Embed Size (px)
Citation preview
1
TAXES OFFICE -
TAX STATISTICAL DIGEST QUARTER 2 Ending 30 June 2017
Tax Analyst August 2017

2
Contents GLOSSARY OF TERMS ....................................................................................................................................................... 3
SUMMARY – YEAR OF ASSESSMENT 2015 ....................................................................................................................... 4
SOURCES OF REVENUE BY YEAR OF ASSESSMENT .......................................................................................................... 5
Sources of Revenue – Personal tax, Corporate Tax and GST ............................................................. 5
PERSONAL TAX ................................................................................................................................................................. 6
Personal Tax Payers by Count and Net Tax Payable ........................................................................... 6
Tax Payers (Excluding Non-residents) By Marital Status By Age - Exemption Thresholds ................. 7
INCOME SOURCES AND TAX PAYABLE ............................................................................................................................. 8
Income by Sources Totals ................................................................................................................... 8
Income Sources ................................................................................................................................... 8
Income Range by Tax Paid .................................................................................................................. 9
Income Range by Marital Status by Tax Paid .................................................................................... 10
Current Year and Prior Year Basis (CYB - PYB)............................................................................................................... 11
Personal Tax Payers by Current or Prior Year Basis .......................................................................... 11
Personal Tax Payers by Current or Prior Year Basis by Net Tax payed ............................................. 11
Personal Tax Payers by Current or Prior Year Basis by Age Demographic ........................................ 11
Income Streams by Current Year and Prior year Basis ..................................................................... 12
QUINTILE ANALYSIS ........................................................................................................................................................ 13
Tax Payer - Quintiles ......................................................................................................................... 13
CORPORATE TAX ............................................................................................................................................................. 14
Tax Payable by Tax Rate .................................................................................................................... 14
GOODS AND SERVICES TAX (GST) .................................................................................................................................. 15
GST by Industry Codes ...................................................................................................................... 15
HIGH VALUE RESIDENTS (HVR) ...................................................................................................................................... 16
Income Tax from HVRs Relocating Under the Post July 2011 Regime .............................................. 16
Income Tax from HVRs (2005 onwards)............................................................................................ 16
METHODOLOGICAL NOTES: ........................................................................................................................................... 17

3
GLOSSARY OF TERMS
Corporate (Company) Tax - Companies that have completed a return in the year of assessment – Inclusive of
companies whose income is subject to Taxation at 0%, 10% or 20%. Companies taxed at 10% or 20% have Profits
arising from being a Financial Institution, a Utility company, from the importation or supply of hydrocarbon oil,
Quarrying in Jersey, Income from land, Property, Property development.
Current Year and Prior Year Basis (CYB - PYB) Current Year Basis: A personal taxpayer whose ITIS deductions out of their current earnings are being used to pay
their income tax liability for the current year.
Previous Year Basis: A personal taxpayer whose ITIS deductions out of their current earnings are being used to pay
their income tax liability for the year of assessment prior to the year in which the deductions are being made (ie the
previous year).
Goods Services Tax (GST) – Paid by those businesses registered for GST with the Taxes office.
Marginal Rate Taxpayer - A Personal Taxpayer whose income tax liability is calculated by reference to the marginal rate calculation (i.e. the taxpayer pays less tax under the marginal rate calculation rather than under the standard rate calculation). Personal Taxpayer An individual/married couple/civil partnership that pays personal income tax, based on their own liability, in Jersey, for the particular year. A “Personal Taxpayer” whose liability is less than £50 for a particular is year is counted as a Personal Non-Taxpayer and exclude from this analysis. Personal Taxpayers includes:
· Single individuals (counted as one personal taxpayer) · Married couples/civil partnerships (counted as one personal taxpayer as they do not have separate tax
liabilities). · Married couples/civil partners that have elected for separate assessment (counted as two personal
taxpayers as they have separate tax liabilities).
Standard Rate Taxpayer - A Personal Taxpayer whose income tax liability is calculated by reference to the standard rate calculation (i.e. the taxpayer pays less tax under the standard rate calculation than under the marginal rate calculation). Tax Payable - The Income tax payable by the taxpayer by Year of Assessment. This is the amount the taxpayer is due to pay to the Treasury, which is either collected via ITIS or made by direct payment. Tax payable is the basis for the ‘tax revenues’ figure that is reported in the States of Jersey Accounts. The Tax payable (Year of Assessment) will differ from Tax receipts (in the States of Jersey Accounts) in any year due to income recognition (i.e. tax revenues are recognised in the year the assessment is raised) and collection timing difference (e.g. payments not necessarily received in the year in which the revenue is recognised). Tax Payable (Net) – The amount of Tax Payable less any Tax under appeal (at the time of Analysis)
Total Income - The sum of a taxpayer’s income taken into account in calculating income tax liabilities. Total income is measured before tax allowances and any other deductions have been taken into account. Losses incurred in the year and capital allowances by sole traders are included within the Total income.

4
SUMMARY1 – YEAR OF ASSESSMENT 2015
PERSONAL TAX
There were 47,040 Personal Tax Payers who paid £381m (tax) in year of assessment 2015. This is made up of:
46,220 Personal Tax Payers (resident) who paid £378m in Tax, assessed at the Standard or Marginal rate
820 Non-resident Personal Tax payers who paid £3m in Tax.
CORPORATE TAX
There were 1470 Corporate Tax Payers who paid £94M in Tax
GST
There were 1,560 GST registered Tax Payers who paid £84m in 2015, there was also 910 GST registered Business that
received £14m in GST refunds also in 2015. Resulting in a Net Return of £70m GST for 2015 (for 2016 the equivalent
figures are 1,590 GST registered Businesses paying £87m and 850 receiving £14m refunds giving a net value of
£73m).
1 All Tax Payers counts rounded to nearest 10. All Tax rounded to nearest Million (£).

5
SOURCES OF REVENUE BY YEAR OF ASSESSMENT
Sources of Revenue – Personal tax, Corporate Tax and GST 2
Year of Assessment
2010 2011 2012 2013 2014 2015
Personal Net Tax Payable £ 335m £ 352m £ 353m £ 353m £ 362m £ 381m
Business Tax £76m £79m £89m £81m £90m £94m
GST £40m £55m £66m £66m £69m £70m
Total £ 451m £ 486m £ 508m £ 500m £ 521m £ 544m
2 Tax Payable - The Income Tax payable by the taxpayer by Year of Assessment. This is the amount the taxpayer is due to pay to the Treasury, which is either collected via ITIS or made by direct payment. Tax payable is the basis for the ‘tax revenues’ figure that is reported in the States of Jersey Accounts. The Tax payable (Year of Assessment) will differ from Tax receipts (in the States of Jersey Accounts) in any year due to income recognition (i.e. tax revenues are recognised in the year the assessment is raised) and collection timing difference (e.g. payments not necessarily received in the year in which the revenue is recognised).

6
PERSONAL TAX
Personal Tax Payers by Count and Net Tax Payable
Year Of Assessment 2015 - TAX PAYERS
Non resident RESIDENT
Grand Total Taxed at Standard rate Taxed at Marginal rate Total
Married 270 2,390 14,250 16,640 16,910
Single 550 2,440 27,140 29,580 30,130
TOTAL 820 4,830 41,390 46,220 47,040
Year Of Assessment 2015 - NET TAX PAYABLE
Non Resident
Tax Payers
Resident Tax Payers
Grand Total
Tax at Standard Rate Tax at Marginal Rate Total
Married £1m £105m £122m £227m £228m
Single £2m £52m £99m £151m £153m
TOTAL £3m £157m £221m £378m £381m Notes: All Tax Payers counts rounded to nearest 10. All Tax rounded to nearest Million (£).

7
Tax Payers (Excluding Non-residents) By Marital Status By Age - Exemption Thresholds
Year Of Assessment 2015
Tax Payers
Marital Status Taxed at 20% Standard
Rate Taxed at Marginal Rate Total
Single 2,090 24,270 26,360
Single 65 years old Plus 350 2,870 3,220
Married 2,040 11,230 13,270
Married 65 years old Plus 350 3,020 3,370
Total 4,830 41,390 46,220 Notes: Either one or both of a married couple / civil partnership are 65 years old or over to receive the higher threshold relief.
Net Tax Payable
Marital Status Tax at Standard rate Tax at Marginal Rate Total
Single £44m £89m £134m
Single 65 years old Plus £8m £10m £17m
Married £89m £103m £192m
Married 65 years old Plus* £16m £19m £35m
Total £157m £221m £378m Notes: All Tax Payers counts rounded to nearest 10. All Tax rounded to nearest Million (£).

8
INCOME SOURCES AND TAX PAYABLE
Income by Sources Totals
Rate Count Total Income Total Taxed At Source (TAS)
income
Total income Including TAS
Net Tax Payable
Marginal 41,390 £1,765m £2m £1,768m £221m
Standard 4,830 £926m £13m £939m £157m
Grand Total 46,220 £2,691m £16m3 £2,707m £378m Notes:
1. All Tax Payers counts rounded to nearest 10. All Tax rounded to nearest Million (£). 2. TAS - Taxed At Source income (Jersey) 3. 20 means 20 - Standard tax payers are taxed at 20% of their total income, therefore 20% of £926m should yield £185m. But in 2015 standard tax
payers paid £157m. This is due to Standard tax payers receiving some reliefs in 2015 and or receiving Tax credits for income where tax has already been paid, distributions being an example
Income Sources
Rate Count
TOTAL INCOME BY SOURCE
Total Taxed At Source
(TAS)Income
Total Income
including TAS
Net Tax Payable
Total Earned Income
Total Unearned
Income
Total Pension Income
Total Business Income
Total Income
Marginal 41,390 £1,391m £114m £199m £60m £1,765m £2m £1,768m £221m
Standard 4,830 £513m £299m £37m £77m £926m £13m £939m £157m
Total 46,220 £1,904m £414m £236m £137m £2,691m £16m £2,707m £378m Notes: All Tax Payers counts rounded to nearest 10. All Tax rounded to nearest Million (£).
3 Actual total for TAS £15.5M rounding effect takes this to £16m

9
Income Range by Tax Paid
Income range Count of
Individuals Net Tax
% of total tax
Paid
£20,000 or less 7670 £6m
£20,001 to £25,000 4740 £9m
£25,001-£30,000 4500 £13m
£30,001-£35,000 4210 £14m
£35,001-£40,000 3470 £15m
£40,001-£45,000 2780 £14m
£45,001-£50,000 2480 £15m
Subtotal Income Under £50,000 29,850 £86m 23%
£50,001-£55,000 2020 £14m
£55,001-£60,000 1710 £13m
£60,001-£65,000 1390 £12m
£65,001-£70,000 1250 £12m
£70,001-£75,000 1040 £11m
£75,001-£80,000 900 £10m
£80,001-£85,000 850 £11m
£85,001-£90,000 700 £9m
£90,001-£95,000 650 £9m
£95,001-£100,000 550 £9m
Subtotal Income Under £100,000 11,060 £111m 29%
£100,001 To £250,000 4460 £112m
greater than £250,000 and less than £500,000 580 £34m
£500,000 plus 270 £36m
Subtotal Income greater than £100,000 5,310 £181m 48%
Grand Total 46,220 £378m 100% Notes:
Generally the income is representative of a full year’s income. However in some cases the income relates to seasonal workers or contract staff who do
not work a full year and therefore do not receive a full year’s relief. Thus it is possible to have what appears to be a low income and still have a tax
liability.
For married / civil partnership total income represents the combined marital / Partnership income
All Tax Payers counts rounded to nearest 10. All Tax rounded to nearest Million (£).

10
Income Range by Marital Status by Tax Paid
Married Single
Range Tax Payers Net Tax Payable Tax Payers
Net Tax Payable Grand Total
£20,000 or less 240 £0m 7,430 £6m £6m
£20,001 to £25,000 120 £0m 4,620 £9m £9m
£25,001-£30,000 460 £0m 4,040 £12m £13m
£30,001-£35,000 1,020 £1m 3,190 £13m £14m
£35,001-£40,000 1,130 £3m 2,340 £12m £15m
£40,001-£45,000 1,040 £3m 1,740 £11m £14m
£45,001-£50,000 1,130 £5m 1,350 £10m £15m
£50,001-£55,000 1,020 £6m 1,000 £8m £14m
£55,001-£60,000 930 £6m 780 £7m £13m
£60,001-£65,000 850 £6m 540 £6m £12m
£65,001-£70,000 840 £7m 410 £5m £12m
£70,001-£75,000 740 £7m 300 £4m £11m
£75,001-£80,000 640 £7m 260 £4m £10m
£80,001-£85,000 650 £8m 200 £3m £11m
£85,001-£90,000 550 £7m 150 £2m £9m
£90,001-£95,000 500 £7m 150 £2m £9m
£95,001-£100,000 440 £7m 110 £2m £9m
£100,000 To £250,000 3,660 £92m 800 £20m £112m
Greater than £250,000 and less than £500,000 480
£28m 100
£5m £34m
£500,000 plus 200 £26m 70 £9m £36m
Grand Total 16,640 £227m 29,580 £151m £378m

11
Current Year and Prior Year Basis (CYB - PYB) Current Year Basis (CYB) - A Personal Tax payer taxed on Earnings in the same year as the income is earned.
Prior Year Basis (PYB) - A Personal Tax payer taxed on Earnings in the year prior to the year the income is earned, paying Tax in arrears
Personal Tax Payers by Current or Prior Year Basis
YEAR OF ASSESSMENT 2015
COUNT
Marital status Current Year Basis Prior Year Basis Grand Total
Married 2,740 13,890 16,640
Single 11,660 17,930 29,580
Grand Total 14,400 31,820 46,220
Personal Tax Payers by Current or Prior Year Basis by Net Tax payed
YEAR OF ASSESSMENT 2015
NET TAX PAYABLE
Marital status Current Year Basis Prior Year Basis Grand Total
Married £37m £190m £227m
Single £41m £110m £151m
Grand Total £78m £300m £378m
Personal Tax Payers by Current or Prior Year Basis by Age Demographic
Current Year Basis Prior Year Basis Grand Total
20 years and under 1,390 110 1500
21-30 7,110 1,620 8730
31-40 3,160 5,670 8830
41-50 1,710 7,960 9670
51-60 860 7,460 8320
61-70 160 4,950 5110
71 years plus 10 4,050 4060
Grand Total 14,400 31,820 46,220 Note: For Married couples / civil partnership age is based on the oldest of the couple. All new Tax payers are registered as
Current Year Basis, unless they are sole trades or their income derives only from investment income then they are Prior
Year Basis.

12
Income Streams by Current Year and Prior year Basis
Prior or Current year Basis
Count Total Earned
Income
Total Unearned
income
Total Pension income
Total business income
Total Income
Net tax payable
CYB 14,400 £542m £17m £3m £6m £567m £78m
PYB 31,820 £1,363m £397m £233m £131m £2,124m £300m
Grand Total 46,220 £1,904m £414m £236m £137m £2,691m £378m
0
1,000
2,000
3,000
4,000
5,000
6,000
7,000
8,000
9,000
20 yearsand under
21-30 31-40 41-50 51-60 61-70 71 yearsplus
Age demographic Of Current and Prior Year Tax Payers
Current year Basis
Prior Year Basis
13
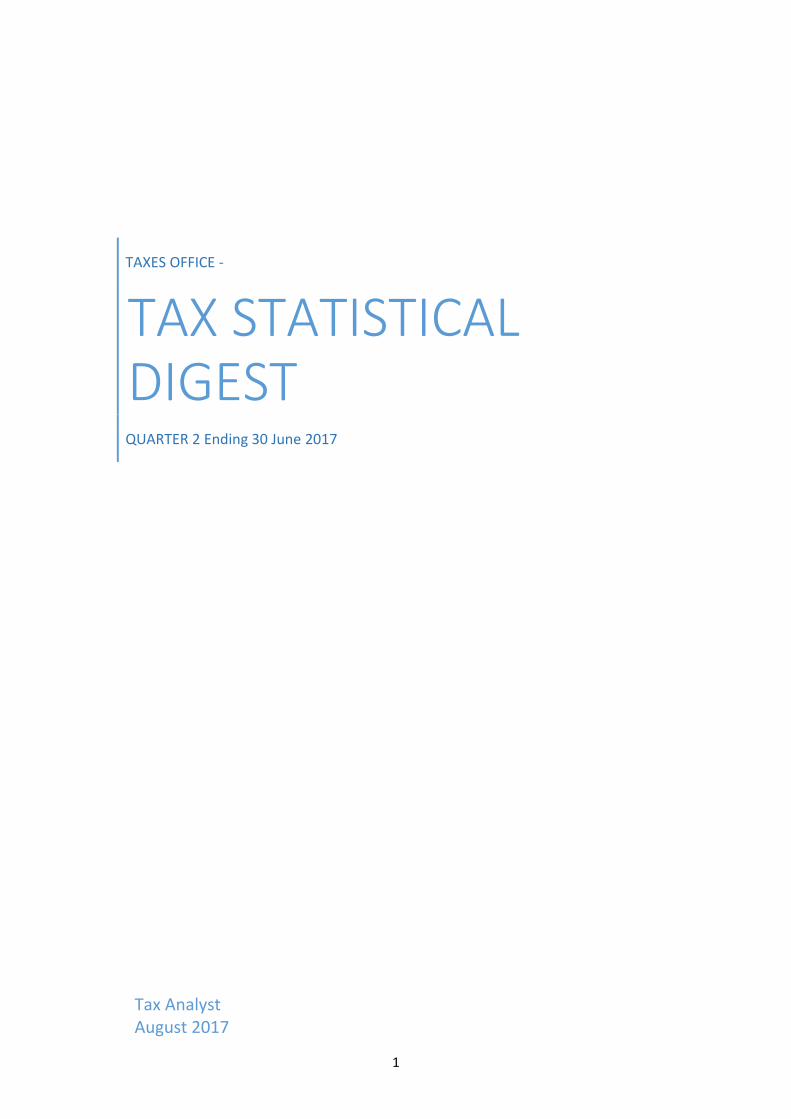
QUINTILE ANALYSIS
Tax Payer - Quintiles
Quintile Total Income4 Net Tax Payable Effective rate % Of Net tax
Payable
1 £142m £9m 6% 2%
2 £246m £24m 10% 6%
3 £352m £40m 11% 11%
4 £530m £72m 14% 19%
5 £1,421m £233m 16% 62%
Total £2,691m £378m 100%
Analysis of Tax Paid (%) by Income: 2015
Higher Income:
Percentage of personal income tax paid by the 5% of Tax Payers with the highest income
31%
Percentage of personal income tax paid by the 10% of Tax Payers with the highest income(see table below)
45%
Percentage of personal income tax paid by the 20% of Tax Payers the highest income
62%
Lower Income :
Percentage of personal income tax paid by the 20% of Tax Payers with the Lowest income
2%
Percentage of Personal Income Tax Paid By The 10% of Tax Payers with the Highest Income 2010 - 2015
2010 2011 2012 2013 2014 2015
Percentage of personal income tax paid by the 10% of Tax Payers with
the highest income 45% 45% 45% 45% 46% 45%
4 Excluding TAS income

14
CORPORATE TAX
Tax Payable by Tax Rate
COMPANIES BY RATE 2010 2011 2012 2013 2014 2015
Count - 0% companies - NIL Tax paid (Separately registered for Tax purposes)
32,050 31,710 31,550 34,050 35,390 32,990
Count - 0% companies - positive tax payable from Jersey Property rental or development, Quarrying in Jersey, or from the importation and/or supply of hydrocarbon oil
1,390 1,320 1,290 1,290 1,290 1,260
Total Count 0% Companies 33,440 33,030 32,840 35,340 36,680 34,250
Total tax paid by 0% companies in receipt of Jersey Property income/Oil income etc.
£20m £18m £18m £17m £18m £20m
Count - 10% companies - No Tax Payable 700 710 730 730 730 690
Count - 10% companies - Tax payable 180 200 210 210 220 210
Count - TOTAL 10% companies 880 910 940 940 950 900
Total tax paid by 10% companies £39m £48m £67m £63m £70m £70m
Count 20% (utility) Companies 20 20 20 20 20 20
Total tax paid by 20% (utility) companies £5m £5m £3m £3m £3m £4m
Count - IBC companies 70 60
Total tax paid by IBC companies £12m £9m
Count 34,410 34,020 33,800 36,300 37,650 35,170
TAX £76m £79m £89m £82m £91m £94m Note: Count of companies rounded to nearest 10.For 2015 there were 7 utilities with Tax payable

15
GOODS AND SERVICES TAX (GST)
GST by Industry Codes
Classification GST Charge
2010 2011 2012 2013 2014 2015 2016
A - Agriculture, Forestry and Fishing £0m £0m £1m £1m £1m £1m £1m
B - Mining and Quarrying £1m £1m £1m £1m £1m £1m £1m
C - Manufacturing £1m £2m £2m £2m £2m £2m £2m
D - Electricity, Gas, Steam, and Air Conditioning
£3m £4m £5m £4m £4m £5m £4m
E - Water Supply Sewerage Waste Management and Remediation Activities
£0m £1m £1m £1m £1m £1m £1m
F - Construction £3m £5m £5m £6m £6m £6m £6m
G - Wholesale and Retail Trade; Repair Of Motor Vehicles and Motorcycles
£21m £29m £36m £36m £37m £38m £38m
H - Transportation and Storage £0m £1m £1m £1m £1m £1m £1m
I - Accommodation and Food Services Activities
£4m £5m £7m £7m £7m £8m £8m
J - Information and Communication £3m £5m £6m £5m £6m £6m £6m
K - Financial and Insurance Activities £0m £0m £0m £0m £0m £0m £0m
L - Real Estate Activities £1m £1m £1m £2m £2m £1m £1m
M - Professional Scientific and Technical Activities
£2m £3m £4m £3m £3m £3m £4m
N - Administrative and Support Service Activities
£1m £2m £2m £2m £2m £2m £3m
O - Public Administration and Defence; Compulsory Social Security
-£3m -£4m -£4m -£4m -£5m -£5m -£5m
P - Education £0m £0m £0m £0m £0m £0m £0m
Q - Human Health and Social Work Activities £0m £0m £0m £0m £0m £0m £0m
R - Arts Entertainment and Recreation £1m £1m £1m £1m £1m £1m £1m
S - Other Service Activities £0m £0m £0m £0m £0m £0m £0m
T - Activities Of Households As Employers £0m £0m £0m £0m £0m £0m £0m
V - Charity £0m -£1m -£1m -£1m -£1m -£1m -£1m
W - DIY Housebuilder £0m £0m £0m £0m £0m £0m £0m
X - Other £0m £0m £0m £0m £0m £0m £0m
Grand Total £40m £55m £66m £66m £69m £70m £73m Notes GST as at 02-07-2017.
Classification based on Companies house – Standard industrial classification of economic Activities (SIC)
GST rounded to nearest Million (£m)

16
HIGH VALUE RESIDENTS (HVR) Source of all tables and analysis: Post-Implementation Review of Jersey’s High Value Residents Regime Applicable since July 2011. A Report by the Tax Policy Unit for the Council of Ministers and the States Assembly December 2016. R.130/2016.
Income Tax from HVRs Relocating Under the Post July 2011 Regime The table below outlines the total income tax paid by those HVRs relocating under the post- July 2011 regime, grouped by reference to the year in which they established tax residence, for the 2012, 2013 and 2014 years of assessment5.
HVRs establishing tax residence
Total Income Tax Paid 2012
Total income tax Paid 2013
Total income tax Paid 2014
76 in 2012 £542,760 £909,397 £924,382
10 in 2013 N/A £963,441 £1,321,442
17 in 2014 N/A N/A £1,521,220
34 in Total £542,760 £1,872,838 £3,767,044
Source: Taxes office
Notes:
In the year of arrival each HVR is expected to pay the £125,000 expected annual minimum income tax contribution appropriately time apportioned (e.g. if an HVR arrives on 1 December they would be expected to pay a minimum of 1/12th of £125,000 in that year of assessment). Therefore in the year of arrival the average income tax payable per HVR is more likely than not to be less than £125,000.
The threshold at which the preferential tax rate applies (i.e. the threshold of £625,000 of income) is also time apportioned, meaning that in the year that a HVR establishes tax residence the 1% tax rate may apply before a £125,000 tax liability has been generated.
Income Tax from HVRs (2005 onwards)
The table below outlines the total income tax paid by HVR designated taxpayers arriving from 2005 onwards, grouped by reference to the version of the HVR regime that applies to the Taxpayer, for the 2012, 2013 and 2014 years of assessment.
HVRs establishing tax residence
Total income Tax Paid 2012
Total income Tax Paid 2013
Total income Tax Paid 2014
2005-2011 regime £4,510,238 £4,621,329 £4,766,075
Post-July 2011 regime £542,760 £1,872,838 £3,767,044
Total £5,052,998 £6,494,167 £8,533,119
5 2014 is the most recent year of assessment for which complete information is currently available. Information in respect of the 2015 year of assessment will become available in 2017. 6 Ordinarily the Comptroller of Taxes does not disaggregate or analyse data on groups consisting of fewer than 12 persons – to avoid inadvertent exposure of – or intrusion into – the affairs of individual taxpayers. Following discussions with the Minister for Treasury and Resources it has been agreed that, to aid analysis of the value of the HVR regime, this policy will be relaxed in certain tables contained in this report.
17
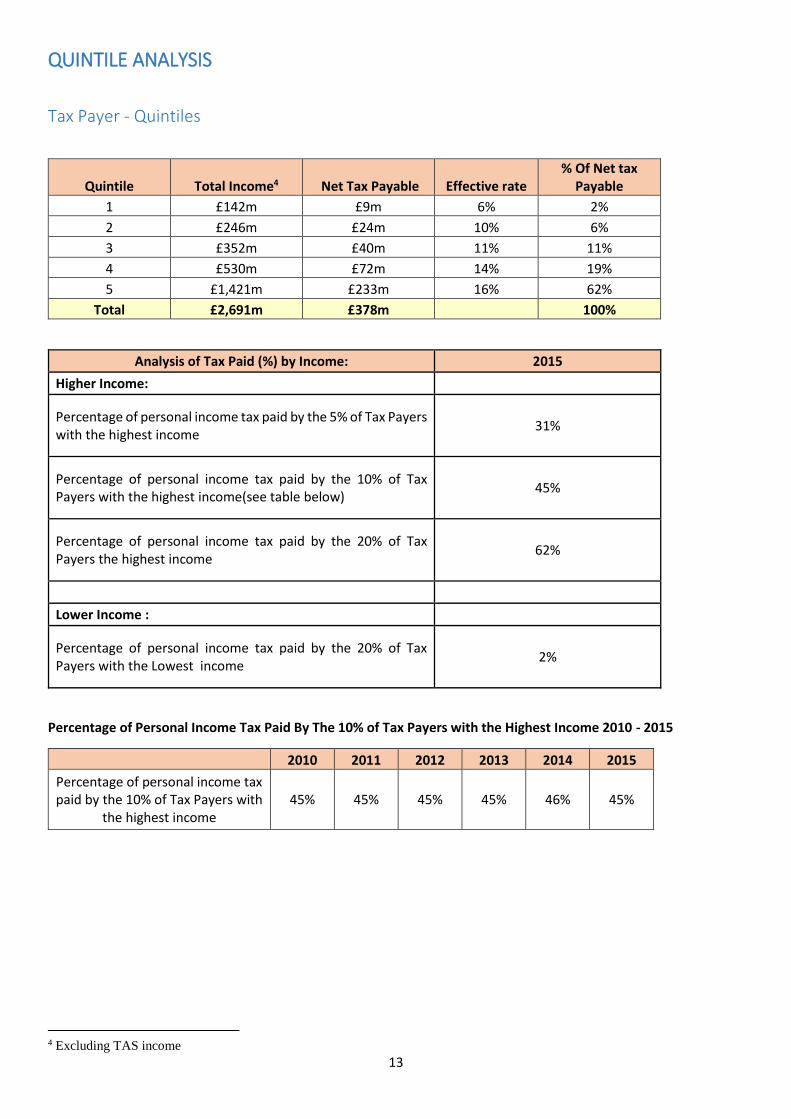
METHODOLOGICAL NOTES:
All Data taken from the Taxes Office Database on 02-07-2017 (excluding HVR report)
Counts of tax payers are inclusive of those Tax payers who have married or separated in the year of
assessment. This may result in the double counting of some individuals, as they are counted as a single Tax
Payer for part of the marital year and again as part of a married couple for the remainder of the year. This is
dependent on being a Tax payer in one or both instances.
Comparisons to previously published data should be treated with caution as data has occasionally been revised
and the methodologies used may differ.
When compiling this report further analysis was conducted on Married couples/civil partners that have elected
for separate assessment. To identify the tax rate used this has resulted in differences in the number of
standard tax payers compared to previously published data.
All the data is drawn from the Taxes office ageing software and database which presents methodological
challenges when producing statistics. A software replacement program is currently underway which should
address these issues.