Embed Size (px)
Citation preview

Tax Incentives for Education
Professor Susan DynarskiKennedy School of Government
Testimony before the President’s Advisory Panel on Federal Tax Reform
March 16, 2005
Overview
•Background on college costs •Tax expenditures for education•Education savings accounts
– Complexity– Distribution of benefits
•Tuition tax credits and deductions and exemptions– Complexity – Distribution of benefits
•Concluding Thoughts
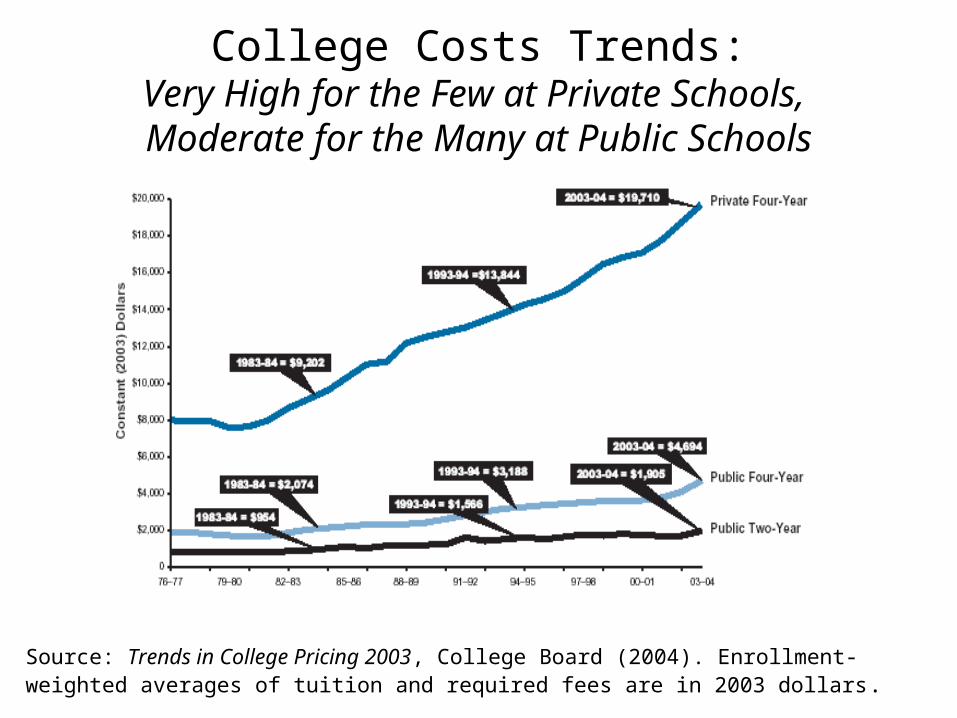
College Costs Trends:Very High for the Few at Private Schools, Moderate for the Many at Public Schools
Source: Trends in College Pricing 2003, College Board (2004). Enrollment-weighted averages of tuition and required fees are in 2003 dollars.

Tax Expenditures for Education(with estimates from the Joint Committee on Taxation in
billions of dollars)
Tax Expenditures Aimed at Reducing:• Future Education Costs
– Coverdell & 529 savings accounts ($0.5 in 2005; $1.1 in 2009)• Current Education Costs
– Hope & Lifetime Learning credits ($5.7 in 2005; $5.7 in 2009)– Personal exemption for student dependents age 18-23 ($2.6 in
2005; $1.4 in 2009)– Tuition deduction ($1.7 in 2005; sunsets after 2005)– Exemption from taxation of employer benefits for education ($0.6
in 2005; $0.7 in 2009) • Completed Education Costs
– Student loan interest deduction ($0.8 in 2005; $0.8 in 2009)

Future Education Costs:Coverdell & 529
• Think of these savings accounts as Roth IRAs for education– 529 for college
• EGTRRA 2001 eliminated federal taxes on 529 withdrawals
• This provision sunsets in 2010• Tax liabilities of 529 backloaded - realized when
funds drawn down when child goes to college• Very rapid recent growth in 529s
– Coverdell for K-college
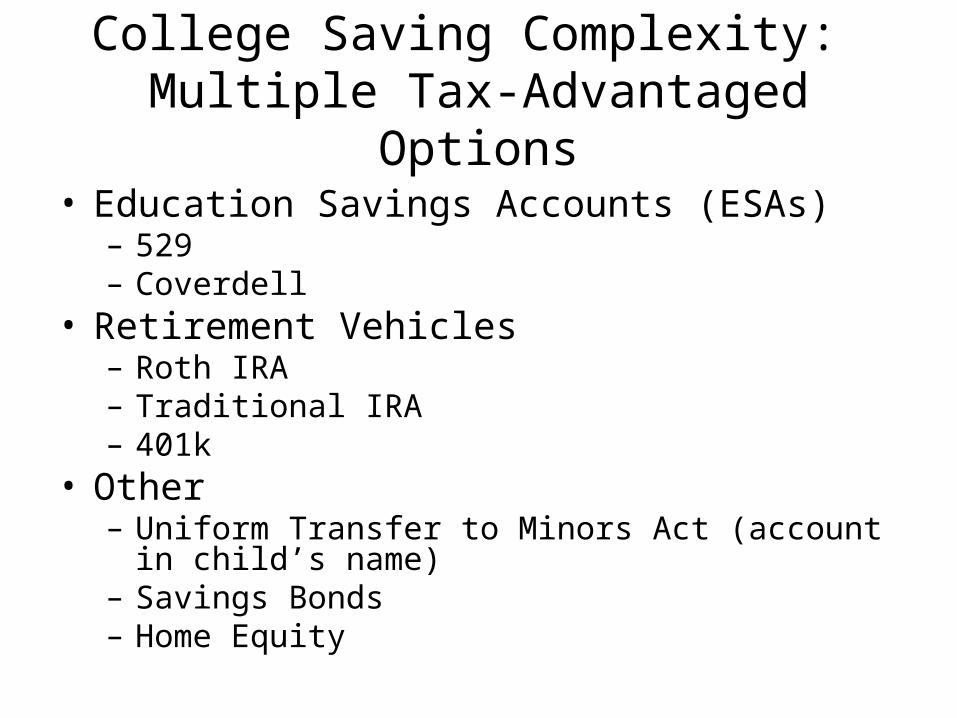
College Saving Complexity: Multiple Tax-Advantaged Options
• Education Savings Accounts (ESAs)– 529 – Coverdell
• Retirement Vehicles– Roth IRA– Traditional IRA– 401k
• Other– Uniform Transfer to Minors Act (account in child’s
name)– Savings Bonds– Home Equity

Complexity in College Savings:More than One Hundred 529 Plans to
Choose From• Arizona and Nevada each sponsors six 529s• Every plan has its own…
– Application– Contribution limits– Investment options– Costs
• Asset-based administrative fees, loads, expense ratios, annual fees
• SEC disclosure rules do not apply no way to easily compare costs across plans
– Penalties for non-educational use
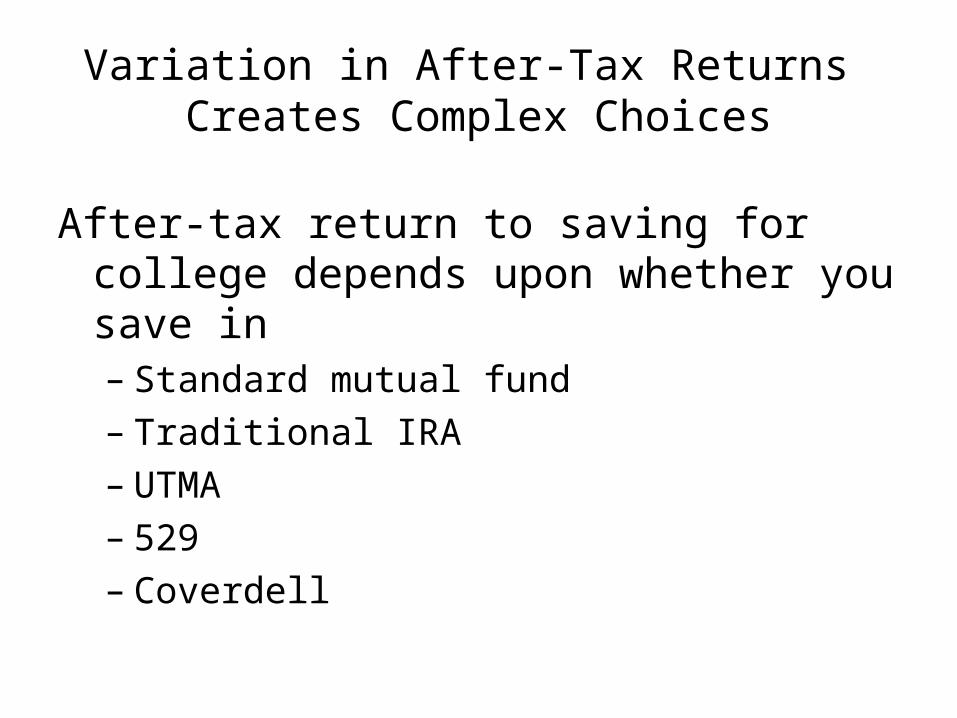
Variation in After-Tax Returns Creates Complex Choices
After-tax return to saving for college depends upon whether you save in– Standard mutual fund– Traditional IRA– UTMA– 529 – Coverdell

Assumptions in Calculating After-Tax Returns
• Married couple, two kids, one earner
• Pretax deposit of $1,000 made when child is born
• After-tax earnings reinvested
• Funds drawn down over four years of college

Portfolio Assumptions
• Stock returns 9%– 2% dividends– 7% long term capital gains, unrealized until
withdrawal
• Bond returns 4%
• Aggressiveness of portfolio decreases as child ages
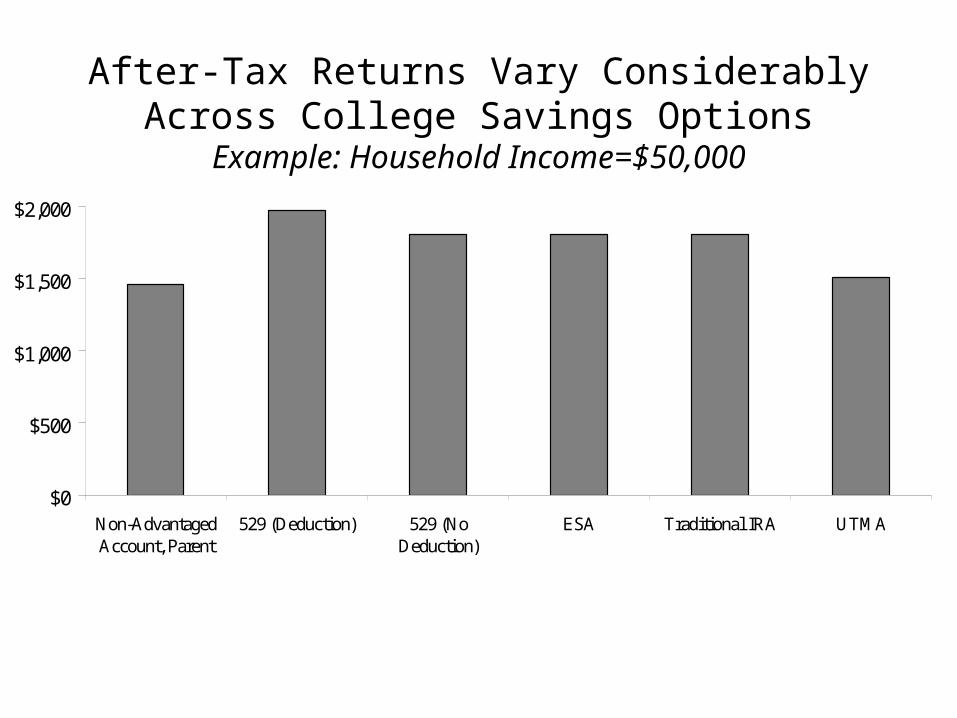
After-Tax Returns Vary Considerably Across College Savings OptionsExample: Household Income=$50,000
$0
$500
$1,000
$1,500
$2,000
Non-AdvantagedAccount, Parent
529 (Deduction) 529 (NoDeduction)
ESA Traditional IRA UTMA
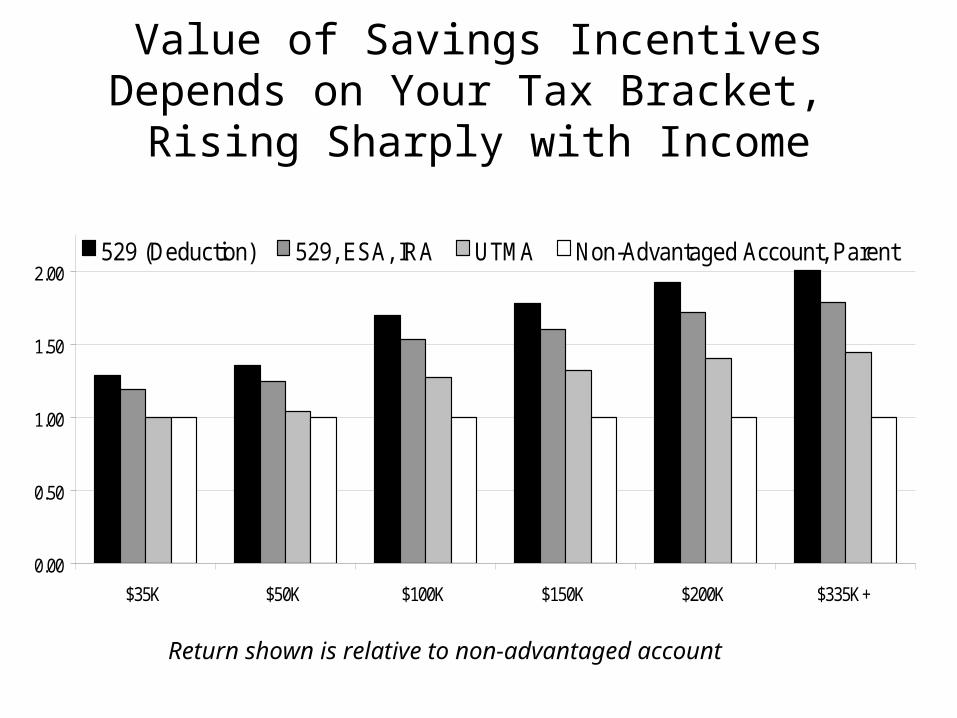
Value of Savings IncentivesDepends on Your Tax Bracket,
Rising Sharply with Income
0.00
0.50
1.00
1.50
2.00
$35K $50K $100K $150K $200K $335K+
529 (Deduction) 529, ESA, IRA UTMA Non-Advantaged Account, Parent
Return shown is relative to non-advantaged account

Penalties Make Coverdell Risky for Low-Income Families
0
0.5
1
1.5
2
$35K $50K $100K $150K $200K
Household IncomeAfter-Tax Return to Non-Qualified Use of Coverdell, relative to standard mutual fund
Return to Standard Mutual Fund
High-income family earns 21% more.
Low-income family earns 11% less using Coverdellfor non-educational purposes than it would putting themoney in a standard mutual fund.

All Households Education Savers(529 or ESA)
Retirement Savers(IRA or Keogh)
Household has 529 or ESA 3% 100% 5%
Household has IRA or Keogh 38% 70% 100%
Median Income $50,000 $91,000 $75,000
Median Net Worth $61,830 $281,200 $227,600
Mean Balance in IRA accounts $20,132 $89,400 $56,523
Parent has a bachelor’s degree 37% 91% 59%
Number of observations 1,533 46 588
Characteristics of Education Savings Account InvestorsSample: 2001 Survey of Consumer Finances,
Households with children less than 17 years of age
Tax Benefits for Current Education Costs
• Hope Tuition Tax Credit
• Lifetime Learning Credit (LLC)
• Tuition Tax Deduction– Sunsets in 2005
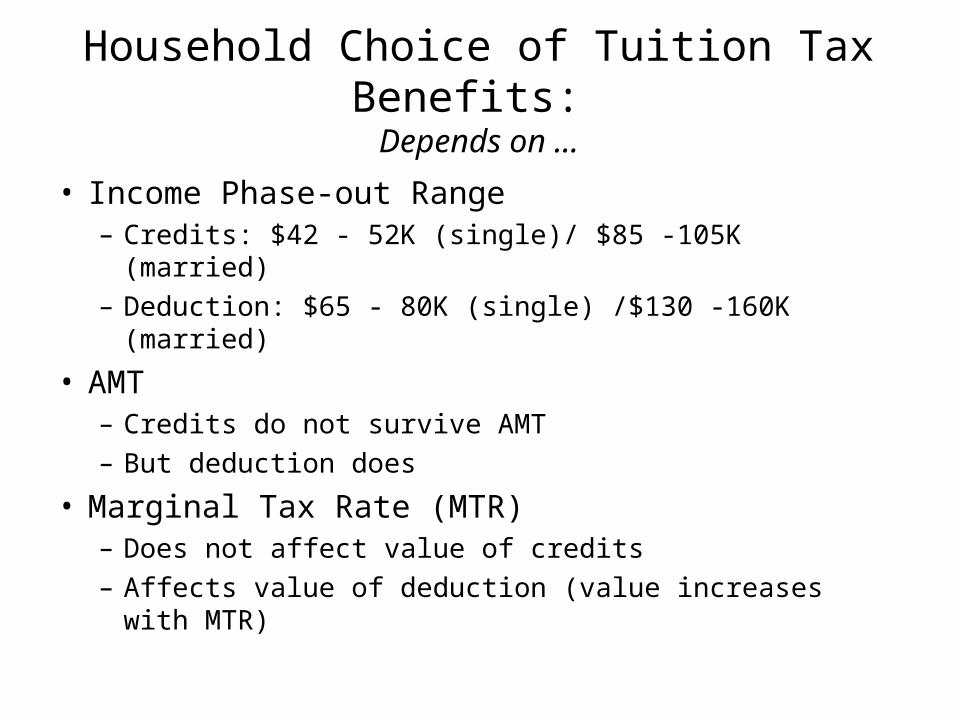
Household Choice of Tuition Tax Benefits: Depends on …
• Income Phase-out Range– Credits: $42 - 52K (single)/ $85 -105K (married)– Deduction: $65 - 80K (single) /$130 -160K (married)
• AMT– Credits do not survive AMT– But deduction does
• Marginal Tax Rate (MTR)– Does not affect value of credits– Affects value of deduction (value increases with MTR)
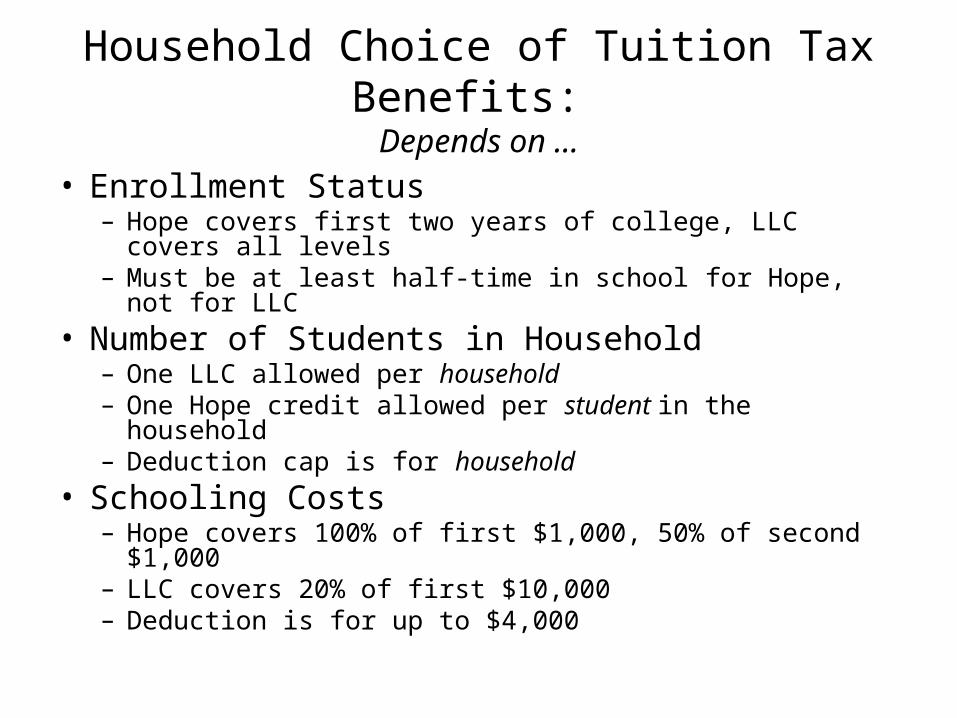
Household Choice of Tuition Tax Benefits: Depends on …
• Enrollment Status– Hope covers first two years of college, LLC covers all
levels– Must be at least half-time in school for Hope, not for LLC
• Number of Students in Household– One LLC allowed per household– One Hope credit allowed per student in the household– Deduction cap is for household
• Schooling Costs– Hope covers 100% of first $1,000, 50% of second $1,000– LLC covers 20% of first $10,000– Deduction is for up to $4,000

Value of Tuition Tax Benefits: 2003
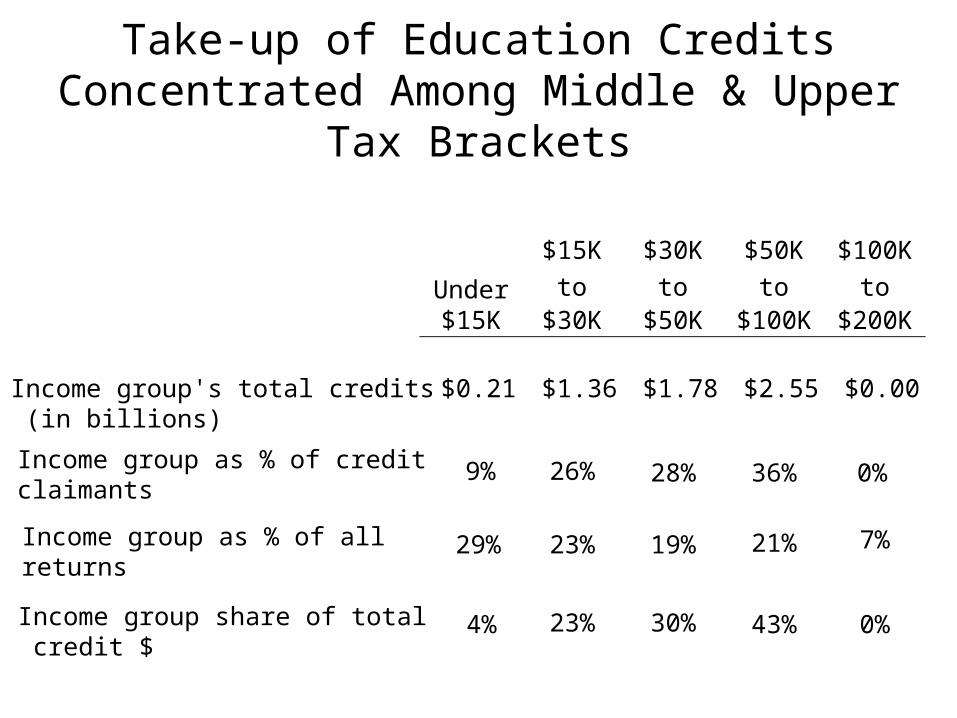
Take-up of Education Credits Concentrated Among Middle & Upper Tax Brackets
$15K $30K $50K $100K
Under to to to to$15K $30K $50K $100K $200K
Income group's total credits (in billions)
$0.21 $1.36 $1.78 $2.55 $0.00
Income group as % of credit claimants
9% 26% 28% 36% 0%
Income group as % of all returns
29% 23% 19% 21% 7%
Income group share of total credit $
4% 23% 30% 43% 0%

Where are Tax Credits Spent?
Most of Credits Spent at Expensive Private Colleges• Full benefit of LLC does not kick in until tuition and fees
are $10,000 a year • Typical student attends a public university, where
– Tuition and fees average $4,700– Just 4% of students pay over $8,000.
• At community colleges, average costs are less than $2,000
(Amounts are for 2003-2004 and expressed in 2003 dollars Source: Trends in College Pricing 2003, College Board, 2004)
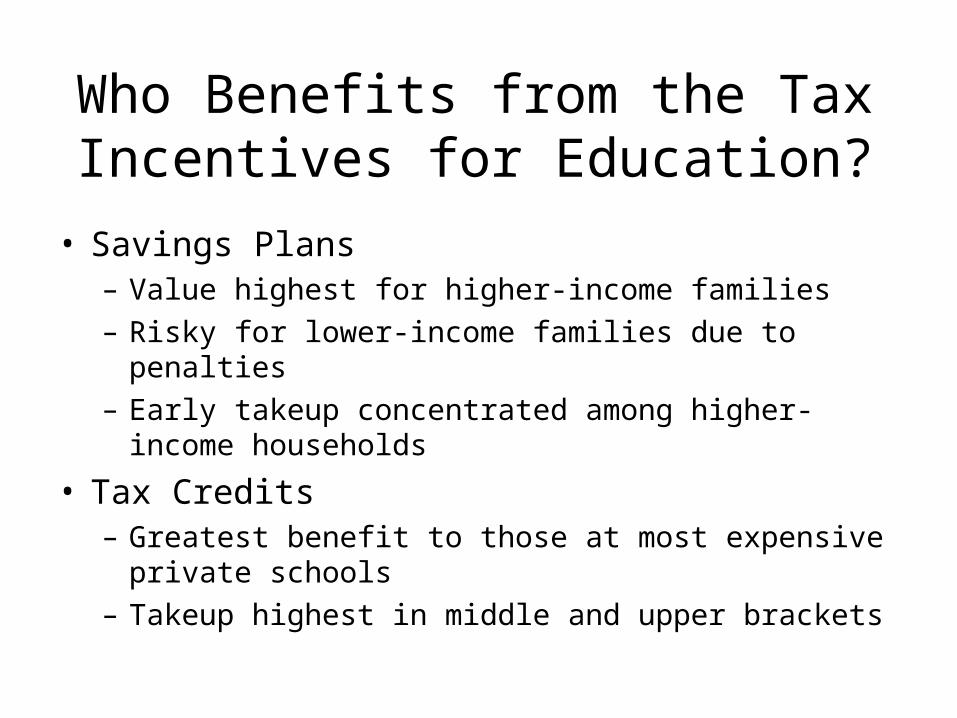
Who Benefits from the Tax Incentives for Education?
• Savings Plans– Value highest for higher-income families– Risky for lower-income families due to penalties– Early takeup concentrated among higher-income
households
• Tax Credits– Greatest benefit to those at most expensive private
schools– Takeup highest in middle and upper brackets

Effect of Incentives on Behavior
• Tax credits do not increase college-going (Long, 2004)– Too complicated– Not available to lower brackets, where there is
more room for response
• Savings plans – No strong evidence they increase savings– Too early to tell if they increase college-going
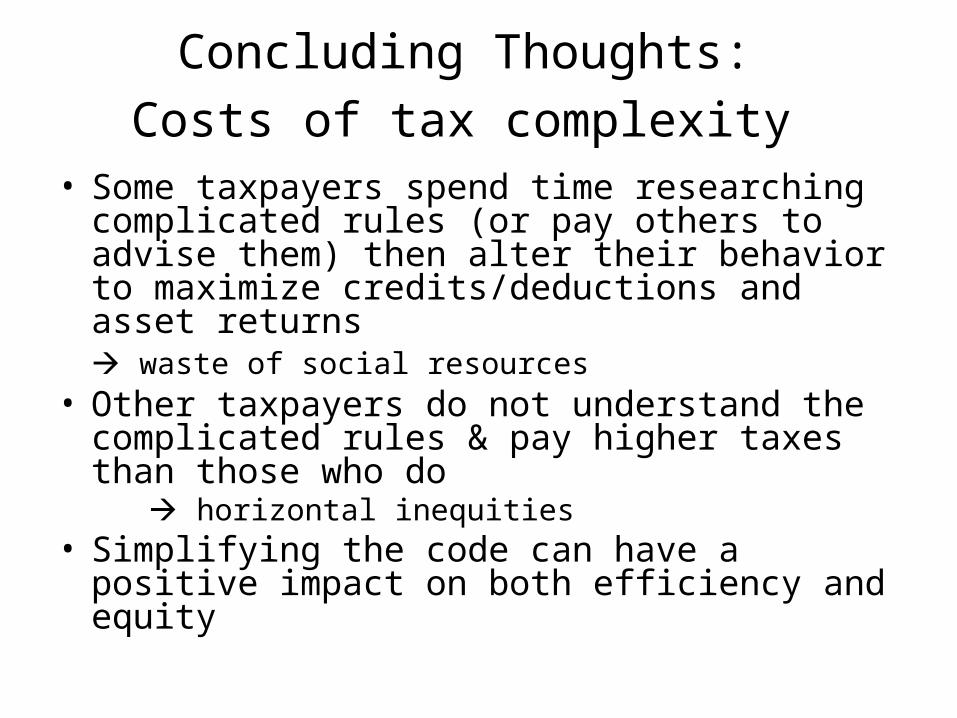
Concluding Thoughts:
Costs of tax complexity • Some taxpayers spend time researching
complicated rules (or pay others to advise them) then alter their behavior to maximize credits/deductions and asset returns
waste of social resources• Other taxpayers do not understand the
complicated rules & pay higher taxes than those who do
horizontal inequities• Simplifying the code can have a positive impact
on both efficiency and equity