Embed Size (px)
Citation preview

TAX CHALLENGES ARISING FROM THE DIGITALISATION OF THE ECONOMY ECONOMIC IMPACT ASSESSMENT
Webinar presentation20 October 2020 – 16.00-17.00 (CEST)

• Chat function disabled for security reasons• Submit questions via Q&A Zoom function• For OECD TV viewers, please e-mail
questions to: [email protected]• Webinar is being recorded and replay will
be made available within 24 hours
2
Housekeeping

3
Speakers
David BradburyHead of the Tax Policy and Statistics Division (OECD Centre for Tax Policy and Administration)
Åsa JohanssonHead of the Structural Policies Surveillance Division (OECD Economics Department)
Stéphane SorbeSenior Economist(OECD Economics Department)
Tibor HanappiEconomist(OECD Centre for Tax Policy and Administration)
Ana Cinta González CabralEconomist(OECD Centre for Tax Policy and Administration)
Valentine Millot Economist(OECD Economics Department)
Sébastien TurbanEconomist(OECD Economics Department)
Pierce O’ReillyEconomist(OECD Centre for Tax Policy and Administration)

• OECD Secretariat report: released on 12 October 2020
– Mandated by the Programme of Work, but not subject to approval by the Inclusive Framework (IF).
– Assesses the revenue and investment effects of Pillar One and Pillar Two.
– Presents global results and results for jurisdiction groups. No jurisdiction-specific data or results are included.
– Utilised a flexible framework, with the focus being on assisting IF members understand the implications of various design decisions.
– Involved extensive engagement with stakeholders, including delegates from IF jurisdictions and other key stakeholders.
4
Introduction

Main caveats
5
• An ‘ex ante’ assessment based on illustrative assumptions on the design and parameters of Pillar One and Pillar Two. Results will ultimately depend on design and parameters to be decided by the IF.
• The methodology relies on a number of simplifying assumptions, for example on the design and the way MNEs and governments may react.
• The data underlying the analysis is the best available to the Secretariat, but they have limitations in terms of coverage, consistency and timeliness.
– Combines various data sources: covering more than 200 jurisdictions and 27,000 MNE groups and has used four novel data “matrices”
– Primarily 2016-17 data: pre-dating the implementation of the OECD/G20 BEPS project, the US Tax Cuts and Jobs Act and most importantly the COVID-19 crisis

• Pillar One and Pillar Two could increase global corporate income tax (CIT) revenuesby about USD 50-80 billion per year. The combined effect of the reforms and the US GILTI could represent USD 60-100 billion per year (i.e. up to around 4% of global CIT).
• The reforms would lead to a more favourable environment for investment and growth than would likely be the case in the absence of a consensus-based solution.
• In the absence of consensus, there would likely be a proliferation ofunilateral tax measures (e.g. digital service taxes) and an increase in tax and trade disputes, which could reduce global GDP by more than 1% in the worst case scenario.
• The COVID-19 crisis is likely to accelerate the trend towards the digitalisation of the economy and exacerbate the tax challenges arising from digitalisation in the absence of an agreement by the Inclusive Framework. 6
Overview of main findings

EFFECT OF THE PROPOSALS ON TAX REVENUES
7

8
Combined revenue effects of Pillar One and Pillar Two at the global level
Estimated global tax revenue gains In % of global CIT revenues In USD billion
Pillar One 0.2%-0.5% 5-12
Pillar Two
Direct revenue gains 0.9%-1.7% 23-42
Additional gains from reduced profit shifting 0.8%-1.1% 19-28
Total Pillar Two 1.7%-2.8% 42-70
Total Pillar One and Pillar Two 1.9%-3.2% 47-81
US GILTI regime 0.4%-0.8% 9-21
Total, including GILTI 2.3%-4.0% 56-102
Note: The estimates in this table are based on illustrative assumptions on the design and parameters of Pillar One and Pillar Two.
9
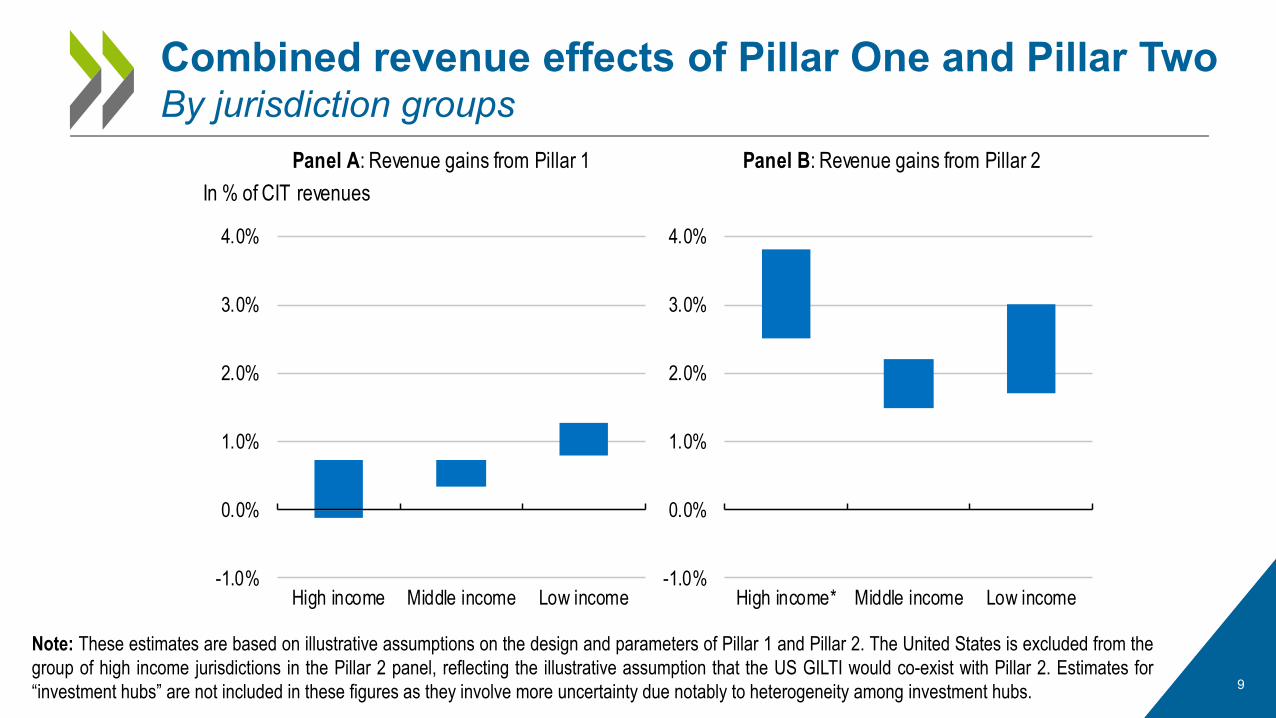
Combined revenue effects of Pillar One and Pillar TwoBy jurisdiction groups
Note: These estimates are based on illustrative assumptions on the design and parameters of Pillar 1 and Pillar 2. The United States is excluded from thegroup of high income jurisdictions in the Pillar 2 panel, reflecting the illustrative assumption that the US GILTI would co-exist with Pillar 2. Estimates for“investment hubs” are not included in these figures as they involve more uncertainty due notably to heterogeneity among investment hubs.
In % of CIT revenues
Panel A: Revenue gains from Pillar 1 Panel B: Revenue gains from Pillar 2
-1.0%
0.0%
1.0%
2.0%
3.0%
4.0%
High income Middle income Low income-1.0%
0.0%
1.0%
2.0%
3.0%
4.0%
High income* Middle income Low income

Pillar One would reallocate a percentage of residual profit to market jurisdictions
10
Routine Profit
Percentage of residual profit reallocated to market jurisdictions(e.g. 20%)
Profitability threshold(e.g. 10% on Profit Before Tax / Turnover)
• Amount A would involve significant changes to current tax rules (e.g. going beyond physical presence)
• Amount A could lead to a substantial reallocation of taxing rights across jurisdictions (e.g. taxing rights on about USD 100 billion of profit could be reallocated)
• Only Amount A was modelled. The effect of Amount B and the Tax certainty component of Pillar One is expected to be small at the global level, but it could be significant in some jurisdictions
Total profit of the MNE group
Residual Profit

11
Taxing rights on about USD 100 billion of profit could be reallocated under Pillar One
020406080
100120140160180200
8% 10% 15% 20% 25%
10% 20% 30%
Profitability threshold (PBT/Turnover)
Reallocation percentageAllocable global residualprofit in ADS and CFB (USD billion)
Example: About USD 100 bn of profit reallocated assuming illustratively a 10% profitability threshold
and a 20% reallocation percentage
Note: These estimates assume the estimates assume illustratively a global revenue threshold of EUR 750 million and focus only on MNE groups witha primary activity in the ADS and CFB sectors

12
Pillar One estimated revenue effectsBy jurisdiction groups
-3.0% -2.0% -1.0% 0.0% 1.0% 2.0% 3.0%
Globaleffect
CIT rate<= 10%
10-20%
20-30%
> 30%
% of CIT revenues
B. Grouping by statutory CIT rates
-3.0% -2.0% -1.0% 0.0% 1.0% 2.0% 3.0%
Globaleffect
High income
Middle income
Low income
Investment hubs
% of CIT revenues
A. Grouping by income levels
-3.9 %
Residual profit threshold (PBT/Turnover):10%20%
Note: These estimates assume illustratively a EUR 750 million global revenue threshold, a profitability threshold (based on PBT to turnover) of 10% or20%, a reallocation of 20% of residual profit to market jurisdictions, a EUR 1 million nexus revenue threshold for ADS and a EUR 3 million nexusrevenue threshold for CFB. Groups of jurisdictions (high, middle and low income) are based on the World Bank classification. Investment hubs aredefined as jurisdictions with a total inward FDI position above 150% of GDP.

• Pillar Two would give countries the right to ‘tax back’ profit that is currently taxed below the minimum rate
• It would essentially operate as a ‘top-up’ tax, up to the minimum rate
• The impact assessment assumes that it applies jurisdiction-by-jurisdiction (i.e. jurisdictional blending)
• It could involve a substance-based ‘carve-out’ (i.e. subtract from profit a fixed percentage of payroll and depreciation expenses)
• The US GILTI regime is assumed to coexist with Pillar Two
Pillar Two comprises a number of interlocking rules that would operate as a minimum tax rate
13
Taxes currently paid
Top-up:Taxes paid under Pillar Two to reach the minimum tax rate
Minimum tax rate (e.g. 12.5%)
Corporate taxes paid by MNE

Stylised scenarios on strategic reactions of MNEs & governments to Pillar Two
14
Scenario 1 Static scenario (no behavioural reaction)
Scenario 2 Interaction with Pillar OneScenario 1
Scenario 3 MNEs reduce their profit shifting intensityScenario 2
Scenario 4 Some low-tax jurisdictions increasetheir ETRScenario 3
Note: Other behavioural reactions to Pillar Two are also possible, but they are not modelled in this chapter. These non-modelled reactions include forexample changes in MNE ‘real’ investment location (with potential implications for CIT revenues but also for revenues from other tax bases) as wellas policy changes in jurisdictions with an average ETR above the minimum rate. These potential reactions are discussed in Chapter 4 of the report.
15
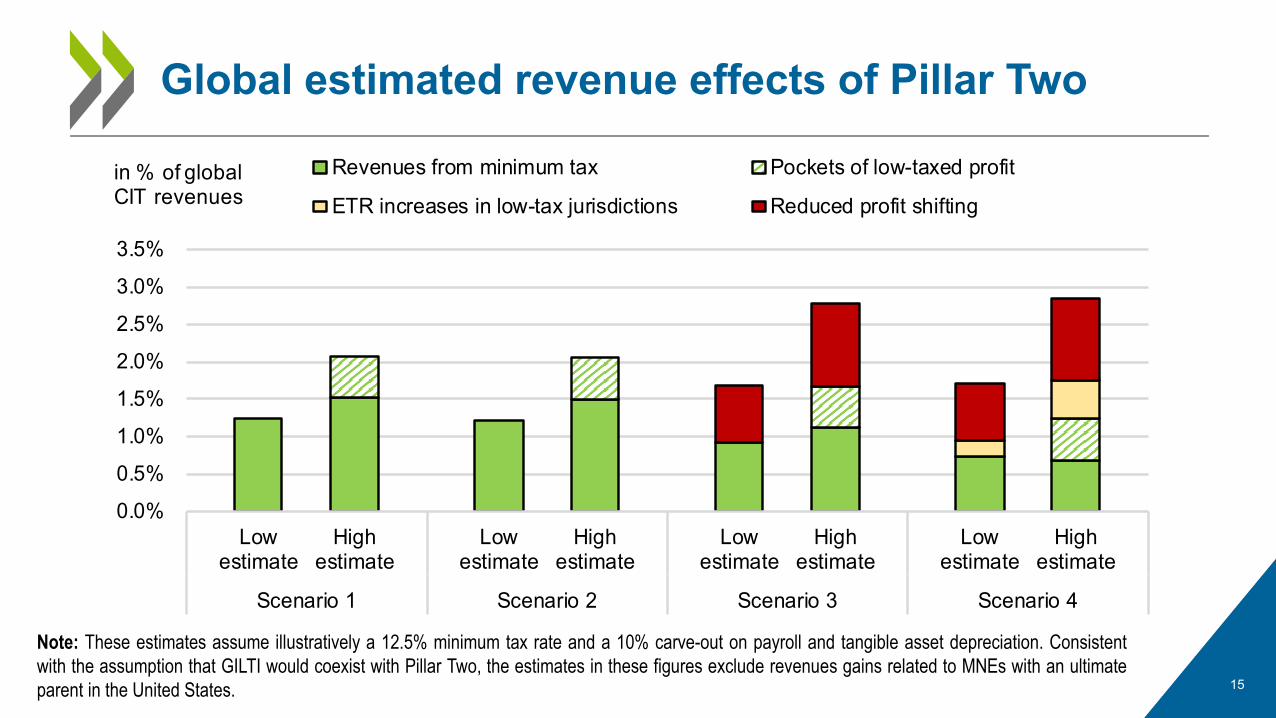
Global estimated revenue effects of Pillar Two
0.0%
0.5%
1.0%
1.5%
2.0%
2.5%
3.0%
3.5%
Lowestimate
Highestimate
Lowestimate
Highestimate
Lowestimate
Highestimate
Lowestimate
Highestimate
Scenario 1 Scenario 2 Scenario 3 Scenario 4
Revenues from minimum tax Pockets of low-taxed profit
ETR increases in low-tax jurisdictions Reduced profit shiftingin % of globalCIT revenues
Note: These estimates assume illustratively a 12.5% minimum tax rate and a 10% carve-out on payroll and tangible asset depreciation. Consistentwith the assumption that GILTI would coexist with Pillar Two, the estimates in these figures exclude revenues gains related to MNEs with an ultimateparent in the United States.

16
Pillar Two estimated revenue effectsBy jurisdiction groups
Note: These estimates assume illustratively a 12.5% minimum tax rate and a 10% carve-out on payroll and tangible asset depreciation. The United States isexcluded from the group of high income jurisdictions in the Pillar 2 panel, reflecting the illustrative assumption that the US GILTI would co-exist with Pillar 2.

EFFECT OF THE PROPOSALS ON INVESTMENT AND ECONOMIC ACTIVITY
17

• Both pillars would lead to a relatively small increase in MNE investment costs
– The negative effect on global investment would be less than 0.1% of GDP, as the proposals would mostly affect highly profitable MNEs whose investment is less sensitive to taxes
– The effect could be lower if MNE groups reallocate investment in response to cost increases
• Pillar One and Pillar Two could support global investment and growth through indirect channels that are significant, although less quantifiable by:
– Increasing the relevance of non-tax factors and improving global capital allocation
– Increasing tax certainty and reducing the need to raise revenues through other (potentially more distortive) tax measures
• In the absence of consensus, there would likely be a proliferation of unilateral tax measures (e.g. digital service taxes) and an increase in tax and trade disputes, which could reduce global GDP by more than 1% in the worst case scenario
18
Main findings on investment effects

• The analysis builds on the forward-looking effective tax rates framework and incorporates:– The profit shifting behaviour of MNEs
– A stylised version of Pillar One (Amount A) and Pillar Two
• Covering over 70 jurisdictions, the model is calibrated to account for the location of MNE activities and assets across jurisdictions
• The effect of Pillar One and Pillar Two is assessed by comparing average and marginal ETRs pre- and post-reform
• Effects on the global GDP-weighted EATR (0.3 pp) and EMTR (1.4 pp) would be relatively small
19
Modest overall direct impact of Pillar One and Pillar Two on MNEs’ investment costs
Changes in Effective Marginal Tax Rates due to Pillar One and Pillar Two
(percentage points)
Source: Hanappi and González Cabral (2020)
1.4 pp
0
1
2
3
4
High Income Low-MiddleIncome
InvestmentHubs
All jurisdictions
percentage points
Pillar 1 Pillar 2
Combined change of 1.4 percentage
points
Note: These estimates are based on the same illustrative assumptions on the design and parameters of the proposals as set out in slides 12 and 15.

-0.2
-0.15
-0.1
-0.05
0
0.05
0.1
0.15
<0% ]0%;10%] >10%
Significant at the 5% level
Profitability at the MNE group-level (PBT / Turnover)
Investment of non-profitable and highly profitable firms tends to be less affected by effective tax rates
20
Firm sensitivity to corporate tax depends on profitability at the MNE group level
• Higher corporate taxes tend to have a negative effect on MNE investment, however, tax sensitivity varies across MNE groups.
• New OECD analysis suggests that highly profitable MNE groups are less sensitive to corporate taxation: relying on a panel of MNE entities in 17 OECD countries (using data from ORBIS).
• Various channels can explain this result:– Liquidity constraints– Market power and economic rents– Tax planning behaviour
Source: Millot et al. (2020)
Change in investment rate after a 1 percentage point increase in EMTR
(percentage points)

• Fiscal space: revenue increases support public finances, which is especially important for domestic resource mobilisation in developing countries
• Tax competition: a lower intensity of tax competition between jurisdictions would further support public finances in the longer term
• Tax incentives for innovation: effectiveness of tax incentives could be affected, but less so if there is a substance-based carve-out, and policy mixes may need to be adapted
• Tax incentives for development: the bargaining position of developing countries wanting to reduce costly and potentially inefficient tax incentives could be strengthened
• Compliance costs: likely to be an increase in filing requirements leading to additional costs for MNEs and governments, but will depend on final design and simplification measures
• Firm competition: competition dynamics among firms could be affected as taxes on large, profitable and profit-shifting MNEs are increased 21
Indirect effects: hard to quantify, but could partly (or even fully) offset the effect of cost increases

22
The consensus & no-consensus scenariosStylised scenarios: estimated effect on global GDP
* The proposals would also have positive impacts on GDP through indirect channels (e.g. increased tax certainty, reduced need to increase other distortive taxes) which are not quantified in this figure.
-1.5
-1
-0.5
0
Direct effect of the proposals onMNE investment costs*
Assuming narrow DSTimplementation
Assuming broad DSTimplementation
Proportional retaliation Worst case retaliat ionImpact on global GDP (in % )
Consensus scenario
No-consensus scenarios

DATA UNDERLYING THE ANALYSIS
23

24
The impact assessment mobilises a large variety of data sources
Main data Examples of use
Firm-level dataOrbis database (consolidated and
unconsolidated accounts), Worldscope
Level of residual profit under Pillar One
Location of profit and economic activityRelationship between firm-level and aggregated data
Aggregated data on MNE activity
Anonymised and aggregated CbCR data, AMNE/FATS, Analytical AMNE,
FDI data
Location of CFB destination-based sales
Location of profit and economic activity
Statutory and effective tax rates
OECD Corporate Tax Statistics, estimates from Torslov et al. (2018),
CbCR data, US BEA data
Revenue effect of the reallocation of taxing rights under Pillar OneLocation and amount of profit subject to Pillar Two
Macroeconomic and other jurisdiction-level
data
GDP, GDP per capita, consumption, trade openness, number of internet
users, remittances
Extrapolations when other data are missing
Distribution of ADS sales (internet users)

• Data on MNE activity is combined in “matrices” to obtain a global geographic coverage.
• Four matrices have been constructed: profit, turnover, tangible assets, and payroll.
• Different sources have different coverage.
• Extrapolations are used when no hard data is available.
• Extensive benchmarking has been done when multiple sources are available for a cell. 25
Data “matrices” to map the economic activity of MNEs underlie the impact assessment
US France Nigeria Bahamas...
(>200 jurisd.)
USProfit of US MNEs in the
US
Profit of French
MNEs in the US
. . .
FranceProfit of US
MNEs in France
. . . .
NigeriaProfit of US
MNEs in Nigeria
. . . .
Bahamas . . . . .
…(>200 jurisd.) . . . . .
Jurisdiction of ultimate parent entity (UPE)
Juris
dict
ion
of af
filiat
e
Source No 3: Extrapolation based on macro sources, including FDI data
Source No 1: Aggregate CbCR data
Source No 2:ORBIS unconsolidated financial account data

ENGAGEMENT WITH COUNTRIES AND EXTERNAL STAKEHOLDERS
26

• Jurisdictions: A key goal has been to assist all jurisdictions to understand the impact of the two pillars for their jurisdiction and to inform their decision making.
– Revenue estimation tools: Pillar One and Pillar Two tools have been circulated bilaterally to 115 countries (out of 137 IF members).
– Briefing of delegates: through various working groups and regular zoom meetings, e.g. Working Party No.2 (WP2), WP2 Bureau, Working Party No.1 (Economic Policy Committee), Task Force on Digital Economy, IF and the IF Steering Group.
– Ongoing bilateral discussions: direct bilateral discussions with delegates.
• International and regional organisations: including IMF, EU, ATAF and ADB.
• Academics and civil society groups: through three workshops that were held with them and with jurisdiction delegates last year.
27
Engagement

IMPLICATIONS OF THE COVID-19 CRISIS AND CONCLUSION
28

• The full impact of the COVID-19 crisis remains highly uncertain at this stage
• The COVID-19 crisis is likely to reduce the expected revenue gains from both pillars, at least in the short run, as the crisis weighs on the profitability of many MNEs
– Although some digital-intensive MNEs have sustained or increased their profitability
• The COVID-19 crisis has accelerated the trend towards the digitalisation of the economy
– This highlights the importance of the reforms and will likely increase the relative importance of ADS in the scope of Pillar One
• Accelerated digitalisation, fiscal pressures and growing public dissatisfaction with tax avoidance are likely to reinforce the prospect of further unilateral tax measures in the absence of a consensus-based solution 29
Implications of the COVID-19 crisis

• Pillar One and Pillar Two could increase global corporate income tax (CIT) revenuesby about USD 50-80 billion per year. The combined effect of the reforms and the US GILTI could represent USD 60-100 billion per year (i.e. up to around 4% of global CIT revenues).
• The reforms would lead to a more favourable environment for investment and growth than would likely be the case in the absence of a consensus-based solution.
• In the absence of consensus, there would likely be a proliferation ofunilateral tax measures (e.g. digital service taxes) and an increase in tax and trade disputes, which could reduce global GDP by up to 1% in the worst case scenario.
• The COVID-19 crisis is likely to accelerate the trend towards the digitalisation of the economy and exacerbate the tax challenges arising from digitalisation in the absence of an agreement by the Inclusive Framework.
30
Summary of main conclusions

Q&A
31

• Via Zoom: Use the Q&A function at the bottom of your screen
• Via OECD TV: E-mail [email protected]
32
How to submit questions

ANNEX
33

References
34
• Economic Impact Assessment report: https://www.oecd.org/tax/beps/tax-challenges-arising-from-digitalisation-economic-impact-assessment-0e3cc2d4-en.htm
• Working paper on ETR analysis (Hanappi and González Cabral, 2020): https://www.oecd-ilibrary.org/taxation/the-impact-of-the-pillar-one-and-pillar-two-proposals-on-mne-s-investment-costs_b0876dcf-en
• Working paper on taxation and MNE investment (Millot et al., 2020): https://www.oecd-ilibrary.org/taxation/corporate-taxation-and-investment-of-multinational-firms_9c6f9f2e-en
• Highlights brochure, with an overview of the Pillar One and Pillar Two Blueprint reports and of the impact assessment: https://www.oecd.org/tax/beps/brochure-addressing-the-tax-challenges-arising-from-the-digitalisation-of-the-economy-october-2020.pdf
• Additional background, including Pillar One and Pillar Two Blueprint reports: https://www.oecd.org/tax/beps/beps-actions/action1/

Simplified formula to assess the effect of Pillar One on tax revenues
35
Tax revenue change in jurisd. A
A B C D E F
Global numbers common to all jurisdictions
Share of residual profit in Jurisd. A
Tax rate applied by
jurisd. A on received
profit
Reallocation percentage
Jurisd. A Share of
destination-based sales
Global residual profit in
scope
Rate of double tax
relief in jurisd. A
Jurisdiction-specific numbers
Note: See Chapter 2 of the report for more details

Simplified formula to assess the effect of Pillar Two on tax revenues
Revenue gain for Jurisd. A
Global low-taxed
profit
Minimum tax rate
Current effective rate on
low-taxed profit
Share of revenues
from minimum tax
accruing toJurisd. A
Top-up on current tax rate
Effect of substance
-based carve-out
Note: See Chapter 3 of the report for more details

The intermediate results on MNE profit shifting are broadly consistent with the economic literature
37Note: See Chapter 3 of the report for more details on the methodology to assess profit shifting.
Baseline estimate(‘normal’ profitability:
7.9%)
Robustness check (‘normal’ profitability:
5%)
Robustness check (‘normal’ profitability:
10%)
Estimated amount of shifted MNE profit at
the global level
In USD bn 727 837 662
In % of global MNE profit 11.3% 13.5% 10.7%
Share of shifted profits in total
observed profit
In zero-tax “profit destination” jurisdictions
90.8% 94.1% 88.5%
In other “profit destination” jurisdictions
61.7% 73.7% 54.7%