Embed Size (px)
Citation preview
Tata Motors Ltd. 06th July 2011
1 | P a g e
CMP: Rs.1017 Recommendation: Buy Target Price: Rs.1453
Q4 FY11 Result Update
Key Highlights
Standalone Business
� Total income grew by 19.4% YoY (26.7% QoQ) to Rs.14,601 Cr.,
driven by volume growth of 12.5% YoY (26.5% QoQ). EBITDA margin
declined by 32 bps YoY (116 bps QoQ) to 9.0% due to 112 bps
increase in purchase of traded goods YoY, 31 bps increase in
employment cost on YoY, and higher marketing expenditure.
� Net realization per vehicle increased by 6.8% YoY (0.4% QoQ)
Rs.668,825 due to price hikes.
� Price hike in Tata Indica and Tata Indigo family is in the range
of Rs.3,000 – Rs.15,000,
� While in the Utility Segment it was around Rs.8,700 –
Rs.14,500,
� In Commercial vehicle is in the range of Rs.1,500 – Rs.30,000.
� Exports in Q4 FY11 were higher 45% YoY to 15,384 units. Exports to
Bangladesh, Sri Lanka & Bhutan showed continued growth while
certain Middle East and North African (MENA) countries showed
subdued sales in Q4 FY11 due to political crisis.
Jaguar Land Rover (JLR)
� Total income grew by 33.9% YoY (2.9% QoQ) to £2,736 mn, driven by
volume growth of 15.9% YoY (4.7% QoQ). EBITDA margin declined by
158 bps QoQ (higher by 636 bps YoY) due to higher marketing spend
(£15 mn of pre launch promotional expenses for Land Rover Evoque)
and 30-40 bps was related to one time write offs.
� Average realization per vehicle for JLR was higher by 15.5% YoY
(-1.8% QoQ) £ 41,388. The QoQ decline in average realization was
due to lower contribution from China; QoQ share of China in Q4
FY11 was 12.4% from 13% in Q3 FY11.
Valuation & Outlook
Tata Motor standalone business is facing strong headwinds due to macro
(India) headwinds such as inflation, rising interest rates and rising fuel
prices. We have factored in 11.5% CAGR growth for the CV segment in
FY11-13E and 10.3% CAGR growth for the PV segment in FY11-13E.
We expect macro concerns to ease out by Q3 and Q4 FY12, and expect
standalone business of PV & CV to show recovery. The Company has
witnessed slowdown in sales of Indigo and Indica family in Q1 FY12,
midsized sedan space, and faces competition from other players.
On Subsidiary front, JLR operating performance has improved and has
surpassed standalone profitability, driven by improving product mix, cost
cutting initiatives and favourable forex movement. We believe JLR has
potential to sustain higher profitability and volumes due to growth in
China, Russia and launch of Land Rover Evoque.
Key Data
Financial Year End March
Market Cap (Rs. Cr.) 54,740
Free Float Factor 0.65
52 Week H/L 1381.4/748.6
Avg. 12M volumes ('000) 3,568
Face Value 10
Bloomberg TTMT IN
Reuters TAMO.BO
NSE TATAMOTORS
BSE 500570
Source: BSE, SIHL Research
Shareholding Pattern
Q4 FY11 Q3 FY11
Promoters 34.8% 34.9%
FII's 23.6% 24.2%
DII's 12.9% 13.9%
Others 28.6% 26.9%
Source: BSE, SIHL Research
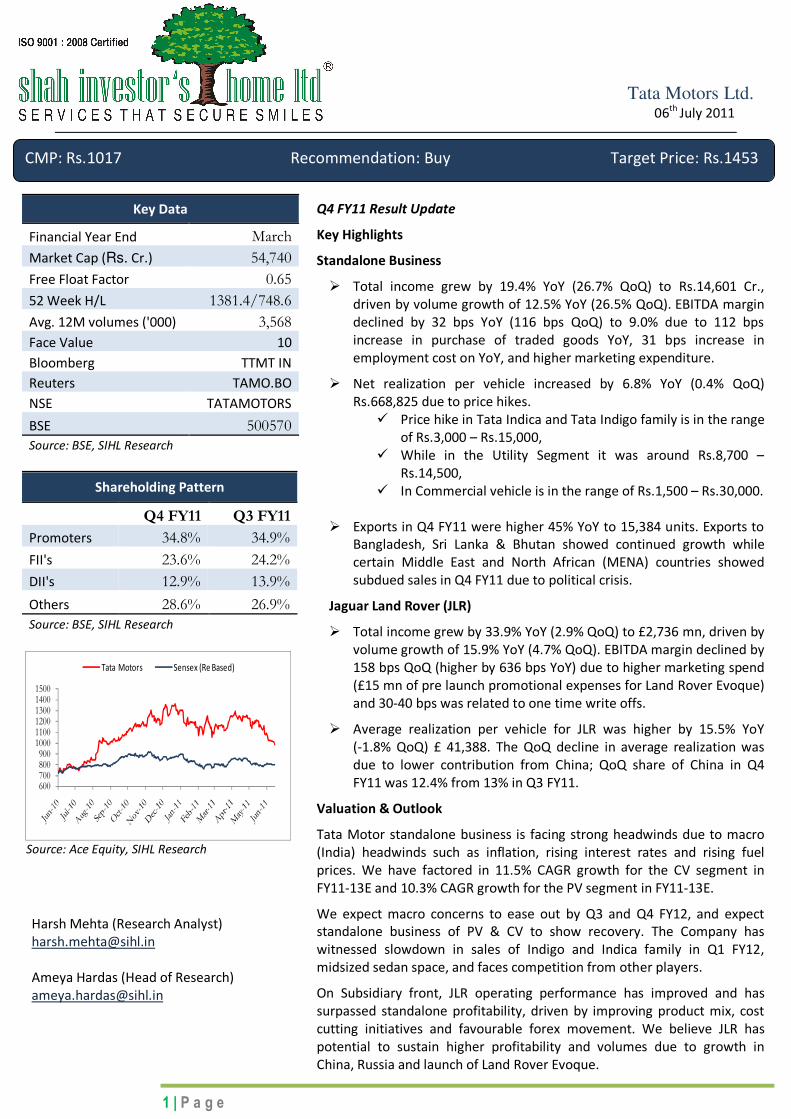
Source: Ace Equity, SIHL Research
600700800900100011001200130014001500
Tata Motors Sensex (Re Based)
Harsh Mehta (Research Analyst)
Ameya Hardas (Head of Research)

Tata Motors Ltd. 06th July 2011
2 | P a g e
Valuation & Outlook
We derive our SOTP (sum of the parts) valuation of Rs.1453/share by
valuing the standalone business at Rs.710/share, JLR business at
Rs.675/share and other subsidiary investments at Rs.67/share. We
recommend a BUY with a Target Price Rs.1453.
Exhibit 2: Volume Breakup (Quarterly)
Domestic Q4 FY11 Q4 FY10 YoY% Q3FY11 QoQ%
M&HCV 57,457 53,990 6.4% 45,771 25.5%
LCV 73,689 64,457 14.3% 65,563 12.4%
UTILITY 13,936 11,439 21.8% 9,260 50.5%
CARS 75,863 69,552 9.1% 50,264 50.9%
TOTAL 220,945 199,438 10.8% 170,858 29.3%
Exports Q4 FY11 Q4 FY10 YoY% Q3FY11 QoQ%
M&HCV 5,205 3,422 52.1% 5,112 1.8%
LCV 9,172 5,592 64.0% 9,054 1.3%
UTILITY 121 167 -27.5% 218 -44.5%
CARS 886 1,437 -38.3% 1,578 -43.9%
TOTAL 15,384 10,618 44.9% 15,962 -3.6%
TOTAL SALES 236,329 210,056 12.5% 186,820 26.5%
JLR Q4 FY11 Q4 FY10 YoY% Q3FY11 QoQ%
JAGUAR 10,041 10,908 -7.9% 13,172 -23.8%
LANDROVER 56,090 46,096 21.7% 49,983 12.2%
TOTAL 66,131 57,004 16.0% 63,155 4.7%
Source: Company Data, SIHL Research
Exhibit 1: Valuation Parameters
Valuation % of Holding either Directly
or through Subsidiaries Valuation Method
Value per
Share
Standalone Business - DCF Valuation 710
Jaguar Land Rover Plc 100 30% Discount to 3.5X EV/EBITDA ratio of FY13E EBITDA of £2,129 mn
675
Tata Motors Finance Ltd. 100 30% Discount to P/Bv ratio of FY13E BV of Rs.1,731 Cr. 23
Tata Daewoo Commercial Vehicle Co. Ltd 100 30% Discount to P/Bv ratio of FY13E BV of Rs.1,408 Cr.
18
Tata Technologies 81 30% Discount to P/Bv ratio of FY13E BV of Rs.904 Cr. 12
HV Axle Ltd. 85 30% Discount to P/Bv ratio of FY13E BV of Rs.623 Cr.
8
HV Transmissions Ltd. 85 30% Discount to P/Bv ratio of FY13E BV of Rs.517 Cr. 7
Target Price 1453
CMP 1017 Expected Return 42.9%

Tata Motors Ltd. 06th July 2011
3 | P a g e
Exhibit 3: Trend in Domestic Realization and EBITDA Margins
Source: Company Data, SIHL Research
Exhibit 4: Trend in JLR Realization and EBITDA Margins
Source: Company Data, SIHL Research
55
8,5
11
56
7,7
42
60
1,4
66
62
6,1
25
61
8,1
47
62
6,0
15
66
6,0
85
66
8,8
25
12.3%
13.2%
12.6%
9.3%10.5%
9.5%
10.1%
9.0%
0%
2%
4%
6%
8%
10%
12%
14%
500,000
520,000
540,000
560,000
580,000
600,000
620,000
640,000
660,000
680,000
Domestic Realization(in Rs.) (LHS) Domestic EBITDA Margins (RHS)
31
,33
7 32
,16
6
34
,58
6
35
,85
7
39
,57
9
40
,75
9
42
,11
9
41
,37
2
-3.0%
2.9%
9.8% 9.5%15.5% 16.6%
17.4% 15.8%
-5%
0%
5%
10%
15%
20%
-
5,000
10,000
15,000
20,000
25,000
30,000
35,000
40,000
45,000
JLR Realization(in £) (LHS) JLR EBITDA Margins (RHS)

Tata Motors Ltd. 06th July 2011
4 | P a g e
Exhibit 5: Market Share of CV
Source: Siam, SIHL Research
Exhibit 6: Market Share of Cars
Source: Siam, SIHL Research
Standalone Business
Passenger Vehicles
Tata Motors Ltd. ended FY11 on strong note with Passenger Vehicle segment
(domestic + exports) growing at 27% YoY. The market share for Passenger Car
segment is around 13.4% in Q4 FY11 which saw a shrinkage of 190 bps YoY. The
volumes of Nano improved from 509 units in November 2010 to around 10,000 units
in April 2011, and slowed down a bit to x in June 2011. Tata Motors is aggressively
looking at expansion of dealer networks in rural segment which is now the focus
market for Nano.
On Utility Vehicle front, the company registered volume of 43,063 units (domestic +
exports) which is up ~26% YoY. The launch of new Aria and Winger variants has not
provided much cheer in terms of volumes. Price hike in Tata Indica and Tata Indigo
family is in the range of Rs.3,000 – Rs.15,000, while in the Utility Segment it was
around Rs.8,700 – Rs.14,500.
74.4
%
72.5%
70.8
%
66.2
%
64.9
%
65.9% 69.4
%
64.9%
11
.7%
12
.3%
12
.9%
15
.3%
14
.5%
13
.8%
10
.2%
13
.4%

Tata Motors Ltd. 06th July 2011
5 | P a g e
Commercial Vehicles (CV)
On CV front (domestic + exports), Tata Motors registered a growth of 14% YoY in Q4
FY11. The growth in CV segment was led by both LCVs (18.3% YoY growth in Q4 FY11)
and M&HCV (9.1% YoY growth in Q4 FY11) even after competition rises in both
segment against the ACE and higher M&HCV segment. Tata Motors recently launched
the four-wheeler Magic Iris, which is also expected to provide end-to-end last mile
solutions for the fast growing rural customer. We estimate LCV volumes to remain
strong driven by strong demand for low tonnage goods. We forecast a 15% CAGR
growth in LCV volumes between FY11 and FY13E.
We expect standalone earnings to increase at 15% CAGR between FY11 and FY13E but
will face some challenges due to the following reasons:
� We estimate domestic Passenger Car volumes for Tata Motors to increase by 10%
in FY12 and FY13 (v/s 27.2% in FY11). We expect Tata Motors to face increasingly
tough competition from global auto giants of the likes of Hyundai, Volkswagen,
and GM which may result in Tata Motors losing market share to the extent of 60-
70 bps YoY.
� We believe Tata Motors Utility Vehicles to grow at a rate of 12% as against
Industry growth rate of 14% in FY12. Existing and new product launches by
market leader M&M, Toyota and Maruti’s launch of new utility vehicle R3 in Q4
FY12 (stretched version of SX4 platform) are expected to penetrate into market of
Tata Motors Utility Vehicles.
� We estimate 9.5% CAGR growth from FY11 to FY13 in M&HCV as Industrial
production is slowing down. Growth in the freight generating sectors like
steel, cement, coal and automobiles has slowed down over the last few months
and is expected to remain weak in FY12E. Tata Motors being the market leader in
M&HCVs (with X% market share), will be face the impact most.
Jaguar Land Rover (JLR) Business: A Saving Grace for Tata Motors
FY11 has been a turnaround year for JLR with volume growth of around 25% YoY to
243,621 units. The company has shown strong growth in the markets of China, Russia
and RoW which has improved volume share to 11.0%, 4.8% and 16.2% from 9.7%, 4.2%
and 15.3% YoY, respectively, for FY11. China continues to remain one of the most
profitable geographies and its increase along with richer Land Rover mix has helped
the average selling price (ASPs) for JLR to improve 15.5% YoY. However TATA MOTORS
witnessed a drop in QoQ share of China from ~13.0% in Q3 FY11 to 12.4% in Q4 FY11.
This contributed to the decline in average net realization QoQ by 1.8%.
Jaguar volumes were down 8% YoY and 24% QoQ in Q4 FY11. This was due to slowing
sales in the UK and European region. The decline in Jaguar overall volumes was partly
attributable to the termination of X-type series and supply constraints for the recently
launched XJ series, due to shortage of engine supplies from Ford.
Engines for Jaguar Land Rover are currently supplied by Ford from its UK plants. Ford is
already supplying more engines than the contracted number, but due to spurt in
demand of JLR vehicles Ford is falling short to matchup the pace of JLR growth
numbers.
Land Rover volumes have been growing strongly at 22% YoY and 12.2% QoQ in Q4
FY11. Demand remained strong even as Discover and Range Rover face similar engine
issues while Freelander and RR Sport continued to witness ~18% growth YoY.

Tata Motors Ltd. 06th July 2011
6 | P a g e
Jaguar Q4 FY11 Volume Share by Geography
Source: Company Data, SIHL Research
20%
33%22%
2%
4%
19%
North America UK
Europe (Exl. Russia) Russia
China Other
Land Rover Q4 FY11 Volume Share by Geography
Source: Company Data, SIHL Research
17%
26%
21%
5%
14%
17%
North America UKEurope (Exl. Russia) Russia
China Other
Management Guidance and Road map for JLR business
� JLR would be launching Land Rover Evoque in Sept 2011. It has received very
good response as it is priced in the lower end of the price band in terms of
other products of the portfolio (around £26,000).
� The capacity at Halewood plant has increased from 100,000 units to 150,000
units taking JLR’s overall capacity to 350,000 units per annum.
� Tata Motors has guided sales of 300,000 units for JLR in FY12, but we have
assumed a conservative growth rate of 17.7%, and that comes to around
286,764 units; we believe slowing growth rate in the Euro Zone may impact JLR’s
market to some extent and may result in a capacity utilization of 82%.
� Management expects to increase its China’s sales to 40,000 units (from 26,000
units) aided by strong demand from luxury vehicles in China and it is further
working on premium entry level segment for Jaguar, to compete with
BMW 3 Series and Mercedes C Class.
� JLR has recently completed a fund raising for £1 bn, of which £250 mn have
been used for repayment of preference capital to Tata Motors, redeemed at par
value and approximately £360m have been earmarked for refinancing existing
debt.
� JLR has carryover tax credits of £2–2.5 bn and hence tax rate is likely to continue
at lower levels going forward.
We believe weakness in the European market will be partially offset by reasonably
buoyant growth in China, Russia, US and other emerging markets. We estimate JLR
volumes to grow by 17.7% YoY in FY12E (Jaguar 15.1% and Land Rover 18.4%) and
12.7% YoY in FY13E (Jaguar 12.4% and Land Rover 12.7%).
We expect the UK market to show a declining growth rate (around 2%) for Luxury
cars in FY12 due to sluggish demands and a miniscule growth rate of 1% in FY13.
Growth in European market (excl. Russia) will remain flattish at around 7.1% and
3.6% in FY12 and FY13 respectively. We believe Russian market to grow at around
40% and 20% in FY12 and FY13 respectively.

Tata Motors Ltd. 06th July 2011
7 | P a g e
New plant in Pune (Chikli) to mark JLR’s India presence
JLR has officially opened its first assembly plant near Pune in Maharashtra. The facility
will assemble Land Rover Freelander 2 supplied in Complete Knock Down (CKD) form
JLR Halewood’s plant. The assembly plant at Pune is not a newly build one but was
earlier used by Mercedes.
JLR is also likely to set up a four – cylinder engine plant in India and will invest around
$700 mn. The cylinder engine plant is likely to have a capacity of 2,00,000 units and
will start by 2015. This will help JLR to reduce its reliance on Ford for supply of such
engines.
We believe EBITDA margins of JLR will decline by 40 bps in FY12E as,
� Incentives to US dealers have risen sharply for the Jaguar brand which in our view
is supporting growth for luxury car volumes in US.
� We believe Evoque EBITDA margins would be lower than existing margins
considering lower selling price (around £26,000), higher fixed costs initially on
lower volumes
� Sharp decline in UK volumes which is a second highest profitable market for JLR.
UK retail volumes of JLR declined by 38% YoY and 16% YoY in April and May 2011,
respectively which is a matter of concern and could weigh on JLR profitability. We
believe the outlook for the UK market remains weak.
Volume Breakup Standalone (Q1 FY12)
Domestic Q1 FY12 Q1 FY11 % YoY growth Q4 FY11 % QoQ growth
M&HCV 45,541 42,156 8.0% 57,456 -20.7%
LCV 67,829 55,073 23.2% 73,690 -8.0%
CARS 54,345 62,589 -13.2% 75,863 -28.4%
Tata Nano 21,978 14,779 48.7% 23,672 -7.2%
Indica Range 17,935 26,507 -32.3% 27,572 -35.0%
Indigo Range 14,432 21,303 -32.3% 24,619 -41.4%
UTILITY 10,436 9,650 8.1% 13,936 -25.1%
Total Domestic 178,151 169,468 5.1% 220,945 -19.4%
Exports Q1 FY12 Q1 FY11 % YoY growth Q4 FY11 % QoQ growth
Total Exports 14,886 12,243 21.6% 15,384 -3.2%
Total Sales 193,037 181,711 6.2% 236,329 -18.3%
Source: Company Data, SIHL Research
Volume for Q1 FY12 was 178,151 units saw a growth of 5.1% YoY (-19.4% QoQ). Our
estimate for FY12 volumes is 893,056 units. Q1 FY12 volumes comprises of 20% of
FY12E volumes. We believe our estimates are in line with company performance.
Tata Motors Ltd. 06th July 2011
8 | P a g e
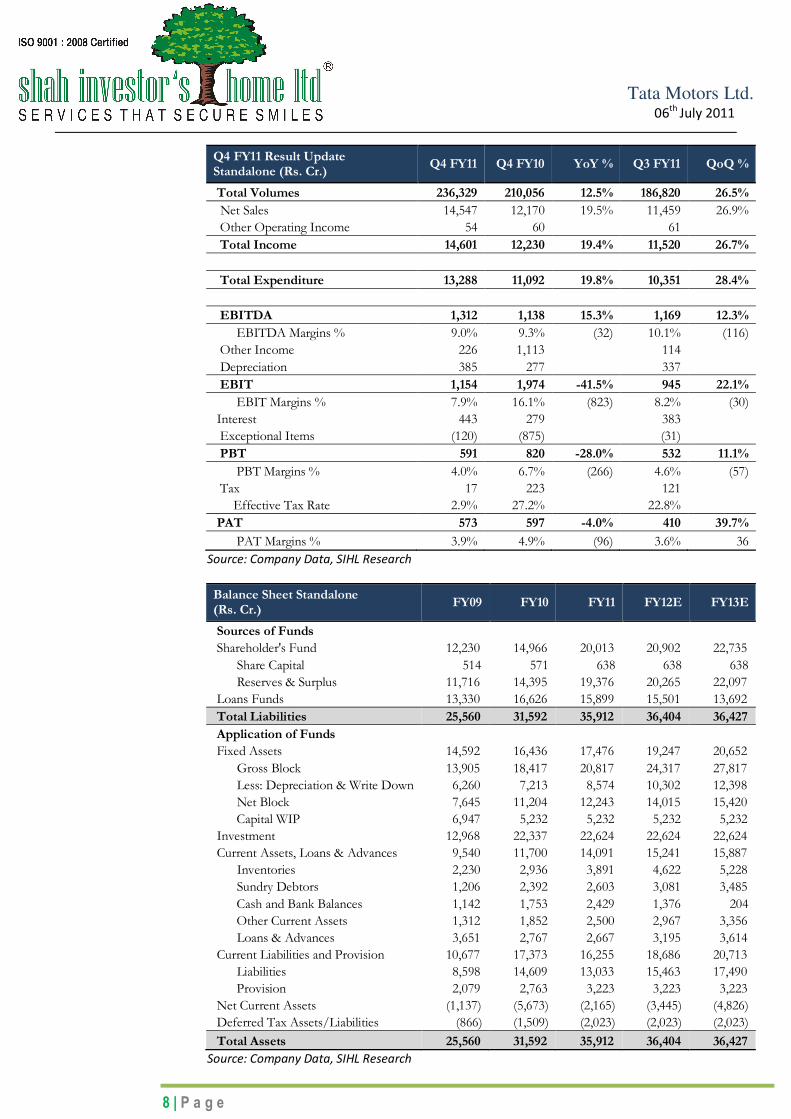
Q4 FY11 Result Update Standalone (Rs. Cr.)
Q4 FY11 Q4 FY10 YoY % Q3 FY11 QoQ %
Total Volumes 236,329 210,056 12.5% 186,820 26.5%
Net Sales 14,547 12,170 19.5% 11,459 26.9%
Other Operating Income 54 60 61
Total Income 14,601 12,230 19.4% 11,520 26.7%
Total Expenditure 13,288 11,092 19.8% 10,351 28.4%
EBITDA 1,312 1,138 15.3% 1,169 12.3%
EBITDA Margins % 9.0% 9.3% (32) 10.1% (116)
Other Income 226 1,113 114
Depreciation 385 277 337
EBIT 1,154 1,974 -41.5% 945 22.1%
EBIT Margins % 7.9% 16.1% (823) 8.2% (30)
Interest 443 279 383
Exceptional Items (120) (875) (31)
PBT 591 820 -28.0% 532 11.1%
PBT Margins % 4.0% 6.7% (266) 4.6% (57)
Tax 17 223 121
Effective Tax Rate 2.9% 27.2% 22.8%
PAT 573 597 -4.0% 410 39.7%
PAT Margins % 3.9% 4.9% (96) 3.6% 36
Source: Company Data, SIHL Research
Balance Sheet Standalone (Rs. Cr.)
FY09 FY10 FY11 FY12E FY13E
Sources of Funds
Shareholder's Fund 12,230 14,966 20,013 20,902 22,735
Share Capital 514 571 638 638 638
Reserves & Surplus 11,716 14,395 19,376 20,265 22,097
Loans Funds 13,330 16,626 15,899 15,501 13,692
Total Liabilities 25,560 31,592 35,912 36,404 36,427
Application of Funds
Fixed Assets 14,592 16,436 17,476 19,247 20,652
Gross Block 13,905 18,417 20,817 24,317 27,817
Less: Depreciation & Write Down 6,260 7,213 8,574 10,302 12,398
Net Block 7,645 11,204 12,243 14,015 15,420
Capital WIP 6,947 5,232 5,232 5,232 5,232
Investment 12,968 22,337 22,624 22,624 22,624
Current Assets, Loans & Advances 9,540 11,700 14,091 15,241 15,887
Inventories 2,230 2,936 3,891 4,622 5,228
Sundry Debtors 1,206 2,392 2,603 3,081 3,485
Cash and Bank Balances 1,142 1,753 2,429 1,376 204
Other Current Assets 1,312 1,852 2,500 2,967 3,356
Loans & Advances 3,651 2,767 2,667 3,195 3,614
Current Liabilities and Provision 10,677 17,373 16,255 18,686 20,713
Liabilities 8,598 14,609 13,033 15,463 17,490
Provision 2,079 2,763 3,223 3,223 3,223
Net Current Assets (1,137) (5,673) (2,165) (3,445) (4,826)
Deferred Tax Assets/Liabilities (866) (1,509) (2,023) (2,023) (2,023)
Total Assets 25,560 31,592 35,912 36,404 36,427
Source: Company Data, SIHL Research

Tata Motors Ltd. 06th July 2011
9 | P a g e
Income Statement Standalone (Rs Cr)
FY09 FY10 FY11 FY12E FY13E
Gross Sales 28,262 38,145 51,903 61,522 69,616
Less: Excise Duty 2,938 2,771 4,096 4,663 5,277
Net Sales 25,323 35,374 47,807 56,858 64,339
Other Operating Income 307 219 233 200 200
Total Income 25,630 35,593 48,040 57,058 64,539
Expenditure
(Inc)/Dec in Stock in Trade 177 (578) (354) (334) (363)
Consumption of Raw Material 16,188 20,393 27,058 32,283 35,259
Manufacturing Expenses 4,794 7,069 7,832 9,229 10,546
Employee Cost 1,539 1,823 2,294 2,601 3,030
Purchase of Traded Goods 2,180 4,513 7,363 8,759 10,203
Expense Capitalized 885 741 818 818 818
Total Expenditure 23,994 32,479 43,375 51,722 57,858
EBITDA (Ex OI) 1,636 3,114 4,666 5,337 6,681
EBITDA Margins % 6.4% 8.7% 9.7% 9.4% 10.4%
Other Income 1,063 1,996 571 500 500
Depreciation 875 1,034 1,361 1,728 2,096
EBIT 1,825 4,076 3,876 4,108 5,085
EBIT Margins % 7.1% 11.5% 8.1% 7.2% 7.9%
Interest 811 1,246 1,532 1,488 1,314
PBT 1,014 2,830 2,197 2,620 3,771
PBT Margins % 4.0% 7.9% 4.6% 4.6% 5.8%
Tax 13 589 385 472 679
Effective Tax Rate 1.2% 20.8% 17.5% 18.0% 18.0%
PAT 1,001 2,240 1,813 2,149 3,092
PAT Margins % 3.9% 6.3% 3.8% 3.8% 4.8%
EPS 22.26 44.24 33.67 39.92 57.45
Source: Company Data, SIHL Research
Cash Flow Standalone (Rs. Cr.)
FY09 FY10 FY11 FY12E FY13E
Cash Flow from Operations 1,295 6,586 (118) 4,104 5,397
PAT 1,001 2,240 1,813 2,149 3,092
Depreciation 875 1,034 1,361 1,728 2,096
Non Cash Adjustment (100) (1,151) - - -
Change in WC (481) 4,463 (3,292) 227 209
Cash Flow from Investing (10,585) (11,848) (2,400) (3,500) (3,500)
Capital Expenditure (4,029) (2,330) (2,400) (3,500) (3,500)
Other Investment Items (6,556) (9,518) - - -
Cash Flow from Financing 8,105 5,348 373 (1,657) (3,069)
Issue of Equity 4,110 - 2,359 - -
Issue/Repay of Debt 7,049 3,296 (727) (397) (1,809)
Dividend Paid (533) (286) (1,077) (1,077) (1,077)
Dividend Tax (109) (59) (183) (183) (183)
Other Financing Cash Flow (2,412) 2,397
Net Cash (1,185) 86 (2,146) (1,053) (1,172)
Opening Balance 1,865 669 716 2,429 1,376
Closing Balance 669 716 2,429 1,376 204
Source: Company Data, SIHL Research

Tata Motors Ltd. 06th July 2011
10 | P a g e
JLR Income Statement (in £ mn)
FY09 FY10 FY11 FY12E FY13E
Gross Income 4,974 6,555 9,905 12,224 14,186
Less: Excise Duty - - - - -
Dividend & Other Income - - 2 - -
Total Income 4,974 6,555 9,907 12,224 14,186
Expenditure
Manufacturing & Other Expenses 5,461 6,624 8,937 11,046 12,819
Expenses Capitalized (446) (462) (651) (773) (833)
Total Expenditure 5,015 6,162 8,287 10,273 11,985
EBITDA (41) 393 1,621 1,952 2,201
EBITDA Margins -0.8% 6.0% 16.4% 16.0% 15.5%
Product Development Expenditure 39 48 119 147 171
Depreciation 170 310 380 544 708
Interest & Discounting Charges 59 49 22 22 22
Amortization 3 11 - - -
Profit before Exceptional Items & Tax (312) (25) 1,099 1,239 1,301
Borrowings, Deposits & Loans Given - (39) (27) (27) (27)
PBT (312) 15 1,126 1,212 1,274
PBT Margins -6.3% 0.2% 11.4% 9.9% 9.0%
Tax Expenses 25 29 83 90 94
PAT (337) (14) 1,043 1,122 1,179
PAT Margins -6.8% -0.2% 10.5% 9.2% 8.3%
Source: Company Data, SIHL Research
JLR Balance Sheet (in £ mn)
FY09 FY10 FY11 FY12E FY13E
Shareholder's Fund (80) 1,379 1,680.3 2,802 3,982
Share Capital 924 2,320 1,658 1,658 1,658
Reserves & Surplus (1,004) (941) 23 1,145 2,324
Loans Funds 1,953 1,283 1,261 1,453 1,576
Secured Loans 416 1,270 824 950 1,031
Unsecured Loans 1,537 13 437 503 546
Total Liabilities 1,873 2,662 2,941 4,255 5,558
Fixed Assets 2,138 2,554 3,031 3,492 3,789
Gross Block 5,347 5,981 6,104 7,109 8,114
Less: Depreciation & Write Down 3,583 3,801 4,104 4,648 5,355
Net Block 1,764 2,180 2,000 2,461 2,759
Capital WIP 373 374 1,030 1,030 1,030
Investment 0 0 105 105 105
Goodwill (On Consolidation) 376 376 376 376 376
Current Assets, Loans & Advances 1,753 2,709 3,110 4,643 6,225
Inventories 917 995 1,152 1,418 1,646
Sundry Debtors 461 667 562 693 804
Cash and Bank Balances 128 680 923 1,948 3,098
Loans & Advances 247 367 473 583 677
Current Liabilities and Provision 2,453 2,988 3,735 4,416 4,992
Liabilities 1,690 2,349 2,910 3,591 4,167
Provision 763 639 825 825 825
Net Current Assets (700) (278) (625) 228 1,233
Deferred Tax Assets/Liabilities 16 27 55 55 55
Total Assets 1,873 2,662 2,941 4,255 5,558
Source: Company Data, SIHL Research

Tata Motors Ltd. 06th July 2011
11 | P a g e
TML Standalone Key Ratios
Particulars FY10 FY11 FY12E FY13E
BV 295.5 371.8 388.3 422.4
EPS 44.2 33.7 39.9 57.4 P/BV 3.4 2.7 2.6 2.4
P/E 22.6 29.6 25.0 17.4
ROE 15.0% 9.1% 10.3% 13.6% ROCE 12.9% 10.8% 11.3% 14.0%
EBITDA Margins 11.5% 8.1% 7.2% 7.9%
EV/EBITDA 17.1 17.3 12.7 10.1 Source: Company Data, SIHL Research
Peer Group Analysis (FY11)
Companies Financial Year End
Revenue (Rs. Cr.)
EBITDA Margin
PAT Margin
EV/ EBITDA
Debt/ Equity
ROE ROCE
Tata Motors Mar 123,133 13.7% 7.5% 5.3 1.7 48.1% 25.2% Mahindra & Mahindra Mar 36,842 16.5% 8.7% 9.5 1.2 22.4% 17.2% Maruti Suzuki Mar 37,578 9.9% 6.1% 9.3 0.0 16.1% 21.4%
Ashok Leyland Mar 11,118 11.0% 5.7% 8.2 0.6 15.9% 14.8% Source: Company Data, SIHL Research
Global Companies Peer Group Analysis (FY11)
Financial Year End
Current MCap
(USD mn)
Revenue (USD mn)
EBITDA (USD mn)
PAT (USD mn)
Products Debt/ Equity
ROE ROCE
BMW Dec 63,171 87,518 20,912 4,657 9 269.9 14.9 13.5
Toyota Mar 144,181 234,087 20,262 5,031 20 113.8 3.9 5.9
Ford# Dec 53,250 128,954 15,383 6,561 12 NA NA 222.3
Audi Dec 36,228 51,280 7,809 3,742 11 7.3 24.2 20.4
Volkswagen Dec 91,466 182,779 24,002 9,847 14 158.1 16.3 17.8
JLR* Dec - 15,958 2,611 1,680 9 0.75 62.0 42.2
Source: Bloomberg, SIHL Research
Notes:
� Global peer group analysis is made on US Dollar basis.
� *JLR is a not a listed company.
� #Equity of Ford has been in negative USD 15.7 bn since FY08, but it has been improving over the period of years. As of 31st
Dec 2010, total equity for Ford is negative USD 673 mn.

Tata Motors Ltd. 06th July 2011
12 | P a g e
Contact Details Shah Investor’s Home Ltd
164C, Mittal Tower,
C Wing, Nariman Point
Mumbai 400021
www.sihl.in
Contact: [email protected], +91-2204 0782/83
You can also access our reports on Bloomberg (ERH SIH<GO>)
Disclaimer:-
The Information provided by SMS or in newsletter or in any document has been prepared by Shah Investor’s Home Ltd
(SIHL). The Information provided by SMS or in newsletter does not constitute an offer or solicitation for the purchase or sale of any
financial instrument or as an official confirmation of any transaction. The information contained herein is from publicly available data
or other sources believed to be reliable, but we do not represent that it is accurate or complete and it should not be relied on as such.
SIHL or any of its affiliates/ group companies shall not be in any way responsible for any loss or damage that may arise to any person
from any inadvertent error in the information contained in this report or SMS. This Information provided by SMS, reports or in
newsletter is provided for assistance only and is not intended to be and must not alone be taken as the basis for an investment
decision. The user assumes the entire risk of any use made of this information. Each recipient of this Information provided by SMS,
report or in newsletter should make such investigation as it deems necessary to arrive at an independent evaluation of an investment
in the securities of companies referred to in this information provided by SMS, report or in newsletter (including the merits and risks
involved), and should consult his own advisors to determine the merits and risks of such investment. The investment discussed or
views expressed may not be suitable for all investors. This information is strictly confidential and is being furnished to you solely for
your information.
The information should not be reproduced or redistributed or passed on directly or indirectly in any form to any other
person or published, copied, in whole or in part, for any purpose. The information provided by report or SMS is not directed or
intended for distribution to, or use by, any person or entity who is a citizen or resident of or located in any locality, state, country or
other jurisdiction, where such distribution, publication, availability or use would be contrary to law, regulation or which would subject
SIHL and affiliates/ group companies to any registration or licensing requirements within such jurisdiction. The distribution of this
Information provided by SMS or in newsletter in certain jurisdictions may be restricted by law, and persons in whose possession this
Information provided by SMS or in newsletter comes, should inform themselves about and observe, any such restrictions. The
information given or Information provided by SMS, report or in newsletter is as of the date of the issue date of report or the date on
which SMS provided and there can be no assurance that future results or events will be consistent with this information. This
information is subject to change without any prior notice. SIHL reserves the right to make modifications and alterations to this
statement as may be required from time to time. However, SIHL is under no obligation to update or keep the information current.
Nevertheless, SIHL is committed to providing independent and transparent recommendation to its client and would be
happy to provide any information in response to specific client queries. Neither SIHL nor any of its affiliates, group companies,
directors, employees, agents or representatives shall be liable for any damages whether direct, indirect, special or consequential
including lost revenue or lost profits that may arise from or in connection with the use of the information. Past performance is not
necessarily a guide to future performance. The disclosures of interest statements incorporated in the Information provided by SMS,
report or in newsletter are provided solely to enhance the transparency and should not be treated as endorsement of the views
expressed in the report. The analyst for this report certifies that all of the views expressed in this report accurately reflect his or her
personal views about the subject company or companies and its or their securities, and no part of his or her compensation was, is or
will be, directly or indirectly related to specific recommendations or views expressed in this report.