Embed Size (px)
Citation preview
ISWS/CIR-127/77
Circular 127 STATE OF ILLINOIS
DEPARTMENT OF REGISTRATION AND EDUCATION
Tastes and Odors in Water Supplies — A Review
by S. D. Lin
ILLINOIS STATE WATER SURVEY URBANA
1977
CONTENTS PAGE
Abstract 1 Introduction 1
Scope of report 1 Acknowledgments 2
Sources of tastes and odors in water 2 Natural sources 2 Man-made sources 8
Organics 8 Inorganics 10 Treatment 10 Distribution system 11
Variations in taste and odor occurrences 12 Characteristics of tastes and odors 12
Organisms 13 Inorganic chemicals 13 Organic chemicals 14 Mixing odorants 14
Characteristics of the consumers 16 Measurement of tastes and odors 17
Standard methods 17 ASTM method D-l292 18 Reliability 19 Other methods 19 Isolation and identification of causes 20
Control and removal of tastes and odors 21 Reservoirs and lakes 21 Water treatment 25 Treatment in distribution systems 38
References cited 39 Additional references on activated carbon 49

Printed by authority of the State of Illinois-Cb. 127, IRS, Par. 58.29 (6-77-2000)
TASTES AND ODORS IN WATER SUPPLIES - A REVIEW
by S. D. Lin
ABSTRACT
A literature review is made to critically compare the reported sources, characteristics, and experiences in the control of tastes, and odors in potable water supplies. Sources of tastes and odors are grouped as natural and man-made sources, and the probable relationships between sources are schematically diagramed. The characteristics of tastes and odors are compared to causative agents, and the characteristics of consumer responses are discussed. Various measurement techniques are examined.
The control and removal of tastes and odors as practiced for reservoirs and lakes, water treatment units, and distribution systems are reviewed. Theoretical concepts and practical examples of each treatment process are given, and the costs of treatment are noted. The case studies presented will be helpful and the report useful for resource planners, consulting engineers, regulatory agencies, and water utility personnel.
INTRODUCTION
Consumers are entitled to a palatable water, as well as a safe water, at all times. The water must be free of any detectable taste and odor when it is used for drinking, cooking, or bathing purposes. In Illinois1 the maximum allowable threshold odor number (TON) for drinking water is limited to 3.
Taste, as a specific sensory process, is very rarely a problem in public water supplies. Most 'tastes' are concerned almost entirely with odors.2'3 Undesirable odors occur frequently in many water supplies in Illinois, especially those depending upon surface waters as the source of supply.
Taste and odor episodes vary in intensity, persistency, and frequency of occurrence. It is the sporadic nature of these episodes that leaves the water plant operator wondering if his treatment techniques corrected the problem or if the problem diminished through a natural course of time.
Some episodes are predictable. Midwestern rivers are often the source of tastes and odors only during high flow periods following late winter thaws. In midwestern reservoirs tastes and odors are not uncommon during fall destratification, i.e., lake turnover. Nevertheless, the unexpected occurrence is more the rule.
Great strides have been made in improving the palatability of water. Some water treatment facilities have features designed to remove organics, insecticides, phenols, and industrial chemicals, but most do not. Taste and odor control continues to remain an art in most localities with as much reliance on hope as on science.
Scope of Report Literature reviews encompassing the problems and control of taste and odor in water
supplies have been performed by several scientists.4"10 It is the intent of this report to update
1

these reviews. Special reliance has been placed on those papers and publications authored during the period 1950-1975. Every effort has been made to cite findings related to sources of taste and odors, their most often detected characteristics, how they are quantified and qualified, and methods used to control them at the sources of supply as well as within the unit operations of the water treatment plant. [Note: Units of measure are those used in the original studies.]
Acknowledgments
This report has been prepared under the general supervision of Dr. William C. Ackermann, Chief of the Illinois State Water Survey, and the guidance of Ralph L. Evans, Head of the Water Quality Section. Mr. Evans reviewed the draft. The illustrations were prepared by the Graphic Arts Section under the supervision of John W. Brother, Jr.; Mrs. J. Loreena Ivens and Mrs. Patricia A. Motherway edited the final report, Mrs. Suzi O'Connor prepared the camera copy, and Rebecca L. Phillips typed the original manuscript.
SOURCES OF TASTES AND ODORS IN WATER
Tastes and odors in water may be derived from a variety of conditions and sources. The sources can be characterized as natural and man-made with the understanding that taste and odor occurrences may develop from either one or the other, or a combination of both. This concept is schematically depicted in figure 1.
Whether a source of taste and odor is a natural one or man-made frequently is not clear cut, and often not important. Algae and decaying vegetation are the principal substances related to natural sources.7 Hartung11 suggests that the most troublesome and objectionable situations are created by man-made sources, such as domestic and industrial wastes and agricultural activities. Experience in Illinois permits a more definitive characterization indicating that algae and decaying vegetation problems are inherently associated with impounded waters, whereas waste-oriented situations are usually limited to free flowing rivers and streams.
Natural Sources Algae. About 60 algal species have been reported as producers of substances leading to
taste and odors in water.7 Table 1 gives a partial list, compiled by Palmer12 in his excellent work on algae-related problems in public water supplies.
Some worthwhile reviews2'13 have been made of the progress of research over the past decade in the identification and chemistry of odor and taste-causing substances produced by algae. Generally, such substances are released during the growth phase of algal cell development. Some of the odorous metabolites produced by algae have been identified as alcohols, esters, aldehydes, ketones, and acids.
Safferman et al.14 in 1967 were the first investigators to submit evidence that geosmin (C12 H22 O) is produced by algae. This is the substance first isolated by Gerber and Lechevalier15
2
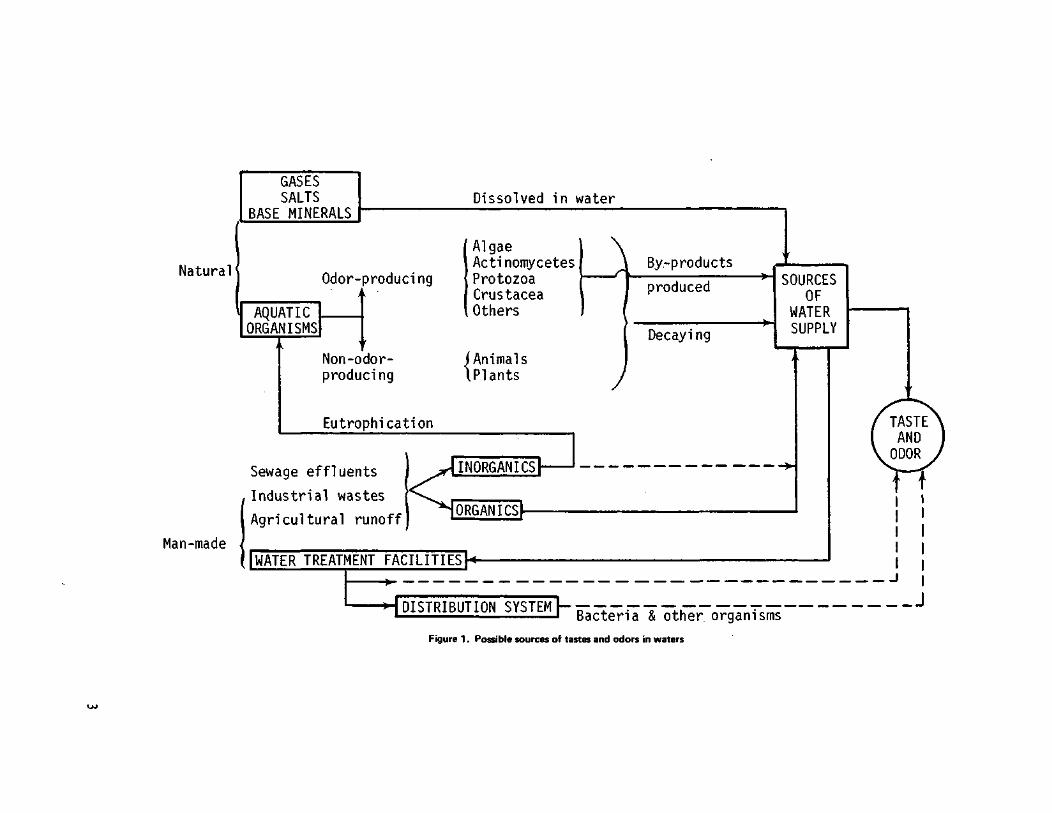
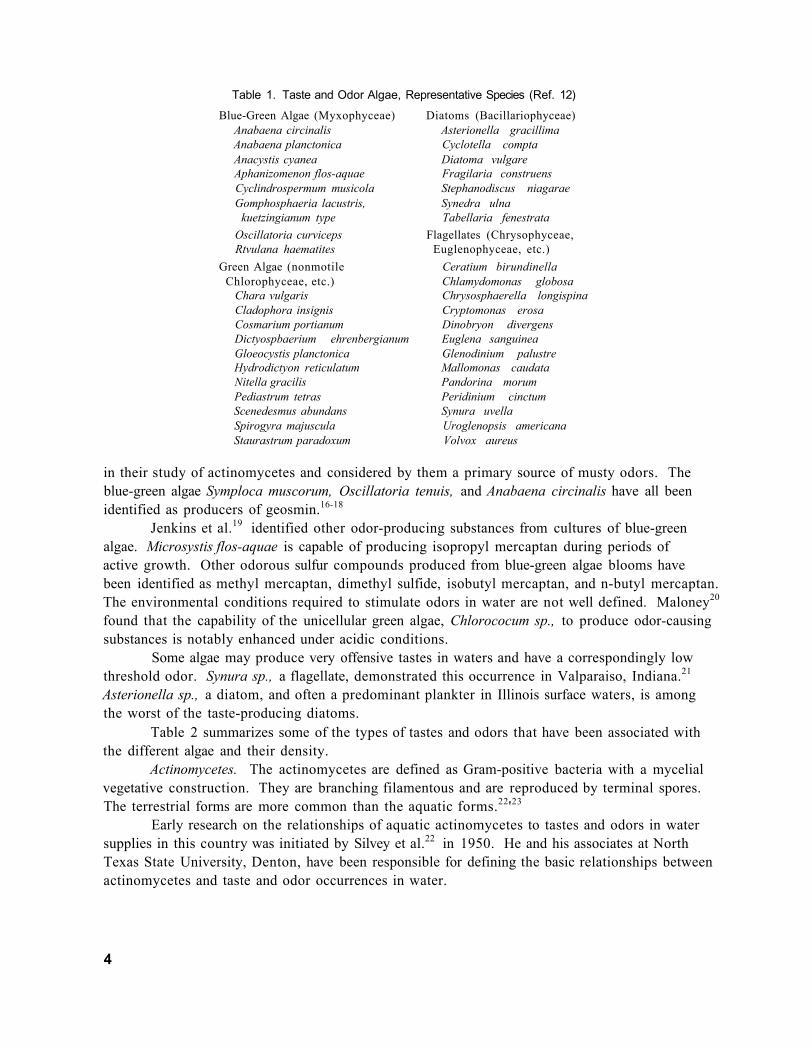
Table 1. Taste and Odor Algae, Representative Species (Ref. 12)
Blue-Green Algae (Myxophyceae) Diatoms (Bacillariophyceae) Anabaena circinalis Asterionella gracillima Anabaena planctonica Cyclotella compta Anacystis cyanea Diatoma vulgare Aphanizomenon flos-aquae Fragilaria construens Cyclindrospermum musicola Stephanodiscus niagarae Gomphosphaeria lacustris, Synedra ulna
kuetzingianum type Tabellaria fenestrata Oscillatoria curviceps Flagellates (Chrysophyceae, Rtvulana haematites Euglenophyceae, etc.)
Green Algae (nonmotile Ceratium birundinella Chlorophyceae, etc.) Chlamydomonas globosa
Chara vulgaris Chrysosphaerella longispina Cladophora insignis Cryptomonas erosa Cosmarium portianum Dinobryon divergens Dictyospbaerium ehrenbergianum Euglena sanguinea Gloeocystis planctonica Glenodinium palustre Hydrodictyon reticulatum Mallomonas caudata Nitella gracilis Pandorina morum Pediastrum tetras Peridinium cinctum Scenedesmus abundans Synura uvella Spirogyra majuscula Uroglenopsis americana Staurastrum paradoxum Volvox aureus
in their study of actinomycetes and considered by them a primary source of musty odors. The blue-green algae Symploca muscorum, Oscillatoria tenuis, and Anabaena circinalis have all been identified as producers of geosmin.16-18
Jenkins et al.19 identified other odor-producing substances from cultures of blue-green algae. Microsystis flos-aquae is capable of producing isopropyl mercaptan during periods of active growth. Other odorous sulfur compounds produced from blue-green algae blooms have been identified as methyl mercaptan, dimethyl sulfide, isobutyl mercaptan, and n-butyl mercaptan. The environmental conditions required to stimulate odors in water are not well defined. Maloney20
found that the capability of the unicellular green algae, Chlorococum sp., to produce odor-causing substances is notably enhanced under acidic conditions.
Some algae may produce very offensive tastes in waters and have a correspondingly low threshold odor. Synura sp., a flagellate, demonstrated this occurrence in Valparaiso, Indiana.21
Asterionella sp., a diatom, and often a predominant plankter in Illinois surface waters, is among the worst of the taste-producing diatoms.
Table 2 summarizes some of the types of tastes and odors that have been associated with the different algae and their density.
Actinomycetes. The actinomycetes are defined as Gram-positive bacteria with a mycelial vegetative construction. They are branching filamentous and are reproduced by terminal spores. The terrestrial forms are more common than the aquatic forms.22'23
Early research on the relationships of aquatic actinomycetes to tastes and odors in water supplies in this country was initiated by Silvey et al.22 in 1950. He and his associates at North Texas State University, Denton, have been responsible for defining the basic relationships between actinomycetes and taste and odor occurrences in water.
4
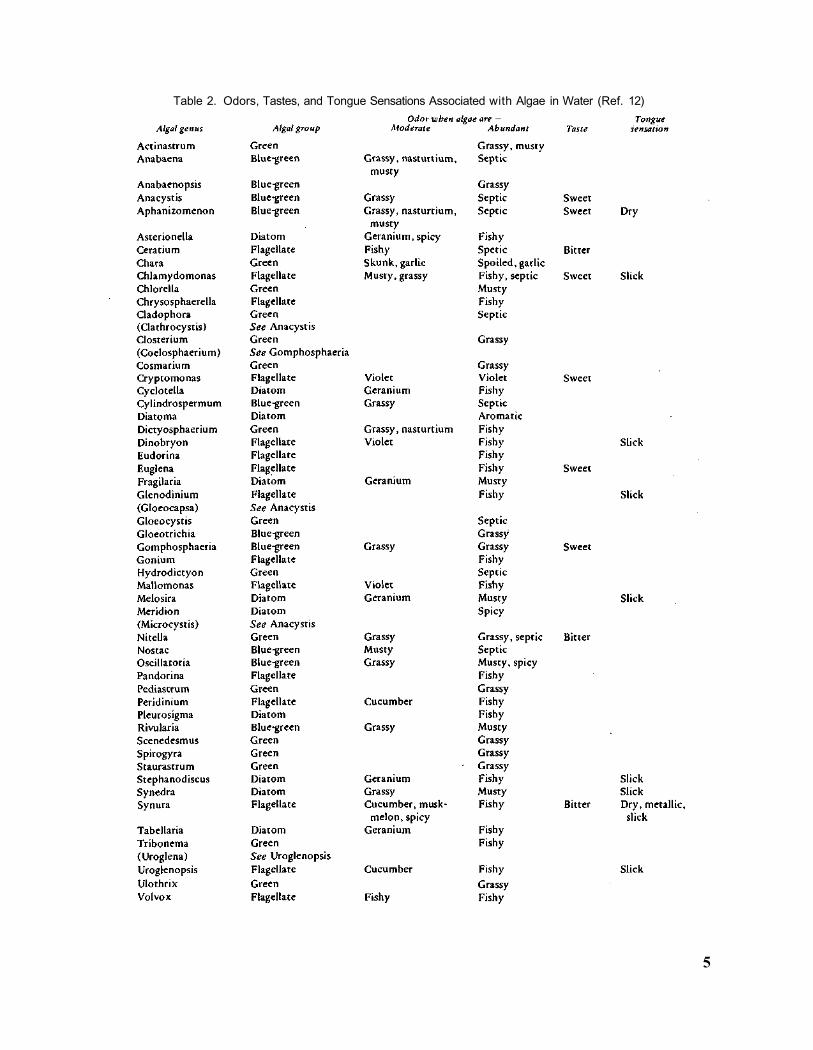
Table 2. Odors, Tastes, and Tongue Sensations Associated with Algae in Water (Ref. 12)
5
The life history and morphology of aquatic actinomycetes have been described by Silvey et al.22 and other workers24-27 The organisms have a primary stage (colonies measure less than 1 mm diameter) which is short lived. Development depends upon water temperature, nutrients, and dissolved oxygen content. Typical odors emitted during the primary stage include fishy, grassy, hay-like, and potato bin. The primary stage gives rise to intermediate gametes that unite to form motile secondary stages. This development will not occur in the absence of dissolved oxygen.
In the secondary stage the organisms are larger, and their colony development is more diverse. They grow best along the edges of lakes, reservoirs, or streams. Muddy shoals with white or grey growths near the waterline are typical of developments. The secondary stages produce odors that are classified as musty, woody, and earthy.
Three genera commonly found in water supplies are Streptomyces, Micromonospora, and Nocardia. Many species of the first two genera have been isolated from the southernmost water of Lake Michigan.27 Silvey's work28'29 has demonstrated the dependency of actinomycetes on phosphorus in producing tastes and odors in lakes and reservoirs in the southwest portion of the United States.
Morris30 in 1961 reported on the correlation between musty odors and the concentration of actinomycete spores in the Cedar River near Cedar Rapids, Iowa. This experience showed that tastes and odors in midwestern streams can be quite intense, will persist for only a short period of time, and will subside with river stage. Erdei31 observed similar correlations in the Missouri River near Omaha, Nebraska.
There have been several successful efforts in isolating the odor-producing substances derived from actinomycete activity. Romano and Safferman32 in 1963, isolated an odoriferous concentrate from pure cultures of Streptomyces griseoluteus IM 3718 that had a threshold odor number in the billions. The chemical structure of the brown amorphous substance was not identified. Morris et al.33 isolated a pale-yellow oil that produced a decidedly musty odor during the Cedar River episode. Gaines and Collins34,35 identified a number of organic compounds from actinomycetes, but it was not clear whether the compounds were related to taste and odor in water.
Geosmin, as mentioned earlier, is an odor-producing compound produced by certain species of actinomycetes in water.15 It is a neutral oil with an earthy or woody odor. Dougherty et al.36 later isolated a compound produced by some actinomycetes that emitted a persistent musty odor. An empirical formula was developed, C12 H18 0 2 , and the compound was called mucidone.37
Other reports of odor-producing substances include that by Henley et al.38 of a volatile compound of 5-methyl-3-heptanone from a Streptomyces cinnamoneus-like culture, and that by Rosen et al.39 of 2-methylisoborneol from the metabolites of certain strains of actinomycetes.
A variety of techniques are being employed to gain further insight into the chemistry of odor-producing substances derived from the activity of actinomycetes and algae. These include gas chromatography, ultraviolet and infrared spectrophotometry, mass spectrophotometry, nuclear magnetic resonance, elemental analysis, and microdistillation. Silvey et al.40 reported that gas-liquid chromatography offers considerable promise in these studies.
Most of the taste and odor problems occurring in impounded waters in Illinois are believed to be associated with algae. This may not be the case, as Silvey and Roach25 have shown that
6

actinomycetes, not algae, are principally responsible for the Table 3. Frequency of Odor Types production of earthy, musty, and woody odors in public Attributed to Decaying Vegetation water supplies.
Decaying Vegetation. From surveys by Sigworth41
and Baker,5 decaying vegetation is the second most frequent source of tastes and odors in water. Such vegetation consists mostly of algae, leaves, and aquatic weeds. The decay of other plants and animals, disturbance of bottom deposits, and seepage from stagnant areas are frequently included as part of this source.
During the decaying process, by-products can be produced that not only cause odors in water but that also stimulate the growth of other organisms which in turn are capable of producing odors. Decaying leaves can produce phenols.42 They can also be a source of nutrients for algae which can produce odor and taste-causing substances. The by-products of algae can sustain actinomycetes; and the by-products of actinomycetes, particularly the amino group, can be reassimilated by some plants.23
The types of odors produced by decaying vegetation, as summarized from Sigworth,41 are included in table 3. Odors classified as 'musty' are most often reported. Other occurrences have been described as septic, muddy, boggy, vegetable, phenolic, peaty, rotten, putrid, pig sty, soaked straw, very sour, varnishy, barnyard, and horse urine.
Bacteria. It may be stretching a point to establish a category for bacterial-mediated tastes and odors separate from that for decaying vegetation, because vegetation does not decay without bacterial activity. Even though the relationships of bacteria, algae, other vegetation, and actinomycetes are often interrelated in the production of tastes and odors, as documented by Silvey43 and others,44 there are cases where bacterial activity in relation to mineral matter are the chief causes of tastes and odors.
For example, iron bacteria have been responsible for tastes and odors in groundwater as well as in water distribution systems independent of the source of water.45 Sulfate-reducing bacteria have been frequently reported as responsible for the production of odoriferous compounds, namely hydrogen sulfide. These modes of odor production, along with the bacterial activity on the proteins of algae, as assumed by Rohlich and Sarles,46 justify the inclusion of bacteria as an entity in the production of tastes and odors in water.
Zooplankton. Occurrences of tastes and odors due to zooplankton are not common. In high densities, however, microcrustacea can produce intense fishy tastes and odors in small reservoirs. In addition, Cyclops, the most frequently occurring Crustacea, have caused filter clogging.43 They have been observed in large numbers, during the spring, in the impoundment serving Canton, Illinois.
Another crustacean, Daphnia, when in large numbers, may impart a fishy odor to water.10
The protozoa Ceratium and Condonella can produce similar odors in water, as can certain species of the rotifera, Anurea.10
Hydrogen Sulfide. Hydrogen sulfide (H2 S) is a colorless gas, heavier than air, and moderately soluble in water. It emits a rotten egg odor and turns silverware black. It can be poisonous if inhaled. It is frequently found in groundwater aquifers47-51 and sometimes in the hypolimnia of reservoirs.52,53
7
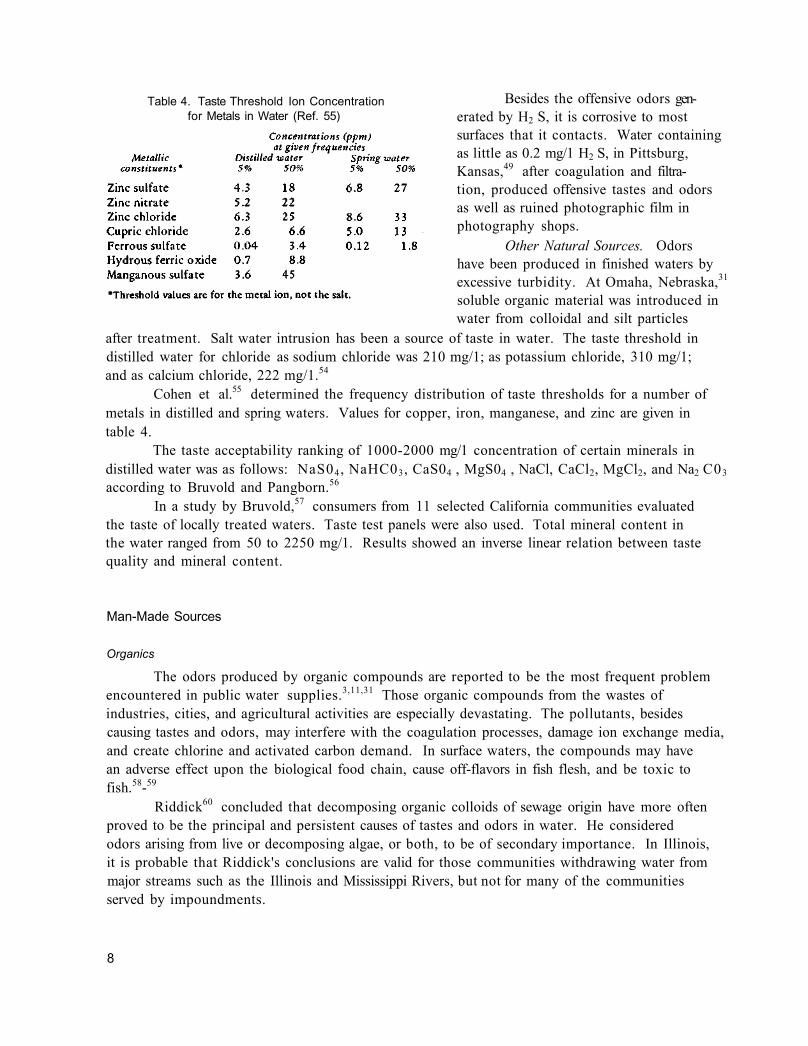
Table 4. Taste Threshold Ion Concentration for Metals in Water (Ref. 55)
Besides the offensive odors generated by H2 S, it is corrosive to most surfaces that it contacts. Water containing as little as 0.2 mg/1 H2 S, in Pittsburg, Kansas,49 after coagulation and filtration, produced offensive tastes and odors as well as ruined photographic film in photography shops.
Other Natural Sources. Odors have been produced in finished waters by excessive turbidity. At Omaha, Nebraska,31
soluble organic material was introduced in water from colloidal and silt particles
after treatment. Salt water intrusion has been a source of taste in water. The taste threshold in distilled water for chloride as sodium chloride was 210 mg/1; as potassium chloride, 310 mg/1; and as calcium chloride, 222 mg/1.54
Cohen et al.55 determined the frequency distribution of taste thresholds for a number of metals in distilled and spring waters. Values for copper, iron, manganese, and zinc are given in table 4.
The taste acceptability ranking of 1000-2000 mg/1 concentration of certain minerals in distilled water was as follows: NaS04 , NaHC03, CaS04 , MgS04 , NaCl, CaCl2, MgCl2, and Na2 C03
according to Bruvold and Pangborn.56
In a study by Bruvold,57 consumers from 11 selected California communities evaluated the taste of locally treated waters. Taste test panels were also used. Total mineral content in the water ranged from 50 to 2250 mg/1. Results showed an inverse linear relation between taste quality and mineral content.
Man-Made Sources
Organics
The odors produced by organic compounds are reported to be the most frequent problem encountered in public water supplies.3,11,31 Those organic compounds from the wastes of industries, cities, and agricultural activities are especially devastating. The pollutants, besides causing tastes and odors, may interfere with the coagulation processes, damage ion exchange media, and create chlorine and activated carbon demand. In surface waters, the compounds may have an adverse effect upon the biological food chain, cause off-flavors in fish flesh, and be toxic to fish.58-59
Riddick60 concluded that decomposing organic colloids of sewage origin have more often proved to be the principal and persistent causes of tastes and odors in water. He considered odors arising from live or decomposing algae, or both, to be of secondary importance. In Illinois, it is probable that Riddick's conclusions are valid for those communities withdrawing water from major streams such as the Illinois and Mississippi Rivers, but not for many of the communities served by impoundments.
8
Tastes and odors of organic origin are not limited to surface water. Smith and Grigo-ropoulos58 reported on odors in subsurface waters caused by trace organics. Spring water extracts were found to have a much lower threshold odor concentration than deep well extracts, and the characteristics of the odors were different
The accumulative effect of organic contaminants on the health of consumers is not known. Some trace organics may present toxico-logical problems.61 Primary among them are phenols and chlorinated pesticides.
Phenols. The role of phenol in tastes and odors in water has been exaggerated. It has been found in considerable quantities in water without causing tastes and odors.62"64 One of the problems is that 'phenol' is a term used for a family of similar compounds which may produce offensive odors. This is especially true if some of these compounds are chlorinated.
Phenolic tastes and odors have been reported by users of the Monongahela, Allegheny, and upper Ohio Rivers.65"67 These problems have generally been associated with the by-products of coal in steel or chemical industries. However, phenolic odors are not always caused by industrial wastes. Hoak62 reported the lack of correlation of phenol concentrations in raw water and ' characteristic medicinal (phenolic) odors. This indicated that some other 'phenolic' substance was responsible.
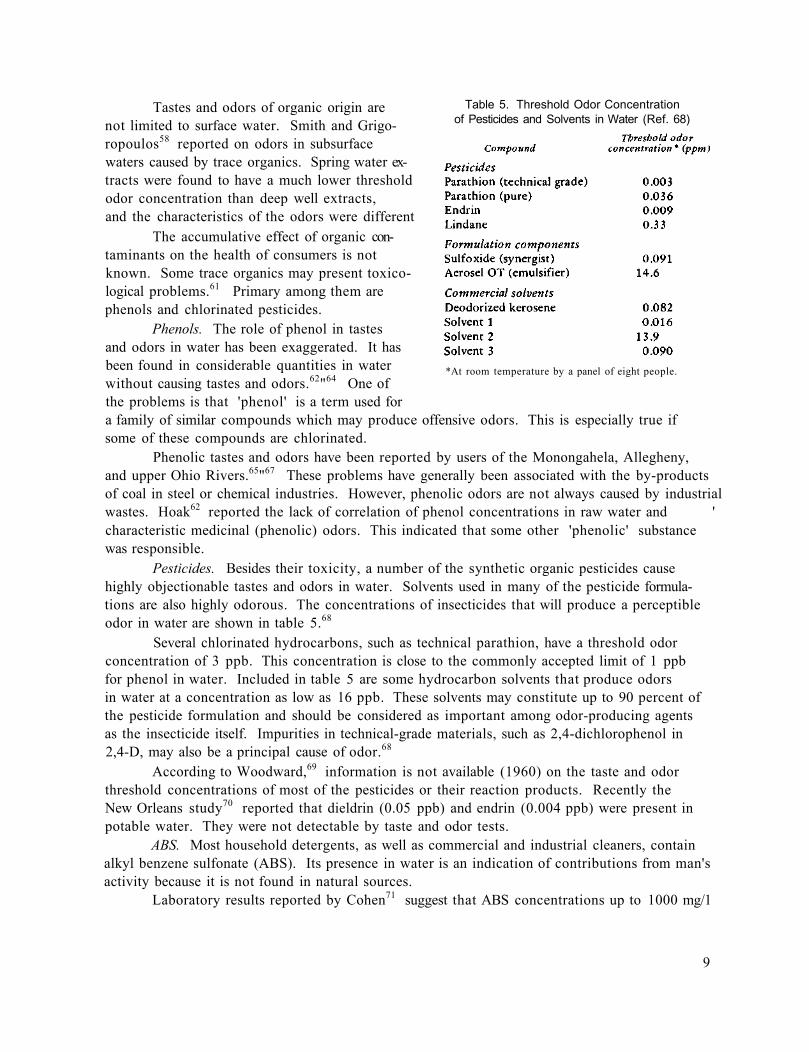
Pesticides. Besides their toxicity, a number of the synthetic organic pesticides cause highly objectionable tastes and odors in water. Solvents used in many of the pesticide formulations are also highly odorous. The concentrations of insecticides that will produce a perceptible odor in water are shown in table 5.68
Several chlorinated hydrocarbons, such as technical parathion, have a threshold odor concentration of 3 ppb. This concentration is close to the commonly accepted limit of 1 ppb for phenol in water. Included in table 5 are some hydrocarbon solvents that produce odors in water at a concentration as low as 16 ppb. These solvents may constitute up to 90 percent of the pesticide formulation and should be considered as important among odor-producing agents as the insecticide itself. Impurities in technical-grade materials, such as 2,4-dichlorophenol in 2,4-D, may also be a principal cause of odor.68
According to Woodward,69 information is not available (1960) on the taste and odor threshold concentrations of most of the pesticides or their reaction products. Recently the New Orleans study70 reported that dieldrin (0.05 ppb) and endrin (0.004 ppb) were present in potable water. They were not detectable by taste and odor tests.
ABS. Most household detergents, as well as commercial and industrial cleaners, contain alkyl benzene sulfonate (ABS). Its presence in water is an indication of contributions from man's activity because it is not found in natural sources.
Laboratory results reported by Cohen71 suggest that ABS concentrations up to 1000 mg/1
Table 5. Threshold Odor Concentration of Pesticides and Solvents in Water (Ref. 68)
9
*At room temperature by a panel of eight people.
in water do not produce odors. Much lower concentrations produce objectionable tastes. Purified ABS at a concentration of 60 mg/1 was detected in water by 50 percent of a 15-member taste panel. The lowest detectable concentration of 16 mg/1 was reported by only 5 percent of the panel.
The ABS content of finished water rarely exceeds a few tenths of a milligram per liter. This clearly suggests that ABS alone, at concentrations usually found in potable water, is not the cause of taste and odor. Reported tastes and odors associated with ABS are more likely caused by those contaminants of man-made origin that may accompany ABS.
Although tastes and odors may not be caused by ABS, levels in the range of 0.5-1.0 mg/1 may adversely affect the aesthetic quality of finished water.72 Also some difficulties may be experienced in the water treatment process, such as coagulation, due to ABS. However, ABS is not a prime source of tastes and odors in finished waters.
Other Man-Made Sources. Hartung11 reported on the severe tastes and odors created by a ruptured petroleum pipeline. Besides material from oil refineries, the periodic discharge of wastes from paint and varnish manufacturers have caused objectionable taste and odor problems.
Inorganics
The introduction of significant quantities of nutrients, such as nitrogen and phosphorus, into a water supply may indirectly cause tastes and odors. Such nutrients may stimulate algal growth and actinomycete propogation. As mentioned earlier, these organisms are frequently responsible for tastes and odors in water.
Sulfur and iron are the other inorganic constituents likely to create tastes and odors.
Treatment The halogens, chlorine, bromine, and iodine, are used for disinfection and/or taste
and odor control as part of the water treatment process. Free halogen residuals usually produce tastes and odors in potable water.
Bryan et al.73 made some taste threshold determinations of these residuals in water. They found that the threshold taste values for chlorine residuals varied with pH. At a pH of 5.0, it was 0.075 mg/1; at pH 7.0, it was 0.156 mg/1; and at pH 9.0, it was 0.450 mg/1. At an unadjusted pH of 5.3, it was 0.050 mg/1. Threshold taste values for bromine and iodine, as determined by panel members, did not vary appreciably with pH. For bromine the taste threshold values ranged from 0.168 to 0.226 mg/1 for varying pH. Similarly, values for iodine ranged from 0.147 to 0.204 mg/1.
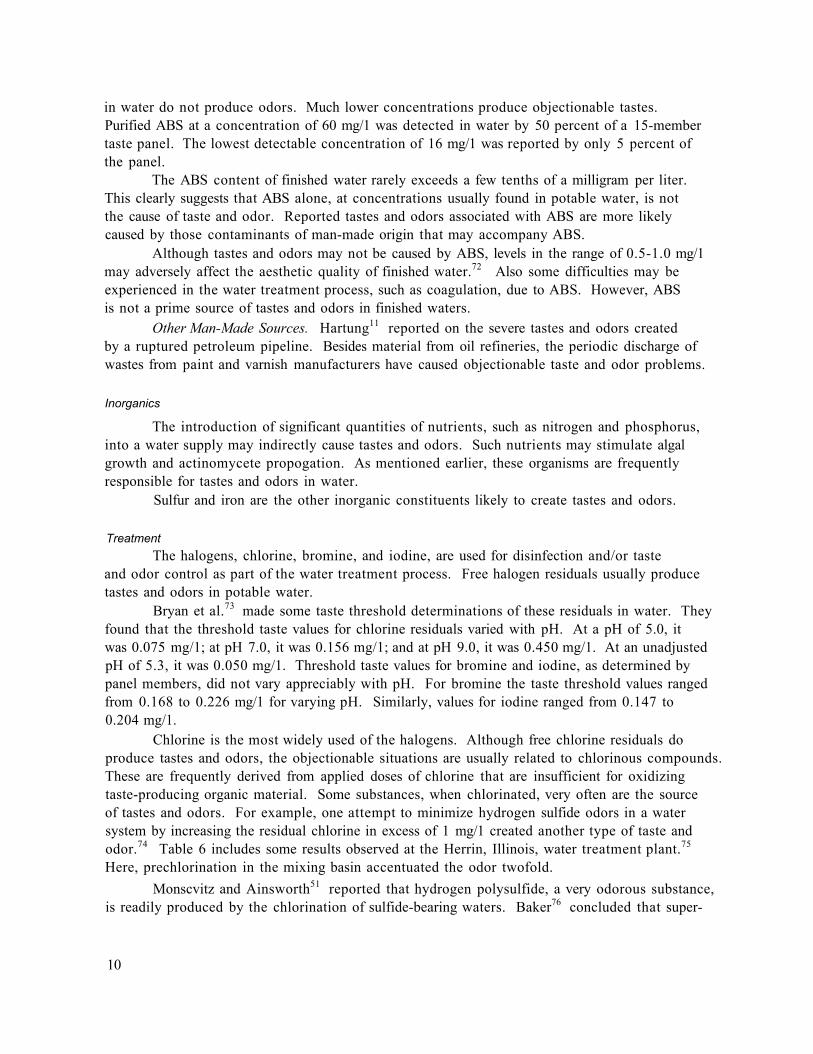
Chlorine is the most widely used of the halogens. Although free chlorine residuals do produce tastes and odors, the objectionable situations are usually related to chlorinous compounds. These are frequently derived from applied doses of chlorine that are insufficient for oxidizing taste-producing organic material. Some substances, when chlorinated, very often are the source of tastes and odors. For example, one attempt to minimize hydrogen sulfide odors in a water system by increasing the residual chlorine in excess of 1 mg/1 created another type of taste and odor.74 Table 6 includes some results observed at the Herrin, Illinois, water treatment plant.75
Here, prechlorination in the mixing basin accentuated the odor twofold. Monscvitz and Ainsworth51 reported that hydrogen polysulfide, a very odorous substance,
is readily produced by the chlorination of sulfide-bearing waters. Baker76 concluded that super-
10
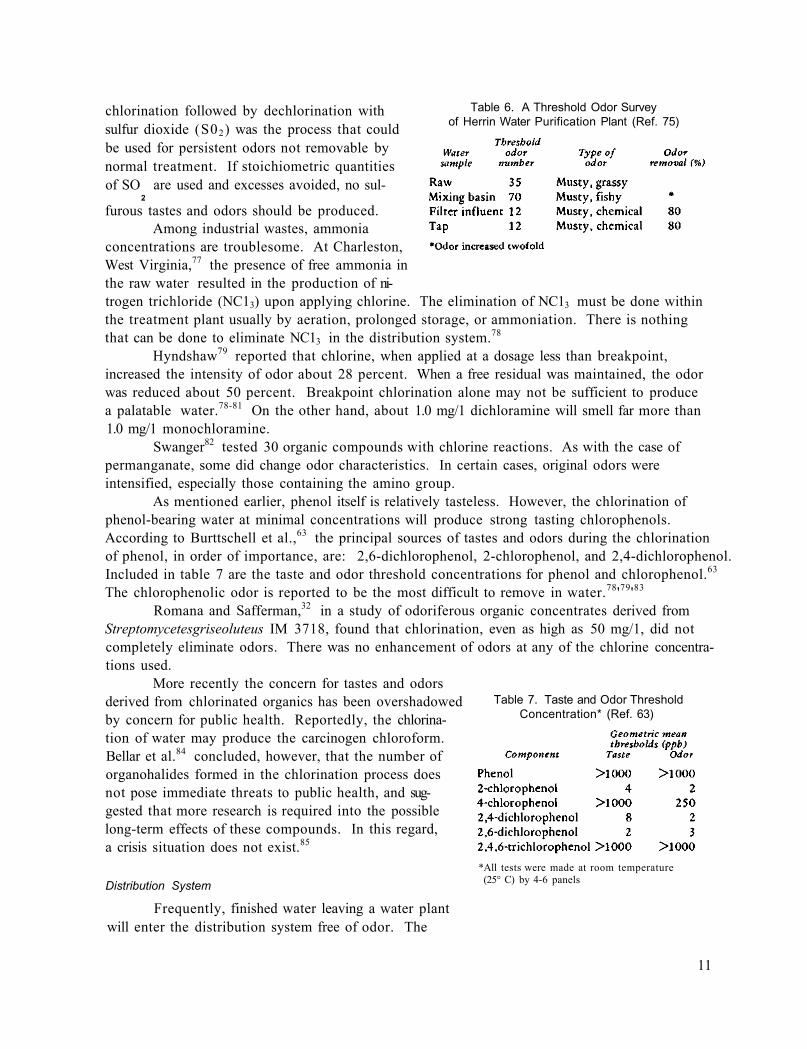
Table 6. A Threshold Odor Survey of Herrin Water Purification Plant (Ref. 75)
chlorination followed by dechlorination with sulfur dioxide (S02) was the process that could be used for persistent odors not removable by normal treatment. If stoichiometric quantities of SO are used and excesses avoided, no sul-
2
furous tastes and odors should be produced. Among industrial wastes, ammonia
concentrations are troublesome. At Charleston, West Virginia,77 the presence of free ammonia in the raw water resulted in the production of nitrogen trichloride (NC13) upon applying chlorine. The elimination of NC13 must be done within the treatment plant usually by aeration, prolonged storage, or ammoniation. There is nothing that can be done to eliminate NC13 in the distribution system.78
Hyndshaw79 reported that chlorine, when applied at a dosage less than breakpoint, increased the intensity of odor about 28 percent. When a free residual was maintained, the odor was reduced about 50 percent. Breakpoint chlorination alone may not be sufficient to produce a palatable water.78-81 On the other hand, about 1.0 mg/1 dichloramine will smell far more than 1.0 mg/1 monochloramine.
Swanger82 tested 30 organic compounds with chlorine reactions. As with the case of permanganate, some did change odor characteristics. In certain cases, original odors were intensified, especially those containing the amino group.
As mentioned earlier, phenol itself is relatively tasteless. However, the chlorination of phenol-bearing water at minimal concentrations will produce strong tasting chlorophenols. According to Burttschell et al.,63 the principal sources of tastes and odors during the chlorination of phenol, in order of importance, are: 2,6-dichlorophenol, 2-chlorophenol, and 2,4-dichlorophenol. Included in table 7 are the taste and odor threshold concentrations for phenol and chlorophenol.63
The chlorophenolic odor is reported to be the most difficult to remove in water.78'79'83
Romana and Safferman,32 in a study of odoriferous organic concentrates derived from Streptomycetesgriseoluteus IM 3718, found that chlorination, even as high as 50 mg/1, did not completely eliminate odors. There was no enhancement of odors at any of the chlorine concentrations used.
More recently the concern for tastes and odors derived from chlorinated organics has been overshadowed by concern for public health. Reportedly, the chlorination of water may produce the carcinogen chloroform. Bellar et al.84 concluded, however, that the number of organohalides formed in the chlorination process does not pose immediate threats to public health, and suggested that more research is required into the possible long-term effects of these compounds. In this regard, a crisis situation does not exist.85
Table 7. Taste and Odor Threshold Concentration* (Ref. 63)
Distribution System
Frequently, finished water leaving a water plant will enter the distribution system free of odor. The
*All tests were made at room temperature (25°C) by 4-6 panels
11
farther the water travels in the distribution system, the more intense an odor may become. This is possibly due to populations of sulfur or iron bacteria, algae, or actinomycetes growing in the distribution system.86-88 Rusty water or offensive odors at isolated points in a distribution system are often attributable to sulfate-reducing bacteria.86 High ferrous iron was found in deadends and areas of low flow owing to excess carbon dioxide. Carbonic acid created serious taste problems in new copper plumbing at Brantford, Ontario.89 It is reported hydrogen sulfide gas was produced by sulfate-reducing bacteria in magnesium anode-equipped hot water tanks.74
Variations in Taste and Odor Occurrences The occurrences of tastes and odors at a water plant or in a water system are generally
unpredictable. Some water supplies do experience patterns, however. At Valparaiso, Indiana, Coote21 reported on two major odor periods. One of these related to algae growth and the other to lake turnover. During turnover, tastes and odors were more offensive and much more difficult to control than during the algal growth phase.
Problems at Cedar Rapids, Iowa, where stream waters serve as the source of supply, generally occur during the spring runoff.90 DuByne91 reported that taste and odor problems can occur from waters of the Maumee River, Ohio, mainly during three periods of the year, i.e., 1) late winter when ice cover has existed for sometime; 2) the summer at low flow times; and 3) early fall when rains scour decayed vegetation from the river bottom. The summer period is the longest, the fall the shortest.
The principal taste and odor problems at Omaha, on the Missouri River, occur when turbidity increases and when there is an abrupt rise or fall in river levels.31
Those communities served by lakes or reservoirs can experience problems during changes from one of water abundance to one of water shortage,92 as well as from the periodic succession of various algae species.93
CHARACTERISTICS OF TASTES AND ODORS
The terms 'taste' and 'odor' are used jointly in the vernacular of water technology.6
As mentioned earlier, the taste and odor problems in water supplies are concerned almost entirely with odors. The technical literature contains relatively little concerning taste of water alone. According to psychologists,94 there are only four taste sensations: sour, sweet, salty, and bitter. All other sensations commonly ascribed to the sense of taste are actually odors, even though the sensation is not noticed until the material is taken into the mouth. Many dissolved salts and minerals can be detected by taste. Taste, as a specific sensory process, is rarely a problem in water supply.2
Odors occur in water because of the presence of foreign substances. The sources of odors have been described in the previous section. The characteristic of an odor may be described by several terms. Frequently the experts disagree. Odors of surface waters have been described as hay-like, manure, geranium, earthy, musty, fishy, moldy, paint-like, woody, marshy, iodoform-
12
Organisms The odors caused by dead organic matter can be
classified as vegetable odors and odors of decomposition. These smells vary in character in different waters and at different seasons. Many vegetable odors are caused by colloidal vegetable matter. Brown-colored waters invariably have a sweetish vegetable odor, and the intensity of the odor varies with the depth of the color. Both color and odor are due to the presence of certain glucosides, such as tannin, extracted from leaves, grasses, and other vegetation.95 The decaying vegetation, such as algae, grass, leaves, and underwater weeds, usually result in an odor which may be characterized as grassy, musty, swampy, or moldy.96'97
The odors produced by actinomycetes are classified as earthy, woody, and musty, and are occasionally accompanied by taints of potato, grass, or hay.22
Inorganic Chemicals
Most inorganic chemicals, except sulfur compounds, are nonodorous. Hydrogen sulfide is one of the frequently reported odor problems in groundwater supplies. It is characterized as a rotten egg odor. At very low concentrations, hydrogen sulfide is musty or swampy.
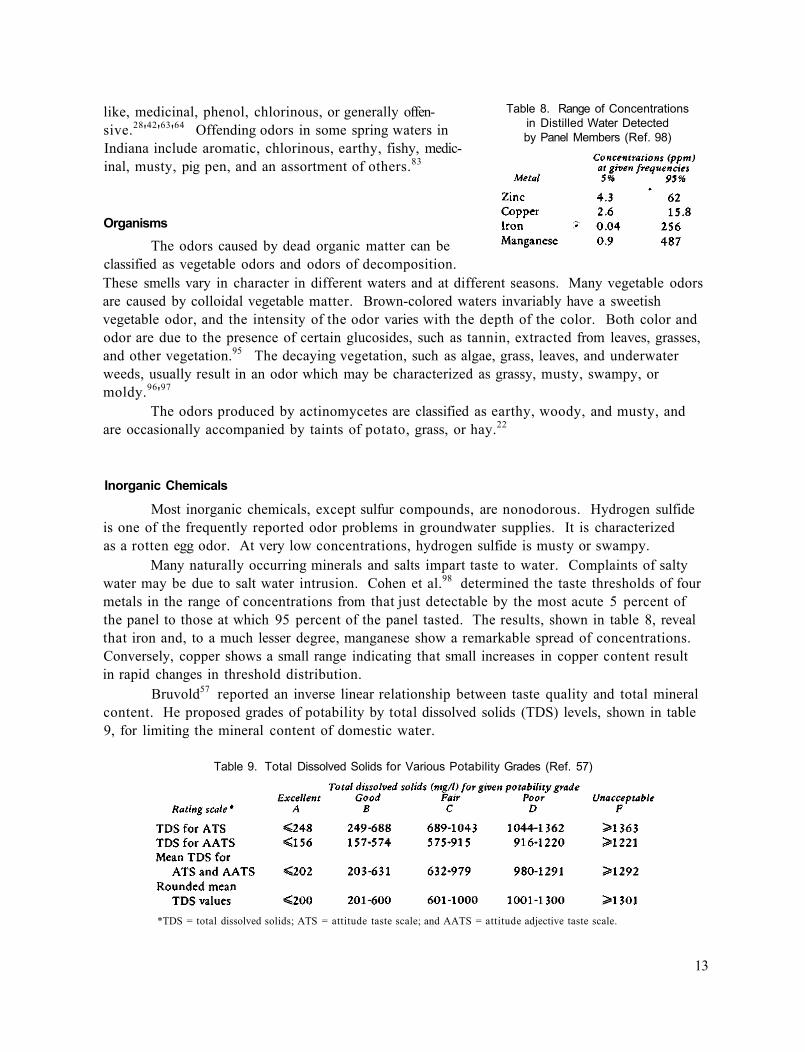
Many naturally occurring minerals and salts impart taste to water. Complaints of salty water may be due to salt water intrusion. Cohen et al.98 determined the taste thresholds of four metals in the range of concentrations from that just detectable by the most acute 5 percent of the panel to those at which 95 percent of the panel tasted. The results, shown in table 8, reveal that iron and, to a much lesser degree, manganese show a remarkable spread of concentrations. Conversely, copper shows a small range indicating that small increases in copper content result in rapid changes in threshold distribution.
Bruvold57 reported an inverse linear relationship between taste quality and total mineral content. He proposed grades of potability by total dissolved solids (TDS) levels, shown in table 9, for limiting the mineral content of domestic water.
Table 9. Total Dissolved Solids for Various Potability Grades (Ref. 57)
*TDS = total dissolved solids; ATS = attitude taste scale; and AATS = attitude adjective taste scale.
13
like, medicinal, phenol, chlorinous, or generally offensive.28'42'63'64 Offending odors in some spring waters in Indiana include aromatic, chlorinous, earthy, fishy, medicinal, musty, pig pen, and an assortment of others.83
Table 8. Range of Concentrations in Distilled Water Detected by Panel Members (Ref. 98)

It is commonly believed that distilled water has no taste because of its inherent lack of dissolved oxygen (DO) and mineral salts. However, Bruvold and Pangborn99 found that DO has no effect on the taste of odor-free mineral waters and of distilled water.
The taste of sodium fluoride when placed dry on the tongue is salty, somewhat weaker than sodium chloride. Fluoridation with sodium fluoride by water plants is advocated for the control of dental decay. Cox and Nathans100 reported that a solution of sodium fluoride at a concentration as low as 2.4 mg/1 fluoride can be distinguished by taste from distilled water through the ionic effect. Their 187 panel test indicated that the probability of detection of 1 mg/1 fluoride (recommended value) was less than 0.001. They concluded that at low (subthreshold) concentrations of salts there was an ionic effect that influences palatability of water.
Chlorine and chlorine compounds are used in water plants for taste and odor control as well as disinfection purposes. Some chloro-derivatives which form during the treatment process may be more undesirable as taste and odor components than the chemical used, such as bitter to medicinal,30 chlorination odor, chlorine reaction odors, pungent chlorinous odors, etc.78
Organic Chemicals
Organic chemicals are the cause of many taste and odor problems. Some of the organic chemicals isolated from water by Middleton et al.,59 along with the concentrations which can be detected by odor, are presented in table 10. Tastes and odors can result from remarkably low concentrations of some materials.
Phenols may occur from natural sources and from many industrial wastes. Phenol itself in water generally is not in a concentration to impart odor. However, chlorination of phenol causes chlorophenolic taste and odor.63'64 Incremental chlorination could develop medicinal odor and the intensity of odor depends on the other organics present.63
Synthetic surface active materials (detergents) have been considered as possible sources of taste and odor in water supplies. Cohen71 found that solution with pure ABS concentrations up to 1000 mg/1 had virtually no odor. The perfumes contained in some detergent formulations do contribute taste and odor. The characteristic of ABS is described as soapy.
Table 11, reported by Baker,101 shows the threshold odor levels for 32 organic chemicals. He stated that the average threshold level has little meaning in terms of water quality control. The least threshold concentration should be used for water quality criteria. Nevertheless, synergism or antagonism are also involved in the mixtures of odorants.
Two of the most important natural organic odorants, metabolites of certain types of aquatic actinomycetes and algae, have been isolated and identified as geosmin and mucidone. These two odorous metabolites have different characteristics. Many observers are able to distinguish between the earthy odor of geosmin and the musty odor of mucidone. This latter odor resembles more closely the musty odor frequently encountered in surface waters.2
Mixing Odorants
Almost never does a water source involve only a single isolated odorant. It is important to consider the effect of the mixture of the odorants already present in water and odorants from substances which are discharging into a water.
14
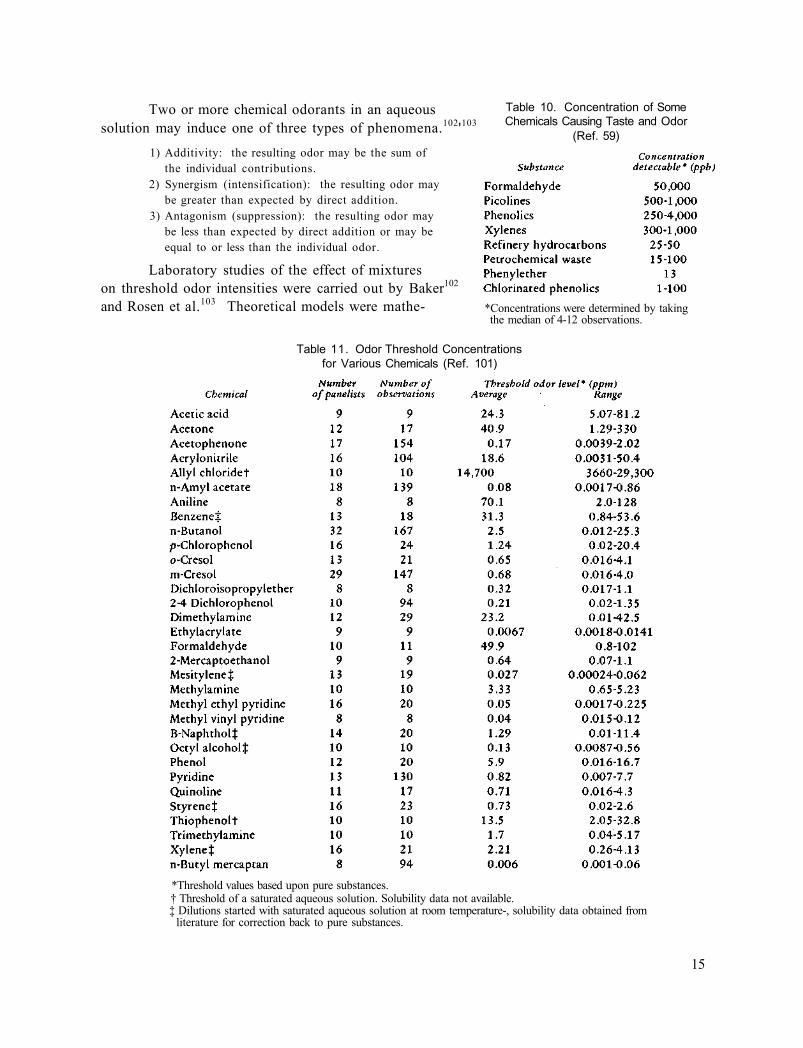
Two or more chemical odorants in an aqueous solution may induce one of three types of phenomena.102'103
1) Additivity: the resulting odor may be the sum of the individual contributions.
2) Synergism (intensification): the resulting odor may be greater than expected by direct addition.
3) Antagonism (suppression): the resulting odor may be less than expected by direct addition or may be equal to or less than the individual odor.
Laboratory studies of the effect of mixtures on threshold odor intensities were carried out by Baker102
and Rosen et al.103 Theoretical models were mathe-
Table 10. Concentration of Some Chemicals Causing Taste and Odor
(Ref. 59)
*Concentrations were determined by taking the median of 4-12 observations.
Table 11. Odor Threshold Concentrations for Various Chemicals (Ref. 101)
*Threshold values based upon pure substances. †Threshold of a saturated aqueous solution. Solubility data not available. ‡Dilutions started with saturated aqueous solution at room temperature-, solubility data obtained from
literature for correction back to pure substances.
15
matically or statistically derived to represent sensory responses without the effect of interactions. These interactions include person-chemical and person-person effects. The actual odor responses were evaluated by comparing the experimental results with the predicted results of the model.
Some of the important conclusions made by Baker102 are as follows. Binary mixtures of all eight chemicals tested showed that nonadditive odor behavior was frequently occurring. A decided synergism was shown for many of the organic chemical pairs. A complex test using all eight chemicals gave strong proof of odor synergism. The demonstration of synergistic and/or antagonistic effects has widespread practical implications. This must be considered by those concerned with water quality at the plant or regulatory level. For example, it is conceivable that several wastewater streams each of which has no perceptible odor, may when mixed together in a receiving stream produce unacceptable tastes and odors. Such results preclude the use of single odor threshold values as criteria for acceptable water.
Laboratory results of Rosen et al.103 showed that an arbitrary selected group of organic chemicals interact in mixture to enhance their individual effects on odor thresholds, demonstrating odor addition and synergism. Later a study by Rosen et al.104 demonstrated the same phenomena in an actual stream pollution situation in the Kanawha River at Nitro, West Virginia. Specifically, the odor of the steam-volatile neutral fraction, constituting an important porportion of the total odor of the river water, resulted from odor synergism among all the neutral components. It is thus shown that the odor of the river water studied was intensified by the mixing of diverse odorants.
CHARACTERISTICS OF THE CONSUMERS
The consumer judges water quality by clarity, palatability, and freedom from taste and odor. It is these qualities that supplement basic health requirements. If these factors are not acceptable, complaints are quickly initiated. The public water supplier, unlike the food or beverage manufacturer who pleases a fraction of the population, must try to please everyone.
There is a difference of response by given persons to different odor types. Some persons show a marked increase in acuity over others in detection of certain types of odor.
Ettinger and Middleton4 found that the most sensitive observer in the 20-man panel was on the average 11 times as sensitive as the least sensitive man. They concluded that taste and odor observations based on the senses of one individual have relatively little value as a criterion of community reaction. A panel of reasonable size drawn from the local community is the best arrangement for measuring population threshold odor.
It has been suggested that the water plant operates on the basis that there is no acceptable taste and odor for water. There is no such thing as a threshold odor for a community. The application of laboratory panel data to the general population is difficult. It is likely that the thresholds developed by the panel member accustomed to evaluating water for taste and odor are lower than those of the general public.98
Nevertheless, the threshold test is important in the water industry because the consumer demands a palatable water with an unobjectionable odor. Maloney105 reported that widespread complaints were expected at Des Moines, Iowa, if the tap threshold odor exceeded 5. Increasing
16

the chlorine residuals to values greater than 1 mg/1 generally produced customer complaints of chlorinous taste and odor in the immediate vicinity of the reservoir discharge at Long Beach, California.74
The measures taken to control taste and odor in water supplies are nearly always linked with the number of complaints received or anticipated.89
MEASUREMENT OF TASTES AND ODORS
Numerous analytical procedures for measuring tastes and odors in water have been proposed. During the early 1960s many studies6'102'103'106 evaluated the effects of such important factors as temperature, variation in personnel, sensory response, background odor, sample array and presentation, synergism and antagonism, and laboratory control. The results of these studies have been incorporated in the threshold procedure of the 13th edition of Standard Methods94
and of the ASTM D-1292 triangle method.107
Standard Methods The threshold odor test has long been routine at many water plants. The threshold odor
number (TON) is used as a quantitative unit. The ratio by which the odor-bearing sample has to be diluted with odor-free water for the odor to be just detectable is the "threshold odor number." The total volume of sample and odor-free water used in each test is 200 ml. The procedure is summarized as follows:
1) Set up a series of appropriate dilutions of a raw water sample, at volumes of 200 ml each, in 500 ml glass-stoppered erlenmeyer flasks.
2) Include two or more blanks of 200 ml of odor-free water in the series. 3) Heat the samples and the blanks to the testing temperature of 40 or 60°C. 4) Shake the flask, remove the stopper, and sniff the vapors starting with the most diluted sample. 5) The observations are recorded as + or - by the tester and the TON determined. 6) A panel or number of observers should be used and the geometric mean of the TON reported.
In Standard Methods it is stated that the sensation of taste is much less complex than odor. Most of the sensations ascribed to the sense of taste, as mentioned earlier, are actually odors. Taste intensity measurements are more difficult than the odor threshold test. Taste tests are performed only on samples which are known to be sanitarily acceptable for ingestion. Panel taste tests are not performed on wastewaters of untreated effluents. The procedures for the taste test are as follows:
1) Prepare a dilution series as for odor testing. 2) Present the series of unknowns to each tester. 3) Pair each sample with a known blank sample, both containing 15 ml of water in the 50 ml beaker. 4) Heat sample and blank to 40 C. 5) Have the tester taste the sample by holding it in the mouth for several seconds and discharging it
without swallowing the water. 6) Rinse with taste free water. 7) Repeat steps 5 and 6 in an increasing order of concentration until the subject's taste threshold has
been detected. 8) Calculate threshold as described for TON.
17
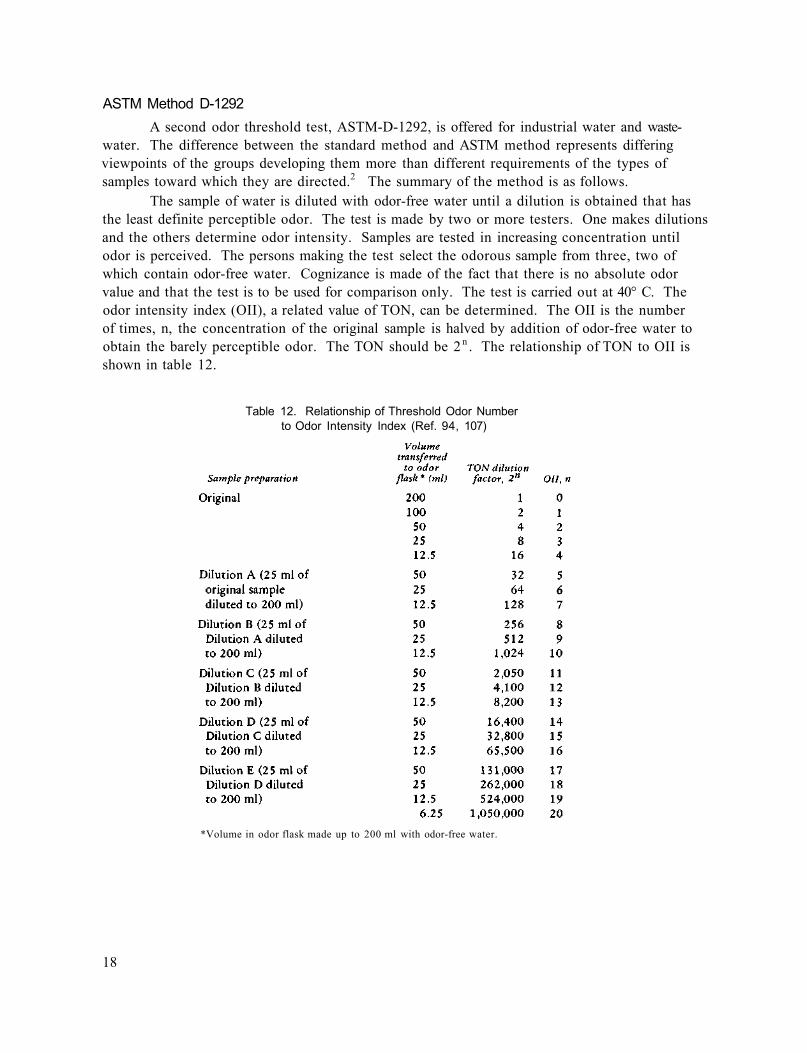
ASTM Method D-1292 A second odor threshold test, ASTM-D-1292, is offered for industrial water and waste
water. The difference between the standard method and ASTM method represents differing viewpoints of the groups developing them more than different requirements of the types of samples toward which they are directed.2 The summary of the method is as follows.
The sample of water is diluted with odor-free water until a dilution is obtained that has the least definite perceptible odor. The test is made by two or more testers. One makes dilutions and the others determine odor intensity. Samples are tested in increasing concentration until odor is perceived. The persons making the test select the odorous sample from three, two of which contain odor-free water. Cognizance is made of the fact that there is no absolute odor value and that the test is to be used for comparison only. The test is carried out at 40°C. The odor intensity index (OII), a related value of TON, can be determined. The OII is the number of times, n, the concentration of the original sample is halved by addition of odor-free water to obtain the barely perceptible odor. The TON should be 2 n . The relationship of TON to OII is shown in table 12.
Table 12. Relationship of Threshold Odor Number to Odor Intensity Index (Ref. 94, 107)
*Volume in odor flask made up to 200 ml with odor-free water.
18

Reliability
Taste and odor threshold tests are useful as a check on the quality of raw and finished water, for control and monitoring of odor through the plant and the determination of corrective treatment. The tests can measure the relative effectiveness of various treatment methods and chemicals and can trace the source of contamination.
The procedures of the tests are not precise and reproducible. The results are useful for local control and are difficult to compare from place to place. Many factors influence the threshold test. They are the number of testers, the order of presentation, the gender, age, economic, social, and physiological background of the judges, the degree of panel training, testing frequency, statistical and laboratory designs, temperature, etc.1,61,76,106 Other disadvantages of the TON test are that it is too time-consuming76 and does not reflect the consumer responses.4,108
It is a problem for a small water plant with limited personnel to run odor threshold tests. The TON generally changes with temperature. Laughlin109 reported that increasing the
temperature of odor observations from 30 to 60°C, increased the TON for all nine waters tested. There was some leveling off of the TON versus temperature curves between 50 and 60°C.
In the studies by Pangborn et al.,110 trained subjects scored the taste intensity and degree of linking of eight mineral solutions (at 750 and 1000 ppm) and of six selected natural drinking waters as a function of solution temperature. They concluded that the degree to which a person reacts to dissolved minerals in water varied with the temperature. The intensity of taste is greatest for water at body temperature and room temperature, and is significantly reduced by chilling or heating.
Other Methods
Although the human olfactory sensory analytic procedures are not entirely satisfactory, there is no substitute. The instrumental devices for measuring tastes and odors have not been able to replace the human nose. Nevertheless, some modifications to improve the sensory tests for taste and odor have been used. None has been universally accepted.
Better laboratory controls and panel design can improve the bias of the olfactory sensory tests. Some laboratories use an air conditioned room with light, humidity, and background controls. Unfortunately, these better controlled environments are usually not available to most of the small water works. The panel selection is very important for the threshold tests. The factors of the panel selection are age, sex, race, smoking habits, degree of training, and the number of panelists. Obviously the more panel judges the better. As many as 20 to 57 panelists have been selected for some studies.98'101'104
Cohen et al.98 used the modified triangle test and duo-trio test for detecting thresholds for certain taste-producing metallic salts. The results of their threshold experiments were expressed as threshold taste concentration instead of threshold taste number.
Pomeroy and Cruse111 suggested a procedure to determine the odor threshold of hydrogen sulfide. Ten wide-mouth glass-stoppered jars of 1 liter capacity were partly filled with 800 ml of odor free distilled water containing sufficient sulfuric acid to lower the pH to about 4. The temperature of the water was about 25°C. To five of these jars, equal quantities of a dilute sodium sulfide solution of known strength were added by microsyringe. An observer
19

Table 13. Sample Values from the Attitude Taste Scales (Ref. 108)
(ATS) Attitude Taste Scale (AATS) Attitude Adjective Taste Scale
(TSR) Taste Scale Rating
was first asked to smell a jar that he was told had only pure water in it. Then he was given the other 10 bottles, with the 5 containing sulfide, all with the same concentration, randomly distributed among them. If he correctly identified each bottle as having sulfide in it, his score was 100 percent for that H2 S concentration. If he detected sulfide in none of them, his score was 50 percent; if he only guessed, his score was somewhere near 50 percent. The jars were freshly prepared for each observer. Of the five persons assigned as judges, only one had had prior experience in odor testing.
Research on mineral tastes in water conducted at the University of California, Berkeley, included the consumer acceptance of tastes by grading schedules, such as the attitude taste scale (ATS), the attitude adjective taste scale (AATS), and the taste scale rating (TSR) procedures.
Detailed descriptions of the attitude scales (ATS and AATS)112,113 and of scale rating (TSR)114,115 are reported elsewhere. These scales give a numerical rating of the taste of a water on a continuum running from 1 through 11. One is extremely unfavorable, 6 is neutral, and 11 is extremely favorable. Increasing degrees of
favorability toward taste are represented by scores above 6, while increasing degrees of unfavorability toward taste are represented by scores below 6. Sample values from the 3 scales are presented in table 13.
The taste intensity and quality of eight mineralized solutions were measured by Pang-born et al.116 For each compound 30 ml of coded samples of the eight concentrations were presented at room temperature (22±1°C) in randomized order, and the subjects were instructed to rate the total taste intensity on a 13 point scale where 0 = none and 12 = extremely intense. No time limit was placed on the procedure.
In 1965, Baker et al.117 applied electrophoretic monitoring techniques of chemical coagulation and odor profile measurement, for improving water treatment efficiency. The Torresdale plant of the Philadelphia Water Department was studied.
Isolation and Identification of Causes
Isolation and identification of the causes of tastes and odors provide information regarding composition, chemical reactivity, and odor characteristics. Analytical methods for identification are discussed by Suffet and Segall61 and Collins.118 To identify organic contaminants and metabolites of algae and actinomycetes, analytical gas chromatography is most widely used.14-19,24,31,38,40,106,119-121
Infrared spectroscopy,16,18,31,119,120 carbon adsorption,58 distillation,18 solvent extraction59,120 and freeze concentrations40,120 are the procedures most often employed. Medsker et al.16,119 also used mass spectroscopy and proton magnetic resonance spectroscopy to study the metabolites of several
20
actinomycetes. The freeze-stir technique was used by Silvey et al.40 to concentrate taste and odor compounds produced by actinomycetes.
CONTROL AND REMOVAL OF TASTES AND ODORS
Reservoirs and Lakes To control tastes and odors imparted to the raw water by blooms of certain microorganisms,
the most logical method is to work on their sources. Algal and actinomycete control should be primarily a preventive measure rather than a cure. The preventive measures may reduce or eliminate expensive treatment for the removal of taste and odor in the treatment facilities.
Applications of algicide or other chemical treatment are most widely used for algal control in impounded waters. Biological control has been studied in laboratories. Other methods such as destratification, limiting nutrient sources, mechanical (removal of aquatic plants), etc. have been used in part for control.
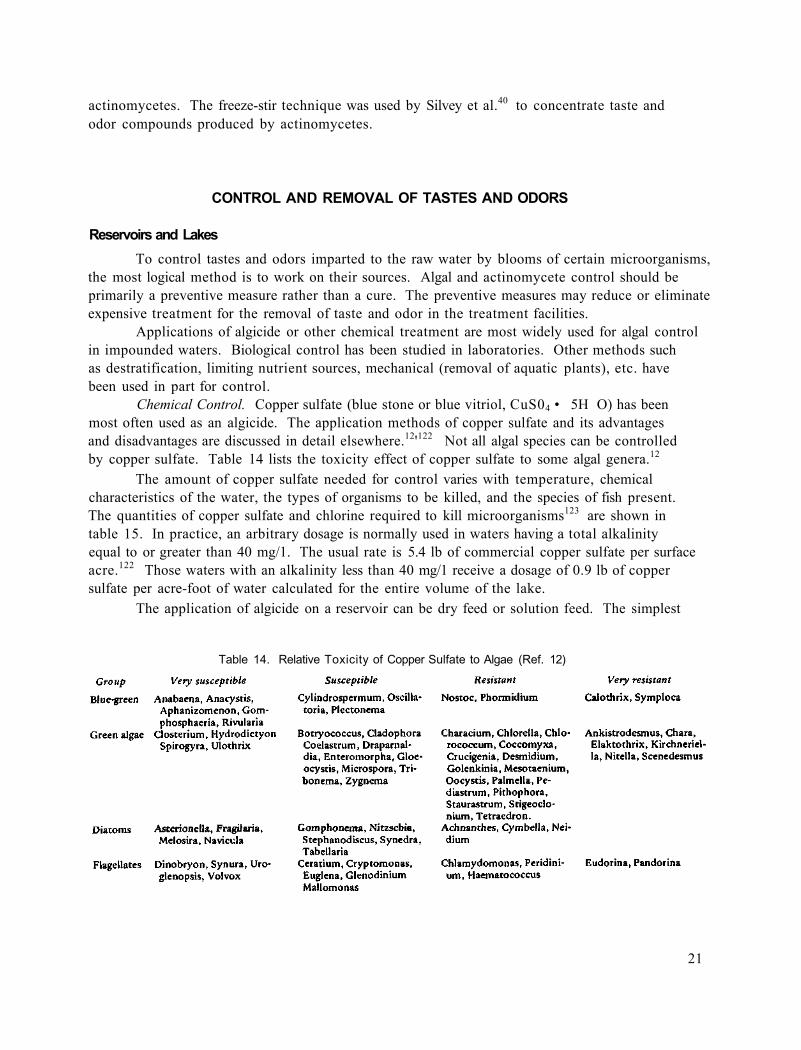
Chemical Control. Copper sulfate (blue stone or blue vitriol, CuS04 • 5H O) has been most often used as an algicide. The application methods of copper sulfate and its advantages and disadvantages are discussed in detail elsewhere.12'122 Not all algal species can be controlled by copper sulfate. Table 14 lists the toxicity effect of copper sulfate to some algal genera.12
The amount of copper sulfate needed for control varies with temperature, chemical characteristics of the water, the types of organisms to be killed, and the species of fish present. The quantities of copper sulfate and chlorine required to kill microorganisms123 are shown in table 15. In practice, an arbitrary dosage is normally used in waters having a total alkalinity equal to or greater than 40 mg/1. The usual rate is 5.4 lb of commercial copper sulfate per surface acre.122 Those waters with an alkalinity less than 40 mg/1 receive a dosage of 0.9 lb of copper sulfate per acre-foot of water calculated for the entire volume of the lake.
The application of algicide on a reservoir can be dry feed or solution feed. The simplest
Table 14. Relative Toxicity of Copper Sulfate to Algae (Ref. 12)
21

Table 15. Concentration Ranges for Copper Sulfate and Chlorine
Required to Kill Microorganisms (Ref. 123)
method is dragging bags from a boat. Other methods are the use of boat equipped spray nozzles, screened hoppers, and helicopter or airplane spray depending on equipment availability and size of the water body. •
The surface application of copper sulfate on reservoirs has proven successful45'122"127 in some cases and unsuccessful in others.26'126'128"131 Examples are as follows:
Copper sulfate applied to Lake Bloomington, Illinois, gave effective control of Anabaena, Asterionella, and Dinobryon.125 The lake water was relatively low in hardness.
In 1959, control of Anabaena and Fragilaria pulchella was successfully accomplished with the use of copper sulfate at Deer Creek Reservoir in Utah.126 Treatment was costly and, as might be expected, did not prevent the accumulation of organic matter at the bottom of the reservoir. This decaying material produced hydrogen sulfide below the thermocline and for several years produced a very unpalatable condition in the water supply of Salt Lake City during the autumnal overturn.
Bartholomew127 stated that treatment of three reservoirs in the Los Angeles area with residual copper was effective as a control of Streptomyces. On the other hand, Silvey and Roach25
reported that aquatic actinomycetes are not vulnerable to copper concentrations of 50 mg/1, or chlorine concentrations up to 25 mg/1.
Woodhull128 indicated that a Connecticut pond supply has served as an example of the possible disastrous effects of copper sulfate treatment. A heavy plankton growth in the small pond, producing abnormal tastes, was treated with copper sulfate, after laboratory identification of the offending organism. The result was the establishment of an unbalance of aquatic biological life causing continued predominance of offending algae. Additional copper treatment seemed only to aggravate the condition. Finally, biological balance was restored and the algal problem solved through the expedient of introducing into the pond organisms determined to be the natural enemies of the offenders.
To control algae in the two open reservoirs of the Philadelphia system, copper sufate was applied to the incoming water and to the surfaces of the reservoirs; however, it failed to control algal growth in these reservoirs because of high concentrations of nutrients.129'130
For the algal control in the Canyon Lakes, Texas, Headstream et al.131 recently reported that maintaining a concentration of 0.5 mg/1 copper cleared the ponds of all algae and eliminated the turbidity. However, because of the high alkalinity of the water (360 mg/1 as CaC03), copper sulfate had to be added on a daily basis to retard algal growth. This was uneconomical. They used an improved method in which CuS04 with sodium citrate (to form cupric citrate) was employed. A concentration of 0.5 mg/1 was achieved by additions every other day. They found another algicide, 3-(3,4-dichlorophenyl)-l,l-dimethylurea was far more effective than CuS04 . The addition of 0.2 mg/1 every three days provided effective control of algae.
A number of chemicals have been used as algicides or algal statics. They include rosin amine D acetate, zinc dimethyl dithiocarbamate, dodecylacetamine, dimethyl benzyl, ammonium chloride, monuron, 2-3-dichloronaphthoquinone, Simazine, dihydroabietylamino acetate, aspartic acid, streptomycin, KMn04 , and chlorine.
22
Chlorine in several forms has been used to control microorganisms in reservoirs.13'44'122'129
Chlorine has proved successful in removing some tastes and odors, but it is known to intensify others, particularly the musty-earthy odor of blue-green algae.13 In the control of midge larvae, 50 mg/1 of either chlorine or CuS04 was ineffective; CuS04 added with chlorine hastened the killing.44 Chlorine was used in conjunction with copper in northwestern reservoirs for the control of algae. A free chlorine residual of 0.2-1.0 mg/1 is effective in controlling many of the algae species that cause taste and odor or filter-clogging problems.122 It is believed that chlorine is often effective against those organisms that are most resistant to CuS04 treatment.
Recently the American Water Works Association Research Foundation132 released the research needs for chemical (CuS04 or C12) control of algae as follows: 1) the most effective chemical concentrations needed for algicidal action against specific microorganisms without a destructive impact on the surrounding biota; 2) the benefits in algicidal activity which can be achieved by the addition of citric acid or a citrate salt; 3) the timing and proper placement of chemical dose in the reservoir; and 4) the metabolic studies of chemical reaction with algae.
The herbicides, 2,4-D and 2,4,5-T, were used to control pond weeds.44 However, their use was extremely limited because of the health hazard. There is a great need for development of acceptable chemicals to control weeds.
Biological Control. In 1964, studies on interrelationship among various types of algae, bacteria, and actinomycetes, made by Silvey and Roach,133 were some of the first where biological control was a major consideration. They investigated the indigenous microorganisms that occurred and attained peak populations in surface waters during predictable periods of the year. The microbiotic cycles indicated that the metabolites of the blue-green algae and the actinomycetes stimulated the growth of the Gram-positive spore-forming bacilli present in the water. The blue-green algae appeared to be the best nutrient source for both the Gram-negative bacilli and the actinomycetes.
From studies of biological methods for the control of tastes and odors, Hohen134 reported that an effective degradation of the metabolites of actinomycetes and rapid reduction of odor level by Bacillus cereus occurred when the bacteria were present in high concentrations (1.2X 10⁵ /ml).
In 1968, Dickson135 compared various control techniques for reservoir microorganisms and concluded that biological control was the best technique for controlling tastes and odor produced by actinomycetes. The application of B. cereus in the field operations proved successful. B. cereus was cultured at Lake Hefner, Oklahoma, in 5000 gallon tanks, utilizing low gluten flour and yeast extract as nutrients. After innoculation and incubation for 24 to 36 hours the culture was applied either to the reservoir or fed into a pretreatment basin in the plant. When the concentration of B. cereus in the reservoir reached 1.0X 10⁵ /ml the metabolites from actinomycetes and algae were degraded in 4 to 5 days.135,136
In 1970, Silvey et al.136 isolated geosmin from the blue-green a\gz,Anabaena circinalis, and measured the geosmin reduction levels by gas chromatography. They found a few strains of B. cereus were very effective in degrading geosmin.
Recently, Narayan and Nunez18 studied the ability of various microorganisms to degrade geosmin. Those examined included Sarcina sp., Micrococcus sp., Mima sp., Escherichia coli, Alcaligenes viscolactis, and Bacillus species. They found that B. cereus ATCC 9139 and B. subtilus strains were as effective for biological control as B. cereus strain 10876. The latter was previously reported as the best strain to degrade geosmin in both laboratory and field studies.
23
Destratification. The impounding of water generally improves the raw water mineral quality. After impoundment, however, biological activity often increases, thermal stratification frequently occurs, and anaerobic conditions are likely to result in the lower water layer. It is from this layer that odor-causing substances can be produced.
Forced aeration and circulation by the use of diffused air, or mechanical pumps, or by supplying energy by some other means, have been used to minimize the effects of stratification. This artificial destratification has been shown to be an effective technique for preventing the formation of anaerobic conditions and for the reduction of hydrogen sulfide for several water supply reservoirs.
Diffused air has been used most often. Those reservoirs where air has been used include Laurel Run and Millcreek Reservoirs, Johnstown, Pennsylvania137; the Wahnbach Reservoir near Sieghurg, Germany138 ; Falmouth Lake in northern Kentucky139 ; Lake Maarsseveen, in the center of Holland, and Zeeuws-Vlaanderen Reservoirs, in the south of the Netherlands140 ; Lafayette Reservoir near Oakland, California141 ; Waco Reservoir at Waco, Texas142; and Occoquan Reservoir near Occoquan, Virginia.53 The impoundment behavior studies group at Cincinnati, Ohio, had a series of experiments at Boltz Lake in northern Kentucky using a mechanical pump to transfer bottom water to the surface.139'143"145
A survey of water utilities using the destratification technique that was made by the AWWA's Quality Control in Reservoirs Committee has shown that a large quantity of water can be treated at a small cost per unit volume.146 Besides the control of tastes and odors, the thermal destratification technique also improves raw water quality, such as increasing dissolved oxygen, decreasing dissolved chemicals concentration, and providing algal reduction. This is generally the case in reservoir studies mentioned previously and in the publication by Symons147 in which the work done by the Cincinnati group is compiled.
The required research in the area of aeration, destratification, and mixing of reservoir water listed by the AWWA Research Foundation132 consists of: 1) the ascertainment of the reasons for success and failures at various geographical locations throughout the country; 2) the reason for reduction in plankton populations during reservoir mixing and predominant shift toward the less irksome green algae; 3) frequency and periodicty of mixing to achieve the best results; 3) criteria for the most effective and economical engineering design of aeration, destratification, and reservoir mixing equipment; and 5) siting of equipment on reservoir premises for the most effective results.
Eutrophication Prevention. The usual recommended approach for solving eutrophication problems is to limit the introduction of nutrients that are by-products of man's activities. These include sewage and industrial wastewater effluents, urban runoff, and drainages from agricultural and rural lands.148"150
Upgrading of existing or installation of new wastewater treatment facilities may improve the water quality of the incoming water to the reservoir. Lawton149 reported that diversion has completely stopped the addition of sewage treatment plant effluents to Lakes Waubesa and Kegonsa, Wisconsin. This limitation of nutrients is a step toward ecological control in a reservoir. Recently Valcik150 pointed out that federal, state, and local agencies must all work together to limit the discharging of nutrient wastes into watersheds, thereby reducing the risk of contamination to surface waters.
Organism-control chemicals such as copper sulfate or chlorine are useful as mentioned
24
earlier. Occasionally carbon or clay is added to increase the turbidity in reservoirs by restricting the passage of sunlight into the water.8'9'44 This so-called 'blackout' treatment reduces growth rates of algae or pond weeds. Methods of distribution of carbon or clay are similar to copper sulfate treatment. Two-tenths to 0.5 lb of powdered activated carbon per 1000 square feet of surface area is generally used. Treatment is practiced only on sunny days.8'9 The practicality of this type of treatment is suspect.
Electrolytic Treatment and Mechanical Removal. Chemical and biological methods for the control of algae in reservoirs require considerable time. The undesirable residual may retard raw water quality. To overcome these drawbacks, in 1969 Shilo151 first suggested the use of weak electrolytes to cause lysis of algal cells. In 1975, laboratory studies of Paul et al.152 showed that the electrolytic treatment of the mixed culture killed algae instantaneously and independent of the rate of flow between electrodes and the concentration of the organisms in suspension. Current density and voltage are the two important factors involved in this method. Gamma-ray irradiation was proposed by Vajdic153 in 1971 for the treatment of tastes and odors produced by actinomycetes. This method seems applicable only at the water treatment plant, not in the reservoir.
Water Treatment
Many treatment methods for the control of tastes and odors at the water plant are well known. The methods, however, are not effective for every plant. The most common practices include oxidation by aeration, chlorine, chlorine dioxide, potassium permanganate, ozone, and adsorption on activated carbon.
No method of controlling taste and odor will necessarily be successful in all waters at all times and under all conditions. In other words, no two sources of water can always be handled in the same way, and as two plants are seldom structurally alike, different approaches may be necessary at different plants.
Many plants have developed adequate methods to remove taste and odor with some combination of the oxidation method with activated carbon. A mixture of methods is the correct approach, because very frequently the success of each treatment depends on the proper functioning of one or more other processes.83
Aeration. Aeration was one of the first means used in attempting to reduce tastes and odors. It reduces carbon dioxide and nitrogen trichloride concentrations with the side effect of reducing corrosiveness. Aeration increases the dissolved oxygen concentration.
Aeration will remove from water only tastes and odors that are dissolved in it as gases or that are otherwise sufficiently volatile to escape rapidly at an air-water interface. It is not a good way to oxidize material.154 Hydrogen sulfide is readily removed by aeration. Odors associated with algae and related organisms can often be reduced. Phenolic substances and their related chloro compounds are nonvolatile and will not respond to aeration.
The aeration devices include blow-out towers, slot aerators, and coke trays.51 These are to maximize the temporal surface-volume ratio of the water.
Aeration has long been used as a key method for the removal of sulfides in groundwater. At Nitro, West Virginia, Haynes and Grant155 reported that aeration successfully treated raw water chronically polluted with volatile chemical waters. Spray aeration with 110-psi pressure at
25

the nozzles was estimated to be equivalent in cost of treatment with 17 ppm of activated carbon. In 1965, granular activated carbon was used at this plant.156 Because the Kanawha River, which serves as the source of water for the Nitro water plant, was heavily polluted with various organic industrial wastes, aeration was still employed as a step of odor removal. Normally, two-stage aeration alone reduced the odor by 75 to 90 percent, whereas the raw water odor thresholds varied from 300 to 1300.
In 1952, Finney157 reported that aeration for odor control was provided by a coke tray aerator located on the top of the sedimentation basin at the new water filtration plant in Springfield, Tennessee.
It has been found practically impossible to remove all of the sulfides (metallic or gaseous) by aeration alone.47-49,158 For southern California waters (the Athens Well and the Wadsworth Plant) with high (20-30 ppm) hydrogen sulfide, aeration by cascade forced-draft, or diffused air removed some of the sulfides, but the water always turned milky.47'48 Vacuum degasifying together with pH reduction removed high percentages of sulfides.47 The aerated water was followed by chlorination and carbon filtration to remove the remaining sulfide at a relatively reasonable cost.47'48
The raw water at Pittsburg, Kansas, contains about 5 ppm H2 S. The aeration chamber reduced it to about 1 ppm, and coagulation and sedimentation brought it down to about 0.2 ppm. Filtration and chlorination reduced it to 0.0 ppm.49
For the unique polysulfide problem at Santa Barbara,50 California, Monscvitz and Ainsworth51
recently recommended the use of sodium pyrosulfite (or sulfur dioxide S0 2 ) for the destruction of hydrogen sulfide odor and colloidal sulfur. There are alternatives such as the softening and prolonged storage for attenuation of the odor. With extended and effective aeration, the H2 S can be removed. But in the absence of well-designed facilities, the simplest technique (the pyrosulfite) may be the one offered by Monscvitz and Ainsworth.51
The kinetics of the oxidation of aqueous hydrogen sulfide and mercaptans by oxygen were studied by Chen and Morris.159 They concluded that oxygenation of sulfide was characterized by an induction period at all pH values. A chain mechanism was proposed. Oxidation rate parameter k varied with pH and showed a very complex pattern. The specific rate was very slow when pH was less than 6; increased greatly as pH increased through 7 to a maximum of pH 8.0 or so; then decreased to a minimum near pH 9; increased again to a second maximum about equal to the first near pH 11; and finally decreased again in more alkaline solutions. The rate parameter was also a function of initial sulfide concentrations. This has been found to be connected to the presence of polysulfides as intermediates.
Besides hydrogen sulfide removal, aeration can remove NC13, C02 , and some chemicals. Aeration by mechanical means, and particularly by means of compressed air was very effective for NC13 removal at the Hialeah plant at Miami, Florida.78 Aeration raised the pH from about 6.0 to 7.4 in the Eden Creek Plant water at McNeil Island, Washington. It removed the carbon dioxide and dissolved gases having medicinal chlorine odors. It was cheaper to aerate the C02
from the water than it was to neutralize it with lime or soda ash.80 Another example, at Institute, West Virginia, taste and odor of butadiene origin were reduced by aeration to the point where they could be efficiently treated by subsequent methods.
Coagulation. Although coagulation is not designated for the corrective treatment of taste and odor, a good coagulation process improves taste and odor control for many raw waters.
26
Erdei96 reported that coagulation eliminated much of the taste and odor trouble related to algae. Both the tannin content and odor number were reduced considerably after coagulation of Missouri River water at Omaha, Nebraska.
Pesticide removal studies by Robeck et al.68 showed that DDT was easily removed by conventional coagulation-sedimentation followed by sand filtration; lindane and parathion were not. Softening with lime and soda ash along with an iron salt as a coagulant did not improve the removal obtained with alum coagulation alone.
In contrast, Williams89 pointed out that extensive laboratory and plant observations showed simple coagulation and settling did not produce the slightest reduction in taste and odor at Brantford, Ontario. The taste and odor substances in the raw water were amenable only to chlorine and carbon. The jar test showed that excess lime softening alone produced some taste and odor reduction.
The laboratory study by Dougherty and Morris37 indicated that alum coagulation was ineffective for mucidone removal in distilled water. No decrease in mucidone concentration was also found by alum coagulation plus softening using the polyelectrolyte and water from the Iowa River at Iowa City. It was concluded that mucidone will not be removed by water plants employing coagulation plus softening in the presence of a polyelectrolyte coagulating aid and turbidity of the Iowa River.
Chlorine. Chlorination has been long used for control of tastes and odors and for disinfection. Chlorination practices generally encompass combined residual (chlorine-ammonia, or marginal chlorination), free residual as in breakpoint chlorination, superchlorination and dechlorination, and chlorine-chlorine dioxide treatment. The definitions of these categories are given by Ryckman and Grigoropoulos.160 They also discuss the mechanism of taste and odor removal. Efficiency of chlorination depends on the species of chlorine and the quality of water treated, especially organic matter, pH, and temperature.
Special care must be taken in using chlorine for taste and odor control. Odorous byproducts, such as. chlorophenols and trichloramine, may be produced by the reaction of chlorine with certain substances. Free residual chlorination is many times more effective than combined residual chlorination, but less effective than chlorine dioxide, which is reported to have 2.5 times the oxidation capacity of chlorine.160 Free residual chlorination is more successful if the offending components are oxidizable and is effective with stationary bodies of water, such as reservoirs and lakes. Superchlorination is not a useful control method only because the water must be dechlorinated after treatment.91 Other comparisons of chlorination methods are discussed elsewhere.4
Chlorine was effective in destroying musty or moldy tastes at the Queen Lake plant,130
Philadelphia, by marginal chlorine residuals followed by free residual chlorination. Nitrogen trichloride was detected. The use of superchlorination and dechlorination by sulfur dioxide reduced the nitrogen trichloride.
Chlorine was successfully used to oxidize sulfides after aeration under pressure conditions at the Athens Well of the Southern California Water Co.47 The chlorinated water was then aerated to remove the methane.
At Santa Barbara, California, elemental sulfur and polysulfide could readily be produced by chlorination of sulfide-bearing water. Monscvitz and Ainsworth51 suggested the use of pyro-
27
sulfite treatment for sulfide removal as previously noted. Taste and odor from phenolic compounds are usually controlled by free residual chlorina-
tion.4 Kinney161 reported that chlorophenols were formed during incremental chlorination in the laboratory but not on marginal chlorination at the Beaver Falls water plant in Pennsylvania. This was due to the chlorine having a greater affinity for other organics than for phenols. Kinney64'161 cited the results of T. J. Powers that when the phenol concentration is 2 ppm, the stoichiometric requirement of chlorine will cause the reaction to go to complete oxidation of phenol; when the phenol concentrations are 20 ppb, more than 100 times the stoichiometric requirements are needed. The intensity of the chlorophenol odor at Beaver Falls was reported to be related to chlorine demand and organic concentrations but not to the phenol concentration itself.
Free residual chlorination will effectively remove phenol from a water containing phenolic compounds which are free from ammonia and other organic matter containing nitrogen.78 Free residual chlorination at the Branch, U.S. Disciplinary Barracks, Greenhaven, N.Y., proved to be successful from the standpoint of taste and odor removal.80 However, at Whiting and East Chicago, Indiana, free residual chlorination did not appear to yield satisfactory results for odor contol.162
At a water plant in Iowa, Hyndshaw79 reported that chlorination changed the basic odor to one which was more difficult to remove by a subsequent application of carbon than the odor found in the raw water. Chlorine-ammonia treatment could be used effectively at this plant because they did not interfere with the carbon treatment that followed.
Woodhull128 reported that free residual chlorination was of great value for odor removal for Connecticut water supplies, especially where chlorination is the only treatment provided. Only a few cases of chlorinous odors associated with free residual chlorination were found to be related to the pH of water. These can be eliminated through close control of the pH value maintained in the distribution system. He also stated that ammonia-chlorine treatment was used effectively under some conditions, notably at those plants where filtration and storage facilities are available.
Robeck et al.68 found that 1-5 ppm of chlorine or potassium permanganate did not have much effect on the chlorinated hydrocarbons. Chlorine converted parathion to paraoxon which is a more toxic compound. Similarly, Aly and Faust163 observed that the chemical coagulation and oxidation by chlorine and potassium permanganate did not remove 2,4-D herbicides from water under laboratory conditions.
Filicky83 reported that there are many instances where the mere raising of the chlorine dosage by only a few parts per million, just enough to get over the free available chlorine zone, has completely rid the water of all tastes and odors caused by the algae, Synura and Anabaena.
Harlock and Dowlin164 reported that any odor caused by algae can be eliminated with chlorine. The dosage must be high enough to destroy all odors at the hot water (80°C) tap. The reaction time with the chlorine required at least 6 hours at McNeil Island Plant, Washington.
The AWWA Task Group85 pointed out chlorine may not affect the actinomycetes in concentrations of less than 10 ppm. However, studies by Romano and Safferman32 demonstrated that more than 95 percent of the actinomycete spores treated with 1 ppm chlorine were no longer viable after a 30-second exposure. They concluded that the sensitivity of actinomycetes to chlorine was comparable to that of most bacteria cells. On the other hand, when odoriferous concentrates obtained from Streptomycetes griseoluteus IM 3718 were treated by chlorine, no
28

enhancement of the odor was noted. There was a slight decrease in odor intensity but chlorination did not completely eliminate the odor, even at concentrations as high as 50 ppm.32
For sulfate and iron bacteria control in the south, it has been found profitable to use rather high concentrations of combined residual chlorine, particularly if the water use is low. This will give a fairly long contact time and will ultimately reduce the sulfur and iron bacteria as well as counteract the hydrogen sulfide. High chlorine residuals are really more efficient but a rapid kill of these organisms generally results in red water for a few days.84
At the West Palm Beach plant92 in Florida, ammonia was injected directly into the water just prior to post-chlorination. Four days later, chloramine residuals were found at the far ends of the distribution system, and complaints from consumers decreased and eventually became quite rare.
Calcium Hypochlorite. Murray165 in 1968 discussed a method of flash mixing chlorine and lime solution at Long Beach, California, for use as a strong bleach in the removal of color, taste, and odor. This method has greater oxidizing action than free chlorine, requires no catalyst such as sunlight to complete its reaction with organic matter, and provides strong buffering action to aggressive or potentially corrosive waters. The advantages of using calcium hypochlorite over gaseous chlorine were: less chlorine used, longer lasting, and greater algicidal action.
In 1972, Murray74 reported another modification to chlorination at the Long Beach plant. Sulfamic acid added at a dosage of 1 ppm in combination with post chlorination at a dosage of 0.5 to 2.5 ppm provided an effective long-lasting chlorine residual that solved the taste and odor problem. Victoreen166 of Wilmington, Delaware, confirmed Murray's results. Morris,167
however, commented that the shortcoming of this system was that the chlorinated sulfamate was not a powerful disinfectant.
Chlorine Dioxide. Another substitute for chlorine to control taste and odor is chlorine dioxide (C102). It is produced with a generator by combining a solution of sodium chlorite (NaC102) and a chlorine solution. At smaller water works not using gaseous chlorination, C102
may be generated with sodium chlorite, hypochlorite, and a mineral acid.4 The use of CIO has been widely accepted and satisfactory for many water plants to control some forms of algae and for taste and odor problems. It costs approximately 50 percent more than liquid chlorine.168
Chlorine dioxide does not react with ammonia and its bactericidal properties are about equal to chlorine. It has been used for the oxidation of iron, manganese, phenolic, and chlorophenolic compounds, and even for fish poisons. It also has been used for algae control.167'169
Chlorine dioxide is an excellent agent to use where phenol and its analogous compounds impair taste and odor.21'67'91'130'160 At Valparaiso, Indiana, the use of C102 has proven very beneficial in control of any chlorinous odor.21 When using CIO a much higher free chlorine residual can be used without the chlorinous odor. The actual cost of treatment with chlorine and sodium chlorite ($0.31 per million gallons) was less than treatment with chlorine and carbon.21
In 1952, chlorine treatment of a public water supply to remove phenolic taste and odor was approximately $7 per million gallons of water in West View, Pennsylvania.67
It was reported that 100 ppb of phenol was destroyed by 0.07 ppm of chlorine dioxide which is produced from commercial sodium chlorite and chlorine in a 1:1 ratio.130 A laboratory test by Granstrom and Lee170 showed that a molar ratio of chlorine to chlorite of 1 1:2 produced CI02 with no residual of the reactants.
The best points to apply chlorine and chlorine dioxide depend on analyses at the local
29

water treatment plant. The chemicals can be applied to the suction side of a pump. The chlorophenolic odors will have disappeared by the time a water can be drawn from the discharge side.160 Other possibilities are: chlorination with subsequent addition of C102 with or without excess chlorine; or application of C102 with or without excess chlorine.67
According to Augenstein,168 adding chlorine to relatively clean groundwater produced an immediately noticeable taste and odor. Hamilton, Ohio, was the first city to use chlorine dioxide successfully in water obtained from deep wells to maintain a residual chlorite in remote sections of the distribution system without taste and odor problems.
The use of chlorine dioxide is not satisfactory for all waters. Chlorine dioxide applied on a plant scale at Whiting, Indiana, did not effectively reduce the threshold odor of the water.162
Although chlorine dioxide removed up to 90 percent of the manganese and most of the iron, it failed to remove the musty, woody tastes and odors imparted by the microorganisms in Crum Creek water, Philadelphia.171
Chlorine dioxide used to be generated on-site because of its unstability and unsafeness. Higbee172 and Lovely173 in 1966 reported that International Dioxcide, Inc., has developed a patented, stabilized form of C102 complex in an aqueous solution called anthium dioxcide. It is a stable, nontoxic, colorless concentrate containing 5 percent available CIO .
Anthium dioxcide has all the advantages of C102 gas with none if its disadvantages. It is activated immediately upon mixing with water containing odoriferous compounds by the oxidizing action of the released C102 .173,174 It can be stored for one year without losing its effectiveness. Commercial anthium dioxcide will lose less than 0.1 percent of its original C102 content after three months storage at room temperature.172
Stabilized chlorine dioxide (anthium dioxcide) proved effective for providing odor-free water for the porpoises in Chicago's Brookfield Zoo174 ; for controlling filamentous scales in Sayreville, New Jersey, well water containing iron bacteria and colloidal clay175 ; for microorganisms and slimes in pulp and paper mills176; and for eliminating foul odor due to activated sludge processes breakdown in Phillipsburg, New Jersey.177 Very little information regarding application of anthium dioxcide for taste and odor control in public water supplies is available.
Potassium Permanganate. Potassium permanganate KMn04 is one of the most effective chemical oxidizing agents for the removal of taste and odor, iron, manganese, and hydrogen sulfide. It is also useful as an algicide and as a bactericide. It does not intensify the tastes and odors after oxidation. During reactions, the residual magnanese dioxide (Mn02) is insoluble, is an absorbant assisting the coagulation process, and is removed by sedimentation and filtration.178-179
Potassium permanganate has been used for taste and odor control in water supplies for a number of years. It is practical, effective, immediate, and economical. Very little equipment is required. Usually a small amount of permanganate is needed. The dosage can be determined by a jar test. Approximate permanganate demand is measured by titration. The pink or purple color serves as an indicator, if there is any permanganate residual after a contact period.
Potassium permanganate is applied as a solution, either from dry or solution feed, and is very easy to control.179 The effectiveness of KMnO4 was studied by Shull.171 It effectively reduced taste and odor, activated carbon and chlorine demands, and bacterial counts. Welch179
gave some examples of the advantage of using permanganate as a preoxidant and applying chlorine subsequently as a disinfection agent. Any chlorine applied after permanganate treatment will be maintained as a free residual. This chlorine will not generate a chlorinous odor.
30
In 1961, Humphrey and Eikelberry180 documented that seven water works have used potassium permanganate successfully to cope with taste and odor problems. The water plants were Peru, Illinois; Waxahachie, Texas; Royersford, West View, and Wilkinsburg, Pennsylvania; Colchester, Connecticut; and Melcher, Iowa.
The city of Waxahachie, Texas,178 constructed a 4740-foot-long earth-filled dam on Waxahachie Creek to impound water. Heavy rains filled the reservoir before the vegetation could be removed resulting in taste and odor problems in the summer of 1960. Potassium permanganate was applied to the raw water by a small diaphragm proportioning pump. Application rates of activated carbon were reduced from 500 to 70 pounds per day.
Extreme taste and odor problems (TON 400-4000) due to algae in the Cedar River, Iowa, water supply occurred in the summer of 1961. KMn04 was used to oxidize taste and odor-producing compounds in raw water (averaging 92% removal). Activated carbon was also used for adsorption ahead of the filter in the treatment plant.181'182 Cherry183 reported that the KMn04
treatment was continued with revisions during the winter and spring of 1962. Potassium permanganate when added as a preoxidant showed a substantial saving in
treatment costs for the city of Huntington, West Virginia, whose water supply from the Ohio River had a musty-woody, phenolic, and nitro-benzene taste and odor problem.184 In addition to reducing chemical costs, it was possible to by-pass the aeration unit.
At Des Moines, Iowa, the water supply from the Raccoon River was treated with activated carbon, coagulated with alum and settled, and KMn04 was added with subsequent settling.185
During the two-year period (1966-1967) of KMnO4 treatment, no daily reading exceeded a threshold odor number of 5 except for a few incidents of equipment failure. Although KMn04
is slightly over three times as costly as carbon, it was over five times as effective as carbon in reducing odors in this plant.
The two Erie water plants, in Pennsylvania, used KMn04 (up to 6 ppm) to oxidize the lignins and tannins which came from a large paper mill wastes.186 The KMnO4 treatment was more effective when the pH was adjusted to 8.0 to 8.3.
Adams187 reported that the use of potassium permanganate at Wilkinsburg, Pennsylvania, began in 1930, when it was tried on a plant scale basis in an attempt to correct a chlorophenol taste and odor problem. The results were not conclusive because of inadequate feeding facilities for the hygroscopic permanganate.
Investigation of chemical oxidation of organic refractories collected from the Missouri River with KMn04 was made by Spicher and Skrinde.188 The results showed limited oxidation and rate of reaction in approximately direct relationship to the concentration of the remaining permanganate. Reduction of odor potential or organic refractories by 50 percent was similar for both low and high concentrations of permanganate. Permanganate oxidation of organic refractories was temperature-dependent and was approximately a first-order reaction. Potassium permanganate was a more effective oxidizing agent for organic refractories under alkaline than under neutral conditions. The incomplete oxidation of organic materials could yield intermediate organic compounds which could exhibit greater or smaller odor potential than the original organic refractories.
Subsequently Spicher and Skrinde189 studied the reaction of potassium permanganate with 27 pure organic compounds in distilled water. They concluded that the functional group of an organic compound such as aldehydes, amines, aromatic alcohols, and keto acids were readily oxidized, whereas carboxylic acids, ketones, aliphatic alcohols, hydroxy acids, amino acids, and some esters were not readily oxidized. The double bond of alkenes was readily oxidized, and the benzene ring of phenol and aniline was broken by permanganate.
31

The laboratory studies on the removal of the metabolite (mucidone) of actinomycete by Dougherty and Morris190 indicated that a carboxylic acid was formed when 1 ppm of mucidone was oxidized by a large amount (1 percent) of permanganate within 30 minutes at 25°C and pH 4. The resulting mixture had a very offensive odor which could be reduced to a threshold odor number of 8 by raising the pH of the solution to 8. About 90 percent of mucidone was oxidized by low concentrations of KMn04 . The persistence of the odor, however, indicated the chemical oxidation of mucidone is not recommended.
Methods of taste and odor control using KMn04 in combination with other chemicals were developed at the Marion Water Co., Marion, Ohio.191 It was reported that potassium permanganate was more effective when fair amounts of organic matter were removed by pretreatment with activated carbon, lime, and settling.
Taste and odor control at the Bowling Green, Ohio, plant was accomplished by the use of potassium permanganate at low doses.81'192 Use of permanganate preoxidation instead of prechlorination stopped algae without intensifying odors. Experiments were carried out on the reaction of permanganate with decomposing sludges from the bottom of settling basins. Odors from sludge were extremely offensive due to decomposition of proteins from microscopic plants and animals. The odorous compounds could have been H2 S, amines, aldehydes, phenol, cresol, indole, skatale, etc. Swanger82,192 concluded that permanganate was not always effective in reducing or eliminating these types of odors. The organic compounds of this nature must be removed by adsorption on activated carbon or not at all.
The use of potassium permanganate in a well water supply to remove hydrogen sulfide was studied by Willey et al.193 The laboratory and field (from a plant in central Indiana) data indicated that each milligram per liter of hydrogen sulfide required approximately 6.2 mg/1 of permanganate for oxidation to a stable endpoint when sulfide bearing well waters were treated at essentially neutral pH values and normal groundwater temperature. Hydrogen sulfide could be effectively removed from water with a continuous regeneration process consisting of a continuous feed of potassium permanganate to the influent of a manganese greensand filter.
Ozone. Ozone (O3) is an allotropic form of oxygen. It is a very powerful oxidizing agent with over 1.5 times the oxidizing potential of chlorine. Ozone is relatively inexpensive, but not as cheap as chlorine. Tastes and odors are not accentuated when ozone is used.
Ozone is a relatively unstable pale blue gas with a distinct pungent odor in air. The odor of ozone is readily apparent. The instability of ozone dictates the need for an on-site production facility when used for water, sewage, and industrial waste treatment. At the present time, ozone is produced commercially by the reaction of an oxygen containing feed gas in an electric discharge across two plates. Although ozone is both toxic and corrosive, it presents no safety and handling problems when equipment is properly designed and constructed.
The first use of ozone was for the disinfection of drinking water for the cities of Nice and Paris, France, in the early 1900s. There are now nearly 1000 installations in Europe.194
In addition to disinfection, these plants use ozone for taste and odor control, iron and manganese removal, color removal, as part of Microzon (microstraining and ozonation), and in the MD (micellization/demicellization) process.88'194"196 Much literature has been published on ozone applications in water and wastewater treatment.197'198
In the United States the use of ozone at water plants has been limited. A relatively new installation for water treatment is at Strasburg, Pennsylvania.199 Several pilot plants for using
32
ozone on wastewater are in operation,200-205 including plants at Philadelphia, Pennsylvania; Washington, D.C.; Chicago, Illinois; Fairfax County, Virginia; Dallas, Texas; and St. Paul, Minnesota.
Cox206 reported that ozone was used for disinfection at Delhi, New York, for a number of years. The Delhi ozone plant was destroyed by a flood in 1935 and never rebuilt.
For taste and odor removal, the city of Whiting, Indiana, applied ozone to the raw water prior to coagulation and filtration. Bartuska207 reported an average of 68 percent of TON was reduced from the raw water by ozonation alone during the 1940-1941 operation. Ozone treatment also reduced the chlorine demand of the water. Ozonation was discontinued because of improvement in the water supply quality.
The effect of the ozone treatment as a taste and odor control at Whiting was evaluated by Besozzi and Vaughn.162 The results showed that during 21 days in March 1947 ozone reduced the average TON of the raw water from 36 to 23, thereby removing 36 percent of the odor. They concluded that ozone proved incapable of combating the taste and odor problem at Whiting. Although ozone improved the quality of the water to a limited degree, it did so in about the same way as other oxidizing agents.
At Philadelphia's Belmont Plant, ozone was applied successfully to the raw water for both destruction of taste and odor and oxidation of manganese during the early 1940s to 1959. Bean208 indicated that the ozone treatment was discontinued when the plant capacity was increased, and the use of free residual chlorination became more economical.
In 1952, Powell et al.209 reported that the TON for the ozonated pilot plant waters were lower than the raw water (the Iowa River at Iowa City) values when the raw water values were high. When the raw water TON was low, ozonation provided very little improvement. Free residual chlorination was needed after ozonation in order to reduce the TON to acceptable values. They also found that the chlorination should be done several hours after ozonation to produce waters that did not develop objectionable tastes after a 24-hour storage.
From the studies of pesticide removal, Robeck et al.68 found that at relatively large and impractical concentrations, ozone did reduce chlorinated hydrocarbons somewhat, but by-products formed and their toxicity was unknown.
Ozone has been used in France for disinfecting water for about three quarters of a century. Gomella's excellent report,196 Ozone Practices in France, presents the optimum ozone treatment techniques. He pointed out that ozone destructed completely, or markedly reduced, many organic pollutants. Ozonation combined with post-chlorination eliminated any organoleptic taste and odor problems. Ozonation improved the water quality, even after activated carbon treatment. Since activated carbon does not provide viral inactivation, ozone can be considered for the main and final stage of water treatment.
Activated Carbon Adsorption. Activated carbon has been widely used for many years for removing taste and odor in public water supplies. It is a relatively simple and economic procedure, with minimum alternation. Taste and odor removal by activated carbon is a phenomenon of adsorption.
Adsorption is basically a separation process by extremely large surface areas and the result of van der Waals forces. Many substances can be employed as adsorbants. Activated carbon is the choice in water treatment because it is insoluble in water and because of its large surface area (500-2000 square meters per gram). Comparisons of adsorptive capacity are measured by
33

the phenol number. The phenol number is defined as the amount in milligrams per liter of activated carbon required to reduce 100 ppb of phenol by 90 percent. This does not reflect the efficiency of activated carbon in removing specific tastes and odors.
The efficiency of adsorption of a substance from water is inversely proportional to its solubility in water. The relationship can be expressed by the Freundlich and the Langmuir adsorption isotherms.
Weber and Morris210 in 1964 studied the competition among solutes for adsorption on activated carbon (50 X 60 and 100 X 140 mesh sizes) in aqueous solution. The pairs of solutes investigated were dodecyl benzene sulfonate (DBS) plus phenol, O-nitrochlorobenzene (NCB) plus DBS, and dodecyl sulfate plus DBS. They found that the Langmuir model is broadly applicable to the adsorption of water pollutants on carbon. Each solute adversely affected both the rate of adsorption and the equilibrium capacity for adsorption of the other compound present. They concluded that adsorption from mixed solutions was competitive and may have significant consequences not only for renovation of wastewaters but also for control of tastes and odors in water supplies. The effectiveness of activated carbon in adsorbing odor-causing substances will decrease as concentration of other adsorbable organic pollutants increase.
In 1973, Ishizaki and Cookson211 reported on the adsorption of sulfur compounds by activated carbon in an agitated solution under controlled conditions of temperature, pH, and ionic strength. They found that activated carbon catalyzed the oxidation of the mercaptan to butyl disulfide. The adsorption of n-butyl mercaptan and butyl disulfide could be expressed by the Langmuir isotherm. The adsoprtion rate of n-butyl mercaptan increased with higher temperature and with lower pH.
Powdered activated carbon was first applied in a public water supply in the United States in 1929, and was accepted almost immediately as a popular method for the control of odors in water supplies.212 The application of powdered carbon is described in detail elsewhere.10,213
Until the early 1960s, the only conventional method of applying activated carbon in water treatment units was to slurry various amounts of finely powdered carbon either into or prior to the settling basin.
For more than a decade, the use of granular activated carbon has been progressing. Granular carbon filters were first pioneered for public water supply at Hopewell, Virginia.214
Medlar215 in 1975 reported that only about 40 plants use granular carbon in the United States. However, more granular carbon plants are expected to be installed because of their advantages. In Illinois, the cities of Peoria, East St. Louis, and Granite City216'217 have relatively new installations.
The use of granular carbon eliminates the need to dose, store, and dispose of powdered carbon. There is no handling and dusting problem. As a part of the treatment system at all times when used in filter beds or columns, granular carbon is capable of providing consistent water quality in spite of fluctuation or accidental spills in raw water sources. Granular carbon also serves a polishing purpose. The percolation process with granular carbon brings the water into more intimate contact with carbon assuring more complete removal. It also increases the effective capacity and reduces the frequency of filter backwashing. Granular carbon performs the dual role of filtration and adsorption. One of the attractive advantages of granular carbon is that it can be regenerated.214-218
The choice of powdered versus granular activated carbon for taste and odor control depends
34
on the individual water plant. Normally, the use of powdered carbon is more economical than granular carbon for plants feeding low dosages of powdered carbon.218 A possible exception to this may be plants using superchlorination treatment. For plants that feed a high carbon dosage, particularly large plants, the use of granular carbon may be more economical. The factors to be considered are powdered carbon dosage, dechlorination, backwash savings, chlorine requirement, granular carbon attrition losses, and regeneration.218
Medlar215 in 1975 pointed out that granular activated carbon adds a relatively small cost to the water plant. To add new filters would cost from $1.00 to $3.50 per person served per year. If a treatment facility uses sand or mixed media in existing filters, replacement and operating costs would be even less.
In practice, granular carbon is usually considered exhausted when the quality of the treated water becomes unacceptable. The time for the carbon to become exhausted is called its 'life expectancy.' The life expectancy of carbon depends upon the material adsorbed. Theoretically, most of the sorption capacity of the granular carbon is not entirely used as it is in powdered carbon.219 The factors influencing the use of granular carbon are discussed in detail by Hyndshaw220 and Hyndshaw et al.221
Generally, molecules of higher molecular weights are attracted more strongly by carbon than are lower-weight molecules. Activated carbon prefers nonpolar substances.219 Carbon added after the softening reactions of lime may not be as effective as when added at low pH.4'79
In a water treatment plant, powdered carbon should be applied at a point prior to filtration or, if no filters are available, prior to coagulation and settling.212 Thus, in the normal water treatment plant carbon can be applied to the raw water,75 mixing basin,181 settling basin, or directly to the filters.
The influence of water treatment chemicals on taste and odor compounds varies and might even be peculiar to the individual plant. Hyndshaw222 in 1962 pointed out that selection of the point of applying carbon should be studied for the maximum efficiency of plant operation. In plants where such factors as pH and disinfection adversely influence taste and odor control, carbon should be applied before the offending chemicals can alter the taste and odor compounds to a less adsorbable form. On the other hand, when the disinfection chemicals modify the taste and odor substances so that they are less noticeable, application of carbon afterward can be more economical. Sigworth97 suggested that carbon and chlorine should not be applied at the same point.
Granular carbon can be used after conventional filtration, as a combination filtration-adsorption medium, or an independent adsorption bed prior to filtration. If the space is available, new carbon columns or beds can be added. Activated carbon placed on the rapid sand filter as an adsorption-filtration system is economical. The Nitro plant of West Virginia Water Company in 1966 had the sand completely removed from their conventional type filters and replaced it with granular carbon.214 Installations of granular carbon at several plants are discussed elsewhere.214"217'223"227
Some fundamental studies on the effects of water treatment methods for removal of organic chemicals were made by Middleton et al.228 in 1952. They developed the carbon filter technique for concentrating and estimating organic chemicals in water. They also concluded that the carbon filter technique would be a useful method for tracing the course of an industrial waste and for studying the organic removal efficiency of a water treatment process.
35
Dostal et al.156 in 1965 studied a series of small scale experiments and full scale tests to obtain granular carbon consumption data for the removal of odorous and nonodorous organic matter from Kanawha River water at the Nitro, West Virginia, water plant. Criteria were developed for use in the design of a granular carbon system for Nitro. In 1966, Dostal et al.229 developed technological functions from the experimental data and incorporated these and pertinent economic data into mathematical optimization models for systems designed to remove taste and odor-producing organic materials from water. The optimization models included cases with constant influent quality over one year, as well as those with seasonal changes in influent quality. The design criteria are given elsewhere.230'231
Activated carbon not only controls taste and odor, but improves the quality of water by removing or reducing materials not necessarily detected by taste and odor methods. These materials might be toxic substances, turbidity, color, organic matter, pesticides, detergents, COD, BOD, microorganisms, and other materials. The use of activated carbon, however, is not a panacea for all water supplies. For most cases, carbon is used with aeration or with chemical oxidation to obtain satisfactory control of tastes and odors.
Treatment with activated carbon is often the most effective method for adsorbing taste and odor due to trade wastes especially organic compounds, chlorine, algae, decaying vegetation, actinomycetes, and other causes. Many successful treatments have been reported. The following are some examples.
In 1949, Besozzi and Vaughn162 reported that the use of powdered activated carbon was the only means by which a satisfactory water supply was produced from the southern Lake Michigan water at Whiting, Indiana. Baylis232 in 1951 reported that activated carbon slurries successfully controlled taste and odor in water at Chicago. Filicky83 in 1955 discussed the problems and corrective measures employed at six Indiana water treatment plants which used activated carbon with or without other types of treatment to produce palatable water. The water sources were affected by sewage, industrial wastes, and odors from natural causes.
In 1952, Middleton et al.228 reported that on a plant scale test at Cincinnati, 10 ppm of activated carbon removed 63 percent of the organic chemicals which were present in the filtered water. At Nitro, West Virginia, water treatment processes including large doses of powdered carbon removed 83 percent of the organic chemicals from the raw water.
Potassium permanganate was used for preoxidation at Cedar Rapids, Iowa,181 and at Bowling Green, Ohio.192 Activated carbon was used for adsorbing some organic compounds to provide palatable waters.
Baker233 studied the relative efficiency of 10 commercial carbons in the removal of n-butanol from water by gas-liquid chromatography with flame-ionization detection. He found considerable variation in capacity and adsorption behavior among the carbons tested because of different surface areas per unit weight.
The effect of activated carbon treatment without coagulation on waters containing organocides is shown in table 16 by the laboratory experiment made by Hyndshaw.234 Experiments with coagulation alone indicated little removal of these compounds. Similarly, Aly and Faust163
found that activated carbon treatment was an effective method for the removal of 2,4-D compounds, formulation solvents, and 2,4-DCP. In practice at the water works of Melbourne, Florida,235 the application of activated carbon up to as high as 20 to 30 ppm in the raw water was effective in removing the herbicide 2,4-D and controlling taste and odor.
36
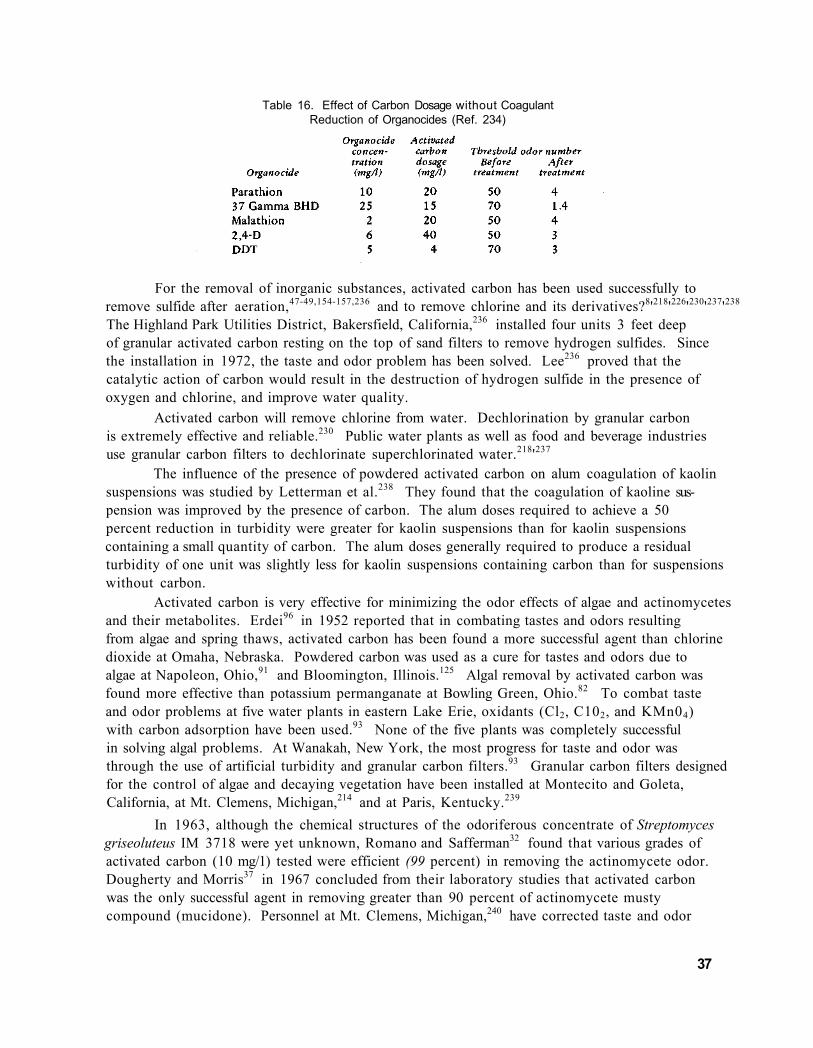
Table 16. Effect of Carbon Dosage without Coagulant Reduction of Organocides (Ref. 234)
For the removal of inorganic substances, activated carbon has been used successfully to remove sulfide after aeration,47-49,154-157,236 and to remove chlorine and its derivatives?8'218'226'230'237'238
The Highland Park Utilities District, Bakersfield, California,236 installed four units 3 feet deep of granular activated carbon resting on the top of sand filters to remove hydrogen sulfides. Since the installation in 1972, the taste and odor problem has been solved. Lee236 proved that the catalytic action of carbon would result in the destruction of hydrogen sulfide in the presence of oxygen and chlorine, and improve water quality.
Activated carbon will remove chlorine from water. Dechlorination by granular carbon is extremely effective and reliable.230 Public water plants as well as food and beverage industries use granular carbon filters to dechlorinate superchlorinated water.218'237
The influence of the presence of powdered activated carbon on alum coagulation of kaolin suspensions was studied by Letterman et al.238 They found that the coagulation of kaoline suspension was improved by the presence of carbon. The alum doses required to achieve a 50 percent reduction in turbidity were greater for kaolin suspensions than for kaolin suspensions containing a small quantity of carbon. The alum doses generally required to produce a residual turbidity of one unit was slightly less for kaolin suspensions containing carbon than for suspensions without carbon.
Activated carbon is very effective for minimizing the odor effects of algae and actinomycetes and their metabolites. Erdei96 in 1952 reported that in combating tastes and odors resulting from algae and spring thaws, activated carbon has been found a more successful agent than chlorine dioxide at Omaha, Nebraska. Powdered carbon was used as a cure for tastes and odors due to algae at Napoleon, Ohio,91 and Bloomington, Illinois.125 Algal removal by activated carbon was found more effective than potassium permanganate at Bowling Green, Ohio.82 To combat taste and odor problems at five water plants in eastern Lake Erie, oxidants (Cl2, C102, and KMn04) with carbon adsorption have been used.93 None of the five plants was completely successful in solving algal problems. At Wanakah, New York, the most progress for taste and odor was through the use of artificial turbidity and granular carbon filters.93 Granular carbon filters designed for the control of algae and decaying vegetation have been installed at Montecito and Goleta, California, at Mt. Clemens, Michigan,214 and at Paris, Kentucky.239
In 1963, although the chemical structures of the odoriferous concentrate of Streptomyces griseoluteus IM 3718 were yet unknown, Romano and Safferman32 found that various grades of activated carbon (10 mg/1) tested were efficient (99 percent) in removing the actinomycete odor. Dougherty and Morris37 in 1967 concluded from their laboratory studies that activated carbon was the only successful agent in removing greater than 90 percent of actinomycete musty compound (mucidone). Personnel at Mt. Clemens, Michigan,240 have corrected taste and odor
37
problems due to the presence of actinomycetes in waters of Lake St. Clair with ultra heavy doses (up to 125 ppm) of carbon slurry since 1958. In the summer of 1967, two feet of granular carbon was placed on the filter by removing 6 inches of filter sand. Hansen225 in 1972 reported that granular carbon filters have been successful at Mt. Clemens in producing a water entirely free of taste and odor, which means that the method effectively controlled the actinomycete problem.
A number of additional references on activated carbon are given at the end of the list of references cited in the text.
Other Treatment Methods. The following covers a rare case for applying copper sulfate in a water treatment plant and investigations of taste and odor control by fatty oils and by X-ray radiation. Anders241 in 1961 reported that at the Richmond, Virginia, water treatment plant, copper sulfate was added to the raw water from the James River and to the filtered water ahead of aeration for algae control. It was found that a copper residual of 0.10 to 0.15 mg/1 in the finished water at the filter plant was sufficient to control algae throughout the distribution system during the cold months of the year. From 0.15 to 0.20 mg/1 was required for the summer months. Microstraining has been used to reduce algae at some water plants.
Results of tests made at the Technical University, Delft, Holland, by Boelhouver et al.242
in 1956 showed that several odor causing substances like phenol, can be removed from water by treatment with small amounts of fatty oils. The oils can be removed later by flocculation with ferric hydroxide. They242 indicated that strong smelling compounds could be obtained by vacuum steam distillation from the derived floc. Almost simultaneously, Klinge et al.243
reported qualitative analysis for investigating the ability of fatty oils to absorb recognized taste and odor-causing contaminants. The groups of organic compounds in the same family with phenols and mercaptans were used as model contaminants. The ability of oils to absorb these contaminants was determined by color development type analysis. Ground nut, rapeseed, linseed, olive, and ricinus oil all proved to be satisfactory absorbant oils.
Vajdic153 in 1971 discussed the practicality of gamma-ray irradiation to control an odorous compound produced by actinomycetes. He reported that an irradiation dose as low as 8.4 X 10³
rads reduced the TON of the artificially produced odorous water from 600 to 17 quite as adequately as the activated carbon treatment (50 ppm for 30 minutes). There are no large scale irradiation units currently treating water supplies. The theoretical total cost of applying a gamma dose from cobalt 60 of about 104 rads to a 1-mgd water plant was estimated to be about 30¢ per 1000 gallons.
Treatment in Distribution Systems
Organisms in distribution systems are most frequently iron bacteria. Other organisms such as sulfur and manganese bacteria, algae, insects, clams, and nematoes have been observed occasionally in distribution systems.46
To control the nuisance organisms in distribution systems, both nonchemical and chemical methods can be used. The favored nonchemical methods are cleaning growths from a distribution system by flushing or removing attached growths from clear walls or finished water storage reservoirs, redesign of the system, and microstraining.
Chemicals such as copper sulfate and chlorine can be applied in the storage reservoir or various points of the distribution system. To combat bacteria growth in the distribution system at Sioux Falls, South Dakota, increased chlorination, rechlorination, and lowered pH combined with a redesigned treatment system were found to be effective.244
38
REFERENCES CITED
1 Illinois Pollution Control Board. 1974. Rules and regulations, Chapter 6, Public Water Supply, Springfield, 12 p.
2 Baker, R. A. 1966. Taste and odors — examination of present knowledge. Journal American Water Works Association v. 58(6):695-699.
3 American Water Works Association Committee on Tastes and Odors. 1970. Research on tastes and odors. Journal American Water Works Association v. 62(l):59-62.
4 Ettinger, M. B., and F. M. Middleton. 1956. Plant facilities and human factors in taste and odor control. Journal American Water Works Association v. 48(10): 1265-1273.
5 Baker, R. A. 1961. Taste and odor in water — critical review. Final report F-A2333. The Franklin Institute, Philadelphia, 159 p.
6 Baker, R. A. 1961. Problems of tastes and odors, Journal Water Pollution Control Federation v. 33(10). 1099-1106.
7 Sigworth, E. A. 1961. The production of palatable water. Taste and Odor Control Journal v. 27(10): 1-8 and 27( l l ) : l -4 .
8 Middlebrooks, E. J. 1965. Taste and odor control in water. Public Works v. 96(4): 127-130.
9 Middlebrooks, E . J . 1965. Taste and odor control. Water & Sewage Works v. 112(RN):R122-R134.
10 West Virginia Pulp and Paper Co. 1966. Taste and odor control in water purification. West Virginia Pulp and Paper Co., New York, 48 p.
11 Hartung, H. O. 1960. Effects of pollutants in water supplies — taste and odor. Journal American Water Works Association v. 52(11):1363-1366.
12 Palmer, C. N. 1962. Algae in water supplies. U.S. Public Health Service Publication No. 657, Washington, D.C., 88 p.
13 Silvey, J. G., D. E. Henley, and J. T. Wyatt. 1972. Planktonic blue-green algae: Growth and odor-production studies. Journal American Water Works Association v. 64(l):35-39.
14 Safferman, R. S., A. A. Rosen, C. I. Mashni, and M. E. Morris. 1967. Earthy-smelling substance from a blue-green alga. Environmental Science & Technology v. l(5):429-430.
15 Gerber, N. N., and H. A. Lechevalier. 1965. Geosmin, and earthy-smelling substances isolated from actinomycetes. Applied Microbiology v. 13(6):935-938.
16 Medsker, L. L., D. Jenkins, and J. F. Thomas. 1968. Odorous compounds in natural waters — earthly smelling compound associated with blue-green algae and actinomycetes. Environmental Science & Technology v. 2(6):461-464.
17 Henley, D. E. 1970. Odorous metabolite and other selected studies of' Cyanophyta. Doctoral Dissertation, North Texas State University, Denton.
18 Narayan, L. V., and W. J. Nunez, III. 1974. Biological control: Isolation and bacterial oxidation of the taste and odor compound geosmin. Journal American Water Works Association v. 66(9):532-536.
19 Jenkins, D., L. L. Medsker, and J. F. Thomas. 1967. Odorous compounds in natural waters, some sulfur compounds associated with blue-green algae. Environmental Science & Technology v. 1 (9):731-735.
20 Maloney, T. E. 1963. Research on algal odor. Journal American Water Works Association v. 55(4):481-486.
21 Coote, R. 1950. Chlorine dioxide treatment at Valparaiso, Indiana. Water & Sewage Works v. 97(1):13-16.
22 Silvey, J. K. G., J. C. Russell, D. R. Redden, and W. C. McCormick. 1950. Actinomycetes and common tastes and odors. Journal American Water Works Association v. 42(11):1018-1026.
23 Silvey, J. K. G. 1953. Newer concepts of tastes and odors in surface water supplies. Water & Sewage Works v. 100(11):426-429.
39
24 Silvey, J. K. G. 1954. New concepts of tastes and odors in water supplies — isolation and identification of noxious actinomycetes in raw and distribution systems. Water & Sewage Works v. 101(5):208-211.
25 Silvey, J. K. G., and A. W. Roach. 1959. Laboratory culture of taste and odor producing aquatic actinomycetes. Journal American Water Works Association v. 51(l):20-32.
26 Silvey, J. K. G., K. Guthrie, and H. E. Schlichting. 1967. Taste and odors in surface water supplies. In Manual of Water Utility Operations, J. H. Sorrels (Ed.), Texas Water Utilities Association, printed by Press, Inc., Lancaster, Pennsylvania, pp. 70-131.
27 McMillan, L. M., S. P. Karshen, and B. F. Willey. 1972. Identification and location of actinomycetes in the southern end of Lake Michigan. Journal American Water Works Association v. 64(5):312-315.
28 Silvey, J. K. G., and A. W. Roach. 1953. Actinomycetes in Oklahoma City Water Supply. Journal American Water Works Association v. 45(4):409-416.
29 Silvey, J. K. G. 1953. Relation of irrigation runoff to tastes and odors. Journal American Water Works Association v. 45(11):1179-1186.
30 Morris, R. L. 1962. Actinomycetes studies as taste and odor cause. Water & Sewage Works v. 109(2):76-77.
31 Erdei, J. F. 1963. Control of taste and odor in Missouri River. Journal American Water Works Association v. 55(12):1506-1522.
32 Romano, A. H., and R. S. Safferman. 1963. Studies on actinomycetes and their odors. Journal American Water Works Association v. 55(2):169-176.
33 Morris, R. L., J. D. Dougherty, and G. W. Ronald. 1963. Chemical aspects of actinomycetes metabolites as contributors of taste and odor. Journal American Water Works Association vr55(10):1380-1390.
34 Gaines, H. D., and R. P. Collins. 1963. Volatile substances produced by Streptomyces odorifer. Lloydia v. 26(4):247-253.
35 Collins, R. P., and H. D. Gaines. 1965. Volatile constituents produced by actinomycete Streptomyces odorifer and alga Synura petersenii. Engineering Extension Series 117 part 2, Purdue University, Lafayette, Indiana, pp. 769-776.
36 Dougherty, J. D., R. D. Campbell, and R. L. Morris. 1966. Actinomycetes: Isolation and identification of agent responsible for musty odors. Science v. 152(3727):1372-1373.
37 Dougherty, J. D., and R. L. Morris. 1967. Studies on removal of actinomycete musty tastes and odors in water supplies. Journal American Water Works Association v. 59(10):1320-1326.
38 Henley, D. E., W. H. Glaze, and J. K. G. Silvey. 1969. Isolation and identification of odor compound produced by selected aquatic actinomycete. Environmental Science & Technology v. 3(3):268-271.
39 Rosen, A. A., C. I. Mashni, and R. S. Safferman. 1970. Recent developments in the chemistry of odor in water. The cause of earthy-musty odour. Water Treatment Examination v. 19(2):106-119.
40 Silvey, J. K. G., W. H. Glaze, A. Hendricks, D. Henley, and J. Matlock. 1968. Gas chromatographic studies on taste and odor in water. Journal American Water Works Association v. 60(4):440-450.
41 Sigworth, E. A. 1957. Control of odor and taste in water supplies. Journal American Water Works Association v. 49(12):1507-1521.
42 Allen, E .J . 1960. Taste and odor problems in new reservoirs in wooded areas. Journal American Water Works Association v. 52(8):1027-1032.
43 Silvey, J. K. G. 1966. Taste and odor — effect of organisms. Journal American Water Works Association v. 58(6):706-715.
44 Silvey, J. K. G., H. B. Sharp, K. L. Dickson, R. C. Allison, and J. C. Stiles. 1973. Some effects of evaporation suppression on reservoir ecology. Journal American Water Works Association v. 65 (4):260-268.
45 MacKenthun, K. M., and L. E. Keup. 1970. Biological problems encountered in water supplies. Journal American Water Works Association v. 62(8):520-526.
40

46 Rohlich, G. A., and W. B. Sarles. 1949. Chemical composition of algae and its relationship to taste and odor. Taste and Odor Control Journal v. 15(10):l-6.
47 Schiller, B. 1955. Vacuum degasification of water for taste and odor control. Journal American Water Works Association v. 47(2):124-128.
48 Foxworthy, J. E., and H. K. Gray. 1958. Removal of hydrogen sulfide in high concentration from water. Journal American Water Works Association v. 50(7):872-878.
49 Sammons, L. L. 1959. Removal of hydrogen sulfide from a ground water supply. Journal American Water Works Association v. 51(10):1275-1276.
50 Monscvitz, J. T., and L. D. Ainsworth. 1968. Unique polysulfide taste and odor problem at Santa Barbara, California. Taste and Odor Control Journal v. 34(2):l-4.
51 Monscvitz, J. T., and L. D. Ainsworth. 1974. Treatment for hydrogen polysulfide. Journal American Water Works Association v. 66(9):537-539.
52 Symons, J. M., J. K. Carswell, and G. G. Robeck. 1970. Mixing of water supply reservoirs for quality control. Journal American Water Works Association v. 62(5):322-334.
53 Eunpu, F. F. 1973. Control of reservoir eutrophication. Journal American Water Works Association v. 64(4):268-274.
54 Lockhart, E. E., C. L. Tucker, and M. C. Merritt. 1955. The effect of water impurities on the flavor of brewed coffee. Food Research v. 20(6):598-605.
55 Cohen, J. M., L. J. Kamphake, E. K. Harris, and R. L. Woodward. 1960. Taste threshold concentrations of metals in drinking water. Journal American Water Works Association v. 52(5):660-670.
56 Bruvold, W. H., and R. M. Pangborn. 1966. Rated acceptability of mineral taste in water. Journal Applied Psychology v. 50(l):22-32.
57 Bruvold, W. H. 1970. Mineral taste and the potability of domestic water. Water Research v. 4(5):331-340.
58 Smith, J. W., and S. G. Grigoropoulos. 1968. Toxic effects of odorous trace organics. Journal American Water Works Association v. 60(8):969-979.
59 Middleton, F. M., A. A. Rosen, and R. H. Burttschell. 1958. Taste and odor research tools for water utilities. Journal American Water Works Association v. 50(l):21-28.
60 Riddick, T. M. 1966. Taste and odors — Zeta potential and polymers. Journal American Water Works Association v. 58(6):719-722.
61 Suffet, I. H., and S. Segall. 1971. Detecting taste and odor in drinking water. Journal American Water Works Association v. 63(9):605-608.
62 Hoak, R. D. 1957. Causes of tastes and odors in drinking water. Water & Sewage Works v. 104(6):243-247.
63 Burttschell, R. H., A. A. Rosen, F. M. Middleton, and M. B. Ettinger. 1959. Chlorine derivatives of phenol causing taste and odor. Journal American Water Works Association v. 51(2):205-214.
64 Kinney, J. E. 1961. Fusing phenol frenzy. Water & Sewage Works v. 108(4):140-144.
65 Bouson, F. W. 1953. Phenolic tastes in a surface supply. Journal American Water Works Association v. 45(5):491-493.
66 Kremer, R. W., and R. J. Cunjak. 1953. Phenolic tastes — Pennsylvania Health Department Survey. Journal American Water Works Association v. 45(5):495-496.
67 Chase, D. E. 1953. Phenolic tastes in a well supply. Journal American Water Works Association v. 45(5): 493-495.
68 Robeck, G. G., K. A. Dostal, J. M. Cohen, and J. F. Kreissl. 1965. Effectiveness of water treatment processes in pesticide removal. Journal American Water Works Association v. 57(2):181-199.
41
69 Woodward, R. L. 1960. Significance of pesticides in water supplies. Journal American Water Works Association v. 52(11):1367-1372.
70 U. S. Environmental Protection Agency. 1974. Draft analytical report — New Orleans area water supply study. EPA 906/10-74-002 Surveillance and Analysis Division, Region VI, USEPA, Dallas, Texas, mimeo report, 30 p.
71 Cohen, J. M. 1963. Taste and odor of ABS in water. Journal American Water Works Association v. 55(5): 587-591.
72 Walton, G. 1960. ABS contamination. Journal American Water Works Association v. 52(11):1354-1362.
73 Bryan, P. E., L. N. Kyzminski, F. M. Sawyer, and T. H. Feng. 1973. Taste thresholds of halogens in water. Journal American Water Works Association v. 54(5):363-368.
74 Murray, W. B. 1972. Taste and odor control with sulfamic acid. Journal American Water Works Association v. 64(4):259-260.
75 Jordan, L. 1961. A change which resulted in a palatable water at Herrin, Illinois. Taste and Odor Control Journal v. 27(4):l-7.
76 Baker, R. A. 1964. Dechlorination and sensory control. Journal American Water Works Association v. 56(12):1578-1592.
77 Haynes, L. 1957. Treatment of industrial water pollution at Nitro and Charleston, West Virginia. Journal American Water Works Association v. 49(3):309-312.
78 Williams, D. B. 1952. How to solve odor problems in water chlorination practice. Water & Sewage Works v. 99(9):358-364.
79 Hyndshaw, A. Y. 1956. Some recent experiences in taste and odor control. Water & Sewage Works v. 103(5): 214-216.
80 Gard, C. M. 1949. Experiences with break-point chlorination. Water & Sewage Works v. 91(11):415-418.
81 Harlock, C. R., and M. R. Dowlin. 1953. Chlorine and chlorine dioxide for control of algae odors. Water & Sewage Works v. 100(2):74-75.
82 Swanger, G. F. 1967. Taste and odor control practices at Bowling Green, Ohio. Taste and Odor Control Journal v. 33(6):l-6.
83 Filicky, J .G . 1955. Taste and odor control in Indiana. Journal American Water Works Association v. 47(7): 675-679.
84 Bellar, T. A., J. J. Lichtenberg, and R. C. Kroner. 1974. The occurrence of organohalides in chlorinated drinking waters. Journal American Water Works Association v. 66(12):703-706.
85 American Water Works Association Technical and Professional Council. 1974. Organic contaminants in drinking water. Willing Water v. 18(12):4-6.
86 American Water Works Association Task Group 2670P. I960. Questions and answers on biologic infestations. Journal American Water Works Association v. 52(6):1081-1084.
87 Lewis, F. R. 1965. Control of sulfate-reducing bacteria. Journal American Water Works Association v. 57(8):1011-1015.
88 O'Donovan, D. C. 1965. Treatment with ozone. Journal American Water Works Association v. 57(9): 1167-1192.
89 Williams, D. B. 1966. Operator's problems in small plant — taste and odors. Journal American Water Works Association v. 58(6):703-705.
90 Louis, L. 1952. Spring taste and odor problems — panel discussion. Journal American Water Works Association v. 44(12):1135-1142.
91 DuByne, F. T. 1963. Taste and odor problems of Maumee River supply. Journal American Water Works Association v. 55(6):710-714.
42
92 Drautz, K. E., and J. G. Simmons. 1967. West Palm Beach solves taste and odor problems. Water and Wastes Engineering v. 4(4):66-68.
93 Clare, L. G., and N. E. Hopson. 1975. Algae problems in eastern Lake Erie. Journal American Water Works Association v. 67(3):131-134.
94 American Public Health Association, American Water Works Association, and Water Pollution Control Federation. 1971. Standard methods for the examination of water and wastewater. American Public Health Association, Inc., 13th ed., New York, 875 p.
95 Gaufin, A. R. 1964. Taste and odor production in reservoirs by blue-green algae. Journal American Water Works Association v. 56(10):1345-1350.
96 Erdei, J . F . 1952. Taste and odor problems during spring runoff. Panel discussion. Journal American Water Works Association v. 44(12):1127-1133.
97 Sigworth, E. A. 1951. Controlling tastes and odors with activated carbon. Water & Sewage Works v. 99(3):121-125.
98 Cohen, J. M., L. J. Kamphake, E. K. Harris, and R. L. Woodward. 1960. Taste threshold concentrations of metals in drinking water. Journal American Water Works Association v. 52(5):660-670.
99 Bruvold, W. H., and R. M. Pangborn. 1970. Dissolved oxygen and taste of water. Journal American Water Works Association v. 62(ll) :721-722.
100 Cox,G. J., and J. W. Nathans. 1952. A study of the taste of fluoridated water. Journal American Water Works Association v. 44(10):940-942.
101 Baker, R. A. 1963. Threshold odors of organic chemicals. Journal American Water Works Association v. 55(7):913-916.
102 Baker, R. A. 1963. Odor effects of aqueous mixtures of organic chemicals. Journal Water Pollution Control Federation v. 35(6):728-741.
103 Rosen, A. A., J. B. Peter, and F. M. Middleton. 1962. Odor thresholds of mixed organic chemicals. Journal Water Pollution Control Federation v. 34(1):7-14.
104 Rosen, A. A., R. T. Skeel, and M. B. Ettinger. 1963. Relationship of river water odor to specific organic contaminants. Journal Water Pollution Control Federation v. 35(6):777-782.
105 Maloney,J.R. 1968. Odor control with carbon and permanganate at Des Moines. Journal American Water Works Association v. 60(10):1195-1198.
106 Baker, R. A. 1962. Critical evaluation of olfactory measurement. Journal Water Pollution Control Federation v. 34(6):582-591.
107 American Society for Testing and Materials. 1975. 1975 annual book of ASTM standards. American Society for Testing and Materials, Philadelphia, Pennsylvania pp. 165-173.
108 Bruvold, W. H., H. J. Ongerth, and R. C. Dillehay. 1969. Consumer assessment of mineral taste in domestic water. Journal American Water Works Association v. 61(11 ):575-580.
109 Laughlin, H. F. 1962. Influence of temperature in threshold odor evaluations. Taste and Odor Control Journal v. 28(10).l-6.
110 Pangborn, R. M., and L. L. Bertolero. 1972. Influence of temperature on taste intensity and degree of linking of drinking water. Journal American Water Works Association v. 64(8): 511-515.
111 Pomeroy, R. D., and H. Cruse. 1969. Hydrogen sulfide odor threshold. Journal American Water Works Association v. 61(12):677.
112 Bruvold, W. H., H. J. Ongerth, and R. C. Dillehay. 1967. Consumer attitude toward mineral taste in domestic water. Journal American Water Works Association v. 59(5):547-556.
113 Dillehay, R. C., W. H. Bruvold, and J. P. Siegel. 1967. On the assessment of potability. Journal Applied Psychology v. 51(2):89-95.
43
114 Bruvold, W. H., and H. J. Ongerth. 1969. Taste quality of mineralized water. Journal American Water Works Association v. 61(4):170-174.
115 Bruvold, W. H. 1968. Scales for rating the taste of water. Journal Applied Psychology v. 52(3):245-253.
116 Pangborn, R. M., I. M. Trabue, and R. E. Baldwin. 1970. Sensory examination of mineralized chlorinated waters. Journal American Water Works Association v. 62(9):572-576.
117 Baker, R. A., S. J. Campbell, and F. R. Anspach. 1965. Electrophoretic and taste and odor measurements in plant control. Journal American Water Works Association v. 57(3):363-374.
118 Collins, R. P. 1966. Analytical methods for identification of taste and odor. Journal American Water Works Association v. 58(6):715-719.
119 Medsker, L. L., D. Jenkins, and J. F. Thomas. 1969. Odorous compounds in natural waters: 2-exo-hydroxy-2-methylbornane, the major odorous compound produced by several actinomycetes. Environmental Science & Technology v. 3(5):476-477.
120 Popalisky, J. R., and F. W. Pogge. 1972. Detecting and treating organic taste and odor compounds in the Missouri River. Journal American Water Works Association v. 64(8):805-811.
121 Caruso, S. C, and J. R. Koslow. 1969. Application of gas chromatography to the detection and identification of taste and odor-producing compounds in surface waters. Proceedings 30th Interstate Water Conference, Pittsburgh, Pennsylvania, pp. 101-108.
122 Coarchene, J. E., and J. D. Chapman. 1975. Algae control in northwest reservoirs. Journal American Water Works Association v. 67(3):127-130.
123 Hale, F. E. 1954. Control of microscopic organisms. Phelps Dodge Refining Corporation, New York, New York.
124 Swartz, S. O. 1955. Review of microorganisms in water supplies. Journal New England Water Works Association v. 69(2):217-227.
125 Riser, D. 1959. Reducing algae, tastes, and odors with copper sulfate and activated carbon. Water works Engineering v. 112(1):40-41.
126 Gaufin, A. R. 1964. Taste and odor production in reservoirs by blue-green algae. Journal American Water Works Association v. 56(10):1345-1350.
127 Bartholomew, K. A. 1958. Control of earthy, musty odors in water by treatment with residual copper. Journal American Water Works Association v. 50(4):481-486.
128 Woodhull, R. S. 1955. Tastes and odors in Connecticut water supplies. Journal American Water Works Association v. 69(2):126-139.
129 Ringer, W. C, and S. J. Campbell. 1955. Algae control at Philadelphia. Journal American Water Works Association v. 47( 8):740-744.
130 Bean, E. L. 1957. Taste and odor control in Philadelphia. Journal American Water Works Association v. 49(2):205-216.
131 Headstream, M., D. M. Wells, and R. M. Sweazy. 1975. The Canyon Lakes projects. Journal American Water Works Association v. 67(3):125-127.
132 American Water Works Association Research Foundation. 1975. A study to select the most urgently needed research to solve taste and odor problems in the water utility industry. Mimeo, 20 p.
133 Silvey, J. K. G., and A. W. Roach. 1964. Studies on microbiotic cycles in surface waters. Journal American Water Works Association v. 56(l):60-72.
134 Hohen, R. C. 1965. Biological methods for the control of taste and odors. Southwest Water Works Journal v. 47(3):26,28,30.
135 Dickson, K. L. 1968. Actinomycetes and water quality. Journal American Water Works Association v. 60(4):379-381.
44

136 Silvey, J. K. G., D. E. Henley, W.J. Nunez, and R. C. Hohen. 1970. Biological control: Control of naturally occurring taste and odors by microorganisms. Proceedings National Biological Congress, Detroit.
137 Ogborn, C. M. 1966. Aeration system keeps water tasting fresh. Public Works v. 97(4):84-86.
138 Bernhardt, H. 1967. Aeration of Wahnback Reservoir without changing the temperature profile. Journal American Water Works Association v. 59(6):943-964.
139 Symons, J. M., W. H. Irwin, E. L. Robinson, and G. G. Robeck. 1967. Impoundment destratification for raw water quality control using either mechanical or diffused air pumping. Journal American Water Works Association v. 59(10):1268-1291.
140 Knoppert, P. L., J. J. Rook, Tj. Hofker, and G. Oskam. 1970. Destratification experiments at Rotterdam. Journal American Water Works Association v. 62(7):448-454.
141 Laverty, G. L., and H. L. Nielsen. 1970. Quality improvements by reservoir aeration. Journal American Water Works Association v. 62(11):711-714.
142 Biederman, W. J., and E. E. Fulton. 1971. Destratification using air. Journal American Water Works Association v. 63(7):462-466.
143 Symons, J. M., W. H. Irwin, and G. G. Robeck. 1967. Impoundment water quality changes caused by mixing. Journal American Society of Civil Engineers Sanitary Engineering Division, v. 93(SA2):l-20.
144 Irwin, W. H., J. M. Symons, and G. G. Robeck. 1967. Water quality in impoundments and modification from destratification. In Reservoir Fishery Resources Symposium, Athens, Georgia. C. C. Layne, Jr. (Ed.), pp. 130-152, distributed by the American Fisheries Society, Washington, D.C.
145 Symons, J. M., W. H. Irwin, and G. G. Robeck. 1968. Control of reservoir water quality by engineering methods. In. Proceedings of Specialty Conference of Current Research into the Effect of Reservoirs on Water Quality. R. A. Elder, P. A. Krenkel, and E. L. Thackston (Eds.), Technical Paper No. 17, Department of Environmental Water Resources Engineering, Vanderbilt University, Nashville, Tennessee, pp. 335-390.
146 Quality Control in Reservoirs Committee, American Water Works Association. 1971. Artificial destratification in reservoirs. Journal American Water Works Association v. 63(9):597-604.
147 Symons, J. M. 1969. Water quality behavior in reservoirs. Public Health Service Publication No. 1930, U.S. Department of Health, Education, and Welfare, Washington, D.C, 616 p.
148 Bartsch, A. F. 1955. Practical methods for control of algae and water weeds. Public Works v. 86(2):86-87, 144-146, 148.
149 Lawton, G. W. 1960. Limitation of nutrients as a step in ecological control — the Madison Lakes before and after diversion. In: Algae and Metropolitan Wastes, Transactions of the 1960 Seminar, U.S. Department of Health, Education, and Welfare. Cincinnati, Ohio, pp. 108-117.
150 Valcik, J. A. 1975. Algae in Baltimore's reservoirs. Journal American Water Works Association v. 67(3): 109-113.
151 Shilo, M. 1969. New approaches to the control of harmful brackish and freshwater algae of economic importance. Second International Conference on Global Impacts of Applied Microbiology, Addis Ababa, Ethiopia, 1967. Biotechnology and Bioengineering Symposium, no. 1. Elmer L. Gaden, Jr. (Ed.), Wiley-Interscience, New York, p. 177.
152 Paul, S. K., K. V. Chari, and B. Bhattacharyya. 1975. Electrolytic control of algae. Journal American Water Works Association v. 67(3):140-141.
153 Vajdic, A. H. 1971. Gamma-ray treatment of tastes and odors. Journal American Water Works Association v. 63(7):459-461.
154 Griffin, A. E. 1955. Discussion: Taste and odor control in Indiana (by J. G. Filicky). Journal American Water Works Association v. 47(7):679-682.
45
155 Haynes, L., and W. Grant. 1945. Reduction of chemical odors at Nitro, West Virginia. Journal American Water Works Association v. 37(10):1013-1020.
156 Dostal, K. A., R. C. Pierson, D. G. Hager, and G. G. Robeck. 1965. Carbon bed design criteria study. Journal American Water Works Association v. 57(5):663-674.
157 Finney, J. W. 1952. Turbidity and odor problems overcome in filter plant design. Public Works v. 83(11): 60-61,96-97.
158 Powell, S. T., and L. G. von Lossberg. 1948. The removal of hydrogen sulfide from well waters. Journal American Water Works Association v. 40(12):1277-1290.
159 Chen, K. Y., and J. C. Morris. 1972. Kinetics of oxidation of aqueous sulfide by O2 . Environmental Science & Technology v. 6(6):529-537.
160 Ryckman, D. W., and S. G. Grigoropoulos. 1959. Use of chlorine and its derivatives in taste and odor removal. Journal American Water Works Association v. 51(10):1268-1274.
161 Kinney, J. E. 1960. Evaluating the taste and odor control problem. Journal American Water Works Association v. 52(4):505-514.
162 Besozzi, L., and J. C. Vaughn. 1949. Experimental studies of odor control at Whiting, Indiana. Journal American Water Works Association v. 41(11):1035-1045.
163 Aly, O. M., and S. D. Faust. 1965. Removal of 2-4-dicblorophenoxyacetic acid derivatives from natural waters. Journal American Water Works Association v. 57(2):221-230.
164 Harlock, R., and R. Dowlin. 1958. Use of chlorine for control of odors caused by algae. Journal American Water Works Association v. 50(l):29-32.
165 Murray, W. B. 1963. A calcium hypochlorite manufacturing process for water treatment plant use. Water & Sewage Works v. 110(9):318-326.
166 Victoreen, H. T. 1972. Commentary 1. Taste and odor control with sulfamic acid (by W. B. Murray). Journal American Water Works Association v. 64(4):260-261.
167 Morris, J. C. 1972. Commentary 11. Taste and odor control with sulfamic acid (by W. B. Murray). Journal American Water Works Association v. 64(4):261.
168 Augenstein, H. W. 1974. Use of chlorine dioxide to disinfect water supplies. Journal American Water Works Association v. 66(12):716-717.
169 Feuss, J .V . 1964. Problems in determination of chlorine dioxide residuals. Journal American Water Works Association v. 56(5):607-615.
170 Granstrom, M. L., and G. F. Lee. 1958. Generation and use of chlorine dioxide in water treatment. Journal American Water Works Association v. 50(11):1453-1466.
171 Shull, K. E. 1962. Operating experiences at Philadelphia suburban treatment plants. Journal American Water Works Association v. 54(10):1232-1239.
172 Higbee, W. E. 1966. Stabilized chlorine dioxide. Modern Chemicals, September-October, 1 p.
173 Lovely, C. F. 1966. The use of stable chlorine dioxide complex in water treatment. Presented to the New Jersey Section of the American Water Works Association, Atlantic City, mimeo., 5 p.
174 International Dioxcide, Inc. 1971. Anthium dioxcide. Bulletin 603, New York, New York, 4 p.
175 Piatek, A. 1967. Preventing filamentous scale in well water. Water & Wastes Engineering v. 4(12):54-55.
176 Cravens, B. B. 1966. Stabilized chlorine dioxide for microorganism control. Journal Technical Association of the Pulp and Paper Industry v. 49(8)53A-55A.
177 Stabilized chlorine dioxide for odor control. 1968. Public Works v. 99(4):166.
178 Smith, J. L. 1961. Water supply tastes and odors controlled by potassium permanganate. Public Works v. 92(5):129-130.
46
179 Welch, W. A. 1963. Potassium permanganate in water treatment. Journal American Water Works Association v. 55(6):735-741.
180 Humphrey, S. B., and M. A. Eikelberry. 1961. New potassium permanganate techniques. Water & Sewage Works v. 108(5):204-206.
181 Cherry, A. K. 1962. Rx for tastes and odors — KMnO4 and activated carbon. Water Works Engineering v. 115(3):182-185.
182 Cherry, A. K. 1962. Use of potassium permanganate in water treatment. Journal American Water Works Association v. 54(4) :417-424.
183 Cherry, A. K. 1962. KMnO4 improves water quality. Water & Sewage Works v. 109(7):266-268.
184 Rauch, W. D. 1964. Permanganate treatment of water. Water and Wastes Engineering v. 1(11):36-39.
185 Maloney, J .R . 1968. Odor control with carbon and permanganate at Des Moines. Journal American Water Works Association v. 60(10):1195-1198.
186 Boland, J. J., and W. E. DeArment. 1964. Potassium permanganate removal of tastes and odors from paper mill wastes. Journal American Water Works Association v. 57(11):1451-1455.
187 Adams, R. B. 1962. Discussion: Operating experiences at Philadelphia suburban treatment plants (by K. E. Shull). Journal American Water Works Association v. 54(10):1239-1240.
188 Spicher, R. G., and R. T. Skrinde. 1963. Potassium permanganate oxidation of organic contaminants in water supplies. Journal American Water Works Association v. 55(9):1174-1193.
189 Spicher, R. G., and R. T. Skrinde. 1965. Effects of potassium permanganate on pure organic compounds. Journal American Water Works Association v. 57(4):472-484.
190 Dougherty, J. D., and R. L. Morris. 1967. Studies on the removal of actinomycete musty tastes and odors in water supplies. Journal American Water Works Association v. 59(10):1320-1326.
191 Whysall, C.G. 1967. Taste and odor control. American City v. 82(12):99-100.
192 Swanger, G . F . 1969. Use of potassium permanganate at Bowling Green, Ohio. Water and Wastes Engineering v. 6(10):46-47.
193 Willey, B. F., H. Jennings, and F. Muroski. 1964. Removal of hydrogen sulfide with potassium permanganate. Journal American Water Works Association v. 56(4) :475-479.
194 Diaper, E. W. J. 1972. Practical aspects of water and waste water treatment by ozone. In: Ozone in Water and Wastewater Treatment, F. L. Evans (Ed.), Ann Arbor Science Publishers, Inc., Ann Arbor, Michigan, pp. 145-179.
195 Hann, V. A. 1956. Disinfection of drinking water with ozone. Journal American Water Works Association v. 48(10):1316-1320.
196 Gomella.C. 1972. Ozone practices in France. Journal American Water Works Association v. 64(l):39-45.
197 Ozone in water and waste water treatment. 1972. F. L. Evans (Ed.), Ann Arbor Science Publishers Inc., Ann Arbor, Michigan, 185 p.
198 Pollution Control System. 1975. Ozone applications in water purification and pollution control — a bibliography, 1940-1974. W. R. Grace & Co., Columbia, Maryland, 10 p.
199 Harris, W. C. 1972. Ozone disinfection. Journal American Water Works Association v. 64(3):182-183.
200 Karlson, E. L. 1972. Ozone — friend or foe? Pollution Engineering v. 4(3) :32-33.
201 Thompson, H. 1972. Ozone-antidote for water pollution. Pollution Engineering v. 4(3):34-36.
202 Kirk, B. S., R. McNabney, and C. S. Wynn. 1972. Pilot plant studies of tertiary wastewater treatment with ozone. In: Ozone in Water and Wastewater Treatment, F. L. Evans (Ed.), pp. 61-82.
203 Bender, R . J . 1970. Ozonation, next step to water purification. Power v. 114(8):58-60.
47
204 Rosen, H.M. 1972. Ozone generation and its economical application in wastewater treatment. Water & Sewage Works v. 119(9):114-120.
205 Rosen, H. M., F. E. Lowther, and R. G. Clark. 1974. Get ready for ozone. Water and Wastes Engineering v. 11(7):25-31.
206 Cox, C. R. 1939. Significant experiences in the treatment of water in New York state. Journal New England Water Works Association v. 53(4):444-457.
207 Bartuska, J. F. 1941. Ozonation at Whiting, Indiana. Journal American Water Works Association v. 3 3(11): 2035-2050.
208 Bean, E. L. 1965. Discussion: Treatment with ozone (by D. C. O'Donovan). Journal American Water Works Association v. 57(9):1193-1194.
209 Powell, M. P., K. G. Drummond, C. Saavedra, F. M. Evans, P. F. Morgan, and N. B. Fisher. 1952. Action of ozone on tastes and odors and coliform organisms. Journal American Water Works Association v. 44(12):1144-1150.
210 Weber, W. J., and J. C. Morris. 1964. Adsorption in heterogeneous aqueous systems. Journal American Water Works Association v. 56(4):447-456.
211 Ishizaki, C, and J. T. Cookson, Jr. 1973. Adsorption of sulfur-containing taste and odor compounds. Journal Water Pollution Control Federation v. 45(3):515-522.
212 Sigworth, E. A. 1956. Taste and odor control with activated carbon. Water & Sewage Works v. 103(10): 456-461.
213 Hyndshaw, A. Y. 1968. Bulk handling of activated carbon. Journal American Water Works Association v. 60(5):562-569.
214 Siefers, H. K. 1969. The use of granular activated carbon in municipal water systems. New England Water Works Association v. 83(1 ):1-12.
215 Medlar, S. 1975. Operating experiences with activated granular carbon. Water & Sewage Works v. 122(2): 70-73.
216 Blanck, C. A., and D. J. Sulick. 1975. Activated carbon fights bad taste. Water and Wastes Engineering v. 12(9):70-73.
217 Blanck, C. A. 1976. Taste and odor control utilizing granular activated carbon in the plains region of the American Water Works System, American Water Service Co., Inc., mimeo., 15 p.
218 Hyndshaw, A. Y. 1970. Selection of granular versus powdered activated carbon. Water and Waste Engineering v. 7(2):49-53.
219 Hyndshaw, A. Y. 1972. Activated carbon to remove organic contaminants from water. Journal American Water Works Association v. 64(5):309-311.
220 Hyndshaw, A. Y. 1955. How to secure maximum benefits with activated carbon. Journal New England Water Works Association v. 69(l):69-77.
221 Hyndshaw, A. Y., H. F. Laughlin, D. C. Colebraugh, Jr., and J. G. Filicky. 1952. Factors influencing efficiency of activated carbon. Journal New England Water Works Association v. 66(1): 36-42.
222 Hyndshaw, A. Y. 1962. Treating application points for activated carbon. Journal American Water Works Association v. 54(l):91-98.
223 Lawrence, C. H. 1968. California plant uses diatomite and carbon filters. Water and Waste Engineering v. 5(l):46-49.
224 Hansen, R. E. 1970. Filter control by suspended solids determination. Public Works v. 101(8):74-76.
225 Hansen, R. E. 1972. Granular carbon filters for taste and odor removal. Journal American Water Works Association v. 64(3):176-181.
48

226 Morin, R. A. 1973. The Weirs water treatment plant Loconia Water Works, Loconia, New Hampshire. Journal New England Water Works Association v. 87(2):162-170.
227 Granular activated carbon eliminates taste and odor problems. 1975. Water & Sewage Works v. 122(11): 42-43.
228 Middleton, F. M., H. Brans, and C. C. Buchhoff. 1952. Fundamental studies of taste and odor in water supplies. Journal American Water Works Association v. 44(6):538-546.
229 Dostal, K. A., J. J. Harrington, R. M. Clark, and G. G. Robeck. 1966. Devleopment of optimization models for carbon bed design. Journal American Water Works Association v. 58(9):1170-1186.
230 Hager, D. G., and M. E. Flentje. 1965. Removal of organic contaminants by granular-carbon filtration. Journal American Water Works Association v. 57(11):1440-1450.
231 Medlar, S. 1974. Two filters are better than one. Water & Sewage Works v. 121(12):28-31.
232 Baylis, J .R . 1951. Chicago controls taste with carbon slurries. American City v. 66(12):108-109.
233 Baker, R. A. 1964. Chromatographic evaluation of activated carbon. Journal American Water Works Association v. 56(l):92-98.
234 Hyndshaw, A. Y. 1974. Activated carbon in coagulation process. In: A collection of reference articles on coagulants and coagulation, G. E. Symons (Ed.). Reprinted from Water and Wastes Engineering pp. 16-17.
235 McColgan, R. 1967. Taste and odor control in the Upper St. John's Basin. Taste and Odor Control Journal v. 33(l):2-4.
236 Lee, P. 1974. Activated carbon removes sulfide odor. Water & Sewage Works v. 121(9):116-117.
237 Hyndshaw, A. Y. 1967. The removal of chlorine from water by activated carbon. Taste and Odor Control Journal v. 33(10):1-4.
238 Letterman, R. D., L. E. Quon, and R. S. Gemmell. 1970. Coagulation of activated carbon suspensions. Journal American Water Works Association v. 62(10):652-658.
239 Bowling, R. 1974. Successful application of granular carbon solves water quality problems. ICI America, Inc., D-122, 3 p.
240 Hansen, R. E. 1964. Problem — musty water, culprit — actinomycetes. Water and Wastes Engineering v. l ( l ) :45-49.
241 Anders, W. W. 1971. Two-point copper sulfating program licks algae problem. Water Works Engineering v. 114(8):700,701,729, 732.
242 Boelhouver, C., R. Syderius, M. Tels, and H. I. Waterman. 1959. Fatty oils for odor removal. Water & Sewage Works v. 106(5): 188-190.
243 Klinge, L. N., M. Tels, M. J. Waale, and H. I. Waterman. 1959. Fatty oils to remove taste and odor. Water & Sewage Works v. 106(6):237-238.
244 O'Connor, J. T., L. Hash, and A. B. Edwards. 1975. Deterioration of water quality in distribution systems. Journal American Water Works Association v. 67(3):113-116.
ADDITIONAL REFERENCES ON ACTIVATED CARBON
Atlas Chemical Industries, Inc. 1963. Measurement adsorptive capacity of activated carbons for liquid purification. Wilmington, Delaware, 28 p.
Fornwalt, H. J., and R. A. Hutchins. 1966. Purifying liquids with activated carbon. Chemical Engineering, Part I: v. 73(8):179-184 (April 11): and Part II: v. 73(10):155-160 (May 9).
49
ICI America, Inc. 1972. A symposium on activated carbon, manufacture, properties, evaluation, application. Atlas Chemical Industries, Inc., 80 p.
Hutchins, R. A. 1973. New method simplifies design of activated-carbon systems. Chemical Engineering v. 80(19):133-138, (August 20).
Westvaco Chemical Division. 1974. Nuchargranular active carbon. Covington, Virginia, 14 p.
Adams, A. D. 1974. Powdered carbon: Is it really that good? Water and Wastes Engineering v. 11(3):B8-B11.
DeJohn, P. B. 1975. Carbon from lignite or coal: Which is better? Chemical Engineering v. 82(9):113-116.
Hutchins, R. A. 1975. Activated carbon regeneration: Thermal regeneration costs. Chemical Engineering Progress v. 71(5):80-86.
Cheremisinoff, P. N. 1976. Carbon adsorption of air and water pollutants. Pollution Engineering v. 8(7):24-32.
Ross, R. M. 1976. Conversion of rapid sand filters to granular carbon filters. Journal American Water Works Association v. 68(12):663-664.
Culp, G. L., and A. J. Shuckrow. 1977. What lies ahead for PAC? Water and Wastes Engineering v. 14(2):67-74.
Huang, J. C, and J. T. Garrett. 1977. Effects of poly electrolytes and clay colloids on carbon adsorption. Water & Sewage Works v. 124(3):64-67.
50