Embed Size (px)
Citation preview

1
February 14, 2020 To: John Pepi From: Marissa Ambrosi Cc: Ted Siegler Natalie Starr Re: Task 8: Activity Based Cost Model and Financial Profile
Task 8.a. - Activity Based Cost Model Introduction
The workplan for the University of Massachusetts Amherst (UMass) Waste System Analysis includes an economic/financial assessment of the current collection and disposal system at UMass. The goal is to create an Activity Based Cost Model (ABC Model, or Model) allowing DSM Environmental Services, Inc (DSM) to estimate total costs by major material group resulting in a cost per ton for each collection stream accounting for labor (including custodial and auxiliary labor), operations & maintenance, and annualized capital costs.
Once the base case model is finalized it can be used for several of the tasks included in the Project Teams’ scope of work, including:
• Analysis of the efficiency of the current waste management system;
• Analysis of the potential costs to add food waste collection in residential life, academic and management buildings; and,
• Financial analysis of capital needs going forward (Task 8.b). OWM provided DSM with the allocation of significant portions of the waste management system costs; the remaining costs were then allocated by DSM, typically using tons managed as a proxy for allocation. Table 8.a.1 of this memorandum presents a summarized Activity Based Cost Model. A detailed description of the methodology is presented below for background use by OWM in support of DSM’s final report to UMass. However, it is important to note that Activity Based Cost Accounting is as much an art as a science. There is no one correct way to allocate costs, and typically there is a need to use best professional judgment in some cases to develop an allocation that makes sense. As such the resulting cost per ton estimates should be viewed as just that – estimates – that are relatively accurate, internally consistent, and reasonably compare activity costs across the system. Given the overall size of the UMass solid waste management budget (including custodial) of roughly $5.7 million, small changes in allocations are not likely to significantly change the overall comparison of costs among the material collection systems.
2
Model Description The Model is formatted to allocate costs into one of seven activities:
• administrative,
• exterior waste bins (dumors),
• refuse,
• single steam recyclables,
• cardboard,
• food waste, and
• all other.
Costs are broken out by line item so that it is possible to adjust the model to account for changes to the collection or processing of waste and materials at UMass going forward. A summary of the key line items (rows) is included below and provides a description of the item, how costs were allocated across the seven activities, and what source was used for the data. The source files refer to the data file that was provided to DSM from OWM and the name in which it was provided. In many cases multiple source files were used in calculations – in these instances the data gathered from each source file is listed after the file name. The data from these source files was used in underlying spreadsheets associated with this cost model.
OWM - Labor OWM labor costs are grouped among the following line items: collection, processing, building, utility and special waste, and administrative. These line items then have subcategories of overtime, fringe benefit, and commonwealth (pension, etc.) costs. OWM labor costs were assigned by OWM both to the type of labor (collection, processing, etc.) and to the material handled. In cases where the material handled was outside the traditional waste stream, the cost was included as part of the all other category. Overtime cost ($91,840) were allocated per material group utilizing the overtime schedule to calculate the number of hours each crew spends per weekend to collect each material type and the total overtime hours worked each weekend. DSM then calculated the percent of overtime spent collecting each material type and multiplied that figure by the total annual overtime cost to estimate the overtime costs per material group. Fringe benefits were calculated at 2.89% of salary costs and Commonwealth health, life, and pension was calculated at 34.58% of salary costs per data provided by OWM.
Data Source: • CopyofFY19WasteProcessingLaboralocation11-14-19 (employee salary, allocation of
time)
• OWMWasteOT-incl-WeekendOTAllocationjp10-22-19 (OT expenses, OT schedule, OT total cost)

3
• UmassFullWasteMgmtExpenseProfile10-22-19Draftjp (Commonwealth health, life, and pension and Fringe Benefits (2.98%)
OWM – Consumables OWM consumables includes line items for office supplies, materials/maintenance for processing, tools & supplies for collection, utilities for the OWM office and WRTF building, and assorted special material recycling costs. Data for OWM consumable allocation were provided by OWM with the exception of utilities which were allocated as 10% administrative, 10% all other waste, with the remaining 80% allocated between dumors, refuse, single stream, OCC, and food waste based on the percentage (by tons) of the overall waste stream each category represented.
Data Source: • DSMFin.AnalysisWithReallocationsjp10-25-19 (line item expenses for FY19, allocated by
OWM)
• UmassFullWasteMgmtExpenseProfile10-22-19Draftjp (Utilities, Bin Liners) OWM – Vehicles OWM vehicle costs include the estimated annual maintenance costs and fuel costs for OWM vehicles used for collection, processing, and administrative duties. In addition to the OWM vehicles this section includes three pieces of machinery (skid steer, backhoe, forklift) used in the in-house processing of materials. OWM provided DSM with the total annual maintenance costs which were then allocated based on the use and type of vehicle. For example, DSM assumed it is more expensive to maintain packer trucks then pickup trucks. Fuel costs were provided as a total to DSM and were then allocated based on historic fuel usage data provided by OWM.
Data Source: • UmassFullWasteMgmtExpenseProfile10-22-19Draftjp (vehicle maintenance & repair
costs, vehicle fuel cost, vehicle type, vehicle usage.)
• https://www.foresternetwork.com/msw-management/waste/article/13001186/the-refuse-fleet-maintenance-challenge-managing-trucks-as-capital-assets - Costs to maintain packer trucks
• May 2018 – Feb 2019 On Campus Fuel (Fuel usage). Contract Costs Contracts with Dave Wickles Trucking and Martin Farm were provided by OWM. These contracts included the cost per haul, monthly container rental and cost per ton of disposal. Costs per haul and monthly rental data were allocated to each waste stream based on the data provided in the Wickles contract. Using estimated haul frequencies provided by OWM, DSM was able to estimate annual haul and rental costs per material type. Disposal costs were calculated based on the cost per ton ($81.40 for refuse and $43.00 for food waste) multiplied by the total annual generation of refuse and food waste.

4
Data Source: • Attachment – B- Haul Destinations Tons Frequencies 4-11-18 (Haul Frequencies)
• Wickles Contract – Monthly rental cost, rental inventory, cost per haul, cost per ton of refuse disposed.
• Martin’s Farm Contract – Cost per ton disposed. Custodial Labor Refuse, Single Stream, OCC and Food Waste Custodial labor costs, which include time collecting and consolidating refuse, single stream and OCC, were allocated to refuse, single stream, OCC, or in some cases food waste based on data provided to DSM. OWM provided DSM with the total minutes per day custodial labor are reported to spend on the collection and consolidation of refuse and single stream in residential halls or apartments, both during weekdays and on the weekend. DSM utilized this data to develop an estimate of total hours per week and total cost per academic session (assuming a labor rate of $20.20/hr.). DSM then allocated the custodial labor costs for residential halls or apartments between refuse, single stream, and food waste based on the estimated number of toter’s collected annually. Cost of custodial labor in the summer for residential buildings is assumed to be 10% of the cost during the academic session. The second part of custodial labor is determining the time spent and associated costs of collection and consolidation in the academic and administrative buildings. To do this, DSM utilized data obtained from initial meetings with custodial staff who estimated that it took them 1 minute to service 1,000 sq ft., with an additional 10 minutes every 10,000 sq. ft. to bring materials to the ground floor consolidation points. Essentially, for every 10,000 sq. ft. it was estimated that it takes custodial staff 20 minutes to service. Utilizing this estimate, DSM added up the square feet per academic or administrative building on each refuse route (East and West) using the mapping data, excluding buildings such as the parking garage that are unlikely to fit in this model. Once the total sq. ft. per refuse route of academic and administrative buildings was determined, DSM calculated the total hours per week and the annual costs during the academic and non-academic sessions (it was assumed that the non-academic session was 60% of the academic session). Total annual cost of custodial labor was then allocated between refuse and single stream based on estimated annual number of toters collected.
Old Corrugated Cardboard (OCC) Custodial costs associated with the collection of OCC are assumed to be 40% of the single stream custodial costs both for the residential and academic sectors. This assumption is based on the understanding that the generation of cardboard is less frequent than single stream or refuse, and, while cardboard generation in academic/residential buildings is 2/3 of that of single stream, the weight of cardboard is much greater than that of most single stream items and, thus, the actual number of cardboard pieces custodial labor has to break down or move is less than that of single stream bins or toters.
5
Auxiliary Custodial Labor Total custodial labor for Auxiliary Services associated with food waste, refuse, and recyclable materials was provided to DSM by OWM. This cost was then allocated based on the number of toters per each waste stream that are understood to be generated in the Dining Commons. Auxiliary custodial labor numbers are included in the line item ‘custodial labor’ in Table 8.a.1.
Data Source: • ResLife. East Custodial Waste Hours Spreadsheet June 2019, ResLife West Custodial
Waste Hours Spreadsheet – Residential Life Custodial Hours
• UMass Waste Flow – Refuse Toter Count
• Loadman Data (October and August) – Single stream toter estimate
• UmassFullWasteMgmtExpenseProfile10-22-19Draftjp – custodial hourly wage
• Food Waste Calcs – Updated 7,24 – Food Waste Toter Count
• UmassFullWasteMgmtExpenseProfile10-22-19Draftjp (002) – Auxiliary Labor Custodial Cost
Building Maintenance (In-house, unbilled) In-house building maintenance represents roughly $33,000 annually. This maintenance includes the OWM offices as well as the WRTF building. Building maintenance was allocated in the same manner as utilities with administrative and all other waste being allocated at 10% of the total, and the remaining 80% split between exterior bins, refuse, single stream, OCC, and food waste based on tons of the overall waste stream they represent.
Data Source: • UmassFullWasteMgmtExpenseProfile10-22-19Draftjp
Facilities & Campus Services Central Services Facilities & Campus Services Central Services costs were provided by OWM. These costs were then allocated into the seven categories based on the percent of labor costs each category represented.
Data Source: • E-mail from JP, 10/21
Capital Costs Capital costs were provided by OWM along with year of purchase. DSM assumed a lifetime of 20 years for buildings, 15 years for equipment, and 10 years for trucks, carts, and dumpsters. Capital costs were allocated by material type based on information provided by OWM. Depreciation expenses were calculated using straight line depreciation. DSM assumed an estimated end of life value of 20 percent of capital which was deducted from the initial capital cost. For carts/toters, DSM assumed a ten-year life with no value at the end, essentially meaning that one-tenth of carts would be replaced each year.

6
In instances where the line item had exceeded its useful lifetime, DSM used best professional judgement to estimate what replacement costs would be and over what reasonable additional lifetime. It should be noted here that UMass does not typically carry a depreciation expense for OWM capital, instead allocating funds to purchase new equipment when deemed necessary. However, because capital is integral to OWM operations, DSM believed it necessary to explicitly account to capital depreciation and include it in the Model.
Structures and Site Capital Structure and site capital cost, lifetime, and waste stream was provided by OWM. In the cases where the item has exceeded its useful life, DSM inserted an estimated annual amount UMass should be setting aside in a capital reserve account to replace the item. OWM allocated the site and structure capital costs based on waste stream. In the instance where multiple waste streams utilize the same capital equipment, DSM allocated 10% to the “all other category” and divided the remaining costs among the other selected waste streams based on the annual tons generated.
Data Source: • UmassFullWasteMgmtExpenseProfile10-22-19Draftjp
Vehicles Vehicles were all assumed to have an end of useful life value of 20% of the purchase price. To calculate the annual depreciation, DSM subtracted the end of useful life value from the purchase price, and then divided that resulting figure by the years of assumed lifetime. Vehicles were allocated to material groups based on information provided by OWM. In cases where the vehicle has depreciated past the end of useful life, DSM included an estimated annual replacement cost.
Data Source: • UmassFullWasteMgmtExpenseProfile10-22-19Draftjp
Containers and Bins Containers and Bins are allocated to the waste stream based on their use on campus. Total container and bin numbers were confirmed by OWM. Containers and bins were assumed to have a 10-year lifetime with one tenth of them being replaced annually. The annual cost of replacement is listed as the capital cost for each style or type of bin/container.
Data Source: • Final Current Container Count

7
Summary Table 8.a.1 summarizes the final cost allocation among the seven activities. As stated above, Table 8.a.1 should be viewed as a rough approximation of costs per collection stream, with a level of accuracy of plus of minus 10 percent in each case. Precision is less important than a relative analysis of the costs for each of the activities listed. Table 8.a.1: Summary Activity Based Cost Model, 2019

8
Task 8.b. - Financial Profile – Current and Future Capital Needs Introduction
The Financial Profile can be divided into two components. The first component, based on the Activity Based Cost Model described above, identifies capital equipment that has exceeded its useful life and should be included in future planning for replacement. The second component of the Financial Profile adds potential investments that DSM believes may be necessary to add new programs (such as food waste collection in Residential Life, Academic and Management Buildings as requested as part of this analysis) as well as improvements to single stream collection, especially to address the relatively high contamination rates identified as part of the Waste Audit. The reader of this memorandum is referred to other Task Memorandums to better understand these potential investments.
Current Capital Needs
Table 8.b.1 lists capital equipment that has exceeded its typical lifetime and as such UMass should consider developing a capital replacement budget for this equipment so that it can be replaced over time. It should be noted here that there is nothing wrong with using capital past its expected lifetime as long as it is adequately maintained. However, it is prudent to budget for either eventual replacement and/or a major overhaul.
Table 8.b.1 Current Capital Replacement Needs, 2019
9
Future Capital Needs
As stated above, this section should be read in conjunction with other Technical Memorandums that detail: Information and Education needs; the potential addition of separate food waste collection to Residential Life, Academic and Management buildings; concerns about single stream recyclables contamination; and, potential reductions in exterior bin collection.
Each of these potential capital needs is briefly summarized below followed by Table 8.b.2 which compiles these potential capital needs into a single overall capital investment; acknowledging that not all of these capital investments may be necessary depending on decisions UMass makes based on the analysis included in DSM’s final report and subsequent internal discussions.
Consistent Bin Colors and Labeling
The Waste Audit indicated that roughly 25 percent of SS material consisted of contamination, including
food waste in the trash and recycling; recyclables in the trash and food waste; and, compostable food
packaging (World Centric) in the recycling (as well as trash).
It is DSM’s professional opinion, based on over a decade of work on public space recycling, that one key
to reducing contamination is to have consistent bin colors and labeling throughout the campus. Based
on photographs compiled by OWM and observations by DSM, there are inconsistencies in bin types,
sizes and colors throughout campus. In some cases, this is the result of trash room space limitations in a
wide variety of buildings from different eras. In other cases, it is due to the change from dual stream to
single stream recycling collection, with older dual stream bins still in use.
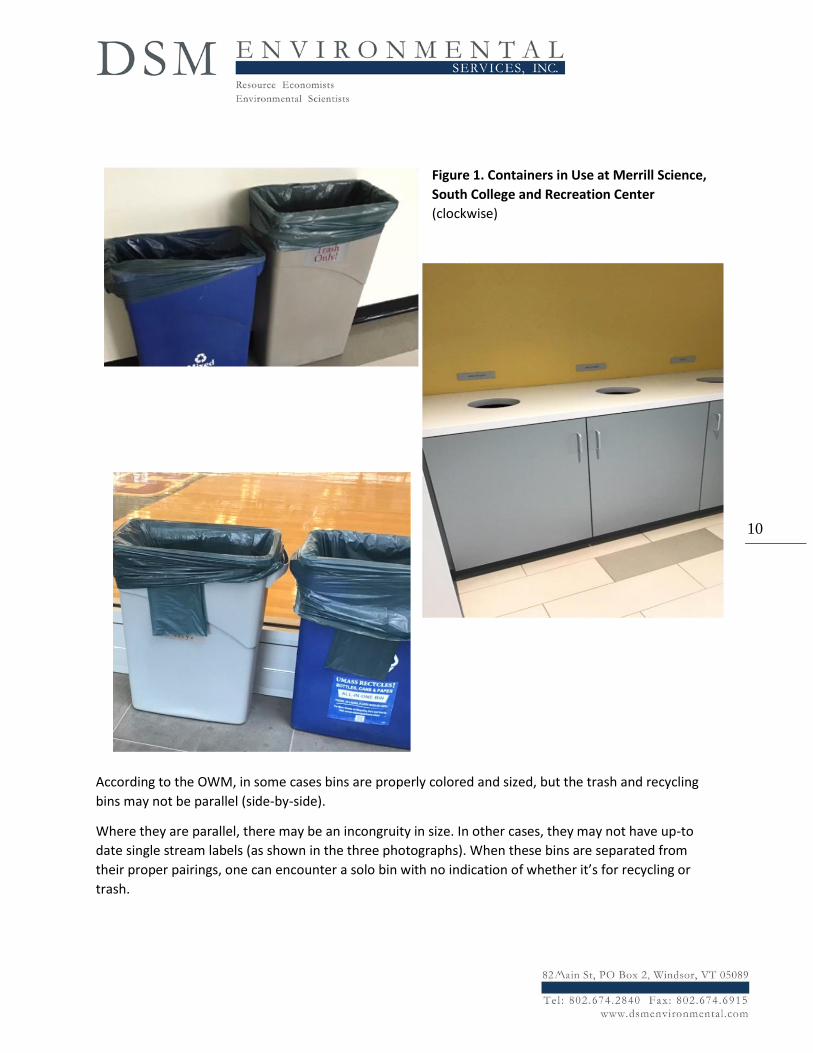
Figure 1 illlustrates a few examples of the different containers used on campus for recycling.
10
Figure 1. Containers in Use at Merrill Science,
South College and Recreation Center
(clockwise)
According to the OWM, in some cases bins are properly colored and sized, but the trash and recycling
bins may not be parallel (side-by-side).
Where they are parallel, there may be an incongruity in size. In other cases, they may not have up-to
date single stream labels (as shown in the three photographs). When these bins are separated from
their proper pairings, one can encounter a solo bin with no indication of whether it’s for recycling or
trash.

11
Furthermore, trash bins can be black, beige or grey. Single stream bins can be green or blue (or even
grey). The bin liners are all different colors with all manner of methods of securing and draping over the
bin edges (not infrequently covering the recycling bin decal).
In addition, many of the newer buildings have desk side recycling bins with no decal and only a mobius
chasing arrow imprinted on them.
Finally, the recycling containers observed by DSM in several of the dorm floor trash rooms were small
compared to the refuse bins, with their collection frequency lower than the daily refuse collection
(making it easier to load recyclables in the trash than the small recycling container).
Given that there will be significant penalties for single stream contamination rates above 15 percent,
either at the Springfield MRF, or at any other recycling facility UMass might choose to haul to, it is
imperative that UMass embark on an aggressive campaign to coordinate all recycling and refuse bin
sizes and colors; especially if in addition, UMass decides to go forward with separate food waste
collection in these same buildings. As discussed in the food waste analysis, World Centric packaging has
the potential to significantly exacerbate confusion as to what is recyclable versus compostable.
It is beyond DSM’s scope to catalog all bins throughout UMass. However, based on photographic
evidence and discussions with OWM, DSM is estimating UMass will need to invest approximately
$200,000 in new bins and bin signage to significantly improve the consistency of containers throughout
campus. This includes the investment in roughly 230 “slim jim” three- unit containers to fit food waste
containers into Residential Life trash rooms where space is insufficient to place a third rolling cart for
food waste.
Addition of MAX R Three Unit Containers
One of the costliest OWM operations (on a per ton basis) is the collection and servicing of exterior litter
(and recycling) bins, estimated at roughly $192,000 last year (see Table 8.a.1 above). It is DSM’s opinion
that many of these exterior bins could be replaced with MAX R three-bin units located in front of, or in
the lobby of most buildings on campus. These three-bin units are very visible and can be properly
labeled and specified in consistent colors so that students, faculty, administrators and visitors can easily
identify which bin is for trash, single stream recyclables, and food waste. And if they were consistently
located, students, faculty and employees would always know they could locate and enter a building (or
go near the entrance) and find a recycling, food waste or trash container, even if they could not find one
outside.
While these three bin units are expensive, at roughly $2,250 each, they have reportedly reduced
confusion about what is recyclable and what is compostable at the Dining Commons; and could become
an integral part of the entrance to Residential Life and Academic buildings going forward.
As such it is recommended that roughly 140 new MAX R units be purchased over the next several years.
Purchase of these MAX R containers would cost roughly $320,000; but would allow for phasing out of
the majority of exterior bin collections. This phasing out of exterior bin collection would also result in
reducing the capital costs of replacing exterior bins (Dumors) which cost roughly $1,100 per unit (refuse
only) or $2,200 for paired units (refuse and recycling).

12
WRTF Improvements
The potential addition of separate collection of food waste in Residential Life, Academic and Administrative buildings will require a central location to dump the collected food waste for transfer to either Martin Farm, or to an alternative location. This is because Martin Farm is concerned about potential levels of contamination and therefore does not want this new material commingled with the food waste that is currently collected from dining commons, which is relatively clean.
While it is possible to deliver the newly collected food waste directly to Martin Farm, or to a food depacking facility) in the packer truck used to collect the food waste, it is likely that it will be less costly over time to instead provide a location at the WRTF facility to consolidate food waste; which would also give OWM the opportunity to make some observations about the quality of material collected and the types of contamination. A site on-campus to dump the collected food waste will be even more important if OWM moves forward with consolidating collection of refuse and/or recyclables as a way to free up existing truck and crew capacity to collect the new separated food waste. The logical option is to utilize one of the open top roll-off containers currently used to store single stream material on the east (back) end of the WRTF building, This should be considered at the same time that UMass is investigating alternatives for processing of single stream material. Several of the options to the MA DEP/Waste Management contract include Casella in Auburn, MA and USA Waste in the Hartford, CT area. DSM estimates that OWM could reduce haul costs to these longer distance facilities by moving from open-top containers to 40 cubic yard compaction boxes. Therefore, one option would be to replace two of the current open top roll-offs with two stationary compactors and attached 40-yard enclosed roll-offs. This would require cutting the overhanging floor, installing dump chutes and stationary compactors feeding closed roll-offs perpendicular to the back of the building. In the absence of an engineering study, DSM estimates that installation of each stationary compactor and hopper, including cutting of the overhanging floor, and purchase of new enclosed roll-offs would cost between $75,000 and $100,000 each.
Addition of Separate Food Waste Collection
As discussed in Technical Memorandum concerning the potential addition of separate food waste
collection, pairing of new food waste carts with single stream and trash bins in Residential Life,
Academic and Management Buildings is expected to require over 3,000 new bins/carts and cost roughly
$140,000 (rounded) should UMass decide to move forward with Option A outlined in the food waste
analysis.
Investments in New Signage
The addition of food waste collection in Residential Life, Academic and Management buildings, when combined with high levels of single stream contamination call for a significant effort to develop new signage and messages. DSM has assumed that roughly $70,000 will be necessary, although it is beyond DSM’s scope as to what the real cost might be.
Summary of Potential New Capital Costs
13
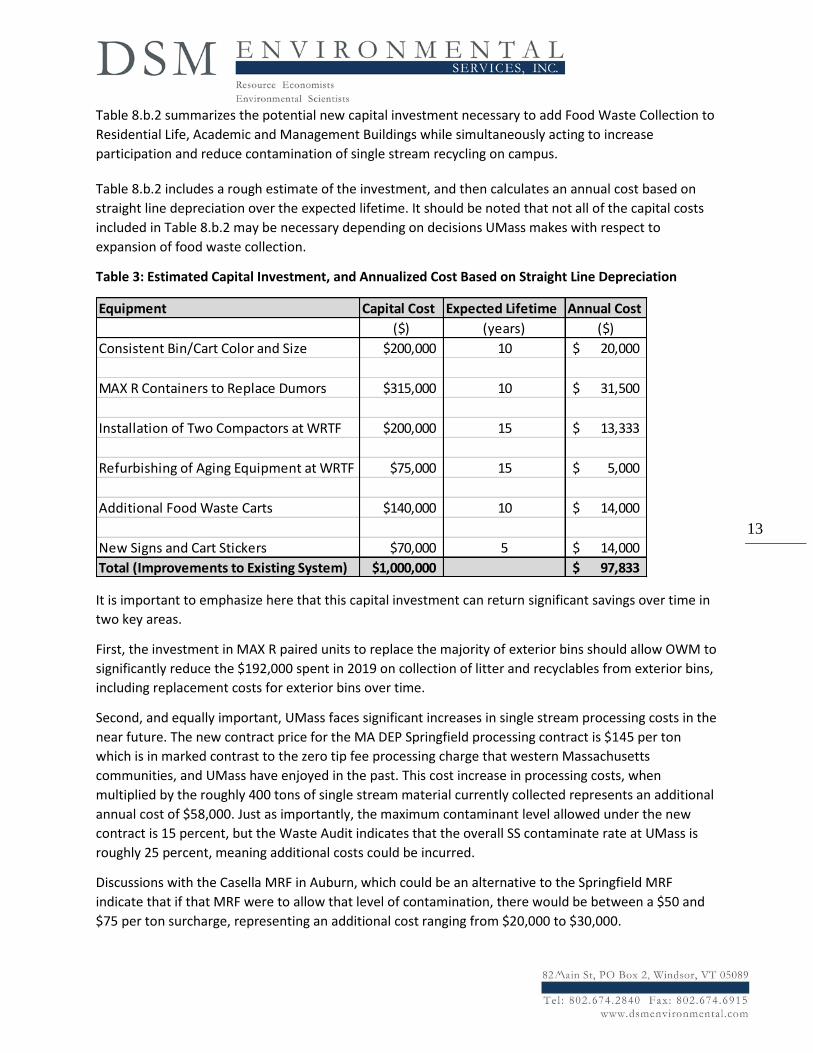
Table 8.b.2 summarizes the potential new capital investment necessary to add Food Waste Collection to
Residential Life, Academic and Management Buildings while simultaneously acting to increase
participation and reduce contamination of single stream recycling on campus.
Table 8.b.2 includes a rough estimate of the investment, and then calculates an annual cost based on
straight line depreciation over the expected lifetime. It should be noted that not all of the capital costs
included in Table 8.b.2 may be necessary depending on decisions UMass makes with respect to
expansion of food waste collection.
Table 3: Estimated Capital Investment, and Annualized Cost Based on Straight Line Depreciation
It is important to emphasize here that this capital investment can return significant savings over time in
two key areas.
First, the investment in MAX R paired units to replace the majority of exterior bins should allow OWM to
significantly reduce the $192,000 spent in 2019 on collection of litter and recyclables from exterior bins,
including replacement costs for exterior bins over time.
Second, and equally important, UMass faces significant increases in single stream processing costs in the
near future. The new contract price for the MA DEP Springfield processing contract is $145 per ton
which is in marked contrast to the zero tip fee processing charge that western Massachusetts
communities, and UMass have enjoyed in the past. This cost increase in processing costs, when
multiplied by the roughly 400 tons of single stream material currently collected represents an additional
annual cost of $58,000. Just as importantly, the maximum contaminant level allowed under the new
contract is 15 percent, but the Waste Audit indicates that the overall SS contaminate rate at UMass is
roughly 25 percent, meaning additional costs could be incurred.
Discussions with the Casella MRF in Auburn, which could be an alternative to the Springfield MRF
indicate that if that MRF were to allow that level of contamination, there would be between a $50 and
$75 per ton surcharge, representing an additional cost ranging from $20,000 to $30,000.
Equipment Capital Cost Expected Lifetime Annual Cost
($) (years) ($)
Consistent Bin/Cart Color and Size $200,000 10 20,000$
MAX R Containers to Replace Dumors $315,000 10 31,500$
Installation of Two Compactors at WRTF $200,000 15 13,333$
Refurbishing of Aging Equipment at WRTF $75,000 15 5,000$
Additional Food Waste Carts $140,000 10 14,000$
New Signs and Cart Stickers $70,000 5 14,000$
Total (Improvements to Existing System) $1,000,000 97,833$
14
Similarly, Martin Farm has indicated that if the newly collected food waste is more contaminated than
the existing food waste delivered from UMass, there will be a surcharge of roughly $20 per ton for this
food waste processing. Multiplying times 250 new tons of food waste equals an additional $5,000 per
year in food waste composting costs.
Most importantly, UMass faces the possibility of losing access to both the single stream MRFs and
Martin Farm if it cannot significantly reduce contamination of single stream and maintain a clean food
waste stream. This is why the investment in containers and signage is critical.