Embed Size (px)
Citation preview

Task 1.9 (5B): Develop a Model of Photovoltaic
Energy Systems for IRW Block
PI: Prof. Dionysios AliprantisRA: Chengrui Cai
UC Davis, CAMay 13, 2013
D. C. Aliprantis, C. Cai (ECpE, ISU) ARPA-E Project Meeting May 13, 2013 1 / 22
Overview
Task description:Develop a model for a photovoltaic (PV) energy system, eitherof the residential rooftop or the large utility-size type. This PVsystem will be represented using an appropriate physics-basedmodel, e.g., a stochastic model that captures its physicalcharacteristics appropriately.
Milestone:The (sampled) distributions of stochastic process model matchhistorical data within 10% on the first two distributionalmoments.
Task progress: 100% complete.
Notes:1. Questions raised in the last meeting2. Use of historical irradiance data
D. C. Aliprantis, C. Cai (ECpE, ISU) ARPA-E Project Meeting May 13, 2013 2 / 22

Overview
What do we want to achieve?
50 scenarios of aggregated hourly PV power (MW) for eachISO-NE load zone (bus) on each day in 2011
◮ Hourly solar irradiance time series for all PV systems◮ Locations and rated capacities of all PV systems◮ Irradiance-to-electric power conversion model
PV power scenarios consistent with the wind power and loadscenarios
◮ From the same weather model◮ With same scenario probability
D. C. Aliprantis, C. Cai (ECpE, ISU) ARPA-E Project Meeting May 13, 2013 3 / 22

Overview
Data and technical approach
What resources are we using?
3TIER provided weather scenarios for 2011
SolarAnywhere irradiance database1 (freely available)
NREL OpenPV database2 (freely available)
Technical approach:
Irradiance scenario development
PV siting information
Irradiance-to-electric power conversion model
1solaranywhere.com
2openpv.nrel.gov
D. C. Aliprantis, C. Cai (ECpE, ISU) ARPA-E Project Meeting May 13, 2013 4 / 22
Technical approach Irradiance scenario development
Irradiance scenario development
D. C. Aliprantis, C. Cai (ECpE, ISU) ARPA-E Project Meeting May 13, 2013 5 / 22

Technical approach Irradiance scenario development
Weather scenarios provided by 3TIERLocations of 8 airports
50 scenarios for each day
Meteorological variables:◮ global horizontal irradiance◮ ground level wind speed◮ dew-point, temperature◮ clearness index, pressure
ID Location Latitude LongitudeKBDL Hartford, CT 41.9391451◦ N 72.6833713◦ WKBDR Bridgeport, CT 41.1634722◦ N 73.1261667◦ WKBOS Boston, MA 42.3629722◦ N 71.0064167◦ WKBTV Burlington, VT 44.4718611◦ N 73.1532778◦ WKCON Concord, NH 43.2027222◦ N 71.5022778◦ WKORH Worcester, MA 42.2671389◦ N 71.8756111◦ WKPVD Providence, RI 41.7239992◦ N 71.4282211◦ WKPWM Portland, ME 43.6456435◦ N 70.3086164◦ W
D. C. Aliprantis, C. Cai (ECpE, ISU) ARPA-E Project Meeting May 13, 2013 6 / 22

Technical approach Irradiance scenario development
Irradiance scenarios and probabilities
4 8 12 16 20 240
100
200
300
400
500
Hour
GH
I (W
/m2)
Sc #1
Sc #2
Sc #3
Sc #4
Sc #5
Sc #6
Sc #7
Sc #8
Sc #9
Sc #10
10 20 30 40 500
0.02
0.04
0.06
0.08
0.1
0.12
Scenario #
Pro
bab
ilit
y(a) (b)
An example of the 3TIER solar irradiance scenarios for Hartford, CT for Jan. 2nd,2011. The first 10 scenarios with the highest probability are plotted in (a) withvarying line thickness, according to the probability of occurrence shown in (b).
D. C. Aliprantis, C. Cai (ECpE, ISU) ARPA-E Project Meeting May 13, 2013 7 / 22

Technical approach Irradiance scenario development
SolarAnywhere irradiance database
Hourly irradiance data:◮ global horizontal irradiance (GHI)◮ direct normal irradiance (DNI)◮ diffuse horizontal irradiance (DHI)
Entire U.S. from 1998 to 2009, i.e., 4383 days, with a spatialresolution of 0.1◦ (around 10 km) for both latitude and longitude
D. C. Aliprantis, C. Cai (ECpE, ISU) ARPA-E Project Meeting May 13, 2013 8 / 22

Technical approach Irradiance scenario development
Match the SolarAnywhere with 3TIER dataTo identify “similar” days from the SolarAnywhere database such that the solar irradiance(specifically the global horizontal irradiance) pattern over these 8 locations is “close” to the3TIER scenarios.
Algorithm 1 The solar scenario generation algorithm for a particular day D
1: input:2: T : 24 × 8× 50 matrix3: S : 24× 2837 × 4383 matrix4: output:5: I : 50× 1 vector6: variable:7: E: 50× 4383 matrix8: for j ← 1 to 50 do9: for k ← 1 to 4383 do
10: Ej,k =∑8
i=1
(
‖T:,i,j − S:,idx(i),k‖2/‖T:,i,j‖2)
/8
11: end for12: Ij = argmin
k∈[1,4383]
Ej,k
13: end for
note:
1. T:,i,j is the vector of 24hours of GHI data of i-th lo-cation for j-th scenario in the3TIER data.
2. symbol “:” in the subscriptmeans the entire data on thatdimension of the matrix.
3. idx(i) is the index of the i-thlocation in the SolarAnywheredata.
D. C. Aliprantis, C. Cai (ECpE, ISU) ARPA-E Project Meeting May 13, 2013 9 / 22

Technical approach Irradiance scenario development
8 columns (locations)
24
row
s(h
ours
)50
pag
es(s
c.)
T:,i,j
2837 columns (locations)
24
row
s(h
ours
)
4383
pag
es(d
ays)
S:,idx(i),k
3TIER SolarAnywhere
Averaged error:
Ej,k = 18
∑8i=1
‖T:,i,j−S:,idx(i),k‖2‖T:,i,j‖2
Selected day:
Ij = argmink∈[1,4383]
Ej,k
D. C. Aliprantis, C. Cai (ECpE, ISU) ARPA-E Project Meeting May 13, 2013 10 / 22

Technical approach Solar irradiance scenario generation
4 8 12 16 20 240
250
500
KBDL
4 8 12 16 20 240
250
500
KBDR
4 8 12 16 20 240
250
500
KBOS
4 8 12 16 20 240
250
500
KBTV
4 8 12 16 20 240
250
500
KCON
4 8 12 16 20 240
250
500
KORH
4 8 12 16 20 240
250
500
KPVD
4 8 12 16 20 240
250
500
KPWM
4 8 12 16 20 240
250
500
KBDL
4 8 12 16 20 240
250
500
KBDR
4 8 12 16 20 240
250
500
KBOS
4 8 12 16 20 240
250
500
KBTV
4 8 12 16 20 240
250
500
KCON
4 8 12 16 20 240
250
500
KORH
4 8 12 16 20 240
250
500
KPVD
4 8 12 16 20 240
250
500
KPWM
Clear day scenario Cloudy day scenarioG
HI
(W/m
2)
GH
I(W
/m
2)
Red: SolarAnywhere
Blue: 3TIER
D. C. Aliprantis, C. Cai (ECpE, ISU) ARPA-E Project Meeting May 13, 2013 11 / 22

Technical approach PV siting information
PV siting information
D. C. Aliprantis, C. Cai (ECpE, ISU) ARPA-E Project Meeting May 13, 2013 12 / 22

Technical approach PV siting information
NREL OpenPV database of PV system info in US
Capital cost
Rated capacity
Location (latitude and longitude)
D. C. Aliprantis, C. Cai (ECpE, ISU) ARPA-E Project Meeting May 13, 2013 13 / 22
Technical approach PV siting information
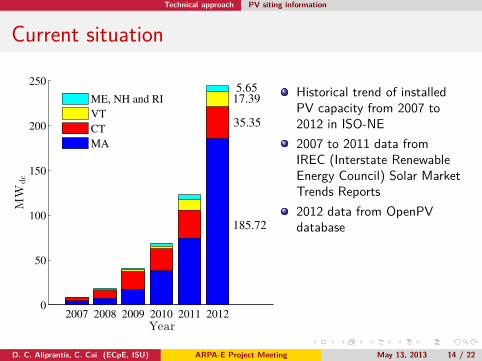
Current situation
2007 2008 2009 2010 2011 20120
50
100
150
200
250
Year
MW
dc
ME, NH and RI
VT
CT
MA
185.72
35.35
17.395.65 Historical trend of installed
PV capacity from 2007 to2012 in ISO-NE
2007 to 2011 data fromIREC (Interstate RenewableEnergy Council) Solar MarketTrends Reports
2012 data from OpenPVdatabase
D. C. Aliprantis, C. Cai (ECpE, ISU) ARPA-E Project Meeting May 13, 2013 14 / 22
Technical approach PV siting information
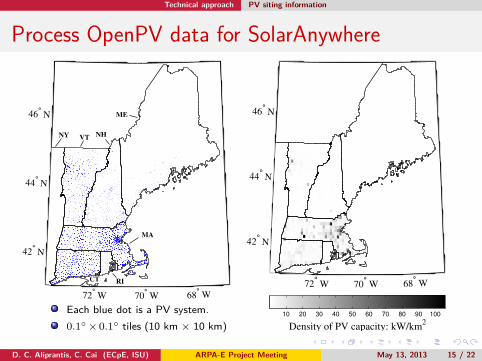
Process OpenPV data for SolarAnywhere
72° W 70
° W 68
° W
42° N
44° N
46° N
NY VTNH
ME
MA
RICT 72
° W 70
° W 68
° W
42° N
44° N
46° N
Density of PV capacity: kW/km2
10 20 30 40 50 60 70 80 90 100Each blue dot is a PV system.
0.1◦× 0.1◦ tiles (10 km × 10 km)
D. C. Aliprantis, C. Cai (ECpE, ISU) ARPA-E Project Meeting May 13, 2013 15 / 22
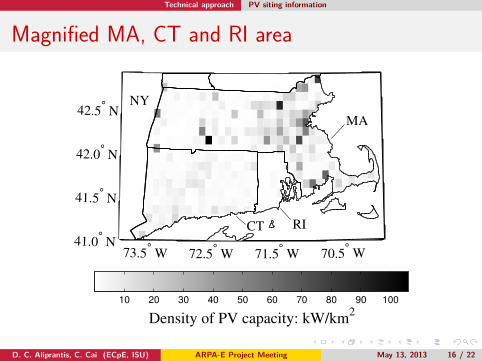
Technical approach PV siting information
Magnified MA, CT and RI area
73.5° W 72.5
° W 71.5
° W 70.5
° W
41.0° N
41.5° N
42.0° N
42.5° N
Density of PV capacity: kW/km2
10 20 30 40 50 60 70 80 90 100
CT RI
MA
NY
D. C. Aliprantis, C. Cai (ECpE, ISU) ARPA-E Project Meeting May 13, 2013 16 / 22

Technical approach Irradiance-to-electric power conversion model
Irradiance-to-electric power conversion model
D. C. Aliprantis, C. Cai (ECpE, ISU) ARPA-E Project Meeting May 13, 2013 17 / 22

Technical approach Irradiance-to-electric power conversion model
From irradiance to electric power
ISO-NE 8 load zonesSource: www.iso-ne.com
−74 −73 −72 −71 −70 −69 −68 −6741
42
43
44
45
46
47
48
Longitude (degrees)
Lat
itu
de
(deg
rees
)
Each point is the center of a tile.
D. C. Aliprantis, C. Cai (ECpE, ISU) ARPA-E Project Meeting May 13, 2013 18 / 22

Technical approach Irradiance-to-electric power conversion model
Power conversion model
P = C · η ·
G
Gn
P : hourly average electric power in MWAC generated by PVsystems in a tile
C : total PV capacity in MWDC in a tile (from OpenPV)
η : PV derating percentage3 (e.g., wiring losses, shading,aging, dirt, etc)
G : hourly average solar irradiance incident on the PV arrays inW/m2 (function of DNI and DHI from SolarAnywhere)
Gn : STC (standard test condition) constant of 1000 W/m2
3default value is 0.77, as suggested by NREL PVWatts model.
D. C. Aliprantis, C. Cai (ECpE, ISU) ARPA-E Project Meeting May 13, 2013 19 / 22

Technical approach Irradiance-to-electric power conversion model
Aggregated PV power for each load zone
4 8 12 16 20 240
0.20.40.60.8
Maine
4 8 12 16 20 240
0.51
1.52
2.5
New Hampshire
4 8 12 16 20 240
3
6
9
Vermont
4 8 12 16 20 2407
14212835
WC Mass
4 8 12 16 20 240
15
30
45
NE Mass
4 8 12 16 20 2405
10152025
SE Mass
4 8 12 16 20 2405
101520
Connecticut
4 8 12 16 20 240
0.5
1
1.5
Rhode Island
4 8 12 16 20 240
0.20.40.60.8
Maine
4 8 12 16 20 240
0.51
1.52
2.5
New Hampshire
4 8 12 16 20 240
3
6
9
Vermont
4 8 12 16 20 2407
14212835
WC Mass
4 8 12 16 20 240
15
30
45
NE Mass
4 8 12 16 20 2405
10152025
SE Mass
4 8 12 16 20 2405
101520
Connecticut
4 8 12 16 20 240
0.5
1
1.5
Rhode Island
A winter clear day A summer cloudy day
MW
AC
MW
AC
D. C. Aliprantis, C. Cai (ECpE, ISU) ARPA-E Project Meeting May 13, 2013 20 / 22
Conclusion
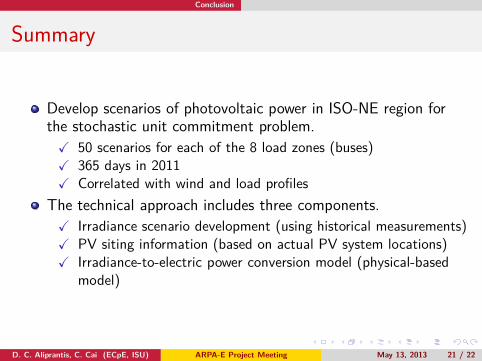
Summary
Develop scenarios of photovoltaic power in ISO-NE region forthe stochastic unit commitment problem.
X 50 scenarios for each of the 8 load zones (buses)X 365 days in 2011X Correlated with wind and load profiles
The technical approach includes three components.
X Irradiance scenario development (using historical measurements)X PV siting information (based on actual PV system locations)X Irradiance-to-electric power conversion model (physical-based
model)
D. C. Aliprantis, C. Cai (ECpE, ISU) ARPA-E Project Meeting May 13, 2013 21 / 22

Q & A
Thank You
Questions?
Contacts:Prof. Dionysios Aliprantis ([email protected])
Chengrui Cai ([email protected])
D. C. Aliprantis, C. Cai (ECpE, ISU) ARPA-E Project Meeting May 13, 2013 22 / 22