Embed Size (px)
Citation preview

TECHNICAL REPORT 2013
TAS GOLD COPPER PROPERTY Inzana Lake Area, Fort St. James, B.C.
Omineca Mining Division
BCGS Map 093K099 NTS Map 093K16W Latitude 54º 54' 17" N Longitude 124º 18' 38" W
UTM 10 (NAD 83) Northing 6084975 Easting 415970
Prepared for:
RICH ROCK RESOURCES INC. and INZANA METALS INC.
Suite 413, Bentall 3, 595 Burrard Street
P.O. Box 49096. Vancouver, British Columbia,
V7X 1G4 Canada
Tel: (604) 569-0010 Fax: (604) 569-0039
prepared by
B.J. PRICE GEOLOGICAL CONSULTANTS INC.
Barry J. Price, M.Sc., P.Geo.
Ste. 831 - 470 Granville Street, Vancouver BC., V6C 1V5
Tel 604-682-1501 Fax: 604-642-4217
FEBRUARY 15, 2013

Technical Report Update 2013. Tas Gold Copper Property BC
B.J PRICE GEOLOGICAL CONSULTANTS INC. VANCOUVER B.C 604-682-1501 FEBRUARY 2013
Page ii
2013 TECHNICAL REPORT, TAS GOLD COPPER PROPERTY Inzana Lake, Fort St. James BC. Omineca M.D.
RICH ROCK RESOURCES INC. and INZANA METALS INC.
SUMMARY
The author was retained by Rich Rock Resources Inc. (Rich Rock) and Inzana Metals Inc. (Inzana) to update a NI 43-101 compliant Technical Report originally prepared March 2012 for the Tas gold copper porphyry property situated near Inzana Lake, Fort St. James area British Columbia (the “Property”). This current Technical report includes geophysical work completed by Meridian Mapping (Dunlop 2011), and SJ Geophysics from 2011 to 2012 (Witter, 2011, Tryon 2012) which was not included in the previous report. Inzana, a wholly owned subsidiary of Rich Rock, purchased the property from Rich Rock in February 2012. The Tas gold copper property (17 mineral claim titles totaling 6136.5 hectares) is located in north-central British Columbia 50 kilometers north of Fort St. James adjacent to Inzana Lake. The Property is situated within the Quesnel Terrane, part of the Intermontane Belt. The Takla Group host unit is composed of late Triassic to early Jurassic volcanics and sediments with alkalic coeval plutons. The property lies within a strongly mineralized belt which includes several porphyry copper-gold deposits, many of which have been drilled extensively with continuing exploration. Several zones are identified to date:
the original Freegold showing, a quartz-carbonate altered zone with visible gold, and the Ridge Zone, encompassing several sub-zones, 300 meters north where much of the exploration work to date is complete.
The Ridge Zone is an area approximately 1200 x 600 meters containing coincident copper-gold soil anomalies, a large induced polarization anomaly and a broad zone of biotite-rich potassic alteration developed in altered and hornfelsed tuff cut by swarms of northeast striking porphyry dikes and intrusion breccia. Compilation of the large Noranda database this year established a much larger, bulk tonnage gold-copper target on the Ridge Zone than previously thought and a new southeast target some 800 meters long sourced from a previously unknown intrusion breccia.
Two bulk samples mined from the East Zone were trucked to Westmin Silbak Premier Mines north of Stewart. The Mill determined the samples to be 16.54 tonnes of 51.20 gpt Au (from sulphide mineralization) and 15.888 tonnes of 19.07 gpt Au (from magnetite mineralization). Gold recovery was said to be 93.8% using cyanide leach. The ore contained no deleterious elements and no penalties were assessed.

Technical Report Update 2013. Tas Gold Copper Property BC
B.J PRICE GEOLOGICAL CONSULTANTS INC. VANCOUVER B.C 604-682-1501 FEBRUARY 2013
Page iii
Black Swan Resources Ltd. completed preliminary (resource) estimations in 1988-89 calculations on the East and West Zones. Drill inferred tonnage (1988) is 54,000 tonnes @ 0.2 opt gold in the East Zone and 32,700 tonnes of 0.2 opt gold in the West Zone for a total of 86,700 tonnes @ 0.2 opt gold (6.86 grams/tonne). Independently, R. Somerville in 1989 estimated resources (then called “Ore Reserves”) at Tas as follows:
ZONE PROBABLE GRADE POSSIBLE GRADE
Tons Oz/ton Au Tons Oz/Ton Au
Mid 3,780 0.62 4,000 0.25
19 3,000 0.45
West 18,980 0.17 5,000 0.20
East 20,350 0.20 5,000 0.20
TOTAL 43,110 17,000
Neither the company nor the author has verified the above estimations, which are preliminary and historical and are not construed to be a current resource, and should not be relied upon. Current work is centered on gold-copper bulk tonnage target some 2000 x 1000 meters in area. Accordingly, the Company resolved to focus its exploration efforts on further developing the historically outlined high-grade zones and to test the porphyry style mineral deposit potential. The Property has sufficient area for exploration and development. Rich Rock has a permit for exploration of the property. There are no conflicting surface rights and no known environmental or social issues known to the author attached to the property. The company maintains a good relationship with the local First Nations group. Two main showing areas are known as the Freegold Zone and the Ridge Zone.
Soil sampling geochemistry shows highly elevated gold and copper in soils overlying the Ridge Zone. The copper anomaly with >300 ppm. encompasses an area 2500 x 1000m having a central area of high gold 1800 x 800m. These anomalies overlie gold mineralized rocks of the Ridge Zone prospects. In addition, a new copper-in-soil target - the Southeast zone covers an area roughly 1100 x 300 meters. These dimensions suggest widely disseminated porphyry style mineralization in addition to the more local high gold tenor zones developed to date on the Ridge Zone. The presence of widespread copper-gold geochemical targets suggests additional porphyry style targets may exist on the property. In June 2010, an airborne geophysical survey was completed over the central part of the Tas property. Canadian Mining Geophysics Ltd. (CMG) completed a helicopter-borne survey of 110 line-kilometers including magnetic gradiometer, VLF-EM &radiometric surveys, all described in detail in the 2010 Technical report (Price 2010). Work completed by Rich Rock in 2011 consisted of line cutting, 36 km of ground magnetic surveys and 32 km of 3D IP (Induced Polarization) conducted by SJ Geophysics. The Southeast Zone was identified as a

Technical Report Update 2013. Tas Gold Copper Property BC
B.J PRICE GEOLOGICAL CONSULTANTS INC. VANCOUVER B.C 604-682-1501 FEBRUARY 2013
Page iv
moderate chargeability anomaly (40ms) extending to depth along with a large chargeability high (>40ms) and resistivity low extending throughout the central part of the grid area. Work completed in 2012 included infill line cutting and marking and infill magnetic and IP surveys. The 2012 Tas grid acts as an infill to a larger and coarser grid surveyed by the same company (SJ Geophysics) in 2011. The purpose of the smaller dipole and line spacing of the 2012 survey was to provide better near-surface resolution of the features of interest. Near the Ridge Zone mineralization, a deep chargeability anomaly (>50ms) immediately north of the zone forms a roughly circular chargeability anomaly enclosing a central chargeability low centered on the Mid Zone, possibly a deep porphyry target zone comprising alteration and low pyrite content coincident with near-surface potassic alteration and a K radiometric anomaly. Dr. Peter Fox has developed a new hypothetical genetic model for the property based on interpretation of the geophysical surveys (See Appendix I). The geological history of the Tas porphyry deduced from the combined 2011 and 2012 induced polarization surveys is complex. It includes:
development of an early porphyry copper-gold system associated with dike emplacement
northward rotation of the dike-porphyry complex to the near horizontal
influx of low temperature, reducing regional fluids from the host rock (Inzana Lake Formation)
erosion of much of the dike complex leaving isolated remnants north of the Tas pluton. It is suggested that the original porphyry and related mineralization and attendant hydrothermal alteration was genetically related to emplacement of fluid-charged magma derived from the adjacent crystallizing Tas pluton, channeled into the evolving dike complex and subsequently developing a porphyry copper-gold mineralized system. Mineralized rocks, as expressed by current chargeability data (Fox 2012 and this report) now lie at surface and at depths of several hundred metres below thin erosion remnants of the dike unit more or less parallel to the dike contacts. The geological history of Tas porphyry as suggested above is similar to other copper-gold deposits, such as the Mt Milligan deposit to the east where the Rainbow dike there is a key feature of development of mineralization and hydrothermal alteration patterns. Other tilted and rotated porphyry deposits include Schaft Creek, Bingham, Yerrington, Butte, and San Manuel/Kalamzoo. RECOMMENDATIONS
A brief review of the airborne geophysical maps and new magnetic and 3 Dimensional IP data suggests numerous untested potassic radiometric, magnetic and IP targets exist. From a review of the surveys, the author, in consultation with Dr. Peter Fox, Ph.D, P.Eng., of Rich Rock, has selected 16 drill holes on various targets totaling 7,100 meters on the targets.

Technical Report Update 2013. Tas Gold Copper Property BC
B.J PRICE GEOLOGICAL CONSULTANTS INC. VANCOUVER B.C 604-682-1501 FEBRUARY 2013
Page v
The following recommendations are made:
Continue compilation of older data and maps, drill data and intercepts as the present author has done for the 2002 drill holes
Locate, re-log and resample all available core from past drilling, some of which was not split or assayed. Use a diamond saw to obtain core samples, or take the whole core if absolutely necessary (i.e. if core is in poor condition)
From this create a computerized drillhole database
Initiate drilling of geophysical and geochemical anomalies. Test the new radiometric, magnetic and 3D IP anomalies
Pursue the long mineralized gold-copper sections encountered in the 2002 drilling at the West Zone
Determine if the molybdenum signature is sourced in an intrusive porphyry at depth
Complete some deeper holes on the known targets
Maintain a typical QA/QC program on core sampling such as was done in 2002
If results warrant, initiate a resource mode and metallurgical testing There are two targets to focus upon:
1. The historical gold vein/shear mineralization 2. The porphyry copper gold target
The Phase I budget, with contingency and HST added has been estimated at $1,700,000. This would be followed, if results warrant, by a second phase of drill and other studies estimated to cost $3,050,000. Total for both phases would be $4,750,000. The budgets have been prepared with care, but the estimates should be revised when the various components are being set out for tender. The author does not guarantee that the above noted programs can be completed for the stated costs. Respectfully submitted ______________________________ B. J. Price Geological Consultants Inc. Barry James Price, M.Sc., P. Geo., Qualified Person, February 15, 2013

Technical Report Update 2013. Tas Gold Copper Property BC
B.J PRICE GEOLOGICAL CONSULTANTS INC. VANCOUVER B.C 604-682-1501 FEBRUARY 2013
Page vi
2013 TECHNICAL REPORT, TAS GOLD COPPER PROPERTY
Inzana Lake, Fort St. James BC. Omineca M.D.
RICH ROCK RESOURCES INC. and INZANA METALS INC.
TABLE OF CONTENTS
SUMMARY .................................................................................................................................................................................. II
RECOMMENDATIONS ................................................................................................................................................................ IV
2013 TECHNICAL REPORT, TAS GOLD COPPER PROPERTY .......................................................................................................... VI
TABLE OF CONTENTS ................................................................................................................................................................. VI
INTRODUCTION AND TERMS OF REFERENCE............................................................................................................................... 1
RELIANCE ON OTHER EXPERTS .................................................................................................................................................... 1
THE COMPANY............................................................................................................................................................................ 1
PROPERTY DESCRIPTION AND LOCATION ................................................................................................................................... 2
FIGURE 1. LOCATION MAP OF B.C. .............................................................................................................................................. 3
FIGURE 2. SKETCH OF CLAIMS AND GEOPHYSICAL GRID ............................................................................................................ 4
FIGURE 3. SKETCH OF CLAIMS AND MINERALIZED ZONES ......................................................................................................... 5
LOCATION .......................................................................................................................................................................................... 6 SALE AGREEMENT ............................................................................................................................................................................... 6 HALLERAN OPTION AGREEMENT ............................................................................................................................................................ 6
ACCESSIBILITY, CLIMATE, LOCAL RESOURCES, INFRASTRUCTURE AND PHYSIOGRAPHY .............................................................. 6
HISTORY ..................................................................................................................................................................................... 7
HISTORICAL ........................................................................................................................................................................................ 8 MINERAL PROCESSING AND METALLURGICAL TESTING: .............................................................................................................................. 8 HISTORICAL RESOURCE ESTIMATE ........................................................................................................................................................... 8 RECENT HISTORY ................................................................................................................................................................................. 9
GEOLOGICAL SETTING ................................................................................................................................................................. 9
REGIONAL GEOLOGY ............................................................................................................................................................................ 9 LOCAL GEOLOGY ............................................................................................................................................................................... 10
FIGURE 4. REGIONAL GEOLOGY (FOX, 2009) ............................................................................................................................ 11
DEPOSIT TYPES ......................................................................................................................................................................... 12
MINERALIZATION ..................................................................................................................................................................... 12
FIGURE 5. LOCAL GEOLOGY (FOX 2011) .................................................................................................................................... 13
EXPLORATION ........................................................................................................................................................................... 15
2010 EXPLORATION .......................................................................................................................................................................... 15 RADIOMETRIC SURVEY........................................................................................................................................................................ 15
FIGURE 6. LOCATION OF 2010 HELICOPTER GEOPHYSICAL SURVEY .......................................................................................... 16

Technical Report Update 2013. Tas Gold Copper Property BC
B.J PRICE GEOLOGICAL CONSULTANTS INC. VANCOUVER B.C 604-682-1501 FEBRUARY 2013
Page vii
FIGURE 7. RADIOMETRIC SURVEY 2010 .................................................................................................................................... 16
FIGURE 8. REGIONS OF INTEREST SELECTED BY CMG. 2010 ..................................................................................................... 18
FIGURE 9. GEOPHYSICAL GRID 2011 ......................................................................................................................................... 18
FIGURE 10. 2011 MAGNETIC INTERPRETATION ........................................................................................................................ 20
2011 MAGNETIC SURVEY ................................................................................................................................................................... 20 2011 INDUCED POLARIZATION SURVEY ................................................................................................................................................. 21
FIGURE 11. 2011 INTERPRETATION OF CIP CHARGEABILITY AT 350 M DEPTH .......................................................................... 22
INTERPRETATION ............................................................................................................................................................................... 22
2012 GEOPHYSICAL SURVEYS .................................................................................................................................................... 24
MAGNETIC SURVEY ................................................................................................................................................................... 24
IN-FILL IP SURVEY ..................................................................................................................................................................... 24
FIGURE 12. COMBINED 2011 AND 2012 GRIDS ......................................................................................................................... 26
FIGURE 13. COMBINED 2011-2012 MAGNETIC SURVEY PLAN .................................................................................................. 26
FIGURE 14. COMBINED GRIDS AND MAJOR GEOLOGICAL FEATURES 2012 ............................................................................... 28
FIGURE 15. 2012 CHARGEABILITY PLAN AT DEPTH 250 M BELOW SURFACE ............................................................................. 29
FIGURE 16. 2012 INTERPRETED RESISTIVITY 250 M BELOW AURFACE ...................................................................................... 29
FIGURE 17. 2012 ISOMETRIC VIEW OF INTERPRETED RESISTIVITY ANOMALIES ........................................................................ 31
DRILLING................................................................................................................................................................................... 31
SAMPLE PREPARATION, ANALYSES AND SECURITY ................................................................................................................... 32
DATA VERIFICATION ................................................................................................................................................................. 32
ADJACENT PROPERTIES ............................................................................................................................................................. 32
MINERAL PROCESSING AND METALLURGICAL TESTING ............................................................................................................ 32
MINERAL RESOURCE AND MINERAL RESERVE ESTIMATES ........................................................................................................ 32
OTHER RELEVANT DATA AND INFORMATION ........................................................................................................................... 32
INTERPRETATION AND CONCLUSIONS ...................................................................................................................................... 33
GENETIC MODEL ................................................................................................................................................................................ 34
RECOMMENDATIONS ............................................................................................................................................................... 35
FIGURE 18 GEOLOGICAL AND GEOPHYSICAL INTERPRETATION (FOX 2013) .............................................................................. 36
FIGURE 19. INTERPRETATION OF TARGETS FROM 2012 SURVEYSFIGURE 20. PRELIMINARY DRILL TARGETS FOR 2012 ........... 37
PROPOSED PROGRAM AND TARGETS ...................................................................................................................................................... 39
FIGURES 21 AND 22 EXAMPLES OF PROPOSED DRILL LOCATIONS (2012) .................................................................................. 40
SUGGESTED INITIAL BUDGET .................................................................................................................................................... 41
PHASE 1 .......................................................................................................................................................................................... 41 PHASE II .......................................................................................................................................................................................... 42

Technical Report Update 2013. Tas Gold Copper Property BC
B.J PRICE GEOLOGICAL CONSULTANTS INC. VANCOUVER B.C 604-682-1501 FEBRUARY 2013
Page viii
REFERENCES ............................................................................................................................................................................. 43
CERTIFICATE OF QUALIFIED PERSON BARRY J. PRICE, P. GEO. ................................................................................................. 45
QUALIFIED PERSON .................................................................................................................................................................. 45
APPENDIX I GENETIC MODEL AND GEOPHYSICAL INTERPRETATION 2013 ................................................................................. 46
FIGURE 1. GEOLOGICAL AND GEOPHYSICAL INTERPRETATION (2013) ...................................................................................... 47
FIGURE 2 TARGET ZONES (2013) ............................................................................................................................................... 48

Technical Report Update 2013. Tas Gold Copper Property BC
B.J PRICE GEOLOGICAL CONSULTANTS INC. VANCOUVER B.C 604-682-1501 FEBRUARY 2013
Page 1
2013 TECHNICAL REPORT - TAS GOLD COPPER PROPERTY Inzana Lake area, Fort St. James, BC.
Rich Rock Resources Inc. and Inzana Metals Inc.
INTRODUCTION AND TERMS OF REFERENCE
The author was retained by Rich Rock Resources Inc. (Rich Rock) and Inzana Metals Inc. (Inzana) to update a NI 43-101 compliant Technical Report for the Tas property originally completed in 2010. This current Technical Report includes geophysical work completed by Meridian Mapping (Dunlop 2011), and SJ Geophysics from 2011 to 2012 (Witter, 2011, Tryon 2012) which was not included in the previous report. Inzana, a wholly owned subsidiary of Rich Rock, purchased the property from Rich Rock in February 2012. The author inspected the property on June 16, 2010 accompanied by Derry Halleran, original property owner and Ken MacDonald, P.Geo., consultant based in Prince George BC. Because of the large amount of previous exploration data since 2008, this report must necessarily be a summary. Technical data from the 2008 limited program is omitted. The reader is referred to the original Technical Report for additional details. RELIANCE ON OTHER EXPERTS
In this report the author has reviewed several reports written by Dr. Peter Fox, Ph.D., P.Eng., an experienced and respected geological engineer and Senior Project Geologist for Rich Rock, including the report titled: Project Report, Tas Gold-Copper Property, Omineca Mining Division, dated January 30, 2009 and Assessment Reports for the work done in 2011 and 2012. The author reviewed geophysical reports by Dugald Dunlop, B.Sc. (Meridian Mapping) and Alex Tryon, B.Sc. (SJ Geophysics). Numerous other assessment reports by experienced geologists and engineers have also been referenced as are listed in the appropriate section entitled References. The present author is solely responsible for the conclusions, recommendations and suggested exploration budget in this report. THE COMPANY
Rich Rock and Inzana are both private companies. Eagle Peak has sold its Tas property, held under option from A.D. Halleran, prospector, to Rich Rock, and Rich Rock has sold its interest in the property to Inzana, which is a wholly-owned subsidiary of Rich Rock.

Technical Report Update 2013. Tas Gold Copper Property BC
B.J PRICE GEOLOGICAL CONSULTANTS INC. VANCOUVER B.C 604-682-1501 FEBRUARY 2013
Page 2
PROPERTY DESCRIPTION AND LOCATION
The following claims are registered in the name of Inzana Metals Inc. a subsidiary of Rich Rock Resources Inc. Claims and location are shown in Figures 1-3.
INZANA METALS INC.
TAS PROPERTY MINERAL TITLES
November 14 2012
Tenure Number
Claim Name Owner
Map Number Issue Date Good To Date Area (ha)
531596
264568 (100%) 093K 2006/apr/10 2015/dec/20 446.34
531598
264568 (100%) 093K 2006/apr/10 2015/dec/20 371.95
531600
264568 (100%) 093K 2006/apr/10 2015/dec/20 427.87
531603
264568 (100%) 093K 2006/apr/10 2015/dec/20 223.27
531606
264568 (100%) 093K 2006/apr/10 2015/dec/20 427.62
583517 TAS 4 264568 (100%) 093K 2008/may/02 2015/dec/20 446.524
583518 TAS 5 264568 (100%) 093K 2008/may/02 2015/dec/20 428.064
583519 TAS 6 264568 (100%) 093K 2008/may/02 2015/dec/20 409.31
594222 TASLIN 264568 (100%) 093K 2008/nov/13 2015/dec/20 260.28
596971 TASLIN 264568 (100%) 093K 2009/jan/04 2015/dec/20 464.72
596972 TASLIN-2 264568 (100%) 093K 2009/jan/04 2015/dec/20 185.84
596973 TASLIN N 264568 (100%) 093K 2009/jan/04 2015/dec/20 464.65
598042 TASLIN-3 264568 (100%) 093K 2009/jan/26 2015/dec/20 223.12
598043 TASLIN-4 264568 (100%) 093K 2009/jan/26 2015/dec/20 464.60
598044 TASLIN-5 264568 (100%) 093K 2009/jan/26 2015/dec/20 334.53
601410 TAZ NE 264568 (100%) 093K 2009/mar/20 2015/dec/20 278.83
601737 TAS E 2 264568 (100%) 093K 2009/mar/27 2015/dec/20 278.98
17 titles
6136.51
In total the two claim groups cover 17 titles with 6136.5 hectares. The claims are not surveyed but are referenced to geographic points of Latitude/Longitude and UTM coordinates which may be precisely located in the field. The claims have adequate land for exploration and development purposes. The claims cover a number of historical gold and copper showings as described elsewhere in this report. The property has sufficient area for exploration and development. Rich Rock has obtained a permit (No MX 13-232) for forthcoming exploration and has filed a reclamation bond of $36,000. There are no known conflicting surface rights and no environmental or social issues known to the writer. Two main showing areas are known as the Freegold Zone and the Ridge Zone, which has a number of subzones. There is one alien claim within the boundaries of the Tas claims (Title 550959). Rich Rock has fulfilled all the terms of the pre-existing option with A.D. Halleran for the original claims. An infill magnetometer and IP survey were recently completed and results were recently obtained which has led to the current revision of this report. The claims are in good standing to December 20, 2015 before which date additional work must be completed.

Technical Report Update 2013. Tas Gold Copper Property BC
B.J PRICE GEOLOGICAL CONSULTANTS INC. VANCOUVER B.C 604-682-1501 FEBRUARY 2013
Page 3
FIGURE 1. LOCATION MAP OF B.C.

Technical Report Update 2013. Tas Gold Copper Property BC
B.J PRICE GEOLOGICAL CONSULTANTS INC. VANCOUVER B.C 604-682-1501 FEBRUARY 2013
Page 4
FIGURE 2. SKETCH OF CLAIMS AND GEOPHYSICAL GRID

Technical Report Update 2013. Tas Gold Copper Property BC
B.J PRICE GEOLOGICAL CONSULTANTS INC. VANCOUVER B.C 604-682-1501 FEBRUARY 2013
Page 5
FIGURE 3. SKETCH OF CLAIMS AND MINERALIZED ZONES

Technical Report Update 2013. Tas Gold Copper Property BC
B.J PRICE GEOLOGICAL CONSULTANTS INC. VANCOUVER B.C 604-682-1501 FEBRUARY 2013
Page 6
Location
The Tas Property is situated 50 km almost due north of the town of Fort St. James, in North-Central British Columbia on map sheet 93-K-16W. The property is located in the Omineca Mining Division, approximately 7 kilometers southeast of the eastern end of Inzana Lake on Tasincheko Creek, in an area informally known at Butchers Flat. Distance (straight line) to Prince George (SE) is about 150 kilometers and to Mackenzie (NE) about 90 kilometers. Geographical coordinates of the center of the property are approximately UTM 10N: 415542 East and 6084914 m N., or in Latitude and Longitude: 54° 54' 15" N, 124° 19' 2" W. Location is shown in Figures 1-3.
Sale Agreement
Rich Rock has sold 100% of its interest in the property to its wholly owned subsidiary, Inzana Metals Inc. a private company (Incorporation Number BC0916230) with Address 413-595 Burrard St., PO Box 49046 Vancouver BC, Canada V7X 1G4 (FMC Certificate Number 110180761).
Halleran Option Agreement
The five original claims were optioned from prospector A.D. Halleran of Fort St. James by Eagle Peak Resources Inc. (“Eagle Peak”) on February 29 2008 as covered by a formal agreement amended February 17, 2009. Eagle Peak has earned a 100% interest from Halleran by a series of cash payments and work obligations. The purchase agreement between Eagle Peak Resources Ltd and Rich Rock allowed Eagle Peak to transfer its rights and obligations under the option agreement and a further agreement dated February 28, 2012 transferred Rich Rock’s rights and obligations to Inzana. Inzana has exercised its option to purchase. In addition to the Halleran tenures, a 100% in 12 mineral tenures was also transferred in the various purchase agreements. The five original claims are subject to the greater of a 3% NSR to A.D. Halleran, or payments of $50,000 per year with all or a portion of a 2% of the NSR purchasable for $500,000 for each one-half of 1%. ACCESSIBILITY, CLIMATE, LOCAL RESOURCES, INFRASTRUCTURE AND PHYSIOGRAPHY
Access to the property is via the Germansen North Road and then west on the Inzana Lake Forestry Road for 10 kilometers. A network of logging roads covers the area, but the author has no information on their condition. Fort St. James can be reached by one long day driving time from Vancouver, or in 3-4 hours from Prince George. Four wheel drive vehicles are recommended. For extended programs, an exploration camp with comfortable accommodation, and reliable communication is suggested. Climate of the area is typical of north-central BC with long winters and warm summers. Practically, work should be done between May and October, although drilling could be done earlier and later, dependent on snow conditions.
Technical Report Update 2013. Tas Gold Copper Property BC
B.J PRICE GEOLOGICAL CONSULTANTS INC. VANCOUVER B.C 604-682-1501 FEBRUARY 2013
Page 7
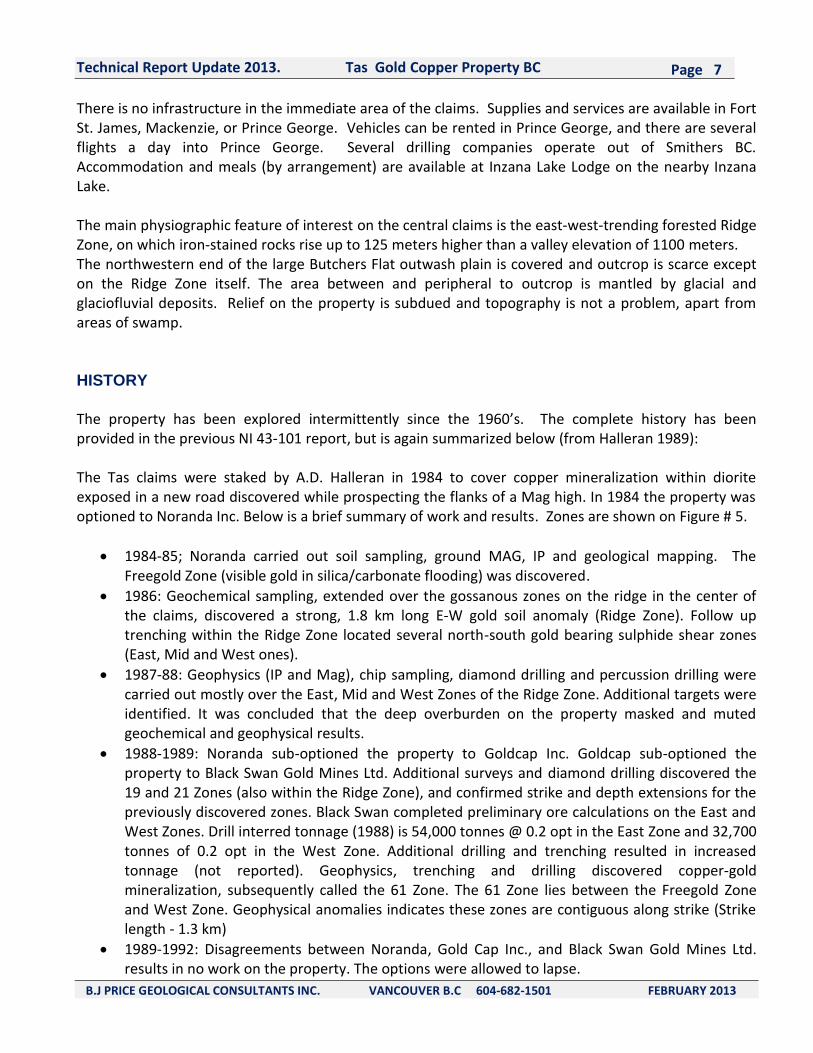
There is no infrastructure in the immediate area of the claims. Supplies and services are available in Fort St. James, Mackenzie, or Prince George. Vehicles can be rented in Prince George, and there are several flights a day into Prince George. Several drilling companies operate out of Smithers BC. Accommodation and meals (by arrangement) are available at Inzana Lake Lodge on the nearby Inzana Lake. The main physiographic feature of interest on the central claims is the east-west-trending forested Ridge Zone, on which iron-stained rocks rise up to 125 meters higher than a valley elevation of 1100 meters. The northwestern end of the large Butchers Flat outwash plain is covered and outcrop is scarce except on the Ridge Zone itself. The area between and peripheral to outcrop is mantled by glacial and glaciofluvial deposits. Relief on the property is subdued and topography is not a problem, apart from areas of swamp. HISTORY
The property has been explored intermittently since the 1960’s. The complete history has been provided in the previous NI 43-101 report, but is again summarized below (from Halleran 1989): The Tas claims were staked by A.D. Halleran in 1984 to cover copper mineralization within diorite exposed in a new road discovered while prospecting the flanks of a Mag high. In 1984 the property was optioned to Noranda Inc. Below is a brief summary of work and results. Zones are shown on Figure # 5.
1984-85; Noranda carried out soil sampling, ground MAG, IP and geological mapping. The Freegold Zone (visible gold in silica/carbonate flooding) was discovered.
1986: Geochemical sampling, extended over the gossanous zones on the ridge in the center of the claims, discovered a strong, 1.8 km long E-W gold soil anomaly (Ridge Zone). Follow up trenching within the Ridge Zone located several north-south gold bearing sulphide shear zones (East, Mid and West ones).
1987-88: Geophysics (IP and Mag), chip sampling, diamond drilling and percussion drilling were carried out mostly over the East, Mid and West Zones of the Ridge Zone. Additional targets were identified. It was concluded that the deep overburden on the property masked and muted geochemical and geophysical results.
1988-1989: Noranda sub-optioned the property to Goldcap Inc. Goldcap sub-optioned the property to Black Swan Gold Mines Ltd. Additional surveys and diamond drilling discovered the 19 and 21 Zones (also within the Ridge Zone), and confirmed strike and depth extensions for the previously discovered zones. Black Swan completed preliminary ore calculations on the East and West Zones. Drill interred tonnage (1988) is 54,000 tonnes @ 0.2 opt in the East Zone and 32,700 tonnes of 0.2 opt in the West Zone. Additional drilling and trenching resulted in increased tonnage (not reported). Geophysics, trenching and drilling discovered copper-gold mineralization, subsequently called the 61 Zone. The 61 Zone lies between the Freegold Zone and West Zone. Geophysical anomalies indicates these zones are contiguous along strike (Strike length - 1.3 km)
1989-1992: Disagreements between Noranda, Gold Cap Inc., and Black Swan Gold Mines Ltd. results in no work on the property. The options were allowed to lapse.

Technical Report Update 2013. Tas Gold Copper Property BC
B.J PRICE GEOLOGICAL CONSULTANTS INC. VANCOUVER B.C 604-682-1501 FEBRUARY 2013
Page 8
1993: A.D. Halleran blasted two bulk samples (32.5 tonnes) from the East Zone (averaged 35.46 g/tonne). Milling by Silbak Premier Mines resulted in 93.8% gold recovery (1150 g of gold) with no penalties.
1999: Omni Resources optioned the property and drilled approximately 700 meters of diamond drilling. Drilling by Omni discovered a new-bulk tonnage Au zone, just northeast of the West Zone. This zone, semi-massive to massive sulphides, is theorized to run east-west parallel to the 1.1 kilometer east-west gossanous ridge (nearly flat lying).
2002: Navasota drilled 1270.11 meters in 7 diamond drill holes. Navasota extended the West Zone and discovered a new zone of disseminated to massive sulphides with true widths in excess of 50 meters and tested for 200 meters along section. Massive sulphides were encountered in all drill holes. Visible gold was noted in two areas of silica flooding (similar to the Freegold Zone). Navasota stated "The presence of low-grade (0.3 to 1.0 g/tonne) gold over large intercepts (16m) highlights the potential for bulk tonnage open pittable mineralization in the West Zone". Navasota re-assayed sections of older drill core not assayed and found previously unreported gold intercepts (ex. 1m of 0.5 opt) and noticed visible gold in silica flooding within the older core.
Historical Mineral Processing and Metallurgical Testing
Two bulk samples mined from the East Zone were trucked to Westmin Silbak Premier Mines north of Stewart. The Mill determined the samples to be 16.54 tonnes of 51.20 gpt Au (from sulphide mineralization) and 15.888 tonnes of 19.07 gpt Au (from magnetite mineralization). Gold recovery was said to be 93.8% using cyanide leach. The ore contained no deleterious elements and no penalties were assessed.
Historical Resource Estimate
Black Swan Resources Ltd. completed preliminary (resource) estimations in 1988-89 calculations on the East and West Zones. Drill inferred tonnage (1988) is 54,000 tonnes @ 0.2 opt gold in the East Zone and 32,700 tonnes of 0.2 opt gold in the West Zone for a total of 86,700 tonnes @ 0.2 opt gold (6.86 grams/tonne). Independently, R. Somerville in 1989 estimated resources (then called “Ore Reserves”) at the Tas property as follows:
ZONE PROBABLE GRADE POSSIBLE GRADE
Tons Oz/ton Au Tons Oz/Ton Au
Mid 3,780 0.62 4,000 0.25
19 3,000 0.45
West 18,980 0.17 5,000 0.20
East 20,350 0.20 5,000 0.20
TOTAL 43,110 17,000
Neither the Company nor the author has verified the above estimations, which are preliminary and historical and are not construed to be a current resource and should not be relied upon.

Technical Report Update 2013. Tas Gold Copper Property BC
B.J PRICE GEOLOGICAL CONSULTANTS INC. VANCOUVER B.C 604-682-1501 FEBRUARY 2013
Page 9
Recent History
2008: Eagle Peak optioned the property in 2008 and completed 20 km of new grid work and commenced a compilation of all prior data. No sampling or drilling was done by Eagle Peak. The following historical work has been completed to date on the Ridge and Freegold Zones since exploration commenced in 1985 and prior to 2008 (after Halleran, 2008).
Diamond drilling: 75 holes, 6318m
Percussion drilling: 11 holes, 390m
Trenching: 28 excavations
Soil sampling: 5,088 samples
Rock samples: 135
VLF-EM surveys: 44 line-km
Magnetometer surveys: 143 line-km
Mise-a-la-masse survey: 7.8 km
IP surveys: 47.3 km
Bulk samples: 2, totaling 32.4 tonnes Historical exploration has been described in the author’s previous Technical Report (2010). Exploration done by Eagle Peak and Inzana from 2008 to the present is described under a subsequent section of this report. GEOLOGICAL SETTING
Geological information is adapted from a detailed description by Fox (2009).
Regional Geology
The Tas property is located within a northwesterly trending belt of largely volcanic strata comprising Upper Triassic to Lower Jurassic Takla Group volcanics and sediments that have been intruded by a series of felsic to ultramafic stocks and batholiths of alkalic affinity. These intrusions, which are associated with a number of copper-gold deposits, generally lie in a northwest belt from the Tas property in the south to Chuchi Lake (and beyond). The Takla Group rocks form part of a large Upper Triassic volcanic arc (the Quesnellia Terrane) lying originally offshore of the North American continental plate. Major fault structures are aligned northwesterly, for example the Pinchi Fault to the west, along which are grouped mercury, copper and gold deposits. Fault-bounded blocks of older basement paragneiss (Wolverine Complex) lie at the northeast corner of the map area. A regional geological map is given in Figure 4 on the following page.

Technical Report Update 2013. Tas Gold Copper Property BC
B.J PRICE GEOLOGICAL CONSULTANTS INC. VANCOUVER B.C 604-682-1501 FEBRUARY 2013
Page 10
Local Geology
Much of the area is covered, and local geology is interpreted from the few outcrops available and additional information from drill holes. Geology at the Tas property has been compiled by Dr. Peter Fox, P.Eng. Ph.D., from which this summary is modified. Rocks at the Tas property include conglomerate, greywacke, shale, argillite and limestone of the Inzana Lake Formation. These sediments lie west of a central belt of basaltic strata comprising the Witch Lake Formation (within the Takla Group). Numerous copper-gold prospects occur throughout the district. The most advanced is the Mt Milligan porphyry copper gold deposit 20 km northeast of the Tas property which is advancing to production by Terrane Metals. The Property is underlain by grey to green cherty tuff and argillite of the Inzana Lake Formation (Unit 1 Figure 5), an oval shaped body of diorite (TAS pluton, Unit 2) that lies south of the Inzana Lake Forestry Road along the southern boundary of the Property and a small, poorly exposed body of monzonite (Unit 3) together with a number of small breccia bodies (Unit 4). Rocks of the Inzana Lake Formation comprise tuffs and siltstones locally altered to chlorite and epidote. It is the host rock of the various gold-copper prospects discovered to date. They are highly fractured and cut by swarms of dikes.
The Tas pluton comprises medium grained augite diorite composed of plagioclase, augite and accessory amounts of hornblende, biotite and magnetite. The latter gives the pluton a prominent regional magnetic signature. Monzonite of Unit 3 is pyritic, altered to fine grained sericite and comprised of plagioclase and minor biotite. The Unit 4 breccia is a dark grey to black biotite-magnetite mafic rock consisting of bleached grey fragments in a pale yellow-green monzonite matrix. Black fragments are commonly magnetic (Mowatt 1999). Other varieties comprise diorite fragments in a fine grained matrix.

Technical Report Update 2013. Tas Gold Copper Property BC
B.J PRICE GEOLOGICAL CONSULTANTS INC. VANCOUVER B.C 604-682-1501 FEBRUARY 2013
Page 11
FIGURE 4. REGIONAL GEOLOGY (Fox, 2009)
Technical Report Update 2013. Tas Gold Copper Property BC
B.J PRICE GEOLOGICAL CONSULTANTS INC. VANCOUVER B.C 604-682-1501 FEBRUARY 2013
Page 12
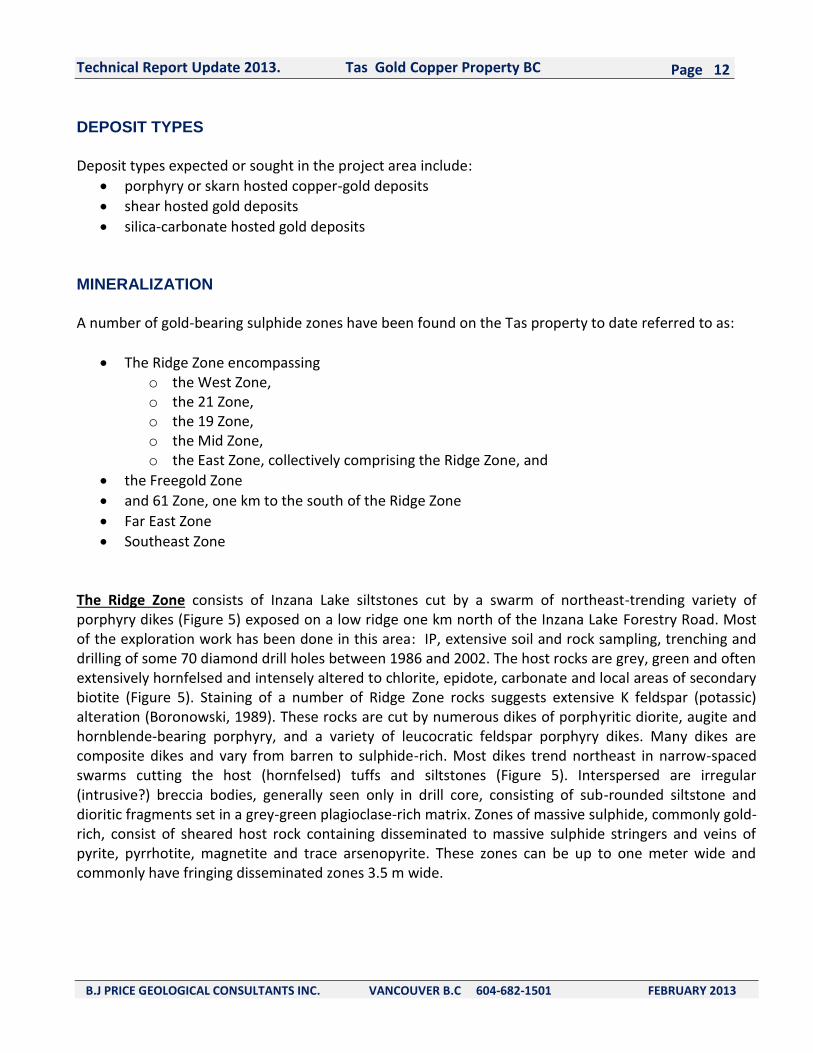
DEPOSIT TYPES
Deposit types expected or sought in the project area include:
porphyry or skarn hosted copper-gold deposits
shear hosted gold deposits
silica-carbonate hosted gold deposits MINERALIZATION
A number of gold-bearing sulphide zones have been found on the Tas property to date referred to as:
The Ridge Zone encompassing o the West Zone, o the 21 Zone, o the 19 Zone, o the Mid Zone, o the East Zone, collectively comprising the Ridge Zone, and
the Freegold Zone
and 61 Zone, one km to the south of the Ridge Zone
Far East Zone
Southeast Zone The Ridge Zone consists of Inzana Lake siltstones cut by a swarm of northeast-trending variety of porphyry dikes (Figure 5) exposed on a low ridge one km north of the Inzana Lake Forestry Road. Most of the exploration work has been done in this area: IP, extensive soil and rock sampling, trenching and drilling of some 70 diamond drill holes between 1986 and 2002. The host rocks are grey, green and often extensively hornfelsed and intensely altered to chlorite, epidote, carbonate and local areas of secondary biotite (Figure 5). Staining of a number of Ridge Zone rocks suggests extensive K feldspar (potassic) alteration (Boronowski, 1989). These rocks are cut by numerous dikes of porphyritic diorite, augite and hornblende-bearing porphyry, and a variety of leucocratic feldspar porphyry dikes. Many dikes are composite dikes and vary from barren to sulphide-rich. Most dikes trend northeast in narrow-spaced swarms cutting the host (hornfelsed) tuffs and siltstones (Figure 5). Interspersed are irregular (intrusive?) breccia bodies, generally seen only in drill core, consisting of sub-rounded siltstone and dioritic fragments set in a grey-green plagioclase-rich matrix. Zones of massive sulphide, commonly gold-rich, consist of sheared host rock containing disseminated to massive sulphide stringers and veins of pyrite, pyrrhotite, magnetite and trace arsenopyrite. These zones can be up to one meter wide and commonly have fringing disseminated zones 3.5 m wide.

Technical Report Update 2013. Tas Gold Copper Property BC
B.J PRICE GEOLOGICAL CONSULTANTS INC. VANCOUVER B.C 604-682-1501 FEBRUARY 2013
Page 13
FIGURE 5. LOCAL GEOLOGY (FOX 2011)

Technical Report Update 2013. Tas Gold Copper Property BC
B.J PRICE GEOLOGICAL CONSULTANTS INC. VANCOUVER B.C 604-682-1501 FEBRUARY 2013
Page 14
Within the Ridge Zone, the West, 19, 21 and East structures strike northwest. All of the drilling programs have focused on delineating these mineralized structures. The gold-bearing zones, up to 30 cm thick, comprise stringers and massive sulphides hosted in shears and intensely fractured siltstone/tuff, breccia and hornblende-augite porphyry. The sulphide content ranges from 5 to 80% and consists of pyrite, pyrrhotite, chalcopyrite and magnetite and trace amounts of arsenopyrite. The West Zone is a strong shear trending 3500 which can be traced for approximately 100 meters. The sulphide mineralization is in siltstone, dikes and breccia and occurs as bands of massive to stringer pyrite, pyrrhotite and chalcopyrite. Sixteen holes have been drilled here to date, the most recent in 2002 (Warner (2003)) noted that various breccia units are an unrecognized host to the gold mineralization. The 21 Zone consists of 5 to 20% disseminated pyrite to massive pyrite in a shear zone in siltstone. Ground magnetometer surveys that are partially coincident with a chargeability anomaly suggest that the zone is 200 meters long. The 19 Zone can be traced in drill holes for approximately 50 meters. Mineralization consists of semi-massive pyrite, pyrrhotite and chalcopyrite in siltstone. Ground magnetometer surveys which are coincident with a strong chargeability anomaly suggest that the zone is 200 meters long. The Mid Zone consists of a series of narrow sulphide-filled shears in hornblende-augite porphyry. The zone trends 030°, parallel to the predominant dyke trend. Ten drill holes were drilled here in 1987-89. The East Zone consists of gold-bearing sulphide mineralization bands averaging about 0.6 m thick which occurs as anastomosing massive to stringers in a shear zone trending 350°. Eleven drill holes tested the East Zone mineralization, which includes pyrite, pyrrhotite, chalcopyrite and magnetite. Trenching has exposed the zone for 70 meters. A.D. Halleran collected 32.5 tonnes of material from this zone in 1993 that returned an average tenor of 35.46 gpt gold (just over 1 oz/ton gold). The 61 Zone to the south consists of disseminated and massive sulphides in shear zones exposed in trenches, road cuts and two drill holes. The sulphide mineralization includes pyrite, pyrrhotite and minor chalcopyrite. The host rock for the mineralization is siltstone and altered hornblende-augite porphyry exposed for approximately 50 meters. The Far East Zone is a few hundred meters east of the East Zone, and geology is relatively unknown because of cover. Drill results for this zone have not as yet been encouraging. The Freegold Zone, the first zone found on the property hosts (visible) gold in a quartz-carbonate altered zone. This was discovered by Noranda Exploration in 1985. The zone lies within the Tas pluton exposed along the Inzana Lake Forestry Road. Five diamond drill holes and four percussion holes were drilled here by Noranda and others in 1987-89. The Southeast Zone was identified as a possibledeep porphyry target zone comprising alteration and low pyrite content coincident with near-surface potassic alteration and a K radiometric anomaly. The Camp zone is a radiometric target.

Technical Report Update 2013. Tas Gold Copper Property BC
B.J PRICE GEOLOGICAL CONSULTANTS INC. VANCOUVER B.C 604-682-1501 FEBRUARY 2013
Page 15
EXPLORATION
2010 Exploration
On June 16, 2010, Canadian Mining Geophysics Ltd., completed an airborne geophysical survey of 103 line kilometers over the Tas property. Geophysical techniques employed were Magnetometer, VLF and Radiometrics. Preliminary results for the Tas property show strong potassic (K) and Thorium Potassium (Th/K) anomalies over the Ridge Zone, the SE copper soil anomaly, and the 61 Zone. The West, 21, 19, and East showings are marked by magnetic anomalies. In addition there are new magnetic and radiometric targets. A preliminary view of the 2010 geophysical surveys confirms a large potassic anomaly consistent with porphyry style mineralization, and smaller potassic anomalies which remain to be tested, and magnetic highs, likely from pyrrhotite noted in past drill holes. The complete geophysical report by CMG is available on request. For continuity and comparison, some of the 2010 geophysical maps are included here. Note that the ground based surveys in 2011 and 2012 provide better detail and clarity.
Radiometric Survey
In addition to magnetics, a gamma ray spectrometry survey was performed to map level of radioactivity of the survey area. The radiometric total count image outlines several regions with elevated radioactivity (sum of all spectrum gates) of which the largest correlated closely with an increase in topographic elevation. Individual spectrum gate data (Potassium, Uranium and Thorium) can provide valuable information on specific alteration or lithology types. The RSX-5 digital airborne gamma-ray spectrometer is designed for the detection and measurement of low-level radiation from both naturally occurring and man-made sources. The spectrometer was built by and purchased from Radiation Solutions Inc. The RSX-5 is a fully integrated system that includes an individual Advanced Digital Spectrometer (ADS) for each crystal within the box. The ADS records high resolution, 1024 channel, digital data of naturally occurring radioactive elements. One region of significance is shown clearly as an elevated ratio of the U/K (and also Th/K) grids. This zone is located in the southern section of the survey area of which its border passes very close to the Freegold Zone and may represent a change in lithology. Also of interest is the close correlation between the magnetic trend axis and the boundary of the high ratio area. Based on the geologic results from the Freegold Zone and the Ridge Zone mineralization, areas with anomalous magnetic response that also show elevated levels for potassium are recommended for further work. Figure 6 identifies 3 zones of interest (ROI 1, 2 and 3). ROI 1 outlines the known mineralization at the Freegold zone and the region to the north of the showing termed the Ridge Zone centered at 415,000 E & 6,083,800 N. ROI 2 and ROI 3 highlight areas with strong magnetics, elevated potassium and located in close proximity to the geologic contact previously mentioned. These areas share similar geophysical attributes as ROI 1 where known mineralization has been recorded.

Technical Report Update 2013. Tas Gold Copper Property BC
B.J PRICE GEOLOGICAL CONSULTANTS INC. VANCOUVER B.C 604-682-1501 FEBRUARY 2013
Page 16
FIGURE 6. LOCATION OF 2010 HELICOPTER GEOPHYSICAL SURVEY

Technical Report Update 2013. Tas Gold Copper Property BC
B.J PRICE GEOLOGICAL CONSULTANTS INC. VANCOUVER B.C 604-682-1501 FEBRUARY 2013
Page 17
FIGURE 7. RADIOMETRIC SURVEY 2010

Technical Report Update 2013. Tas Gold Copper Property BC
B.J PRICE GEOLOGICAL CONSULTANTS INC. VANCOUVER B.C 604-682-1501 FEBRUARY 2013
Page 18
FIGURE 8. REGIONS OF INTEREST SELECTED BY CMG. 2010
Technical Report Update 2013. Tas Gold Copper Property BC
B.J PRICE GEOLOGICAL CONSULTANTS INC. VANCOUVER B.C 604-682-1501 FEBRUARY 2013
Page 19
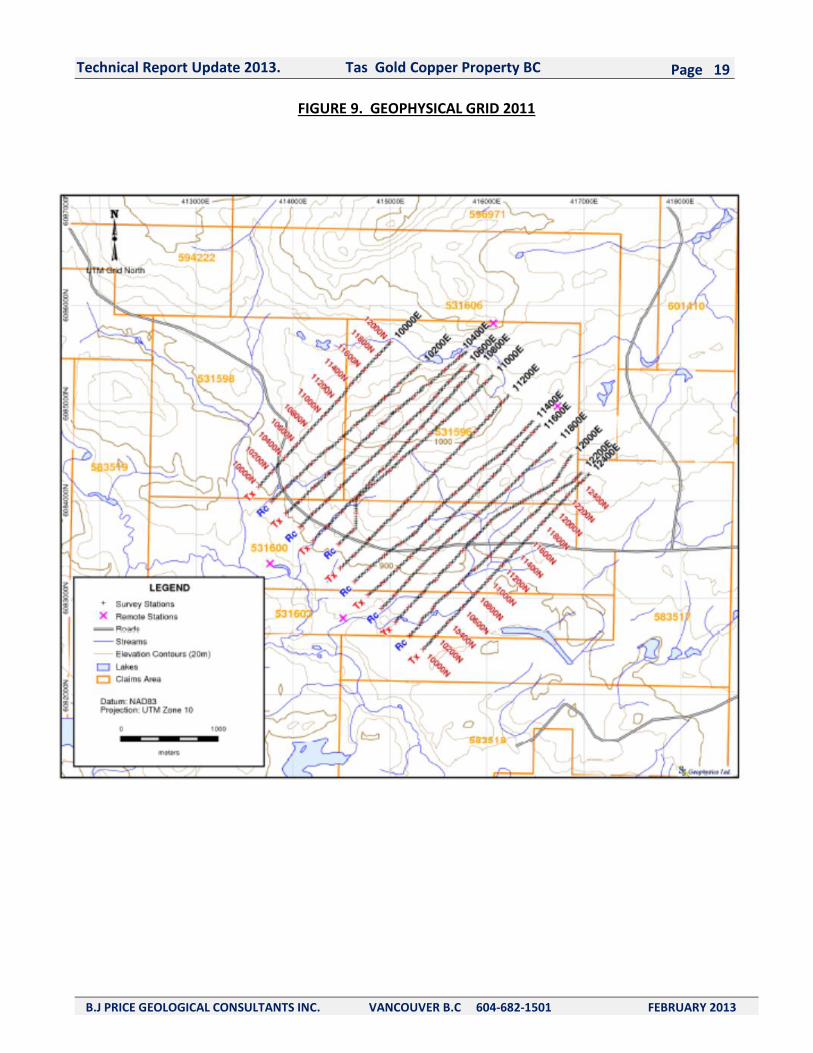
FIGURE 9. GEOPHYSICAL GRID 2011
Technical Report Update 2013. Tas Gold Copper Property BC
B.J PRICE GEOLOGICAL CONSULTANTS INC. VANCOUVER B.C 604-682-1501 FEBRUARY 2013
Page 20
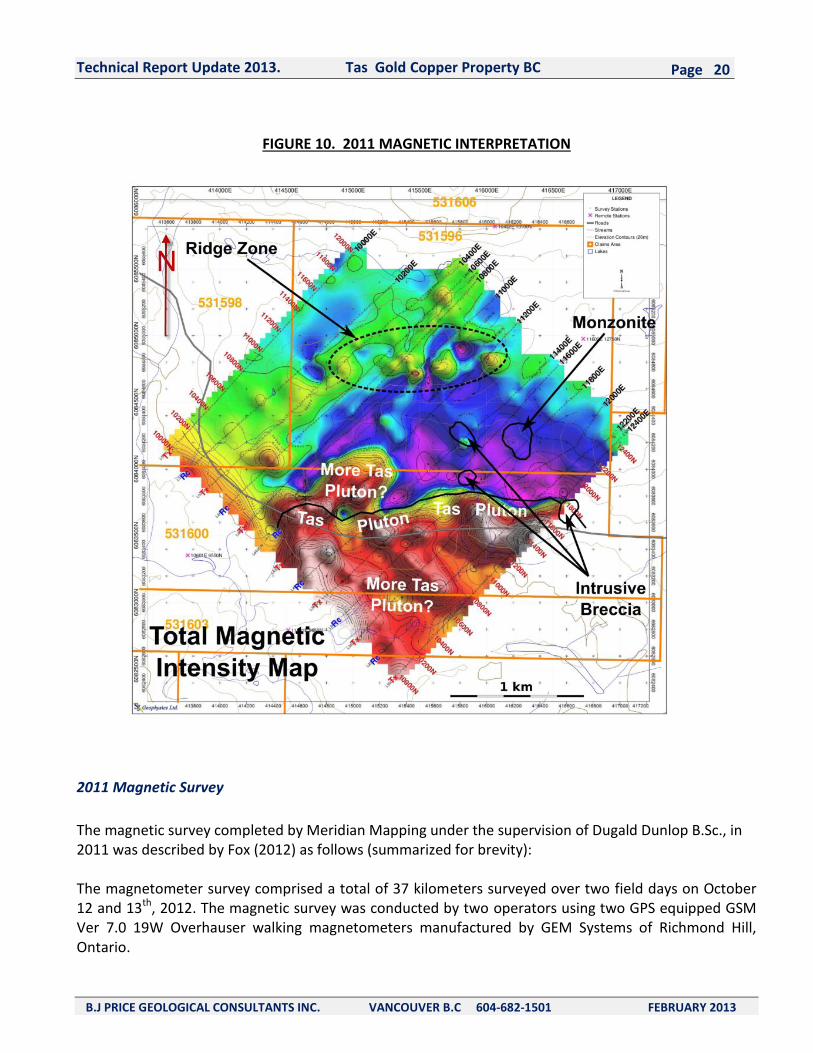
FIGURE 10. 2011 MAGNETIC INTERPRETATION
2011 Magnetic Survey
The magnetic survey completed by Meridian Mapping under the supervision of Dugald Dunlop B.Sc., in 2011 was described by Fox (2012) as follows (summarized for brevity): The magnetometer survey comprised a total of 37 kilometers surveyed over two field days on October 12 and 13th, 2012. The magnetic survey was conducted by two operators using two GPS equipped GSM Ver 7.0 19W Overhauser walking magnetometers manufactured by GEM Systems of Richmond Hill, Ontario.

Technical Report Update 2013. Tas Gold Copper Property BC
B.J PRICE GEOLOGICAL CONSULTANTS INC. VANCOUVER B.C 604-682-1501 FEBRUARY 2013
Page 21
This instrument measures variations in the total intensity of the earth’s magnetic field to an absolute accuracy of +/- 0.1 nT (nano-Teslas). They were used in “walking mode” and set to record a reading every 2 seconds. A third GSM 19 magnetometer was employed as a stationary base to measure the diurnal variations. For locations, the magnetometers are equipped with GPS instrumentation. The ground magnetic response corroborated the 2010 airborne magnetic survey with strong response over the Tas pluton on the south part of the Property and a number of small positive and negative anomalies in the Ridge Zone which are not yet understood with respect to mineralization. Figure 9 above provides an initial interpretation of the survey by Dr. Fox (2012).
2011 Induced Polarization Survey
In September and October 2011, 32 kilometers of 3 Dimensional Induced Polarization survey (3D IP) was conducted by SJ Geophysics. The first SJ Geophysics crew arrived at the Tas project on September 13th and demobilized on September 19th, 2011. The second SJ Geophysics crew arrived at the project September 29 and demobilized on October 10th, 2011. The SJ Geophysics crews were accommodated by the client in a fishing lodge near Inzana Lake. The lodge was powered by a diesel generator and provided hot water to the crew. Communication with the office was limited to a satellite phone and weekly trip to Ft. St. James to send data over the internet. The geophysical instrumentation used to acquire the 3D IP data consisted of SJ-24 full waveform receivers and a GDD Tx II transmitter. The specifications of these instruments are available on request. As stated by SJ Geophysics: “The time domain IP technique energizes the ground by injecting square wave current pulses via a pair of current electrodes. During current injection, the primary voltage and input current are used along with the known positions of the electrodes to calculate the apparent (bulk) resistivity of the ground. Immediately after the current injection stops, a time decaying voltage is measured at the receiver electrodes. This IP effect measures the amount of polarizable (or “chargeable”) particles in the subsurface rock”. Unlike conventional 2D IP, the electrode arrays are not restricted to an inline geometry. In the standard 3D IP configuration, a receiver array is established along one survey line while current lines are located on two adjacent lines lying on either side of the receiver line. Current injections are performed sequentially at fixed increments (25, 50, 100 or 200 m) along the current lines. Meanwhile, geophysical data are collected along a receiver array which consists of 12 to 16 dipoles laid out along the receiver line. “Under ideal circumstances, high chargeability corresponds to disseminated metallic sulfides. But other rock materials are also chargeable, such as some graphitic rocks, clays and some metamorphic rocks (e.g., serpentinite). Therefore, it is prudent from a geological perspective to incorporate other data sets to assist in interpretation”.

Technical Report Update 2013. Tas Gold Copper Property BC
B.J PRICE GEOLOGICAL CONSULTANTS INC. VANCOUVER B.C 604-682-1501 FEBRUARY 2013
Page 22
FIGURE 11. 2011 INTERPRETATION OF CIP CHARGEABILITY AT 350 M DEPTH
Interpretation
Results of the survey are discussed in detail by Witter (2012). In the shallow subsurface (25 m depth), the Tas pluton and monzonite body correlate with an area of low chargeability (<5-15 ms). The Ridge Zone, by contrast, is characterized by moderate chargeabilities (20-40 ms) with high response in the east central part in the vicinity of the Mid Zone. Resistivity in the shallow subsurface is highly variable with the highest resistivity anomaly (>2500 ohm-m) occurring in the NE sector of the Ridge Zone. A small resistivity low (<50 ohm-m) in the center of the Ridge Zone may, at these shallow depths, indicate the presence of disseminated sulfides that could be responsible for the elevated chargeability values and an abundance of silicification and/or argillic alteration could cause the low resistivity.

Technical Report Update 2013. Tas Gold Copper Property BC
B.J PRICE GEOLOGICAL CONSULTANTS INC. VANCOUVER B.C 604-682-1501 FEBRUARY 2013
Page 23
At intermediate depths (150-200 m), the geophysical anomalies are large and have high magnitude. At 200 m, the Tas pluton is characterized by low chargeability (<5 – 20 ms). A northward extension of this low chargeability zone near the 61 Zone suggests a northerly lobe of the Tas pluton at these depths. At the east end of the grid, the Southeast Zone forms two significant chargeability anomalies (>55 ms) associated with intrusive breccia, monzonite, and the Tas pluton. Within the Ridge Zone area, chargeabilities are moderate (15 – 40 ms) at these depths with higher values in the west (West Zone) compared to the east. Resistivity is variable within the Ridge Zone with a resistivity low (50-150ohm-m) near the center and anomalies of moderate to high resistivity (500-2000 ohm-m) on either side. The high resistivity anomaly in the west side of the Ridge Zone is significantly larger and of greater magnitude compared to the eastern end. A chargeability anomaly (>50ms) immediately north of the Ridge Zone forms a roughly circular chargeability anomaly enclosing a central chargeability low centered on the Mid Zone – a zone of alteration and relatively low pyrite content coincident with near-surface potassic alteration. At deeper levels (350 m), a generally east-west zone of high chargeability (>45 ms) extends across the central survey area. One arm of this high chargeability zone extends below the south-central portion of the Ridge Zone and may reflect a deep extension of the Ridge mineralization. A significant resistivity low (<50-200 ohm-m) lies at 350 m depth in large part coincident with the zone of high chargeability. The lowest magnitude portion of this resistivity anomaly lies beneath the south central part of the Ridge Zone near the 19 and Mid Zones. The combination of geophysical anomalies suggests abundant disseminated sulfides (causing high chargeability) coupled with a zone of hydrothermally altered rocks (creating low resistivity), possibly a representing a deep porphyry target. Dr. Peter Fox, Ph.D., P.Eng. summarized the survey as follows: “Work in 2011 consisted of line cutting, 36 km of ground magnetic surveys and 32 km of 3D IP conducted by SJ Geophysics. The Southeast Zone was identified as a moderate chargeability anomaly (40ms) extending to depth along with a large chargeability high (>40ms) and resistivity low extending throughout the central part of the grid area. Near the Ridge Zone mineralization, a deep chargeability anomaly (>50ms) immediately north of the zone forms a roughly circular chargeability anomaly enclosing a central chargeability low centered on the Mid Zone, possibly a deep porphyry target zone comprising alteration and low pyrite content coincident with near-surface potassic alteration and a K radiometric anomaly.” It can be concluded that, geophysically and geologically, the TAS prospect has strong similarities to the Mt Milligan and other alkalic porphyries in British Columbia (Price, 2010 and others). The magnetometer survey defined the north contact of the Tas pluton and identified magnetic zones associated with the Ridge Zone prospects. Previous radiometric surveys (2010) provided a number of potassic radiometric targets, similar to those from other Omineca area porphyry targets.

Technical Report Update 2013. Tas Gold Copper Property BC
B.J PRICE GEOLOGICAL CONSULTANTS INC. VANCOUVER B.C 604-682-1501 FEBRUARY 2013
Page 24
The 2011 3D IP survey clearly identified shallow to deep chargeability of the Ridge Zone, the Southeast Zone and the 61 Zone farther west. Most importantly, there is a large, deep porphyry-like chargeability target in the central part of the grid. These targets confirm the Tas porphyry model. 2012 GEOPHYSICAL SURVEYS
The geophysical work completed in 2012 included ground magnetometer surveys and infill Induced Polarization surveys described below: Magnetic Survey
The following description is reproduced from a report by Meridian Mapping Ltd. (2012). No interpretation was provided but a brief interpretation is made by the present author from the magnetic plans. Between September 6th and 9th, 2012, Meridian Mapping Ltd. completed a ground magnetometer survey over a portion of the TAS Property near Inzana Lake, British Columbia for Inzana Metals Inc. This 2012 survey both expanded and infilled a similar survey conducted on the property by Meridian in 2011. The 2012 survey covered five new lines up to 2400m long at 100m spacing that had been added to the NW side of the grid and both cut and uncut infill lines extending NE from the L111+00N baseline with an average length of 1300m. After combining with the 2011 survey data, the average line spacing on the NE side of the grid was approximately 50m. Lines run on an average azimuth of 45 degrees. A total of 55.1 kilometers were surveyed over four field days. The magnetic survey was conducted by two operators using two GPS equipped GSM Ver 7.0 19W Overhauser walking magnetometers manufactured by GEM Systems of Richmond Hill, Ontario. This instrument measures variations in the total intensity of the earth’s magnetic field to an absolute accuracy of +/- 0.1 nT. They were used in ‘walking mode’ and set to record a reading every 2 seconds. A third GSM 19 magnetometer was employed as a stationary base to measure the diurnal variations in the earth’s magnetic field. Data was recorded at a 3 second interval at the base. This base data was used to apply diurnal correction to the rover data. A 200 meter length of overlap line was walked each morning by both units. Data from this overlap line was used to level the data between the two instruments as well as between survey days. The same overlap line was used for the 2012 survey as the 2011 survey, allowing leveling and combining of the two surveys.
Deliverable data includes: 1. Total Magnetic Intensity; 2. Calculated 1st Vertical Derivative; 3. Analytic Signal; 4. B&W Contour Plots of above three.; 5. Profiles of Total Magnetic Intensity and 6. Survey Track Plot.
Figures showing the in-filled magnetic plan and interpretations are shown on the following pages. As the images have been reduced for this report, the image quality has suffered. Full PDF versions are available on request. In-Fill IP Survey
Work completed in 2012 by SJ Geophysics Ltd. between July 4th – July 20, 2012 included infill line cutting and marking and infill magnetic and IP surveys. The 2012 Tas grid acts as an infill to a larger and coarser grid surveyed by the same company (SJ Geophysics) in 2011. The purpose of the smaller dipole and line spacing of the 2012 survey was to provide better near-surface resolution of the features of interest. The 2012 Tas grid consisted of 27 survey lines (13 receiver and 14 current lines), spaced at 100 meters with stations flagged and marked every 50 meters (Figure 12).

Technical Report Update 2013. Tas Gold Copper Property BC
B.J PRICE GEOLOGICAL CONSULTANTS INC. VANCOUVER B.C 604-682-1501 FEBRUARY 2013
Page 25
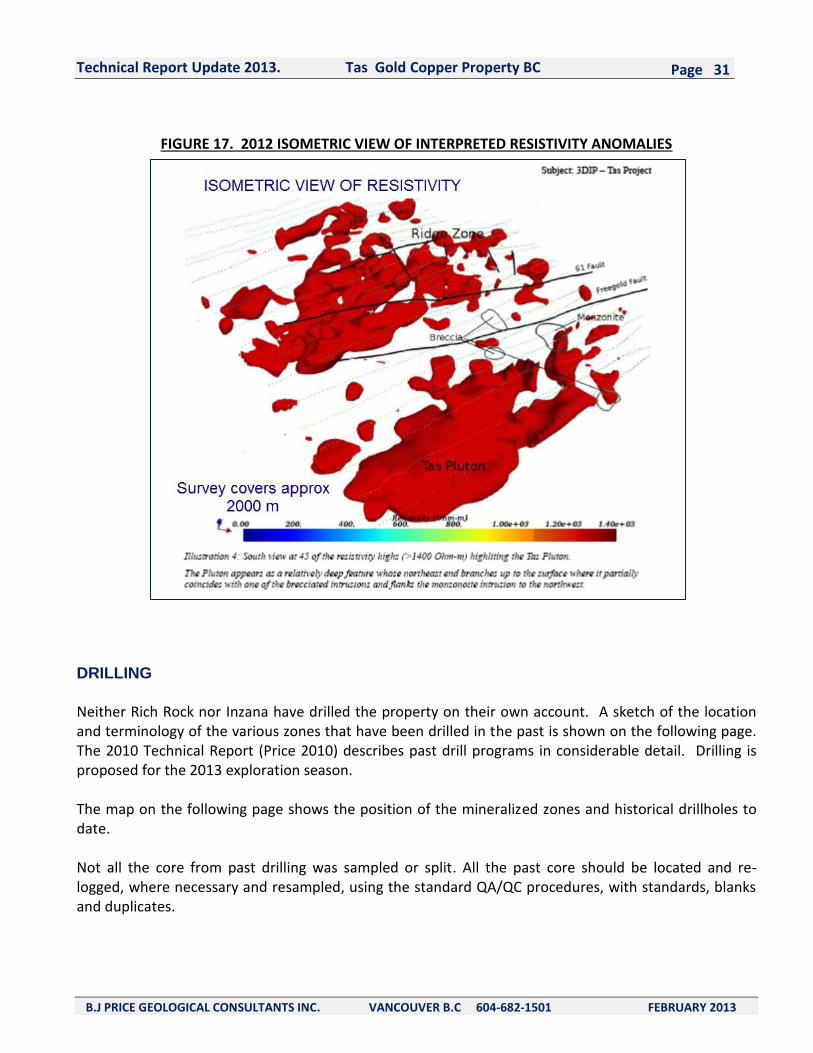
A brief interpretation is provided by SJ Geophysics in a Memorandum attached to the report. The present author has summarized its findings below: The primary rock types in the survey area are volcanic cherty tuff and argillite units of the Inzana Lake Formation. The grid also encompasses an area of identified porphyry Au-Cu mineralization, known as the Ridge Zone, as well as a large diorite pluton (the Tas Pluton) and other assorted intrusions. The 2012 3D IP survey, designed to infill the eastern half of the 2011 grid, allowed to map (or re-map) several geological breaks and faults that appear to control some structures of interest, including the Ridge Zone. The smaller line spacing and dipole length also allowed a better definition of the geophysical signature associated with known showings. In particular it helped refine the outlines of extended chargeablility highs (> 45ms) likely related to pyritic systems with outer envelopes (between 30 and 35 ms) that could coincide with chalcopyrite. The resistivity model exhibits a complex pattern near surface (0 down to approximately 100 m below topography) resistivity highs (>600 Ohm-m) outlining dense faulting (Illustration 2.). The placement of those faults is challenging to determine given the complexity of the model. At lower depths (<100 m below topography, Illustration 3.), the features are smoother and the patterns simpler, in part due to the reduced resolution. The Tas Pluton appears in the southwest corner of the grid as a deep-seated feature. Its northeastern end branches up to the surface where it partially coincides with one of the brecciated intrusions and flanks the monzonite intrusion to the north (Illustration 4). Some of the previously mapped faults such as the Freegold, the Mid and East Zone faults (solid black line on Illustration 5) clearly stand out in the resistivity model. They also appear more extended than what is represented on the geological map. The resistivity model also outlines a multitude of un-mapped breaks and attention will be paid to the one running through the Ridge Zone showings (thin dashed black line on Illustration 5) as it could be an important controlling factor in their formation. Some other mapped faults, in particular the West Zone faults, seem to be shifted to the southeast in comparison to the geological map (thick dashed line on Illustration 5), while the 61 fault does not appear at all. Consequently a thorough field investigation of those faults is recommended. The faults outlined above do not appear as clearly at lower depths (< 100 m) as the sharp breaks in relatively high resistivity are replaced by low resistivity features (< 75 Ohm-m, see Illustration 6). Those features extend directly below some mapped faults and most of the showings to the exception of the Mid Zone, Southeast Zone and Monzonite Zone prospects. This coincidence suggests that those deep resistivity lows could be of interest. Comparison of the observations made on the resistivity data and the magnetometer survey (Illustration 7, surfaced map provided by the client) shows a good correlation between isolated magnetic highs in the Ridge Zone and breaks in the resistivity, in particular along the new West Ridge Zone faults and the Ridge Zone Showings fault. A more detailed magnetometer survey (50m line spacing for example) may allow to better define those features. Once the survey is completed, a three dimensional inversion of the magnetometer data is recommended in order to get a better definition of the features' relative depth. Contrary to the resistivity model, the chargeability exhibits relatively smooth features from the near surface down to depth (Illustrations 8 and 9). The Tas Pluton sharply stands out at any given depth with a lower background (approximately 5 ms) although the edges outlined by the chargeability model slightly differ from those shown by the geological map and the resistivity model. The remainder of the model exhibits a higher chargeability background (approximately 15 ms) consisting of deep extended chargeability highs (> 35 ms, Illustration 9) loosing intensity and appearing as isolated features at the surface (<45 ms, Illustration 8). Given their relatively high chargeability intensity at depth and their general alignment along the faults outlined by the resistivity model (Illustration 10), those features are likely related to a fault-controlled pyritic system. Consequently attention should be focused on their outer, lower chargeability envelopes, in particular the more isolated, near surface ones (Illustration 11), as they might be related to chalcopyrite, along the Ridge Zone faults (as delineated by the resistivity model) and in the vicinity of the Freegold fault. To better visualize the spatial relationships of the various anomalies, we have mapped the high resistivity (red) and low resistivity (blue) bodies as well as the high chargeability (green) bodies in three dimensions. The lowest chargeability area associated with the Tas pluton is not shown.

Technical Report Update 2013. Tas Gold Copper Property BC
B.J PRICE GEOLOGICAL CONSULTANTS INC. VANCOUVER B.C 604-682-1501 FEBRUARY 2013
Page 26
FIGURE 12. COMBINED 2011 AND 2012 GRIDS

Technical Report Update 2013. Tas Gold Copper Property BC
B.J PRICE GEOLOGICAL CONSULTANTS INC. VANCOUVER B.C 604-682-1501 FEBRUARY 2013
Page 27
FIGURE 13. COMBINED 2011-2012 MAGNETIC SURVEY PLAN

Technical Report Update 2013. Tas Gold Copper Property BC
B.J PRICE GEOLOGICAL CONSULTANTS INC. VANCOUVER B.C 604-682-1501 FEBRUARY 2013
Page 28
FIGURE 14. COMBINED GRIDS AND MAJOR GEOLOGICAL FEATURES 2012

Technical Report Update 2013. Tas Gold Copper Property BC
B.J PRICE GEOLOGICAL CONSULTANTS INC. VANCOUVER B.C 604-682-1501 FEBRUARY 2013
Page 29
FIGURE 15. 2012 CHARGEABILITY PLAN AT DEPTH 250 M BELOW SURFACE

Technical Report Update 2013. Tas Gold Copper Property BC
B.J PRICE GEOLOGICAL CONSULTANTS INC. VANCOUVER B.C 604-682-1501 FEBRUARY 2013
Page 30
FIGURE 16. 2012 INTERPRETED RESISTIVITY 250 M BELOW AURFACE
Technical Report Update 2013. Tas Gold Copper Property BC
B.J PRICE GEOLOGICAL CONSULTANTS INC. VANCOUVER B.C 604-682-1501 FEBRUARY 2013
Page 31
FIGURE 17. 2012 ISOMETRIC VIEW OF INTERPRETED RESISTIVITY ANOMALIES
DRILLING
Neither Rich Rock nor Inzana have drilled the property on their own account. A sketch of the location and terminology of the various zones that have been drilled in the past is shown on the following page. The 2010 Technical Report (Price 2010) describes past drill programs in considerable detail. Drilling is proposed for the 2013 exploration season. The map on the following page shows the position of the mineralized zones and historical drillholes to date. Not all the core from past drilling was sampled or split. All the past core should be located and re-logged, where necessary and resampled, using the standard QA/QC procedures, with standards, blanks and duplicates.

Technical Report Update 2013. Tas Gold Copper Property BC
B.J PRICE GEOLOGICAL CONSULTANTS INC. VANCOUVER B.C 604-682-1501 FEBRUARY 2013
Page 32
SAMPLE PREPARATION, ANALYSES AND SECURITY
Neither Rich Rock nor Inzana have completed any significant sampling on the Property, as no trenching, or other physical work or drilling has been done by the company. Past sampling has been adequately described in the 2010 report. DATA VERIFICATION
In the 2010 Technical Report the author describes due diligence samples for verification. These were samples of quartz vein float and intrusive material float taken at the Freegold area on the main Inzana Lake Forestry Road. The original rock exposures are now covered and heavily vegetated with alder. A number of the 2002 drill hole intercepts were checked mathematically and no serious errors were seen. ADJACENT PROPERTIES
The writer has no direct information concerning adjacent properties, which are owned by Xstrata and others. MINERAL PROCESSING AND METALLURGICAL TESTING
Neither Rich Rock nor Inzana have accomplished any mineral processing or metallurgical studies; such are premature, but will be done if a resource is established, and the likelihood of this cannot be quantitatively estimated at this time. MINERAL RESOURCE AND MINERAL RESERVE ESTIMATES
The Property has a small historical resource estimated by A.D. Halleran for Black Swan Resources Ltd. in 1988, and Somerville for Black Swan in 1989, described under “History”. Neither the Company nor the author has verified the above estimations, which are preliminary and historical and is not construed to be a current resource, and should not be relied upon. The Property has no current mineral reserves or resources. OTHER RELEVANT DATA AND INFORMATION
The Property has no known environmental or social issues known to the writer. The area lies under one or more native land claims, primarily by the Nak'azdli Band located on Necoslie I.R. No. 1 in Fort St. James. Nak'azdli is a member of the Carrier Sekani Tribal Council (CSTC) along with seven other First Nation Bands. Nak'azdli First Nation is made up of approximately 1700 on and off reserve members. Contacts for the band are: Telephone 250-996-7171 Fax 250-996-8010 Postal address P.O. Box 1329, Fort St. James, British Columbia V0J 1P0 Physical address: 284 Kwah Rd, Fort St. James, British Columbia V0J 1P0 Email: [email protected]. Rich Rock and Inzana maintain a good relationship with the

Technical Report Update 2013. Tas Gold Copper Property BC
B.J PRICE GEOLOGICAL CONSULTANTS INC. VANCOUVER B.C 604-682-1501 FEBRUARY 2013
Page 33
local bands. The author is not aware of any other relevant data, the omission of which would make this report incomplete or misleading. INTERPRETATION AND CONCLUSIONS
The Tas prospect lies within a belt of known porphyry copper-gold deposits such as Mt Milligan, Kwanika, Duckling Creek (Lorraine) and others. The mineralization at the Tas property has strong similarities to these porphyries, such as:
long intervals of anomalous (but as yet sub-economic) copper
intermittent gold mineralization throughout some holes in the Western Zone
association with magnetic anomalies
presence of broad potassic radiometric anomaly
alteration with sericite biotite and epidote consistent with the addition of potassium to the host rocks
favourable Triassic age host rocks
a subdued but anomalous molybdenum signature in the 2002 drill holes
Soil sampling work done by previous operators including Noranda was compiled by Dr. Peter Fox., Ph.D., P.Eng. The compiled maps (Figure 8 and 9) show highly elevated gold and copper in soils overlying the Ridge Zone. The copper anomaly with >300 ppm. copper encompasses an area 2500 x 1000m having a central area of high gold 1800 x 800m. These anomalies overlie gold mineralized rocks of the Ridge Zone prospects. The review of the most recent drilling (by Navasota in 2002) shows significant widths of sub-gram gold values and strongly anomalous copper, with one intercept in Hole TS 06-7 of 46.5 meters of 0.929 grams/tonne gold and 0.07% copper. In addition, a new copper-in-soil target has been identified by the work completed by Inzana. The Southeast anomaly covers an area roughly 1100 x 300 meters. These dimensions suggest widely disseminated porphyry style mineralization in addition to the more local high gold tenor zones developed to date on the Ridge Zone.
The presence of widespread copper-gold geochemical targets suggests additional porphyry style targets may exist on the property. This has been corroborated in a preliminary interpretation of the 2010 geophysical surveys which show broad radiometric potassic anomalies and smaller magnetic anomalies, consistent with other porphyry style properties in the area. The presence of more local high grade gold prospects enhances the overall potential of the Ridge Zone and 61 Zone mineralization. Porphyry targets in the South Omineca area are clearly associated with magnetic and potassic radiometric anomalies. The combined 2010-2012 surveys have shown a number of magnetic and IP (chargeability and resistivity) targets that must be evaluated by drilling.

Technical Report Update 2013. Tas Gold Copper Property BC
B.J PRICE GEOLOGICAL CONSULTANTS INC. VANCOUVER B.C 604-682-1501 FEBRUARY 2013
Page 34
Further exploration is clearly warranted to develop and test the targets outlined herein. A preliminary cost estimate is given in the accompanying tentative budget.
Genetic model
Dr. Peter Fox has developed a new genetic model for the property based on interpretation of the geophysical surveys: “The geological history of the Tas porphyry deduced from the combined 2011 and 2012 induced polarization surveys is complex. It includes:
development of an early porphyry copper-gold system associated with dike emplacement
northward rotation of the dike-porphyry complex to the near horizontal
influx of low temperature, reducing regional fluids from the host rock (Inzana Lake Formation)
erosion of much of the dike complex leaving isolated remnants north of the Tas pluton. These late fluids overprinted the early porphyry alteration replacing most of it with chloritic mineral assemblages typical of late stage propylitic alteration. Much of the northeast striking dike swarm and steep faults also formed at this time along with formation of fault-controlled gold-bearing massive sulfide replacement bodies such as the East Zone and other similar bodies exposed in the Ridge Zone.” The above is based on an interpretation of chargeability section 112E and similar sections from 118E to 104E. This interpretation is included in an Appendix (I). The sections assume the apparent south-dipping contact of the Tas pluton as indicated by the original chargeability data (Fox, 2012) was originally vertical and was followed by the emplacement of the dike, a tabular apophysis of the Tas pluton. It is suggested that the original porphyry and related mineralization and attendant hydrothermal alteration was genetically related to emplacement of fluid-charged magma derived from the crystallizing Tas pluton magma, channeled into the evolving dike complex and subsequently developing a porphyry system related to dike emplacement. Mineralized rocks as expressed by current chargeability data (Fox 2012 and this report) now lie at surface and at depths of several hundred metres below thin erosion remnants of the dike unit more or less parallel to the dike contacts. Key chargeability targets are noted in Figure 15 and 18. Theses comprise a target area about 1,400 meters x 1,200 meters in area and up to a depth of 350 meters. The zone remains open to the east to section 124E and possibly beyond, and also to the west. (See Appendix I). The geological history of Tas porphyry as suggested above is similar to other copper-gold deposits, such as the Mt Milligan deposit to the east where the Rainbow dike there is a key feature of development of mineralization and hydrothermal alteration patterns. Other tilted and rotated porphyry deposits include Schaft Creek, Bingham, Yerrington, Butte, and San Manuel/Kalamzoo.

Technical Report Update 2013. Tas Gold Copper Property BC
B.J PRICE GEOLOGICAL CONSULTANTS INC. VANCOUVER B.C 604-682-1501 FEBRUARY 2013
Page 35
RECOMMENDATIONS
A brief review of the airborne geophysical maps and new 3 Dimensional IP data suggests numerous untested potassic radiometric, magnetic and IP targets exist. From a review of the surveys, the author in consultation with Dr. Peter Fox, Ph.D, P.Eng. of Rich Rock, has selected 16 drill holes on various targets totaling 7,100 meters on the targets. The following recommendations are made:
Continue compilation of older data and maps, drill data and intercepts as the present author has done for the 2002 drill holes
Locate, re-log and resample all available core from past drilling, some of which was not split or assayed. Use a diamond saw to obtain core samples, or take the whole core if absolutely necessary (i.e. if core is in poor condition)
From this create a computerized drillhole database
Initiate drilling of geophysical and geochemical anomalies. Test the new radiometric, magnetic and 3D IP anomalies
Pursue the long mineralized gold-copper sections encountered in the 2002 drilling at the West Zone
Determine if the molybdenum signature is sourced in an intrusive porphyry at depth
Complete some deeper holes on the known targets
Maintain a typical QA/QC program on core sampling such as was done in 2002
If results warrant, initiate a resource mode and metallurgical testing There are two targets to focus upon:
1. The historical gold vein/shear mineralization 2. The porphyry copper gold target
Targets are shown in the accompanying Figures 15, 18, 19 and 20.

Technical Report Update 2013. Tas Gold Copper Property BC
B.J PRICE GEOLOGICAL CONSULTANTS INC. VANCOUVER B.C 604-682-1501 FEBRUARY 2013
Page 36
FIGURE 18 GEOLOGICAL AND GEOPHYSICAL INTERPRETATION (FOX 2013)

Technical Report Update 2013. Tas Gold Copper Property BC
B.J PRICE GEOLOGICAL CONSULTANTS INC. VANCOUVER B.C 604-682-1501 FEBRUARY 2013
Page 37
FIGURE 19. INTERPRETATION OF TARGETS FROM 2012 SURVEYS

Technical Report Update 2013. Tas Gold Copper Property BC
B.J PRICE GEOLOGICAL CONSULTANTS INC. VANCOUVER B.C 604-682-1501 FEBRUARY 2013
Page 38
FIGURE 20. PRELIMINARY DRILL TARGETS FOR 2012

Technical Report Update 2013. Tas Gold Copper Property BC
B.J PRICE GEOLOGICAL CONSULTANTS INC. VANCOUVER B.C 604-682-1501 FEBRUARY 2013
Page 39
Proposed program and targets
Following the 2011 and 2012 magnetic and 3D IP surveys, recently received, the author and Dr. Peter Fox, Ph.D., P.Eng. on the basis of geophysical data at that time, proposed seven targets that warranted drilling in a Phase l program, the Mid, West, East, West ll, 61, Camp and Southeast Zones, for a total of 3700m of Phase l drilling. With the new 3D IP data, a program of 16 drillholes from 350 to 550 meters in depth totaling 7,100 meters has been proposed. Drill locations proposed herein may change somewhat depending on topography and access and any reinterpretation. A Phase 1 budget of Can $1,700,000 including contingency and HST has been estimated to cover the recommendations made. Tentative drill locations are provided in the Table below. Note that the positions of the proposed holes are referred to grid positions. Actual position of these holes may depend on a number of factors, including permitting, topography, obstructions, weather etc. and changes in drilling plans may be made by the field geologist depending on additional results obtained or observations made. (See Figures 21 and 22)
TABULATION OF PROPOSED DRILLHOLES AT TAS PROPERTY
2013 Drill Program
DDH NO. EAST Line) NORTH (Stn.) AZIMUTH INCL DEPTH
m. m. deg. deg. m.
1 10200 10600 45 -60 400
2 10400 11450 225 -45 400
3 10600 11400 225 -50 450
4 10800 11200 vert -90 500
5 10800 11700 225 -55 500
6 10800 11700 45 -50 500
7 11000 11800 225 -55 450
8 11000 11800 45 -45 500
9 11200 11675 225 -45 500
10 11200 11675 45 -45 500
11 11400 11650 225 -55 450
12 11600 11775 225 -60 400
13 11800 11675 135 -45 350
14 12000 11525 45 -55 400
15 12200 11800 45 -70 400
16 12400 11800 vert -90 400
7,100

Technical Report Update 2013. Tas Gold Copper Property BC
B.J PRICE GEOLOGICAL CONSULTANTS INC. VANCOUVER B.C 604-682-1501 FEBRUARY 2013
Page 40
FIGURES 21 AND 22 EXAMPLES OF PROPOSED DRILL LOCATIONS (2012)

Technical Report Update 2013. Tas Gold Copper Property BC
B.J PRICE GEOLOGICAL CONSULTANTS INC. VANCOUVER B.C 604-682-1501 FEBRUARY 2013
Page 41
SUGGESTED INITIAL BUDGET
Phase 1
TAS PROPERTY 2013 BUDGET ESTIMATE
DESCRIPTION PHASE I UNITS AND RATES AMOUNT CAN$ (rounded)
Geological Supervision and compilation 2 man x 2 months 50,000.00
Geological assistants, samplers, 2 men x 2 months 20,000.00
Camp, meals and accommodation 10 men x 2 months 60,000.00
Vehicles, maintenance 2 vehicles x 2 months 15,000.00
Field equipment, computers, GPS, Sat phone 5,000.00
Permits 25,000.00
Diamond drilling, HQ or NQ all inclusive of assays, freight etc.
7100 meters x $160/m 1,140,000.00
Geological reporting 15,000.00
Log, Sample and assay old core 25,000.00
Road and drill pad preparation, D6 cat 200 hrs x $200 40,000.00
Equipment Rentals 5,000.00
Subtotal 1,400,000.00
Contingency 10% 150,000.00
HST 12% 12% 170,000.00
TOTAL rounded $ 1,700,000.00
The above budget has been prepared with care, but the estimate should be revised when the various components are being set out for tender. The author does not guarantee that the above noted program can be completed for the stated costs.

Technical Report Update 2013. Tas Gold Copper Property BC
B.J PRICE GEOLOGICAL CONSULTANTS INC. VANCOUVER B.C 604-682-1501 FEBRUARY 2013
Page 42
A second phase of drilling, and other work, contingent on Favourable results from the program outlined above, is presented below.
Phase II
DESCRIPTION PHASE II UNITS AND RATES AMOUNT CAN$ (rounded)
Geological Supervision and compilation 2 man x 2 months 35,000
Resource Estimate 200,000
Metallurgical Testing 100,000
Camp, Meals and accommodation 15 men x 3 months 50,000
Vehicles, maintenance 2 vehicles x 3 months 25,000
Field Equipment, GPS, Computers, Sat Phone etc. 20,000
Permits 20,000
Equipment Rentals 25,000
Diamond drilling, HQ or NQ all inclusive of assays, freight etc.
12000 meters x $165/m
1,980,000
Geological reporting 45,000
Subtotal 2,500,000
Contingency 10% 250,000
HST 12% 12% 300,000
TOTAL rounded $ 3,050,000
TOTAL PHASES I AND II $ 4,750,000
The above budget has been prepared with care, but the estimate should be revised when the various components are being set out for tender. The author does not guarantee that the above noted program can be completed for the stated costs. Respectfully submitted B. J. Price Geological Consultants Inc.
..........................................................................
Barry James Price, M.Sc., P. Geo., Qualified Person
February 15, 2013

Technical Report Update 2013. Tas Gold Copper Property BC
B.J PRICE GEOLOGICAL CONSULTANTS INC. VANCOUVER B.C 604-682-1501 FEBRUARY 2013
Page 43
REFERENCES
(Those emphasized in bold are the more important reports) Beauchamp, D.A., and Fan, S.F., 1996. Report on the TAS and Val Claims, British Columbia, BCDM Assessment report 24873. Bailey, D.G., 1990. Geological Examination of the TAS Prospect , BCDM Assessment report 20782 Boronowski, A.J., 1989. Geochemical Report on the TAS 1 and 4 Claims, BCDM Assessment report 19980. Boronowski, A.J., 1989. Geochemical Report on the TAS 2 and 6 Claims of the TAS Property , BCDM Assessment report 19981 Boronowski, A.J., and Somerville, R., 1989. Report on the 1989 Diamond Drilling and Trenching Program TAS Property for Black Swan Gold Mines Ltd. Dunlop, Dugald, B.Sc., (2011) LOGISTICS REPORT On GROUND MAGNETIC SURVEY, TAS PROPERTY, OMENICA MINING DIVISION, BC completed for: EAGLE PEAK RESOURCES INC. by Meridian Mapping Ltd. Dated: November 2011. Dunlop, Dugald, B.Sc., (2012) LOGISTICS REPORT On GROUND MAGNETIC SURVEY, TAS PROPERTY, OMENICA MINING DIVISION, BC completed for Inzana Metals Inc. by Meridian Mapping Ltd. Dated: November 2012. Elliott, T.M., 1999. Diamond Drilling Report on the TAS Gold Prospect North of Fort St. James, BCDM Assessment report 26185. Fox, Peter, (2009); Project Report, Tas Gold-Copper Property, Omineca Mining Division, NTS 93K 16, Latitude 54° 55, Longitude 124o19 prepared for: EAGLE Peak Resources Inc. Dated January 30, 2009 Fox, P.E., 2009. Assessment Report, Tas Gold-Copper Property, Omineca Mining Division, dated October 30, 2009. BCDM Assessment report 27152. Fox, P.E., and Scrivens, S., 2010. Assessment Report, Tas Gold-Copper Property, Omineca Mining Division, dated September 10, 2010. BCDM Assessment report 31681. Fox, Peter, (2012) GEOPHYSICAL Assessment REPORT On the TAS COPPER-GOLD PROPERTY Omineca Mining Division, Tas, Taslin, Taz Claims for: RICH ROCK RESOURCES dated January 5, 2012 Fox, Peter, (2013) IP interpretation and Genetic Model for the TAS deposit. Personal correspondence dated February 5, 2013. Halleran A.D., 1989. Summary Report Of The Tas Gold Property for Black Sawn Resources Ltd. dated 1989 Halleran, W., 1994. Trenching and Bulk Sampling Report on the TAS Gold Prospect , BCDM Assessment report 23353 Halleran, W., 2008. Project Summary, Report dated August 19, 2008. Kootchin, Matvei, (2011); Three Dimensional Induced Polarization Survey On The Tas Project Fort St. James, British Columbia, Canada. Survey Conducted By SJ Geophysics Ltd. Prepared November 2011 Maxwell, G and Bradish, L, 1987. Geophysical and Geochemical Report on the TAS 11 Claim, BCDM Assessment report 16657. Maxwell, G and Bradish, L, 1988. Report of Work on the TAS Project, BCDM Assessment report 16763

Technical Report Update 2013. Tas Gold Copper Property BC
B.J PRICE GEOLOGICAL CONSULTANTS INC. VANCOUVER B.C 604-682-1501 FEBRUARY 2013
Page 44
Maxwell, G and Bradish, L, 1988. Report of Work on the TAS Project (TAS 1 - 11 Claims) BCDM. Assessment report 17234 Mowat, U., 1999. Mapping and Sampling on the TAS Claims, BCDM Assessment report 25839. Pezzot, T, 1989. Geophysical Report on Induced Polarization, Magnetic, and Mise-a-la-Masse Surveys on the TAS Project, BCDM Assessment report 19977. Price, Barry J., (2010), Technical Report, Tas Copper Gold Property, Inzana Lake Area, Fort St. James, B.C. prepared for Rich Rock Resources Inc. and Eagle Peak Resources Inc., dated May 10, 2010. 56p. Price, Barry J., (2012a), Technical Report, Tas Copper Gold Property, Inzana Lake Area, Fort St. James, B.C. prepared for Rich Rock Resources Inc. and Eagle Peak Resources Inc., dated March 15, 2012. Schmidt, U., 1988. Report on the Grid Soil Geochemistry of the TAS East Property, BCDN Assessment report 18100. Schmidt, U., 1990. Helicopter Borne Magnetic and VLF-EM Survey, TAS East Property, BCDM Assessment report 1993. Scrivens, Sean, P.Geo., 2010; Report on a Helicopter-Borne Magnetic Gradiometer, VLF-EM & Radiometric Survey, Project Name: TAS, Project Number: 2010-006 prepared for Rich Rock Resources and dated July 20th, 2010. Somerville, R.,1989. Geophysical Report on a Total Field Magnetic Survey and a VLF Survey on the TAS Claims Ridge Zone, BCDM Assessment report Somerville, R., P.Eng. (1989); A report on the Tas Property Ore Reserves for Black Swan Gold Mines Ltd. Dated March 31, 1989. Tryon, Alex, 2012; Logistics Report Prepared For Inzana Metals Inc . Three Dimensional Induced Polarization Survey (SJ Geophysics Ltd.) On The Tas Project dated August 2012 Warner, L., 1985. Report on Soil Geochemical Survey, BCDM Assessment report 13979. Warner, L, and Bradish L, 1987. Assessment Report TAS 2 - 10 Claims, BCDM Assessment Report 15687 Warner, L.M., and Kay, B.G., 2003. Report on Diamond Drilling for the TAS Property, BCDM Assessment report 27152. Wells, Ron, (2006); Report on 2005 Exploration on the Fran Property, Omineca Mining Division British Columbia For Yankee Hat Minerals Ltd. Effective Date: March 22, 2006 Witter, J, (2011) Interpretation Memo (For Tas Property IP Survey) SJ Geophysics Ltd. Dated December 16, 2011.

Technical Report Update 2013. Tas Gold Copper Property BC
B.J PRICE GEOLOGICAL CONSULTANTS INC. VANCOUVER B.C 604-682-1501 FEBRUARY 2013
Page 45
CERTIFICATE OF QUALIFIED PERSON BARRY J. PRICE, P. GEO. I, Barry James Price, hereby certify that: I am an independent Consulting Geologist and Professional Geoscientist residing at 820 East 14th Street, North Vancouver B.C., with my office at Ste. 831 - 470 Granville Street, Vancouver, B.C., V6C 1V5, (Telephone: 682-1501) This certificate applies to the Technical Report titled: Technical Report 2013, Tas Copper Gold Property, Inzana Lake Area, Fort St. James, B.C. (the “Technical Report”) prepared for Rich Rock Resources Inc. and Inzana Metals Inc., and dated February 15, 2013. I am responsible for all parts of this report. I am a registered as a Professional Geoscientist (P. Geo.) in the Province of British Columbia with the Association of Professional Engineers and Geoscientists of BC ("APEGBC") No 19810 - 1992 and I am entitled to use the Seal, which has been affixed to the Technical Report. I am also a member of the Society of Exploration Geologists (SEG) and Canadian Institute of Mining (CIM). I graduated from University of British Columbia, Vancouver B.C., in 1965 with a Bachelor’s Degree in Science (B.Sc.) Honours, in the field of Geology, and received a further Degree of Master of Science (M.Sc.) in Economic Geology from the same University in 1972. I have practiced my profession as a Geologist for the past 45 years since graduation, in the fields of Mining Exploration, Oil and Gas Exploration, and Geological Consulting. I have written a considerable number of Qualifying Reports, Technical Reports and Opinions of Value for junior companies. I have worked in Canada, the United States of America, in Mexico, The Republic of the Philippines, Indonesia, Cuba, Ecuador, Panama, Nicaragua, Tajikistan, The People's Republic of China, and the Republic of South Africa, Chile, and Argentina. I visited the subject Tas property on June 16 and 17, 2010 accompanied by Derry Halleran, original property owner and vendor, and Ken MacDonald P.Geo., consulting geologist of Prince George B.C. following which I completed the 2010 technical Report, which contains a full description of all past work. Prior to the 2010 report I have had no prior association with the property. I have explored and examined similar properties in the Fort. St. James and Manson Creek areas for others, including the Duckling Creek and Lorraine copper and gold properties. I have also worked on numerous other similar copper gold deposits in British Columbia, Mexico, Panama, and the USA. I have based this report in part, on information contained in the Summary and Assessment Report for the property prepared by Peter Fox, Ph.D., P.Eng. and other experienced geologists and engineers and on a review of all available data concerning the subject property supplied by Eagle Peak Resources Inc., and Rich Rock Resources Inc. and on other materials from my own files and other materials obtained from the literature and from the Internet. For the purposes of the Technical Report I am a Qualified Person as defined in National Instrument 43-101. I have no direct or indirect interest in the Tas property in the Omineca Mining Division which is the subject of this report, and I do not hold, directly or indirectly, any interest in the properties or shares of Rich Rock Resources Inc. or Inzana Metals Inc., or any related company in full compliance with section 1.5 of National Instrument 43-101. I have read National Instrument 43-101 and the Technical Report has been prepared in compliance with that instrument. As of the date of the certificate, to the best of my knowledge, information and belief, the Technical Report contains all scientific and technical information that is required to be disclosed the absence of which would make the Technical Report incomplete or misleading. I consent to the public filing of the Technical Report and to extracts from, or a summary of the technical report in the written disclosure being filed subject to keeping the information in context. Dated at Vancouver B.C. this 15
th day of February 2013
.......................................................................... Barry James Price, M.Sc., P. Geo., Qualified Person

Technical Report Update 2013. Tas Gold Copper Property BC
B.J PRICE GEOLOGICAL CONSULTANTS INC. VANCOUVER B.C 604-682-1501 FEBRUARY 2013
Page 46
APPENDIX I GENETIC MODEL AND GEOPHYSICAL INTERPRETATION 2013
The following hypothetical genetic model and geological history of the Tas porphyry, by Dr. Peter Fox,
PhD., P.Eng., as deduced from the known geology and combined 2011 and 2012 induced polarization
surveys is complex. It includes development of an early porphyry copper-gold system associated with
dike emplacement, northward rotation of the dike-porphyry complex to the near horizontal, influx of
low temperature, reducing regional fluids from the host rock Inzana Lake Formation and erosion of
much of the dike complex, leaving isolated remnants north of the Tas pluton. These late fluids
overprinted the early porphyry alteration replacing most of it with chloritic mineral assemblages typical
of late stage propylitic alteration. Much of the northeast striking dike swarm and steep faults also
formed at this time along with formation of fault-controlled gold-bearing massive sulfide replacement
bodies such as the East Zone and other similar bodies exposed in the Ridge Zone.
The above is based on an interpretation of chargeability section 112E (Figure 1) and similar sections
from 118E to 104E (Figure 2). The sections assume the apparent south-dipping contact of the Tas pluton
as indicated by the original chargeability data (Fox, 2012) was originally vertical and the emplacement of
the dike, a tabular apophasis of the Tas pluton, was as indicated in Figures 1 and 2. It is suggested that
the original porphyry and related mineralization and attendant hydrothermal alteration was genetically
related to emplacement of fluid-charged magma derived from the crystallizing Tas pluton, channeled
into the evolving dike complex and subsequently developing a porphyry system related to dike
emplacement. Mineralized rocks as expressed by current chargeability data (Fox 2012 and this report)
now lie at surface and at depths of several hundred metres below thin erosion remnants of the dike unit
more or less parallel to the dike contacts.
The geological history of Tas porphyry as suggEsted above is similar to other copper-gold deposits, such
as the Mt Milligan deposit to the east where the Rainbow dike is a key feature of hydrothermal
alteration patterns and development of porphyry style mineralization. Other tilted and rotated porphyry
deposits include Schaft Creek, Bingham Canyon, Yerrington, San Manuel/Kalamazoo and Butte.

Technical Report Update 2013. Tas Gold Copper Property BC
B.J PRICE GEOLOGICAL CONSULTANTS INC. VANCOUVER B.C 604-682-1501 FEBRUARY 2013
Page 47
FIGURE 1. GEOLOGICAL AND GEOPHYSICAL INTERPRETATION (2013)
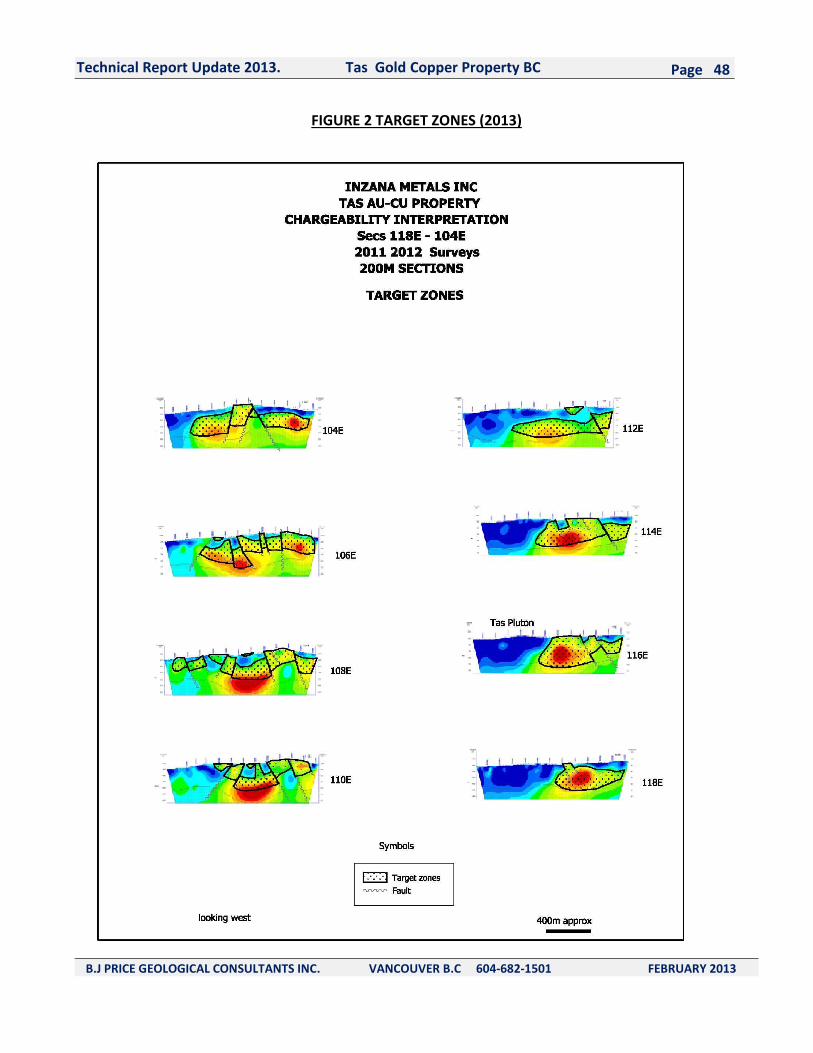
Technical Report Update 2013. Tas Gold Copper Property BC
B.J PRICE GEOLOGICAL CONSULTANTS INC. VANCOUVER B.C 604-682-1501 FEBRUARY 2013
Page 48
FIGURE 2 TARGET ZONES (2013)