Embed Size (px)
Citation preview

TAROOM SEWERAGE Planning Report DRAFT Job No. 763709 Prepared for Banana Shire Council July 2009

TTAARROOOOMM SSEEWWEERRAAGGEE PPLLAANNNNIINNGG RREEPPOORRTT
Banana Shire Council DRAFT 8 July 2009 M:\7637-09\Word\TAROOM REPORT JUNE 2009 V.1(ST).docx Cardno Pty Ltd Page i
Cardno (Qld) Pty Ltd
ABN 57 051 074 992
Level 11 Green Square North Tower
515 St Paul’s Terrace
Fortitude Valley Qld 4006
Locked Bag 4006 Fortitude Valley
Queensland 4006 Australia
Telephone: 07 3369 9822
Facsimile: 07 3369 9722
International: +61 7 3369 9822
www.cardno.com.au
DDooccuummeenntt CCoonnttrrooll
Version Date Author Reviewer
Name Initials Name Initials
DRAFT 8 July 2009 Rick Choktamstit Stephen Tansley
"© 2009 Cardno (Qld) Pty Ltd All Rights Reserved. Copyright in the whole and every part of this document belongs to Cardno (Qld) Pty Ltd and may not be used, sold, transferred, copied or reproduced in whole or in part in any manner or form or in or on any media to any person without the prior written consent of Cardno (Qld) Pty Ltd.”

TTAARROOOOMM SSEEWWEERRAAGGEE PPLLAANNNNIINNGG RREEPPOORRTT
Banana Shire Council DRAFT 8 July 2009 M:\7637-09\Word\TAROOM REPORT JUNE 2009 V.1(ST).docx Cardno Pty Ltd Page ii
TABLE OF CONTENTS EXECUTIVE SUMMARY…………………………………………………………………………1
1. INTRODUCTION ................................................................................................................. 3
1.1 Wastewater Treatment in Taroom .............................................................................. 3 1.2 History of the Treatment Plant ................................................................................... 3 1.3 Objective of this Report .............................................................................................. 3
2. SEWAGE TREATMENT PLANT INFLOW ......................................................................... 4
2.1 Raw Sewage Quantity ................................................................................................ 4
3. EXPECTED FUTURE LOADING AND POPULATION GROWTH ..................................... 7
4. EFFLUENT QUALITY ......................................................................................................... 8
4.1 Effluent Discharge Requirements .............................................................................. 8
5. EXISTING SEWAGE TREATMENT PLANT .................................................................... 12
5.1 Inlet Works ............................................................................................................... 12 5.2 Imhoff Tank .............................................................................................................. 14 5.3 Trickling Filter ........................................................................................................... 16 5.4 Secondary Clarifier (Humus Tank) ........................................................................... 18 5.5 Chlorine Contact Tank ............................................................................................. 20 5.6 Sludge Treatment and Dewatering .......................................................................... 21 5.7 Summary of the Capacity of Existing Process Elements ......................................... 25
6. EFFLUENT MANAGEMENT ............................................................................................ 26
6.1 Effluent Reuse at Taroom Golf Club ........................................................................ 26 6.2 Effluent Reuse at Mr. Rose’s Farm .......................................................................... 26
7. SUSTAINABILITY ASSESSMENT OF EFFLUENT REUSE ............................................ 28
7.1 Model for Effluent Disposal using Land Irrigation (MEDLI) ...................................... 28 7.2 Raw Data Used in MEDLI Runs ............................................................................... 28 7.3 MEDLI Output and Discussions ............................................................................... 28
8. CONCLUSION AND RECOMMENDATIONS ................................................................... 31
9. REFERENCES .................................................................................................................. 33

TTAARROOOOMM SSEEWWEERRAAGGEE PPLLAANNNNIINNGG RREEPPOORRTT
Banana Shire Council DRAFT 8 July 2009 M:\7637-09\Word\TAROOM REPORT JUNE 2009 V.1(ST).docx Cardno Pty Ltd Page iii
LIST OF TABLES Table 2-1 Taroom Typical Raw Sewage Quality ...................................................................... 6 Table 3-1 Predicted Taroom Future STP Loadings and EP..................................................... 7 Table 4-1 Release Quality Characteristic Limits ...................................................................... 8 Table 4-2 Release Quality Characteristic Limits for Irrigation Water ....................................... 8 Table 4-3 Water quality of effluent in the chlorine contact tank (CCT) ................................... 10 Table 5-1 Imhoff Tank Design Values .................................................................................... 14 Table 5-2 Optimal Design Parameters for a Low Rate Trickling Filter ................................... 17 Table 5-3 Optimal Parameters for Comparison ..................................................................... 17 Table 5-4 Humus tank design values ..................................................................................... 19 Table 5-5 Average Sludge Production at Taroom STP (2006-2008) ..................................... 22 Table 5-6 Existing Drying Beds .............................................................................................. 23 Table 5-7 Design Capacity of Each Process Element ........................................................... 25 Table 7-1 MEDLI Output ........................................................................................................ 29 APPENDICES APPENDIX A MEDLI OUTPUTS APPENDIX B Calculations

TTAARROOOOMM SSEEWWEERRAAGGEE PPLLAANNNNIINNGG RREEPPOORRTT
Banana Shire Council DRAFT 8 July 2009 M:\7637-09\Word\TAROOM REPORT JUNE 2009 V.1(ST).docx Cardno (Qld) Pty Ltd Page 1
EXECUTIVE SUMMARY
The Sewage Treatment Plant (STP) at Taroom treats sewage from Taroom Township. The existing facility comprises inlet works comprising screening and grit removal, an Imhoff tank, a trickling filter, a secondary clarifier or humus tank, a chlorine contact tank, chemical storage area, a tool shed and an office.
The forecast average dry weather flow for the design horizon is 167 kL/day
There is an absence of analytical data of the raw sewage and consequently the following assessment of the current sewage treatment plant is based upon the typical medium strength sewage quality found at other STPs within Banana Shire Council area.
The following table summarises the estimated available capacity of each process element:
Plant Element Capacity
(m3/day)
Equivalent ADWF
(m3/day)
Inlet Screens - -
Grit Removal 406 82
Imhoff Tank - Sedimentation 538 179
Imhoff Tank - Digestion 177 177
Trickling Filter 222 222
Secondary Clarifier 707 235.7
Chlorine Contact Tank 369 123
Sludge Dry Beds 280 280
In summary, the main biological process elements are capable of treating sewage for the next 20 years. The critical process elements are the Inlet Works and Chlorine contact Tank which require augmentation. The Trickling Filter will be satisfactory if the distribution system is maintained to provide even distribution of influent flows over the whole of the media.
Historical data shows that the STP performance is not consistent resulting in effluent quality non-conformance events in general this can be overcome by minor changes to operational procedures and maintenance of existing treatment plant elements.
The current effluent disposal method relies on irrigation at the adjacent Golf Course and Farm. MEDLI modelling indicates that this is environmental sustainable however under the Water Supply (Safety and Reliability) Act 2008 Recycled Water Management Plans will need to be formulated to replace the current inadequate agreements.

TTAARROOOOMM SSEEWWEERRAAGGEE PPLLAANNNNIINNGG RREEPPOORRTT
Banana Shire Council DRAFT 8 July 2009 M:\7637-09\Word\TAROOM REPORT JUNE 2009 V.1(ST).docx Cardno (Qld) Pty Ltd Page 2
The following works are recommended to improve the STP performance:
Item Estimated Cost ($)
Install fine screens and grit removal 285,000
Repair/replace Trickling Filter Distributor Arms, repair concrete work 50,000
Install automated sludge draw-off at Humus Tank 8,000
Install automated chlorination system 10,000
Augment Chlorine Contact Tank 7,000
Repair walls at Sludge Drying Bed 5,000

TTAARROOOOMM SSEEWWEERRAAGGEE PPLLAANNNNIINNGG RREEPPOORRTT
Banana Shire Council DRAFT 8 July 2009 M:\7637-09\Word\TAROOM REPORT JUNE 2009 V.1(ST).docx Cardno (Qld) Pty Ltd Page 3
1. INTRODUCTION
1.1 Wastewater Treatment in Taroom
Banana Shire Council is responsible for the collection, treatment and disposal of sewage for the town of Taroom and surrounding areas. The sewage is delivered to the sewage treatment plant (STP) located at Lot 1 on Plan RP132808 in the Parish of Taroom. The treated effluent can be discharged into the Dawson River 1.5 km north-west of the farm under conditions stated in the Integrated Authority No. WT0155: EPA (2002). Currently, the effluent is reused at a golf course and an adjacent farm for irrigation purposes.
1.2 History of the Treatment Plant
The plant was originally built in late 1960’s. The treatment plant is typical of those built in Queensland during this period; the treatment process comprises inlet screening, an Imhoff tank, trickling filter, humus tank and a chlorine contact tank. The digested sludge is drawn from Imhoff tank to the 4 drying beds for dewatering.
According to the asset register record, only the contact tank was installed in 1965 while most of the plant components were installed in 1971. New assets installed during 2000 to 2004 include a storage shed, a wet well pump, a control cabinet, an electrical board and two Hypochlorite storage tanks.
1.3 Objective of this Report
The objective of this Planning Report for Banana Shire Council is to assess the current Taroom sewage treatment plant (STP) and provides necessary recommendations to ensure the requirements for effluent release are met and the effluent reuse schemes are sustainable.
This report addresses and details the following issues;
Predicts the Taroom population growth and future sewage loadings. Reviews inflow load to STP and its daily load profile including the current and historical
operating data. Undertakes physical audit of STP for actual operation and condition of existing
infrastructure. Assesses each process elements in terms of operational efficiency, maximum capacity
and the ability to treat the raw sewage to the required effluent quality. Investigates and reviews the existing treatment plant operations. Recommends actions to achieve to the required effluent quality. Reviews Council’s Integrated Authority issued by the EPA. Reviews Council’s effluent supplying contracts. Assesses suitability and sustainability of existing effluent disposal/re-use practices
having due regard to long term impacts and EPA requirements/guidelines;
TTAARROOOOMM SSEEWWEERRAAGGEE PPLLAANNNNIINNGG RREEPPOORRTT
Banana Shire Council DRAFT 8 July 2009 M:\7637-09\Word\TAROOM REPORT JUNE 2009 V.1(ST).docx Cardno (Qld) Pty Ltd Page 4
2. SEWAGE TREATMENT PLANT INFLOW
2.1 Raw Sewage Quantity
2.1.1 STP Hydraulic Loading
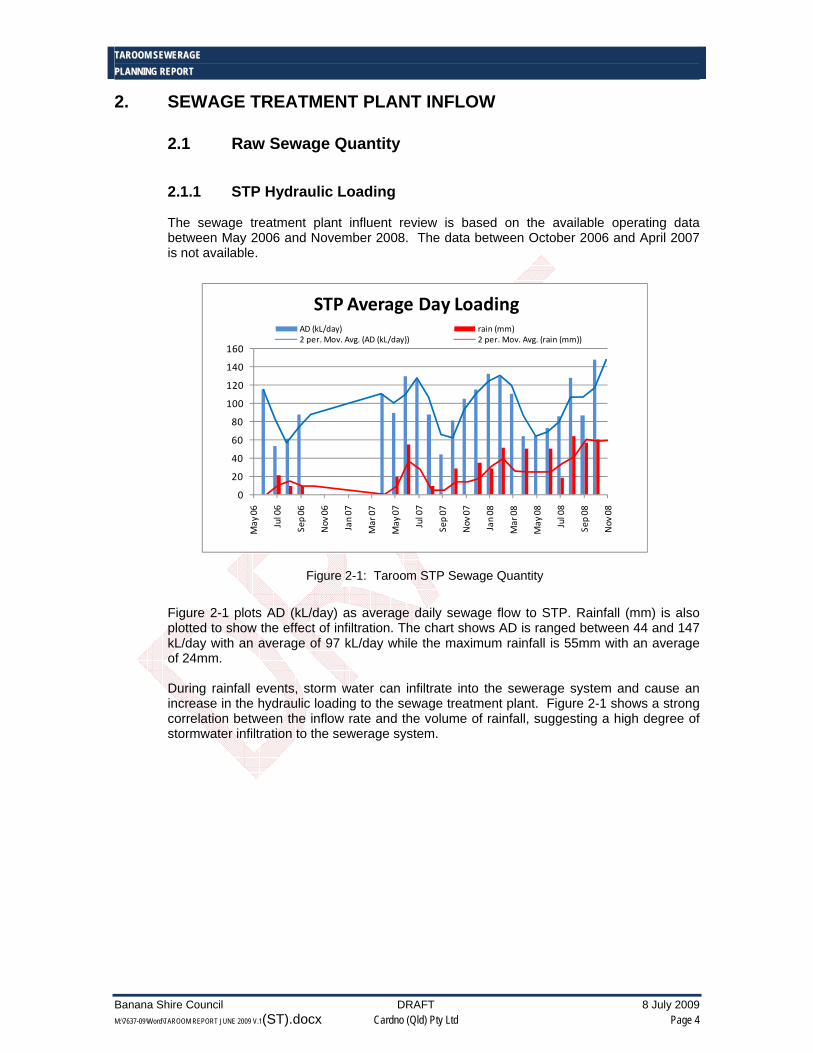
The sewage treatment plant influent review is based on the available operating data between May 2006 and November 2008. The data between October 2006 and April 2007 is not available.
0
20
40
60
80
100
120
140
160
May 06
Jul 06
Sep 06
Nov 06
Jan 07
Mar 07
May 07
Jul 07
Sep 07
Nov 07
Jan 08
Mar 08
May 08
Jul 08
Sep 08
Nov 08
STP Average Day LoadingAD (kL/day) rain (mm)2 per. Mov. Avg. (AD (kL/day)) 2 per. Mov. Avg. (rain (mm))
Figure 2-1: Taroom STP Sewage Quantity
Figure 2-1 plots AD (kL/day) as average daily sewage flow to STP. Rainfall (mm) is also plotted to show the effect of infiltration. The chart shows AD is ranged between 44 and 147 kL/day with an average of 97 kL/day while the maximum rainfall is 55mm with an average of 24mm.
During rainfall events, storm water can infiltrate into the sewerage system and cause an increase in the hydraulic loading to the sewage treatment plant. Figure 2-1 shows a strong correlation between the inflow rate and the volume of rainfall, suggesting a high degree of stormwater infiltration to the sewerage system.

TTAARROOOOMM SSEEWWEERRAAGGEE PPLLAANNNNIINNGG RREEPPOORRTT
Banana Shire Council DRAFT 8 July 2009 M:\7637-09\Word\TAROOM REPORT JUNE 2009 V.1(ST).docx Cardno (Qld) Pty Ltd Page 5
0
50
100
150
200
250
300
0
20
40
60
80
100
120
140
160
Jan Feb Mar Apr May Jun Jul Aug Sep Oct Nov Dec
Rainfall (mm)A
D (kL/day)
STP Loading Cyclerain 2006 rain 2007 rain 20082006 2007 2008
Figure 2-2: Taroom STP Loading Cycle
From the available data, it does not appear that there is any seasonal pattern for the influent flows apart from that related to rainfall.
2.1.2 STP Load Fluctuations
Fluctuations in the rate of raw sewage arriving at the treatment plant affect the efficiency of the various process elements within the plant. All treatment elements have hydraulic load considerations as part of the design of these units. Flows in excess of these design parameters will have a detrimental effect on their performance.
Ideally a wastewater treatment plant should receive a constant, consistent flow 24hrs a day, 7 days a week for optimal biological and physical treatment. However, the flow entering the sewage treatment plant tends to vary throughout the day, month, or year. The instantaneous flow rate, total volume and concentration of contaminants to the plant are dependent on community activity, as well as climatic conditions.
A treatment process that relies on biological activity to treat the sewage is susceptible to underperforming due to sudden fluctuations in incoming flow and/or concentrations of contaminants.
Sewage flow to the STP varies significantly throughout the day. The flow rate is dependent on community activities, commonly the peak periods for municipal sewage treatment plants are between 8-10am and 6-8pm while during late evening and early mornings flow can drop to zero.
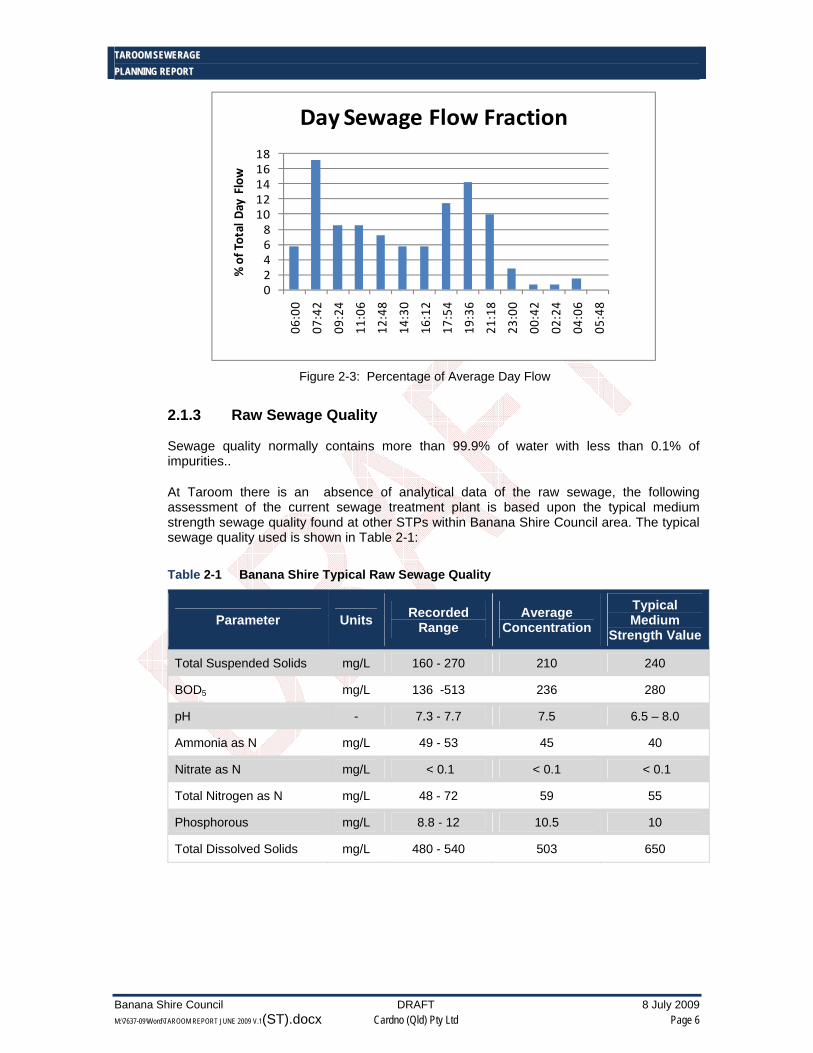
Flow fluctuations throughout the day were captured in the weighted test on 17 March 2009. Figure 2-3 plots STP inflow as percentage of the daily flow over 24 hours. STP inflow starts at 6am (6% daily flow), peaks (17%) around 8am, then inclines to 5-8% during the day. The flow increases again around 6-9pm (10-14%) and drops to the lowest rates (0-3%) for the rest of the night.
TTAARROOOOMM SSEEWWEERRAAGGEE PPLLAANNNNIINNGG RREEPPOORRTT
Banana Shire Council DRAFT 8 July 2009 M:\7637-09\Word\TAROOM REPORT JUNE 2009 V.1(ST).docx Cardno (Qld) Pty Ltd Page 6
02468
1012141618
06:00
07:42
09:24
11:06
12:48
14:30
16:12
17:54
19:36
21:18
23:00
00:42
02:24
04:06
05:48
% of Total Day Flow
Day Sewage Flow Fraction
Figure 2-3: Percentage of Average Day Flow
2.1.3 Raw Sewage Quality
Sewage quality normally contains more than 99.9% of water with less than 0.1% of impurities..
At Taroom there is an absence of analytical data of the raw sewage, the following assessment of the current sewage treatment plant is based upon the typical medium strength sewage quality found at other STPs within Banana Shire Council area. The typical sewage quality used is shown in Table 2-1:
Table 2-1 Banana Shire Typical Raw Sewage Quality
Parameter Units Recorded Range
Average Concentration
Typical Medium
Strength Value
Total Suspended Solids mg/L 160 - 270 210 240
BOD5 mg/L 136 -513 236 280
pH - 7.3 - 7.7 7.5 6.5 – 8.0
Ammonia as N mg/L 49 - 53 45 40
Nitrate as N mg/L < 0.1 < 0.1 < 0.1
Total Nitrogen as N mg/L 48 - 72 59 55
Phosphorous mg/L 8.8 - 12 10.5 10
Total Dissolved Solids mg/L 480 - 540 503 650

TTAARROOOOMM SSEEWWEERRAAGGEE PPLLAANNNNIINNGG RREEPPOORRTT
Banana Shire Council DRAFT 8 July 2009 M:\7637-09\Word\TAROOM REPORT JUNE 2009 V.1(ST).docx Cardno (Qld) Pty Ltd Page 7
3. EXPECTED FUTURE LOADING AND POPULATION GROWTH
Low population growth rate is expected for Taroom in the next 20 years. The Strategic Asset Management Plan for Water Supply and Sewerage Service; Taroom Shire Council, October 2004 (SAMP 2004) suggests no significant change in population until 2014.
The Queensland’s future population 2008 (Department of Infrastructure and Planning, the State of Queensland) also suggests low population growth and estimates the average population growth in Taroom Shire area to be 0.9% annually from 2006 to 2031.
The SAMP 2004 suggests that in 2004 Taroom population is 700EP and the sewage produced is 162m3/day. This equates to a sewage generation rate of 231.43 L/EP.
The SAMP 2004 predicts the sewage flow rates between 2004 and 2014 as shown in Table 3-1. For the purpose of planning, the future loadings of 2019, 2024 and 2029 are calculated based on the same increasing rate of sewage flow. The EP of each year is also calculated by assuming each EP generates 231.43 232 L/day of sewage.
The results are shown in the following table:
Table 3-1 Predicted Taroom Future STP Loadings and EP
Scheme Sewage Flow (ML/day)
2004 2009 2014 2019 2024 2029
Sewerage Flow (ML/day) 0.162 0.163 0.164 0.165 0.166 0.167
EP (232 L/EP) 700 704 709 713 717 722
According to the calculation results, in 2029 the sewage flow to Taroom STP will be 167m3/day and the STP will be serving a population of 722EP.

TTAARROOOOMM SSEEWWEERRAAGGEE PPLLAANNNNIINNGG RREEPPOORRTT
Banana Shire Council DRAFT 8 July 2009 M:\7637-09\Word\TAROOM REPORT JUNE 2009 V.1(ST).docx Cardno (Qld) Pty Ltd Page 8
4. EFFLUENT QUALITY
4.1 Effluent Discharge Requirements
4.1.1 EPA Requirements
The Banana Shire Council has an Integrated Authority (Licence No.WT0155) to operate the Taroom Sewage Treatment Plant. The conditions of this authority are legislated under the Environmental Protection Act 1994 and Council is required to ensure the specified quality of the effluent is met and the risk of environmental harm is reduced. The licence provides effluent management options as follows:
The treated sewerage effluent from the STP can be released at the “Release Point: T1” to waters described as the Dawson River. The effluent quantity allowed to be released must not exceed 300 kL/day. The quality of the released effluent must meet the followings:
Table 4-1 Release Quality Characteristic Limits
Quality Characteristic Release Limit Limit Type
BOD5 (mg/L) 20 80%tile
SS (mg/L) 30 80%tile
pH 6.5-8.5 Range
Faecal Coliforms (org/100mL) 1000 Max
Chlorides 300-700 Range
TDS 1500 Max
Dissolved Oxygen (mg/L) 2 Min
The treated effluent can be reused for irrigation in a sustainable manner and the quality must meet the following:
Table 4-2 Release Quality Characteristic Limits for Irrigation Water
Quality Characteristic Release Limit Limit Type pH 6.5-9.0 Range
Faecal Coliforms (org/100mL) 1000 Max
Chlorides 700 Max
TDS 1500 Max
4.1.2 Law and Regulations for Recycled Water Supply
The supply of effluent from the STP is regulated under provisions included in the Water Supply (Safety and Reliability) Act 2008 (the Act). The Act came into force on 1 July 2008 and is administered by the Department of Natural Resources and Water (NRW). The regulator under the Act is the chief executive of NRW. The provisions for recycled water supply in the Act aim to protect public health whilst ensuring the water supply needs of the community are met.

TTAARROOOOMM SSEEWWEERRAAGGEE PPLLAANNNNIINNGG RREEPPOORRTT
Banana Shire Council DRAFT 8 July 2009 M:\7637-09\Word\TAROOM REPORT JUNE 2009 V.1(ST).docx Cardno (Qld) Pty Ltd Page 9
The Act states that; “the multiple-entity recycled water scheme must not supply recycled water unless there is an approved recycled water management plan for the supply of the water”.
As the recycled water provider of the Taroom scheme, Banana Shire Council is required by the Act to have either of the following before supplying recycled water unless they are covered by a transitional period as described in sections 631–634 of the Act:
A recycled water management plan (RWMP) approved by the regulator; or An exemption from preparation of a RWMP granted by the regulator (refer to Recycled
Water Management Plan Exemption Guidelines).
These requirements are being undertaken as part of the Recycle Water Management Plan Report (RWMP) for Banana Shire Council.
4.1.3 Classification for Irrigation
The Water Quality Guidelines for Recycled Water Scheme 2008 suggests that for irrigating non-food crops, the irrigator may use any relevant guidelines as a benchmark when determining the appropriate water quality criteria for the irrigation with appropriate control measures. The Public Health Regulation 2005 outlines quality standards for recycled water based on the presence of E.Coli. The regulation defines quality standard of each class in the following sections:
Schedule 3C: quality standard of Class A+ recycled water; Schedule 3D: quality standards of for Class A, B, C and D recycled water.
Schedule 3D classifies recycled water Classes A – D based on the results of test for presence of E.Coli. Testing must be undertaken on a weekly basis and each class standard requires that 95% of the samples taken in a 12 month period must meet the specified E.Coli Level.
In order to verify the recycled water Class for Taroom STP effluent, at least 52 weekly test results are required. Therefore, with the limited data available, the STP effluent can not be classified. However, the available results indicate that STP’ s best performance in reducing E.Coli was less than 2 cell/100mL which is equivalent to recycled water Class A (Schedule 3D). This suggests that the STP is capable of producing Class A effluent If the performance is consistence over 52 weeks monitoring (52 samples) as required by Schedule 3D. The Queensland Water Recycling Guidelines 2005; part 7.3.7 contain guidelines which are applicable for Taroom’s effluent reuse schemes as follows: Guidelines for Pasture Irrigation, stock watering and agricultural wash down
Where there is no assurance of effective control over the timing of public access to any area irrigated with recycled water, and above-ground irrigation delivery systems are used, only Class A recycled water should be used. Where sub surface irrigation is used, Class C recycled water may be used with uncontrolled access. Drip irrigation may not lead to ponding of the water.

TTAARROOOOMM SSEEWWEERRAAGGEE PPLLAANNNNIINNGG RREEPPOORRTT
Banana Shire Council DRAFT 8 July 2009 M:\7637-09\Word\TAROOM REPORT JUNE 2009 V.1(ST).docx Cardno (Qld) Pty Ltd Page 10
Class C recycled water could also be used for spray irrigation in areas where public access can be prevented during irrigation and for long enough after irrigation wetted surface has dried, or be used for subsurface irrigation.
Class B recycled water can be used for irrigation of pasture and fodder for dairy animals where there is no withholding period between irrigation and feeding;
Class C recycled water can be used for irrigation of pasture and fodder for dairy animals where there is a 5 day with holding period;
Recycled water for stock drinking water should meet the requirements for Class B, with the exception that stock should not be exposed to recycled water that contains Helminth (tapeworm) eggs
Recycled water for non food crops such as silviculture, cotton, turf production and nurseries should be of at least Class D quality
These guidelines are primarily aimed at ensuring public safety whilst the EPA requires long term environmental sustainability to be assessed and shown that the application of the effluent for the various uses is not detrimental to the environment in the long term.
4.1.4 Current Treated Effluent Quality
The effluent quality is routinely monitored at the plant’s Chlorine Contact Tank (CCT) as it is the final point before the effluent leaves the STP. The other test results undertaken on water from the farm’s paddock and the golf course dam are not relevant to this assessment of plant performance as they are beyond the Council’s control as described in the effluent supply agreements.
The following test results are from 2006 and 2008:
Table 4-3 Water quality of effluent in the chlorine contact tank (CCT)
PARAMETERS UNITS composite 18/03/09
11:0020/02/08
11:0014/06/07
11:00 21/02/07
10:0011/01/06
BOD5 mg/L 3 30 16 21 26
TDS mg/L 755 382 449 384 -
SS mg/L 21 19 18 6 35
Chlorides mg/L - 40.2 38.4 60.6 35.6
DO mg/L - 1.8 3.5 2.3 1.6
pH - 7 7.2 7.5 7 7.4
E.Coli/ 100mL Org <10 <2 1400 <2
Nitrate mg/L 85.8 44.1 59.3 26.4 21.6
NH4 as N mg/L <0.05 5.99 27.5 15 22.7
T-N mg/L 21.7 17.2 52.6 26.5 34.6
T-P mg/L 7.4 6.5 9.1 7.7 6.7
As discussed earlier, the effluent can be released from the STP to the water way or for irrigation purposes under conditions stated in the EPA license. The conditions specify the target effluent qualities that need to be met. The following discusses each parameter against the target.

TTAARROOOOMM SSEEWWEERRAAGGEE PPLLAANNNNIINNGG RREEPPOORRTT
Banana Shire Council DRAFT 8 July 2009 M:\7637-09\Word\TAROOM REPORT JUNE 2009 V.1(ST).docx Cardno (Qld) Pty Ltd Page 11
BOD5 (80th percentile) and SS (80th percentile) are required to be lower than 20 and 30 mg/L respectively. The tests are undertaken quarterly and the results are evaluated annually. The available records show the STP is able to meet both limits but the performance is inconsistent.
TDS, pH and chlorides level are well within the limit.
5. E.COLI COUNTS INDICATE THAT THE STP IS ABLE TO PRODUCE LESS THAN 2 CELLS PER 100 ML WHICH IS WELL UNDER THE LIMIT. HOWEVER, THIS PERFORMANCE IS ALSO INCONSISTENT.

TTAARROOOOMM SSEEWWEERRAAGGEE PPLLAANNNNIINNGG RREEPPOORRTT
Banana Shire Council DRAFT 8 July 2009 M:\7637-09\Word\TAROOM REPORT JUNE 2009 V.1(ST).docx Cardno (Qld) Pty Ltd Page 12
5. EXISTING SEWAGE TREATMENT PLANT
The sewage treatment plant at Taroom is typical of plants built in the late 60’s early 70’s, consisted of primary sedimentation, biological treatment and disinfection before discharging to local waterway. These types of plants were designed to typically produce a secondary treated effluent quality of 20mg/L BOD5, 30mg/L suspended solids, with no nutrient removal, although some nitrification may occur in the trickling filter under low-load conditions and ammonia volatilisation may occur if storing in a pond. The process system at Taroom consists of the following units;
Inlet works Imhoff tank (combined Primary Sedimentation and Sludge Digester) Trickling filter; Secondary Clarifier (Humus Tank); Disinfection contact tank.
5.1 Inlet Works
5.1.1 General Consideration
The objective on the Inlet works is to remove gross solids and grit from the flow to prevent blockages and other damage to downstream process elements in the treatment plant. The Inlet works usually comprises of screening and grit removal as a single treatment unit. The screens are designed to capture gross inorganic solids, such as toilet paper, rags etc and remove them from the flow to prevent blocking downstream pipes and pumps. Following the screens, the water flows through the grit removal system, where heavier solid particles, such as grit, sand and other solids are removed from the sewage flow by gravity settlement. Grit in the sewage can cause premature failure of pipes, pumps and valves due to the abrasive action of the grit. The grit accumulated on the bottom of the channel is contaminated with organic matter and will have the potential to cause odour problems when removed and left exposed to the air for too long a period.
The design of the grit channels relies on reducing the velocity of the wastewater to a point where the heavier particles settle out and collect on the floor of the channel. The recommended maximum design velocity for grit channels is 0.3 m/s.
5.1.2 Assessment of Inlet Works
The inlet works at Taroom has only cast iron bar screens with a bar spacing of 50mm. The screen is installed in the inlet channel which is rectangular with flat bottom and dimension of 0.3 m wide, 0.5 m deep and 5 m long. At the end of this rectangular section the width narrows to 0.15 m (Parshall Flume shade) then expands back to the end channel section which leads into the Imhoff tank. The end section is 0.3m wide and 0.9 m long.
Grit accumulated in the channel can cause odour. The operator manually cleans the screen and grit channel daily and no odour detected during the site visit.

TTAARROOOOMM SSEEWWEERRAAGGEE PPLLAANNNNIINNGG RREEPPOORRTT
Banana Shire Council DRAFT 8 July 2009 M:\7637-09\Word\TAROOM REPORT JUNE 2009 V.1(ST).docx Cardno (Qld) Pty Ltd Page 13
Figure 5-1: Inlet Works at Taroom
The 50 mm screen spacing will allow a considerable quantity of inorganic material as evidenced by the material on the surface of the tank to be discharged into the Imhoff Tank adding to the solids loading and reducing the effectiveness of the digestion chamber.
Figure 5-2: Imhoff Tank
The inlet channel discharges into the Imhoff Tank as a rectangular weir which effectively controls the depth of flow and hence the velocity. A free discharge equivalent to 3ADWF (5.8 L/sec) results in a depth of flow of 36 mm and a velocity of 0.32 m/sec which is marginally above the recommended maximum. At peak wet weather flow (5ADWF) the velocity in the Inlet Channel is calculated at 0.38 m/sec compared with the recommended velocity of 0.3 m/sec. It is likely therefore that during diurnal peak flows and during wet weather events grit will be carried into the Imhoff Tank reducing its effectiveness.
It is therefore recommended that fine screens and a vortex type grit removal system complete with grit classifier is installed at Taroom as has recently been completed at Biloela STP. The estimated cost of this work is $285,000.

TTAARROOOOMM SSEEWWEERRAAGGEE PPLLAANNNNIINNGG RREEPPOORRTT
Banana Shire Council DRAFT 8 July 2009 M:\7637-09\Word\TAROOM REPORT JUNE 2009 V.1(ST).docx Cardno (Qld) Pty Ltd Page 14
5.2 Imhoff Tank
5.2.1 General Consideration
An Imhoff tank was often used at treatment plants for small communities of less than 1500 people. The objective of Imhoff tank is to settle the suspended solids in the sewage and anaerobically digest them. This undertaken in a deep two storey tank consisting of an upper continuous flow sedimentation tank and a lower sludge digestion chamber. The clear water leaves the tank from the upper chamber while settleable solids are settled and collected in bottom of the lower chamber where it is anaerobically digested before being discharged to the drying beds. This process should generally remove 30-35% of BOD5 and 50-60% of volatile suspended solid from the raw sewage.
The physical design of an Imhoff Tank is based on the surface loading rate, retention time, digestion chamber volume and floor slope of hopper bottom. The surface loading rate is given in terms of cubic metres of flow per square meter of surface area per unit of time, usually per day.
Typical design parameters for an Imhoff tank are shown in Table 6.1, taken from the Queensland Guidelines for Planning & Design of Sewerage Schemes,. It should be noted that these criteria relate to the individual compartments of the tank i.e. sedimentation compartment or digestion compartment not to the tank as a whole
Table 5-1 Imhoff Tank Design Values
Item Units Criteria Surface loading rate at 3ADWF m3/m2/d <25
Retention time at 3ADWF hrs >2.0
Anaerobic Digester volume for primary and secondary sludge m3/EP 0.1- 0.14
Suspended solids removal rate % 40 – 70
BOD5 removal % 20 – 50 The surface loading rate for optimal operation is given in literature as 25m3/m2/day, (Water Resources Commissions Department of Primary Industries, QLD Guidelines for Planning & Design of Sewerage Schemes, September 1992). This rate is designed to achieve a removal efficiency of 30% for BOD5 and 60% for suspended solids.
For normal primary sedimentation tanks if the retention time is too long the content of the tank, especially the settled sludge, can become anaerobic and generate unpleasant odours and if the retention time is too short the tank will be inefficient and the suspended solids and BOD5 removal efficiency will be reduced. In the case of an Imhoff tank the sludge settles into the digestion chamber where anaerobic digestion is encouraged. The internal baffles prevent the rising sludge from entering the clarified effluent zone and directs the biogas through to the side zones. This prevents any rising solids passing through to the clarified effluent.

TTAARROOOOMM SSEEWWEERRAAGGEE PPLLAANNNNIINNGG RREEPPOORRTT
Banana Shire Council DRAFT 8 July 2009 M:\7637-09\Word\TAROOM REPORT JUNE 2009 V.1(ST).docx Cardno (Qld) Pty Ltd Page 15
5.2.2 Assessment of the Imhoff Tank
According to the asset register, the Imhoff Tank was built in 1971 has 8.2m diameter and a predicted 80 year useful life. It is therefore expected to need to be replaced in 2051. The original drawings of the Imhoff Tank are unavailable therefore the dimensions were determined on site:
The sedimentation section has a surface area of 23.65m2 (4.3m width and 5.5m length). The sedimentation volume is approximately 68.6m3 (calculated between the top water level and slot level: 4.04m depth).
Calculating the maximum allowable sewage flow based on each of the parameters contained within the QLD Guidelines:
Surface loading rate of 25 m3/m2-d ; maximum flow = 591m3/d Weir overflow rate of 125 m3/m2-d ; maximum flow =538m3/d At 590 m3/d; the retention time is 2.6 hours
From the results, the Imhoff tank capacity is limited by the weir overflow rate which limits the flow rate to 538m3/day. As the suggested parameter is based on 3ADWF, therefore, the maximum capacity based on average flows is 179 m3/day.
This additional capacity and consequent long retention time under current dry weather flow conditions results in algal growth within the Imhoff Tank and will at times of higher flow lead to carryover of this algal material to the Trickling Filter increasing the solids loading on that plant element.
Calculating the Imhoff digester volume:
Cone volume up to the straight wall with 0.6 m’ diameter flat bottom = 77 m3 Volume of straight wall section up to 0.5 meter below the slot = 30.30 m3 Total digestion volume = 70.56 + 30.30 = 107.3 m3
As the existing Imhoff tank works as a low rate digester and treats primary sludge and recycled sludge generated from trickling filter, the Guidelines (QLD Guidelines for Planning & Design of Sewerage Schemes, September 1992, Table 14.0) suggests that for this application, the digestion volume required is 0.1 – 0.14m3/EP.
Calculating the equivalent EP based on the suggested digestion volume of 0.14m3/EP:
Maximum EP based on the existing digestion volume = 107.3/0.14 = 766EP Allow 232L/EP: maximum STP inflow based on the existing digestion volume = 766 x
232/1000 = 177m3/d.
Therefore, as limited by its digestion volume the existing Imhoff is capable of treating STP inflows up to 177m3/d provided that the grit removal efficiency of the inlet works is improved

TTAARROOOOMM SSEEWWEERRAAGGEE PPLLAANNNNIINNGG RREEPPOORRTT
Banana Shire Council DRAFT 8 July 2009 M:\7637-09\Word\TAROOM REPORT JUNE 2009 V.1(ST).docx Cardno (Qld) Pty Ltd Page 16
Figure 5-3: Imhoff Tank at Taroom
During the site inspection the Imhoff tank appeared visually to be in good condition.
The current loading is below the recommended maximum in the Guidelines, operational practices could be improved by adjusting the sludge draw-off by routinely monitoring the sludge bed level. This may reduce the load on the sludge drying beds and ensure a stable sludge is being produced.
5.3 Trickling Filter
5.3.1 General Considerations
The trickling filter treats the soluble organic matter in the clarified wastewater from the Imhoff tank. The clarified wastewater is distributed evenly over the filter surface through the rotating distributor arms and flows down through the rock media of the filter. A biological slime containing bacteria and protozoa grows on the media and as the wastewater passes over the slime the bacteria purifies the wastewater by converting the organic material into harmless compounds – mainly carbon dioxide and water.
Some nitrification may occur if the filter has a light organic loading with the subsequent reduction in ammonia concentration in the wastewater. Effluent from the base of the filter is collected and directed to the secondary clarifier where the solids are separated from the treated effluent while the sludge is collected and returned to the inlet works.

TTAARROOOOMM SSEEWWEERRAAGGEE PPLLAANNNNIINNGG RREEPPOORRTT
Banana Shire Council DRAFT 8 July 2009 M:\7637-09\Word\TAROOM REPORT JUNE 2009 V.1(ST).docx Cardno (Qld) Pty Ltd Page 17
The recommended hydraulic loading rate at which the effluent passes through the media should not exceed 0.8 m3/m3 media per day. Above this rate the effluent will not have adequate contact time with the biological slime on the media to ensure full treatment. Conversely, the filter media must remain moist at all times. If the media is allowed to dry out for a prolonged period the microorganisms will start to die and the treatment efficiency is reduced. To prevent the media drying out during periods of low flow rate it is normal practice to recirculate treated effluent to the filter.
The optimal design parameters for a trickling filter are summarised in Table 5-2 below. The loading rates given in Table 5.5 are designed to achieve a treated effluent quality of 20 mg/L BOD5 and 30 mg/L suspended solids for a water temperature of 200C.
Table 5-2 Optimal Design Parameters for a Low Rate Trickling Filter
PARAMETER UNIT VALUE
Hydraulic Loading Rate m3/m3 media /day 0.3 – 0.8
Organic Loading Rate kg BOD5/m3/day 0.07-0.22
5.3.2 Assessment of the Trickling Filter
The overflow from the Imhoff tank gravitates into the central well in the trickling filter and disperses out through the outlet holes in the distribution arms. The effluent flowing out of the arms generates enough force to rotate the arms across the surface of the media of the trickling filter. The effluent is then collected in the underdrainage system and directed to the secondary clarifier tank.
In the absence of engineering drawings and technical data, a measurement at site indicates the trickling filter dimension of 14m diameter with 1.8m media depth. Therefore, the calculated media volume is 277m3.
Using the suggested optimum parameters to calculate maximum capacity of the filter, the results are:
Table 5-3 Optimal Parameters for Comparison
DESIGN PARAMETER
OPTIMAL VALUES (m3/m3 media /day)
OPTIMAL CAPACITY (m3/day)
Hydraulic Loading Rate 0.3 - 0.8 83 - 222
Organic Loading Rate 0.07 - 0.22 99 - 311
From the table, the results indicate that the maximum filter capacity is limited by hydraulic load with maximum capacity of 222m3/day. Based on the organic loading rate, the optimum operating range is from 99 m3/day to 311 m3/day.
During the site inspection, the filter was operating within the suggested range. The distribution systems installed on the filter consisted of the rotating 4-arm distributor and fixed sprinklers. The 4-arm distributor was in poor condition and needs to be repaired or replaced. The fixed sprinklers on the filter were found to be assisting with distributing flow over the media surface but approximately 1 meter width of dry media was measured from the outer media bed perimeter. This results in reducing the active media volume by over

TTAARROOOOMM SSEEWWEERRAAGGEE PPLLAANNNNIINNGG RREEPPOORRTT
Banana Shire Council DRAFT 8 July 2009 M:\7637-09\Word\TAROOM REPORT JUNE 2009 V.1(ST).docx Cardno (Qld) Pty Ltd Page 18
25% which therefore proportionally reduces the BOD5 removal efficiency and calculated capacity to 167 m3/day; the plant’s ultimate capacity.
Figure 5-4: Trickling Filter at Taroom
Beside the distributor arm that needs immediate attention, the cracks in the water collection channel around the bottom of the filter also need to be fixed to prevent water ponding and seepage into the water table. The filter structure appeared to be in good condition.
5.4 Secondary Clarifier (Humus Tank)
5.4.1 General Consideration
The purpose of the secondary clarifier (humus tank) is to separate the humus solids or sludge from the trickling filter effluent. The clarified effluent passes to the disinfection tank while the sludge settles to the tank floor and is returned upstream to the inlet works.
5.4.2 Assessment of the Humus Tank
The design of humus tank in this application is similar to the design of primary sedimentation tanks. The accepted design parameters for a humus tank based on the QLD Guidelines for Planning & Design of Sewerage Schemes, Vol 2, Section 12 are shown in Table 5-4:

TTAARROOOOMM SSEEWWEERRAAGGEE PPLLAANNNNIINNGG RREEPPOORRTT
Banana Shire Council DRAFT 8 July 2009 M:\7637-09\Word\TAROOM REPORT JUNE 2009 V.1(ST).docx Cardno (Qld) Pty Ltd Page 19
Table 5-4 Humus Tank Design Values
Parameters Units ValuesSurface Loading Rate at Peak flow at m3/m2/d 25
Retention time at 3ADWF hrs 2.0
Weir overflow rate at 3ADWF m3/m/d 250
Field measurements were used to calculate the capacity of the existing humus tank. The tank is cylindrical with a diameter measured to be 6 m. The effective volume is calculated by measuring the depth of water to the sludge bed.
Calculating the maximum flow as limited by each of the parameters based on the suggested design values:
Surface loading rate of 25 m3/m2-d : 707 m3/d Weir overflow rate of 125 m3/m2-d : 4,712 m3/d At 706 m3/d, the retention time is 6.7 hours
According to the results, the maximum flow rate is limited by the surface loading rate which indicates that the existing clarifier can operate at a flow up to 707m3/day. This criteria is based on 3ADWF, therefore the design ADWF of the secondary clarifier is 707/3 = 235.6 m3/day.
The tank is required to settle the solids, and allow clarified effluent to pass through to the chlorination contact tank. Longer retention time allows greater solid settlement however, excessive sludge retention time will allow anoxic and anaerobic conditions to develop which promotes the denitrification process producing nitrogen gas which rises to the surface as bubbles. The rising bubbles disturb the sludge blanket and reduce settling efficiency and is evidenced by sludge floating on the surface of the tank..
During the site visits the clarified water overflowing to the CCT appeared to be clear but the sedimentation section of the humus tank looked to be turbid, green and murky. Scum and other material was visible floating on the surface with some bubbles rising from the bottom.
The analytical results reveal the effluent suspended solids ranges from 6-40 mg/L, indicating performance inconsistency which is possibly due to sludge retained in the tank. Some Nitrates are also evident in the final effluent which indicates that a level of nitrification is occurring.
The sewage flow between 2006 and 2008 is in the range of 120-140 m3/day which equate to 34-40 hours retention time. The current practice to manually draw off sludge every morning is therefore insufficient as the anoxic condition and denitrification was evident. It is also reported that at times the operators need to keep birds and ducks out of the clarifier.
Therefore, the following is recommended:
The Humus Tank should be drained and cleaned at least once a year. An automatic sludge draw-off system should be installed and adjusted to suit the plant
load. The interval between sludge draw off should not be longer than 4-6 hours.

TTAARROOOOMM SSEEWWEERRAAGGEE PPLLAANNNNIINNGG RREEPPOORRTT
Banana Shire Council DRAFT 8 July 2009 M:\7637-09\Word\TAROOM REPORT JUNE 2009 V.1(ST).docx Cardno (Qld) Pty Ltd Page 20
Figure 5-2: Humus tank at Taroom STP.
5.5 Chlorine Contact Tank
5.5.1 General
Clear water from the secondary clarifier enters the chlorine contact tank (CCT) for disinfection. Sodium hypochlorite is used as disinfection agent. A 30 minute retention time is generally considered adequate to achieve the maximum bacteriological kill rate.
5.5.2 Assessment of Chlorine Contact Tank
Sodium hypochlorite dosing rate is currently manually set once per day based on a chlorine residual test to target 0.6mg/L. This results in not being able to maintain the chlorine target when the influent flow changes. Ideally, the dosage should be automatically adjusted to match the load. It is recommended to install a control system to monitor the chlorine residue level at the outlet to the CCT and automatically adjust the dosing rate to maintain the preset target value.
Sodium hypochlorite is stored in two polyethylen tanks located within a coated masonry and concrete bund. Access is difficult and should be improved.
The existing CCT has a dimension of 1.4m length x 1.5m width and 1.25m height up to the overflow level. The calculated volume up to the overflow weir is 7.68m3.
The maximum flow that the CCT can provide sufficient retention time is:
Max flow = 7.68 x 24 x 60 / 30 = 368.6 m3/day = 4.2 L/s

TTAARROOOOMM SSEEWWEERRAAGGEE PPLLAANNNNIINNGG RREEPPOORRTT
Banana Shire Council DRAFT 8 July 2009 M:\7637-09\Word\TAROOM REPORT JUNE 2009 V.1(ST).docx Cardno (Qld) Pty Ltd Page 21
= 121 kL/day ADWF This is less than both the current flows and the predicted 3ADWF of 5.8 L/sec and the size of the CCT should be increased by an additional 2.8 m3. This can be achieved by installing an additional chamber of approximately 1.5 m square adjacent to the existing inlet channel.
Figure 5-3: Chlorination System
5.6 Sludge Treatment and Dewatering
5.6.1 Sludge Production
Sludge produced in a sewage treatment plant may be defined as a concentrated dispersion of solids from the treatment processes suspended in water. The solids in the sludge are mainly of a biological nature (biosolids) produced as a waste product of the biological purification. In general, the biosolids are in the order of 70 - 80% organic matter with the balance being inert, inorganic material. The nature and physical characteristics of the sludge depends on its origins. Raw, undigested (stabilised) sludge is usually a grey colour with a viscous, lumpy consistency due to its organic nature and has an objectionable odour when exposed to air. It is produced by the settlement of the organic matter contained in the raw sewage. The raw sludge anaerobically digests in the bottom hopper of the Imhoff Tank which changes its characteristics. Fully digested sludge is a black colour with a characteristic “tarry” odour and a creamy appearance. Sludge production can be estimated using flow data, the average suspended solid concentration in the influent and assuming a 50% solid reduction by digestion. The sludge removed from the Imhoff tank is likely to be around 2 - 4% dry solids.

TTAARROOOOMM SSEEWWEERRAAGGEE PPLLAANNNNIINNGG RREEPPOORRTT
Banana Shire Council DRAFT 8 July 2009 M:\7637-09\Word\TAROOM REPORT JUNE 2009 V.1(ST).docx Cardno (Qld) Pty Ltd Page 22
Currently at Taroom STP, sludge is removed from the bottom of the Imhoff Tank approximately every 6 - 8 weeks and transferred directly to sludge beds for drying. This sludge originates from the raw sludge settled out from the influent and humus sludge returned from the secondary clarifier. In a well operated Imhoff Tank this sludge should be a relatively stable anaerobically digested sludge.
Table 5-5 shows a calculation of sludge production based on the current operating practice and using an average raw sewage flow to STP during 2006 - 2008:
Table 5-5 Average Sludge Production at Taroom STP (2006-2008)
Parameters Units Value
Average STP inflow m3/day 100
Typical QLD mid-strength suspended solid mg/L 240
Suspended solids load to treatment plant kg/d 24
Suspended solids captured in Imhoff tank (assume 60%) kg/d 14
Volatile Solid (assume 70%) kg/d 10
Volatile Solid loss through anaerobic digestion % 50
Total Solids after digestion kg/d 9
Sludge Draw off interval weeks 6
Estimated sludge dry solids content % 3
Sludge volume transferred to drying beds m3 13
5.6.2 Sludge Treatment
The sludge treatment process in place at Taroom STP is based on anaerobic digestion. The sludge is held for 30 - 45 days at ambient temperatures under anaerobic conditions. In the process, specific groups of anaerobic bacteria decompose the various groups of organic matter in the sludge, breaking them down to simple compounds, mainly water, carbon dioxide, methane and biomass.
The anaerobic process occurring in the Imhoff tank is classified as a low-rate process based on its extended retention time and operation at ambient temperatures. It operates as an unheated, low rate anaerobic digestion chamber. The working volume can, and as discussed earlier, is likely to be significantly reduced by a build up of grit and other settled inorganic solids.
During the anaerobic digestion process, a mixture of carbon dioxide and methane is produced and rises through the gas chamber to the surface. As the gas travels upwards through the digesting sludge some mixing of the sludge is induced. A scum layer is formed from the sludge rising with the gas to the surface; this layer helps contain the odour.
A well operated anaerobic digester can reduce the organic matter in the sludge by 40 – 50% and produce a stabilised sludge.

TTAARROOOOMM SSEEWWEERRAAGGEE PPLLAANNNNIINNGG RREEPPOORRTT
Banana Shire Council DRAFT 8 July 2009 M:\7637-09\Word\TAROOM REPORT JUNE 2009 V.1(ST).docx Cardno (Qld) Pty Ltd Page 23
5.6.3 Sludge Drying Beds
Sludge removed from the Imhoff tank is expected to have dry solids content in the order of 2 – 4%. At this concentration, the sludge is still 96 – 98% water and must be dewatered (dried) to a solid consistency so that it can be handled and transported from site without spillage.
There are various methods of sludge dewatering and currently the Taroom STP dewaters the sludge on drying beds by spreading the sludge over the sand bed. Water content in the sludge is reduced by percolating through the sand bed and evaporation. The dry sludge is then removed to a stockpile on site and eventually disposed of at the refuse tip.
There are 4 sludge drying beds at Taroom STP with sand topping and underdrain system where water from sludge passes down through the sand and is collected in the humus sludge recycle well and returned to the process.
Table 5-6 Existing Drying Beds
Parameters Units Value
Number of drying beds unit 4
Dimensions (L x W) m 5.5 x 2.75
Area (per bed) m2 15.13
Area (total) m2 60.5
Underdrain system Yes
Bed topping material Sand
General condition Poor – Walls have significant cracks
The QLD Guidelines recommends the minimum sludge bed area is 0.05m2 per EP. Given the dry bed area of 60.5m2, the existing dry beds are sufficient for loading up to 1,210 EP.

TTAARROOOOMM SSEEWWEERRAAGGEE PPLLAANNNNIINNGG RREEPPOORRTT
Banana Shire Council DRAFT 8 July 2009 M:\7637-09\Word\TAROOM REPORT JUNE 2009 V.1(ST).docx Cardno (Qld) Pty Ltd Page 24
Figure 5-4: Sludge drying beds at Taroom

TTAARROOOOMM SSEEWWEERRAAGGEE PPLLAANNNNIINNGG RREEPPOORRTT
Banana Shire Council DRAFT 8 July 2009 M:\7637-09\Word\TAROOM REPORT JUNE 2009 V.1(ST).docx Cardno (Qld) Pty Ltd Page 25
5.7 Summary of the Capacity of Existing Process Elements
The following table summarises the estimated available capacity of each process element:
Table 5-7 Calculated Capacity of Each Process Element
Plant Element Capacity
(m3/day)
Equivalent ADWF
(m3/day) Comments
Inlet Screens - - 50 mm aperture is considered too large
Grit Removal 406 82 Channel width is too small for current diurnal peak flows
Imhoff Tank - Sedimentation 538 179 Satisfactory
Imhoff Tank - Digestion 177 177 Satisfactory
Trickling Filter 222 222 Satisfactory
Secondary Clarifier 707 235.7 Satisfactory
Chlorine Contact Tank 369 123 Volume too small for current peak flows
Sludge Dry Beds 280 280 Sufficient provided grit removal is improved
In summary, the biological process elements are capable of treating sewage for the next 20 years. The critical process elements are the Inlet Works and Chlorine contact Tank which require augmentation. The Trickling Filter will be satisfactory if the distribution system is maintained to provide even distribution of influent flows over the whole of the media.

TTAARROOOOMM SSEEWWEERRAAGGEE PPLLAANNNNIINNGG RREEPPOORRTT
Banana Shire Council DRAFT 8 July 2009 M:\7637-09\Word\TAROOM REPORT JUNE 2009 V.1(ST).docx Cardno (Qld) Pty Ltd Page 26
6. EFFLUENT MANAGEMENT
Currently the treated effluent from STP is used by the adjacent farm owned by Mr Rose and at the Taroom Golf Club. Council supplies treated effluent with a quality based on meeting EPA requirements but it does not guarantee the quantity of supply to each user.
The contents of both agreements are summarised as follows:
6.1 Effluent Reuse at Taroom Golf Club
Taroom Golf Club is located about 1 km south of the STP along Cromwell Street. The irrigated area is approximately 50 ha and irrigation is only undertaken during the night. The golf course has several dams used for irrigation. The effluent from STP is pumped to one of these dams via the golf course pump situated at the treatment plant’s CCT. The golf course does not take STP effluent every day. When the golf course pump is on duty it is controlled by the CCT level controller. There is no standby pump.
The current supply agreement (2004-2024) provides the following conditions
Club’s responsibilities: Quantity of supply is not guaranteed, taking the effluent is to be at the Club’s
risk. Management of the dam and disposal of water in the dam via irrigation Ensuring that the effluent in the dam is stored and used for irrigation on their
property in a sustainable manner including no damage to vegetation, minimum soil erosion, no surface ponding and minimum infiltration beyond root zone.
Display warnings to the public that the effluent is in use and to provide signage that indicates if the water is drinkable or not drinkable.
The Council’s responsibilities: Management of the effluent up to the dam in the golf course. Ensuring the effluent quality meets the EPA Licence requirements Management of excess effluent in a wet weather event or in the case that the
club discontinues acceptance of effluent.
6.2 Effluent Reuse at Mr. Rose’s Farm
Mr. Rose’s farm is located adjacent to the STP site. The farm only takes the effluent via the overflow from the CCT. The overflow discharges into an underground pipe where it gravitates into the drainage trench around a paddock which is approximately 1 ha in area. Excess water from the drainage trench flows into a dam located at the north east corner of the property.
Any overflow from this dam can discharge into Dawson Creek about 1.5 km away.
The current supply agreement (2004-2024) outlines the following conditions
Mr. Rose’s responsibilities: Quantity of supply is not guaranteed, taking the effluent is to be at the Mr.
Rose’s risk

TTAARROOOOMM SSEEWWEERRAAGGEE PPLLAANNNNIINNGG RREEPPOORRTT
Banana Shire Council DRAFT 8 July 2009 M:\7637-09\Word\TAROOM REPORT JUNE 2009 V.1(ST).docx Cardno (Qld) Pty Ltd Page 27
Ensuring that the effluent is stored and use for irrigation on the property in a sustainable manner i.e. no damage to vegetation, minimum soil erosion, no surface ponding and minimum infiltration beyond root zone.
Management of the dam and disposal of water in the dam via irrigation Maintaining signage warning the public that the effluent is in use
The Council’s responsibilities:
Management of the effluent up Mr. Rose’s property boundary. Ensuring the effluent quality meets the EPA Licence requirements. Provide a notice that the property stores and irrigates treated effluent which
is not for drinking use. Management of excess effluent in wet weather events or in the case that Mr.
Rose discontinues acceptance.

TTAARROOOOMM SSEEWWEERRAAGGEE PPLLAANNNNIINNGG RREEPPOORRTT
Banana Shire Council DRAFT 8 July 2009 M:\7637-09\Word\TAROOM REPORT JUNE 2009 V.1(ST).docx Cardno (Qld) Pty Ltd Page 28
7. SUSTAINABILITY ASSESSMENT OF EFFLUENT REUSE
7.1 Model for Effluent Disposal using Land Irrigation (MEDLI)
The reuse of effluent can be beneficial as it reduces the demand for other water resources, increases the productivity of agriculture, limits possible adverse impacts on the natural environment and in some instances, can reduce the need for artificial fertilisers.
The effects of effluent loading to a land application can be simulated by modeling the effects on the environment. The accepted computerised hydraulic model to evaluate the sustainability of effluent re-use is MEDLI (Model for Effluent Disposal to Land Irrigation) which has been jointly developed by the CRC for Waste Management and Pollution Control, the Queensland Department of Primary Industries and Natural Resources and Mines (NRM) for the purpose of designing and analysing effluent disposal systems for rural industries and wastewater treatment plants using land irrigation.
The data used in MEDLI are climatic data (rainfall, temperature, evaporation and solar radiation), soil profiles, irrigation area characteristics, and effluent flows and quality.
7.2 Raw Data Used in MEDLI Runs
The plant type chosen for the model runs are tropical pasture for farm irrigation simulation and Kikuyu pasture for the golf course irrigation.
The irrigation area of golf course is 50 Ha and the irrigated paddock area of the farm is 1 Ha. Black earth is chosen as the soil type of both areas, accurate determination of the soil profile will be required to produce results for each specific area considered, however this approximation will be adequate for the purpose of this report.
The irrigation rate is set to be triggered at 50mm water deficit and stopped at the drainage limit.
The recent; March 2009 effluent analytical results are used as the quality of the irrigating water.
7.3 MEDLI Output and Discussions
7.3.1 MEDLI Output
Two irrigation models are simulated to assess the sustainability of effluent use on each area by evaluating the effects over 48 years.
Table 7-1 shows MEDLI run results of two irrigation models: 1) Mr. Rose’s Farm Irrigation and 2) the Golf Course Irrigation. Both models are run to simulate the effect of irrigation in comparison with no irrigation.

TTAARROOOOMM SSEEWWEERRAAGGEE PPLLAANNNNIINNGG RREEPPOORRTT
Banana Shire Council DRAFT 8 July 2009 M:\7637-09\Word\TAROOM REPORT JUNE 2009 V.1(ST).docx Cardno (Qld) Pty Ltd Page 29
Table 7-1 MEDLI Output
Parameters Unit Mr. Rose Farm Golf Course
IRRG No IRRG IRRG No
IRRG Total area considered Ha 1 1 50 50
Total effluent volume used ML/y 8 0 60 0
Soil Nutrients
N2 added from irrigation kg/ha/y 123 0 18 0
N2 removed by plant kg/ha/y 164 46 62 46
P added from irrigation kg/ha/y 56 0 8 0
P removed by plant kg/ha/y 31 0 6 0
Soil P stored changed kg/ha 1185 5 106 1
Soil P stored after 48 years kg/ha 3216 2005 2111 0
P leached in year kg/ha 0 0 0 0
Plant Nutrient Uptake
dry matter yield (shoots) kg/ha/y 11568 3445 5251 3539
net N2 removed by plant kg/ha/y 163 41 60 41
net P removed by plant kg/ha/y 31 0 6 0
Salinity
reduction in plant yield due to salinity % 0 0 0 0
Groundwater
average groundwater recharge m3/d 1.1 0.3 14.1 10.3
average NO3-N conc. in recharge mg/L 1.3 5 5 6.8
max NO3-N conc. in groundwater mg/L 0.1 0 0.8 0.9
7.3.2 Sustainability of Effluent Use at Mr. Rose’s Farm
Given the conditions chosen in section 7.2, the effluent used for irrigation on Mr. Rose’s farm is 8 ML annually. Nitrogen added into the soil via the irrigating water is less than the amount that the pasture consumes. Therefore it causes no change in the Nitrogen concentration within the soil and groundwater. Phosphorus, on the other hand, is not all taken up by the plant. Some phosphorus will be stored each year and after 48 years the level will increase by 1,185 kg/ha. The model run indicates no phosphorus leaching into the groundwater, this implies that the soil has enough capacity to store the excess phosphorus.
The maximum phosphorus level that can be stored within 1.5m depth soil is calculated based on general phosphorus level of 2,000 mg/kg of soil:
Allow: soil layer = 1.5 m and soil density = 1.05 kg/m3
Hence: weight of 1 ha of soil = 1.575x10⁷ kg

TTAARROOOOMM SSEEWWEERRAAGGEE PPLLAANNNNIINNGG RREEPPOORRTT
Banana Shire Council DRAFT 8 July 2009 M:\7637-09\Word\TAROOM REPORT JUNE 2009 V.1(ST).docx Cardno (Qld) Pty Ltd Page 30
Therefore: 2,000 mg/kg soil = 31,500 kg/ha
In the absence of soil test data, the final phosphorous level is calculated by using the phosphorus starting level from MEDLI database. The result; 3,216 kg/ha, is well below the suggested level. A full soil test should be done to identify the starting level in order to accurately calculate the final phosphorus level at the end of year 48.
Salinity level can affect plant yield. However, the results indicate no reduction in plant yield due to salinity.
Groundwater recharge in the results comes from irrigation and rainfall. On average the groundwater is recharged with 1.1 m3/day of water from the farm area. The recharge contains 1.3 mg/L of Nitrate-N which is less than the 10 mg/L as recommended for drinking water.
In contrast, the “No Irrigation” results show less recharge rate but higher in Nitrate-N concentration. This can be explained that the recharge only comes from rainfall with Nitrate from other natural sources. Therefore, water from the irrigation water adds into the total recharge volume and dilutes the Nitrate concentration.
The MEDLI results also indicate that if there is a 10 m thick aquifer, located 1,000 m from the irrigating area, the Nitrate-N level of water in the aquifer will not exceed 0.1 mg/L.
7.3.3 Sustainability of Effluent Use at Taroom Golf Course
The same condition as chosen in section 7.2 is also used as the basis. MEDLI results indicate the effluent used for irrigation on golf course is 60 ML annually (or 1.2 ML/ha/year). The grass consumes more nitrogen than the amount added via the irrigation, which therefore causing no change to the soil.
Similar to the farm case, the grass does not take all the phosphorus from the irrigating water. Some phosphorus will be stored each year and after 48 years the level increases by 106 kg/ha (the total irrigation rate per ha is much less than the farm). The model run shows no phosphorus leaching into groundwater. This indicates that each year the soil can store all excess phosphorus.
Using MEDLI database, phosphorus level by the end of year 48 is calculated: 2,111 kg/ha which is well below the suggested value of 31,500 kg/ha (or 2,000 mg/kg of soil). A soil test is recommended to identify the starting level of phosphorus.
Salinity does not appear to affect plant yield.
The calculated groundwater recharge from this irrigation is 14m3/day with 5 mg/L of Nitrate-N content. The Nitrate content is lower than the “No Irrigation Case” (6.8 mg/L). However, both are considered good recharge as per the drinking water guideline limits of 10 mg/L (Nitrate-N). The MEDLI results also suggest that if there is a 10 m thick aquifer, located 1,000 m from the irrigation area, maximum Nitrate-N level of water in the aquifer is 0.8 mg/L.

TTAARROOOOMM SSEEWWEERRAAGGEE PPLLAANNNNIINNGG RREEPPOORRTT
Banana Shire Council DRAFT 8 July 2009 M:\7637-09\Word\TAROOM REPORT JUNE 2009 V.1(ST).docx Cardno (Qld) Pty Ltd Page 31
8. CONCLUSION AND RECOMMENDATIONS
The following table summarises the estimated available capacity of each process element:
Plant Element Capacity
(m3/day)
Equivalent ADWF
(m3/day) Comments
Inlet Screens - - 50 mm aperture is considered too large
Grit Removal 406 82 Channel width is too small for current diurnal peak flows
Imhoff Tank - Sedimentation 538 179 Satisfactory
Imhoff Tank - Digestion 177 177 Satisfactory
Trickling Filter 222 222 Satisfactory
Secondary Clarifier 707 235.7 Satisfactory
Chlorine Contact Tank 369 123 Volume too small for current peak flows
Sludge Dry Beds 280 280 Sufficient provided grit removal is improved
In summary, the biological process elements are capable of treating sewage for the next 20 years. The critical process elements are the Inlet Works and Chlorine contact Tank which require augmentation. The Trickling Filter will be satisfactory if the distribution system is maintained to provide even distribution of influent flows over the whole of the media.
The following works are recommended to improve the STP performance:
Inlet Works
Installing fine screens and grit removal will reduce the solid loading to Imhoff Tank and sludge management systems. It is recommended that a fine (6mm) screen be installed in the existing inlet channel and a grit vortex installed adjacent to the channel in a similar manner to the recent works at Biloela STP;
Estimated Cost $285,000
Imhoff Tank
It is recommended that operational procedures be modified to routinely record the level of sludge and adjust the draw off rate and frequency to ensure sufficient sludge retention time and stabilisation before discharge to the sludge drying beds.

TTAARROOOOMM SSEEWWEERRAAGGEE PPLLAANNNNIINNGG RREEPPOORRTT
Banana Shire Council DRAFT 8 July 2009 M:\7637-09\Word\TAROOM REPORT JUNE 2009 V.1(ST).docx Cardno (Qld) Pty Ltd Page 32
Trickling Filter
The rotating distributor is in poor condition and does not perform satisfactorily, it should be repaired or replaced. Concrete work should be repaired to prevent contaminated water infiltration into the groundwater and ponding in the collection channel.
Estimated Cost: $50,000
Humus Tank
The sludge retention time is considered to be excessive. It is recommended to install an automatic sludge draw off valve with a timer to draw off sludge on a regular basis.
Estimated Cost: $8,000
Chlorine Contact Tank
a) Install a residual chlorine analyser and automated chlorine dosing control system to ensure the effluent has the correct chlorine residual prior to discharge.
Estimated Cost: $10,000
b) Increase size of CCT by constructing an additional chamber between the Humus Tank outlet and the existing CCT.
Estimated Cost: $10,000
Sludge Drying Beds Cracks in the concrete walls around the perimeter of the beds should be repaired to prevent water and sludge spillage contaminating the groundwater.
Estimated Cost: $5,000

TTAARROOOOMM SSEEWWEERRAAGGEE PPLLAANNNNIINNGG RREEPPOORRTT
Banana Shire Council DRAFT 8 July 2009 M:\7637-09\Word\TAROOM REPORT JUNE 2009 V.1(ST).docx Cardno (Qld) Pty Ltd Page 33
9. REFERENCES
Water Resources Commission 1991, Guidelines for Planning and Design of sewerage schemes: Volume 1, Department of Primary Industries, Brisbane Water Resources Commission 1992, Guidelines for Planning and Design of sewerage schemes: Volume 2, Department of Primary Industries, Brisbane Metcalf & Eddy 1991, Wastewater Engineering: Treatment Disposal Reuse, 3rd ed, G.Tchobanoglous and FL Burton, McGraw-Hill, NY. EPA 2005, Queensland Water Recycling Guidelines, Environmental Protection Agency, Brisbane Water Supply (Safety and Reliability) Act 2008, State of Queensland, Brisbane. Public Health Regulation 2005, State of Queensland, Brisbane. NRW 2008, Water Quality Guidelines for Recycled Water Schemes, Department of Natural Resource and Water, Brisbane. NRW 2008, Recycled Water Management Plan and Validation Guidelines, Department of Natural Resource and Water, Brisbane. NRW 2008, Recycled Water Management Plan Exemption Guidelines, Department of Natural Resource and Water, Brisbane.

TTAARROOOOMM SSEEWWEERRAAGGEE PPLLAANNNNIINNGG RREEPPOORRTT
Banana Shire Council DRAFT 8 July 2009 M:\7637-09\Word\TAROOM REPORT JUNE 2009 V.1(ST).docx Cardno (Qld) Pty Ltd Page 34
FIGURES
Figure 5: Locality Plan
Irrigation Area = 1 ha
Irrigation Area = 50 ha
Dawson Creek
Taroom STP
Farm Dam Paddock = 1 ha (Irrigation Area)
Water Spill Way

APPENDIX A MEDLI OUTPUTS

a) Golf Course: no irrigation ***************************************** SUMMARY OUTPUT MEDLI Version 1.30 Data Set: Taroom GC no irrg Run Date: 12/05/09 Time:09:02:00.67 ***************************************** GENERAL INFORMATION ******************* Title: Taroom Golf Course Subject: Irrigation Application rates Client: [no entry] User: Rick C. Time: Tue May 12 09:00:39 2009 Comments: [no entry] RUN PERIOD ********** Starting Date 1/ 1/1957 Ending Date 31/12/2004 Run Length 48 years 0 days _____________________________________________________________________________________ CLIMATE INFORMATION ******************* Enterprise site: Taroom GC no irrg -25.6 deg S 149.8 deg E Weather station: Theodore_24.95S_150.05E (Interpo ANNUAL TOTALS 10 Percentile 50 percentile 90 Percentile Rainfall mm/year 478. 629. 981. Pan Evap mm/year 1870. 2035. 2185. MONTHLY Jan Feb Mar Apr May Jun Jul Aug Sep Oct Nov Dec Year Rainfall (mm) 97 92 55 41 40 28 31 27 27 61 81 93 673 Pan Evap (mm) 239 189 193 151 110 86 93 122 167 209 225 242 2025 Ave Max Temp DegC 34 32 32 29 26 23 22 24 28 30 32 34 28 Ave Min Temp DegC 21 20 19 15 11 8 6 7 11 15 18 20 14 Rad (MJ/m2/day) 23 20 20 18 15 14 15 18 21 23 24 24 19 ------------------------------------------------------------------------------------- MONTHLY IRRIGATION ****************** Irrigation (mm) 0 0 0 0 0 0 0 0 0 0 0 0 0 _____________________________________________________________________________________ SOIL PROPERTIES *************** Soil type: Black Earth SOIL WATER PROPERTIES Layer 1 Layer 2 Layer 3 Layer 4 Bulk Density (g/cm3) 1.0 1.3 1.3 1.3 Porosity (mm/layer) 60.4 262.3 298.9 148.3 Saturated Water Content (mm/layer) 59.6 259.5 297.0 146.7 Drained Upper Limit (mm/layer) 41.2 232.5 280.2 140.1 Lower Storage Limit (mm/layer) 25.7 150.5 204.6 115.2 Air Dry Moisture Content (mm/layer) 3.2 Layer Thickness (mm) 100.0 500.0 600.0 300.0 Profile Max Rootzone Total Saturated Water Content (mm) 762.8 616.1 Total Drained Upper Limit (mm) 694.0 553.9 Total Lower Storage Limit (mm) 496.0 380.8

Total Air Dry Moisture Content (mm) 4.6 4.3 Total Depth (mm) 1500.0 1200.0 Maximum Plant Available Water Capacity 173.1 Saturated Hydraulic Conductivity At Surface (mm/hr) 1.0 Limiting (mm/hr) 0.5 RUNOFF Runoff curve No II 73.0 SOIL EVAPORATION CONA (mm/day^0.5) 3.5 URITCH (mm) 6.0 _____________________________________________________________________________________ AVERAGE WASTE STREAM ******************** Sewage treatment plant waste stream (All values relate to influent after any screening and recycling, if applicable). Inflow Volume (ML/year) 63.39 Nitrogen (tonne/year) 1.30 Phosphorus (tonne/year) 0.41 Salinity (tonne/year) 44.70 Nitrogen Concentration (mg/L) 20.55 Phosphorus Concentration (mg/L) 6.54 Salinity (mg/L) 705.19 Salinity (dS/m) 1.10 WASTE STREAM DETAILS (for last inflow event): Nitrogen Concentration (mg/L) 21.41 Phosphorus Concentration (mg/L) 6.81 TDS Concentration (mg/L) 734.86 Salinity (dS/m) 1.15 _____________________________________________________________________________________ IRRIGATION WATER **************** Irrigation triggered on a soil water deficit of (mm): 50.0 Irrigating upto upper storage limit + 0 mm AREA Total Irrigation Area (ha) 50.00 VOLUMES Total Irrigation (ML/year) 0.00 Minimum Volume Irrigated by Pump (ML/ha/day) 0.00 Maximum Volume Irrigated by Pump (ML/day) 0.00 Maximum Vol. Available For Shandying (ML/yr) 0.00 IRRIGATION CONCENTRATIONS Average salinity of Irrigation (dS/m) 0.00 Average salinity of Irrigation (mg/L) 0.00 Average Nitrogen Conc of Irrigation Before ammonia loss (mg/L) 0.00 After ammonia loss (mg/L) 0.00 Average Phosphorus Conc of Irrigation (mg/L) 0.00

LAND DISPOSAL AREA ****************** WATER BALANCE ------------- (Initial soil water assumed to be at field capacity) (Irrigated up to 0.00% of field capacity) Rainfall (mm/year) 673.6 Irrigation Area (ha) 50.0 Irrigation (mm/year) 0.0 Soil Evaporation (mm/year) 344.3 Transpiration (mm/year) 306.9 Runoff (mm/year) 17.9 Drainage (mm/year) 7.5 Change in soil moisture (mm/year) -3.1 ANNUAL TOTALS Year Rain Irrig Sevap Trans Runoff Drain Change (mm) (mm) (mm) (mm) (mm) (mm) (mm) _____________________________________________________________________________ 1957 373.0 0.0 289.7 260.6 0.1 7.8 -185.2 1958 880.0 0.0 431.1 339.8 37.7 0.0 71.4 1959 804.0 0.0 287.0 546.0 0.1 0.0 -29.0 1960 602.0 0.0 130.6 511.3 0.0 0.0 -39.9 1961 777.0 0.0 474.0 268.8 25.6 0.0 8.6 1962 690.0 0.0 299.3 372.4 2.6 0.0 15.7 1963 834.0 0.0 414.5 354.1 68.7 0.0 -3.3 1964 599.0 0.0 383.1 215.3 7.2 0.0 -6.7 1965 550.0 0.0 364.5 172.3 11.0 0.0 2.1 1966 597.0 0.0 395.3 202.4 0.3 0.0 -0.9 1967 675.0 0.0 421.0 256.4 6.8 0.0 -9.3 1968 632.0 0.0 407.9 215.6 12.9 0.0 -4.4 1969 480.0 0.0 280.1 181.1 0.1 0.0 18.6 1970 510.0 0.0 273.0 158.4 1.8 0.0 76.8 1971 978.0 0.0 260.3 459.8 156.3 107.8 -6.2 1972 745.0 0.0 293.0 501.3 41.4 0.0 -90.7 1973 1077.0 0.0 484.7 426.2 25.2 0.0 140.9 1974 772.0 0.0 355.2 457.8 3.0 53.6 -97.7 1975 887.0 0.0 371.0 341.1 10.9 27.9 136.1 1976 672.0 0.0 306.2 498.0 0.1 8.0 -140.4 1977 521.0 0.0 336.5 219.8 3.3 0.0 -38.6 1978 983.0 0.0 371.3 498.9 100.3 0.0 12.5 1979 603.0 0.0 385.7 200.3 12.2 0.0 4.8 1980 625.0 0.0 297.1 319.2 0.3 0.0 8.3 1981 783.0 0.0 274.6 483.4 3.3 0.0 21.6 1982 463.0 0.0 286.6 227.4 1.0 0.0 -52.0 1983 1169.0 0.0 333.4 593.2 99.4 122.3 20.7 1984 906.0 0.0 319.9 533.0 22.2 0.0 30.9 1985 682.0 0.0 409.0 311.1 0.7 0.0 -38.8 1986 772.0 0.0 399.0 311.6 33.8 0.0 27.7 1987 510.0 0.0 401.5 138.7 0.0 0.0 -30.2 1988 696.0 0.0 380.8 224.4 27.8 0.0 63.1 1989 844.0 0.0 357.3 526.5 7.9 0.0 -47.8 1990 530.0 0.0 316.3 175.7 1.0 0.0 37.1 1991 478.0 0.0 304.6 187.9 11.5 0.0 -25.9 1992 504.0 0.0 352.6 165.9 2.4 0.0 -16.9 1993 408.0 0.0 334.0 90.0 0.0 0.0 -16.0 1994 509.0 0.0 322.2 179.2 4.2 0.0 3.4 1995 633.0 0.0 377.5 236.8 4.8 0.0 13.9 1996 570.0 0.0 332.3 205.5 5.3 0.0 26.9 1997 596.0 0.0 313.7 305.6 19.1 0.0 -42.4 1998 986.0 0.0 345.9 558.3 31.1 34.5 16.2 1999 597.0 0.0 303.8 310.7 4.2 0.0 -21.7 2000 693.0 0.0 385.0 200.5 17.4 0.0 90.2 2001 477.0 0.0 331.1 213.8 0.0 0.0 -67.9 2002 440.0 0.0 320.6 123.9 0.9 0.0 -5.5 2003 625.0 0.0 383.0 178.8 32.5 0.0 30.7 2004 594.0 0.0 331.5 271.2 1.5 0.0 -10.3 _____________________________________________________________________________

NUTRIENT BALANCE ----------------- NITROGEN Total N irrigated from ponds (kg/ha/year) 0.0 % of Total as ammonium 0.0 Nitrogn lost by ammonia volat.(kg/ha/year) 0.0 Deep Drainage (mm/year) 7.5 Nitrogen added in irrigation (kg/ha/year) 0.0 Nitrogen added in seed (kg/ha/year) 4.2 Nitrogen removed by crop (kg/ha/year) 45.5 Denitrification (kg/ha/year) 0.5 Leached NO3-N (kg/ha/year) 0.5 Change in soil organic-N (kg/ha/year) -38.3 Change in soil solution NH4-N (kg/ha/year) 0.0 Change in soil solution NO3-N (kg/ha/year) -4.0 Change in adsorbed NH4-N (kg/ha/year) 0.0 Initial soil organic-N (kg/ha) 1963.5 Final soil organic-N (kg/ha) 123.4 Initial soil inorganic-N (kg/ha) 193.5 Final soil inorganic-N (kg/ha) 0.8 Average N03-N conc in the root zone (mg/L) 0.7 Average N03-N conc below root zone (mg/L) 3.7 Average N03-N conc of deep drainage (mg/L) 6.8 PHOSPHORUS Phosphorus added in irrigatn (kg/ha/year) 0.0 % of Total as phosphate 100.0 Phosphorus added in seed (kg/ha/year) 0.4 Phosphorus removed by crop (kg/ha/year) 0.4 Leached PO4-P (kg/ha/year) 0.0 Change in dissolved PO4-P (kg/ha/year) 0.0 Change in adsorbed PO4-P (kg/ha/year) 0.0 Average P04-P conc in the root zone (mg/L) 0.0 Average P04-P conc below root zone (mg/L) 0.0 SOIL P STORAGE LIFE Year Year No. Tot P stored P leached in year kg/ha kg/ha _____________________________________________________________________________ 1957 1 2000.4 0.0 1958 2 2000.4 0.0 1959 3 2000.4 0.0 1960 4 2005.8 0.0 1961 5 2000.3 0.0 1962 6 2000.3 0.0 1963 7 2000.3 0.0 1964 8 2005.8 0.0 1965 9 2000.3 0.0 1966 10 2000.3 0.0 1967 11 2000.3 0.0 1968 12 2005.8 0.0 1969 13 2000.3 0.0 1970 14 2000.3 0.0 1971 15 2000.3 0.0 1972 16 2005.7 0.0 1973 17 2000.3 0.0 1974 18 2000.2 0.0 1975 19 2000.2 0.0 1976 20 2005.7 0.0 1977 21 2000.2 0.0 1978 22 2000.2 0.0 1979 23 2000.2 0.0 1980 24 2005.7 0.0 1981 25 2000.2 0.0 1982 26 2000.2 0.0 1983 27 2000.1 0.0 1984 28 2005.6 0.0 1985 29 2000.1 0.0

1986 30 2000.1 0.0 1987 31 2000.1 0.0 1988 32 2005.6 0.0 1989 33 2000.1 0.0 1990 34 2000.1 0.0 1991 35 2000.1 0.0 1992 36 2005.5 0.0 1993 37 2000.0 0.0 1994 38 2000.0 0.0 1995 39 2000.0 0.0 1996 40 2005.5 0.0 1997 41 2000.0 0.0 1998 42 2000.0 0.0 1999 43 2000.0 0.0 2000 44 2005.4 0.0 2001 45 1999.9 0.0 2002 46 1999.9 0.0 2003 47 1999.9 0.0 2004 48 2005.4 0.0 _____________________________________________________________________________ PLANT ----- Plant species: Kikuyu pasture PLANT WATER USE Irrigation (mm/year) 0. Totl Irrigation Area(ha) 50.0 Pan coefficient (%) 1.0 Maximum crop coefficient (%) 0.8 Average Plant Cover (%) 34. Average Plant Total Cover (%) 49. Average Plant Rootdepth (mm) 433. Average Plant Available Water Capacity (mm) 114. Average Plant Available Water (mm) 22. Yield produced per unit transp. (kg/ha/mm) 12. PLANT NUTRIENT UPTAKE Dry Matter Yield (Shoots) (kg/ha/yr) 3539. Net nitrogen removed by plant (kg/ha/yr) 41. Shoot Concn (%DM) 1.17 Net phosphorus removed by plant (kg/ha/yr) 0. Shoot Concn (%DM) 0.00 AVERAGE MONTHLY GROWTH STRESS (0=no stress, 1=full stress) Month Yield Nitr Temp Water Water kg/ha Defic Logging ____________________________________________ 1 562. 0.5 0.0 0.5 0.0 2 450. 0.5 0.0 0.5 0.0 3 414. 0.6 0.0 0.5 0.0 4 268. 0.5 0.0 0.7 0.0 5 117. 0.3 0.2 0.7 0.0 6 116. 0.3 0.5 0.6 0.0 7 97. 0.3 0.6 0.6 0.0 8 124. 0.3 0.5 0.6 0.0 9 165. 0.3 0.2 0.7 0.0 10 249. 0.3 0.0 0.6 0.0 11 464. 0.3 0.0 0.5 0.0 12 511. 0.5 0.0 0.5 0.0 >>> NO-PLANT EVENTS <<< %Days due to temperature stress 0.5 %Days due to frosting 0.2 %Days due to scorching 0.0 %Days due to water stress 37.5 %Days due to nitrogen stress 0.0

No. of forced harvests per year 2.5 No. of normal harvests per year 0.0 _____________________________________________________________________________________ SALINITY -------- Salt tolerance - plant species: moderate Average EC of Irrigation Water (dS/m) 0.0 Irrigation (mm/year) 0.0 Average EC of Rainwater (dS/m x10) 0.3 Rainfall (mm/year) 673.6 >>>No salinity calculations<<< No. of years chosen for running averages 10 _____________________________________________________________________________________ GROUNDWATER ************ Average Groundwater Recharge (m3/day) 10.3 Average Nitrate-N Conc of Recharge (mg/L) 6.8 Thickness of the Aquifer (m) 10.0 Distance (m) from Irrigation Area to where Nitrate-N Conc in Groundwater is Calculated 1000.0 Concentration of NITRATE-N in Groundwater (mg/L) ---------------------------------------------- Year Depth Below Water Table Surface 0.0 m 5.0 m 9.0 m ____________________________________________ 1961 0.2 0.2 0.2 1966 0.4 0.4 0.4 1971 0.5 0.5 0.5 1976 0.6 0.6 0.6 1981 0.7 0.7 0.7 1986 0.7 0.7 0.7 1991 0.8 0.8 0.8 1996 0.8 0.8 0.8 2001 0.8 0.8 0.8 Last 2004 0.9 0.9 0.9 _____________________________________________________________________________________ Equivalent persons 700 Dry weatherProduction (ML/day) 0.1621 Effluent per person (L/day) 231.5 Effluent per person (L/yr) 84497.5 Effluent volume per 1000 EPs per year (ML) 84.5 Infiltration average _____________________________________________

b) Golf Course: with irrigation ***************************************** SUMMARY OUTPUT MEDLI Version 1.30 Data Set: Taroom Golf course Run Date: 12/05/09 Time:08:46:47.31 ***************************************** GENERAL INFORMATION ******************* Title: Taroom Golf Course Subject: Irrigation Application rates Client: [no entry] User: Rick C. Time: Tue May 12 08:17:02 2009 Comments: [no entry] RUN PERIOD ********** Starting Date 1/ 1/1957 Ending Date 31/12/2004 Run Length 48 years 0 days _____________________________________________________________________________________ CLIMATE INFORMATION ******************* Enterprise site: Taroom GC -25.6 deg S 149.8 deg E Weather station: Theodore_24.95S_150.05E (Interpo ANNUAL TOTALS 10 Percentile 50 percentile 90 Percentile Rainfall mm/year 478. 629. 981. Pan Evap mm/year 1870. 2035. 2185. MONTHLY Jan Feb Mar Apr May Jun Jul Aug Sep Oct Nov Dec Year Rainfall (mm) 97 92 55 41 40 28 31 27 27 61 81 93 673 Pan Evap (mm) 239 189 193 151 110 86 93 122 167 209 225 242 2025 Ave Max Temp DegC 34 32 32 29 26 23 22 24 28 30 32 34 28 Ave Min Temp DegC 21 20 19 15 11 8 6 7 11 15 18 20 14 Rad (MJ/m2/day) 23 20 20 18 15 14 15 18 21 23 24 24 19 ------------------------------------------------------------------------------------- MONTHLY IRRIGATION ****************** Irrigation (mm) 10 10 11 9 10 10 11 9 10 10 10 10 119 _____________________________________________________________________________________ SOIL PROPERTIES *************** Soil type: Black Earth SOIL WATER PROPERTIES Layer 1 Layer 2 Layer 3 Layer 4 Bulk Density (g/cm3) 1.0 1.3 1.3 1.3 Porosity (mm/layer) 60.4 262.3 298.9 148.3 Saturated Water Content (mm/layer) 59.6 259.5 297.0 146.7 Drained Upper Limit (mm/layer) 41.2 232.5 280.2 140.1 Lower Storage Limit (mm/layer) 25.7 150.5 204.6 115.2 Air Dry Moisture Content (mm/layer) 3.2 Layer Thickness (mm) 100.0 500.0 600.0 300.0 Profile Max Rootzone Total Saturated Water Content (mm) 762.8 616.1

Total Drained Upper Limit (mm) 694.0 553.9 Total Lower Storage Limit (mm) 496.0 380.8 Total Air Dry Moisture Content (mm) 4.6 4.3 Total Depth (mm) 1500.0 1200.0 Maximum Plant Available Water Capacity 173.1 Saturated Hydraulic Conductivity At Surface (mm/hr) 1.0 Limiting (mm/hr) 0.5 RUNOFF Runoff curve No II 73.0 SOIL EVAPORATION CONA (mm/day^0.5) 3.5 URITCH (mm) 6.0 _____________________________________________________________________________________ AVERAGE WASTE STREAM ******************** Sewage treatment plant waste stream (All values relate to influent after any screening and recycling, if applicable). Inflow Volume (ML/year) 63.39 Nitrogen (tonne/year) 1.30 Phosphorus (tonne/year) 0.41 Salinity (tonne/year) 44.70 Nitrogen Concentration (mg/L) 20.55 Phosphorus Concentration (mg/L) 6.54 Salinity (mg/L) 705.19 Salinity (dS/m) 1.10 WASTE STREAM DETAILS (for last inflow event): Nitrogen Concentration (mg/L) 21.41 Phosphorus Concentration (mg/L) 6.81 TDS Concentration (mg/L) 734.86 Salinity (dS/m) 1.15 _____________________________________________________________________________________ IRRIGATION WATER **************** Irrigation triggered on a soil water deficit of (mm): 50.0 Irrigating upto upper storage limit + 0 mm AREA Total Irrigation Area (ha) 50.00 VOLUMES Total Irrigation (ML/year) 59.85 Minimum Volume Irrigated by Pump (ML/ha/day) 0.00 Maximum Volume Irrigated by Pump (ML/day) 162.00 Maximum Vol. Available For Shandying (ML/yr) 0.00 IRRIGATION CONCENTRATIONS Average salinity of Irrigation (dS/m) 1.17 Average salinity of Irrigation (mg/L) 746.65 Average Nitrogen Conc of Irrigation Before ammonia loss (mg/L) 15.17 After ammonia loss (mg/L) 15.17 Average Phosphorus Conc of Irrigation (mg/L) 6.92 _____________________________________________________________________________________

LAND DISPOSAL AREA ****************** WATER BALANCE ------------- (Initial soil water assumed to be at field capacity) (Irrigated up to 22.56% of field capacity) Rainfall (mm/year) 673.6 Irrigation Area (ha) 50.0 Irrigation (mm/year) 119.7 Soil Evaporation (mm/year) 170.6 Transpiration (mm/year) 599.0 Runoff (mm/year) 16.0 Drainage (mm/year) 10.3 Change in soil moisture (mm/year) -2.7 ANNUAL TOTALS Year Rain Irrig Sevap Trans Runoff Drain Change (mm) (mm) (mm) (mm) (mm) (mm) (mm) _____________________________________________________________________________ 1957 373.0 111.7 62.6 587.1 0.0 7.8 -172.8 1958 880.0 124.0 217.6 713.6 20.0 0.0 52.8 1959 804.0 122.9 55.1 891.4 0.1 0.0 -19.7 1960 602.0 118.2 0.0 748.9 0.4 0.0 -29.1 1961 777.0 122.0 209.0 676.3 8.6 0.0 5.1 1962 690.0 117.5 16.4 777.4 0.5 0.0 13.1 1963 834.0 125.5 157.9 710.4 53.1 35.1 3.0 1964 599.0 118.4 200.6 525.0 1.0 0.0 -9.1 1965 550.0 116.8 335.7 333.0 14.6 0.0 -16.6 1966 597.0 116.7 268.4 432.8 1.6 0.0 10.9 1967 675.0 120.8 0.0 788.6 0.1 0.0 7.1 1968 632.0 118.9 172.2 591.8 2.0 0.0 -15.2 1969 480.0 114.6 293.2 296.0 0.6 0.0 4.9 1970 510.0 109.8 24.6 476.1 1.9 0.0 117.2 1971 978.0 124.6 181.0 709.2 147.2 110.6 -45.5 1972 745.0 127.6 208.3 720.6 22.6 0.0 -78.9 1973 1077.0 121.8 2.3 1041.3 9.2 0.0 146.0 1974 772.0 128.6 147.6 787.4 5.3 69.7 -109.3 1975 887.0 118.1 147.1 651.9 13.9 38.6 153.7 1976 672.0 130.5 0.0 826.7 2.0 61.4 -87.6 1977 521.0 115.7 120.6 616.6 4.9 0.0 -105.3 1978 983.0 127.9 160.7 862.7 79.0 0.0 8.6 1979 603.0 116.9 0.0 706.7 0.9 0.0 12.3 1980 625.0 116.3 157.1 578.6 0.8 0.0 4.7 1981 783.0 124.4 114.9 767.9 0.4 0.0 24.2 1982 463.0 113.8 136.9 477.5 3.5 0.0 -41.1 1983 1169.0 131.5 263.0 778.0 124.8 125.9 8.7 1984 906.0 126.5 239.1 716.2 27.5 0.3 49.4 1985 682.0 120.6 221.9 645.1 1.0 0.0 -65.5 1986 772.0 121.7 373.1 422.0 46.6 0.0 52.0 1987 510.0 115.6 335.2 334.4 0.3 0.0 -44.4 1988 696.0 119.3 347.2 386.2 25.2 0.0 56.7 1989 844.0 125.8 112.1 912.8 2.8 0.0 -57.8 1990 530.0 114.3 0.0 604.7 1.5 3.3 34.7 1991 478.0 116.7 0.0 590.3 4.2 0.0 0.1 1992 504.0 115.7 0.0 643.7 0.0 0.0 -24.0 1993 408.0 112.8 0.0 537.0 0.0 0.0 -16.2 1994 509.0 114.8 285.1 320.4 9.3 0.0 9.0 1995 633.0 118.4 322.1 411.2 6.3 0.0 11.7 1996 570.0 107.9 322.9 314.8 13.8 0.0 26.4 1997 596.0 128.4 299.4 454.7 20.3 0.0 -50.1 1998 986.0 127.2 216.3 804.5 31.7 41.8 19.0 1999 597.0 119.9 0.0 704.6 4.4 0.0 7.9 2000 693.0 118.9 169.9 563.6 23.0 0.0 55.4 2001 477.0 116.8 297.2 357.8 0.0 0.0 -61.2 2002 440.0 113.3 305.7 259.4 1.1 0.0 -12.8 2003 625.0 118.3 357.1 322.5 26.7 0.0 37.0 2004 594.0 117.9 331.3 374.9 3.4 0.0 2.2

_____________________________________________________________________________ NUTRIENT BALANCE ----------------- NITROGEN Total N irrigated from ponds (kg/ha/year) 18.2 % of Total as ammonium 0.0 Nitrogn lost by ammonia volat.(kg/ha/year) 0.0 Deep Drainage (mm/year) 10.3 Nitrogen added in irrigation (kg/ha/year) 18.2 Nitrogen added in seed (kg/ha/year) 2.0 Nitrogen removed by crop (kg/ha/year) 61.6 Denitrification (kg/ha/year) 0.5 Leached NO3-N (kg/ha/year) 0.5 Change in soil organic-N (kg/ha/year) -38.4 Change in soil solution NH4-N (kg/ha/year) 0.0 Change in soil solution NO3-N (kg/ha/year) -4.0 Change in adsorbed NH4-N (kg/ha/year) 0.0 Initial soil organic-N (kg/ha) 1963.5 Final soil organic-N (kg/ha) 121.5 Initial soil inorganic-N (kg/ha) 193.5 Final soil inorganic-N (kg/ha) 0.2 Average N03-N conc in the root zone (mg/L) 0.1 Average N03-N conc below root zone (mg/L) 4.2 Average N03-N conc of deep drainage (mg/L) 5.0 PHOSPHORUS Phosphorus added in irrigatn (kg/ha/year) 8.3 % of Total as phosphate 100.0 Phosphorus added in seed (kg/ha/year) 0.2 Phosphorus removed by crop (kg/ha/year) 6.3 Leached PO4-P (kg/ha/year) 0.0 Change in dissolved PO4-P (kg/ha/year) 0.0 Change in adsorbed PO4-P (kg/ha/year) 2.2 Average P04-P conc in the root zone (mg/L) 0.0 Average P04-P conc below root zone (mg/L) 0.0 SOIL P STORAGE LIFE Year No. Tot P stored P leached in year kg/ha kg/ha _____________________________________________________________________________ 1957 1 2004.4 0.0 1958 2 2012.2 0.0 1959 3 2019.9 0.0 1960 4 2032.2 0.0 1961 5 2033.0 0.0 1962 6 2039.1 0.0 1963 7 2044.2 0.0 1964 8 2055.3 0.0 1965 9 2055.6 0.0 1966 10 2061.5 0.0 1967 11 2064.1 0.0 1968 12 2071.5 0.0 1969 13 2071.1 0.0 1970 14 2073.9 0.0 1971 15 2074.2 0.0 1972 16 2082.1 0.0 1973 17 2077.3 0.0 1974 18 2076.1 0.0 1975 19 2077.9 0.0 1976 20 2082.5 0.0 1977 21 2076.6 0.0 1978 22 2079.4 0.0 1979 23 2078.4 0.0 1980 24 2083.8 0.0 1981 25 2079.4 0.0 1982 26 2079.3 0.0 1983 27 2081.8 0.0

1984 28 2087.3 0.0 1985 29 2082.5 0.0 1986 30 2085.3 0.0 1987 31 2088.4 0.0 1988 32 2096.7 0.0 1989 33 2090.8 0.0 1990 34 2087.8 0.0 1991 35 2086.3 0.0 1992 36 2090.3 0.0 1993 37 2083.5 0.0 1994 38 2084.9 0.0 1995 39 2089.0 0.0 1996 40 2098.5 0.0 1997 41 2096.1 0.0 1998 42 2097.1 0.0 1999 43 2094.6 0.0 2000 44 2099.7 0.0 2001 45 2096.7 0.0 2002 46 2100.1 0.0 2003 47 2103.4 0.0 2004 48 2110.8 0.0 _____________________________________________________________________________ PLANT ----- Plant species: Kikuyu pasture PLANT WATER USE Irrigation (mm/year) 120. Totl Irrigation Area(ha) 50.0 Pan coefficient (%) 1.0 Maximum crop coefficient (%) 0.8 Average Plant Cover (%) 66. Average Plant Total Cover (%) 76. Average Plant Rootdepth (mm) 869. Average Plant Available Water Capacity (mm) 144. Average Plant Available Water (mm) 32. Yield produced per unit transp. (kg/ha/mm) 9. PLANT NUTRIENT UPTAKE Dry Matter Yield (Shoots) (kg/ha/yr) 5251. Net nitrogen removed by plant (kg/ha/yr) 60. Shoot Concn (%DM) 1.13 Net phosphorus removed by plant (kg/ha/yr) 6. Shoot Concn (%DM) 0.12 AVERAGE MONTHLY GROWTH STRESS (0=no stress, 1=full stress) Month Yield Nitr Temp Water Water kg/ha Defic Logging ____________________________________________ 1 562. 0.7 0.0 0.4 0.0 2 519. 0.8 0.0 0.4 0.0 3 449. 0.7 0.0 0.4 0.0 4 426. 0.7 0.0 0.5 0.0 5 353. 0.7 0.2 0.5 0.0 6 354. 0.7 0.5 0.4 0.0 7 266. 0.6 0.6 0.3 0.0 8 324. 0.5 0.5 0.3 0.0 9 438. 0.6 0.2 0.4 0.0 10 498. 0.6 0.0 0.5 0.0 11 474. 0.7 0.0 0.4 0.0 12 588. 0.7 0.0 0.4 0.0 >>> NO-PLANT EVENTS <<< %Days due to temperature stress 0.4 %Days due to frosting 0.2 %Days due to scorching 0.0

%Days due to water stress 9.8 %Days due to nitrogen stress 0.1 No. of forced harvests per year 1.5 No. of normal harvests per year 0.5 _____________________________________________________________________________________ SALINITY -------- Salt tolerance - plant species: moderate Average EC of Irrigation Water (dS/m) 1.2 Irrigation (mm/year) 119.7 Average EC of Rainwater (dS/m x10) 0.3 Rainfall (mm/year) 673.6 Average EC of Infiltrated water (dS/m) 0.2 Av. water-upt-weightd rootzone EC(dS/m s.e.) 0.6 EC soil soln (FC) at base of rootzone (dS/m) 77.3 Deep Drainage (mm/year) 10.3 Reduction in Crop yield due to Salinity (%) 0.0 Percentage of yrs that crop yld falls below 90% of potential because of soil salinity 0.0 Period ECrootzone ECbase Rel Yield sat ext in situ (dS/m) (dS/m) (%) ____________________________________________ 1957 - 1966 0.76 37.08 100. 1958 - 1967 0.65 45.67 100. 1959 - 1968 0.66 45.48 100. 1960 - 1969 0.69 45.18 100. 1961 - 1970 0.66 45.01 100. 1962 - 1971 0.55 10.85 100. 1963 - 1972 0.56 10.91 100. 1964 - 1973 0.54 14.39 100. 1965 - 1974 0.49 8.87 100. 1966 - 1975 0.43 7.12 100. 1967 - 1976 0.42 5.76 100. 1968 - 1977 0.42 5.74 100. 1969 - 1978 0.41 5.77 100. 1970 - 1979 0.40 5.78 100. 1971 - 1980 0.40 5.80 100. 1972 - 1981 0.44 9.59 100. 1973 - 1982 0.45 9.51 100. 1974 - 1983 0.42 5.48 100. 1975 - 1984 0.44 7.16 100. 1976 - 1985 0.49 8.93 100. 1977 - 1986 0.50 12.78 100. 1978 - 1987 0.51 12.79 100. 1979 - 1988 0.53 12.73 100. 1980 - 1989 0.51 12.79 100. 1981 - 1990 0.51 12.43 100. 1982 - 1991 0.52 12.36 100. 1983 - 1992 0.52 12.38 100. 1984 - 1993 0.72 440.31 100. 1985 - 1994 0.77 473.68 100. 1986 - 1995 0.78 473.37 100. 1987 - 1996 0.85 468.93 100. 1988 - 1997 0.79 472.53 100. 1989 - 1998 0.65 34.93 100. 1990 - 1999 0.69 34.79 100. 1991 - 2000 0.68 37.66 100. 1992 - 2001 0.70 37.66 100. 1993 - 2002 0.71 37.62 100. 1994 - 2003 0.69 37.76 100. 1995 - 2004 0.69 37.83 100. _____________________________________________________________________________________ GROUNDWATER ************ Average Groundwater Recharge (m3/day) 14.1 Average Nitrate-N Conc of Recharge (mg/L) 5.0 Thickness of the Aquifer (m) 10.0

Distance (m) from Irrigation Area to where Nitrate-N Conc in Groundwater is Calculated 1000.0 Concentration of NITRATE-N in Groundwater (mg/L) ---------------------------------------------- Year Depth Below Water Table Surface 0.0 m 5.0 m 9.0 m ____________________________________________ 1961 0.2 0.2 0.2 1966 0.4 0.4 0.4 1971 0.5 0.5 0.5 1976 0.6 0.6 0.6 1981 0.7 0.7 0.7 1986 0.7 0.7 0.7 1991 0.8 0.8 0.8 1996 0.8 0.8 0.8 2001 0.8 0.8 0.8 Last 2004 0.8 0.8 0.8 _____________________________________________________________________________________ Equivalent persons 700 Dry weather Production (ML/day) 0.1621 Effluent per person (L/day) 231.5 Effluent per person (L/yr) 84497.5 Effluent volume per 1000 EPs per year (ML) 84.5 Infiltration average _____________________________________________

c) Mr. Rose Farm: no irrigation ***************************************** SUMMARY OUTPUT MEDLI Version 1.30 Data Set: Taroom Farm no irrg Run Date: 12/05/09 Time:10:19:52.63 ***************************************** GENERAL INFORMATION ******************* Title: Taroom Farm no irrg Subject: Irrigation Application rates Client: [no entry] User: Rick C. Time: Tue May 12 09:59:28 2009 Comments: [no entry] RUN PERIOD ********** Starting Date 1/ 1/1957 Ending Date 31/12/2004 Run Length 48 years 0 days _____________________________________________________________________________________ CLIMATE INFORMATION ******************* Enterprise site: Taroom Farm no irrg -25.6 deg S 149.8 deg E Weather station: Theodore_24.95S_150.05E (Interpo ANNUAL TOTALS 10 Percentile 50 percentile 90 Percentile Rainfall mm/year 478. 629. 981. Pan Evap mm/year 1870. 2035. 2185. MONTHLY Jan Feb Mar Apr May Jun Jul Aug Sep Oct Nov Dec Year Rainfall (mm) 97 92 55 41 40 28 31 27 27 61 81 93 673 Pan Evap (mm) 239 189 193 151 110 86 93 122 167 209 225 242 2025 Ave Max Temp DegC 34 32 32 29 26 23 22 24 28 30 32 34 28 Ave Min Temp DegC 21 20 19 15 11 8 6 7 11 15 18 20 14 Rad (MJ/m2/day) 23 20 20 18 15 14 15 18 21 23 24 24 19 ------------------------------------------------------------------------------------- MONTHLY IRRIGATION ****************** Irrigation (mm) 0 0 0 0 0 0 0 0 0 0 0 0 0 _____________________________________________________________________________________ SOIL PROPERTIES *************** Soil type: Black Earth SOIL WATER PROPERTIES Layer 1 Layer 2 Layer 3 Layer 4 Bulk Density (g/cm3) 1.0 1.3 1.3 1.3 Porosity (mm/layer) 60.4 262.3 298.9 148.3 Saturated Water Content (mm/layer) 59.6 259.5 297.0 146.7 Drained Upper Limit (mm/layer) 41.2 232.5 280.2 140.1 Lower Storage Limit (mm/layer) 25.7 150.5 204.6 115.2 Air Dry Moisture Content (mm/layer) 3.2 Layer Thickness (mm) 100.0 500.0 600.0 300.0 Profile Max Rootzone

Total Saturated Water Content (mm) 762.8 418.1 Total Drained Upper Limit (mm) 694.0 367.1 Total Lower Storage Limit (mm) 496.0 244.4 Total Air Dry Moisture Content (mm) 4.6 3.9 Total Depth (mm) 1500.0 800.0 Maximum Plant Available Water Capacity 122.7 Saturated Hydraulic Conductivity At Surface (mm/hr) 1.0 Limiting (mm/hr) 0.5 RUNOFF Runoff curve No II 73.0 SOIL EVAPORATION CONA (mm/day^0.5) 3.5 URITCH (mm) 6.0 _____________________________________________________________________________________ AVERAGE WASTE STREAM ******************** Sewage treatment plant waste stream (All values relate to influent after any screening and recycling, if applicable). Inflow Volume (ML/year) 63.39 Nitrogen (tonne/year) 1.30 Phosphorus (tonne/year) 0.41 Salinity (tonne/year) 44.70 Nitrogen Concentration (mg/L) 20.55 Phosphorus Concentration (mg/L) 6.54 Salinity (mg/L) 705.19 Salinity (dS/m) 1.10 WASTE STREAM DETAILS (for last inflow event): Nitrogen Concentration (mg/L) 21.41 Phosphorus Concentration (mg/L) 6.81 TDS Concentration (mg/L) 734.86 Salinity (dS/m) 1.15 _____________________________________________________________________________________ IRRIGATION WATER **************** Irrigation triggered on a soil water deficit of (mm): 50.0 Irrigating up to upper storage limit + 0 mm AREA Total Irrigation Area (ha) 1.00 VOLUMES Total Irrigation (ML/year) 0.00 Minimum Volume Irrigated by Pump (ML/ha/day) 0.00 Maximum Volume Irrigated by Pump (ML/day) 0.00 Maximum Vol. Available For Shandying (ML/yr) 0.00 IRRIGATION CONCENTRATIONS Average salinity of Irrigation (dS/m) 0.00 Average salinity of Irrigation (mg/L) 0.00 Average Nitrogen Conc of Irrigation Before ammonia loss (mg/L) 0.00 After ammonia loss (mg/L) 0.00 Average Phosphorus Conc of Irrigation (mg/L) 0.00

LAND DISPOSAL AREA ****************** WATER BALANCE ------------- (Initial soil water assumed to be at field capacity) (Irrigated up to 0.00% of field capacity) Rainfall (mm/year) 673.6 Irrigation Area (ha) 1.0 Irrigation (mm/year) 0.0 Soil Evaporation (mm/year) 350.4 Transpiration (mm/year) 296.1 Runoff (mm/year) 18.6 Drainage (mm/year) 10.4 Change in soil moisture (mm/year) -2.0 ANNUAL TOTALS Year Rain Irrig Sevap Trans Runoff Drain Change (mm) (mm) (mm) (mm) (mm) (mm) (mm) _____________________________________________________________________________ 1957 373.0 0.0 296.0 254.7 0.0 8.2 -185.9 1958 880.0 0.0 435.0 336.0 37.0 0.0 72.0 1959 804.0 0.0 283.3 549.6 0.1 0.0 -28.9 1960 602.0 0.0 293.8 347.7 0.1 0.0 -39.6 1961 777.0 0.0 458.5 287.4 25.5 0.0 5.5 1962 690.0 0.0 292.5 377.6 2.5 0.0 17.3 1963 834.0 0.0 411.8 363.0 68.8 0.0 -9.6 1964 599.0 0.0 368.7 220.7 8.8 0.0 0.8 1965 550.0 0.0 366.4 182.0 11.0 0.0 -9.4 1966 597.0 0.0 421.2 164.3 0.2 0.0 11.3 1967 675.0 0.0 420.6 257.9 6.8 0.0 -10.3 1968 632.0 0.0 410.0 213.3 12.6 0.0 -3.9 1969 480.0 0.0 279.2 182.2 0.1 0.0 18.5 1970 510.0 0.0 272.8 161.2 1.7 0.0 74.4 1971 978.0 0.0 260.2 459.2 154.6 107.8 -3.8 1972 745.0 0.0 293.9 501.0 40.9 0.0 -90.9 1973 1077.0 0.0 466.8 472.7 18.3 0.0 119.3 1974 772.0 0.0 323.5 496.6 2.2 31.4 -81.7 1975 887.0 0.0 370.6 336.4 10.9 27.4 141.6 1976 672.0 0.0 329.0 461.8 5.4 7.8 -132.1 1977 521.0 0.0 337.1 228.4 3.4 0.0 -47.8 1978 983.0 0.0 369.4 498.6 100.4 0.6 13.9 1979 603.0 0.0 384.8 215.4 12.2 0.0 -9.4 1980 625.0 0.0 300.7 301.5 0.3 0.0 22.5 1981 783.0 0.0 273.2 485.1 3.3 0.0 21.4 1982 463.0 0.0 288.1 225.8 0.9 0.0 -51.9 1983 1169.0 0.0 308.2 619.1 94.3 126.3 21.1 1984 906.0 0.0 319.3 537.1 22.1 0.0 27.5 1985 682.0 0.0 418.1 304.6 0.6 0.0 -41.3 1986 772.0 0.0 403.8 271.5 31.2 0.0 65.6 1987 510.0 0.0 401.2 173.5 0.0 0.0 -64.7 1988 696.0 0.0 389.8 210.4 29.0 0.0 66.8 1989 844.0 0.0 424.8 420.7 16.0 0.0 -17.4 1990 530.0 0.0 307.8 182.3 1.0 0.0 38.9 1991 478.0 0.0 299.7 182.0 10.1 0.0 -13.9 1992 504.0 0.0 352.4 161.3 2.7 0.0 -12.4 1993 408.0 0.0 334.5 89.8 0.0 0.0 -16.3 1994 509.0 0.0 321.9 169.4 4.8 0.0 12.9 1995 633.0 0.0 377.3 244.8 5.2 0.0 5.6 1996 570.0 0.0 331.1 196.1 6.0 0.0 36.7 1997 596.0 0.0 330.9 220.8 37.3 35.2 -28.1 1998 986.0 0.0 388.7 439.1 38.8 106.9 12.4 1999 597.0 0.0 331.0 275.0 7.6 1.8 -18.5 2000 693.0 0.0 385.0 189.8 19.7 31.2 67.3 2001 477.0 0.0 346.9 182.8 0.0 0.0 -52.6 2002 440.0 0.0 321.6 114.3 1.1 0.0 3.0 2003 625.0 0.0 387.5 160.8 36.1 14.5 26.2 2004 594.0 0.0 329.2 289.2 2.2 0.0 -26.6

_____________________________________________________________________________ NUTRIENT BALANCE NITROGEN Total N irrigated from ponds (kg/ha/year) 0.0 % of Total as ammonium 0.0 Nitrogn lost by ammonia volat.(kg/ha/year) 0.0 Deep Drainage (mm/year) 10.4 Nitrogen added in irrigation (kg/ha/year) 0.0 Nitrogen added in seed (kg/ha/year) 4.6 Nitrogen removed by crop (kg/ha/year) 45.9 Denitrification (kg/ha/year) 0.6 Leached NO3-N (kg/ha/year) 0.5 Change in soil organic-N (kg/ha/year) -38.3 Change in soil solution NH4-N (kg/ha/year) 0.0 Change in soil solution NO3-N (kg/ha/year) -4.0 Change in adsorbed NH4-N (kg/ha/year) 0.0 Initial soil organic-N (kg/ha) 1963.5 Final soil organic-N (kg/ha) 123.9 Initial soil inorganic-N (kg/ha) 193.5 Final soil inorganic-N (kg/ha) 0.3 Average N03-N conc in the root zone (mg/L) 1.2 Average N03-N conc below root zone (mg/L) 3.2 Average N03-N conc of deep drainage (mg/L) 5.0 PHOSPHORUS Phosphorus added in irrigatn (kg/ha/year) 0.0 % of Total as phosphate 100.0 Phosphorus added in seed (kg/ha/year) 0.4 Phosphorus removed by crop (kg/ha/year) 0.4 Leached PO4-P (kg/ha/year) 0.0 Change in dissolved PO4-P (kg/ha/year) 0.0 Change in adsorbed PO4-P (kg/ha/year) 0.0 Average P04-P conc in the root zone (mg/L) 0.0 Average P04-P conc below root zone (mg/L) 0.0 SOIL P STORAGE LIFE Year No. Tot P stored P leached in year kg/ha kg/ha _____________________________________________________________________________ 1957 1 2000.4 0.0 1958 2 2000.4 0.0 1959 3 2000.4 0.0 1960 4 2005.8 0.0 1961 5 2000.4 0.0 1962 6 2000.3 0.0 1963 7 2000.3 0.0 1964 8 2005.8 0.0 1965 9 2000.3 0.0 1966 10 2000.3 0.0 1967 11 2000.3 0.0 1968 12 2005.8 0.0 1969 13 2000.3 0.0 1970 14 2000.3 0.0 1971 15 2000.3 0.0 1972 16 2005.8 0.0 1973 17 2000.3 0.0 1974 18 2000.3 0.0 1975 19 2000.3 0.0 1976 20 2005.7 0.0 1977 21 2000.2 0.0 1978 22 2000.2 0.0 1979 23 2000.2 0.0 1980 24 2005.7 0.0 1981 25 2000.2 0.0 1982 26 2000.2 0.0 1983 27 2000.2 0.0 1984 28 2005.6 0.0

1985 29 2000.1 0.0 1986 30 2000.1 0.0 1987 31 2000.1 0.0 1988 32 2005.6 0.0 1989 33 2000.1 0.0 1990 34 2000.1 0.0 1991 35 2000.1 0.0 1992 36 2005.6 0.0 1993 37 2000.1 0.0 1994 38 2000.1 0.0 1995 39 2000.1 0.0 1996 40 2005.5 0.0 1997 41 2000.1 0.0 1998 42 2000.0 0.0 1999 43 2000.0 0.0 2000 44 2005.5 0.0 2001 45 2000.0 0.0 2002 46 2000.0 0.0 2003 47 2000.0 0.0 2004 48 2005.5 0.0 _____________________________________________________________________________ PLANT ----- Plant species: Tropical pasture PLANT WATER USE Irrigation (mm/year) 0. Totl Irrigation Area(ha) 1.0 Pan coefficient (%) 1.0 Maximum crop coefficient (%) 0.8 Average Plant Cover (%) 30. Average Plant Total Cover (%) 47. Average Plant Rootdepth (mm) 269. Average Plant Available Water Capacity (mm) 100. Average Plant Available Water (mm) 19. Yield produced per unit transp. (kg/ha/mm) 12. PLANT NUTRIENT UPTAKE Dry Matter Yield (Shoots) (kg/ha/yr) 3445. Net nitrogen removed by plant (kg/ha/yr) 41. Shoot Concn (%DM) 1.20 Net phosphorus removed by plant (kg/ha/yr) 0. Shoot Concn (%DM) 0.00 AVERAGE MONTHLY GROWTH STRESS (0=no stress, 1=full stress) Month Yield Nitr Temp Water Water kg/ha Defic Logging ____________________________________________ 1 541. 0.5 0.0 0.5 0.0 2 442. 0.5 0.0 0.5 0.0 3 437. 0.5 0.0 0.5 0.0 4 250. 0.4 0.0 0.7 0.0 5 98. 0.2 0.2 0.7 0.0 6 104. 0.3 0.5 0.6 0.0 7 88. 0.3 0.6 0.6 0.0 8 125. 0.2 0.5 0.6 0.0 9 157. 0.2 0.2 0.7 0.0 10 230. 0.2 0.0 0.6 0.0 11 444. 0.3 0.0 0.5 0.0 12 527. 0.5 0.0 0.5 0.0 >>> NO-PLANT EVENTS <<< %Days due to temperature stress 0.6 %Days due to frosting 0.2 %Days due to scorching 0.0 %Days due to water stress 40.7

%Days due to nitrogen stress 0.0 No. of forced harvests per year 2.7 _____________________________________________________________________________________ SALINITY -------- Salt tolerance - plant species: moderate Average EC of Irrigation Water (dS/m) 0.0 Irrigation (mm/year) 0.0 Average EC of Rainwater (dS/m x10) 0.3 Rainfall (mm/year) 673.6 >>>No salinity calculations<<< No. of years chosen for running averages 10 _____________________________________________________________________________________ GROUNDWATER ************ Average Groundwater Recharge (m3/day) 0.3 Average Nitrate-N Conc of Recharge (mg/L) 5.0 Thickness of the Aquifer (m) 10.0 Distance (m) from Irrigation Area to where Nitrate-N Conc in Groundwater is Calculated 1000.0 Concentration of NITRATE-N in Groundwater (mg/L) ---------------------------------------------- Year Depth Below Water Table Surface 0.0 m 5.0 m 9.0 m ____________________________________________ 1961 0.0 0.0 0.0 1966 0.0 0.0 0.0 1971 0.0 0.0 0.0 1976 0.0 0.0 0.0 1981 0.0 0.0 0.0 1986 0.0 0.0 0.0 1991 0.0 0.0 0.0 1996 0.0 0.0 0.0 2001 0.0 0.0 0.0 Last 2004 0.0 0.0 0.0 _____________________________________________________________________________________ Equivalent persons 700 Dry weather Production (ML/day) 0.1621 Effluent per person (L/day) 231.5 Effluent per person (L/yr) 84497.5 Effluent volume per 1000 EPs per year (ML) 84.5 Infiltration average

d) Mr. Rose Farm: with irrigation ***************************************** SUMMARY OUTPUT MEDLI Version 1.30 Data Set: Taroom Farm Run Date: 12/05/09 Time:10:17:13.45 ***************************************** GENERAL INFORMATION ******************* Title: Taroom Farm Subject: Irrigation Application rates Client: [no entry] User: Rick C. Time: Tue May 12 09:59:28 2009 Comments: [no entry] RUN PERIOD ********** Starting Date 1/ 1/1957 Ending Date 31/12/2004 Run Length 48 years 0 days _____________________________________________________________________________________ CLIMATE INFORMATION ******************* Enterprise site: Taroom Farm -25.6 deg S 149.8 deg E Weather station: Theodore_24.95S_150.05E (Interpo ANNUAL TOTALS 10 Percentile 50 percentile 90 Percentile Rainfall mm/year 478. 629. 981. Pan Evap mm/year 1870. 2035. 2185. MONTHLY Jan Feb Mar Apr May Jun Jul Aug Sep Oct Nov Dec Year Rainfall (mm) 97 92 55 41 40 28 31 27 27 61 81 93 673 Pan Evap (mm) 239 189 193 151 110 86 93 122 167 209 225 242 2025 Ave Max Temp DegC 34 32 32 29 26 23 22 24 28 30 32 34 28 Ave Min Temp DegC 21 20 19 15 11 8 6 7 11 15 18 20 14 Rad (MJ/m2/day) 23 20 20 18 15 14 15 18 21 23 24 24 19 ------------------------------------------------------------------------------------- MONTHLY IRRIGATION ****************** Irrigation (mm) 94 67 73 68 54 33 27 41 68 87 89 94 793 _____________________________________________________________________________________ SOIL PROPERTIES *************** Soil type: Black Earth SOIL WATER PROPERTIES Layer 1 Layer 2 Layer 3 Layer 4 Bulk Density (g/cm3) 1.0 1.3 1.3 1.3 Porosity (mm/layer) 60.4 262.3 298.9 148.3 Saturated Water Content (mm/layer) 59.6 259.5 297.0 146.7 Drained Upper Limit (mm/layer) 41.2 232.5 280.2 140.1 Lower Storage Limit (mm/layer) 25.7 150.5 204.6 115.2 Air Dry Moisture Content (mm/layer) 3.2 Layer Thickness (mm) 100.0 500.0 600.0 300.0 Profile Max Rootzone Total Saturated Water Content (mm) 762.8 418.1 Total Drained Upper Limit (mm) 694.0 367.1

Total Lower Storage Limit (mm) 496.0 244.4 Total Air Dry Moisture Content (mm) 4.6 3.9 Total Depth (mm) 1500.0 800.0 Maximum Plant Available Water Capacity 122.7 Saturated Hydraulic Conductivity At Surface (mm/hr) 1.0 Limiting (mm/hr) 0.5 RUNOFF Runoff curve No II 73.0 SOIL EVAPORATION CONA (mm/day^0.5) 3.5 URITCH (mm) 6.0 _____________________________________________________________________________________ AVERAGE WASTE STREAM ******************** Sewage treatment plant waste stream (All values relate to influent after any screening and recycling, if applicable). Inflow Volume (ML/year) 63.39 Nitrogen (tonne/year) 1.30 Phosphorus (tonne/year) 0.41 Salinity (tonne/year) 44.70 Nitrogen Concentration (mg/L) 20.55 Phosphorus Concentration (mg/L) 6.54 Salinity (mg/L) 705.19 Salinity (dS/m) 1.10 WASTE STREAM DETAILS (for last inflow event): Nitrogen Concentration (mg/L) 21.41 Phosphorus Concentration (mg/L) 6.81 TDS Concentration (mg/L) 734.86 Salinity (dS/m) 1.15 _____________________________________________________________________________________ IRRIGATION WATER **************** Irrigation triggered on a soil water deficit of (mm): 50.0 Irrigating upto upper storage limit + 0 mm AREA Total Irrigation Area (ha) 1.00 VOLUMES Total Irrigation (ML/year) 7.93 Minimum Volume Irrigated by Pump (ML/ha/day) 0.00 Maximum Volume Irrigated by Pump (ML/day) 162.00 Maximum Vol. Available For Shandying (ML/yr) 0.00 IRRIGATION CONCENTRATIONS Average salinity of Irrigation (dS/m) 1.19 Average salinity of Irrigation (mg/L) 760.52 Average Nitrogen Conc of Irrigation Before ammonia loss (mg/L) 15.49 After ammonia loss (mg/L) 15.49 Average Phosphorus Conc of Irrigation (mg/L) 7.05 _____________________________________________________________________________________

LAND DISPOSAL AREA ****************** WATER BALANCE ------------- (Initial soil water assumed to be at field capacity) (Irrigated up to 100.00% of field capacity) Rainfall (mm/year) 673.6 Irrigation Area (ha) 1.0 Irrigation (mm/year) 793.1 Soil Evaporation (mm/year) 63.8 Transpiration (mm/year) 1337.5 Runoff (mm/year) 26.4 Drainage (mm/year) 39.4 Change in soil moisture (mm/year) -0.4 ANNUAL TOTALS Year Rain Irrig Sevap Trans Runoff Drain Change (mm) (mm) (mm) (mm) (mm) (mm) (mm) _____________________________________________________________________________ 1957 373.0 983.1 66.1 1362.8 0.0 8.2 -81.0 1958 880.0 665.7 112.9 1331.9 45.5 56.2 -0.8 1959 804.0 686.9 0.0 1445.1 12.0 26.0 7.9 1960 602.0 888.4 0.0 1475.1 3.3 0.0 11.9 1961 777.0 625.9 109.0 1292.7 17.5 21.2 -37.5 1962 690.0 839.3 0.0 1469.5 6.3 0.0 53.5 1963 834.0 729.4 121.4 1288.0 83.7 98.7 -28.4 1964 599.0 842.4 156.9 1272.5 3.5 0.0 8.5 1965 550.0 784.5 95.2 1249.8 20.1 3.5 -34.3 1966 597.0 877.8 0.0 1442.6 4.5 0.0 27.6 1967 675.0 739.9 0.0 1437.0 6.3 0.0 -28.4 1968 632.0 835.0 136.0 1297.2 9.3 1.8 22.8 1969 480.0 991.5 0.0 1447.4 0.5 0.0 23.6 1970 510.0 1157.8 0.0 1627.7 7.4 0.0 32.7 1971 978.0 728.1 163.8 1243.8 182.6 135.0 -19.0 1972 745.0 729.5 112.5 1300.8 41.8 49.2 -29.8 1973 1077.0 468.3 0.0 1342.5 24.4 95.7 82.7 1974 772.0 578.2 117.7 1157.3 7.6 140.4 -72.8 1975 887.0 772.3 0.0 1380.7 132.6 63.3 82.6 1976 672.0 679.6 0.0 1356.5 3.5 57.5 -66.0 1977 521.0 797.4 99.3 1231.8 1.6 4.4 -18.7 1978 983.0 574.7 0.0 1389.8 113.0 87.3 -32.4 1979 603.0 944.7 0.0 1533.1 4.6 0.0 10.0 1980 625.0 897.2 122.5 1341.5 5.5 43.7 9.1 1981 783.0 629.0 0.0 1338.4 7.9 38.9 26.8 1982 463.0 674.2 172.6 994.3 4.6 16.2 -50.5 1983 1169.0 626.5 0.0 1412.7 175.7 172.2 34.9 1984 906.0 523.0 214.5 1095.3 36.5 67.3 15.3 1985 682.0 731.1 163.1 1223.9 15.0 36.4 -25.4 1986 772.0 843.8 163.6 1278.6 54.2 87.0 32.4 1987 510.0 993.9 0.0 1517.4 0.0 0.0 -13.5 1988 696.0 943.5 0.0 1556.1 35.7 49.1 -1.4 1989 844.0 520.5 0.0 1241.7 13.2 124.9 -15.3 1990 530.0 891.9 0.0 1385.5 0.1 4.1 32.2 1991 478.0 1100.4 0.0 1558.5 11.5 8.9 -0.5 1992 504.0 883.6 0.0 1423.6 0.7 3.5 -40.2 1993 408.0 1157.4 0.0 1550.2 0.0 0.0 15.2 1994 509.0 615.0 319.7 760.6 10.4 50.0 -16.7 1995 633.0 986.9 5.0 1581.1 12.6 13.3 8.0 1996 570.0 781.2 0.0 1321.9 5.8 0.0 23.5 1997 596.0 878.9 0.0 1437.2 41.5 40.4 -44.2 1998 986.0 573.3 0.0 1326.7 40.6 157.3 34.7 1999 597.0 724.8 0.0 1287.1 16.3 23.9 -5.5 2000 693.0 678.4 119.6 1153.2 5.6 35.4 57.6 2001 477.0 1042.8 0.0 1558.4 1.3 0.0 -39.9 2002 440.0 1043.5 122.9 1363.9 2.5 1.5 -7.1 2003 625.0 834.0 141.4 1232.9 24.2 64.9 -4.5 2004 594.0 573.6 226.0 883.2 15.9 2.6 39.9

_____________________________________________________________________________ NUTRIENT BALANCE ----------------- NITROGEN Total N irrigated from ponds (kg/ha/year) 122.9 % of Total as ammonium 0.0 Nitrogn lost by ammonia volat.(kg/ha/year) 0.0 Deep Drainage (mm/year) 39.4 Nitrogen added in irrigation (kg/ha/year) 122.9 Nitrogen added in seed (kg/ha/year) 0.5 Nitrogen removed by crop (kg/ha/year) 163.6 Denitrification (kg/ha/year) 1.5 Leached NO3-N (kg/ha/year) 0.5 Change in soil organic-N (kg/ha/year) -38.2 Change in soil solution NH4-N (kg/ha/year) 0.0 Change in soil solution NO3-N (kg/ha/year) -4.0 Change in adsorbed NH4-N (kg/ha/year) 0.0 Initial soil organic-N (kg/ha) 1963.5 Final soil organic-N (kg/ha) 131.8 Initial soil inorganic-N (kg/ha) 193.5 Final soil inorganic-N (kg/ha) 0.1 Average N03-N conc in the root zone (mg/L) 0.0 Average N03-N conc below root zone (mg/L) 1.1 Average N03-N conc of deep drainage (mg/L) 1.3 PHOSPHORUS Phosphorus added in irrigatn (kg/ha/year) 55.9 % of Total as phosphate 100.0 Phosphorus added in seed (kg/ha/year) 0.0 Phosphorus removed by crop (kg/ha/year) 30.7 Leached PO4-P (kg/ha/year) 0.0 Change in dissolved PO4-P (kg/ha/year) 0.0 Change in adsorbed PO4-P (kg/ha/year) 25.3 Average P04-P conc in the root zone (mg/L) 0.1 Average P04-P conc below root zone (mg/L) 0.0 SOIL P STORAGE LIFE Year YearNo. Tot P stored P leached in year kg/ha kg/ha _____________________________________________________________________________ 1957 1 2031.2 0.0 1958 2 2089.6 0.0 1959 3 2127.5 0.0 1960 4 2166.3 0.0 1961 5 2194.8 0.0 1962 6 2216.1 0.0 1963 7 2241.1 0.0 1964 8 2273.3 0.0 1965 9 2287.4 0.0 1966 10 2314.0 0.0 1967 11 2326.2 0.0 1968 12 2350.4 0.0 1969 13 2375.3 0.0 1970 14 2412.6 0.0 1971 15 2431.7 0.0 1972 16 2454.9 0.0 1973 17 2460.8 0.0 1974 18 2463.1 0.0 1975 19 2478.9 0.0 1976 20 2502.8 0.0 1977 21 2514.3 0.0 1978 22 2535.7 0.0 1979 23 2553.7 0.0 1980 24 2583.9 0.0 1981 25 2599.8 0.0 1982 26 2620.1 0.0 1983 27 2641.8 0.0

1984 28 2661.1 0.0 1985 29 2670.0 0.0 1986 30 2694.3 0.0 1987 31 2722.4 0.0 1988 32 2762.1 0.0 1989 33 2771.5 0.0 1990 34 2794.0 0.0 1991 35 2827.5 0.0 1992 36 2869.8 0.0 1993 37 2899.9 0.0 1994 38 2931.8 0.0 1995 39 2962.4 0.0 1996 40 2997.2 0.0 1997 41 3014.8 0.0 1998 42 3040.9 0.0 1999 43 3053.6 0.0 2000 44 3086.1 0.0 2001 45 3106.2 0.0 2002 46 3140.2 0.0 2003 47 3180.9 0.0 2004 48 3216.2 0.0 _____________________________________________________________________________ PLANT ----- Plant species: Tropical pasture PLANT WATER USE Irrigation (mm/year) 793. Totl Irrigation Area(ha) 1.0 Pan coefficient (%) 1.0 Maximum crop coefficient (%) 0.8 Average Plant Cover (%) 82. Average Plant Total Cover (%) 92. Average Plant Rootdepth (mm) 729. Average Plant Available Water Capacity (mm) 119. Average Plant Available Water (mm) 95. Yield produced per unit transp. (kg/ha/mm) 9. PLANT NUTRIENT UPTAKE Dry Matter Yield (Shoots) (kg/ha/yr) 11568. Net nitrogen removed by plant (kg/ha/yr) 163. Shoot Concn (%DM) 1.41 Net phosphorus removed by plant (kg/ha/yr) 31. Shoot Concn (%DM) 0.26 AVERAGE MONTHLY GROWTH STRESS (0=no stress, 1=full stress) Month Yield Nitr Temp Water Water kg/ha Defic Logging ____________________________________________ 1 1242. 0.7 0.0 0.0 0.0 2 1057. 0.7 0.0 0.0 0.0 3 1053. 0.7 0.0 0.0 0.0 4 960. 0.7 0.0 0.0 0.0 5 824. 0.7 0.2 0.0 0.0 6 660. 0.8 0.5 0.0 0.0 7 499. 0.6 0.6 0.0 0.0 8 596. 0.6 0.5 0.0 0.0 9 868. 0.7 0.2 0.1 0.0 10 1191. 0.7 0.0 0.0 0.0 11 1286. 0.7 0.0 0.0 0.0 12 1333. 0.8 0.0 0.0 0.0 >>> NO-PLANT EVENTS <<< %Days due to temperature stress 0.3 %Days due to frosting 0.2 %Days due to scorching 0.0

%Days due to water stress 1.4 %Days due to nitrogen stress 0.1 No. of forced harvests per year 0.5 No. of normal harvests per year 1.3 _____________________________________________________________________________________ SALINITY -------- Salt tolerance - plant species: moderate Average EC of Irrigation Water (dS/m) 1.2 Irrigation (mm/year) 793.1 Average EC of Rainwater (dS/m x10) 0.3 Rainfall (mm/year) 673.6 Average EC of Infiltrated water (dS/m) 0.7 Av. water-upt-weightd rootzone EC(dS/m s.e.) 1.2 EC soil soln (FC) at base of rootzone (dS/m) 28.5 Deep Drainage (mm/year) 39.4 Reduction in Crop yield due to Salinity (%) 0.0 Percentage of yrs that crop yld falls below 90% of potential because of soil salinity 0.0 Period ECrootzone ECbase Rel Yield sat ext in situ (dS/m) (dS/m) (%) ____________________________________________ 1957 - 1966 1.32 44.87 100. 1958 - 1967 1.25 45.01 100. 1959 - 1968 1.32 62.55 100. 1960 - 1969 1.40 78.91 100. 1961 - 1970 1.43 82.10 100. 1962 - 1971 1.37 43.38 100. 1963 - 1972 1.35 35.52 100. 1964 - 1973 1.28 34.02 100. 1965 - 1974 1.19 22.50 100. 1966 - 1975 1.12 19.40 100. 1967 - 1976 1.08 17.06 100. 1968 - 1977 1.10 17.06 100. 1969 - 1978 1.03 14.23 100. 1970 - 1979 1.01 14.08 100. 1971 - 1980 0.97 12.63 100. 1972 - 1981 0.98 14.57 100. 1973 - 1982 1.01 15.37 100. 1974 - 1983 1.02 13.95 100. 1975 - 1984 1.02 15.54 100. 1976 - 1985 1.06 16.41 100. 1977 - 1986 1.06 15.71 100. 1978 - 1987 1.07 16.23 100. 1979 - 1988 1.13 18.38 100. 1980 - 1989 1.04 13.96 100. 1981 - 1990 1.05 14.86 100. 1982 - 1991 1.12 16.70 100. 1983 - 1992 1.14 17.56 100. 1984 - 1993 1.29 27.28 100. 1985 - 1994 1.35 28.99 100. 1986 - 1995 1.38 32.04 100. 1987 - 1996 1.42 42.82 100. 1988 - 1997 1.38 36.53 100. 1989 - 1998 1.28 25.55 100. 1990 - 1999 1.35 34.93 100. 1991 - 2000 1.30 30.88 100. 1992 - 2001 1.31 31.42 100. 1993 - 2002 1.34 32.27 100. 1994 - 2003 1.27 25.82 100. 1995 - 2004 1.26 29.22 100. _____________________________________________________________________________________ GROUNDWATER ************ Average Groundwater Recharge (m3/day) 1.1 Average Nitrate-N Conc of Recharge (mg/L) 1.3 Thickness of the Aquifer (m) 10.0

Distance (m) from Irrigation Area to where Nitrate-N Conc in Groundwater is Calculated 1000.0 Concentration of NITRATE-N in Groundwater (mg/L) ---------------------------------------------- Year Depth Below Water Table Surface 0.0 m 5.0 m 9.0 m ____________________________________________ 1961 0.0 0.0 0.0 1966 0.1 0.1 0.1 1971 0.1 0.1 0.1 1976 0.1 0.1 0.1 1981 0.1 0.1 0.1 1986 0.1 0.1 0.1 1991 0.1 0.1 0.1 1996 0.1 0.1 0.1 2001 0.1 0.1 0.1 Last 2004 0.1 0.1 0.1 _____________________________________________________________________________________ Equivalent persons 700 Dry weatherProduction (ML/day) 0.1621 Effluent per person (L/day) 231.5 Effluent per person (L/yr) 84497.5 Effluent volume per 1000 EPs per year (ML) 84.5 Infiltration average _____________________________________________

APPENDIX B Calculations