Embed Size (px)
Citation preview
1
Ongoing draft Not for citation
21/09/2014
Tariff Preference and Trade Cost as
Determinants of Export: The Case of Bangladesh
Mashfique Ibne Akbar Research Associate1
Centre for Policy Dialogue (CPD) House: 40/C, Road: 32, Dhanmondi R/A,
Dhaka-1209, Bangladesh. <[email protected]>
Towfiqul Islam Khan
Research Fellow Centre for Policy Dialogue (CPD)
House: 40/C, Road: 32, Dhanmondi R/A, Dhaka-1209, Bangladesh.
21 September, 2014
Prepared for Asia-Pacific Trade Economists’ Conference: “Trade in the Asian Century: Delivering on the Promise of Economic Prosperity”
22-23 September, 2014
1Corresponding author: +8801719297168 (cell), +88028124770 (office), +88028130951 (fax)

2
Abstract
Bangladesh’s export trend has been robust throughout the last couple of decades, but
her exports have been limited to a number of products and product-destinations are
restricted to only a certain developed regions. The current study examines whether
tariff preferences impacts Bangladesh’s export. Additionally, the paper also examines
whether trade cost impacts Bangladesh’s exports. In the above context, the study
evaluates performance of export of the Bangladesh economy together with an analysis
based on the relative preferential margin (RPM). The paper highlights that Bangladesh
could make only a small progress towards diversifying her exports during last ten years
(2003-2013). The RPM estimations for Bangladesh further reveals that tariff
preferences for most of the export flows from Bangladesh faced unfavourable tariff
preferences in 2013. As regards trade cost and its components, it is found that
Bangladesh’s exports are influenced by the economic condition of partner countries and
GSP facilities. Since the trade cost variable incorporates a number of components
including tariff, transport cost, cultural components and trade facilitation issues, future
trade policies of Bangladesh will need to address these issues with utmost sincerity.
Keywords: Export, Bangladesh, Tariff Preferences, Trade Cost, Relative
Preferential Margin (RPM), Gravity Model
JEL Classification: C10, C21, F14
3
I. Introduction
Exports originating from Bangladesh have been concentrated to a limited number of
products. This has been the case historically with Bangladesh, from the spell when
Bangladesh started to shift to an export-oriented economy since the early 1990s. What
is more noteworthy is that exports are shipped to a limited number of destinations,
mainly the developed US and Euro destinations. Bangladesh’s exports grew by 7.8 per
cent from 1980-1990. But the figure showed substantial increase in the subsequent
decade of 1990-2000, taking a value of 15.7 (UNCTAD, 2014). The trend has continued
in recent decades but has kept approximately to the same levels – 12.9 per cent growth
between 2000 and 2010 and 13.6 per cent growth between 2010 and 2013. Lack of both
product and geographic diversification of exports represent a grave concern for
Bangladesh concerning the sustainability of export-led growth strategy, which has been
a trending concept for Least Developed Countries (LDCs) (similar to Bangladesh2) for
the past couple of decades.
The importance of higher survival rates of new export dimensions and trade at the
extensive margin3 is continually stressed for sustained economic growth of the poorer
nations (Besedes and Prusa, 2006; Brenton, Pierola, and von Uexkull, 2009). While
export diversification mitigates external volatility, but several constraints are faced by
the developing countries in opting for export diversification. Some of the el primo
factors would include transaction costs, weak infrastructure and rule of law, poor
implementation of trade facilitation mechanisms and unbalanced national and regional
trade policies. Another factor worth noting is that system of trade preference (e.g. most-
favoured nation [MFN] tariff rate) determines exports of the developing countries. On
the favourable side, there is preferential treatment by the developed trading partners,
but on the other hand, sombre tariff and non-tariff barriers are encountered by these
nations while venturing other developing and regional destinations.
The Doha Development Round (DDR) of the World Trade Organisation (WTO) was a
major breakthrough in the sphere of tariffs. It was since assumed that tariffs would be a
2 Bangladesh is included in the list of LDCs. The LDC currently includes 49 countries. 3 The extensive margin indicates new products at a later date as compared to a prior reference period
4
thing of the past and would be “relatively irrelevant” as a trade barrier. But the case has
been essentially different in the face of the deadlock of the WTO. Even today, after more
than one decade of the DDR, tariffs continue to be a solemn deterrent of trade for the
developing countries. One can argue that there are trade facilitation instruments and
there are Aid for Trade measures, but the question remains as to whether tariffs are still
relevant and whether there is tariff erosion? We would like to put forward the
hypothesis that tariffs are very relevant in today’s world. The “trade agreement
shopping” that is evident between each and every nation further supports the
hypothesis. “Trade agreement shopping” essentially refers to the notion that each
country is opting for bilateral, multilateral, plurilateral or regional trade agreements,
irrespective of their developmental state.
While it can be argued that overall tariffs are on the decline pertaining to both
developed and developing countries and is receiving lesser and lesser attention as
compared to other non-tariff measures, however, what appears to be disquieting is that
tariffs still have a role to play in the determination of exports, especially that of the
developing hosts. The first part of the study aims to identify determinants of exports
from Bangladesh by focusing on the role of market access, specifically tariffs. The
research question involves around the identification of the trend of whether the export-
led growth of Bangladesh has been due to the increase in value and/or volume of
existing trade flows or new trade flows. Together with examination of Bangladesh’s
overall export trends, the paper identifies the relative market access of Bangladesh’s
exports. This has been examined with the estimation of the relative preferential margin
for Bangladeshi exports at the Harmonised System (HS) 6-digit level.
With tariffs falling under the broad category of trade costs, the second part of the paper
aims to examine whether trade costs affect Bangladesh’s exports. This is important from
the point of view that Bangladesh has very meagre amounts of trade with her
developing partners, specifically the South Asian counterparts. The destination of the
majority of the exports has been the Euro zone (EU 27) and the US. In this connection,
55.13 per cent4 of Bangladesh’s export in 2012 accounted for the Euro zone and 19.28
4 According to data from Trade Map data, International Trade Centre, 2013

5
per cent went to the US; while in contrast, only a meager 1.22 per cent of Bangladesh’s
exports catered to the ASEAN (Association of Southeast Asian Nations) region in the
same timeframe (Bangladesh’s imports from ASEAN stood at 18.8 per cent in the same
year) and 2.47 per cent for the South Asian counterpart. It can be observed that more
than four-fifths of the export of Bangladesh is diverted to the distant US and Euro zone,
while very minimal trade occurs with its neighboring Asian counterparts. Hence, it can
be made out that trade costs, including tariffs have a role to play in the lack of export
diversification that is evident from the export basket of Bangladesh. With Arvis, Duval,
Shepherd and Utoktham (2013) stamping the fact that trade costs are a major
hindrance for trade in the developing countries, trade cost have also been determined to
be a dynamic foray in Bangladesh’s trade. The current study employs gravity modeling
to identify the brunt of trade cost on Bangladesh’s exports.
The paper has been purposely divided into separate sections to keep tariff preference
analysis, dealing with individual export products of the Bangladesh economy, separate
from trade cost analysis, which examines Bangladesh’s export on an aggregate level. In
this respect, the rest of the paper is organised as follows. Section II discusses relevant
literature as regards tariff preferences and trade cost in connection to the Bangladesh
economy. Section III presents export performance trend of Bangladesh. Section IV
discusses the methodology of both RPM and trade cost pertaining to the current
analysis while Section V presents the empirical results. Section VI concludes with
recommendations and way forward.
II. Review of Relevant Literature
Tariff Preferences
The theory put forward by Smith (1776) and Ricardo (1817) in favour of comparative
advantage and specialisation does not hold appear to be relevant in the twenty-first
century. In fact, it was after the Second World War that Prebish (1950) and Singer
(1950) argued that export diversification is necessary to stabilise export earnings and
enhance economic growth. Given the former agenda, the developing countries would
only be exporting primary commodities. In this regard, export diversification seems to
contradict with theories of specialisation and comparative advantage. While some
6
proponents argue that specialisation permits better international competitiveness,
others believe that constricted number of export flows increase volatility in export
earnings and consequently, leading to declining terms of trade. Trade diversification,
essentially, trade involving export of a variety of commodities with different price
tendencies can help achieve sustainable stability in overall export performance.
Export diversification can be defined as “the change in the composition of a country’s
existing export product mix or export destination” (Ali, Alwang and Siegel, 1991).
Thinking otherwise, export diversification can also be defined as the evolution from
traditional to non-traditional sectors. In this connection, there can be different
dimensions of export diversification. The two common prevalent forms of export
diversification include horizontal diversification and vertical diversification (Diagonal
diversification refers to a change from importer input into secondary and tertiary
sectors). Horizontal diversification refers to diversification “within the same sector
(primary, secondary or tertiary), and entails adjustment in the country’s export mix by
adding new products on existing export baskets within the same sector, with the hope
to mitigate adverse economic (to counter international price instability or decline) and
political risks” (Samen, 2010). Vertical diversification refers to a move from the primary
sector to secondary and tertiary sectors. The latter category of diversification can
develop prospects for raw materials together with greater price stability as compared to
raw commodities.
The role of export diversification’s contribution in growth of the developing countries
have been stressed for quite a number of decades now. During the 1950s to the 1970s,
development strategies in the developing world and specifically countries in South Asia,
Africa and Latin America was in support of import-substituting strategies and
installation of restrictive trade policies. However, this view was altered towards export
promotion and outward orientation in the 1980s, 1990s and 2000s with the observable
accomplishments of India, China and the East Asian countries (Samen, 2010).
Bangladesh, too, residing in the South Asian counterpart, initiated the process of
globalisation in early 1990s.
7
Exports play a major role in contributing to the long-run growth of economies. This is
achieved through “supporting a virtuous cycle of investment, innovation and poverty
reduction” (UNCTAD, 2008). In this connection, Bangladesh has predominantly
transformed her economy from an exporter of primary products to a manufactured
goods one. And accordingly, the associated externalities with such structural
transformation has benefited the country with all merits. Export-oriented economies
are generally prone to external economic shocks, with the scale impact depending on
the degree of concentration of a country’s export basket. External shocks pertain to the
developing economies more as such economies are heavily dependent on commodity
exports. “The ability of LDCs to expand export earnings depends on growing world
trade, market access and the ability to diversify export products” (Edo and Heal, 2013).
Market access and diversification of products are hence crucial from the viewpoint of
enhanced global and regional participation of trade as propos LDCs like Bangladesh.
Generally, LDCs have comparatively weaker bargaining capacities. Therefore, the WTO
is a more preferred option for the LDCs because the WTO represents stands a
multilateral trading system. Several multilateral trading systems are existent to cater to
improved market access of the developing countries and the LDCs in particular. The
majority of such trading arrangements focus on reducing tariffs to fashion favourable
preferential margins for the underdeveloped nations. The European Union (EU)
together with other developed countries offers preferential market access for the
developing countries and LDCs. With the Generalised System of Preferences (GSP)
already in effect from 1995, Everything but Arms (EBA) initiative (introduced in 2005)
provides duty free and quota free (DFQF) access for all products from the LDCs (but
arms).
India and China, developing country themselves, provides DFQF access to the LDCs.
India’s Duty Free Tariff Preference (DFTPI-LDC) arrangement was effective from 2008.
While at the outset it preferential arrangements might seem lucrative, but Engel (2009)
argues that “potential welfare benefits are mitigated both through limitations in the
product coverage and administrative specifications, as well as through the uncertainty
of their sustained access”.
8
The apparently dismal state of the WTO agreements and regional and bilateral trade
arrangements taking preference over WTO agreements has become a common practice.
In this respect, the Ninth Ministerial Conference of the WTO in 2013 installed a new ray
of hope for the LDCs. While multilateral trading arrangements benefit LDCs with “a rule-
based policy platform to negotiate flexibilities, waivers and special and differential
treatment” (Rahman, 2014) this agenda was rather unobtainable due to non-
reciprocatory practice of existing bilateral or plurilateral trade negotiations. It should
be noted that broadening of the export base is a very challenging assignment for the
LDCs. While the WTO trade negotiations were meant to cater to the LDCs by means of
better integration into world markets, but the case appears to be driven by political
decisions of key players of the advanced economies. In this connection, it should be
stressed that structural transformation of the developing economies will require firm
commitment from the international community, together with efforts from the
developing country themselves.
Trade cost
Trade cost, amongst other determinants of the volume of trade, plays a significant role
in determining the amount of trade of a nation. Components of trade cost would include
“transportation costs (both freight costs and time costs), policy barriers (tariffs and
non-tariff barriers), information costs, contract enforcement costs, costs associated with
the use of different currencies, legal and regulatory costs and local distribution costs”
(De, 2007). Arvis, Duval, Shepherd and Utoktham (2013) calculated trade costs of
agriculture and manufactured goods in 178 countries to show that “trade costs are
strongly declining in per capita income”. However, the authors make a distinct
observation that the rate of decline of trade costs is far quicker in the developed
countries than in the developing ones. As a result relative isolation between the
developed and developing countries is getting higher by the day. Maritime connectivity
and logistics performance have been further found to be very imperative determinants
of bilateral trade, together with trade policies such as market entry barriers and
regional integration agreements (Free Trade Agreements (FTAs), Preferential Trade
Agreements (PTAs) and other Regional Trade Arrangements (RTAs)) (Arvis, Duval,
Shepherd and Utoktham, 2013). The following diagram (Figure 1), adopted from De
(2007), would best demonstrate the components of trade cost which influences trade
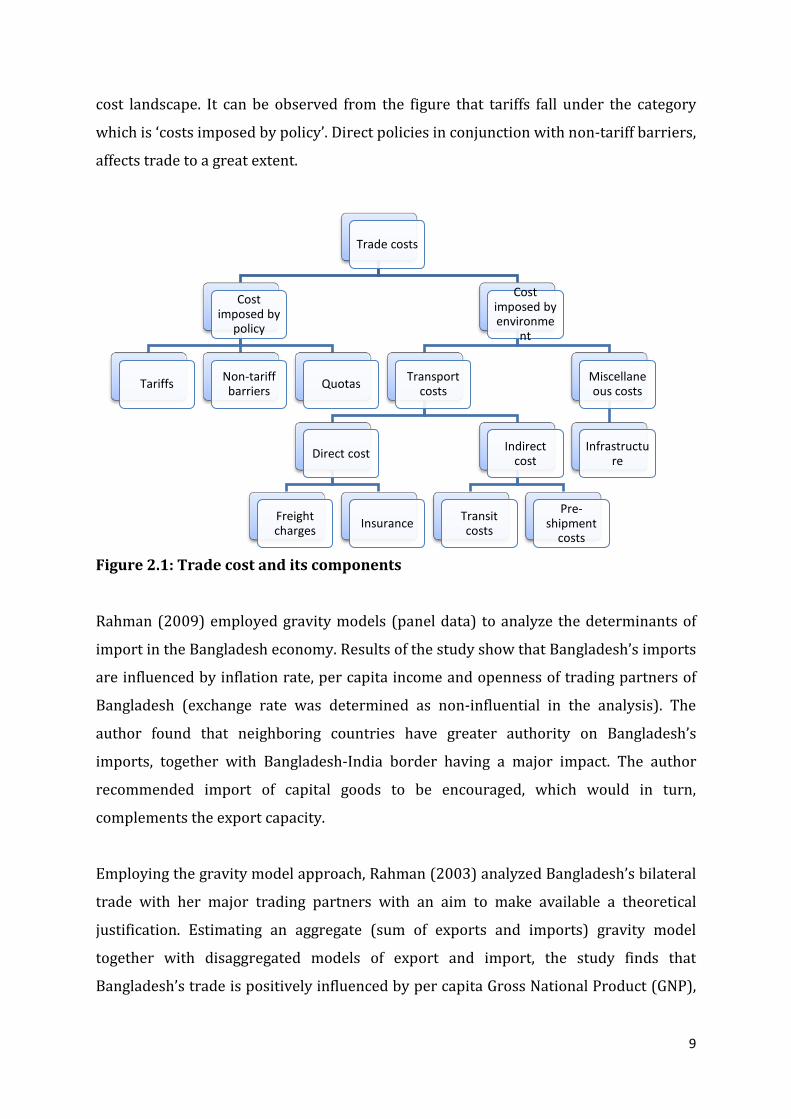
9
cost landscape. It can be observed from the figure that tariffs fall under the category
which is ‘costs imposed by policy’. Direct policies in conjunction with non-tariff barriers,
affects trade to a great extent.
Figure 2.1: Trade cost and its components
Rahman (2009) employed gravity models (panel data) to analyze the determinants of
import in the Bangladesh economy. Results of the study show that Bangladesh’s imports
are influenced by inflation rate, per capita income and openness of trading partners of
Bangladesh (exchange rate was determined as non-influential in the analysis). The
author found that neighboring countries have greater authority on Bangladesh’s
imports, together with Bangladesh-India border having a major impact. The author
recommended import of capital goods to be encouraged, which would in turn,
complements the export capacity.
Employing the gravity model approach, Rahman (2003) analyzed Bangladesh’s bilateral
trade with her major trading partners with an aim to make available a theoretical
justification. Estimating an aggregate (sum of exports and imports) gravity model
together with disaggregated models of export and import, the study finds that
Bangladesh’s trade is positively influenced by per capita Gross National Product (GNP),
Trade costs
Cost imposed by
policy
Tariffs Non-tariff barriers Quotas
Cost imposed by environme
nt
Transport costs
Direct cost
Freight charges Insurance
Indirect cost
Transit costs
Pre-shipment
costs
Miscellaneous costs
Infrastructure
10
the dimension of partner economies, openness and income differential of the trading
partners. Furthermore, exchange rates, openness of the Bangladesh economy and
import demand of partner countries’ were determined as the primary determinants of
Bangladesh’s exports (positive impact). Concluding exchange rate as insignificant,
Rahman (2003) decided on inflation rates, per capita income differentials and openness
of partner countries as the major determinants of Bangladesh’s imports. Additionally,
transport cost was found to be a significant factor in impacting Bangladesh’s trade
negatively. More innovative results include the fact that multilateral resistance factors
affect Bangladesh’s trade (specifically exports) positively and that her imports are
greatly influenced by border trade with India.
Results of Rahman and Dutta (2012) have been found to be very similar to those of
Rahman (2003). Rahman and Dutta (2012) employ a generalized gravity model (panel
data estimation) to analyze Bangladesh’s bilateral trade. Results of the study indicate
that per capita Gross Domestic Product (GDP) differential, size of economies and
openness of partner countries influence Bangladesh’s trade in an optimistic manner.
Exports are positively determined by its own GDP, openness and import demand of
partner countries and negatively affected by domestic inflation and partner country’s
GDP. On the other hand, imports are positively impacted by GDP and openness of
partner countries and hindered by inflation in the destination country.
With the aid of a gravity model, Roy and Rayhan (2011) investigated into the factors of
trade flows which contribute to the Bangladesh economy. Contradicting findings of
Rahman (2003) and Hossain (2009), the authors concluded that regional dummy
variables including SAARC and the contiguity factor border variable are significant
(SAARC dummy is significant with a negative coefficient).
11
III. Dynamics of Export Sector in Bangladesh
Since her independence in 1971, Bangladesh went through a wide ranging changes in
her trade and industrial policies. Over the past four decades or so, the economy
experienced a major shift from a predominantly import-substituting trade and
industrial strategy towards export-promotion and private sector oriented trade and
industrial strategy. As mentioned before, major changes in trade and industrial policy
were initiated from the beginning of the 1990s. During this period, Bangladesh took
significant measures to promote her export. These measures included duty-free import
of machinery and intermediate inputs, subsidised interest rates on bank credit, cash
compensation schemes, and exemption from income tax and other taxes on selective
basis. Indeed, during the last four decades following the move towards liberalisation,
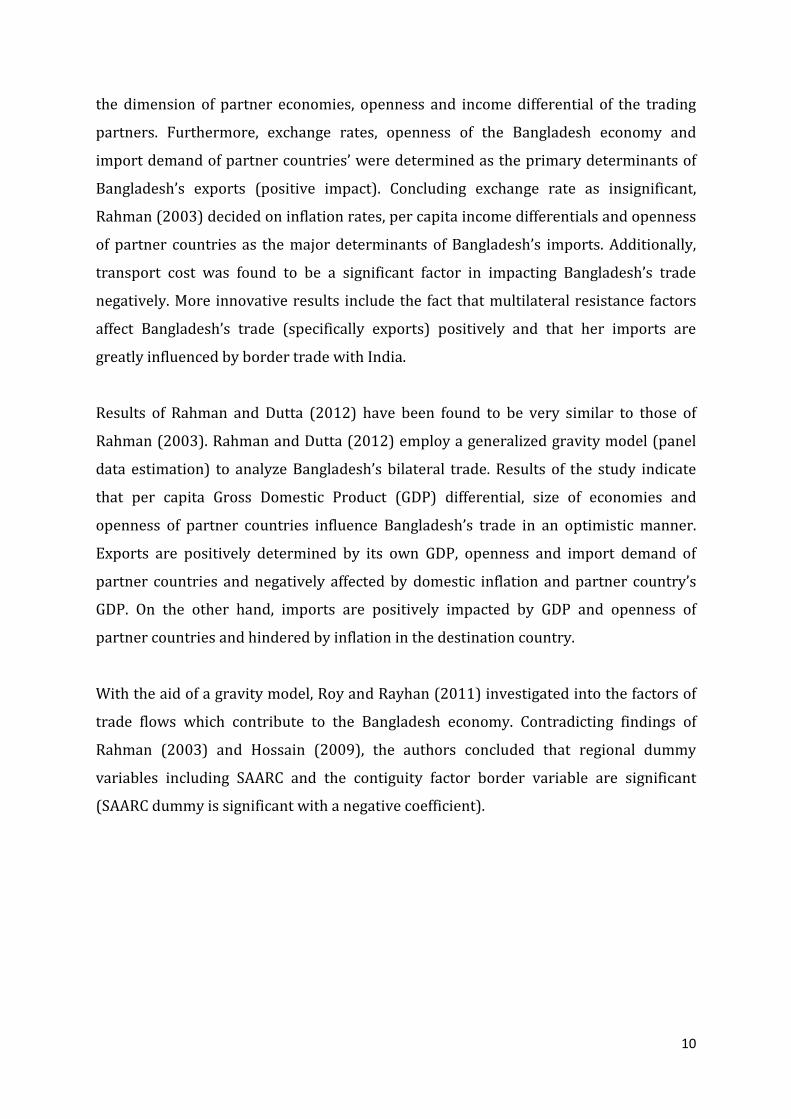
Bangladesh has been experiencing a rapid pace of global integration. In FY51991, trade-
GDP ratio in Bangladesh was equivalent to about 16.8 per cent of Bangladesh’s GDP but
by FY2013, this has increased to 49.9 per cent (Table 3.1). During the time, export
earnings increased by about 15.7 times. As a share of GDP, exports increased from 5.5
per cent in FY1991 to 21.0 per cent in FY2013. Indeed, export earnings increased at a
faster pace compared to her import payments. Exports as per cent of imports increased
from 49.5 per cent in FY1991 to 72.5 per cent in FY2013. The surge in export earnings
helped Bangladesh to emerge as a trade-led economy from an aid dependent one.
Table 3.1: Importance of Export in Bangladesh economy
Indicator FY1991 FY2001 FY2010 FY2011 FY2012 FY2013 Exports (billion USD) 1.7 6.5 16.2 22.9 24.3 27.0 Trade as % of GDP 16.8 33 39.8 50.5 51.5 49.9 Export as % of GDP 5.5 13.5 16.1 20.5 20.9 21.0 Export as % of Import 49.5 69.3 68.3 68.1 68.4 72.5 ODA as % of Exports 99.1 472.5 748.8 1290.0 1194.7 970.1 Sources: Estimated on the basis of Bangladesh Economic Review, various years.
The trends in export-related correlates signifies the importance of exports for
Bangladesh’s economy. Besides, the change of trade volume and trading pattern, the
trade structure has also undergone significant changes. Rahman et al. (2011) observed
5 Bangladesh’s fiscal year starts in July and ends in June.
12
that trade orientation did not take place at the same pace in most of the sectors. Over
these years, Ready Made Garments (RMG) has emerged as the single-most export
earning product of the country, replacing the traditional jute and jute products. A
number of other products (e.g., leather goods, footwear, pharmaceuticals, melamine,
battery, plastic goods etc.) have been added to Bangladesh’s export basket. However,
their contribution to total export earnings remains very insignificant. Indeed, a large
part of export rise over the past three decades was related to only one sector, – RMG
(World Bank, 1999). The share of RMG export was about 50 per cent of total in FY1991.
The share increased to about 80 per cent in FY2013.
Bangladesh’s export continues to suffer from lack of market diversification. World Bank
(1999) observed that a large part of the export rise in Bangladesh originated from
preferential market access in developed countries. The preferential market access to
Bangladesh came in the form of GSP facilities provided by developed and some
transitional countries outside the WTO mechanism. From this perspective, Bangladesh
needs to diversify her exports. GSP is a system whereby preferential treatment by way
of a reduced or duty-free tariff rate is granted by developed countries to eligible
products imported from the developing countries. This preferential treatment is
granted without any reciprocal obligation on the part of the developing countries. The
main purpose of the above tariff concession scheme is: (a) to increase the export
earnings of the preference receiving countries; (b) to promote their industrialisation;
and (c) to accelerate their role of economic growth. Under the GSP, Bangladeshi
products currently receive preferential market access from a number of tariff areas,
including Australia, Belarus, Bulgaria, Canada, the EU, Japan, New Zealand, Norway,
Switzerland, the Russian Federation, and the United States of America (USA)6. In recent
years, the combined share of the EU, the USA, and Canada in total export of Bangladesh
has been about 90 per cent.
The perspective plan of Bangladesh for the period 2010-2021 aimed a 5.8 times
increase in export earnings of Bangladesh between FY2009 and FY2021 (GED 2010).
The ongoing Sixth Five Year Plan in Bangladesh identifies a number of strategies
towards this end: i) product diversification through creating supply-side capacities for 6 The GSP facility offered by the US is put on hold at present.
13
new products which would enhance the export basket, ii) geographical diversification
by widening the range of destined markets for exports, iii) diversification beyond export
of goods, into services, by seeking opportunities to expand non-merchandise exports,
and iv) intermediate goods diversification (GED 2011).
To attain the stated goal, over the coming years, Bangladesh will certainly need to
enhance her supply-side capacities, promote trade facilitation and improve her
competitiveness. Concurrently, Bangladesh will also require to strategise in a manner
that enables her to realize the advantages originating from its participation in the WTO
and various bilateral and regional agreements. As an LDC, Bangladesh receives
preferential market access in most of the developed countries. WTO also has several
provisions for preferential treatment of goods and services originating from LDCs. In
view of the slow progress as regard realizing the DFQF agenda as per the DDR, countries
around the world are becoming keen towards participating in bilateral, regional and
plurilateral trade negotiations.
In the above context, product and market diversification in Bangladesh also call for full
utilisation of provisions of various regional arrangements. Bangladesh is a Member of
several regional trading arrangements: the South Asian Preferential Trading
Arrangement (SAPTA), which is being strengthened with the establishment of South
Asian Free Trade Area (SAFTA) in 2006 and the Asia Pacific Trade Agreement (APTA),
previously known as the Bangkok Agreement. Bangladesh also participates in the Bay of
Bengal Initiative for Multi Sectoral Technical and Economic Cooperation (BIMSTEC). A
sub-regional initiative called BCIM (Bangladesh, China, India and Myanmar) is now in
the process of negotiation among the mentioned Asian countries. Regrettably, thus far,
effectiveness of these RTAs cannot be considered encouraging.
A slow progress in effectively forging Regional Trade Agreements (RTAs) led the
member countries to be interested on signing more Bilateral Trade Agreements (BTAs)
with intra and extra regional member countries. For example, India has signed a
number of bilateral trade agreements with its neighbouring countries, such as Bhutan,
Nepal, and Sri Lanka. Again, Bangladesh has made very little progress towards forming
Bilateral Free Trade Agreement (BFTA) with her major trade partners. Under these
14
circumstances, Bangladesh is facing considerable preference erosion as result of higher
tariff barriers in the export destinations.
IV. Data and Methodology
Tariff Preference
To evaluate market access conditions of Bangladeshi exports, the paper utilises bilateral
trade data at the 6-digit level of the HS7 classification. Export of Bangladesh has been
employed against exporting partners (all importing partners has been considered,
although the number of importing partners would differ according to the product in
consideration). Products have been considered at the HS 6-digit level if total value of
export for that product exceeded USD 10,000 for that particular year8. The UN
COMTRADE database has been employed for bilateral trade data and UNCTAD TRAINS
for obtaining tariff data. Data for other indicators were gathered from World
Development Indicator (WDI), World Bank and UNCTADSTAT, UNCTAD. The current
study adopts similar methodology to that of Nicita and Rollo (2013) and Debaere and
Mostashari (2010).
Since the study predominantly examines changes in trade and trade policy, two points
in time, 2003 and 2013, have been considered. As mentioned before, trade values less
than USD 10,000 were ignored. The data has been categorised into three broad
categories9 namely, primary, intermediate and final products. The list of primary
merchandises include 576 HS 6-digit products, the intermediate list contains 2863 HS 6-
digit products and the final goods list contains 1782 products. The classification has
been done principally to categorise possible differential trends in the broad groups.
Analysis also follows from three different type of trade flows: new flows, surviving flows
and disappearing flows. Each type of flow10 indicates new products together with newly
accessed export destinations. New flow represents firsthand export flows in 2013, 7 2002 HS code classification has been employed. 8 This was done to avoid products which are exported at minimal levels. Inclusion of such products would entail biasedness as such products do not represent a significant proportion of total exports. 9 Primary, intermediate and final goods classification has been categorized according to the Broad Economic Categories (BEC) classification 10 Product-destination combination have been considered while calculating each of the flows.
15
which were non-existent in 2003. Alternatively, disappearing flow indicates export
flows which were present in 2003 but were missing in 2013. Surviving flow specifies
export flows which were present in 2003 and continued in 201311.
Market access conditions are captured by two variables - “the first variable captures
direct market access conditions (the tariff faced by exports), and the second variable
captures relative market access conditions (the tariff faced by an exporter relative to the
tariff faced by foreign competitors)” (Nicita and Rollo, 2013). While the first measure is
bilateral applied tariff, the relative market access condition is measured by RPM
(Hoekman and Nicita, 2011; and Fugazza and Nicita, 2013). RPM considers preferential
rates given to a particular country, although lower than MFN rates, and takes into
account that even such rates could penalise the exporting country given that other
competing countries couldbenefit from even lower preferential margins. The RPM is
calculated as “the difference, in tariff percentage points, that a given good faces when
exported from a given country relative to being exported from any other” (Nicita and
Rollo, 2013).
𝑅𝑃𝑀𝑔,𝑗𝑘 = ∑ 𝑡𝑣𝑔,𝑣𝑘𝜏𝑔,𝑣𝑘𝑣
∑ 𝑡𝑣𝑔,𝑣𝑘𝑣− 𝜏𝑔,𝑗𝑘 , 𝑣 ≠ 𝑗
where j denotes the exporter k denotes the importer g denotes the product (HS 6-digit) 𝜏 is bilateral tariff v denotes countries competing with country j in exporting to country k tv is export value
The measure of preferential margin could be positive, negative or equal depending on
the advantage or disadvantage that the exporting country faces (Bangladesh in this
case) as compared to other exporting nations. A negative preferential margin indicates
that Bangladesh faces tariffs which are higher than those of her competitors. On the
other hand, a positive preferential margin signifies preferential treatment (considering
11 However, surviving flows cannot confirm the continuity of the flows throughout the years. This analysis considers points in time and not trend over the years.

16
the MFN tariff rates) for Bangladesh. Preferential margin is zero when there is no
discrimination, implying identical tariffs across all trading partners.
Trade Cost
The trade cost analysis employs the gravity model with a focus on examining the impact
of trade cost for Bangladesh’s export. The raison d'être for the consideration of the
gravity model and which makes this model more attractive than other methodologies is
– the intuitive appeal of the model, the model fitting important stylized facts, real data
employment with ease to explain trade flows in relation to the policy factors and that
the model is estimated using OLS regression. With an aim to establish the intuitive
gravity model, Tinbergen (1962) and Pöyhönen (1963), the forerunners of the gravity
model, utilized the basic concept to explain the volume of bilateral trade flow between
countries. Recent times have witnessed gravity models incorporating variables beyond
the traditional measures such as regulatory and institutional policies together with
infrastructure characteristics. In this connection, Leamer and Levinsohn (1995) stated
that the gravity model has generated “some of the clearest and most robust findings in
empirical literature” of trade.
Trade (exports, imports or a combination of both) between two countries is determined
by their economic sizes (GDP and/or GNP) and is inversely related to the distance
between them. This forms the basis of the gravity model and would typically take the
following form:
Xij = CYiYj
tij�
where Xij = trade (exports and/or imports) from i to j C = constant YiYj = economic mass of the respective countries (GDP) tij = distance between i and j
An intuitive gravity model follows from the above-mentioned equation in a linear
outline (this is the basic form of a gravity model):
log Xij = C + β1logYi + β2logYj + β3logtij + εij
17
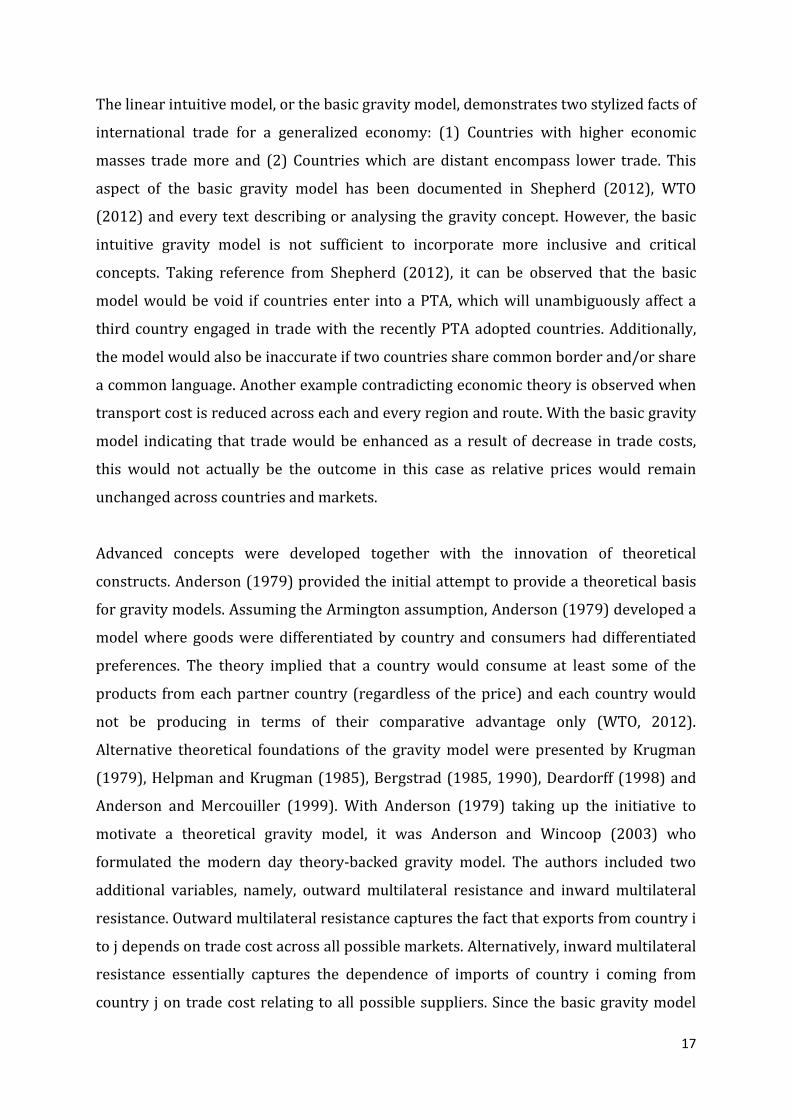
The linear intuitive model, or the basic gravity model, demonstrates two stylized facts of
international trade for a generalized economy: (1) Countries with higher economic
masses trade more and (2) Countries which are distant encompass lower trade. This
aspect of the basic gravity model has been documented in Shepherd (2012), WTO
(2012) and every text describing or analysing the gravity concept. However, the basic
intuitive gravity model is not sufficient to incorporate more inclusive and critical
concepts. Taking reference from Shepherd (2012), it can be observed that the basic
model would be void if countries enter into a PTA, which will unambiguously affect a
third country engaged in trade with the recently PTA adopted countries. Additionally,
the model would also be inaccurate if two countries share common border and/or share
a common language. Another example contradicting economic theory is observed when
transport cost is reduced across each and every region and route. With the basic gravity
model indicating that trade would be enhanced as a result of decrease in trade costs,
this would not actually be the outcome in this case as relative prices would remain
unchanged across countries and markets.
Advanced concepts were developed together with the innovation of theoretical
constructs. Anderson (1979) provided the initial attempt to provide a theoretical basis
for gravity models. Assuming the Armington assumption, Anderson (1979) developed a
model where goods were differentiated by country and consumers had differentiated
preferences. The theory implied that a country would consume at least some of the
products from each partner country (regardless of the price) and each country would
not be producing in terms of their comparative advantage only (WTO, 2012).
Alternative theoretical foundations of the gravity model were presented by Krugman
(1979), Helpman and Krugman (1985), Bergstrad (1985, 1990), Deardorff (1998) and
Anderson and Mercouiller (1999). With Anderson (1979) taking up the initiative to
motivate a theoretical gravity model, it was Anderson and Wincoop (2003) who
formulated the modern day theory-backed gravity model. The authors included two
additional variables, namely, outward multilateral resistance and inward multilateral
resistance. Outward multilateral resistance captures the fact that exports from country i
to j depends on trade cost across all possible markets. Alternatively, inward multilateral
resistance essentially captures the dependence of imports of country i coming from
country j on trade cost relating to all possible suppliers. Since the basic gravity model

18
does not incorporate these variables, there is effectively the problem of omitted variable
bias. Hence, this model is ought to have significant implications, even though the
resistance terms cannot be included in the model as data points. Together with the
model devised by Anderson and Wincoop (2003), other theoretically sound gravity
models would include Chaney (2008), Eaton and Kortum (2002) and Helpman et al.
(2008).
A typical Anderson and Wincoop (2003) model would take the following form:
logXij = logYi + logEj − logY + (1 − σ)[logτij − logωi − logPj]
ωi = �{τijPj
}1−σc
j=1
EjY
Y = � Yi
c
i=1
Pj = �{τijωi
}1−σc
i=1
YiY
logτijk = b1logdistanceij + b2contig + b3comlangoff + b4colony + b5comcol
where X is exports indexed over countries (i and j) Y is GDP E is expenditure (not necessarily similar to GDP on a sectoral basis) Y = ∑ Yic
i=1 σ is the intra-sectoral elasticity of substitution and τij is trade cost
The current paper, in an attempt to evaluate trade cost and its relatedness to the
Bangladesh economy, employs a range of gravity models. Firstly, the paper employs the
OLS estimation. OLS is a logical estimation to start with because OLS is econometric
equivalent to a hypothetical line of best fit incorporating an association between trade,
GDP, distance and other related variables. For OLS to be an consistent, unbiased and
efficient estimator, the error term would have to have a mean of zero and be
uncorrelated to the regressors (the orthogonality assumption), the error term would
have to be independently drawn from a normal distribution with a fixed variance (the
homoskedasticity assumption) and none of the explanatory variables should be a linear
combination of the other variables (the assumption of full rank) (Shepherd, 2012).
Hence, robust measures are incorporated in the following regressions to accommodate

19
any pattern of heteroskedasticity and orthogonality in the data. Together with other
standard measures, the OLS estimator is corrected for by using heteroskedasticity-
consistent (hc3) standard error estimator according to the Davidson and MacKinnon
(1993) methodology. Another measure, which is very common in the gravity literature,
is an adjustment which allows for the correlation of the error term within specific
groups to be defined by a specific variable. Moulton (1990) states that failure to account
for the clustering in data with multiple levels of aggregation can result in biased
understated standard errors. A typical variable to take up the role of the clustering
variable would be ‘distance’.
To ensure the robustness of the results obtained from OLS estimations, the Poisson
Pseudo12-Maximum Likelihood Estimator (PPML) have been estimated13. The PPML
estimator has been used for gravity analysis because, apart from providing consistent
estimates of the nonlinear model, the PPML is also consistent in the presence of fixed
effects and the model automatically include observations for which the observed trade
value is nil (which are dropped in OLS estimations). The latter is one of the striking and
important features of this model because it is the case that not all partners would trade
all products with all their counterparts (Haveman and Hummels, 2004).
12 It is not necessary that the data be distributed as Poisson. 13 The existence of multiplicative error term in a non-linear gravity model can be accounted through the Poisson Pseudo-Maximum Likelihood Estimator (Silva and Tenreyro, 2006).

20
The augmented gravity model for export that would be employed for the current
analysis is as follows14:
ln_EXij = α+ β1 ln_GDPj+ β2 ln_TCij + β3 ln_dist + β4 infra + β5 contig + β6 gsp + β7 rta_pta +
εij
where i and j are country of origin and destination respectively ln_IMij represents log of import of country i from country j (at current USD) ln_GDPj represents log of GDP of the partner countries (at current USD) TCij is ad-valorem trade cost between country i and j (ESCAP-World Bank Trade Cost Database)15 ln_dist represents the log of distance between country i and j infra represents infrastructure quality of the partner countries contig is a dummy variable equal to unity for countries which share a common border rta_pta is a dummy variable equal to unity if the country pairs share bilateral or regional trade agreements gsp is a dummy variable equal to unity if the importing country offers GSP (Generalised System of Preference) to the exporting nation (Bangladesh in this case)
ln_EXij represents the aggregate exports of Bangladesh at current prices. Although the
basic gravity model states that both the reporting and partner country’s GDP is likely to
influence bilateral trade, but it is the case that only Bangladesh’s partner (all the
exporters when Bangladesh is importing and all the importers when Bangladesh is
exporting) countries’ GDP have been taken into account at the current juncture. This is
because the current study specifically wants to concentrate on Bangladesh’s exporting
partners and their characteristics, and not vice versa. In this respect, Bangladesh’s GDP
can be considered to be constant throughout the sample period.
14 Other variables were also considered to be included as regressors to the gravity models - these would include remoteness, Global Competitiveness Index (GCI) index, weighted applied tariff and dummies for landlocked countries, countries sharing a common colonial background and for Asian countries. However, for the reason of better fit of the model, correcting for the problem of autocorrelation and multicollinearity and presenting an overall rationale, the variables have been excluded from the present regressions. Additionally, disaggregated measures of infrastructure variables (road density, rail density, passengers carried by air, air freight, electric power consumption, internet users, container port traffic, mobile cellular subscription and landline usage) were also considered. However, this leaves scope for taking up a more detailed research at a future date.
15 Methodology and data of Duval and Uthoktham (2012) has been followed
21
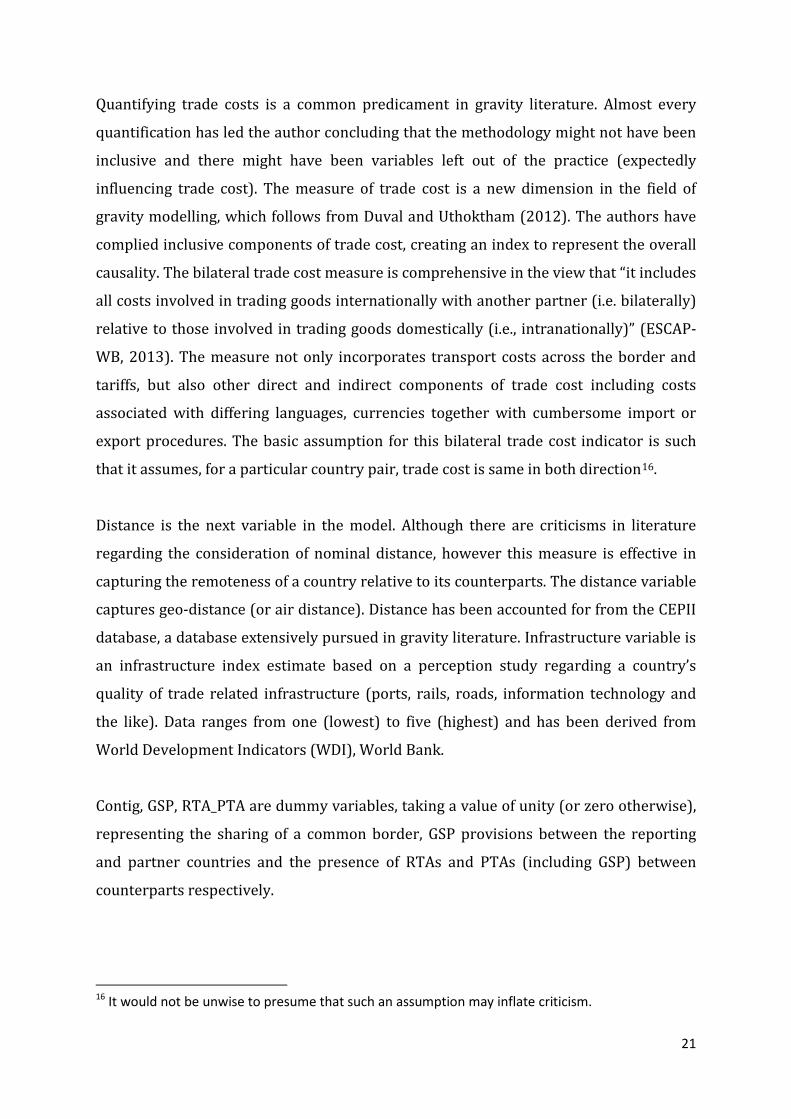
Quantifying trade costs is a common predicament in gravity literature. Almost every
quantification has led the author concluding that the methodology might not have been
inclusive and there might have been variables left out of the practice (expectedly
influencing trade cost). The measure of trade cost is a new dimension in the field of
gravity modelling, which follows from Duval and Uthoktham (2012). The authors have
complied inclusive components of trade cost, creating an index to represent the overall
causality. The bilateral trade cost measure is comprehensive in the view that “it includes
all costs involved in trading goods internationally with another partner (i.e. bilaterally)
relative to those involved in trading goods domestically (i.e., intranationally)” (ESCAP-
WB, 2013). The measure not only incorporates transport costs across the border and
tariffs, but also other direct and indirect components of trade cost including costs
associated with differing languages, currencies together with cumbersome import or
export procedures. The basic assumption for this bilateral trade cost indicator is such
that it assumes, for a particular country pair, trade cost is same in both direction16.
Distance is the next variable in the model. Although there are criticisms in literature
regarding the consideration of nominal distance, however this measure is effective in
capturing the remoteness of a country relative to its counterparts. The distance variable
captures geo-distance (or air distance). Distance has been accounted for from the CEPII
database, a database extensively pursued in gravity literature. Infrastructure variable is
an infrastructure index estimate based on a perception study regarding a country’s
quality of trade related infrastructure (ports, rails, roads, information technology and
the like). Data ranges from one (lowest) to five (highest) and has been derived from
World Development Indicators (WDI), World Bank.
Contig, GSP, RTA_PTA are dummy variables, taking a value of unity (or zero otherwise),
representing the sharing of a common border, GSP provisions between the reporting
and partner countries and the presence of RTAs and PTAs (including GSP) between
counterparts respectively.
16 It would not be unwise to presume that such an assumption may inflate criticism.
22
The current analysis takes the route of a cross-sectional analysis for the Bangladesh
economy. A light form of gravity database is used for the purpose of the analysis. All the
feasible indicators17 were averaged over a period of 2003 and 2007 to transform the
database to a cross-sectional panel from an unbalanced one. The data has been
deliberately kept at this juncture because this period is an apt point in time to capture
trade cost and its implications on Bangladesh trade. This is so because the period marks
a decade of the implementation of trade related policy changes (in terms of opening up
of the economy) of Bangladesh and also because data from 2008 onwards would be
intermingled with the effects and after-effects of the global financial crisis. Data are
included in the regressional estimates for only the partners with whom Bangladesh has
trading statistics (even for a single year over the study timeframe). This procedure
effectively includes the effectual traders of Bangladesh economy and restricts the zero
trade problem at a minimum level. This course of action may also partially account for
the vastly known multilateral resistance term setback.
V. Empirical Results
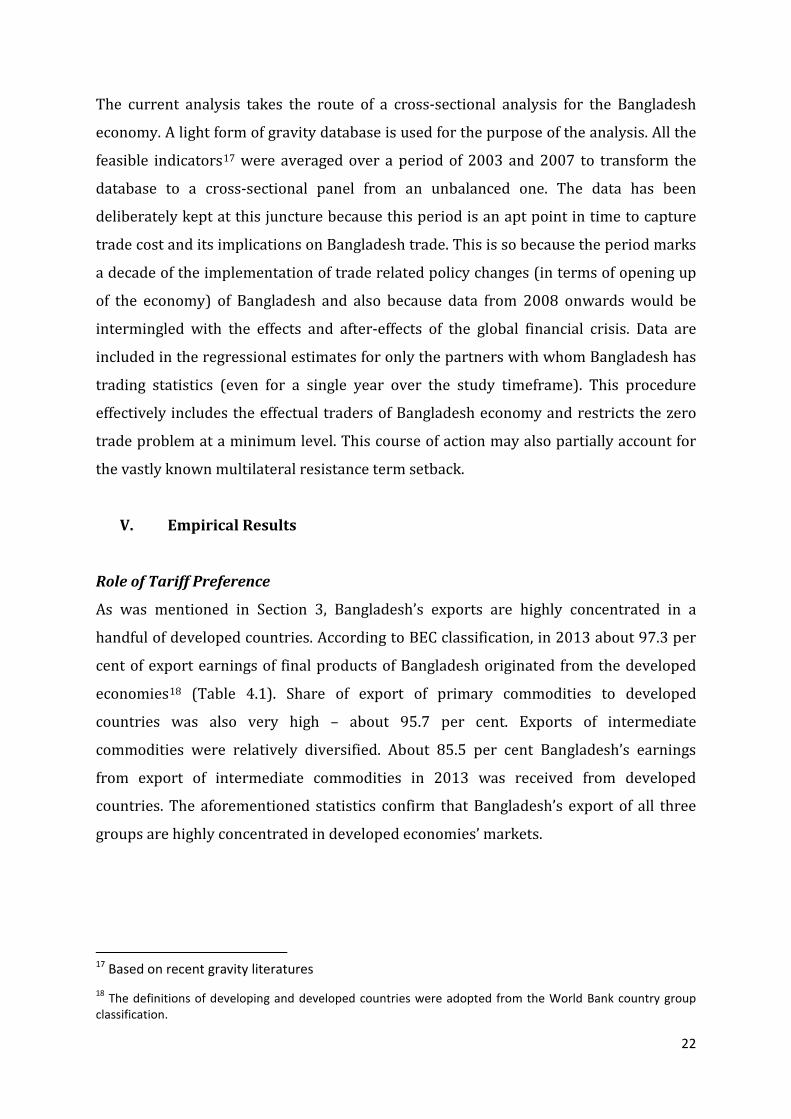
Role of Tariff Preference
As was mentioned in Section 3, Bangladesh’s exports are highly concentrated in a
handful of developed countries. According to BEC classification, in 2013 about 97.3 per
cent of export earnings of final products of Bangladesh originated from the developed
economies18 (Table 4.1). Share of export of primary commodities to developed
countries was also very high – about 95.7 per cent. Exports of intermediate
commodities were relatively diversified. About 85.5 per cent Bangladesh’s earnings
from export of intermediate commodities in 2013 was received from developed
countries. The aforementioned statistics confirm that Bangladesh’s export of all three
groups are highly concentrated in developed economies’ markets.
17 Based on recent gravity literatures 18 The definitions of developing and developed countries were adopted from the World Bank country group classification.
23
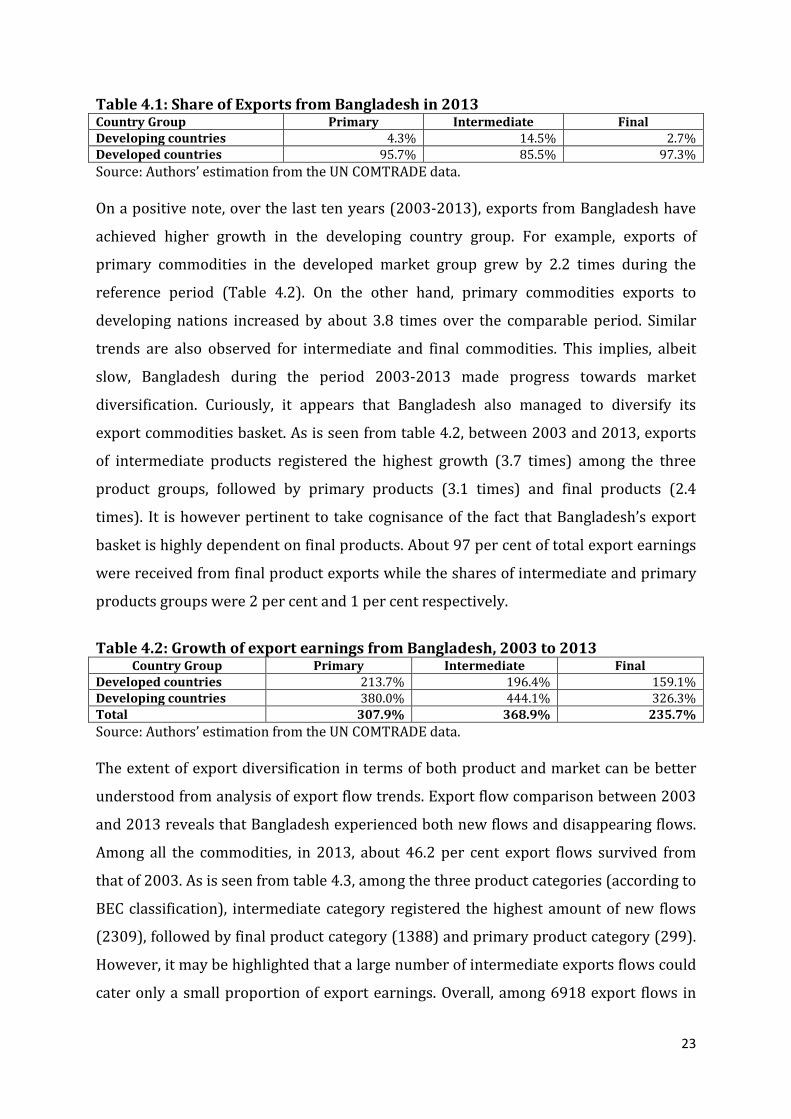
Table 4.1: Share of Exports from Bangladesh in 2013 Country Group Primary Intermediate Final Developing countries 4.3% 14.5% 2.7% Developed countries 95.7% 85.5% 97.3% Source: Authors’ estimation from the UN COMTRADE data. On a positive note, over the last ten years (2003-2013), exports from Bangladesh have
achieved higher growth in the developing country group. For example, exports of
primary commodities in the developed market group grew by 2.2 times during the
reference period (Table 4.2). On the other hand, primary commodities exports to
developing nations increased by about 3.8 times over the comparable period. Similar
trends are also observed for intermediate and final commodities. This implies, albeit
slow, Bangladesh during the period 2003-2013 made progress towards market
diversification. Curiously, it appears that Bangladesh also managed to diversify its
export commodities basket. As is seen from table 4.2, between 2003 and 2013, exports
of intermediate products registered the highest growth (3.7 times) among the three
product groups, followed by primary products (3.1 times) and final products (2.4
times). It is however pertinent to take cognisance of the fact that Bangladesh’s export
basket is highly dependent on final products. About 97 per cent of total export earnings
were received from final product exports while the shares of intermediate and primary
products groups were 2 per cent and 1 per cent respectively.
Table 4.2: Growth of export earnings from Bangladesh, 2003 to 2013
Country Group Primary Intermediate Final Developed countries 213.7% 196.4% 159.1% Developing countries 380.0% 444.1% 326.3% Total 307.9% 368.9% 235.7% Source: Authors’ estimation from the UN COMTRADE data. The extent of export diversification in terms of both product and market can be better
understood from analysis of export flow trends. Export flow comparison between 2003
and 2013 reveals that Bangladesh experienced both new flows and disappearing flows.
Among all the commodities, in 2013, about 46.2 per cent export flows survived from
that of 2003. As is seen from table 4.3, among the three product categories (according to
BEC classification), intermediate category registered the highest amount of new flows
(2309), followed by final product category (1388) and primary product category (299).
However, it may be highlighted that a large number of intermediate exports flows could
cater only a small proportion of export earnings. Overall, among 6918 export flows in
24
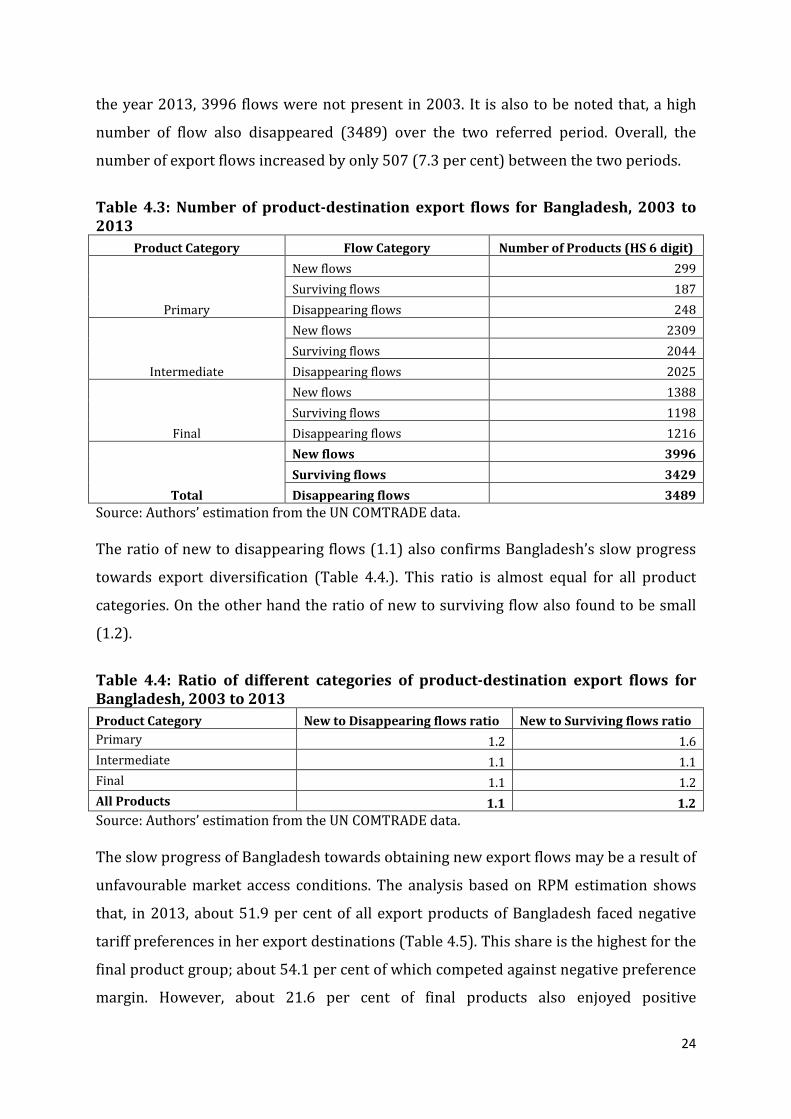
the year 2013, 3996 flows were not present in 2003. It is also to be noted that, a high
number of flow also disappeared (3489) over the two referred period. Overall, the
number of export flows increased by only 507 (7.3 per cent) between the two periods.
Table 4.3: Number of product-destination export flows for Bangladesh, 2003 to 2013
Product Category Flow Category Number of Products (HS 6 digit)
Primary
New flows 299 Surviving flows 187 Disappearing flows 248
Intermediate
New flows 2309 Surviving flows 2044 Disappearing flows 2025
Final
New flows 1388 Surviving flows 1198 Disappearing flows 1216
Total
New flows 3996 Surviving flows 3429 Disappearing flows 3489
Source: Authors’ estimation from the UN COMTRADE data. The ratio of new to disappearing flows (1.1) also confirms Bangladesh’s slow progress
towards export diversification (Table 4.4.). This ratio is almost equal for all product
categories. On the other hand the ratio of new to surviving flow also found to be small
(1.2).
Table 4.4: Ratio of different categories of product-destination export flows for Bangladesh, 2003 to 2013 Product Category New to Disappearing flows ratio New to Surviving flows ratio Primary 1.2 1.6 Intermediate 1.1 1.1 Final 1.1 1.2 All Products 1.1 1.2 Source: Authors’ estimation from the UN COMTRADE data. The slow progress of Bangladesh towards obtaining new export flows may be a result of
unfavourable market access conditions. The analysis based on RPM estimation shows
that, in 2013, about 51.9 per cent of all export products of Bangladesh faced negative
tariff preferences in her export destinations (Table 4.5). This share is the highest for the
final product group; about 54.1 per cent of which competed against negative preference
margin. However, about 21.6 per cent of final products also enjoyed positive

25
preferences. Share of products which faced negative tariff preference margin was low
for primary product group (17.9 per cent). Indeed, about 71.6 per cent of the primary
export products from Bangladesh received equal preferences. Intermediate product
exports enjoyed the highest share of positive preferences, although the number was
limited to only 26.9 per cent.
Table 4.5: State of tariff preference faced by the Bangladesh’s exports according to RPM (All Products) Primary Intermediate Final Total Negative 12 40 1738 1790 Equal 48 82 779 909 Positive 7 45 695 747 Total 67 167 3212 3446
Share of total (%) Negative 17.9 24.0 54.1 51.9 Equal 71.6 49.1 24.3 26.4 Positive 10.4 26.9 21.6 21.7 Source: Authors’ estimation from the UN COMTRADE data. RMG is the single largest export commodity for Bangladesh. All RMG products belong to
the final commodity group. It can be seen from Table 4.6 that, about 55.5 per cent of
RMG commodities faced negative tariff preferences in 2013. Thus, although the
products under RMG category cater to the bulk of the exports earnings, their destination
is limited to certain tariff areas only.
Table 4.6: State of tariff preference faced by the Bangladesh’s exports according to RPM (RMG) RPM Status Primary Intermediate Final Total Negative 0 0 1537 1537 Equal 0 0 658 658 Positive 0 0 575 575 Total 0 0 2770 2770
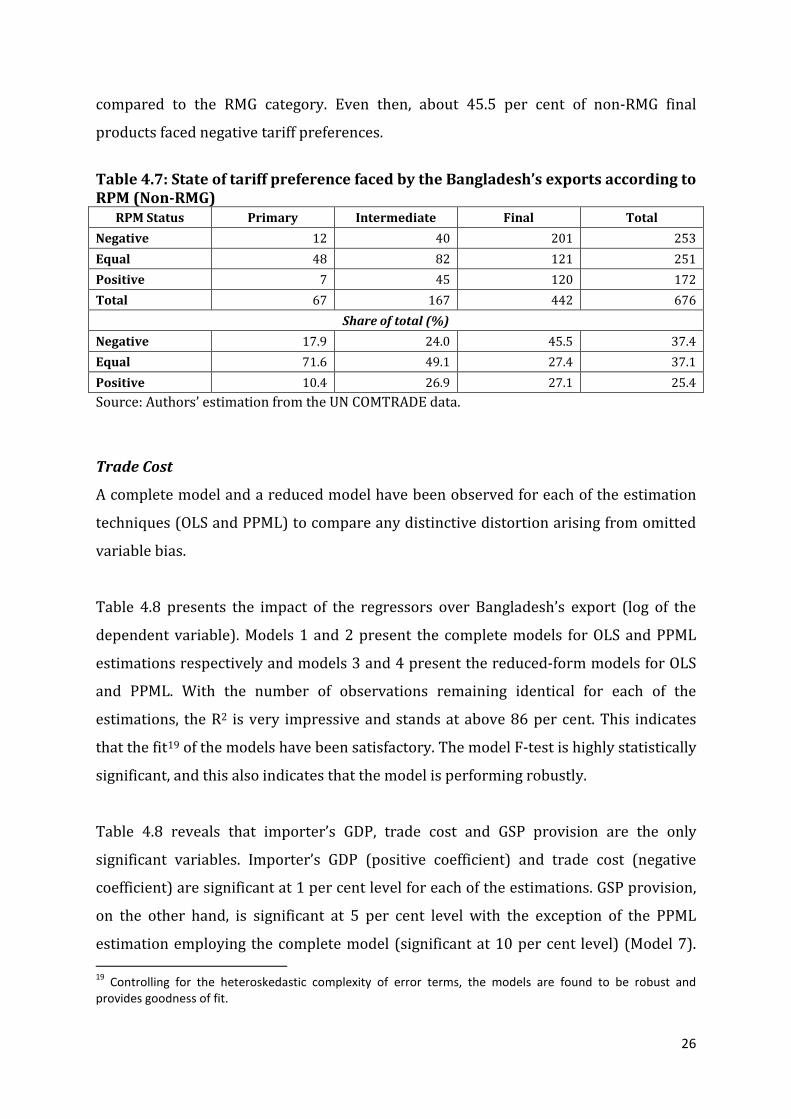
Share of total (%) Negative N/A N/A 55.5 55.5 Equal N/A N/A 23.8 23.8 Positive N/A N/A 20.8 20.8 Source: Authors’ estimation from the UN COMTRADE data. As all the primary and intermediate products fall under the non-RMG category, the state
of tariff preference countered non-RMG export products was relatively better in 2013
26
compared to the RMG category. Even then, about 45.5 per cent of non-RMG final
products faced negative tariff preferences.
Table 4.7: State of tariff preference faced by the Bangladesh’s exports according to RPM (Non-RMG)
RPM Status Primary Intermediate Final Total Negative 12 40 201 253 Equal 48 82 121 251 Positive 7 45 120 172 Total 67 167 442 676
Share of total (%) Negative 17.9 24.0 45.5 37.4 Equal 71.6 49.1 27.4 37.1 Positive 10.4 26.9 27.1 25.4 Source: Authors’ estimation from the UN COMTRADE data.
Trade Cost
A complete model and a reduced model have been observed for each of the estimation
techniques (OLS and PPML) to compare any distinctive distortion arising from omitted
variable bias.
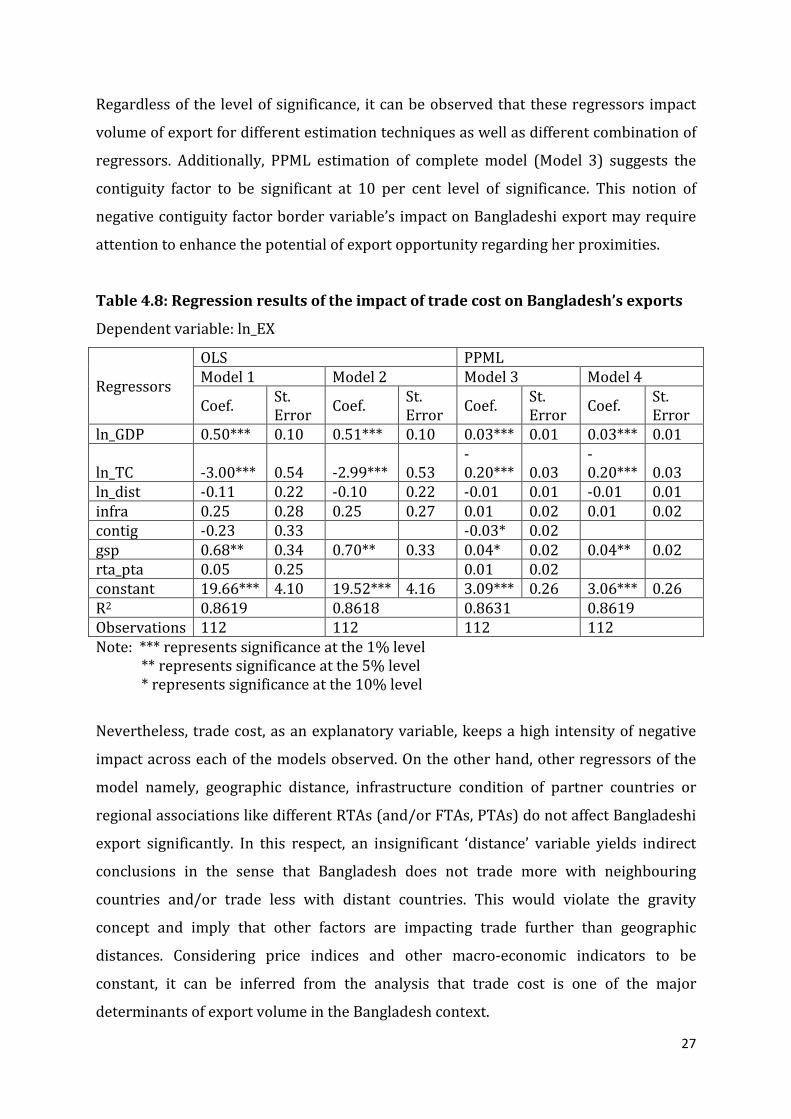
Table 4.8 presents the impact of the regressors over Bangladesh’s export (log of the
dependent variable). Models 1 and 2 present the complete models for OLS and PPML
estimations respectively and models 3 and 4 present the reduced-form models for OLS
and PPML. With the number of observations remaining identical for each of the
estimations, the R2 is very impressive and stands at above 86 per cent. This indicates
that the fit19 of the models have been satisfactory. The model F-test is highly statistically
significant, and this also indicates that the model is performing robustly.
Table 4.8 reveals that importer’s GDP, trade cost and GSP provision are the only
significant variables. Importer’s GDP (positive coefficient) and trade cost (negative
coefficient) are significant at 1 per cent level for each of the estimations. GSP provision,
on the other hand, is significant at 5 per cent level with the exception of the PPML
estimation employing the complete model (significant at 10 per cent level) (Model 7). 19 Controlling for the heteroskedastic complexity of error terms, the models are found to be robust and provides goodness of fit.
27
Regardless of the level of significance, it can be observed that these regressors impact
volume of export for different estimation techniques as well as different combination of
regressors. Additionally, PPML estimation of complete model (Model 3) suggests the
contiguity factor to be significant at 10 per cent level of significance. This notion of
negative contiguity factor border variable’s impact on Bangladeshi export may require
attention to enhance the potential of export opportunity regarding her proximities.
Table 4.8: Regression results of the impact of trade cost on Bangladesh’s exports
Dependent variable: ln_EX
Regressors
OLS PPML Model 1 Model 2 Model 3 Model 4
Coef. St. Error Coef. St.
Error Coef. St. Error Coef. St.
Error ln_GDP 0.50*** 0.10 0.51*** 0.10 0.03*** 0.01 0.03*** 0.01
ln_TC -3.00*** 0.54 -2.99*** 0.53 -0.20*** 0.03
-0.20*** 0.03
ln_dist -0.11 0.22 -0.10 0.22 -0.01 0.01 -0.01 0.01 infra 0.25 0.28 0.25 0.27 0.01 0.02 0.01 0.02 contig -0.23 0.33 -0.03* 0.02 gsp 0.68** 0.34 0.70** 0.33 0.04* 0.02 0.04** 0.02 rta_pta 0.05 0.25 0.01 0.02 constant 19.66*** 4.10 19.52*** 4.16 3.09*** 0.26 3.06*** 0.26 R2 0.8619 0.8618 0.8631 0.8619 Observations 112 112 112 112 Note: *** represents significance at the 1% level ** represents significance at the 5% level * represents significance at the 10% level
Nevertheless, trade cost, as an explanatory variable, keeps a high intensity of negative
impact across each of the models observed. On the other hand, other regressors of the
model namely, geographic distance, infrastructure condition of partner countries or
regional associations like different RTAs (and/or FTAs, PTAs) do not affect Bangladeshi
export significantly. In this respect, an insignificant ‘distance’ variable yields indirect
conclusions in the sense that Bangladesh does not trade more with neighbouring
countries and/or trade less with distant countries. This would violate the gravity
concept and imply that other factors are impacting trade further than geographic
distances. Considering price indices and other macro-economic indicators to be
constant, it can be inferred from the analysis that trade cost is one of the major
determinants of export volume in the Bangladesh context.
28
VI. Conclusion and Recommendation
The present paper makes an attempt to assess how market access in terms of tariff
preferences in the export destinations influenced the performance of Bangladesh as
regards export diversification between 2003 and 2013. The paper highlights a number
of key findings. First, although export of Bangladesh is highly concentrated in terms of
both product basket and markets, she made slow progress towards export
diversification. Second, the attained progress was possible due to the fact that
Bangladesh registered a higher exports growth in the non-traditional markets
(developing markets). Growth of non-traditional products (primary and intermediate)
was also higher compared to the traditional products. Third, the number of export flows
between 2003 and 2013 increased only by an insignificant margin (7.3 per cent).
Fourth, most of the Bangladesh’s exports faced negative tariff preferences at the export
destinations. Finally, the negative tariff preferences faced by Bangladesh are much
higher for the products which she has a higher competitive advantage (RMG).
The above findings indicates that tariff preferences still can play a strong role as regards
export performance of a LDC like Bangladesh which is constrained by her relatively
weaker capacity as regards export diversification. Characterised by low per capita
income, lack of basic necessities and amenities, weak infrastructural arrangements
predominantly involving energy issues and connectivity and fragile institutional and
legal arrangements, Bangladesh would have to diversify their exportability in order to
move towards a higher growth trajectory which can also offer gainful employment to
her large population. To attain the goals of fostering a diversified export sector it is
perhaps pertinent to take the needed measures which can enhance her export
competitiveness and strengthen her supply-side capacities. However, it is also to be
recognised, as can be found from the analysis of this paper, slow progress of global
trade negotiation at the WTO is also keeping a country like Bangladesh at bay. It is thus
important to ensure an early harvest of promised DFQF market access in the developed
countries in a meaningful way.
29
Moving to the second episode of the paper, where it was analysed whether trade cost
affected Bangladesh’s exports by utilising the WB-ESCAP estimates, it was found that
trade cost, including a number of components including tariff, transport cost, cultural
components and trade facilitation issues, influence Bangladesh’s exports together with
positive correlation with the economic condition of partner countries, measured by GDP
and GSP facilities. Curiously, RTAs and PTAs do not influence Bangladesh’s export.
Such findings of the study bring forward a number of central policy recommendations
for Bangladesh. First, it is learned from the study that higher trade cost leads to lower
trade volume for Bangladesh. In the context of Bangladesh, it is often the case that
difficulties in the implementation of policies arise from their non-binding nature, lack of
coordination and interlinkage of policies, inability to employ trade policies for the
betterment of domestic-market oriented and import-substituting industries and the
lack of initiative towards strengthening of trade promoting and trade diplomacy
associated institutional bodies (Moazzem et al., 2011). In this backdrop, a rethinking of
the trade-related policies of Bangladesh is essential, to benefit from the changing
scenario of both the domestic and global grounds. To ensure maximum possible welfare
for the country, trade policies of Bangladesh should immediately reflect her priorities
and developmental needs. Second, the RTAs and/or PTAs with which Bangladesh are
associated are largely ineffective, at least until 2007. The major limitation lies in the
quiescent SAARC Preferential Trade Arrangement (SAPTA), SAFTA and SAARC
negotiations. Bangladesh should try to influence its partners in these RTAs and/or PTAs
to make these platforms more trade-friendly.
In conclusion, progression towards the reduction of trade costs would lead towards
diversification of her exports together with the accessibility of diverse markets. At the
same time the emerging economies should also consider a faster market for exports
from LDCs like Bangladesh. Although the nation has come a long way from resolving
numerous bottlenecks of trade cost including the key factor of non-transparency in
customs procedures20, however, Bangladesh should take the road towards enhanced
20 Complex nature of customs documentation, requirement of longer spans of time in releasing and clearing goods from ports and corrupt customs personnel have been documented as major hurdles for carrying out trade in Bangladesh (Bhattacharya and Hossain, 2006).
30
human and financial resources, better infrastructure facilities and apposite political
support from the part of the politicians. For a low-income developing country21 like
Bangladesh, it is hence recommended that she balance the cost and benefit aptitude of
trade facilitation and act in view of that. Hence, the need of the day is the integration of
inclusive and effective trade-related policies.
21 Bangladesh is categorised as a Least Developed Country (LDC).
31
References Ali, R., Alwang, J. and Siegel, P. B. (1991). Is export Diversification the best way to achieve export growth and Stability? A look at three African Countries. World Bank Working Papers No. 729. World Bank Working Paper Series. Anderson, J. (1979). A Theoretical Foundation for the Gravity Model. American Economic Review, 69 (1), 106-116. Anderson, J. E., and Marcouiller, D. (1999). Trade, location and security: An empirical investigation. NBER working Paper No 7000. Anderson, J. E., and Wincoop, E. V. (2003). Gravity with Gravitas: A Solution to the Border Puzzle. American Economic Review , 93 (1), 170-192. Arvis, J-F., Duval, Y., Shepherd, B., and Utoktham, C. (2013). Trade Costs in the Developing World. 1995-2010. World Bank Policy Research Working Paper 1309. The World Bank Poverty Reduction and Economic Management Network. Besedes, T. and Prusa, T. (2006). Ins, outs, and the duration of trade. Canadian Journal of Economics, 39, 266–295. Bergstrand, J. H. (1985). The gravity equation in international trade: Some microeconomic foundations and empirical evidence. Review of Economics and Statistics, 67 (3), 474–481. Bergstrand, J. H. (1990). The Heckscher-Ohlin-Samuelson model, the Linder hypothesis, and the determinants of bilateral intra-industry trade. Economic Journal, 100 (4), 1216–1229. Chaney, T. (2008). Distorted Gravity: The Intensive and Extensive Margins of International Trade. American Economic Review, 98 (4), 1707-1721. Davidson, R., & MacKinnon, J. G. (1993). Estimation and Inference in Econometrics. New York: Oxford University Press. Deardoff, A. (1998). Determinants of bilateral trade: Does gravity work in a neoclassical world? In: J. A. Frankel (Ed.), The regionalization of the world economy. Chicago: University of Chicago Press. Debaere, P. and Mostashari, S. (2010). Do tariffs matter for the extensive margin of international trade? An empirical analysis. Journal of International Economics, 81, 163–169. Duval, Y. and Utoktham, C. (2012). Trade Costs in Asia and the Pacific: Improved and Sectoral Estimates. Trade and Investment Division, ESCAP Staff Working Paper 05/11. UNESCAP.
32
Eaton, J. and Kortum, S. (2002). Technology, Geography, and Trade. Econometrica, 70 (5), 1741-1779. Edo, P. J. M. and Heal, A. (2013). Duty-Free, Quota-Free Trade for Asia-Pacific Least Developed Countries: Overview and Update. Asia-Pacific Research and Training Network on Trade (ARTNeT)) Policy Brief no. 36. Bangkok: UNESCAP. ESCAP-WB. (2013). ESCAP-WB Trade Cost Database: Explanatory Note for Users. Retrieved 10 15, 2013, from ESCAP: http://www.unescap.org/tid/artnet/db/usernote-2013.pdf Engel, J. (2009). Assessing the Chinese and Indian LDC Preference Schemes – Initial Observations. Working draft. Retrieved from http://www.tulane.edu/~dnelson/PEBricsConf/Engel-BRICs%20Prefs.pdf Fugazza, M. and Nicita, A. (2013). The direct and relative effects of preferential market access. Journal of International Economics, 89, 357-368. GED. (2010). Outline Perspective Plan of Bangladesh 2010-202: Making Vision 2021 A Reality. Dhaka: Planning Commission, Ministry of Planning, Government of Bangladesh (GoB). GED. (2011). Sixth Five Year Plan FY2011-FY2015: Accelerating Growth and Reducing Poverty (Part 1). Dhaka: Planning Commission, Ministry of Planning, Government of Bangladesh (GoB). Haveman, J. and Hummels, D. (2004). Alternative Hypotheses and the Volume of Trade: The Gravity Equation and the Extent of Specialization. Canadian Journal of Economics, 37 (1), 199-218. Helpman, E. and Krugman, P. (1985). Market structure and foreign trade. Cambridge: MIT Press. Helpman, E., Melitz, M. and Rubinstein, Y. (2008). Estimating Trade Flows: Trading Partners and Trading Volumes. Quarterly Journal of Economics, 103 (2), 441-487. Hoekman, B. and Nicita, A. (2011). Trade Policy, Trade Costs, and Developing Country Trade. World Development, 39, 2069–2079. Hossain, S. M. (2009). South Asian Free Trade Area: Implications for Bangladesh. MPRA Paper No. 18517. Krugman, P. (1979). Scale economies, product differentiation, and the pattern of trade. American Economic Review, 70 (5), 950-9. Leamer, E. and Levinsohn, J. (1995). International Trade Theory: The Evidence. In G. Grossman and K. Rogoff (eds.), Handbook of International Economics. Amsterdam: Elsevier.

33
Moazzem, K. G., Ahmed, N., Manzur, S. N. and Chowdhury, M. I. (2011). Framework for the Proposed Comprehensive Trade Policy 2012-2017. Dhaka: Centre for Policy Dialogue (CPD). Moulton, B. (1990). An Illustration of the Pitfall in Estimating the Effects of Aggregate Variables on Micro Units. Review of Economics and Statistics, 72 (2), 334-338. Novy, D. (2011). Gravity Redux: Measuring International Trade Costs with Panel Data. Nicita, A. and Rollo, V. (2013). Tariff Preferences as a Determinant for Exporters from Sub-Saharan Africa. Policy Issues in International Trade and Commodities Study Series No. 60. New York and Geneva: United Nations Conference on Trade and Development (UNCTAD). Pöyhönen, P. (1963). A tentative model for the volume of trade between countries. Weltwirtschaftliches Archiv 90, 93-100. Presbish, R. (1950). The Economic Development of Latin America and its Principal problems. New York: United Nations. Rahman, M. M. (2003). A Panel Data Analysis of Bangladesh’s Trade: The Gravity Model Approach. Retrieved 07 16, 2013, from http://www.etsg.org/ETSG2003/papers/rahman.pdf. Rahman, M.M. (2009). The Determinants of Bangladesh's Imports: A Gravity Model Analysis under Panel Data. Indian Journal of Economics, 357. Rahman, M. M. and Dutta, D. (2012). The Gravity Model Analysis of Bangladesh's Trade: A Panel Data Approach. Journal of Asia-Pacific Business , 13 (3). Rahman, M. (2014). What does the Bali package mean for the LDCs? WTO Bridges Africa. Volume 3, Number 3. International Centre for Trade and Sustainable Development (ICTSD). Rahman, M., Moazzem, K. G., Hossain, S. S., Iqbal, M. A. and Rahman, M. T. (2011). Bangladesh Labour and Social Trends Report 2010. Dhaka: Centre for Policy Dialogue (CPD) and International Labour Organization (ILO). Ricardo, D. (1817). Principles of Political Economy and Taxation. New York: Penguin. Roy, M. and Rayhan, M. I. (2011). Trade Flows of Bangladesh: A Gravity Model Approach. Economics Bulletin , 31 (1), 950-959. Samen, S. (2010). A primer on Export Diversification: Key Concepts, Theoretical Underpinnings and Empirical Evidence. Growth and Crisis Unit. World Bank Institute. Shepherd, B. (2012). The Gravity Model of International Trade: A User Guide. Bangkok: UNESCAP.

34
Silva, J. S. and Tenreyro, S. (2006). The Log of Gravity. Review of Economics and Statistics, 88 (4), 641-658. Singer, H.W. (1950). The distribution of Trade between Investing and Borrowing Countries. American Economic Review, 40, 531-548. Smith, A. (1776). The Wealth of Nations. London: Methuen. Tinbergen, J. (1962). Shaping the World Economy: Suggestions for an International Economic Policy. New York: The Twentieth Century Fund. UNCTAD. (2014). UNCTADSTAT. United Nations Conference on Trade and Development. Data Centre. Retrieved from http://unctadstat.unctad.org/wds/ReportFolders/reportFolders.aspx?sCS_ChosenLang=en World Bank. (1999). Bangladesh Trade Liberalization: Its Pace and Impacts. Report No. 19591- BD. Poverty Reduction and Economic Management Unit, South Asia Region. Retrieved from http://siteresources.worldbank.org/INTSARREGTOPINTECOTRA/34004324-1120490724746/20926224/TradeLiberalizationItsPaceandImpacts.pdf
WTO. (2012). A Practical Guide to Trade Policy Analysis. World Trade Organisation.
35
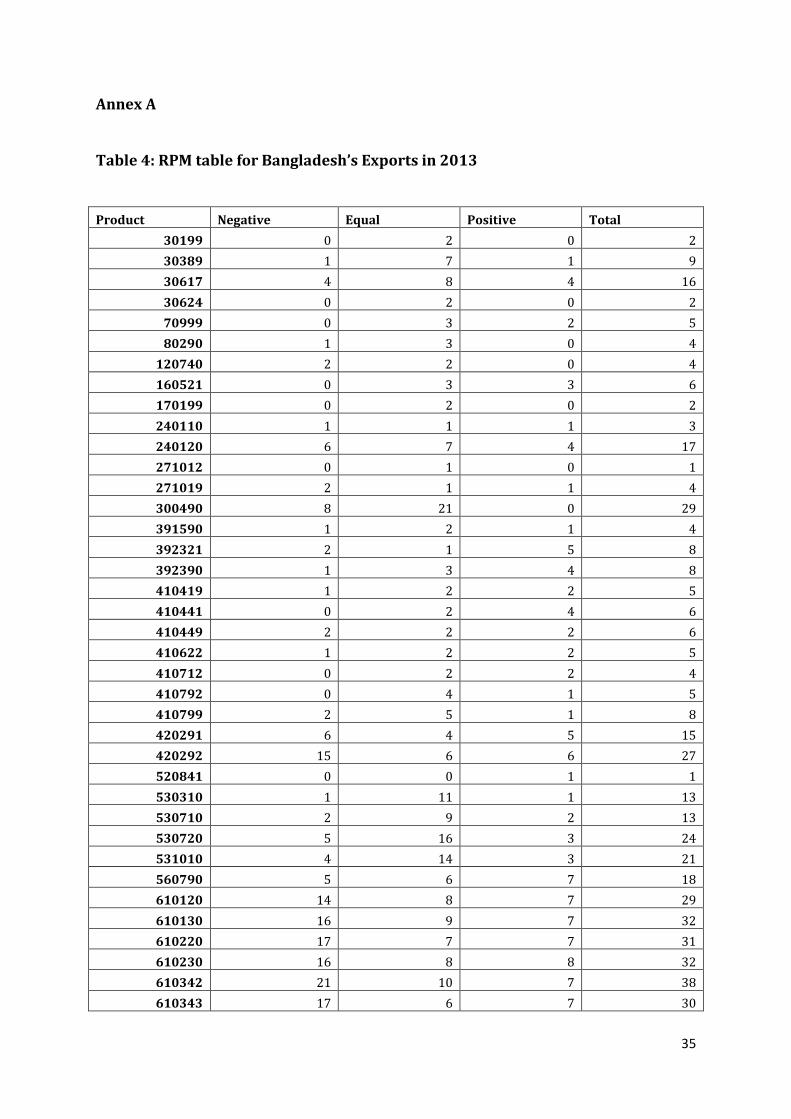
Annex A
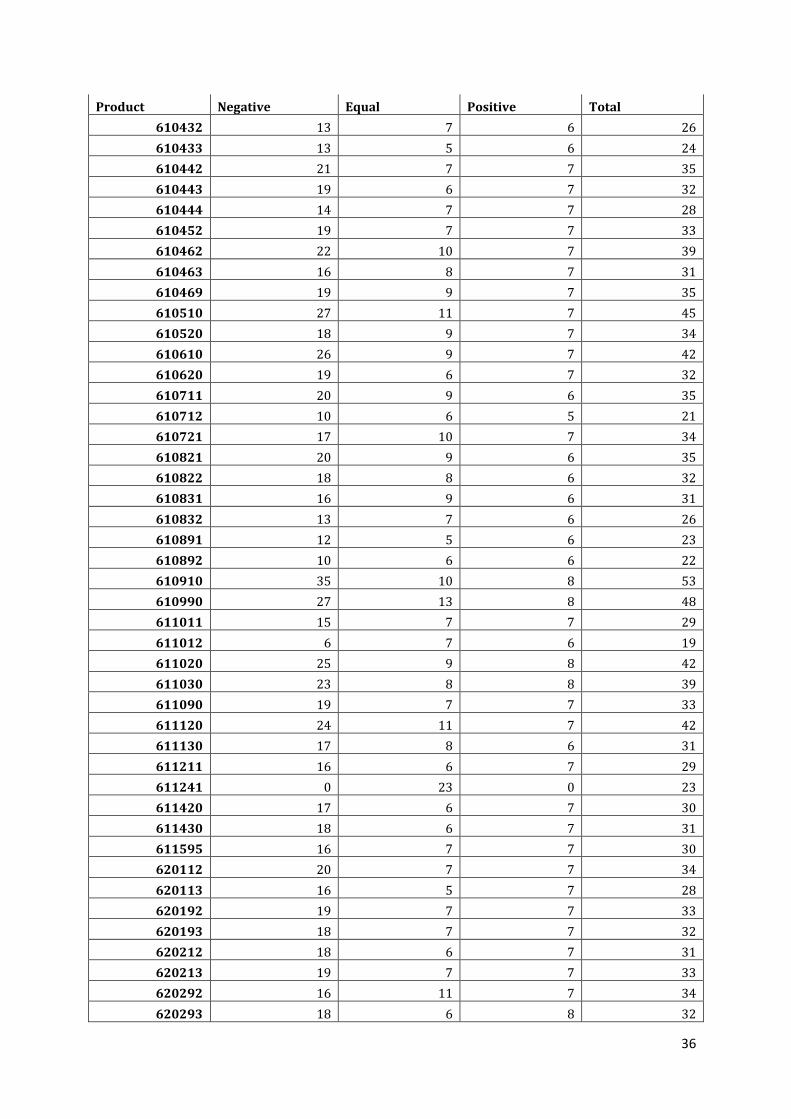
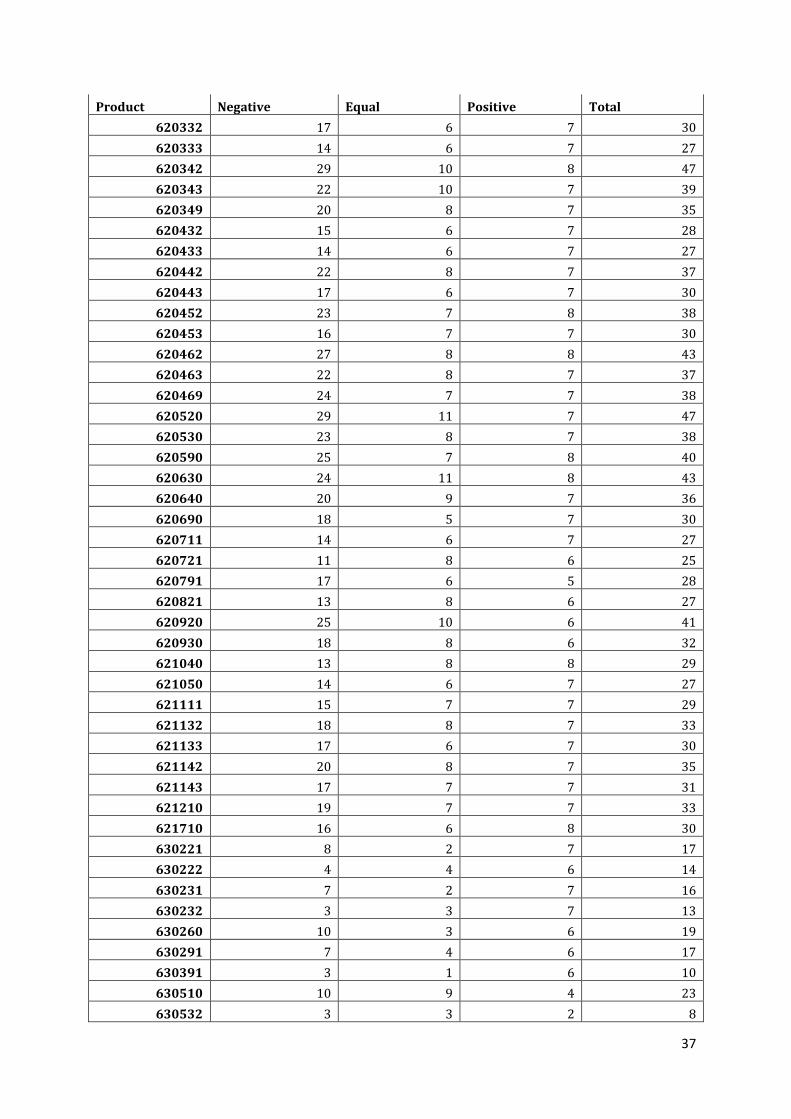
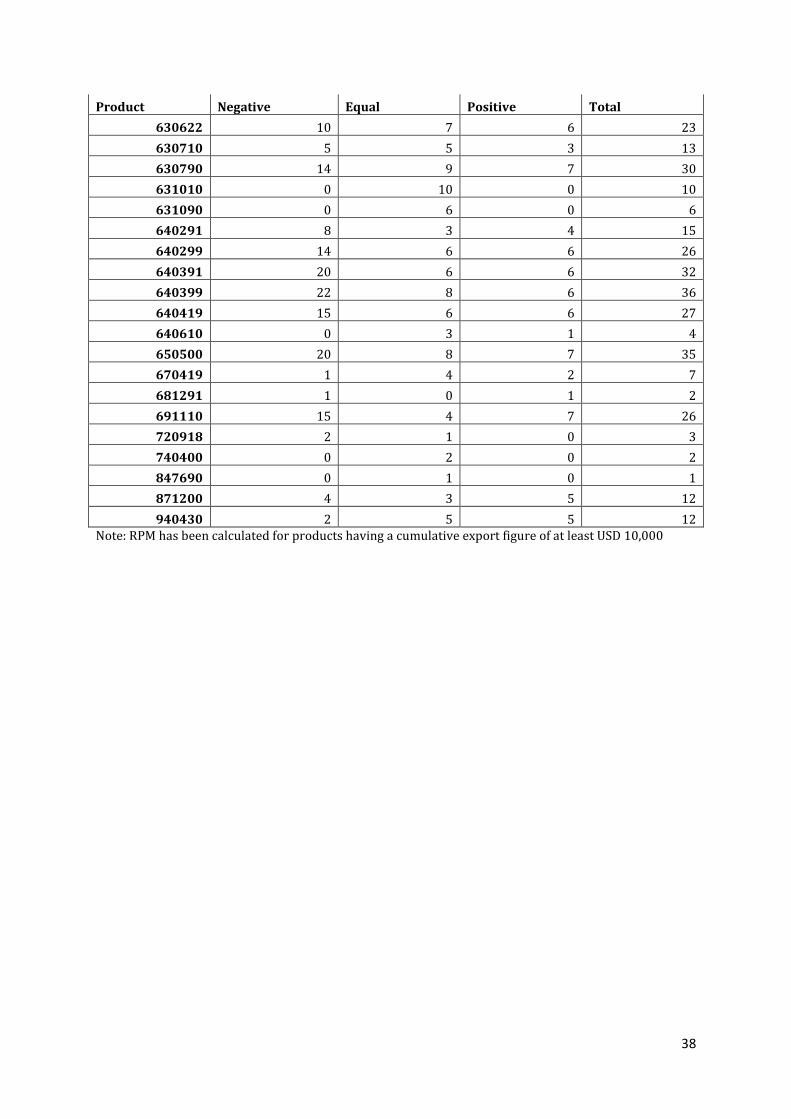
Table 4: RPM table for Bangladesh’s Exports in 2013
Product Negative Equal Positive Total 30199 0 2 0 2 30389 1 7 1 9 30617 4 8 4 16 30624 0 2 0 2 70999 0 3 2 5 80290 1 3 0 4
120740 2 2 0 4 160521 0 3 3 6 170199 0 2 0 2 240110 1 1 1 3 240120 6 7 4 17 271012 0 1 0 1 271019 2 1 1 4 300490 8 21 0 29 391590 1 2 1 4 392321 2 1 5 8 392390 1 3 4 8 410419 1 2 2 5 410441 0 2 4 6 410449 2 2 2 6 410622 1 2 2 5 410712 0 2 2 4 410792 0 4 1 5 410799 2 5 1 8 420291 6 4 5 15 420292 15 6 6 27 520841 0 0 1 1 530310 1 11 1 13 530710 2 9 2 13 530720 5 16 3 24 531010 4 14 3 21 560790 5 6 7 18 610120 14 8 7 29 610130 16 9 7 32 610220 17 7 7 31 610230 16 8 8 32 610342 21 10 7 38 610343 17 6 7 30
36
Product Negative Equal Positive Total 610432 13 7 6 26 610433 13 5 6 24 610442 21 7 7 35 610443 19 6 7 32 610444 14 7 7 28 610452 19 7 7 33 610462 22 10 7 39 610463 16 8 7 31 610469 19 9 7 35 610510 27 11 7 45 610520 18 9 7 34 610610 26 9 7 42 610620 19 6 7 32 610711 20 9 6 35 610712 10 6 5 21 610721 17 10 7 34 610821 20 9 6 35 610822 18 8 6 32 610831 16 9 6 31 610832 13 7 6 26 610891 12 5 6 23 610892 10 6 6 22 610910 35 10 8 53 610990 27 13 8 48 611011 15 7 7 29 611012 6 7 6 19 611020 25 9 8 42 611030 23 8 8 39 611090 19 7 7 33 611120 24 11 7 42 611130 17 8 6 31 611211 16 6 7 29 611241 0 23 0 23 611420 17 6 7 30 611430 18 6 7 31 611595 16 7 7 30 620112 20 7 7 34 620113 16 5 7 28 620192 19 7 7 33 620193 18 7 7 32 620212 18 6 7 31 620213 19 7 7 33 620292 16 11 7 34 620293 18 6 8 32
37
Product Negative Equal Positive Total 620332 17 6 7 30 620333 14 6 7 27 620342 29 10 8 47 620343 22 10 7 39 620349 20 8 7 35 620432 15 6 7 28 620433 14 6 7 27 620442 22 8 7 37 620443 17 6 7 30 620452 23 7 8 38 620453 16 7 7 30 620462 27 8 8 43 620463 22 8 7 37 620469 24 7 7 38 620520 29 11 7 47 620530 23 8 7 38 620590 25 7 8 40 620630 24 11 8 43 620640 20 9 7 36 620690 18 5 7 30 620711 14 6 7 27 620721 11 8 6 25 620791 17 6 5 28 620821 13 8 6 27 620920 25 10 6 41 620930 18 8 6 32 621040 13 8 8 29 621050 14 6 7 27 621111 15 7 7 29 621132 18 8 7 33 621133 17 6 7 30 621142 20 8 7 35 621143 17 7 7 31 621210 19 7 7 33 621710 16 6 8 30 630221 8 2 7 17 630222 4 4 6 14 630231 7 2 7 16 630232 3 3 7 13 630260 10 3 6 19 630291 7 4 6 17 630391 3 1 6 10 630510 10 9 4 23 630532 3 3 2 8
38
Product Negative Equal Positive Total 630622 10 7 6 23 630710 5 5 3 13 630790 14 9 7 30 631010 0 10 0 10 631090 0 6 0 6 640291 8 3 4 15 640299 14 6 6 26 640391 20 6 6 32 640399 22 8 6 36 640419 15 6 6 27 640610 0 3 1 4 650500 20 8 7 35 670419 1 4 2 7 681291 1 0 1 2 691110 15 4 7 26 720918 2 1 0 3 740400 0 2 0 2 847690 0 1 0 1 871200 4 3 5 12 940430 2 5 5 12
Note: RPM has been calculated for products having a cumulative export figure of at least USD 10,000