Embed Size (px)
Citation preview

Tariff policy for water sector
Romanian Water Association
Economic Workgroup
Bucharest, 2008 May 13th

Tariff policy for water sectorRomanian Water Association Economic Workgroup
Case study- Water Company Brasov
Tariff policy & Affordability
Profitability & MRD Reserve
Conclusions

Case study: Water Company Brasov, Romania
1993: Water crisis
Water system in bad condition
high losses
no meters in place
Financial problems
low tariffs barely cover the cost
collecting rate 60-70%
the investments were done by governmental funds.

Pumping station

Pumps

Sludge deposit
Water Company Brasov, Romania
1995:Performance Improvement Plan
Revenue Improvement Measures:
Tariff increases:
– initial adjustment
– in real terms with 50% every year for the first 3 years.
– fully adjustment with Inflation
Customer Debt Control
– max. 20%
Cost Control Measures– 2% every year x 5 first years

Water Company Brasov, Romania
Tariff Policy
before 1995:– different tariffs for each type of consumers
– the tariffs barely cover the operational cost
1996-2005– unique tariff eliminating the cross-subsidies
– strong increase of tariff
2003– “polluters pay” principle financial resources for investments
2008- affordability principle development & sustainability

0
0,5
1
1,5
2
2,5
3
3,5
1995 1996 1997 1998 1999 2000 2001 2002 2003 2004 2005 2006 2007 2008
lei / c
m
water price domestic water price non domestic
sewerage tariff domestic sewerage tariff non domestic
water & sewerage domestic water $ sewerage nondomestic
Water Company Brasov, Romania
Tariffs 1995- 2008 (19% V.A.T. included)
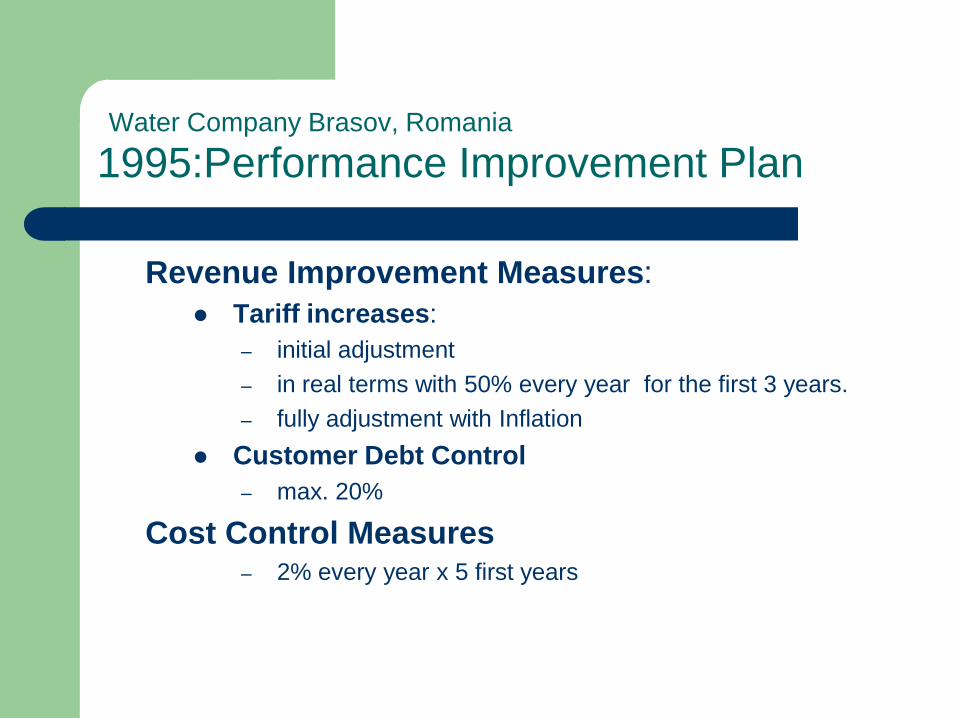
Water Company Brasov, Romania
Water demand
20000
25000
30000
35000
40000
45000
50000
55000
60000
65000
1992
1993
1994
1995
1996
1997
1998
1999
2000
2001
2002
2003
2004
2005
2006
2007
'00
0 c
m
The water production decrease 2008/1995 = 63%

Water Company Brasov, Romania
Water metering (water meters/ total connections)
0
10
20
30
40
50
60
70
80
90
[%]
contorizare 29 31 39 46 53 63 73 78 80 82 83 84
1996 1997 1998 1999 2000 2001 2002 2003 2004 2005 2006 2007

Water Company Brasov, Romania
Water consumption per capita
0
50
100
150
200
250
300
350
l/cap
ita/d
ay
1995 1996 1997 1998 1999 2000 2001 2002 2003 2004 2005 2006 2007

Water Company Brasov, Romania
The Average Bill Value per Household
1.4
6
8.5
12.7
22.2
26
30
25.8
21.521.822.6
0.9
16.4
0
5
10
15
20
25
30
1995 1996 1997 1998 1999 2000 2001 2002 2003 2004 2005 2006 2007
lei / f
am
Figure 1.2.1 Inflation1995 – 2007 *)
0
50
100
150
200
250
300
350
400
450
500
1995 1996 1997 1998 1999 2000 2001 2002 2003 2004 2005 2006 2007
%
Note : *) The data for 2007is an estimate

Water Company Brasov, Romania
Bill value and water consumption for population
1.4
12.7
22.2
26
30
78.5
0.9
6
25.8
21.521.822.6
16.4
3.33.33.43.63.85
8.18.8
9.18.78.89
0
5
10
15
20
25
30
1995 1996 1997 1998 1999 2000 2001 2002 2003 2004 2005 2006 2007
lei / f
am
cm
/pe
rs
Average invoice value per household Average montly consumption/person
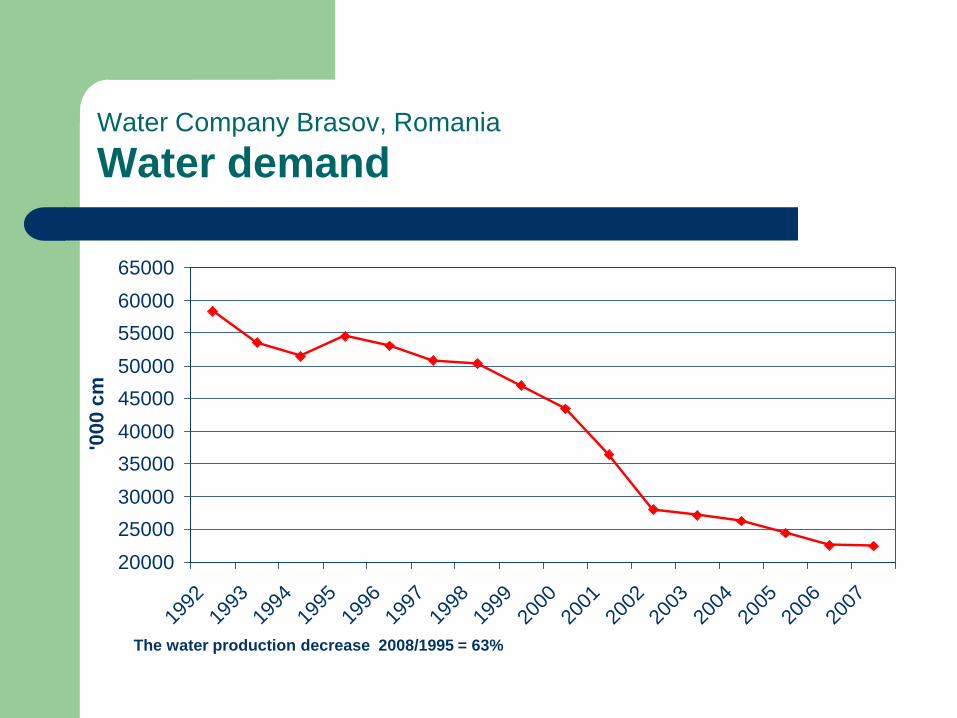
Romania
Affordability (1999- 2004)
0.0%
0.5%
1.0%
1.5%
2.0%
2.5%
3.0%
3.5%
4.0%
4.5%
5.0%
Arad Bacau Braila Cluj Constanta Bistrita
1999 2000 2002 2004
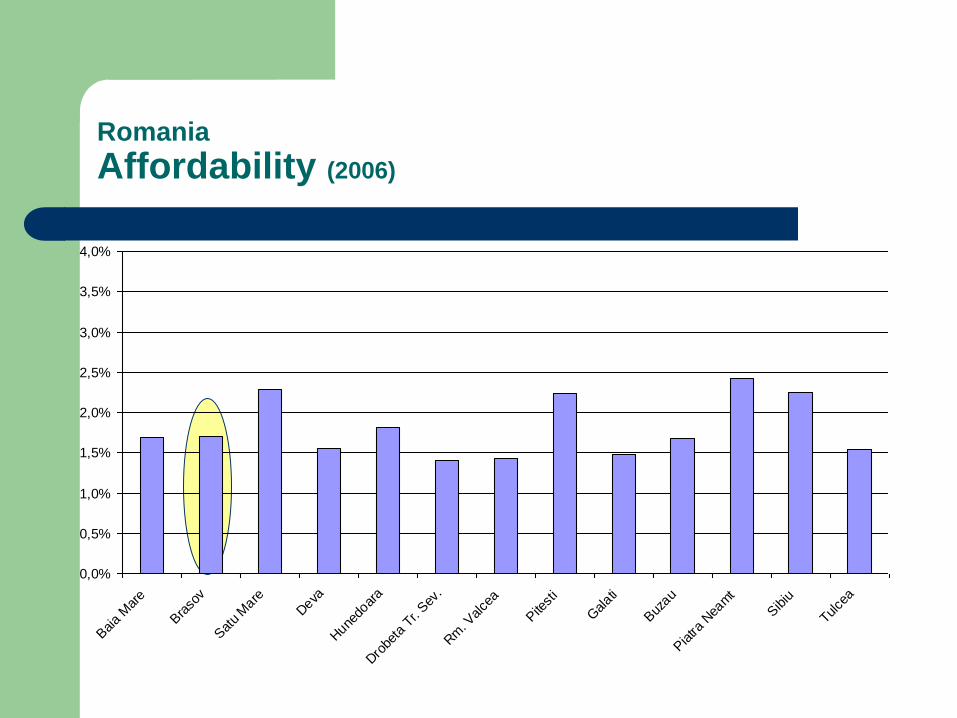
Romania
Affordability (2006)
0,0%
0,5%
1,0%
1,5%
2,0%
2,5%
3,0%
3,5%
4,0%
Baia
Mar
e
Bra
sov
Sat
u M
are
Deva
Hune
doar
a
Dro
beta
Tr.
Sev
.
Rm
. Valce
a
Pite
sti
Galati
Buz
au
Piatra
Nea
mt
Sibiu
Tulce
a

Romania
Uncashed bills (2006)
0.0%
5.0%
10.0%
15.0%
20.0%
25.0%
30.0%
35.0%
40.0%
Baia Mare Brasov Satu Mare Hunedoara Drobeta Tr.
Sev.
Rm. Valcea Pitesti Galati Piatra Neamt Sibiu Tulcea

Tariff structure (1)
Operational cost
– Row water and materials
– Energy and fuel
– Spare parts
– Salaries
– Third party services
– Financial expenses
– Income tax
– Repair and Maintenance:
emergency repairs
routine maintenance
preventive maintenance

Tariff structure (2)
Depreciation and provisions for
replacement of assets
Profit for:
– Loans repayments
– Development

Romania
Profitability for non MUDP (2006)
-5.0%
0.0%
5.0%
10.0%
15.0%
20.0%
25.0%
30.0%
Baia Mare Brasov Satu Mare Hunedoara Drobeta Tr.
Sev.
Rm. Valcea Pitesti Galati Buzau Piatra
Neamt
Sibiu Tulcea

Romania
Operational Profit for MUDP (2006)
0,0%
5,0%
10,0%
15,0%
20,0%
25,0%
30,0%
35,0%
Arad Bacau Brasov Constanta Iasi Oradea Tg. Mures Timisoara

Maintenance, Replacement and Development (MRD) Reserve
The Water Company
depreciation and
net profits
The County Council
profit tax
share of the net profits

Conclusions
Water infrastructure is expensive
Affordable water tariff but not for free
Water sector need for political support and professional management
Planning on a long term. Decision now.
Make profit and reinvest it !
RESULTS:

Water Tank 5000 cm
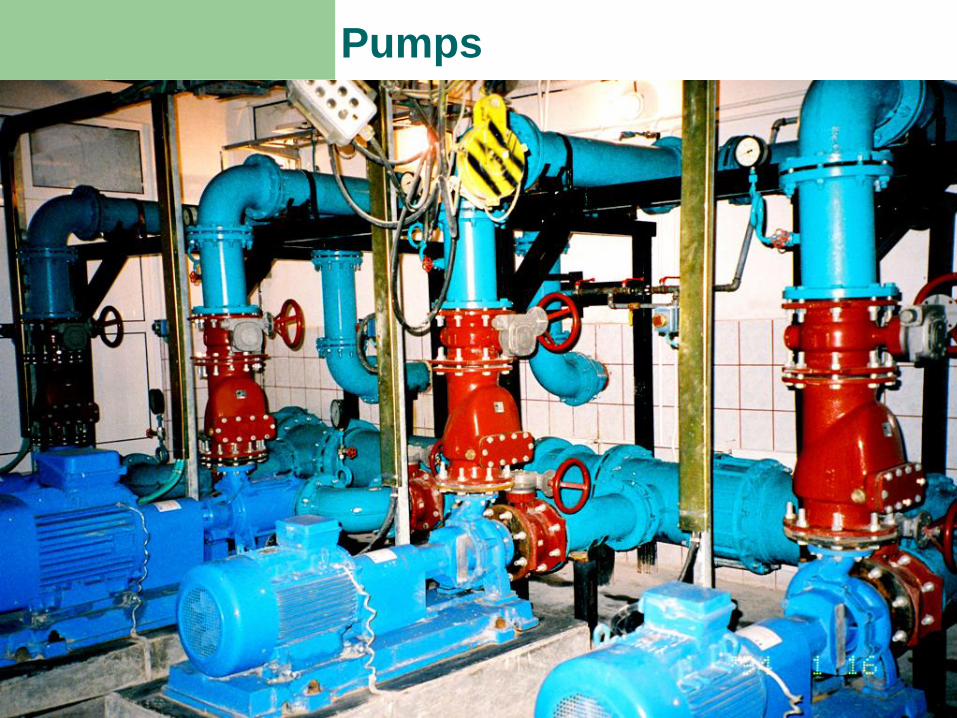
Pumps

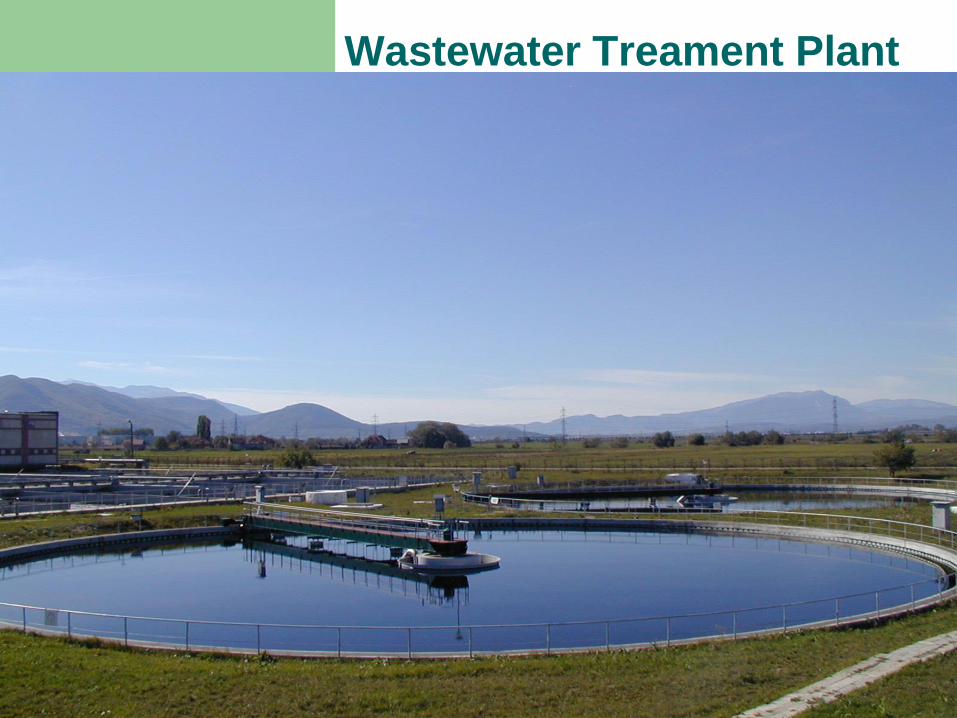
Wastewater Treament Plant

Operational center

Compania Apa Brasov
13, Vlad Tepes street
500092 Brasov, Romania
Tel: +4 0744 64 84 14
Fax: +4 0268 40 86 45
Thank you !
Благодарю за внимание!
Sludge deposit