Embed Size (px)
Citation preview

Journal of Economic Cooperation Among Islamic Countries 17, 3-4 (1996), 165-186
TARGETING, COVERAGE AND CONTRIBUTION OF ZAKAT TO HOUSEHOLDS' INCOME:
THE CASE OF PAKISTAN
Dr. Nasim Shah Shirazi* Dr. Shirazi’s paper investigates the Zakat and ’Ushr (ZU) Programme of Pakistan with three main objectives in mind: firstly, to examine the targeting of the programme; secondly, to determine the programme’s coverage; and thirdly, to estimate the contribution of ZU to the average income of the poorest households. The paper uses the 1990/91 data of a regular Household Integrated Economic Survey (HIES), but also points out some limitations in the data sample. Dr. Shirazi concludes that, overall, the Programme funds are correctly targeted as a significantly large proportion of zakat and ’ushr transfers did find their way to the targeted group. However, the coverage of the programme is found to be “not significantly large”, since it covers only 2.7 per cent of the total households.
1. INTRODUCTION Payment of zakat is one of the five pillars of Islam. It is an obligatory transfer by a sahib-e-nisab (rich) to the poor. A well-organised system of zakat was in practice some fourteen centuries ago. Under this system a considerable portion of the wealth of the rich was automatically redistributed among the poor.
In Pakistan, even before the establishment of the official zakat system in 1980, people were paying zakat voluntarily to the poor and destitute, relatives and neighbours, religious school (deeni madaris) and other welfare institutions.
The President of Pakistan, on 20th June 1980, promulgated the zakat and ’ushr ordinance, 1980. The objective of the zakat and ’ushr system was to
* Associate Professor and Acting Director of Research International Institute of Islamic Economics. International Islamic University, Islamabad, Pakistan.

Journal of Economic Cooperation Among Islamic Countries
166
assist and rehabilitate the needy, the indigent and the poor. The zakat and ’ushr system had a five-tier administrative set-up. There is a Central Zakat Council, Provincial Zakat Councils (one in each province), District Zakat Committees (one in each district), Tehsil Zakat Committees (one in each Tehsil) and Local Zakat Committees (one for each village in the rural areas and one for each Mohallah in the urban areas). However, presently, the administrative set-up has been reduced from five tiers to four tiers, abolishing the Provincial Zakat Councils and Tehsil Zakat Committees, while introducing 12 regional administrators all over the country.
There are at present about 39,000 Local Zakat Committees working throughout the country and more than 250 thousand persons are voluntarily involved in the working of the system. Financial Institutions involved in the collection also do not charge any fee. The ’ushr assessment and its collection are also free of cost. This volunteer work makes the administrative system of zakat and ’ushr unique.
The objectives of the paper are: a) to identify whether zakat and ’ushr reach the poor sections of the households and whether the programme is correctly targeted or not; b) to estimate the proportion of zakat and ’ushr recipients among the households in the lowest income decile and thus determine the coverage of the programme; c) to estimate the contribution of zakat and ’ushr to the average income of the lower income decile.
Regarding the methodology and data set that are applied to undertake analysis within the above-mentioned framework, all households of the country are divided into successive deciles (ten groups) according to ascending income levels. In this way, the lowest income decile contains the poorest households, while the 10th decile presents the richest households of the country.
Results have been obtained from the data collected in the Household Integrated Economic Survey (HIES)* 1990/91. The HIES is conducted by the Federal Bureau of Statistics (FBS), Statistics Division, Government of Pakistan, on a regular basis and covers both rural and urban areas in four provinces of Pakistan. The sample size of this survey was 6,516 households
* Previously this survey was called the Household Income and Expenditure Survey.

Contribution of Zakat to Households' Income: The Case of Pakistan 167
out of which 123 households could not be covered by the FBS for various reasons. The distribution of the sample is given below.

Journal of Economic Cooperation Among Islamic Countries
168
Provinces Total Urban Rural
Punjab 3264 1288 1976
Sind 1676 844 832
NWFP 912 392 520
Baluchistan 664 248 416
Total 6516 2772 3744
Source: Federal Bureau of Statistics, Household Integrated Economic Survey, (1990/91), Government of Pakistan.
The sample size of this survey is small as compared to the past HIES surveys. The results derived from this survey are reliable with a rural/urban breakdown only at the national level and there is no guarantee of reliability of results even at the provincial level. This is clearly mentioned in the report* that "due to smaller size of sample, it was considered appropriate to prepare results only on [a] national basis by urban/rural breakdown, as the sample was considered not representative for provincial level tabulation".
However, analysis for the current study is extended to the provincial level to get some indicative results. Another limitation of the data is that the transfers reported in the HIES include voluntary transfers along with the transfers from the official zakat programme, and the two cannot be disaggregated.
Taking into account all the above the paper is organised as follows. In section 2, the types of assets that are subject to zakat and ’ushr would be tackled. Section 3 is devoted to trends in collection of ’ushr. Section 4 deals with issues related to the collection of zakat. Section 5 covers the distribution of zakat and ’ushr. Section 6 presents the estimates of zakat that reach the poor. In section 7, the coverage of the programme is discussed, while section 8 discusses the contribution of zakat to the average households income of the lower income decile. The last section, 9, concludes the paper.
* Federal Bureau of Statistics, “Household Integrated Economic Survey” (1990/91), Government of Pakistan.
Contribution of Zakat to Households' Income: The Case of Pakistan 169
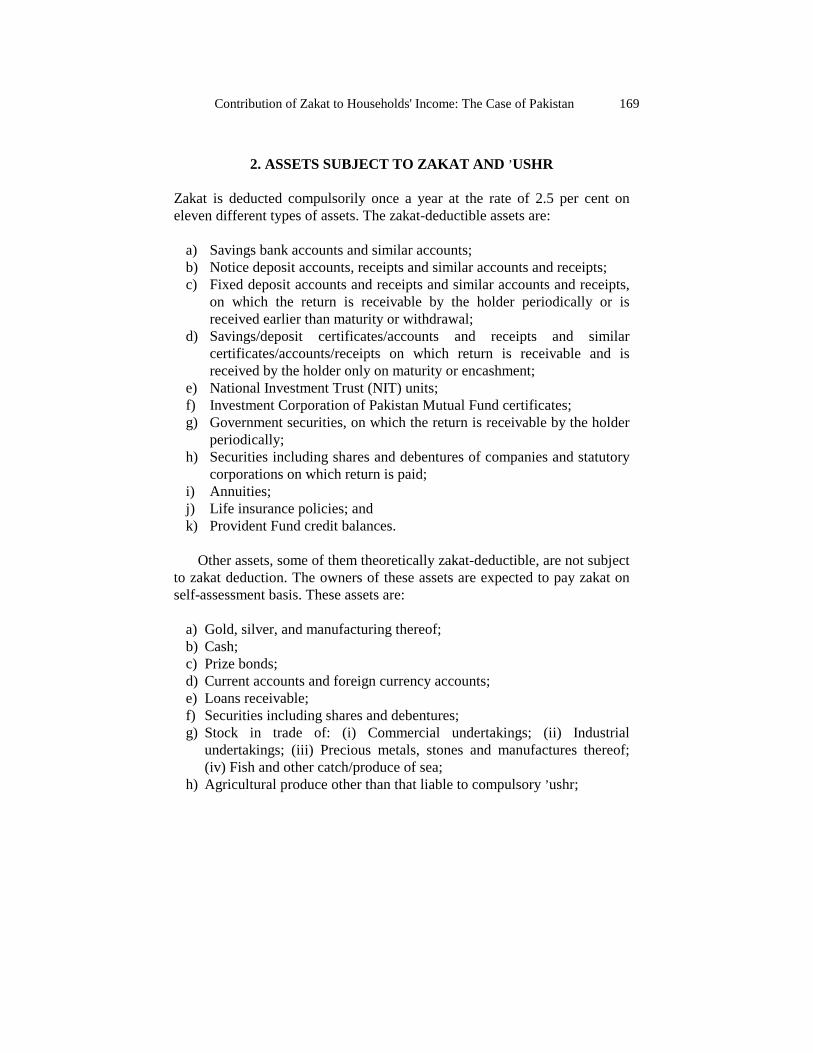
2. ASSETS SUBJECT TO ZAKAT AND ’USHR Zakat is deducted compulsorily once a year at the rate of 2.5 per cent on eleven different types of assets. The zakat-deductible assets are:
a) Savings bank accounts and similar accounts; b) Notice deposit accounts, receipts and similar accounts and receipts; c) Fixed deposit accounts and receipts and similar accounts and receipts,
on which the return is receivable by the holder periodically or is received earlier than maturity or withdrawal;
d) Savings/deposit certificates/accounts and receipts and similar certificates/accounts/receipts on which return is receivable and is received by the holder only on maturity or encashment;
e) National Investment Trust (NIT) units; f) Investment Corporation of Pakistan Mutual Fund certificates; g) Government securities, on which the return is receivable by the holder
periodically; h) Securities including shares and debentures of companies and statutory
corporations on which return is paid; i) Annuities; j) Life insurance policies; and k) Provident Fund credit balances.
Other assets, some of them theoretically zakat-deductible, are not subject
to zakat deduction. The owners of these assets are expected to pay zakat on self-assessment basis. These assets are:
a) Gold, silver, and manufacturing thereof; b) Cash; c) Prize bonds; d) Current accounts and foreign currency accounts; e) Loans receivable; f) Securities including shares and debentures; g) Stock in trade of: (i) Commercial undertakings; (ii) Industrial
undertakings; (iii) Precious metals, stones and manufactures thereof; (iv) Fish and other catch/produce of sea;
h) Agricultural produce other than that liable to compulsory ’ushr;

Journal of Economic Cooperation Among Islamic Countries
170
i) Animals fed free in pastures, and wealth and financial assets other than those listed in the schedule on which zakat is payable according to Shari'ah.
In case of savings bank accounts and similar accounts, zakat is deducted
once a year, on the first of Ramadan. From other zakat-deductible assets, it is deducted on the date on which the first return is paid or on the date of encashment or withdrawal, whichever is earlier during the zakat year* .
The zakat collection for the period 1980/81 to 1993/94 from different assets is shown in Table 1. As the Table shows, the total zakat collection increased steadily from 1980/81 to 1993/94 except for the years 1984/85, 1991/92 and 1992/93. The main reason for the decline in the zakat receipts in 1984/85 was the drop in collection from savings bank accounts** . Similarly the decline in collection of zakat for the years 1991/92 and 1992/93 was owing to the declining receipts from the fixed deposit receipts and certificates as greater resources are moved out of these assets into foreign exchange accounts following the liberalisation of foreign exchange rate policy. The changes in zakat receipts from savings bank accounts and fixed deposit receipts and certificates lead to substantial fluctuations in the total collections of zakat because of the relatively large share of these assets in the total collection (see Appendix Table 1). Zakat receipts from voluntary sources were about 6 to 7 millions rupees during the recent years. However, zakat collection from other receipts, which was negligible in all the previous years, was very high (Rs.1.8 billion) in 1993/94. Inclusion of these receipts
* Zakat year' means year according to the Hijrah (Islamic) calendar for which zakat is chargeable, commencing on the first day of Ramadan. ** Followers of Fiqh Ja'fariah (school of thought) were exempted. Many people learnt to avoid payments of zakat by transferring Savings Accounts into Current during collection and after that period redeposit into Savings Accounts [see Beall et al 19931. This practice continues to date. The World Bank (Report No. 1 4397-PAK) prepared a rough estimate of the collection of zakat which was due on savings Accounts (personal) and fixed deposits (personal) as of the end of December 1993. Applying the 2.5 percent rate to these balances yields Rs. 3,494 million and Rs. 1 268 million respectively. The corresponding amounts actually collected in 1993/94 were Rs. 1,767 million and Rs. 527 million respectively, suggesting that a considerable proportion of people withdraw deposits or declare themselves exempt.

Contribution of Zakat to Households' Income: The Case of Pakistan 171
increased the grand total of zakat collection to Rs. 4.6559 billion in the year 1993/94.
Collection of zakat by type of assets (at constant prices of 1980/81) is shown in Appendix Table 2. The annual average growth rate of total zakat collection and its components is given in Table 2.

Journal of Economic Cooperation Among Islamic Countries
170
Table 1 Collection of Zakat by Type of Asset
Name of Asset 1980-81 1981-82 1982-83 1983-84 1984-85 1985-86 1986-87 1987-88 1988-89 1989-90 1990-91 1991-92 1992-93 1993-94
Saving Bank Accounts 618.15 658.4 752.0 1,162.0 868.4 937.0 1,022.1 1,156.0 1,178.7 1,273.2 1,376.3 1,496.3 1,567.5 1,767.4
Notice Deposit Receipts 70.89 39.3 23.0 22.0 24.2 22.8 12.3 17.3 14.4 17.1 9.5 12.2 14.0 9.8
Fixed Deposit Receipts and Certfs. 76.05 111.8 152.0 170.0 279.3 379.7 452.7 674.7 776.9 963.6 1,068.7 834.7 606.8 527.0
Savings Deposit Certificates 22.87 29.8 35.062.0 79.2 82.7 63.8 97.3 138.5 134.8 118.1 152.6 161.8 191.5
NIT Units 19.64 19.5 13.0 19.0 22.2 25.9 25.2 27.3 43.5 2.6 65.9 99.4 93.5 98.8
ICP Mutual Funds l.90 1.1 2.0 3.0 3.3 2.9 2.9 2.9 1.7 3.0 2.9 3.2 3.5 2 9
Government Securities 1.01 0.9 1.0 1.0 1.1 1.6 1.3 1.0 1.0 0.6 0.4 1.0 1.9 1.0
Shares and Debentures 25.15 25.5 3.0035.0 36.1 40.7 47.9 53.6 75.1 84.5 100.4 114.0 142.6 164.5
Annuities 0.05 .. .. .. .. .. 0.1 0.2 0.1 .. .. ... 0.3 0.2
Life Insurance Policies 2.99 4.7 5.0 6.0 6.8 8.6 8.l 9.2 10.8 12.2 13.9 15.6 18.9 21.0
Provident Funds 5.55 11.5 11.0 11.0 14.2 19.l 22.5 30.1 38.7 8l.6 35.9 41.2 47.6 60.1
Total Deduction of zakat at source 844.25 902.4 1,027.01,490.0 1,334.8 1.521.0 1,658.9 2,069.5 2,279.42,573.2 2,792.0 2,770.3 2,658.4 2,844.4
Voluntarily paid zakat 1.60 1.6 1.0 1.0 1.8 1.7 1.4 2.4 3.5 3.5 5.6 8.3 7.7 7.4
Other Receipts .. .. .. .. .. .. .. 0.3 1.8 0.8 0.6 0.2 1.7 1,804.1
Grand Total Receipts 845.85 904.0 1,028.0 1,491.0 1,336.6 1,522.7 1,660.3 2,072.2 2,284.7 2,577.6 2,798.2 2,778.8 2,667.8 4,655.9
.. : Negligible Source : Central Zakat Administration (1994)~ Zakat and ’Ushr System of Pakistan, Zakat and Ushr Division, Ministry of Finance,
Government of Pakistan.

Contribution of Zakat to Households' Income: The Case of Pakistan
171
The total collections of zakat increased at an average annual rate of 2.63 per cent during the period from 1980/81 to 1993/94. The collection of zakat from savings bank accounts increased by 2.10 per cent during the same period, while collection from notice deposit receipts decreased significantly at an annual average rate of minus 18.72 per cent. The annual average increase of 10.32 per cent was recorded in collection from fixed deposit receipts and certificates. There was also a significant increase (7.66 per cent) in the collection from savings deposit certificates. Collection from ICP Mutual Funds and government securities showed an annual decrease of minus 2.98 per cent and minus 8.39 per cent respectively. The grand total collection of zakat, which also includes voluntary payment of zakat and other receipts, increased at an annual average rate of 3.85 per cent during the period from 1980/81 to 1993/94.
Table 2
Annual Average Growth of Zakat Collection by Type of Asset
Name of Asset Growth Rates in
Percentage (1980/81 to 1993/94)
T. Statistics
Savings Bank Accounts 2.10 1.056 Notice Deposit Receipts -18.72 -10.26 Fixed Deposit Receipts and Certificates 10.32 3.29* Savings Deposit Certificates 7.66 4.77* NIT Units 4.93 0.88 ICP Mutual Funds -2.98 -1.55 Government Securities -8.39 -2.84 Shares and Debentures 7.73 16.78* Annuities 4.76 0.526 Life Insurance Policies 5.88 8.69* Provident Funds 9.70 4.42* Total Collection 2.63 2.70** Voluntary Payment of Zakat 10.97 5.50* Other Receipts ... ... Grand Total Receipts 3.85 3.99*
Source: Computed from Appendix Table 2. * Significant at 1 per cent. ** Significant at 5 per cent. + 1980/81 taken as constant price year. ... Insufficient observations.

Journal of Economic Cooperation Among Islamic Countries
172
3. TRENDS IN COLLECTION OF USHR
The trend in collection of ’ushr is given in Appendix Table 3. This Table presents the information about the assessment and collection of ’ushr and the percentage ’ushr collected out of the assessment made for each year. The Table shows that the collection of ’ushr increased from Rs. 179.32 million in 1982/83 to Rs. 258.71 million in the year 1983/84 and it further increased to Rs. 261.04 in 1984/85. After 1984/85 ’ushr collection has been continuously declining and in recent years has dropped significantly. It fell to Rs. 0.20 million in 1993/94.
Assessment and collection of ’ushr were basically the responsibility of the Local Zakat Committees. Local Zakat Committees "have neither the professional competence nor the backing to confront the influential landowners"*. Local Zakat Committees work voluntarily and in most cases are ignorant of financial matters. In a few cases, the chairmen, and, in most cases, the members of the Local Zakat Committees are uneducated or have very low levels of education. Faiz (1991)** reports that “in the majority of cases, accounts of Local Zakat Committees are maintained by some one else”. Owing to the low collection of the ’ushr, the Central Zakat Administration decided in 1993 to hand over the assessment and collection of ’ushr to the revenue departments of the respective provinces. Revenue departments are in a much better position to assess and collect ’ushr because they have trained personnel. It is expected that ’ushr collection will improve because of this measure.
4. PROBLEMS IN COLLECTION OF ZAKAT
The collection of zakat is not without problems. The zakat system is not broad based and all technically zakat-deductible assets are not subject to zakat. Many exemptions are given in the collection of zakat, e.g., WAPDA Bearer Bonds, Special Saving Certificates and foreign currency accounts. Zakat is collected from the Muslim residents of Pakistan. However, followers of the Fiqh-i-Ja'fariah (Shiah) are exempt. In other words zakat is levied only on the Sunnis. Several rich Sunnis are known to have declared * Faiz Muhammad (1990). Evaluation of Nizam-e-Zakat and Ushr in Pakistan. International institute of Islamic Economics, International Islamic University, Islamabad. ** Faiz, op. cit.

Contribution of Zakat to Households' Income: The Case of Pakistan
173
themselves as Shiah in order to evade payments of zakat. All these exemptions reduce the potential and actual zakat collection.
Some religious scholars have confused the people by putting forward the idea that the payment of zakat is an individual matter and should be given individually to the needy directly rather than through the government. People do not trust the official zakat machinery and have no faith in the efficacy of the official zakat and ’ushr system to be of benefit to the deserving. Many such problems have been discussed by Beall et al. (1993)*. They have also identified problems such as the transfer of money from savings to current accounts. They report that "it is common for people, for example, to move savings into current accounts during collection periods".
Lack of a proper information system about zakat organisation is also a
serious problem. There is very little information dissemination through the mass media. A report reveals that very little effort is put into advertising. Except a local television programme about zakat in the Punjab province, no zakat- related programmes exist at the provincial or national levels (Kahf, 1987)** .
One of the functions of the Local Zakat Committees was to collect voluntary zakat and gifts, etc. However, a report (Faiz, 1990)*** reveals that only 8 per cent of the existing Local Zakat Committees collected voluntary zakat. It is further reported, based on the survey by Faiz (1990), that "part of the reasons for low voluntary collection is that most of the committees either did not admit to or feel the need to collect zakat from the local population. In the majority of cases also, the committees trying to collect zakat from the local population failed to get an adequate response".
* Beall, jo, et al. (1993), Social Safety Nets and Social Networks: Their Role in Poverty Alleviation in Pakistan, background paper for Pakistan Poverty Assessment Report No. 14397 - PAK. ** Kahf, Monzer (1987), “Report on Zakat and Ushr Fund Management in the Islamic Republic of Pakistan”. IRTI, Islamic Development Bank and International Institute of Islamic Economics, International Islamic University, Islamabad. *** Faiz, op. cit.

Journal of Economic Cooperation Among Islamic Countries
174
5. DISTRIBUTION All the zakat proceeds are deposited in the Central Zakat Fund with the State Bank of Pakistan. The Central Zakat Administration retains a certain amount in the Central Zakat Fund for national welfare and other schemes and the remaining amount was allocated to the provinces (into provincial Zakat Fund) based on the population shares. From the Provincial Zakat Fund 60 per cent were allocated to Local Zakat Committees for subsistence and rehabilitation purposes directly to the deserving people and 40 per cent for the same objective but for disbursement through the welfare institutions. Presently, zakat is distributed from the Central Zakat Council to the beneficiaries directly through the financial institutions and post offices. The disbursement of zakat for subsistence and rehabilitation grants is given in Appendix Table 4. On average Rs.481.6 (at 1980/81 prices) per beneficiary were disbursed from official sources among on average 1.15 million beneficiaries every year during the period 1980/81 to 1992/93. Out of these beneficiaries on the average 121,753 beneficiaries were rehabilitated each year with an average annual grant of Rs. 1266.5 at 1980/81 prices (see Appendix Table 4.A).
The subsistence allowance decreased (statistically insignificantly) at an average annual rate of minus 3.94 per cent and the average growth rate of beneficiaries during 1980/81 to 1992/93 was also negative (minus 1.89 per cent). However, rehabilitation grants increased significantly, at an annual average rate of 26.24 per cent, and the rehabilitated families increased at an annual average rate of 28.12 per cent during the same period.
The total disbursements to welfare and other institutions increased significantly at an annual average rate of 12.55 per cent. The number of beneficiaries through these institutions increased at the average annual rate of 10.63 per cent during 1990/91 to 1992/93.
The identification of deserving people is the main responsibility of the Local Zakat Committees. It is reported that this selection was improper in the past, in some cases, non-deserving people were selected. Selection was not systematic. Acquaintance and other association with the Local Zakat Committee Chairman or members was commonly cited as the reason for

Contribution of Zakat to Households' Income: The Case of Pakistan
175
being on the list*. For these reasons, it was decided by the Central Zakat Administration, as an interim measure, to disburse zakat only to the most deserving categories of Mustahequeen; namely the indigent widows, orphans and the disabled. People are generally not satisfied with these committees. A report* shows that in Pakistan 14 per cent of the committee members are corrupt, 13 per cent give Zakat Fund to their friends/acquaintances. In 10 per cent of the cases, it was found that the money recorded as disbursed in committees registers was more than what was actually disbursed. Political considerations influence the performance of Zakat Administration. It is reported** that Zakat Funds are also used for political purposes.
6. TARGETING OF ZAKAT AND USHR TRANSFER The distribution of total zakat and ’ushr according to income decile is given in Table 3. Estimates given in the Table show that the lowest income decile received 94.3 per cent of the total zakat and ’ushr disbursements. 16.8 per cent in the urban areas and 77.5 per cent in the rural areas of Pakistan. The second lowest income decile received only 2.7 per cent of the total zakat and ushr distribution in overall Pakistan, 0.4 per cent in the urban areas and 2.3 per cent in the rural areas of Pakistan during the same period. The third and fourth income deciles received even less than one per cent in these areas. However, the fifth income decile received 1.3 per cent in overall Pakistan, 1.2 per cent in the rural areas and 0.1 per cent in the urban areas of Pakistan. In the disbursement of zakat and ushr funds, as given in Table 1, the major share went to the rural households, i.e., 82.5 per cent of the total zakat and ushr was distributed among the rural households and only 17.5 per cent among the households of the urban areas of Pakistan.
As regards the distribution of zakat and ushr among the provinces, the lowest income decile in overall Punjab received the highest percentage (73.1) followed by NWFP (14.6). The lowest (0.8) was in Baluchistan. The second lowest income decile in overall Punjab received 1.3 per cent of the
* World Bank, 1970, "Pakistan: A Profile of Poverty" Report No. 8848-PAK. * Faiz, op. cit. ** Kahf, op. cit.

Journal of Economic Cooperation Among Islamic Countries
176
total zakat and ushr distribution of Punjab, followed by NWFP (1.1 per cent) and Sind (0.3 per cent). However, no disbursement was reported to be made to the second, third and fourth income deciles in overall Baluchistan. Similarly the zakat and ushr disbursement to the other income decile in all the provinces is negligible.
Table 3 Percentage of Zakat & Ushr Distribution in the 5 lowest Income Decile
1st 2nd 3rd 4th 5th Total
Overall 94.3 2.7 0.9 0.8 1.3 100.0
Urban 16.8 0.4 0.1 0.1 0.1 17.5
Rural 77.5 2.3 0.8 0.6 1.2 82.5
Province
Punjab 73.1 1.3 0.3 0.7 0.9 76.2
Sind 5.8 0.3 0.0 0.0 0.2 6.4
NWFP 14.6 1.1 0.6 0.1 0.1 16.5
Baluchistan 0.8 0.0 - - 0.1 1.0
Source: Estimates from HIES, 1990/91.
Among the provinces, the highest (76.2 per cent) disbursement from the total zakat and ushr is received by the households living in Punjab, followed by NWFP (16.5 per cent), again the lowest (1.0 per cent) by the households of Baluchistan. Households from Sind received 6.4 of the total zakat and ushr.
From Table 3 it is clear that zakat and ushr transfer is made to the targeted group, i.e., to the lowest income decile. However, these transfers also include voluntary zakat and ushr along with official transfers. Unfortunately, the official and voluntary transfer cannot be separated in this data set. One would expect that voluntary zakat and ushr disbursement by the rich are made mostly to the deserving people directly or indirectly through welfare institutions, Deeni Madaris and other welfare trusts and do not involve the government*.
* Estimates from HIES show that during 1990/91, Rs 14.6 billion zakat and Ushr were transferred. These estimates also include official transfers. During the same period official zakat collection was Rs. 2.8 billion and the zakat amount distributed was about Rs. 1.3 billion [see Shirazi, Nasim S. (1995) “Income Transfer Program in

Contribution of Zakat to Households' Income: The Case of Pakistan
177
Table 3 also shows that some zakat and ushr is transferred to the fourth
and fifth income deciles, however, these transfers were insignificant.
Another important result from this Table is that the total share of zakat and ushr disbursement is comparatively low to the province of Sind. Whereas Sind province is the second largest province as far as the population is concerned after Punjab. The reason for this small share could be data bias, i.e., during the survey year, there were disturbances in the province of Sind, so enumerators might not have reached the targeted survey areas or there could be cultural reasons that hinder the respondents from correctly reporting receipt of zakat and ushr.
Zakat and ushr receipts in Punjab and NWFP are reportedly comparatively higher than in the other two provinces. Again data biases have to be kept in mind.
7. COVERAGE OF THE ZAKAT AND USHR: PROPORTION OF HOUSEHOLDS RECEIVING ZAKAT AND USHR
IN THE INCOME DECILE As noted above in Table 3 it seems that the programme is correctly targeted and the lion’s share of zakat and ushr funds flows to the lowest income decile. The statistics regarding the coverage of the programme of zakat and ushr are given in Table 4. Zakat and ushr benefited 18.1 per cent of the total households in the lowest income decile on an overall basis, 16.5 per cent in the urban and 18.5 per cent in the rural areas of Pakistan. Out of the total households in the second income decile, 3.6 per cent overall, 3.7 per cent in the urban and 3.6 per cent in the rural areas, of Pakistan received zakat and ushr in 1990-91. The percentage of the households in the third through fifth deciles who received zakat and ushr varies between 1.5 and 1.8 in overall Pakistan and between 0.4 per cent to 1.7 in the urban and 1.8 per cent to 2.0 per cent in the rural areas of Pakistan. However, the total households that
Pakistan”. A background paper for World Bank Report on Pakistan Poverty Assessment No. 14397-PAK*]. Therefore, more than Rs. 13 billion were transferred from the private sources in 1990/91 Private voluntary transfers are usually more accurately targeted and paid to the persons/institutions that really deserve these.

Journal of Economic Cooperation Among Islamic Countries
178
benefited in all income deciles were 2.7 per cent overall, 1.4 per cent in the urban areas and 3.2 per cent in the rural areas of Pakistan in 1990/91.
The proportion of beneficiaries, in all income deciles were 2.4 per cent in overall Punjab, 1.2 per cent in Sind, 7.6 per cent in NWFP and 0.9 per cent in Baluchistan of the total households in each province. If these percentages are decomposed into each income decile, then most of the recipients lie in the lowest income decile. In the case of Punjab, 16.9 per cent of the first income decile, 1.9 per cent of the second and 1.2 to 1.8 of the third through the fifth income decile benefited from zakat and ushr. In the case of Sind, 7.8 per cent of the first income decile, 4.5 of the second, 1.1 per cent of the third, 0.06 per cent of the fourth and 2.0 per cent of the fifth income decile were beneficiaries. In NWFP a significant 7.6 percentage of the households received zakat and ushr. A large majority, 32.2 per cent of the first income decile, 9.4 per cent of the second, 4.5 per cent of the third, 1.3 per cent of the fourth and 2.4 per cent of the fifth income decile were beneficiaries.
Table 4
Proportion of Households Receiving Zakat & Ushr in the lowest 5 Income deciles (%)
1st 2nd 3rd 4th 5th Overall
Overall 18.1 3.6 1.8 1.5 1.6 2.7
Urban 16.5 3.7 1.7 0.7 0.4 1.4
Rural 18.5 3.6 1.9 1.8 2.0 3.2
Province
Punjab 16.9 1.9 1.5 1.8 1.2 2.4
Sind 7.8 4.5 1.1 0.6 2.0 1.2
NWFP 32.2 9.4 4.5 1.3 2.4 7.6
Baluchistan 12.4 1.4 - - 2.7 0.9
Sources: HIES, 1990/91.
Similarly, in the case of Baluchistan, 12.4 per cent of the 1st income decile and 1.4 per cent of the second income decile were beneficiaries. No beneficiaries were reported in the 3rd and 4th income deciles. However, in

Contribution of Zakat to Households' Income: The Case of Pakistan
179
the fifth income decile, 2.7 per cent out of the total households reported receiving some zakat and ushr.
The proportion of households lying in the fourth and fifth deciles are theoretically not deserving, especially when several households of the lowest income decile have only partially benefited. However, these transfers are very small. As the previous two Tables (3 and 4) show, overall, the funds are correctly targeted, but the coverage of the programme is not significantly large. This programme covers only 2.7 per cent of the total households.
8. CONTRIBUTION OF ZAKAT AND USHR: AVERAGE INCOME BY INCOME DECILE BY ZAKAT/USHR AND OTHER SOURCES
The average income by income decile is reported in Table 5. An attempt is made to break down the zakat and ushr receipts* from other income to get an idea of the relative magnitudes. On average, zakat and ushr contributed Rs. 415.5 to the average income of the lowest income decile in overall Pakistan, Rs. 434 in the urban areas and Rs. 411.7 in the rural areas of Pakistan. The average contribution of zakat and ushr to the average income of other income deciles was negligible in 1990/91. Among the provinces, the contribution of zakat and ushr to the average income of the households in the lowest income decile was found to be the highest in Punjab (Rs. 497.4) and the lowest in Sind (Rs. 161.5).
The average percentage share of zakat and ushr in the average disposable income by income decile is reported in Table 5. The data in this Table show that the zakat and ushr share in the total disposable income of the lowest income decile was about 38.55 per cent for Pakistan, 43.7 per cent for Punjab, 34.87 per cent for NWFP and 26.5 for Baluchistan and about 18 per cent in Sind. There was no significant contribution of zakat and ushr to the other income decile.
* Households Income and Expenditure Survey Data show that these transfers of zakat and ’ushr are in cash payment.

Journal of Economic Cooperation Among Islamic Countries
180
Table 5 Average Disposable Income Per Household Per Month by Income Decile by Zakat/Ushr and Other Sources
1st 2nd 3rd 4th 5th 6th 7th 8th 9th 10th Overall
Overall Income from Zakat & Ushr (ZU) 415.5 11.8 4.1 3.5 5.6 - - - - - 44.1 Other Income 662.2 1637.5 1956.8 2157.4 2535.9 2793.6 3062.8 3466.4 4147.6 8423.6 3083.6 Total 1077.7 1649.3 1960.9 2160.9 2541.5 2793.6 3062.8 3466.4 4147.6 8423.6 3127.7 Urban ZU 434.0 7.4 2.3 2.2 1.3 - - - - - 25.3 Other Income 688.9 1801.1 2187.2 2375.9 2674.1 3163.5 3264.0 3709.4 4183.5 8413.2 3644.5 Total 1122.9 1808.5 2189.5 2378.1 2675.4 3163.5 3264.0 3709.4 4183.5 8413.2 3669.8 Rural ZU 411.7 13.1 4.6 4.0 7.5 - - - - - 52.3 Other Income 656.6 1591.6 1884.5 2063.8 2477.3 2609.5 2950.7 3319.8 4129.5 8431.3 2837.4 Total 1068.3 1604.7 1889.1 2067.8 2484.8 2609.5 2950.7 3319.8 4129.5 8431.3 2889.7 Province Punjab ZU 497.4 8.6 2.1 4.3 6.3 - - - - - 53.3 Other Income 640.5 1585.3 1916.9 2075.8 2382.7 2553.0 2944.9 3347.1 4127.8 8742.4 3004.3 Total 1137.9 1593.9 1919.0 2080.1 2389.0 2553.0 2944.9 3347.1 4127.8 8742.4 3057.6 Sind ZU 161.5 7.6 1.1 0.6 4.3 - - - - - 12.4 Other Income 743.1 1827.9 2101.7 2374.7 2642.8 3298.1 3305.1 3560.2 4098.1 7840.7 3481.2 Total 904.6 1835.5 2102.8 2375.3 2647.1 3298.1 3305.1 3560.2 4098.1 7840.7 3493.6 NWFP ZU 358.9 27.3 17.0 4.4 2.3 - - - - - 64.1 Other Income 670.3 1646.0 1943,4 2326.0 3050.1 3023.9 3149.0 3844.2 4681.5 7841.0 2632.9 Total 1029.2 1673.3 1960.4 2330.4 3052.4 3023.9 3149.0 3844.2 4681.5 7841.0 2697.0 Baluchistan ZU 234.4 13.9 - - 20.2 - - - - - 14.0 Other Income 649.8 1682.1 1867.5 2173.3 2530.5 2915.0 3052.8 3737.6 3935.3 8492.5 3456.0 Total 884.2 1696.0 1867.5 2173.3 2550.7 2915.0 3052.8 3737.6 3935.3 8492.5 3470.0
Source: Estimates from HIES, 1990/91.

Contribution of Zakat to Households' Income: The Case of Pakistan
181
Table 6 Percentage share of zakat and ushr in the Average Disposable income by
income decile
1st 2nd 3rd 4th 5th 6th 7th 8th 9th 10th Overall
Overall 38.55 0.72 0.21 0.16 0.22 - - - - - 1.41
Urban 38.65 0.41 0.10 0.09 0.05 - - - - - 0.68
Rural 38.53 0.82 0.24 0.19 0.30 - - - - - 1.81
Province
Punjab 43.71 0.54 0.11 0.21 0.26 - - - - - 1.74
Sind 17.85 0.41 0.05 0.02 0.16 - - - - - 0.35
NWFP 34.87 1.63 0.87 0.19 0.07 - - - - - 2.38
Baluchistan 26.51 0.82 - - 0.79 - - - - - 0.40
Source: Calculated from Table 5.
9. CONCLUSION The Zakat and Ushr Programme, according to the estimates from HIES 1990/91, is correctly targeted. The lowest income decile gets maximum payments from the zakat and ushr transfers. Transfers were also made to the fourth and fifth income deciles. However, these transfers were insignificant.
Among the provinces, Sind gets a small share as compared to its population. The survey might not have been conducted in a proper way. This could be due to the increased data bias resulting from the disturbances in Sind.
Zakat and ushr covered 2.7 per cent of the total households in overall Pakistan. However, it covered 18.1 per cent of the households in the lowest income decile in Pakistan in 1990/91, 32.2 per cent in NWFP, about 17 per cent in Punjab and a low 7.89 per cent in Sind. This indicates that the disbursement of zakat and ushr is better organised in Punjab and NWFP. Zakat and ushr on average contributed 38.55 per cent of the total average disposable income of the lowest income decile.

Journal of Economic Cooperation Among Islamic Countries
182
Appendix Table 1 Share of Assets in Total Deduction of Zakat
Rs. in millions Name of Asset 1980-81 1981-82 1982-83 1983-84 1984-85 1985-86 1986-87 1987-88 1988-89 1989-90 1990-91 1991-92 1992-93 1993-94
Savings Bank Accounts 73.2 73.0 73.2 77.9 65.0 61.6 61.6 55.8 51.7 49.5 49.3 54.0 59.0 62.1
Notice Deposit Receipts 8.4 4.3 2.2 1.4 1.8 1.5 0.7 0.8 0.6 0.7 0.3 0.4 0.5 0.3 Fixed Deposit Receipts and Certificates 9.0 12.4 14.8 11.4 20.9 25.0 27.3 32.6 34.1 37.4 38.3 30.1 22.8 18.5 Savings Deposit
Certificates 2.7 3.3 3.4 4.2 5.9 5.4 3.8 4.7 6.1 5.2 4.2 5.5 6.1 6.7
NIT Units 2.3 2.2 1.3 103 1.7 1.7 1.5 1.3 1.9 0.1 2.4 3.6 3.5 3.5
ICP Mutual Funds 0.2 0.1 0.2 0.2 0.2 0.2 0.2 0.1 0.1 0.1 0.1 0.1 0.1 0.1
Government Securities 0.1 0.09 0.1 0.06 0.08 0.1 0.1 0.05 0.04 0.02 0.01 0.04 0.07 0.04
Shares and Debentures 2.9 2.8 2.9 2.3 2.7 2.7 3.0 2.6 3.3 3.3 3.6 4.1 5.4 5.8 Annuities ... ... ... ... ... ... ... ... ... ... ... ... ... ...
Life Insurance Policies 0.3 0.5 0.5 0.4 0.5 0.6 0.5 0.4 0.5 0.5 0.5 0.6 0.7 0.7
Provident Funds 0.6 1.3 1.1 0.7 1.1 1.2 1.3 1.5 1.7 3.2 1.3 1.5 1.8 2.1
Total 100.0 100.0 100.0 100.0 100.0 100.0 100.0 100.0 100.0 100.0 100.0 100.0 100.0 100.0
... : Negligible Source : Central Zakat Administration, (1994).

Contribution of Zakat to Households' Income: The Case of Pakistan
183
Appendix Table 2 Collection of Zakat (at constant prices of 1980-81) by Type of Asset
Rs. in millions Name of Asset 1980-81 1981-82 1982-83 1983-84 1984-85 1985-86 1986-87 1987-88 1988-89 1989-90 1990-91 1991-92 1992-93 1993-94
Savings Bank Accounts 618.15 601.99 653.12 920.32 657.92 687.30 717.31 740.12 694.98 705.21 674.23 665.94 641.81 640.11
Notice Deposit Receipts 70.89 35.93 19.97 17.42 18.33 16.72 8.63 11.07 8.49 9.47 4.65 5.43 5.73 3.54 Fixed Deposit Receipts and Certifcates 76.05 102.22 132.01 134.64 211.60 278.51 317.71 431.97 458.07 533.73 523.53 371.48 248.45 190.86 Savings Deposit
Certificates 22.87 27.24 30.39 49.10 60.00 60.66 44.77 62.29 81.66 74.66 57.85 67.91 66.25 69.35
NIT Units 19.64 17.83 11.29 15.05 16.82 18.99 17.68 17.47 25.64 1.44 32.28 44.24 38.28 35.78
ICP Mutual Funds 1.90 1.00 1.74 2.37 2.50 2.12 2.03 1.85 1.00 1.66 1.42 1.42 1.43 1.05
Government Securities 1.01 0.82 0.87 0.79 0.83 1.17 0.91 0.64 0.59 0.33 0.19 0.44 0.78 0.36
Shares and Debentures 25.15 23.31 26.05 27.72 27.35 29.85 33.61 34.32 44.28 46.80 49.18 50.74 58.38 59.58
Annuities 0.05 ... ... ... ... ... 0.07 0.13 0.58 ... ... ... 0.12 0.07
Life Insurance Policies 2.99 4.29 4.34 4.75 5.15 6.31 5.68 5.89 6.36 6.75 6.81 6.94 7.73 7.60
Provident Funds 5.55 10.51 9.55 8.71 10.75 14.01 15.79 19.27 22.81 45.19 17.58 18.33 19.48 21.76
Total 844.25 825.09 891.95 1180.10 1011.28 1115.67 1164.22 1324.98 1343.98 1425.27 1367.76 1232.94 1088.48 1030.17
Voluntarily paid zakat ... 1.46 0.87 0.79 1.36 1.25 0.98 1.54 2.06 1.94 2.74 3.69 3.15 2.68
Other receipts ... ... ... ... ... ... ... 0.19 1.06 0.44 0.29 0.09 0.70 653.40
Grand total receipts ... 826.55 892.82 1180.89 1012.65 1116.92 1165.20 1326.71 1347.10 1427.66 1370.79 1236.72 1092.33 1686.25
Source: Based on Table 3.1.

Journal of Economic Cooperation Among Islamic Countries
184
Appendix Table 3
Assessment and Collection of ’Ushr Rs. in millions
Year Assessment Collection % of Assessment
1982-83 179.62 179.32 99.78
1983-84 262.40 258.71 98.59
1984-85 271.47 261.04 96.16
1985-86 264.38 246.40 93.19
1986-87 251.48 225.43 89.64
1987-88 273.58 239.88 87.68
1988-89 245.86 177.04 72.00
1989-90 237.11 107.57 45.37
1990-91 207.88 121.65 56.29
1991-92 58.82 12.66 21.5
1992-93 67.65 11.88 17.60
1993-94 0.21 0.20 95.20
Source: Central Zakat Administration, “Zakat and Ushr System in Pakistan”, Government of Pakistan (1994) and Annual Report of State Bank of Pakistan (1994).

Contribution of Zakat to Households' Income: The Case of Pakistan
185
Appendix Table 4 Disbursements of Zakat from Local Zakat Committees
Rs. in million
Year
Subsistence Allowance at Current
Prices
Subsistence Allowance at Constant Prices of 1980-81
No. of beneficiaries
Rehabilitation Grants at Constant Prices of 1980-81
Rehabilitation Grants at Current Prices
No. of beneficiaries
Total Allowance at Current
Prices
Total Allowance at Constant Prices of 1980-81
Total Beneficiaries
1980-81 438.442 438.442 1289489 2.566 2.566 1934 441.008 441.008 1291423
1981-82 528.502 475.70 1287207 14.483 16.091 9214 544.593 490.683 1296421
1982-83 279.343 240.21 1175067 70.546 82.038 46753 361.381 310.756 1221820
1983-84 769.090 616.45 1245055 116.261 145.048 62983 914.318 732.711 1308038
1984-85 533.933 405.01 953016 73.003 96.241 45703 630.174 478.013 998719
1985-86 186.837 135.81 509627 115.398 158.753 113091 345.590 251.208 622718
1986-87 462.926 324.81 856289 299.635 427.040 201364 889.966 624.445 1057653
1987-88 349.270 230.55 1262129 299.062 453.050 310577 809.320 529.612 1572706
1988-89 320.225 191.48 926101 261.214 436.829 177312 757.054 452.694 1103413
1989-90 278.675 157.15 471273 141.885 251.606 96348 530.281 229.035 567621
1990-91 465.639 233.07 779003 203.247 406.047 204177 871.686 436.317 983180
1991-92 1120.528 511.68 1103745 161.511 353.695 107717 1474.223 673.191 1211462
1992-93 708.622 296.17 1532612 245.669 587.790 20562 1296.412 541.839 1738234 Source: Central Zakat Administration, Zakat and Ushr System of Pakistan, Ministry of Finance, Government of Pakistan, Islamabad.
1. Average beneficiaries per year 1.15 million 2. Average amount distributed per beneficiary Rs. 481.6 (at 1980-81 period) 3. Average number of rehabilitated beneficiaries Out of total 0.12 million

Journal of Economic Cooperation Among Islamic Countries
186
4. Average annual rehabilitated grant Rs.1266.4.
Appendix Table 4.A Trends in allowances and number of beneficiaries (1980-81 to 1992-93)
Variable Estimated % growth rate T-Statistics
Subsistence Allowance (SA) -3.94 -1.13
Beneficiaries of SA -1.89 -0.69
Rehabilitation Grant (RG) 26.24 3.73*
Beneficiaries of RG 28.12 3.98
Total Allowance 0.82 0.30
Total Beneficiaries -0.44 -0.17
Note : * Significant at 1 percent. Source : Calculated from Appendix Table 3.