Embed Size (px)
Citation preview
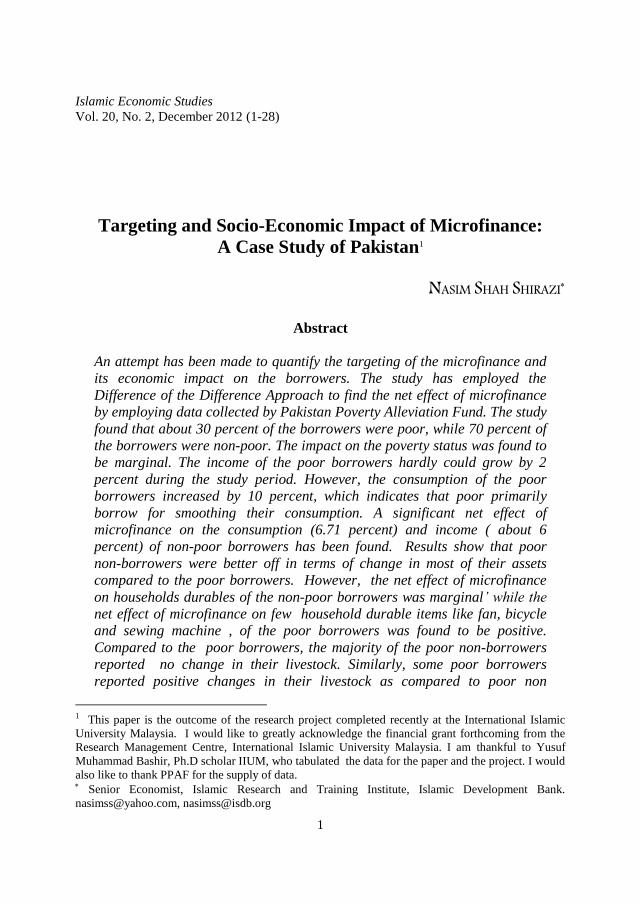
Islamic Economic Studies
Vol. 20, No. 2, December 2012 (1-28)
1
Targeting and Socio-Economic Impact of Microfinance:
A Case Study of Pakistan1
NASIM SHAH SHIRAZI
Abstract
An attempt has been made to quantify the targeting of the microfinance and
its economic impact on the borrowers. The study has employed the
Difference of the Difference Approach to find the net effect of microfinance
by employing data collected by Pakistan Poverty Alleviation Fund. The study
found that about 30 percent of the borrowers were poor, while 70 percent of
the borrowers were non-poor. The impact on the poverty status was found to
be marginal. The income of the poor borrowers hardly could grow by 2
percent during the study period. However, the consumption of the poor
borrowers increased by 10 percent, which indicates that poor primarily
borrow for smoothing their consumption. A significant net effect of
microfinance on the consumption (6.71 percent) and income ( about 6
percent) of non-poor borrowers has been found. Results show that poor
non-borrowers were better off in terms of change in most of their assets
compared to the poor borrowers. However, the net effect of microfinance
on households durables of the non-poor borrowers was marginal’ while the
net effect of microfinance on few household durable items like fan, bicycle
and sewing machine , of the poor borrowers was found to be positive.
Compared to the poor borrowers, the majority of the poor non-borrowers
reported no change in their livestock. Similarly, some poor borrowers
reported positive changes in their livestock as compared to poor non
1 This paper is the outcome of the research project completed recently at the International Islamic
University Malaysia. I would like to greatly acknowledge the financial grant forthcoming from the
Research Management Centre, International Islamic University Malaysia. I am thankful to Yusuf
Muhammad Bashir, Ph.D scholar IIUM, who tabulated the data for the paper and the project. I would
also like to thank PPAF for the supply of data. Senior Economist, Islamic Research and Training Institute, Islamic Development Bank.
2 Islamic Economic Studies, Vol. 20 No. 2
borrowers during the study period, which shows positive net impact of
microcredit on the livestock of the poor borrowers. Expenditures on social
and other miscellaneous items were found to be very small.
Key Words: Microfinance, targeting of microfinance, Pakistan Poverty Alleviation
Fund, Socio-economic Impact, Microfinance and the poor
JEL Classification: G21, O15
1. Introduction
The system of microfinance has been designed to give low income communities
quick and easy access to socio-economic services, and providing opportunities for
self-employment and thus a chance to uplift themselves out of poverty. The non-
availability of the funds to the poor is considered the major constraint for getting
beneficial opportunities. If the funds are made available to the poor then it is
expected that they can change their destiny.
The microfinance industry has been growing rapidly in the developing countries
especially after the experience of the Grameen bank in Bangladesh. The most
recent entrants to the microfinance industry are commercial banks. This modality
includes many variants: transformed microfinance NGOs, government owned
development banks, reformed state banks and diversification into microfinance by
existing commercial banks. Even big multinational banks such as ABN Amro,
Citibank and Deutche Bank are now involved in microfinance (Montgomery and
Weiss, 2005). Moreover, big financial institutions, such as World Bank and the
European bank for Reconstruction and Development, are also helping and backing
the microfinance industry (The Economist, 2007).
Just like in other developing countries, microfinance institutions (MFIs) have
been growing very fast in Pakistan. More than 18 different institutions are working
for uplifting the poor masses. These include micro finance banks, banks with
microfinance as separate product line; institutions specialized in rural support
programs, such as National Rural Support program (NRSP) and Punjab Rural
Support Program (PRSP)2, and private NGOs. Moreover, an independent
professionally managed unit, Pakistan Poverty Alleviation Fund (PPAF), has been
established in 2000 for providing development support to civil society
2 Each province has its own rural support program, such as Sindh Rural Support program (SRSP),
Sarhad (now Khaiber Pukhtoonkhawa) Rural Support Program (SRSP), and Baluchistan Rural
Support Program (BRSP).
Nasim Shah Shirazi: Targeting and Socio-Economic Impact of Microfinance 3
organizations in the country. The target population of the PPAF project
3 are the
poor and disadvantaged rural and urban communities. The PPAF gives microcredit
to group-based organizations called Community Organizations (COs) through its
participatory organizations (POs). The group based procedure of loans4 serves as a
social collateral. Peer pressure is used to monitor and enforce contracts and screen
the credential of the borrowers.
Various aspects of microfinance and microenterprises have been discussed in
the literature. Few empirical studies have quantified the impact of microfinance on
poverty, some have focused on the relation between microfinance and socio-
economic indicators, few concentrated on the sustainability and profitability, and
few others estimated the return to capital invested in the micro enterprises (see
Shirazi, 2008; Shirazi and Khan, 2009). The literature on targeting of the
microfinance and the economic impact is limited (see section 2) with reference to
Pakistan. Only Gallup Pakistan (2005) has estimated changes in income,
consumption, assets and other social variables of the recipients of the microfinance
in Pakistan. However, the study did not touch upon the issue of targeting of the
funds and also did not decompose the borrowers in the category of poor and non-
poor. Therefore this study will quantify the socio-economic impact of
microfinance, if any, with reference to Pakistan. More specifically, the study will
focus on impact of microfinance on the various income groups including poor
borrowers, change in their income and consumption, and change of their assets, if
any. In addition to that study will also explore the targeting of the funds i.e. who
gets microfinance. The study will utilize the data collected by PPAF and employ
Difference of the Difference Approach for the purpose of analysis.
After giving brief introduction in section 1, section 2 is devoted for review of
the relevant literature. Section 3 discusses the methodology and data, while section
4 provides the data analysis. Section 5 concludes the paper with some policy
recommendations.
3 PPAF Provides financial assistance to community organizations through four windows including :i.
Lines of credit for expansion of poverty targeted Microcredit/enterprise development programs, ii
Grants and Loans for community physical infrastructure on a cost-sharing basis, iii Grants for Health
and Education on a cost sharing basis and ,iv Grants to strengthen and build the institutional capacity
of partner organizations and communities. However, our analysis are limited to the microfinance due
to the data constraint. 4 The average loan size was reported to be around Rs.11, 445 ranging from Rs.1000 to Rs.300, 000,
while the average loan size desired by the borrowers was around Rs.24, 803 (see Gallup, 2005).
4 Islamic Economic Studies, Vol. 20 No. 2
2. Review of the Literature
Various aspects of microfinance and microenterprises have been discussed in
the literature. Few empirical studies have quantified the impact of microfinance on
poverty, some have focused on the relation between microfinance and socio-
economic indicators, few concentrated on the sustainability and profitability, and
few others estimated the return to capital invested in the micro enterprises (see
Shirazi 2008). Microfinance surely bring some changes, which could be positive
or negative on individuals, households and institutions ( see Cheston et al,1999 and
Baker, 2000). Some studies have been focused on the growth of income and
expenditures of the borrowers due to microfinance. Hulme and Mosley (1996), for
instance, based on the counter factual combined approach, analyzed the impact of
microfinance on poverty alleviation using sample data for Indonesia, India,
Bangladesh and Sri Lanka and found that growth of income of borrowers always
exceeds that of control group and the increase was larger for better-off borrowers.
Similarly MkNelly et al. (1996) found positive benefits for the borrowers.
Khandker (1998), based on double difference comparison between eligible and
ineligible households and between program and control villages, focusing on
Grameen, Bangladesh and Bangladesh Rural Advancement Committee (BRAC),
found that microcredit alleviated poverty up to 5 percent annually. Furthermore, it
was found, that a loan of 100 Taka to a female borrower, after it is repaid, allows a
net consumption increase of 18 Taka. For Thailand village banks, Coleman (1999),
using the same approach as that of Khandker (1998), found no evidence of any
impact of micro finance. Another study by Coleman (2004), found that programs
are not reaching the poor as much as they reach relatively wealthy people.
Khandker (2003), found that microfinance helps to reduce extreme poverty much
more than moderate poverty i.e. 18 percentage points as compared with 8.5
percentage points over seven years. Welfare impact is also positive for all
households, including non-participants, as there were spillover effects.
Swain (2004) examines empirical evidence from literature to see the goodness
of microfinance as a good poverty alleviation strategy. The evidence shows that
microfinance influence is much felt by households at the brink of poverty line,
instead of the core poor. Microfinance also reduces vulnerability and smoothing
consumption of poor households. Navajas et al. (2000) examine the coverage of
five MFIs in Bolivia and discover that majority of the borrowers were close to the
poverty line. They also find that group lenders had more depth of outreach than
individual lenders, urban poorest were more likely borrowers and rural borrowers
were among the poorest of all clients. Also, Servon (1997) studies three MFIs in
the US and finds that they served those at the margin of the mainstream economy,
Nasim Shah Shirazi: Targeting and Socio-Economic Impact of Microfinance 5
not the very poor. Barnes et al (2001) examining MFI in Uganda found positive
impact on enterprise level, increased in assets and net revenue, reduced financial
vulnerability and increased value, skill and education. However, Schreiner (1999)
finds that microfinance is not an effective tool for poverty reduction in US because
of weak social cohesion, though it may move more people from welfare to self
employment.
Mosley (2001), using data from Latin American countries, found a positive
growth of income and assets of the borrowers than control group. The growth of
income of the better-off borrowers was larger. However, he could not find any
evidence of impact of microfinance on extreme poverty. Banegas et al. (2002),
employing Logit model, found positive impact on the income of borrowers. Gallup
Pakistan (2005), using counter factual , combined approach, found positive impact
of PPAF microfinance on the consumption, income and assets of the borrowers.
Shirazi and Khan (2009) employed Counter-factual “Combined approach” and
found that Micro credit has reduced the poverty about 3 percentage points on
average in Pakistan during 2003/4- 2004/5. Waqar et al (2008), estimated the long
term effect of credit on growth and poverty in Pakistan, found out that agricultural
credit has a positive impact on the Gross Domestic Product and its effect was more
pronounced on the Agriculture GDP. Furthermore impact of agricultural credit in
reducing poverty was significant both in the short run and long run Montgomery
(2005) found a positive impact of Khushhali bank of Pakistan microfinance lending
on the income, empowerment, health and education of the poor. However, he did
not find any impact on consumption expenditure of the very poor. His study, in
general, shows that even poorest of the poor benefited from the Kushhali Bank’s
microfinance program. Saboor et al. (2009) estimated the impact of credit on the
income and production level of small farmers using a randomly collected data from
Rawalpindi District in Pakistan. The study reveals that for small farmers, credit
was not a profiting activity. However, all respondents argued that their
expenditures were increasing and they concluded that the credit system should
further be improved so that the full benefits could be reaped both in the crop and
livestock sectors and miss-utilization of credit by farmers could be minimized. Arif
(2006) reviewed poverty reduction programs in Pakistan. He found that various
criterion have been used for targeting the poor by different organizations. His
review portrays that microfinance organizations use a loose criterion to identify
poor and non-poor households. He further pointed out that “ evidence on the
targeting efficiency of microfinance is slim”. Shirazi (2008) estimated that micro
credit has increased the return to investment of the borrowers. In his study, using
Pakistan Gallop data, 2005, he found that micro credit has increased the returns to
investment of 79 percent of the borrowers in the range of 15 to 89 per cent per
6 Islamic Economic Studies, Vol. 20 No. 2
year. Furthermore, the average weighted rate of return to investment was 4.57 per
cent per month or uncompounded rate of 54.89 per year. He found that female
borrowers were making more return than their male counterparts.
Few studies, which have been summarized in Rahman (2004), have focused on
the impact of microcredit on employment and increase in income and expenditure
of the borrowers in Bangladesh. Results of these studies show that income of the
recipients of micro credit has increased in the range of 8-40 percent. Micro credit
has been successful in creating a positive impact on employment. Furthermore,
Studies show that microcredit has positively contributed to the social investment,
school enrolment, social empowerment, girls schooling and women’s non-land
asset. Some studies (Choudhury and Bhuiya, 2001; Barnes et.al, 2001; Chen and
Snodgrass, 2001) have identified significant positive effects of microfinance on the
human resource development among the participants in various countries. Chowdry
and Alam (2007) found that the participation of a household in the micro credit
program of the Grameen Bank increases consumption of that household
significantly. However, there is non-linearity in the increasing trend in
consumption of participating households. The consumption level goes up gradually
with the increase in the membership duration up to five years of membership, but
the growth rate starts declining after that period of membership. Similarly Naveed
(1994), Amin et.al (1998) and Hashemi et.al (1996) found positive impact of
microfinance on the women empowerment and welfare. Many impact studies have
been made on Grameen bank from different perspectives, which conclude that
Grameen Bank’s members have been better off in terms of wide range of economic
and social indicators including increased income, improved nutrition, better food
intake, better consumption on clothing, better housing, lower child mortality, lower
birth rate, higher adoption of family-planning practices, better health care, better
access to education for the children, empowerment of women participation in
social and political activities (see Yunus, 2004). Literature also highlight the
beneficial role of microfinance for the poor by smoothing their consumption
expenditure, increasing income and savings and diversify their income sources (see
Dichter, 1999; Panjaitan et.al, 1999; Remenyi and Quinones Jr., 2000; Morduch,
1998, Khandker, 2003; McKerman, 2002 and Simonwtz, 2002). Wydick (1999)
Examining the effect of microenterprise lending on child schooling in Guatemala
using logistic regression found that access to credit increases the schooling
investment on child and reduces the likelihood of withdrawing children from
school to provide family labour.
Although the main objective of the microfinance is to make the funds available
for investment in micro enterprises and thus lift the poor people out from poverty
Nasim Shah Shirazi: Targeting and Socio-Economic Impact of Microfinance 7
and promoting growth, Dichter (2007) casts doubt and says that “recent experience
and the economic history of rich countries, however, suggest that these
expectations are unrealistic. Most people, poor or otherwise, are not entrepreneurs,
so there is little reason to think that mass credit would in general lead to viable
business start-ups.” Also not all lending programs have been successful. Fifty
branches of two major MFIs in Krishna district were closed down by the
authorities in Andra Pradesh as a result of allegation of charging interest and forced
loan recovery (Shylendra, 2006). Credit at certain time may be disempowering,
leading to increase tension within the family (Goetz and Sen Gupta, 1996).
Researchers have found borrowers starving themselves to meet repayments and
sometimes experienced the disgrace of losing their asset as collateral and loss of
self-pride and even sleep as a result of worry on finding money to meet next
installment (Copestake, 2002:752). Researchers have also queried group lending.
Group lending can be costly to implement, with high default rate, insufficient
number of borrowers in a group and perpetual reliance on subsidies (Bhatt and
Tang, 2001).
Islamic Microfinance
It has been pointed out that traditional microfinance is reaching and benefiting
more to better off than the poor. It is fact that traditional microfinance has been
growing rapidly in third world countries, but this is also fact that Islamic
microfinance has not got its momentum. Some Islamic microfinance institutions
are working in some countries, but still these are in infancy stage, and weak in
terms of resource and coverage.
Regarding Islamic microfinance in Pakistan, very few initiatives have been
undertaken with very little coverage. Only a few NGOs operate on Islamic
principles. The visible examples of Islamic microfinance in Pakistan can be
counted as Islamic Relief Pakistan (IRP), Akhuwat, Karakoram Cooperative Bank
(KCB), National Rural Support Program and Muslim Aid. All these use
Mur ba ah as a mode of finance except Akhuwat, which provides interest free
loan (Qar -e- asanah). Akhtar et. al (2009) reported that Akhuwat is providing
interest free loans for all poor (including the extreme poor) and helping them to get
out of poverty. However, their study finds declining growth of loan portfolio with
the sharp decline of equity growth over the last five years, which will constraint the
financial stability in the future. To overcome this problem, they suggested
integration of Islamic microfinance with NGOs, Non-profit Organizations (NPOs),
Zak t, Awq f and with Tak ful as well as with professional training and capacity
building institutions of Pakistan to provide Islamic Micro financial services to the
8 Islamic Economic Studies, Vol. 20 No. 2
poorest of the poor under one roof. On the other side Rural Development Scheme
(RDS) of Islamic Bank Bangladesh Limited (IBBL) has not only been treated as a
sustainable MFI in the rural development and poverty alleviation of Bangladesh
with a short span of time of its establishment but also successful in increasing the
household income, productivity of crops and livestock, expenditure, and
employment (Parveen, 2009; Rehman and Fariduddin, 2010). An important study
has been conducted by Obaidullah (2008) with detailed case studies of RDS of
IBBL, the KOSGEB of Turkey and the linkage model of Bank Indonesia. The RDS
has been successful by using Shar ah compliant model. He observed that RDS has
been using bay -mu’ajjal as the only mode of finance, and it needs diversification
in the use of other Shar ah compliant models. The author suggested that the IDB
members countries may learn and replicate the success of the KOSGEB model for
growth oriented enterprises and the Bank Indonesia linkage model for the provision
of microfinance especially Shar ah compliant microfinance.
The general picture that emerges from the above review of literature is that
opinion differs on the real impact of microfinance. Most of the studies are related
with the developing countries and specially Bangladesh. The literature on targeting
of the microfinance and the economic impact is limited with reference to Pakistan.
Therefore, this study is devoted for the purpose.
3. Methodology and Data Set
3.1. Methodology
In this study a counter-factual “Combined approach” has been employed to
study the economic impact of PPAF micro credit on status of the households. This
approach combines the “with-without approach” and the “before–after approach”.
The “with–without approach” provides information of the status of borrowers
(target group) and compares it with the status of non–borrowers (control group).
The “before–after” approach makes a comparison of the change in the status of
group before borrowing and after borrowing for the time period in which the
borrowers benefited. There are several other factors that affect the income,
consumption and assets of all households overtime irrespective of whether they
borrowed or otherwise. This methodology will enable us to capture the net impact
of microfinance, and to isolate the influence of other factors on the income,
consumption and assets etc. ,if any, of the borrowers.
The respondents have been decomposed into two groups, poor and non poor, by
using the official poverty lines. The purpose of decomposing is to analyze and find
Nasim Shah Shirazi: Targeting and Socio-Economic Impact of Microfinance 9
which category of the borrowers, the poor or rich, are in majority. If the poor are in
majority then the microfinance is reaching to the target population, otherwise rich
may be getting benefits of the microfinance. We have used the country official
poverty line of Rs.878.64 per adult equivalent per month for the year 2004-05 and
the same poverty line has been deflated by Core inflation to get the poverty line of
Rs.838.22 for the year 2003-04.
More specifically the following formula has been used to find the net impact of
micro credit on poverty alleviation.
P*= (Pbt1- Pbt0) – (Pnbt1- Pnbto)
Where
P*: Net impact of micro credit on poverty status of borrower households
Pbt1 is the poverty status of the borrower households with current income level,
Pbt0 is the poverty status of the borrower households with previous income level,
Pnbt1 is the poverty status of the Non- borrower household with current income
level and
Pnbto is the poverty status of the non-borrower household with previous income
level,
‘t1’ represents the duration from Jan 2004 to Jan 2005 and ‘t0’ stands for the
duration from Jan 2003 to Jan 2004.
Moreover, the same procedure has been employed to find the net impact of
microcredit on income, expenditure, assets and other social indicators of both the
borrower groups- the poor and the non-poor.
3.2. Data Source
We have utilized the data collected by PPAF. Gallup Pakistan (2005) gathered
quantitative data from more than 3000 households, covering all provinces of
Pakistan, of which more than 1500 were borrowers and the rest were non
borrowers (control group). Interviewed were conducted in 114 community
organizations from 23 participatory organizations. Data were also collected on the
socio-economic variables. Respondents were asked questions about their current
and past year’s income, consumptions and assets in addition to many other
variables related to different aspects of sample households. Details of the
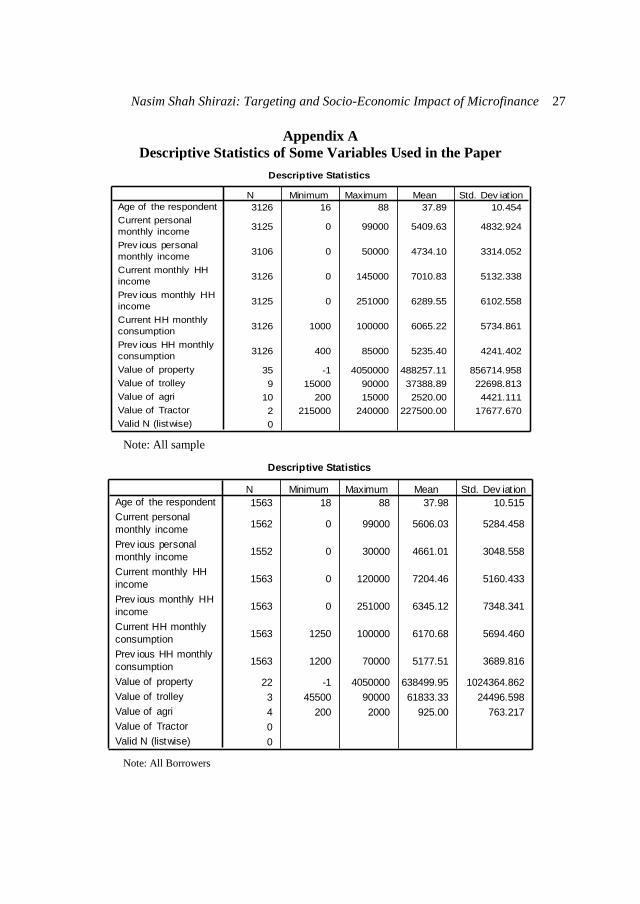
quantitative variables used in the study are given in Appendix A.
10 Islamic Economic Studies, Vol. 20 No. 2
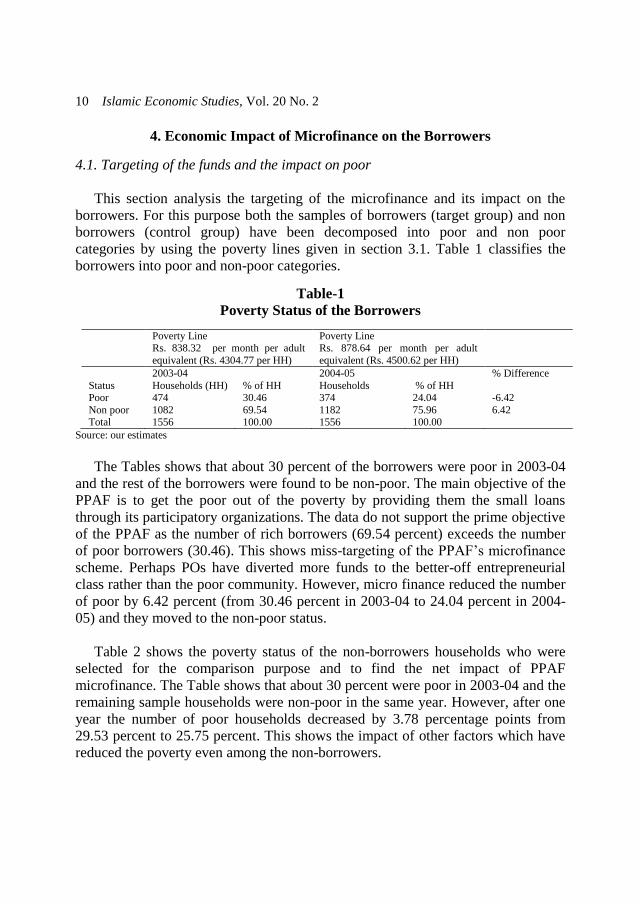
4. Economic Impact of Microfinance on the Borrowers
4.1. Targeting of the funds and the impact on poor
This section analysis the targeting of the microfinance and its impact on the
borrowers. For this purpose both the samples of borrowers (target group) and non
borrowers (control group) have been decomposed into poor and non poor
categories by using the poverty lines given in section 3.1. Table 1 classifies the
borrowers into poor and non-poor categories.
Table-1
Poverty Status of the Borrowers
Poverty Line Rs. 838.32 per month per adult
equivalent (Rs. 4304.77 per HH)
Poverty Line Rs. 878.64 per month per adult
equivalent (Rs. 4500.62 per HH)
2003-04 2004-05 % Difference
Status Households (HH) % of HH Households % of HH Poor 474 30.46 374 24.04 -6.42
Non poor 1082 69.54 1182 75.96 6.42 Total 1556 100.00 1556 100.00
Source: our estimates
The Tables shows that about 30 percent of the borrowers were poor in 2003-04
and the rest of the borrowers were found to be non-poor. The main objective of the
PPAF is to get the poor out of the poverty by providing them the small loans
through its participatory organizations. The data do not support the prime objective
of the PPAF as the number of rich borrowers (69.54 percent) exceeds the number
of poor borrowers (30.46). This shows miss-targeting of the PPAF’s microfinance
scheme. Perhaps POs have diverted more funds to the better-off entrepreneurial
class rather than the poor community. However, micro finance reduced the number
of poor by 6.42 percent (from 30.46 percent in 2003-04 to 24.04 percent in 2004-
05) and they moved to the non-poor status.
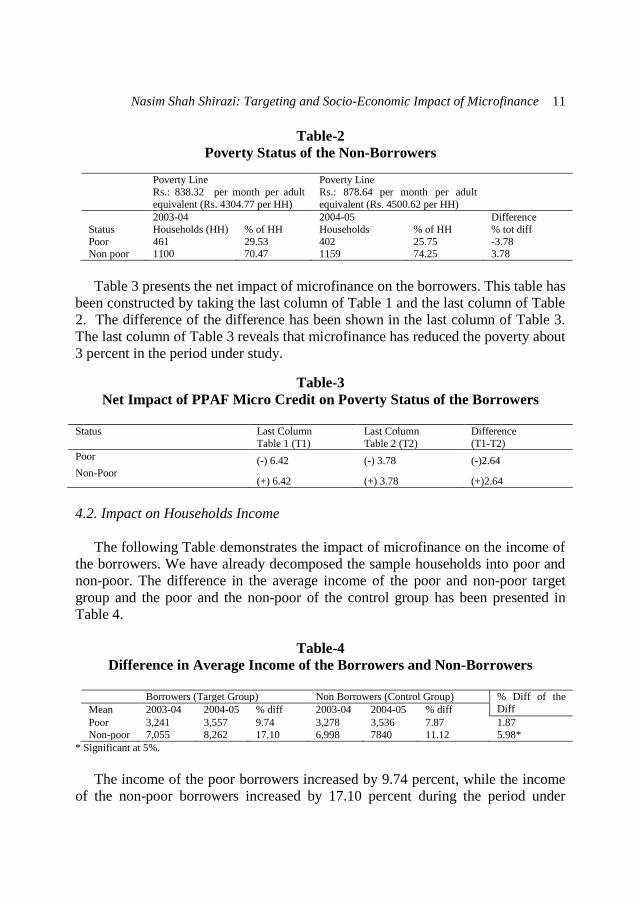
Table 2 shows the poverty status of the non-borrowers households who were
selected for the comparison purpose and to find the net impact of PPAF
microfinance. The Table shows that about 30 percent were poor in 2003-04 and the
remaining sample households were non-poor in the same year. However, after one
year the number of poor households decreased by 3.78 percentage points from
29.53 percent to 25.75 percent. This shows the impact of other factors which have
reduced the poverty even among the non-borrowers.
Nasim Shah Shirazi: Targeting and Socio-Economic Impact of Microfinance 11
Table-2
Poverty Status of the Non-Borrowers
Poverty Line
Rs.: 838.32 per month per adult
equivalent (Rs. 4304.77 per HH)
Poverty Line
Rs.: 878.64 per month per adult
equivalent (Rs. 4500.62 per HH)
2003-04 2004-05 Difference
Status Households (HH) % of HH Households % of HH % tot diff
Poor 461 29.53 402 25.75 -3.78
Non poor 1100 70.47 1159 74.25 3.78
Table 3 presents the net impact of microfinance on the borrowers. This table has
been constructed by taking the last column of Table 1 and the last column of Table
2. The difference of the difference has been shown in the last column of Table 3.
The last column of Table 3 reveals that microfinance has reduced the poverty about
3 percent in the period under study.
Table-3
Net Impact of PPAF Micro Credit on Poverty Status of the Borrowers
4.2. Impact on Households Income
The following Table demonstrates the impact of microfinance on the income of
the borrowers. We have already decomposed the sample households into poor and
non-poor. The difference in the average income of the poor and non-poor target
group and the poor and the non-poor of the control group has been presented in
Table 4.
Table-4
Difference in Average Income of the Borrowers and Non-Borrowers
Borrowers (Target Group) Non Borrowers (Control Group) % Diff of the
Diff Mean 2003-04 2004-05 % diff 2003-04 2004-05 % diff
Poor 3,241 3,557 9.74 3,278 3,536 7.87 1.87
Non-poor 7,055 8,262 17.10 6,998 7840 11.12 5.98*
* Significant at 5%.
The income of the poor borrowers increased by 9.74 percent, while the income
of the non-poor borrowers increased by 17.10 percent during the period under
Status Last Column
Table 1 (T1)
Last Column
Table 2 (T2)
Difference
(T1-T2)
Poor (-) 6.42 (-) 3.78 (-)2.64
Non-Poor (+) 6.42 (+) 3.78 (+)2.64
12 Islamic Economic Studies, Vol. 20 No. 2
study. Similarly the income of the poor non-borrowers increased by 7.87 percent
while that of non-poor non-borrowers’ income increased by 11.12 percent over the
same period. The last column of the Table reports the net effect of the microfinance
on the income of the borrowers, which is about two percent (1.87 percent). This
increase is marginal and insignificant. However, the net effect of microfinance on
the income of the non-poor was about 6 percent and found to be statistically
significant.
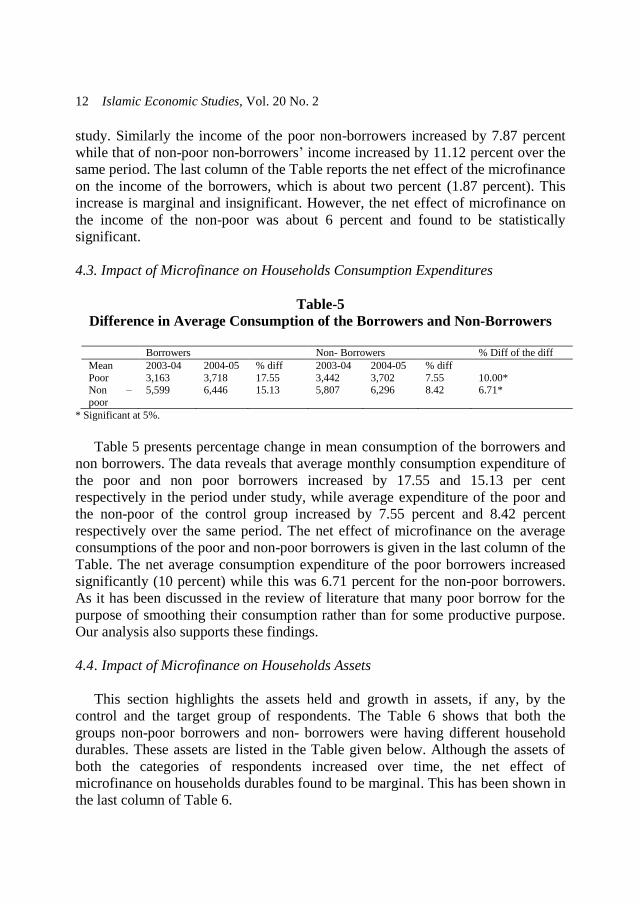
4.3. Impact of Microfinance on Households Consumption Expenditures
Table-5
Difference in Average Consumption of the Borrowers and Non-Borrowers
Borrowers Non- Borrowers % Diff of the diff
Mean 2003-04 2004-05 % diff 2003-04 2004-05 % diff
Poor 3,163 3,718 17.55 3,442 3,702 7.55 10.00* Non –
poor
5,599 6,446 15.13 5,807 6,296 8.42 6.71*
* Significant at 5%.
Table 5 presents percentage change in mean consumption of the borrowers and
non borrowers. The data reveals that average monthly consumption expenditure of
the poor and non poor borrowers increased by 17.55 and 15.13 per cent
respectively in the period under study, while average expenditure of the poor and
the non-poor of the control group increased by 7.55 percent and 8.42 percent
respectively over the same period. The net effect of microfinance on the average
consumptions of the poor and non-poor borrowers is given in the last column of the
Table. The net average consumption expenditure of the poor borrowers increased
significantly (10 percent) while this was 6.71 percent for the non-poor borrowers.
As it has been discussed in the review of literature that many poor borrow for the
purpose of smoothing their consumption rather than for some productive purpose.
Our analysis also supports these findings.
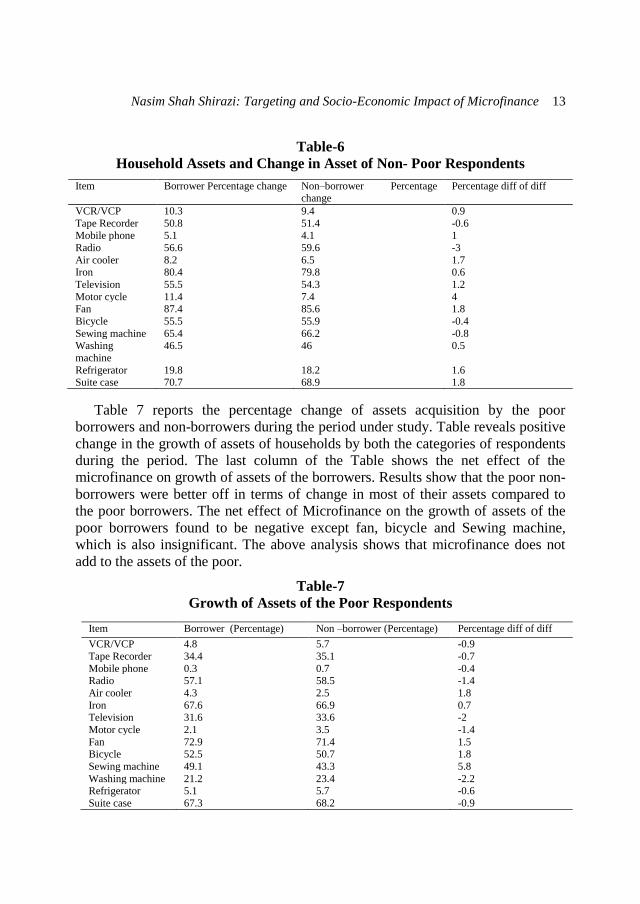
4.4 . Impact of Microfinance on Households Assets
This section highlights the assets held and growth in assets, if any, by the
control and the target group of respondents. The Table 6 shows that both the
groups non-poor borrowers and non- borrowers were having different household
durables. These assets are listed in the Table given below. Although the assets of
both the categories of respondents increased over time, the net effect of
microfinance on households durables found to be marginal. This has been shown in
the last column of Table 6.
Nasim Shah Shirazi: Targeting and Socio-Economic Impact of Microfinance 13
Table-6
Household Assets and Change in Asset of Non- Poor Respondents
Item Borrower Percentage change Non–borrower Percentage change
Percentage diff of diff
VCR/VCP 10.3 9.4 0.9
Tape Recorder 50.8 51.4 -0.6 Mobile phone 5.1 4.1 1
Radio 56.6 59.6 -3
Air cooler 8.2 6.5 1.7 Iron 80.4 79.8 0.6
Television 55.5 54.3 1.2
Motor cycle 11.4 7.4 4 Fan 87.4 85.6 1.8
Bicycle 55.5 55.9 -0.4
Sewing machine 65.4 66.2 -0.8 Washing
machine
46.5 46 0.5
Refrigerator 19.8 18.2 1.6 Suite case 70.7 68.9 1.8
Table 7 reports the percentage change of assets acquisition by the poor
borrowers and non-borrowers during the period under study. Table reveals positive
change in the growth of assets of households by both the categories of respondents
during the period. The last column of the Table shows the net effect of the
microfinance on growth of assets of the borrowers. Results show that the poor non-
borrowers were better off in terms of change in most of their assets compared to
the poor borrowers. The net effect of Microfinance on the growth of assets of the
poor borrowers found to be negative except fan, bicycle and Sewing machine,
which is also insignificant. The above analysis shows that microfinance does not
add to the assets of the poor.
Table-7
Growth of Assets of the Poor Respondents
Item Borrower (Percentage) Non –borrower (Percentage) Percentage diff of diff
VCR/VCP 4.8 5.7 -0.9
Tape Recorder 34.4 35.1 -0.7
Mobile phone 0.3 0.7 -0.4 Radio 57.1 58.5 -1.4
Air cooler 4.3 2.5 1.8
Iron 67.6 66.9 0.7 Television 31.6 33.6 -2
Motor cycle 2.1 3.5 -1.4
Fan 72.9 71.4 1.5 Bicycle 52.5 50.7 1.8
Sewing machine 49.1 43.3 5.8
Washing machine 21.2 23.4 -2.2 Refrigerator 5.1 5.7 -0.6
Suite case 67.3 68.2 -0.9
14 Islamic Economic Studies, Vol. 20 No. 2
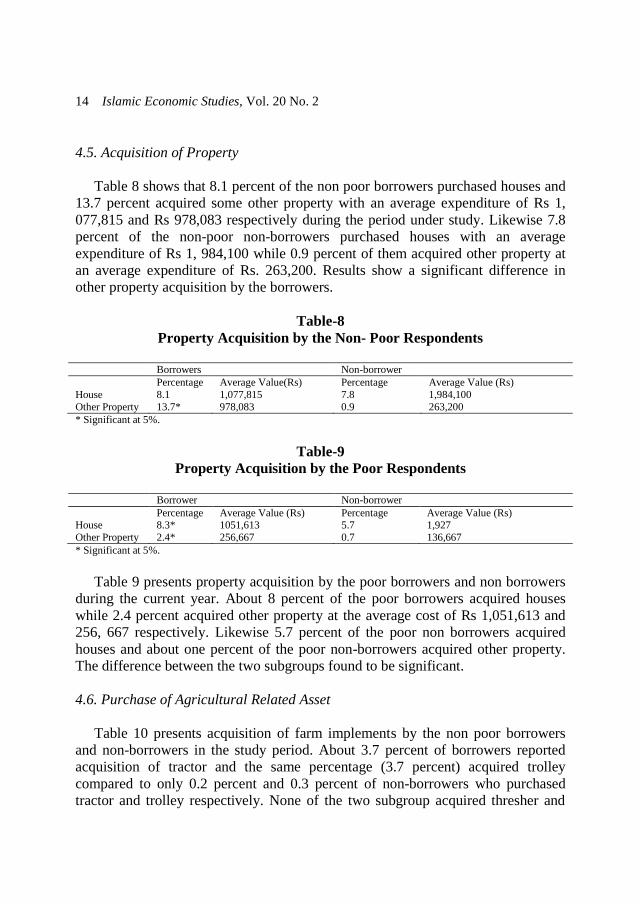
4.5. Acquisition of Property
Table 8 shows that 8.1 percent of the non poor borrowers purchased houses and
13.7 percent acquired some other property with an average expenditure of Rs 1,
077,815 and Rs 978,083 respectively during the period under study. Likewise 7.8
percent of the non-poor non-borrowers purchased houses with an average
expenditure of Rs 1, 984,100 while 0.9 percent of them acquired other property at
an average expenditure of Rs. 263,200. Results show a significant difference in
other property acquisition by the borrowers.
Table-8
Property Acquisition by the Non- Poor Respondents
Borrowers Non-borrower
Percentage Average Value(Rs) Percentage Average Value (Rs)
House 8.1 1,077,815 7.8 1,984,100
Other Property 13.7* 978,083 0.9 263,200
* Significant at 5%.
Table-9
Property Acquisition by the Poor Respondents
Borrower Non-borrower
Percentage Average Value (Rs) Percentage Average Value (Rs) House 8.3* 1051,613 5.7 1,927
Other Property 2.4* 256,667 0.7 136,667
* Significant at 5%.
Table 9 presents property acquisition by the poor borrowers and non borrowers
during the current year. About 8 percent of the poor borrowers acquired houses
while 2.4 percent acquired other property at the average cost of Rs 1,051,613 and
256, 667 respectively. Likewise 5.7 percent of the poor non borrowers acquired
houses and about one percent of the poor non-borrowers acquired other property.
The difference between the two subgroups found to be significant.
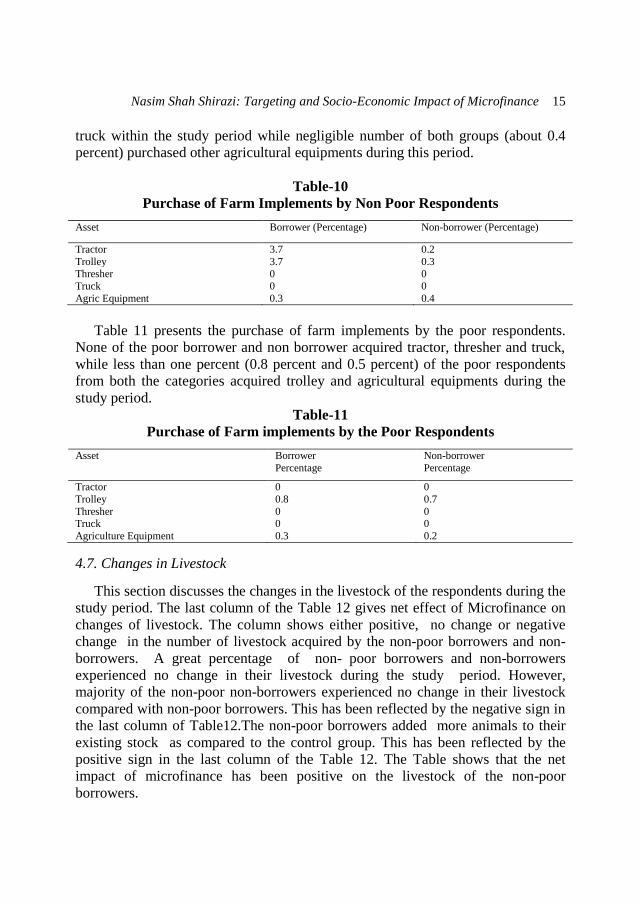
4.6. Purchase of Agricultural Related Asset
Table 10 presents acquisition of farm implements by the non poor borrowers
and non-borrowers in the study period. About 3.7 percent of borrowers reported
acquisition of tractor and the same percentage (3.7 percent) acquired trolley
compared to only 0.2 percent and 0.3 percent of non-borrowers who purchased
tractor and trolley respectively. None of the two subgroup acquired thresher and
Nasim Shah Shirazi: Targeting and Socio-Economic Impact of Microfinance 15
truck within the study period while negligible number of both groups (about 0.4
percent) purchased other agricultural equipments during this period.
Table-10
Purchase of Farm Implements by Non Poor Respondents
Asset Borrower (Percentage) Non-borrower (Percentage)
Tractor 3.7 0.2
Trolley 3.7 0.3 Thresher 0 0
Truck 0 0
Agric Equipment 0.3 0.4
Table 11 presents the purchase of farm implements by the poor respondents.
None of the poor borrower and non borrower acquired tractor, thresher and truck,
while less than one percent (0.8 percent and 0.5 percent) of the poor respondents
from both the categories acquired trolley and agricultural equipments during the
study period.
Table-11
Purchase of Farm implements by the Poor Respondents
Asset Borrower
Percentage
Non-borrower
Percentage
Tractor 0 0
Trolley 0.8 0.7
Thresher 0 0 Truck 0 0
Agriculture Equipment 0.3 0.2
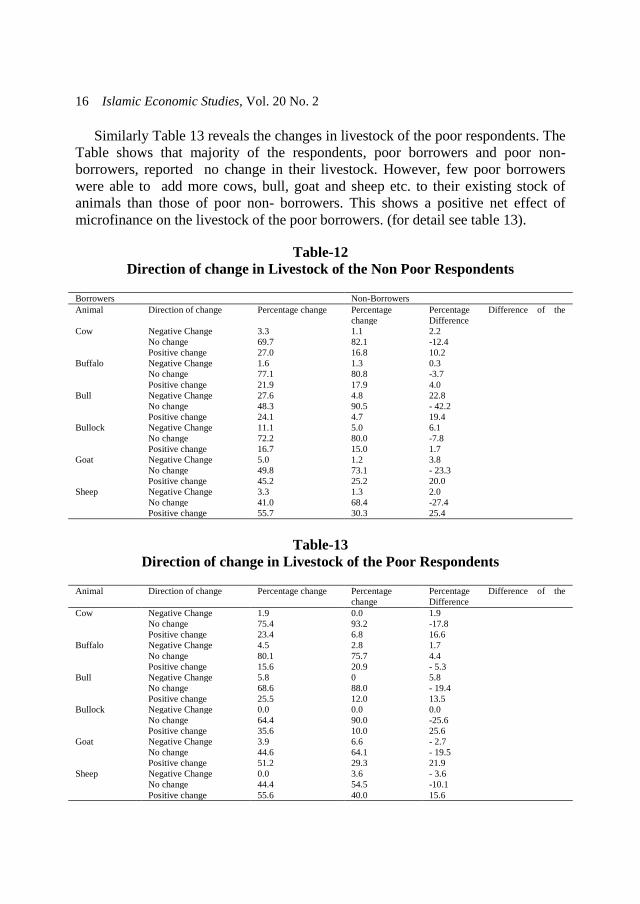
4.7. Changes in Livestock
This section discusses the changes in the livestock of the respondents during the
study period. The last column of the Table 12 gives net effect of Microfinance on
changes of livestock. The column shows either positive, no change or negative
change in the number of livestock acquired by the non-poor borrowers and non-
borrowers. A great percentage of non- poor borrowers and non-borrowers
experienced no change in their livestock during the study period. However,
majority of the non-poor non-borrowers experienced no change in their livestock
compared with non-poor borrowers. This has been reflected by the negative sign in
the last column of Table12.The non-poor borrowers added more animals to their
existing stock as compared to the control group. This has been reflected by the
positive sign in the last column of the Table 12. The Table shows that the net
impact of microfinance has been positive on the livestock of the non-poor
borrowers.
16 Islamic Economic Studies, Vol. 20 No. 2
Similarly Table 13 reveals the changes in livestock of the poor respondents. The
Table shows that majority of the respondents, poor borrowers and poor non-
borrowers, reported no change in their livestock. However, few poor borrowers
were able to add more cows, bull, goat and sheep etc. to their existing stock of
animals than those of poor non- borrowers. This shows a positive net effect of
microfinance on the livestock of the poor borrowers. (for detail see table 13).
Table-12
Direction of change in Livestock of the Non Poor Respondents
Borrowers Non-Borrowers
Animal Direction of change Percentage change Percentage
change
Percentage Difference of the
Difference
Cow Negative Change 3.3 1.1 2.2
No change 69.7 82.1 -12.4
Positive change 27.0 16.8 10.2
Buffalo Negative Change 1.6 1.3 0.3
No change 77.1 80.8 -3.7
Positive change 21.9 17.9 4.0
Bull Negative Change 27.6 4.8 22.8
No change 48.3 90.5 - 42.2
Positive change 24.1 4.7 19.4
Bullock Negative Change 11.1 5.0 6.1
No change 72.2 80.0 -7.8
Positive change 16.7 15.0 1.7
Goat Negative Change 5.0 1.2 3.8
No change 49.8 73.1 - 23.3
Positive change 45.2 25.2 20.0
Sheep Negative Change 3.3 1.3 2.0
No change 41.0 68.4 -27.4
Positive change 55.7 30.3 25.4
Table-13
Direction of change in Livestock of the Poor Respondents
Animal Direction of change Percentage change Percentage
change
Percentage Difference of the
Difference
Cow Negative Change 1.9 0.0 1.9
No change 75.4 93.2 -17.8
Positive change 23.4 6.8 16.6
Buffalo Negative Change 4.5 2.8 1.7
No change 80.1 75.7 4.4
Positive change 15.6 20.9 - 5.3
Bull Negative Change 5.8 0 5.8
No change 68.6 88.0 - 19.4
Positive change 25.5 12.0 13.5
Bullock Negative Change 0.0 0.0 0.0
No change 64.4 90.0 -25.6
Positive change 35.6 10.0 25.6
Goat Negative Change 3.9 6.6 - 2.7
No change 44.6 64.1 - 19.5
Positive change 51.2 29.3 21.9
Sheep Negative Change 0.0 3.6 - 3.6
No change 44.4 54.5 -10.1
Positive change 55.6 40.0 15.6
Nasim Shah Shirazi: Targeting and Socio-Economic Impact of Microfinance 17
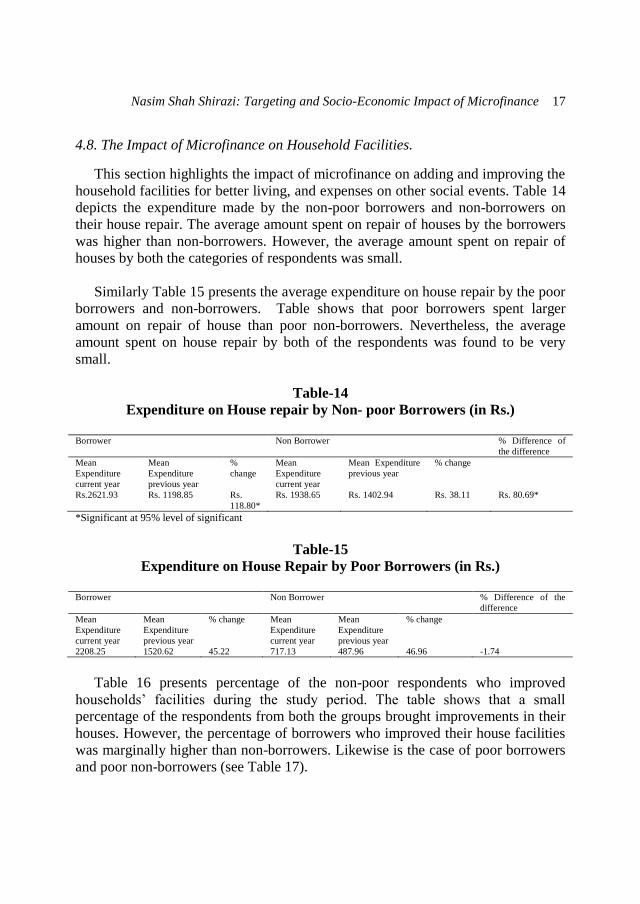
4.8. The Impact of Microfinance on Household Facilities.
This section highlights the impact of microfinance on adding and improving the
household facilities for better living, and expenses on other social events. Table 14
depicts the expenditure made by the non-poor borrowers and non-borrowers on
their house repair. The average amount spent on repair of houses by the borrowers
was higher than non-borrowers. However, the average amount spent on repair of
houses by both the categories of respondents was small.
Similarly Table 15 presents the average expenditure on house repair by the poor
borrowers and non-borrowers. Table shows that poor borrowers spent larger
amount on repair of house than poor non-borrowers. Nevertheless, the average
amount spent on house repair by both of the respondents was found to be very
small.
Table-14
Expenditure on House repair by Non- poor Borrowers (in Rs.)
Borrower Non Borrower % Difference of
the difference
Mean
Expenditure
current year
Mean
Expenditure
previous year
%
change
Mean
Expenditure
current year
Mean Expenditure
previous year
% change
Rs.2621.93 Rs. 1198.85 Rs.
118.80*
Rs. 1938.65 Rs. 1402.94 Rs. 38.11 Rs. 80.69*
*Significant at 95% level of significant
Table-15
Expenditure on House Repair by Poor Borrowers (in Rs.)
Borrower Non Borrower % Difference of the
difference
Mean
Expenditure
current year
Mean
Expenditure
previous year
% change Mean
Expenditure
current year
Mean
Expenditure
previous year
% change
2208.25 1520.62 45.22 717.13 487.96 46.96 -1.74
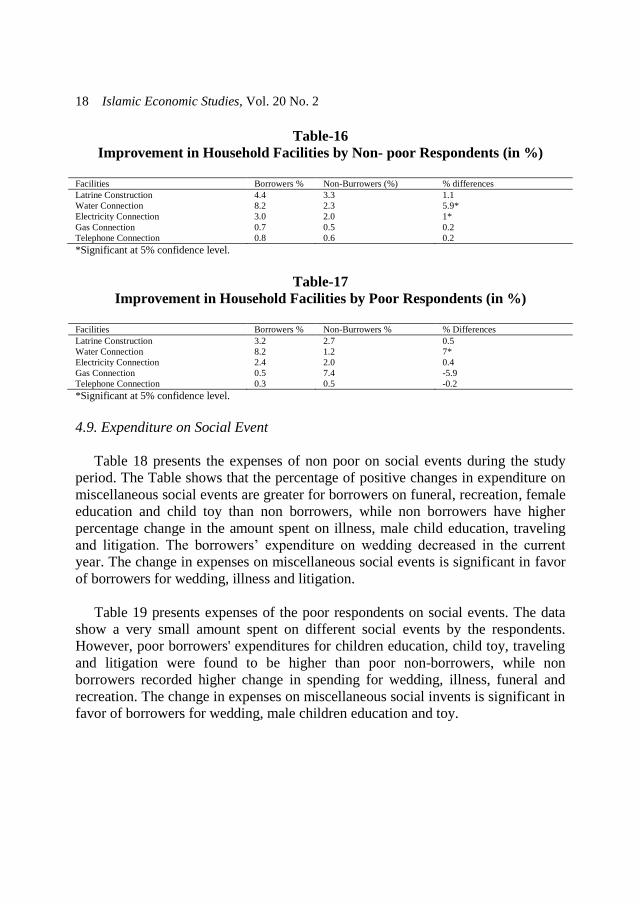
Table 16 presents percentage of the non-poor respondents who improved
households’ facilities during the study period. The table shows that a small
percentage of the respondents from both the groups brought improvements in their
houses. However, the percentage of borrowers who improved their house facilities
was marginally higher than non-borrowers. Likewise is the case of poor borrowers
and poor non-borrowers (see Table 17).
18 Islamic Economic Studies, Vol. 20 No. 2
Table-16
Improvement in Household Facilities by Non- poor Respondents (in %)
Facilities Borrowers % Non-Burrowers (%) % differences
Latrine Construction 4.4 3.3 1.1
Water Connection 8.2 2.3 5.9*
Electricity Connection 3.0 2.0 1*
Gas Connection 0.7 0.5 0.2
Telephone Connection 0.8 0.6 0.2
*Significant at 5% confidence level.
Table-17
Improvement in Household Facilities by Poor Respondents (in %)
Facilities Borrowers % Non-Burrowers % % Differences
Latrine Construction 3.2 2.7 0.5
Water Connection 8.2 1.2 7*
Electricity Connection 2.4 2.0 0.4
Gas Connection 0.5 7.4 -5.9
Telephone Connection 0.3 0.5 -0.2
*Significant at 5% confidence level.
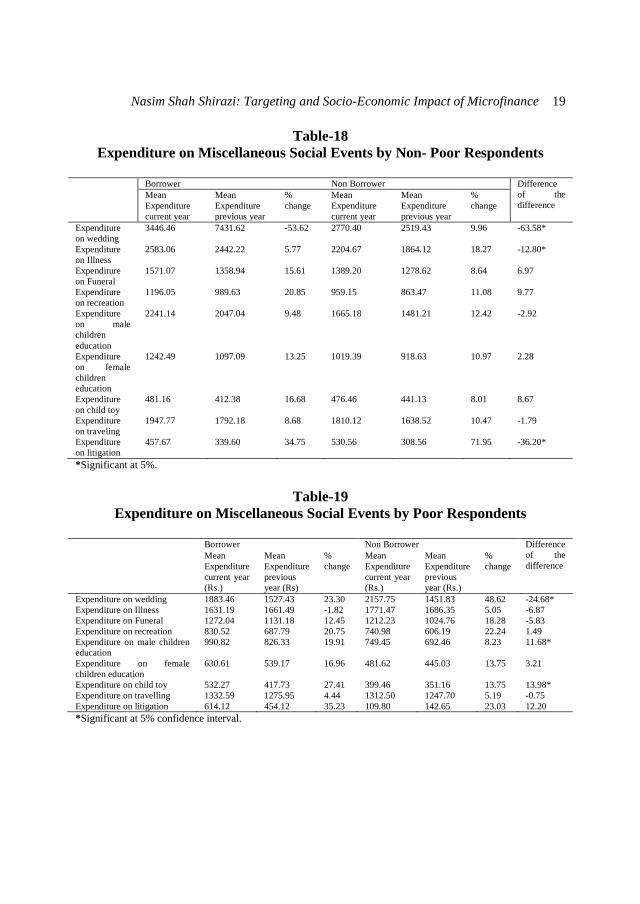
4.9. Expenditure on Social Event
Table 18 presents the expenses of non poor on social events during the study
period. The Table shows that the percentage of positive changes in expenditure on
miscellaneous social events are greater for borrowers on funeral, recreation, female
education and child toy than non borrowers, while non borrowers have higher
percentage change in the amount spent on illness, male child education, traveling
and litigation. The borrowers’ expenditure on wedding decreased in the current
year. The change in expenses on miscellaneous social events is significant in favor
of borrowers for wedding, illness and litigation.
Table 19 presents expenses of the poor respondents on social events. The data
show a very small amount spent on different social events by the respondents.
However, poor borrowers' expenditures for children education, child toy, traveling
and litigation were found to be higher than poor non-borrowers, while non
borrowers recorded higher change in spending for wedding, illness, funeral and
recreation. The change in expenses on miscellaneous social invents is significant in
favor of borrowers for wedding, male children education and toy.
Nasim Shah Shirazi: Targeting and Socio-Economic Impact of Microfinance 19
Table-18
Expenditure on Miscellaneous Social Events by Non- Poor Respondents
Borrower Non Borrower Difference
of the
difference Mean
Expenditure
current year
Mean
Expenditure
previous year
%
change
Mean
Expenditure
current year
Mean
Expenditure
previous year
%
change
Expenditure
on wedding
3446.46 7431.62 -53.62 2770.40 2519.43 9.96 -63.58*
Expenditure
on Illness
2583.06 2442.22 5.77 2204.67 1864.12 18.27 -12.80*
Expenditure
on Funeral
1571.07 1358.94 15.61 1389.20 1278.62 8.64 6.97
Expenditure
on recreation
1196.05 989.63 20.85 959.15 863.47 11.08 9.77
Expenditure
on male
children
education
2241.14 2047.04 9.48 1665.18 1481.21 12.42 -2.92
Expenditure
on female
children
education
1242.49 1097.09 13.25 1019.39 918.63 10.97 2.28
Expenditure
on child toy
481.16 412.38 16.68 476.46 441.13 8.01 8.67
Expenditure
on traveling
1947.77 1792.18 8.68 1810.12 1638.52 10.47 -1.79
Expenditure
on litigation
457.67 339.60 34.75 530.56 308.56 71.95 -36.20*
*Significant at 5%.
Table-19
Expenditure on Miscellaneous Social Events by Poor Respondents
Borrower Non Borrower Difference
of the
difference Mean
Expenditure
current year
(Rs.)
Mean
Expenditure
previous
year (Rs)
%
change
Mean
Expenditure
current year
(Rs.)
Mean
Expenditure
previous
year (Rs.)
%
change
Expenditure on wedding 1883.46 1527.43 23.30 2157.75 1451.83 48.62 -24.68*
Expenditure on Illness 1631.19 1661.49 -1.82 1771.47 1686.35 5.05 -6.87
Expenditure on Funeral 1272.04 1131.18 12.45 1212.23 1024.76 18.28 -5.83
Expenditure on recreation 830.52 687.79 20.75 740.98 606.19 22.24 1.49
Expenditure on male children
education
990.82 826.33 19.91 749.45 692.46 8.23 11.68*
Expenditure on female
children education
630.61 539.17 16.96 481.62 445.03 13.75 3.21
Expenditure on child toy 532.27 417.73 27.41 399.46 351.16 13.75 13.98*
Expenditure on travelling 1332.59 1275.95 4.44 1312.50 1247.70 5.19 -0.75
Expenditure on litigation 614.12 454.12 35.23 109.80 142.65 23.03 12.20
*Significant at 5% confidence interval.
20 Islamic Economic Studies, Vol. 20 No. 2
Islamic Microfinance
5. Conclusion and Policy Recommendations
The study has been conducted to analyze the socio-economic impact of
microfinance on the borrowers in Pakistan. The study has employed the
“Difference of the Difference” approach to find the net effects of microfinance.
The study has used data collected by Pakistan Poverty Alleviation Fund in 2005.
The main objective of the microfinance has been to reach the poor and
disadvantaged people who do not have collateral.
The study found that in case of Pakistan all microfinance funds are not going to
the poor masses rather the non-poor were the major beneficiaries. Only about 30
percent of the poor were the recipients of the microfinance facilities during the
study period, which show miss-targeting of the funds. The impact on the poverty
status was found to be positive but marginal. Only about 3 percent of poor could
cross the national poverty line. The income of the poor borrowers hardly could
grow by 2 percent during the study period. The income of the non-poor borrowers
grew at about 6 percent. However, the consumption of the poor borrowers
increased by 10 percent, which indicates that the poor primarily borrow for
smoothing their consumption. A significant net effect of microfinance on the
consumption (6.71 percent) and income ( about 6 percent) of non-poor borrowers
has been found. Results show that poor non-borrowers were better off in terms of
change in most of their assets compared to the poor borrowers. However, the net
effect of microfinance on households durables of the non-poor borrowers was
marginal’ while the net effect of microfinance on few items of household durables
like fan, bicycle and sewing machine , of the poor borrowers was found to be
positive.
Compared to the poor borrowers, the majority of the poor non-borrowers
reported no change in their livestock. Similarly, some poor borrowers reported
positive changes in their livestock as compared to poor non borrowers during the
study period, which shows positive net impact of microcredit on the livestock of
the poor borrowers.. As for as purchase of property and other agriculture related
assets are concerned, only about 8 percent of the poor borrowers could purchase
some property while about one percent purchased agricultural implements. The
majority of the poor borrowers and non-borrowers reported no change in their
livestock. However, poor borrowers were able to add more cows, bull, goat and
sheep etc. to their existing stock of animals than those of poor non- borrowers. This
shows a positive net effect of microfinance on the livestock of the poor borrowers.
Nasim Shah Shirazi: Targeting and Socio-Economic Impact of Microfinance 21
Results show some changes in adding household facilities and house repairs by
the poor and the non poor borrowers. Both of the respondents spent very small
amount on house repair. Likewise very few poor and non-poor respondents added
household facilities during the study period. Expenditures on social and other
miscellaneous items were found to be small. However, poor borrows spent more
money for children education, child toy, travelling and litigation compared to non
borrowers who spent a little bit more on wedding, illness, funeral and recreation.
The main purpose of the PPAF was to address the problem of poverty in the
country and to provide microfinance to the poor through its participatory
organizations and NGOs. Despite the PPAF efforts, the POs and other NGOs failed
to target the poor masses. They focused on entrepreneurial class. The PPAF should
make sure that funds go to the poor and marginalized communities.
It has been noticed that most of the poor who received microcredit were not
benefited much, perhaps they lack entrepreneurial skills. Although PPAF has been
stressing the POs for the training of the recipients of microfinance, it seems that
POs have neglected the training aspect of the beneficiaries. It is suggested that the
borrowers of microfinance also be provided with training in the areas
(sectors/trades) in which funds are made available.
The average size of the loan was reported to be about Rs. 11,445 ranging from
Rs. 1,000 to Rs. 30,000, while the average loan size desired by the borrowers was
around Rs.24, 803. Therefore the loan size may be increased so that the borrowers
may get full benefits out of it.
The analysis given above highlights the extent of effectiveness of the traditional
microfinance in case of Pakistan. Results show some positive but marginal impact
on the social and economic life of the borrowers. However, traditional
microfinance is reaching and benefiting more to better off than the poor and
unskilled. It has also been observed that most of the poor borrow for smoothing
their consumption rather than for some investment purpose. They are caught in a
trap and remain poor. This problem can be solved by providing them social safety
net and capacity building through zak t and adaqat. An inclusive business model
is suggested, where consumption requirement may be met through grant and
production requirement through finance to include the poor and enable them to be
entrepreneurs.
22 Islamic Economic Studies, Vol. 20 No. 2
References
Ahmed, Salehuddin. (2004), “Microcredit and Poverty: New Realities and Strategic
Issues.” In Attacking Poverty with Microcredit, ed. Salehuddin Ahmed and
M.A. Hakim. The University Press Ltd. Dhaka, Bangladesh
Akhtar,W., Nadeem, A. and S. Khurram Ali Jaffri (2009), “ Islamic Microfinance
and Poverty Alleviation: A Case of Pakistan”. Proceeding 2nd
CBRC, Lahore,
Pakistan, November 14.
Amin, Ruhul, Stan Becker, and Abdul Bayes (1998), “NGO-promoted microcredit
programs and women's empowerment in rural Bangladesh”. Quantitative and
qualitative evidence, The Journal of Developing Areas 32, 221-236.
Arif, G. M. (2006), “Targeting Efficiency of Poverty Reduction Programs in
Pakistan”. Working paper No. 4, Asian Development Bank.
Baker, J. L. (2000), “Evaluating the impact of development projects on poverty: A
handbook for practitioners” (Washington D.C: The World Bank).
Banegas, O. Jarrin, S., Rojas, B., Nuselder, H. and Sanders, A. (2002), “ HIVOS
Outreach and Impact of Microcredit: Case Studies of Banco Solidario (Ecuador)
and Caja los Andes (Bolivia)”. Centro de Estudios para el Desarrollo Rural-
Free University of Amsterdam, mimeo, San Jose.
Barnes, C., Gary Gaile, and Richard Kimbombo (2001), “Impact of Three
Microfinance Programs in Uganda”. USAID-AIMS paper (Washington, D.C.:
Management of Systems International).
Baumann, Ted. (2004), “Pro-Poor Microcredit in South Africa: Cost-efficiency and
Productivity of South African Pro-Poor Microfinance institutions”.
Development Southern Africa, Vol.21, No.5, December.
Bhatt, N. & Tang, S.Y. (2001), “Delivering microfinance in developing countries:
controversy and policy perspectives”. Policy Studies Journal, 29(2), pp.319-
333.
Chen, Martha A. and Donald Snodgrass (2001), “Managing Resources, Activities,
and Risk in Urban India”. The Impact of SEWA Bank (Washington, D.C.:
AIMS).
Cheston, S., Reed, L., Harper, V., Hill L, Horn, N., Salib, S. & Walen, M. (1999),
“Measuring Transformation: Assessing and Improving the Impact of
Microcredit”. Prepared for the Microcredit Summit Meeting of Councils in
Nasim Shah Shirazi: Targeting and Socio-Economic Impact of Microfinance 23
Abidjan, Cote d’Ivoire, 24-26 June 1999. Available from
http://www.microcreditsummit.org/papers/impactpaper.pdf [August 30, 2008].
Chowdhury, A.M.R. and A. Bhuiya (2001), "Do Poverty Alleviation Programmes
Reduce
Chowdhury, M. Jahangir Alam. (2007), “Does the Participation in the Microcredit
Programs Increase Consumption of Participating Households”? The Case of the
Grameen Bank in Bangladesh. In: University of Dhaka, Center for Microfinance
and Development / Working Papers. RePEc: ags: udcmdw: 46545.
Coleman, B.E. (1999) “The Impact of group lending in Northeast Thailand,”
Journal of Development Economics, vol. 60, pp.105-141.
Coleman, B.E. (2004), “Microfinance in Northeast Thailand: who benefits and how
much?” World Development
Copestake, James (2002), “Inequality and the Polarizing Impact of Microcredit:
Evidence from Zambia’s Copperbelt.” Journal of International Development
14: 743-755.
Dichter, T.(1999), “Non-governmental organizations (NGOs) In Microfinance:
Past, Present and Future” An Essay.
Dichter, Thomas (2007), “A Second Look at microfinance: The sequence of
Growth and Credit in Economic History”. Center for Global Liberty &
Prosperity, development Policy Briefing paper, No.1, 15 February
Edgcomb, E. & Garber, C. (1998), “Practitioner-led impact assessment: A test in
Honduras” AIMS paper (Washington, DC: The Small Enterprise Education and
Promotion Network)
Gallup Pakistan (2005), “PPAF Micro Credit Financing: Assessment of Outcome”.
Pakistan Poverty Alleviation Fund, Pakistan. (Unpublished)
Goetz, A.M., & Sen Gupta, R. (1996), “Who takes credit? Gender, power and
control over loan use in rural credit programmes in Bangladesh”. World
Development, 24(1), pp.45-64
Hashemi, S.S. Schuler and I Riley(1996), “Rural Credit programs and Women‘s
Empowerment in Bangladesh”. World Development Vol. 24, No. 4, pp. 635-
653.
Hulme, D. and Mosley, P. (1996), “Finance Against Poverty”. Vol. 1 and 2,
Routledge: London
24 Islamic Economic Studies, Vol. 20 No. 2
Inequity in Health: Lessons from Bangladesh," in Poverty Inequity and Health, ed.
D.Leon and G. Walt (Oxford: Oxford University Press)
Khandker, S. (1998) “Fighting Poverty with Microcredit: Experience in
Bangladesh. New York: Oxford University Press, Inc.
Khandker, S. (2003), “Micro-finance and Poverty: Evidence Using Panel Data
from Bangladesh”. World Bank Policy Research Paper 2945, World Bank,
Washington.
McKernan, Signe-Mary (2002), “The Impact of Micro-credit Programs on Self-
employment Profits: Do Non-credit Program Aspects Matter?” The Review of
Economic and Statistics 84(1): 93-115.
MKNelly, B., Watetip, C., Lassen C.A and Dunford, C. (1996), “Preliminary
evidence that integrated financial and educational services can be effective
against hunger and malnutrition,” Freedom from Hunger Research Paper no. 2,
Freedom from Hunger, April.
Montgomery, H (2005), “ Serving the Poorest of the Poor: The Poverty Impact of
the Khushhali Bank’s Microfinance Lending in Pakistan. Paper available at
http://www.adbi.org/files/2005.09.28.book.khushali.microfinance.study.pdf.
Montgomery, H. and Weiss, John(2005), “Great expectations: Microfinance and
poverty reduction in Asia and Latin America,’
Morduch, J. (1998), “Does Micro-finance Really Help the Poor? New Evidence
from Flagship Programs in Bangladesh”. Harvard University and Stanford
University Manuscript
Mosley, Paul (2001), “Microfinance and Poverty in Bolivia,” Journal of
Development Studies, vol. 37, no. 4, pp. 101-132
Mustafa, S.I. A., et al, (1996), “Beacon of Hope: An Impact Assessment of
BRAC's Rural Development Programme”. Dhaka, Bangladesh: BRAC, 1996.
Navajas, Sergio, Mark Schreiner, Richard L. Meyer, Claudio Gonzalez-Vega, and
Jorge Rodriguez-Meza, (2000), “Microcredit and the poorest of the poor:
Theory and evidence from Bolivia”. World Development 28, 333-346.
Naved R.(1994), “Empowerment of Women: Listening to the Voices of Women”.
In The Bangladesh Development Studies —Special issue on Women,
Development and Change, Vol. Xxii, No. 2&3, pp. 121-155 pp. 155-179, ed.
Amin, BIDS, Dhaka
Nasim Shah Shirazi: Targeting and Socio-Economic Impact of Microfinance 25
Obaidullah, Mohammed (2008), “ Role of Microfinance in Poverty Alleviation:
lessons from Experiences in Selected IDB Members Countries”. Islamic
Research and Training Institute, Islamic Development Bank, Jeddah.
Panjaitan-Drioadisuryo, D.M. Rositan, and Kathleen Cloud (1999), "Gender, Self-
Employment, and Microcredit Programs: An Indonesian Case Study. "Quarterly
Review of Economics and Finance, Vol. 39
Parveen, Jannat ara (2009), “Sustainability issues of Interest-free Micro-finance
Institutions in Rural Development and Poverty Alleviation”. The Bangladesh
Perspective Theoretical and Empirical researches in Urban Management, No 2
(11), May.
Rahman M. Mizanur and Fariduddin, Ahmad (2010), “Impact of microfinance of
IBBL on the rural poor’s livelihood in Bangladesh: an empirical study”.
International Journal of Islamic and Middle Eastern Finance and Management
Vol. 3 No. 2, 2010 pp. 168-190
Rahman, R.I. (2004), “Future Challenges Facing the MFIs of Bangladesh: Choice
of Target Groups, Loan Sizes and Rate of Interest”. In Attacking Poverty with
Microcredit, Ed. The University Press Ltd. Dhaka, Bangladesh.
Remenyi, Joe and Benjamin Quinones Jr. (2000), “Microfinance and Poverty
Alleviation: Case Studies from Asia and the Pacific”. New York: Pinter
Publishers, Ltd., 79: 131-34; 253-64.
Saboor, A., Husain, M. and Munir, M. (2009). “Impact of Micro Credit in
Alleviating Poverty: An Insight from Rural Rawalpindi, Pakistan”. Pakistan
Journal of Life and Social Science. (2009), 7(1): 90-97
Schreiner, Mark (1999), “Self-employment, microenterprise, and the poorest
Americans”, The Social Service Review 73, 496-523.
Servon, Lisa J., (1997), “Microenterprise programs in U.S. inner cities: Economic
development or social welfare? Economic Development Quarterly 11, 166-180.
Shirazi, Nasim Shah (2008), “Return on Investment in Microenterprises:
Experience of the Borrowers of Pakistan Poverty Alleviation Fund”. Forman
Journal of Economic Studies, Vol 4, January-December.
Shirazi, Nasim Shah and Aman ullah Khan (2009). “Role of Pakistan Poverty
Alleviation Fund in Poverty Alleviation: A case of Pakistan”. Pakistan
Economic and Social Review Vol. 47, No. 2 pp. 215-228
Shylendra, H.S. (2006), “Microfinance institutions in Andhra Pradesh: Crisis and
Diagnosis”. Economic and Political Weekly, pp. 1959-1963.
26 Islamic Economic Studies, Vol. 20 No. 2
Simonwitz, A. (2002), “Apprising the Poverty Outreach of Micro-finance: A
Review of the CGAP Poverty Assessment Tool (PAT)”. Brighton, UK: Imp-
Act, Institute of Development Studies, www.imp-act.org.
Swain, Ranjula B. (2004), “ Is Microfinance a Good Poverty Alleviation Strategy?
Evidence from Impact Assessment”. Sida . available at
www.sida.se/publications.
The Economist (2007), “Finance and Economics: Small Loans and Big ambitions”.
Economic Focus, London, March 17, Vol.382, Iss.8520; Pg.108.
Waqar A., Zakir H., Hazoor M. S. and Ijaz H. (2008), “Impact of Agriculture
Credit on Growth and Poverty in Pakistan (Time Series Analysis Through Error
Correction Model)”. European Journal of Scientific Research ISSN 1450-216X
Vol.23 No.2 (2008), pp.243-251
Wydick, W. Bruce (1999b), “The effect of microenterprise lending on child
schooling in Guatemala”. Economic Development and Cultural Change 47,
853-869.
Yunus Muhammad(2004), “Expanding microcredit Outreach to Reach the
Millennium Development Goals: Some Issues for Attention”. In Attacking
Poverty with Microcredit, Ed. Salehuddin Ahmed and M.A. Hakim the
University Press Ltd. Dhaka, Bangladesh.
Nasim Shah Shirazi: Targeting and Socio-Economic Impact of Microfinance 27
Appendix A
Descriptive Statistics of Some Variables Used in the Paper
Descriptive Statistics
3126 16 88 37.89 10.454
3125 0 99000 5409.63 4832.924
3106 0 50000 4734.10 3314.052
3126 0 145000 7010.83 5132.338
3125 0 251000 6289.55 6102.558
3126 1000 100000 6065.22 5734.861
3126 400 85000 5235.40 4241.402
35 -1 4050000 488257.11 856714.958
9 15000 90000 37388.89 22698.813
10 200 15000 2520.00 4421.111
2 215000 240000 227500.00 17677.670
0
Age of the respondent
Current personal
monthly income
Prev ious personal
monthly income
Current monthly HH
income
Prev ious monthly HH
income
Current HH monthly
consumption
Prev ious HH monthly
consumption
Value of property
Value of trolley
Value of agri
Value of Tractor
Valid N (listwise)
N Minimum Maximum Mean Std. Dev iat ion
Note: All sample
Descriptive Statistics
1563 18 88 37.98 10.515
1562 0 99000 5606.03 5284.458
1552 0 30000 4661.01 3048.558
1563 0 120000 7204.46 5160.433
1563 0 251000 6345.12 7348.341
1563 1250 100000 6170.68 5694.460
1563 1200 70000 5177.51 3689.816
22 -1 4050000 638499.95 1024364.862
3 45500 90000 61833.33 24496.598
4 200 2000 925.00 763.217
0
0
Age of the respondent
Current personal
monthly income
Prev ious personal
monthly income
Current monthly HH
income
Prev ious monthly HH
income
Current HH monthly
consumption
Prev ious HH monthly
consumption
Value of property
Value of trolley
Value of agri
Value of Tractor
Valid N (listwise)
N Minimum Maximum Mean Std. Dev iat ion
Note: All Borrowers
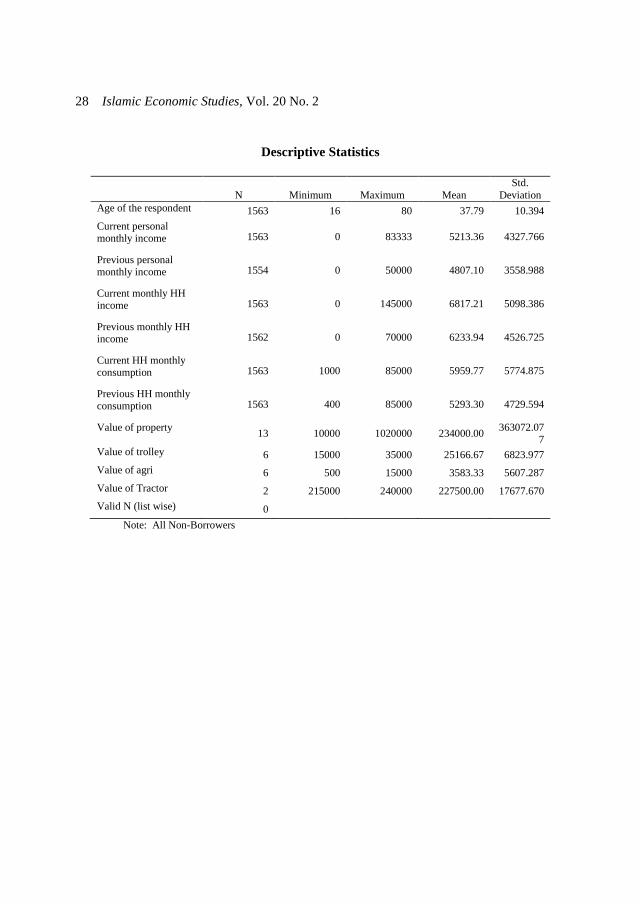
28 Islamic Economic Studies, Vol. 20 No. 2
Descriptive Statistics
N Minimum Maximum Mean
Std.
Deviation
Age of the respondent 1563 16 80 37.79 10.394
Current personal monthly income 1563 0 83333 5213.36 4327.766
Previous personal monthly income 1554 0 50000 4807.10 3558.988
Current monthly HH income 1563 0 145000 6817.21 5098.386
Previous monthly HH income 1562 0 70000 6233.94 4526.725
Current HH monthly consumption 1563 1000 85000 5959.77 5774.875
Previous HH monthly consumption 1563 400 85000 5293.30 4729.594
Value of property 13 10000 1020000 234000.00
363072.077
Value of trolley 6 15000 35000 25166.67 6823.977
Value of agri 6 500 15000 3583.33 5607.287
Value of Tractor 2 215000 240000 227500.00 17677.670
Valid N (list wise) 0
Note: All Non-Borrowers