Embed Size (px)
Citation preview

Regular Article
IMMUNOBIOLOGY AND IMMUNOTHERAPY
Targeting a cytokine checkpoint enhances the fitness ofarmored cord blood CAR-NK cellsMay Daher,1,* Rafet Basar,1,* Elif Gokdemir,1 Natalia Baran,2 Nadima Uprety,1 Ana Karen Nunez Cortes,1 Mayela Mendt,1
Lucila Nassif Kerbauy,1,3,4 Pinaki P. Banerjee,1 Mayra Shanley,1 Nobuhiko Imahashi,1 Li Li,1 Francesca Lorraine Wei Inng Lim,1 Mohsen Fathi,5
Ali Rezvan,5 Vakul Mohanty,6 Yifei Shen,6 Hila Shaim,1 Junjun Lu,1 Gonca Ozcan,1 Emily Ensley,1 Mecit Kaplan,1 Vandana Nandivada,1
Mustafa Bdiwi,1 Sunil Acharya,1 Yuanxin Xi,6 Xinhai Wan,1 Duncan Mak,2 Enli Liu,1 Xin Ru Jiang,1 Sonny Ang,1 Luis Muniz-Feliciano,1 Ye Li,1
Jing Wang,6 Shahram Kordasti,7 Nedyalko Petrov,7 Navin Varadarajan,5 David Marin,1 Lorenzo Brunetti,8 Richard J. Skinner,9 Shangrong Lyu,9
Leiser Silva,9 Rolf Turk,10 Mollie S. Schubert,10 Garrett R. Rettig,10 Matthew S. McNeill,10 Gavin Kurgan,10 Mark A. Behlke,10 Heng Li,11
Natalie W. Fowlkes,12 Ken Chen,6 Marina Konopleva,2 Richard E. Champlin,1 Elizabeth J. Shpall,1 and Katayoun Rezvani1
1Department of Stem Cell Transplantation and Cellular Therapy and 2Department of Leukemia, The University of Texas MD Anderson Cancer Center, Houston, TX;3Department of Stem Cell Transplantation and Cellular Therapy, Hospital Israelita Albert Einstein, Sao Paulo, Brazil; 4Human Genome and Stem Cell ResearchCenter, Department of Genetics and Evolutionary Biology, Biosciences Institute, University of Sao Paulo, Sao Paulo, Brazil; 5Department of Chemical andBiomolecular Engineering, University of Houston, Houston, TX; 6Department of Bioinformatics and Computational Biology, The University of Texas MD AndersonCancer Center, Houston, TX; 7System Cancer Immunology, Comprehensive Cancer Centre, King’s College London, London, United Kingdom; 8Center for Cell andGene Therapy, Baylor College of Medicine, Houston, TX; 9C.T. Bauer College of Business, University of Houston, Houston, TX; 10Integrated DNA Technologies,Coralville, IA; 11Dana-Farber/Harvard Cancer Center, Boston, MA; and 12Veterinary Medicine and Surgery, The University of Texas MD Anderson Cancer Center,Houston, TX
KEY PO INT S
l CRISPR-Cas9 CISHdeletion enhances themetabolic fitness andantitumor activityof armored IL-15–secreting CB-derived CAR-NK cells.
Immune checkpoint therapy has resulted in remarkable improvements in the outcome forcertain cancers. To broaden the clinical impact of checkpoint targeting, we devised astrategy that couples targeting of the cytokine-inducible Src homology 2–containing (CIS)protein, a key negative regulator of interleukin 15 (IL-15) signaling, with fourth-generation“armored” chimeric antigen receptor (CAR) engineering of cord blood–derived naturalkiller (NK) cells. This combined strategy boosted NK cell effector function through en-hancing the Akt/mTORC1 axis and c-MYC signaling, resulting in increased aerobic gly-colysis. When tested in a lymphoma mouse model, this combined approach improved NKcell antitumor activity more than either alteration alone, eradicating lymphoma xenografts
without signs of any measurable toxicity. We conclude that targeting a cytokine checkpoint further enhances theantitumor activity of IL-15–secreting armored CAR-NK cells by promoting their metabolic fitness and antitumor ac-tivity. This combined approach represents a promisingmilestone in the development of the next generation of NK cellsfor cancer immunotherapy. (Blood. 2021;137(5):624-636)
IntroductionNatural killer (NK) cells mediate potent cytotoxicity against tu-mor cells1 and are attractive candidates for the next-generationcancer immunotherapies.2 Moreover, their ready availabilityfrom various sources, such as umbilical cord blood (CB), booststheir potential as a third-party product for widespread clinicalscalability.3,4 A recent advance in the development of NK-cell–based immunotherapy is the demonstration that chimericantigen receptor (CAR) engineering can enhance their effectorfunction.5-7 We have shown that CB-NK cells transduced witha fourth-generation vector encoding anti-CD19 CAR andinterleukin-15 (IL-15) induce greater in vivo expansion andlonger-term persistence than nontransduced (NT) NK cells.6
While our preclinical study using an aggressive model of NK-resistant Raji lymphoma confirmed that this approach can pro-long survival of mice,6 it was not curative, leading us to question
whether the antitumor activity of IL-15–secreting CAR-NK cellscould be further enhanced by inhibiting key cytokine-relatedimmune checkpoints.
The suppressor-of-cytokine signaling (SOCS) family of proteinsplay important roles in NK cell biology by attenuating JAK-STAT–mediated cytokine signaling and NK cell cytotoxicityagainst cancer.8,9 One of its members, the cytokine-inducible Srchomology 2–containing protein (CIS), is encoded by the CISHgene. CIS contains a central Src homology 2 that interacts withphosphorylated tyrosine motifs in target proteins such as thosebelonging to the JAK-STAT signaling pathway and a C-terminal40-amino-acid motif known as the SOCS box that ubiquitinatesthe target proteins and directs them for proteosomaldegradation.10,11 CIS is induced by cytokines such as IL-2 and IL-1512,13 and is an important intracellular checkpoint in NK cells.10
624 blood® 4 FEBRUARY 2021 | VOLUME 137, NUMBER 5 © 2021 by The American Society of Hematology
Dow
nloaded from http://ashpublications.org/blood/article-pdf/137/5/624/1798880/bloodbld2020007748.pdf by U
NIVER
SITY OF H
OU
STON
user on 03 March 2021

Given that our CAR19-specific CB-derived NK cells are designedto secrete IL-15, we hypothesized that CIS would be a logicalcheckpoint to target to enhance their antitumor potency. Here,we show that a combined strategy of IL-15 CAR engineering andCISH knockout (KO) in CB-derived NK cells significantly im-proved tumor control. This gain of effector function is attributedto enhanced IL-15 signaling secondary toCISHKO,with consequentactivation of the Akt/mTORC1/c-MYC pathway and increased NKcell glycolysis in response to tumor. Thus, we demonstrate thatdeleting a critical cytokine checkpoint in IL-15–secreting CAR-NKcells improves their metabolic “fitness,” permitting greater in vivopersistence and cytotoxic function. Our data support the use of a2-step strategy that combines engineering CAR-NK cells to secreteIL-15 with cytokine checkpoint gene editing to further enhance theirtherapeutic potential in the clinic.
Materials and methodsRetrovirus transfection and transductionThe retroviral vector encoding iC9.CAR19.CD28-z-2A-IL-15was kindly provided by Gianpietro Dotti (University of North
Carolina).14,15 CAR19.CD28-z (without IL-15) was used as acontrol.
CRISPR-Cas9 gene editing of CISHCISH KO was performed using ribonucleoprotein (RNP) com-plex, in both NT and CAR-NK cells (for details, see supplementalMethods, available on the Blood Web site). To assess KO effi-ciency, we used polymerase chain reaction (PCR) gel electro-phoresis, western blot, and Sanger sequencing. Details on theprotocols are included in supplemental Methods.
NK cell functional and cytotoxicity assaysCytokine production, degranulation, chromium release assay,Incucyte real-time assay, and annexin V/DRAQ7 viability assayswere used as previously described.6 Details of these assays areprovided in the supplemental Methods.
Mass cytometry and antibody conjugationA panel comprising 37metal-tagged antibodies was used for thein-depth characterization of NK cells16 (supplemental Table 1and supplemental Methods).
D
CA
R
Cas
9 m
ock
CIS
H K
OC
as9
mo
ckC
ISH
KO
NT
E
0 7 14 21
Time (days)
*
*
Rela
tive
CISH
mRN
A ex
pres
sion
(2CT
)
0
10
100
200
300
400 NTCAR19/IL-15
A
5’
5’
5’
3’
3’
5’
3’
3’PAM PAM
Exon 1 Exon 4
B
NT CAR
WT Cas9mock
CISHKO
WT Cas9mock
CISHKO
D4: CAR transduction
D7: CRISPR/Cas9
% Indel 0 0 0 091 95
Expanded CB NK cells
CCIS
% Protein loss 0 0 0 081 98
-Actin
37 kDA
50 kDA
37 kDA
Figure 1. CRISPR-Cas9–mediated deletion of CISH in iC9/CAR19/IL-15 NK cells. (A) Schematic representation of CRISPR-Cas9–mediated CISH KO using 2 guide RNAs(gRNA) targeting exon 4 of the CISH gene. PAM, protospacer-adjacent motif. (B-C) CB-NK cells were expanded with K562 based feeder cells and IL-2 and then either left NT ortransduced with a retroviral vector expressing iC9/CAR19/IL-15 construct on day 4 (D4) of expansion. On day 7 (D7) of expansion, NT and iC9/CAR19/IL-15–expressing CB-NKcells were nucleofected with Cas9 alone (Cas9 mock), Cas9 preloaded with gRNA targetingCISH exon 4 (CISH KO), or nonnucleofected (wild-type [WT]). TheCISH KO efficiencywas determined by PCR (B) and western blot analysis (C). (D) Sanger sequencing results showing multiple peaks reflecting nonhomologous end-joining (NHEJ) events in NT oriC9/CAR19/IL-15 (CAR) NK cells that underwent CISH KO compared with single peaks in control (Cas9 mock). Arrows indicate the base pair position where the gene editingstarted. (E) Bar graphs showing the relative mRNA expression levels of CISH determined on days 0, 7, 14, and 21 of expansion in NT (blue) and iC9/CAR19/IL-15 (red) NK cells byreverse transcription polymerase chain reaction (RT-PCR) (n5 3). Note that on days 0 and 7 only data for NT-NK cells are included since the CAR transduction step is performedon day 4 of expansion. 18 S ribosomal RNA (18S) was used as the internal reference gene. Bars represent mean values with standard deviation, *P # .05.
CHECKPOINT DELETION IN ARMORED CB CAR-NK CELLS blood® 4 FEBRUARY 2021 | VOLUME 137, NUMBER 5 625
Dow
nloaded from http://ashpublications.org/blood/article-pdf/137/5/624/1798880/bloodbld2020007748.pdf by U
NIVER
SITY OF H
OU
STON
user on 03 March 2021

A
CAR MC1
CAR MC2
CAR MC3
CAR MC4
CAR MC5
CAR MC6
CAR MC7
CAR MC8
CAR MC9
CAR MC10
CAR MC11
CAR MC12
CAR MC13
CAR MC14
CAR MC15
CAR MC16
CAR MC17
CAR MC18
CAR MC19
CAR MC20
tSNE
2
tSNE1
CD16KI3DL1
KIR2DS4Granz-BPerforinDNAM
NKG2AKi672B4
NKG2DKIR3DL1-S1
CCR7CISH
NKp46T-BET
KIR3DL2NKp30
CD94KLRG1CD27TIGIT
DAP12CD3ZCD25
SYKTRAIL
KIR2DL5CD62LSiglec7
KIR2DL2-L3
KIR2DL1-S5
1 2 3 4 5 6 7 8 9 10 11 12 13 14 15 16 17 18 19 20
-1
-0.8
-0.6
-0.4
-0.2
0
0.2
0.4
0.6
0.8
1
EOMES
DIFN- response
0.50.40.30.20.10.0
-0.1
10
5
0-5
Enrichment profile Hits Ranking metric scores
Rank in ordered dataset
Rank
ed li
st m
etric
(Pre
Rank
ed)
Enric
hmen
tsc
ore
(ES)
05,
000
10,0
00
15,0
00
20,0
00
25,0
00
TNF- signaling via NFKB0.60.50.40.30.20.10.0
-0.1
10
5
0-5
Rank
ed li
st m
etric
(Pre
Rank
ed)
Enric
hmen
tsc
ore
(ES)
Enrichment profile Hits Ranking metric scores
Rank in ordered dataset
05,
000
10,0
00
15,0
00
20,0
00
25,0
00
IL-2/STAT5 signaling
0.60.7
0.50.40.30.20.10.0
10
5
0-5
Rank
ed li
st m
etric
(Pre
Rank
ed)
Enric
hmen
tsc
ore
(ES)
Enrichment profile Hits Ranking metric scores
Rank in ordered dataset
05,
000
10,0
00
15,0
00
20,0
00
25,0
00
IL-6/JAK/STAT3
0.60.50.40.30.20.10.0
10
5
0-5
Rank
ed li
st m
etric
(Pre
Rank
ed)
Enric
hmen
tsc
ore
(ES)
Enrichment profile Hits Ranking metric scores
Rank in ordered dataset
05,
000
10,0
00
15,0
00
20,0
00
25,0
00
Inflammatory response
0.60.50.40.30.20.10.0
10
5
0-5
Rank
ed li
st m
etric
(Pre
Rank
ed)
Enric
hmen
tsc
ore
(ES)
Enrichment profile Hits Ranking metric scores
Rank in ordered dataset
05,
000
10,0
00
15,0
00
20,0
00
25,0
00
CAR CTRL
CAR KO
100
80
60
40
20
0
-103 103 104 1050
p-STAT5-PE
Norm
alize
d to
mod
e
-103 103 104 1050
p-STAT3-PerCP-Cy5
100
80
60
40
20
0
Norm
alize
d to
mod
e
-103 103 104 1050
p-PLC1-Alexa 647
100
80
60
40
20
0
Norm
alize
d to
mod
e
E2500
2000
1500
1000
500
0
**
p-ST
AT5
(MFI
)
2000 **
1500
1000
500
0
p-ST
AT3
(MFI
)
**3000
2000
1000
0
p-PL
C1
(MFI
)
F
BCAR19/IL-15 CTRL
813.8206.952.512.911.566303.491.3627.317.54501021324102.732.419.742862845249.473.5821.46686.6202.359.5417.223.975162.457.1219.846.2180223.972.7123.396.8780
813.8206.952.512.911.566303.491.3627.317.54501021324102.732.419.742862845249.473.5821.46686.6202.359.5417.223.975162.457.1219.846.2180223.972.7123.396.8780
CD25
Tbet
Eom
esGr
aBPe
rfnCd
3zKi
67
CAR19/IL-15 CISH KODown
Up
CAR CAR KO
Log2
fold
chan
geZ t
rans
form
ed lo
g no
rmal
ized
coun
ts
1.5
-1
-1
1
2
KLFR1TENM1RP11-504P24.3TLE1ZBTB10RP4-635A23.6
RP11-887P2.3ZFP69BMBTNFSF14NAB2CTC-231011.1MX1CHAC1RASSF8CXCL8FRMD4BIL1ACSF2PLAU
TNFRSF12AZBED2FAM167APPP1R10STX1ADCUN1D3SOCS1PDGFAN4BP3RNF219ZEB2IL3RAC15orf48CEACAM1EMP1SHC4TGM5RRADRIN1AGPAT9FILIP1L
LTA
0
-2
C
LDLRAD4
CAR CTRL
CAR KO
Figure 2. Phenotype and molecular signature of iC9/CAR19/IL-15 CISH KO NK cells. (A) Comparative heatmap of mass cytometry data showing the expression of NK cellsurfacemarkers, transcription factors, and cytotoxicitymarkers in iC9/CAR19/IL-15CISH KO comparedwith iC9/CAR19/IL-15 control NK cells. Each column represents a separatecluster identified by FlowSOManalysis, and each row reflects the expression of a certain marker for each annotation. Color scale shows the expression level for eachmarker, with
626 blood® 4 FEBRUARY 2021 | VOLUME 137, NUMBER 5 DAHER et al
Dow
nloaded from http://ashpublications.org/blood/article-pdf/137/5/624/1798880/bloodbld2020007748.pdf by U
NIVER
SITY OF H
OU
STON
user on 03 March 2021

Seahorse assaysThe extracellular acidification rate (ECAR) and oxygen con-sumption rate were measured using the Agilent Seahorse XFe96Analyzer (Agilent) per the manufacturer’s instructions. NT-NKcells (control or CISH KO) and CAR-transduced NK cells (controlor CISH KO) were assayed alone or purified after 2 hours ofcoculture with Raji. Where indicated, NK cells were pre-incubated with rapamycin (100 ng/mL, Miltenyi Biotec) for4 hours prior to the Seahorse assay.
Xenogeneic lymphoma modelsWe used an aggressive NK-resistant Raji NOD/SCID IL-2Rgnull(NSG) xenograft model as previously described.6 Mice (10-12 weeks old; The Jackson Laboratory, Bar Harbor, ME) wereirradiated with 300 cGy at day 21 and engrafted with FFluc-Rajicells. Where indicated, NT (control or CISH KO), CAR19/IL-15 CB-NK (control or CISH KO), or CAR19 (no IL-15) CB-NK(control or CISH KO) cells were injected through the tail vein.Mice were subjected to weekly bioluminescence imaging(Xenogen IVIS-200 Imaging System).17 Trafficking, persistenceand expansion of NK cells were measured by flow cytometry.The antibodies used for flow cytometry staining are described indetail in the supplemental Methods.
Off-target identificationThe genome-wide, unbiased identification of double-strandedbreaks enabled by sequencing (GUIDE-seq) method was employedfor unbiased discovery of off-target editing events.18 Details of thistechnology and target enrichment via rhAmpSeq19 are included insupplemental Methods.
Additional detailedmethods are provided in supplemental Data.
ResultsPhenotypic and molecular signaling alterationsassociated with CISH deletionThe central hypothesis of this study predicts that knocking outthe CISH gene in CAR-NK cells will enhance their effectorfunction against tumor cells, much in the way that targeting PD-1improves outcomes by removing a critical immune checkpoint inT cells.20,21 Our approach for combined retroviral transductionwith the iC9/CAR19/IL-15 construct and RNP-mediated geneediting of CISH is shown in Figure 1A-B. On day 7, we nucle-ofected CAR-NK cells with Cas9 alone (Cas9 mock) or Cas9preloaded with gRNA targetingCISH exon 4. The iC9/CAR19/IL-15 transduction efficiency and cell viability on day 7 were.90%and remained stable over time in both control and gene-editedcells (supplemental Figure 1A-B). The efficiency of CISH KO was
high (81% to 98%) in both the nontransduced (NT) control andCAR-expressing NK cells by PCR (Figure 1B) and western blot(Figure 1C) and remained stable over time (supplementalFigure 1C-D). This on-target efficiency was confirmed by Sangersequencing (Figure 1D). Importantly,CISH expression in NK cellstransduced with either iC9/CAR19/IL-15 or NT (control) andcultured with IL-2 and K562 feeder cells expressing membrane-bound IL-21, 4-1BB ligand, and CD48 (referred to as uAPC)increased over time (Figure 1E). This indicates that CAR-modified and NT-NK cells are subject to the same counter-regulatory circuits leading to modulation of CIS levels.
Next, to gain insight into the phenotypic changes that accom-pany CISH KO in CAR-NK cells, we used cytometry by time offlight and a panel of 37 antibodies against inhibitory and acti-vating receptors, as well as differentiation, homing, and acti-vation markers (supplemental Table 1). CISH KO resulted inincreased expression of markers of activation and cytotoxicity(Figure 2A), including granzyme B, perforin, TRAIL, and CD3z;transcription factors such as eomesodermin (eomes) and T-bet;adaptor molecules such as DAP12; and activating co-receptors/proliferation markers such as DNAM, CD25, and Ki67. A similarprofile of upregulated markers was identified after CISH KOin NT-NK cells (supplemental Figure 2A). Using viSNE, at-distributed stochastic neighbor-embedding (t-SNE) algorithm,we observed marked phenotypic differences between controland CISH KO iC9/CAR19/IL-15 NK cells, with predominantlyproliferative and cytotoxic features (eg, increased expression ofCD25, Ki67, CD3z, perforin, and granzyme B) in CISH KO iC9/CAR19/IL-15 NK cells (Figure 2B). Despite higher expression ofproliferation markers on CISH KO iC9/CAR19/IL-15 NK cells onphenotyping, the proliferative capacity of NK cells during in vitroexpansion did not differ significantly following CISH KO (sup-plemental Figure 3A). This is likely related to the use of uAPCsthat can optimally expand both engineered and nonengineeredNK cells in vitro.5,17 Moreover, despite the activation phenotypeassociated with CISH KO, we did not observe any evidence ofactivation-induced cell death in NT CISH KO or CAR19/IL-15 CISH KO cells following stimulation with tumor targets(supplemental Figure 3B).
To assess the consequences of CISH KO on the transcriptomicand signaling pathway responses of NK cells, we performedRNA-sequencing studies of CISH KO NT and iC9/CAR19/IL-15NK cells vs their unmodified controls. CISH KO led to upregu-lation of genes related to inflammatory and immune responses(eg, tumor necrosis factor [TNF] and interferon [IFN] signalingsuch as TNFRSF12A, MX1, and T-bet regulation such asZEB2) as well as cytokine signaling (eg, IL1A, IL3RA, andCXCL8) (Figure 2C; supplemental Figure 2B) in both NT and
Figure 2 (continued) red representing higher expression and blue lower expression in iC9/CAR19/IL-15 CISH KO NK cells. The t-SNE map generated from FlowSOManalysis in the right panel shows the 20 NK cell metaclusters (MCs) represented in the mass cytometry heatmap in the left panel. (B) Individual t-SNE maps show theexpression of selected NK cell markers for iC9/CAR19/IL-15 CISH KO compared with iC9/CAR19/IL-15 control NK cells. Color scale indicates signal intensity, ranging fromlow (blue) to high (red) after arcsine transformation. (C) Global gene expression analysis by RNA sequencing. Heatmap displays the genes that were differentially expressedin purified iC9/CAR19/IL-15 CISH KO vs iC9/CAR19/IL-15 control NK cells (n 5 4). Color scale shows the expression level of each marker, with red representing higherexpression and blue lower expression in iC9/CAR19/IL-15 control (CAR) or iC9/CAR19/IL-15 CISH KO (CAR KO) NK cells (q , 0.1 and absolute log2foldchange . 0.8). (D)GSEA showing enrichment in IFN-g response, TNF-a signaling via NF-kB, IL-2/STAT5 signaling, IL-6/JAK/STAT3 signaling and inflammatory response in iC9/CAR19/IL-15 CISH KO compared with iC9/CAR19/IL-15 control NK cells. (E) Representative histogram showing enhanced phosphorylation of STAT5 (p-STAT5), STAT3 (p-STAT3) andphospholipase C g 1 (p-PLCg1) in iC9/CAR19/IL-15CISH KO vs iC9/CAR19/IL-15 control NK cells after coculture with Raji cells for 30 minutes. Blue histograms represent CARcontrol, and red histograms represent CAR CISH KO. (F) Bar graphs showing mean fluorescence intensity (MFI) of p-STAT5, p-STAT3, and p-PLCg1 in iC9/CAR19/IL-15 CISHKO vs iC9/CAR19/IL-15 control NK cells (n5 3). Blue bars represent CAR control and red bars represent CAR CISH KO. Bars represent mean values with standard deviation.**P # .01.
CHECKPOINT DELETION IN ARMORED CB CAR-NK CELLS blood® 4 FEBRUARY 2021 | VOLUME 137, NUMBER 5 627
Dow
nloaded from http://ashpublications.org/blood/article-pdf/137/5/624/1798880/bloodbld2020007748.pdf by U
NIVER
SITY OF H
OU
STON
user on 03 March 2021

iC9/CAR19/IL-15 NK cells. Gene set enrichment analysis (GSEA)supported enrichment of pathways involved in TNF-a, IFN-g,IL-2/STAT5, and IL-6/JAK/STAT3 signaling, as well as in thoserelated to inflammatory immune responses (Figure 2D; sup-plemental Figure 2C). We confirmed our findings at the proteinlevel by showing enhanced phosphorylation of STAT5, STAT3,and phospholipase C g 1 (PLCg1) in CISH KO iC9/CAR19/Il-15NK cells (Figure 2E-F). It is worthwhile to note that CIS and otherSOCS proteins have been reported to downregulate CD3z22 andPLCg123 in T cells, and our data support a similar effect in NKcells after CISH KO for both CD3z (Figure 2A-B) and p-PLCg1(Figure 2E-F). Considered together, these phenotypic andmolecular signaling results support the hypothesis that targetingCIS in CAR-NK cells removes an important immune checkpoint.
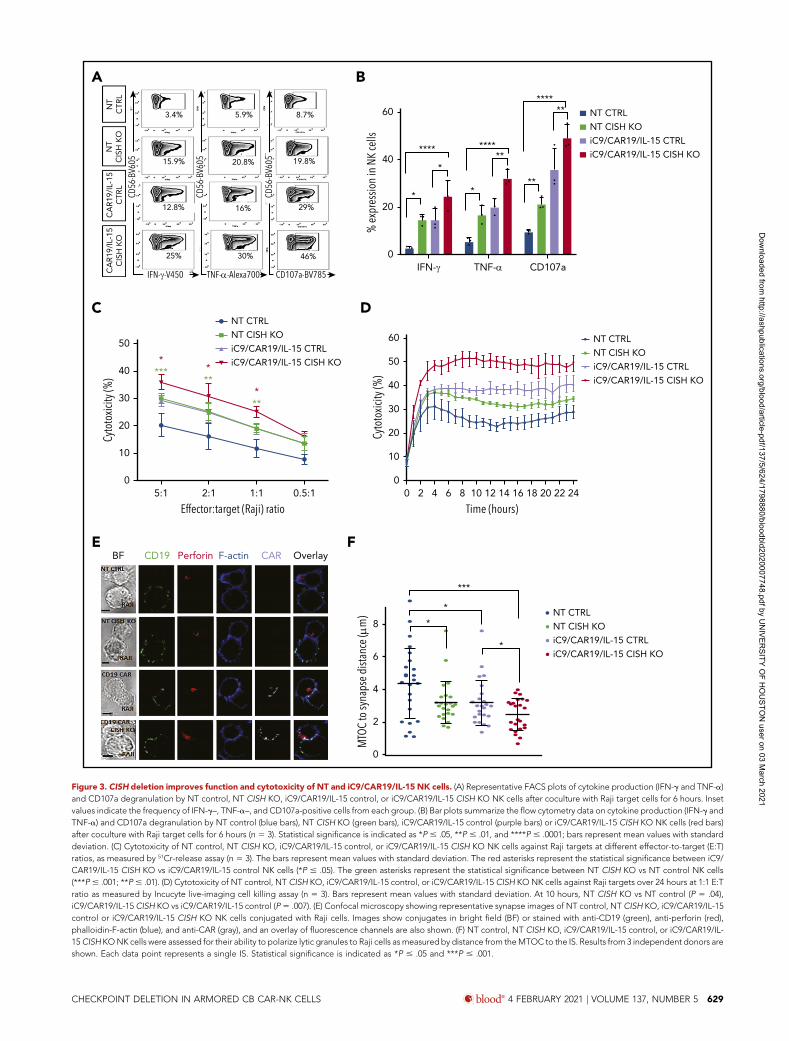
CISH ablation enhances the antitumor activity ofiC9/CAR19/Il-15 NK cellsWhen tested against CD191 Raji lymphoma cells, our CISH KONT or iC9/CAR19/IL-15 NK cells produced more IFN-g and TNF-a, and displayed greater degranulation (CD107a) and cytotox-icity against their targets than did their respective NT and iC9/CAR19/IL-15 NK controls (Figure 3A-D). Furthermore, CISH KOiC9/CAR19/IL-15 NK cells killed Ramos lymphoma cell line andprimary chronic lymphocytic leukemia targets cells (n 5 3) moreefficiently than controls (supplemental Figure 4A-B). This out-come was reinforced by the effect of CISH KO on the formationof the immunologic synapse (IS) between NT or iC9/CAR19/IL-15 NK cells and tumor cells. Indeed, polarization of perforin-centroid defined microtubule-organizing center (MTOC) wasaugmented by CISH deletion as reflected by a shortenedMTOC-to-IS distance compared with controls (Figure 3E-F), afinding that typically correlates with increased effector cellfunction and cytotoxicity.24 While we did not observe an up-regulation in the expression of adhesion molecules (eg, LFA-1,CD11b, or CD2), CISH deletion resulted in an increase in theCAR mean fluorescence intensity (supplemental Figure 5). Up-regulation of CAR expression following CISH KO is likely relatedto the increased activation state of the iC9/CAR19/IL-15 NK cellsand supports prior reports that cell activation can increase ex-pression of SFG retroviral vector–encoded transgenes.14,25
Robust metabolic changes associated with CIScheckpoint eliminationAlthough blocking the cytokine checkpoint CIS seemed like alogical approach, we remained concerned over the possibleimpact of increased IL-15 signaling on prominent metabolicpathways in NK cells. In one negative scenario, long-term ex-posure to IL-15 could suppress rather than boost metabolicrates, leading to NK cell exhaustion.26 In another scenario, itmight produce undue systemic toxicity.27,28 We therefore eval-uated the effects of CISH KO, with or without iC9/CAR19/IL-15transduction, on 2 major regulators of NK cell metabolism:mTORC1, which controls pathways responsible for proliferationand cytotoxicity,29,30 and MYC, which upregulates glucosetransporters and glycolytic enzymes that promote glycolysis.31
Indeed, GSEA revealed an enrichment of genes involved inphosphatidylinositol 3-kinase (PI3K)/Akt/mTOR, mTORC1,c-MYC, and glycolysis (Figure 4A).
The above results raise a pivotal question: are the metabolicgene expression patterns seen with CISH KO distinct, or do theyoverlap with those seen with unmodified or CAR19/IL-15 NK
cells? The heatmap in Figure 4B displays the various hallmarkpathways and how they change (upregulated or downregulated)among the various comparisons. In general, compared with NT-NK cells, each engineering strategy (CISH KO or CAR trans-duction) alone or in combination led to enrichment of metabolicpathways (Figure 4B). We observed some overlap between thepathways upregulated by CISH ablation or iC9/CAR19/IL-15transduction alone; however, the combination of both approachesclearly led to more robust metabolic changes (Figure 4B). Of note,certain pathways were specifically activated after CISH KO andwere not induced with CAR transduction alone; these includedpathways related to cytokine signaling and inflammatory response(Figure 4B).
We next focused on themetabolic pathways that are functionallyrelevant for NK cell antitumor activity; overall, our linear re-gression model showed an additive effect of CISH ablation andCAR transduction, with the largest increase in PI3K/Akt/mTORand glycolysis pathways being achieved with a combination ofthe 2 strategies, suggesting that both genetic manipulations areneeded to achieve optimal NK cell effector functions (Figure 4C).This interpretation was confirmed by a greater phosphorylationof Akt and ribosomal protein S6 (S6), a downstream target ofmTORC1, and increased expression of c-MYC, an importantmediator of glycolysis, in particular in CISH KO CAR19/IL-15 NKcells in response to Raji targets (Figure 4D; supplemental Fig-ure 6). Notably, p-S6 and p-Akt were upregulated in CISH KOCAR19/IL-15 NK cells even in the absence of Raji, although thiswas not associated with increased tonic signaling (supplementalFigure 7). It is likely by removing the CIS brake, the endoge-nously secreted IL-15 by CAR19/IL-15 NK cells can trigger themTORC1/Akt pathway with a lower threshold of activity. Incontrast c-MYC, which is the precursor of glycolysis, was onlyupregulated in response to Raji tumor. To pursue the functionalimplications of these findings, we first blocked the mTORC1pathway by treating the CAR19/IL-15 NK cells (6CISH KO) withrapamycin and observed a decrease in their cytotoxicity againstRaji lymphoma compared with untreated cells (supplementalFigure 8A), which asserts the importance of the mTORC1pathway as part of the mechanism by which CISH KO enhancesthe cytotoxicity of CAR19/IL-15 NK cells. We then used Seahorseassays to measure the glycolytic response of NK cells to tumortargets and showed that in response to Raji cells, either CISH KOalone or CAR transduction alone in NK cells could increaseglycolysis, as measured by ECAR, although the best result (andthe only statistically significant one) was achieved by combiningCISH KO and CAR19/IL-15 transduction (Figure 4E-F). Consis-tent with these findings, CAR-NK cells with CISH deletionshowed the greatest glucose consumption, when coculturedwith Raji, compared with controls (Figure 4G). The addition ofrapamycin completely abrogated any glycolytic advantage ofCISH KO in CAR19/Il-15 NK cells or NT-NK cells (supplementalFigure 8B-C), further supporting the importance of the mTORC1pathway as an upstream regulator of glycolysis in this setting.Importantly, in the absence of Raji targets, there was no dif-ference in glycolysis among the different NK conditions (sup-plemental Figure 8D-E) which parallels the c-MYC expressionprofile. CISH KO iC9/CAR19/IL-15 NK cells also had higheroxygen consumption rate compared with control iC9/CAR19/IL-15 NK cells (supplemental Figure 9A) and induced an increase inmitochondria numbers and the mitochondrial/nuclear volumeratio as assessed by confocal microscopy (supplemental Figure 9B-C).
628 blood® 4 FEBRUARY 2021 | VOLUME 137, NUMBER 5 DAHER et al
Dow
nloaded from http://ashpublications.org/blood/article-pdf/137/5/624/1798880/bloodbld2020007748.pdf by U
NIVER
SITY OF H
OU
STON
user on 03 March 2021
IFN- -V450
25%
TNF- -Alexa700 CD107a-BV785
30% 46%
3.4% 5.9% 8.7%
19.8%20.8%15.9%
12.8% 16% 29%
CD56
-BV6
05
CD56
-BV6
05
CD56
-BV6
05
CA
R19
/IL-
15C
ISH
KO
CA
R19
/IL-
15C
TRL
NT
CIS
H K
ON
TC
TRL
A B
IFN- TNF- CD107a0
% e
xpre
ssio
n in
NK
cells
20
40
60
**** ******
**
******
*
* *
NT CTRL
NT CISH KO
iC9/CAR19/IL-15 CTRL
iC9/CAR19/IL-15 CISH KO
D
0 2 4 6 8 10 12 14 16 18 20 22 24
Time (hours)
0
10
20
30
40
50
60
Cyto
toxic
ity (%
)
NT CTRL
NT CISH KO
iC9/CAR19/IL-15 CTRL
iC9/CAR19/IL-15 CISH KO
C
**** *
*****
5:10
10
20
30
40
50
Cyto
toxic
ity (%
)
Effector:target (Raji) ratio2:1 1:1 0.5:1
NT CTRL
NT CISH KO
iC9/CAR19/IL-15 CTRL
iC9/CAR19/IL-15 CISH KO
F
*
*
*
***
0
2
4
6
8
MTO
C to
syna
pse
dista
nce
(m
) NT CTRL
NT CISH KO
iC9/CAR19/IL-15 CTRL
iC9/CAR19/IL-15 CISH KO
EBF CD19 Perforin F-actin CAR Overlay
Figure 3. CISH deletion improves function and cytotoxicity of NT and iC9/CAR19/IL-15 NK cells. (A) Representative FACS plots of cytokine production (IFN-g and TNF-a)and CD107a degranulation by NT control, NT CISH KO, iC9/CAR19/IL-15 control, or iC9/CAR19/IL-15 CISH KO NK cells after coculture with Raji target cells for 6 hours. Insetvalues indicate the frequency of IFN-g–, TNF-a–, and CD107a-positive cells from each group. (B) Bar plots summarize the flow cytometry data on cytokine production (IFN-g andTNF-a) and CD107a degranulation by NT control (blue bars), NT CISH KO (green bars), iC9/CAR19/IL-15 control (purple bars) or iC9/CAR19/IL-15 CISH KO NK cells (red bars)after coculture with Raji target cells for 6 hours (n 5 3). Statistical significance is indicated as *P # .05, **P # .01, and ****P # .0001; bars represent mean values with standarddeviation. (C) Cytotoxicity of NT control, NT CISH KO, iC9/CAR19/IL-15 control, or iC9/CAR19/IL-15 CISH KO NK cells against Raji targets at different effector-to-target (E:T)ratios, as measured by 51Cr-release assay (n 5 3). The bars represent mean values with standard deviation. The red asterisks represent the statistical significance between iC9/CAR19/IL-15 CISH KO vs iC9/CAR19/IL-15 control NK cells (*P # .05). The green asterisks represent the statistical significance between NT CISH KO vs NT control NK cells(***P# .001; **P# .01). (D) Cytotoxicity of NT control, NT CISH KO, iC9/CAR19/IL-15 control, or iC9/CAR19/IL-15 CISH KO NK cells against Raji targets over 24 hours at 1:1 E:Tratio as measured by Incucyte live-imaging cell killing assay (n 5 3). Bars represent mean values with standard deviation. At 10 hours, NT CISH KO vs NT control (P 5 .04),iC9/CAR19/IL-15 CISH KO vs iC9/CAR19/IL-15 control (P5 .007). (E) Confocal microscopy showing representative synapse images of NT control, NT CISH KO, iC9/CAR19/IL-15control or iC9/CAR19/IL-15 CISH KO NK cells conjugated with Raji cells. Images show conjugates in bright field (BF) or stained with anti-CD19 (green), anti-perforin (red),phalloidin-F-actin (blue), and anti-CAR (gray), and an overlay of fluorescence channels are also shown. (F) NT control, NT CISH KO, iC9/CAR19/IL-15 control, or iC9/CAR19/IL-15CISH KONK cells were assessed for their ability to polarize lytic granules to Raji cells as measured by distance from theMTOC to the IS. Results from 3 independent donors areshown. Each data point represents a single IS. Statistical significance is indicated as *P # .05 and ***P # .001.
CHECKPOINT DELETION IN ARMORED CB CAR-NK CELLS blood® 4 FEBRUARY 2021 | VOLUME 137, NUMBER 5 629
Dow
nloaded from http://ashpublications.org/blood/article-pdf/137/5/624/1798880/bloodbld2020007748.pdf by U
NIVER
SITY OF H
OU
STON
user on 03 March 2021

Conditions
C
Path
yway
activ
ity co
rrecte
dfo
r don
ors e
ffects
-0.004
0
0.004
PI3K/AKT/MTOR signaling**
-0.02
0
0.02
Glycolysis
**
**
NTNT-KOCARCAR-KO
E2F Targets4B2
0
-2
Mea
n T
Stat
isti
c
-4
G2M CheckpointApoptosisCholesterol HomeostasisEpithelial Mesenchymal TransitionAdipogenesisDNA RepairCoagulationXenobiotic MetabolismOxidative PhosphorylationP53 PathwayIL2 STAT5 SignalingTNFA Signaling Via NFKB
Mitotic Spindel
MTORC1 SignallingHypoxiaGlycolysis
Interferon Gamma ResponseIL6 JAK STAT3 SignalingInflammatory response
Unfolded Protein Response
Androgen ResponseComplement
TGF Beta Signaling
UV Response Up
Interferon Alpha ResponseKRAS Signaling Up
MYC Targets V1
CA
R V
s NTK
O
CA
RK
O V
s CA
R
CA
RK
O V
s NT
CA
R V
s NT
NTK
O V
s NT
MYC Targets V2
Allograft Rejection
NT NT-KO
RajiD
CARCAR-K
o
NT NT-KO
CARCAR-K
o
NT NT-KO
- + (30 min) + (1hr)
CARCAR-K
o
NT NT-KO
+ (2hr)
CARCAR-K
o
p-Akt
Akt
p-S6
S6
c-Myc
-tubulin
A PI3K/AKT/MTOR signaling0.50.40.30.20.10.0
-0.1Enric
hmen
t sco
re
(ES)
Rank
ed li
st m
etric
(P
reRa
nked
)
Rank in ordered dataset
10
5
0
-5
0 5,000 10,000 15,000 20,000 25,000
MTORC1 signaling
0.50.40.30.20.10.0
Enric
hmen
t sco
re
(ES)
Rank
ed li
st m
etric
(P
reRa
nked
)
Rank in ordered dataset
10
5
0
-5
0 5,000 10,000 15,000 20,000 25,000
MYC
0.50.40.30.20.10.0
0.6
Enric
hmen
t sco
re
(ES)
Rank
ed li
st m
etric
(P
reRa
nked
)
Rank in ordered dataset
10
5
0
-5
0 5,000 10,000 15,000 20,000 25,000
Glycolysis0.5
0.4
0.3
0.2
0.1
0.0
Enric
hmen
t sco
re
(ES)
Rank
ed li
st m
etric
(P
reRa
nked
)
Rank in ordered dataset
10
5
0
-5
0 5,000 10,000 15,000 20,000 25,000
0
5
**
Gluc
ose
(nm
ol/1
06
cells
) 15
20
10
25
G NT CTRL + RajiNT CISH KO + RajiCAR CTRL + RajiCAR CISH KO + Raji
0
50
*
ECAR
(mpH
/min
/106
cell/
ml) 100
150
F NT CTRL + RajiNT CISH KO + RajiCAR CTRL + RajiCAR CISH KO + Raji
00 20 40 60 80
ECAR
(mpH
/min
/106
cell/
ml)
Time (minutes)
50
100
150 Glucose Oligomycin 2-DG
E NT CTRL + RajiNT CISH KO + RajiCAR CTRL + RajiCAR CISH KO + Raji
Enrichment profile Hits Ranking metric scores Enrichment profile Hits Ranking metric scores
Enrichment profile Hits Ranking metric scores Enrichment profile Hits Ranking metric scores
Figure 4. Metabolic changes associated with iC9/CAR19/IL-15 CISH KO NK cells. (A) GSEA plots showing enrichment in PI3K/Akt/MTOR, mTORC1, MYC, and glycolysispathways in iC9/CAR19/IL-15 CISH KO NK cells compared with iC9/CAR19/IL-15 control NK cells. (B) Comparative mean T statistic heat map of RNA sequencing data showingthe expression of metabolic pathways in NT control (NT), NT CISH KO (NTKO), iC9/CAR19/IL-15 control (CAR), or iC9/CAR19/IL-15 CISH KO (CARKO) NK cells that aresignificantly different (q, 0.01) in$1 of the 5 comparisons. Each column represents a separate comparison, and each row reflects the expression of a certain hallmark pathway for
630 blood® 4 FEBRUARY 2021 | VOLUME 137, NUMBER 5 DAHER et al
Dow
nloaded from http://ashpublications.org/blood/article-pdf/137/5/624/1798880/bloodbld2020007748.pdf by U
NIVER
SITY OF H
OU
STON
user on 03 March 2021

These data suggest that CISH KO can also enhance themetabolism of CAR-NK cells by increasing mitochondrialactivity.
Finally, we propose a model (visual abstract), in which CISH KOin CAR-NK cells enhances IL-15 signaling by releasing acheckpoint brake, in turn leading to increased activation of theAkt/mTORC1 axis and in the presence of tumor ensuing c-MYCactivation, culminating in greater glycolytic capacity of CAR-NKcells and a resultant increase in their ability to respond to tumortargets.
CIS checkpoint disruption combined with iC9/CAR19/IL-15 transduction improves tumor controlin a Raji lymphoma modelUsing an aggressive Raji lymphoma mouse model (Figure 5A),we next investigated whether adoptive transfer of CISH KO NKcells in the absence of CAR transduction could boost the controlof disease in tumor-bearing mice. First, mice received a singleIV infusion of NK cells (10 3 106/mouse) that were eitherunmodified (NT control) or electroporated with Cas9 alone(Cas9 control) or had CISH KO. The tumor burden, monitoredby bioluminescence imaging (BLI), increased in all animalsthrough day 28 of the study, with no significant differences insurvival noted between the CISH KO group and controls (sup-plemental Figure 10). We next investigated the in vivo antitumoractivity of NK cells modified with both CISH KO and iC9/CAR19/IL-15 transduction. Mice received iC9/CAR19/IL-15 or CISH KOiC9/CAR19/IL-15 NK cells, and tumor growth was followed byweekly BLI imaging. Survival was monitored and all survivinganimals were sacrificed at day 35 and their organs examined forevidence of lymphoma. While animals treated with iC9/CAR19/IL-15 NK cells had evidence of tumor in their organs and suc-cumbed to lymphoma, those treated with CISH KO iC9/CAR19/IL-15 were tumor free and did not have evidence of lymphoma intheir spleen, liver, or bone marrow (Figure 5B-D; supplementalFigure 11A-B). Since dual-engineered cells had shown greaterpotency than either modification alone, even at low E:T ratiosin vitro, we hypothesized that it would also be more effective atcontrolling Raji lymphoma cells at lower infusion doses. Indeed,when as few as 33 106 CISH KO iC9/CAR19/IL-15 NK cells wereadministered, they significantly improved survival (P5 .003) andthe control of Raji lymphoma compared with control NK cells,although the mice eventually succumbed to tumor by day 46(Figure 5E-G). The higher dose (10 3 106) of the CISH KO iC9/CAR19/IL-15 NK cells eradicated lymphoma in mice, as dem-onstrated by BLI and pathologic examination, and led to sig-nificantly prolonged survival times (Figure 5E-H). This result wasassociated with improved NK cell persistence (up to 7 weeksafter infusion) in mice that received the CISH KO iC9/CAR19/IL-
15 cells compared with iC9/CAR19/IL-15 NK controls (Figure 5I;supplemental Figure 11C).
CISH KO was not associated with signs of increased toxicity inmice, including organ damage or increase in systemic in-flammatory cytokines or increased weight loss compared withcontrol groups (Figure 5D,H,J; supplemental Figure 12). Afterthe initial weight loss observed in all groups after irradiation,mice treated with CISH KO iC9/CAR19/IL-15 cells recoveredtheir weight to baseline over an extended period of follow-up(Figure 5J). Moreover, CAR-NK cells were not detectable in theorgans of animals at autopsy, indicating that CISH KO does notinduce uncontrolled expansion and persistence of CAR-NK cells.We conclude that silencing CISH in the context of CAR19/IL-15transduction in NK cells can secure robust control of tumor cellsin vivo without appreciable toxicity.
The presence of IL-15 in the CAR construct isnecessary for CISH KO–mediated improvement inNK cell functionSince our CAR construct expresses both CAR19 and IL-15, it wasimportant to understand whether the improvement in NK cellfunction following CISH KO is dependent on the presence of IL-15 in the CAR construct. To address this question, we transducedNK cells with a vector expressing CAR19 without the IL-15transgene (referred to as CAR19 NK cells) and analyzed theirCISH expression after culture with IL-2 and uAPC. CAR19 NKcells showed a time-dependent increase in CISH expression tothe same extent as observed with NT control, but to a lowermagnitude than in iC9/CAR19/IL-15 NK cells (supplementalFigure 13A). The efficiency of CISH KO in CAR19 NK cells wassimilar to what was achieved in CAR19/IL-15 NK cells (supple-mental Figure 13B) and improved their cytotoxicity against Rajiin vitro (supplemental Figure 13C) similar to NT-NK cells fol-lowing CISH KO. However, when tested in our Raji lymphomamouse model, CISH KO failed to improve the antitumor activityof CAR19 NK cells in vivo (supplemental Figure 13D-F), pointingto the essential role of IL-15 in mediating the effect of CISH KOon CAR-NK cell antitumor activity.
Safety evaluation of CISH KO iC9/CAR19/IL-15 NKcells for relapsed/refractory B-cell malignancyTo investigate the possibility that enhanced IL-15 signaling mayresult in autonomous dysregulated growth of CISH KO CB-NKcells, we cultured NT (control or CISH KO) or iC9/CAR19/IL-15 CB-NK cells (control or CISH KO) in media in the absence ofexogenous IL-2 or feeder cells for 45 days. CulturedCISH KONTor iC9/CAR.19/IL-15 CB-NK cells did not show signs of abnormalgrowth over 6 weeks (supplemental Figure 14A), after which thecells stopped expanding. Moreover, we did not observe an
Figure 4 (continued) each annotation. Color scale indicates signal intensity, ranging from lower (blue) to higher (red) expression. (C) Violin plots showing PI3K/Akt/mTORC1 andglycolysis signaling in NT (blue), NT-KO (green), CAR (purple), or CAR-KO (red) NK cells after correction for donor effect. Pathway activity of samples is regressed against donorand the residual is the corrected pathway activity. P values reported are computed relative to NT using the linear regression approach discussed in Materials and methods.**P # .01. (D) NT control (NT), NT CISH KO (NT-KO), iC9/CAR19/IL-15 control (CAR), or iC9/CAR19/IL-15 CISH KO (CAR-KO) NK cells were cultured without (2) or with (1) Rajicells for 30minutes, 1 hour, or 2 hours; NK cells were then purified, and the protein expression levels of p-Akt, Akt, p-S6, S6, c-MYC, and a-tubulin in NK cells were determined bywestern blot analysis. Representative blots from 2 independent experiments are shown. (E) A series of ECARs was calculated for NT control (blue lines), NTCISH KO (green lines),iC9/CAR19/IL-15 control (purple lines), or iC9/CAR19/IL-15 CISH KO (red lines) NK cells cocultured with Raji targets for 2 hours and subsequently purified and treated with 2 g/LD-glucose, 1 mM oligomycin, and 100 mM 2-deoxyglucose (2-DG). A representative graph from 5 independent experiments is shown. (F) Box plots summarize the ECAR data byNT control (blue box), NT CISH KO (green box), iC9/CAR19/IL-15 control (purple box), or iC9/CAR19/IL-15 CISH KO (red box) NK cells cocultured with Raji (n 5 5). Statisticalsignificance is indicated as *P# .05; bars represent mean values with standard deviation. (G) Bar graph summarizes the glucose concentration in the supernatant of the differentNK cell conditions cocultured with Raji for 2 hours: NT control (blue), NT CISH KO (green), iC9/CAR19/IL-15 control (purple), or iC9/CAR19/IL-15 CISH KO (red) NK cells (n5 3).Bars represent mean values with standard deviation (**P # .01).
CHECKPOINT DELETION IN ARMORED CB CAR-NK CELLS blood® 4 FEBRUARY 2021 | VOLUME 137, NUMBER 5 631
Dow
nloaded from http://ashpublications.org/blood/article-pdf/137/5/624/1798880/bloodbld2020007748.pdf by U
NIVER
SITY OF H
OU
STON
user on 03 March 2021

B C D
10
15
20
25
30
Body
wei
ght (
gram
s)
0 3 9 16 21 24 28 30 35
Raji alone Raji + CAR19/IL-15 CTRLRaji + CAR19/IL-15 CISH KO
Time (days)
*
Raji alone Raji + CAR19/IL-15 CTRLRaji + CAR19/IL-15 CISH KO
100
50
0
0 10 20 30
Perc
ent s
urviv
al
**
Time (days)
Rajialone
Raji +CAR19/IL-15CTRL
Raji +CAR19/IL-15CISH KO
Day
14
Day
21
Day
29
80000
60000
40000
20000
Radiance(p/sec/cm /sr)
*
Color ScaleMin= 8.00e3Max=8.00e4
A
Weekly bleeding,weekly BLI
Day -1:300cGyirradiation
Day 0:Injection ofRaji + NKcells
Day 1:BLI
E
G
Day
0D
ay 1
0D
ay 1
7D
ay 2
4
Day
31
Day
38
Day
46
Raji (R)alone
R+CAR19/IL-15CTRL 3x10⁶
R+CAR19/IL-15CISHKO 3x10⁶
R+CAR19/IL-15CTRL 10x106
R+CAR19/IL-15CISHKO 10x106
Day
341
80000
60000
40000
20000
Radiance(p/sec/cm /sr)
Color ScaleMin= 8.00e3Max=8.00e4
F
0 10 20 30 40 50
Time post-infusion (days)
50000
100000
150000
200000
**
Avg
radi
ance
(p/s/
cm2s
r)
Raji alone Raji+CAR19/IL-15 CTRL 3x10⁶
Raji+CAR19/IL-15 CTRL 10x106
Raji+CAR19/IL-15 CISH KO 10x106
Raji+CAR19/IL-15 CISH KO 3x10⁶
0 20 40 60 200 300 400
Time (days)
0
50
100
Perc
ent s
urviv
al
**
Raji alone Raji+CAR19/IL-15 CTRL 3x10⁶
Raji+CAR19/IL-15 CTRL 10x106
Raji+CAR19/IL-15 CISH KO 10x106
Raji+CAR19/IL-15 CISH KO 3x10⁶
*
H I JRajiCAR19/IL-15
CTRLCAR19/IL-15
CISH KO
H&E
CD20
H&E
CD20
Live
rB
one
mar
row
Day 7 Day 14 Day 21 Day 28
0
20
40
60
80
100
% C
D3-C
D56+
/hCD
45+ *
*
**
**
CAR19/IL-15 CTRL CAR19/IL-15 CISH KO
Time (days)
10
-1 6 16 21 27 33 42 48 76 8810211
613
014
415
720
0
15
20
25
30
Body
wei
ght (
gram
s)
Raji alone Raji+CAR19/IL-15 CTRL 3x10⁶
Raji+CAR19/IL-15 CTRL 10x106
Raji+CAR19/IL-15 CISH KO 10x106
Raji+CAR19/IL-15 CISH KO 3x10⁶
Figure 5. CISH KO iC9/CAR19/IL-15 NK cells improve tumor control and survival in a Raji lymphoma mouse model at low infusion doses. (A) Schematic diagramrepresenting the timeline of the in vivo experiments. (B) BLI imaging of an independent mouse experiment where mice received either Raji alone or Raji plus 103 106 CAR19/IL-15 control or Raji plus 103 106 CAR19/IL-15CISH KO (n5 5mice per group). *This mouse died accidentally during bleeding. (C) Survival curve for the 3 groups of mice describedin panel B (Raji alone, green; Raji plus 103 106 CAR19/IL-15 control, blue; Raji plus 103 106 CAR19/IL-15 CISH KO, red). Statistical significance is represented by *P# .05 for thecomparison of the red and blue curves and **P# .01 for the comparison of the blue and gray curves. (D) Graph representing the body weights of mice over time in the 3 different
632 blood® 4 FEBRUARY 2021 | VOLUME 137, NUMBER 5 DAHER et al
Dow
nloaded from http://ashpublications.org/blood/article-pdf/137/5/624/1798880/bloodbld2020007748.pdf by U
NIVER
SITY OF H
OU
STON
user on 03 March 2021

increase in the expression of genes related to chromosomalinstability32 such as aurora kinases or genes associated with DNAdamage following CISH KO (supplemental Figure 14B).
Even though CISH KO CAR-NK cells lacked evidence of serioustoxicity in our in vivo model, we planned additional in vitro andvivo experiments to ascertain that CISH KO CAR-NK cells couldbe swiftly eliminated in the event of toxicity in early phase clinicaltesting. Thus, we relied on the presence of iC9 as a suicide genein our vector to confirm that CISH KO CAR-NK cells couldbe induced to undergo apoptosis in the presence of asmall-molecule dimerizer, AP1903. The addition of as little as10 nM of AP1903 to cultures of CAR-NK cells induced theirapoptosis within 4 hours, and CISH KO did not affect theaction of the dimerizer (supplemental Figure 15A). The suicidegene was also effective at eliminating the CAR-NK cells in vivo(supplemental Figure 15B-C). Mice engrafted with Raji tumorreceived either control or CISH KO CAR-NK cells (n 5 5 miceper group) followed by treatment with the dimerizer ondays 7 and 9 after NK cell infusion. The animals were thensacrificed on day 12. Administration of the small-moleculedimerizer resulted in a striking reduction of the transducedcells (both control and CISH KO) in the blood and tissues (liver,spleen, and bone marrow) in all treated mice (supplementalFigure 15B-C).
Identifying possible off-target editing events mediated by theCRISPR-Cas9 RNP complexes is crucial before the approachdescribed here can bemoved to the clinic. Thus, we usedGuide-seq and rhAmpSeq technologies (Integrated DNA Technologies[IDT]) to assess genome-wide off-target effects for our CISHgRNAs. Guide-seq experiments were performed using HEK293cells that constitutively express Streptococcus pyogenes Cas9nuclease paired with highly modified synthetic gRNAs18 toidentify off-target sites with the highest potential to be edited foreach CRISPR RNA (crRNA) (Figure 6A-B). Potential Cas9 off-target cleavage sites were then quantified in NK cells electro-porated with RNP complexes targeting the CISH locus usingrhAmpSeq technology. Cells treated with wild-type S pyogenes.Cas9 protein had a low frequency of off-target editing eventswith either crRNA1, crRNA2, or the combination of both crRNAs(Figure 6C-D). The use of a high-fidelity Cas9 protein (Alt-R HiFiCas9 v3; IDT)33 further reduced the off-target events to , 0.5%(Figure 6C-D). These data support the translation of this ap-proach to the clinic.
DiscussionNK cell differentiation, effector function and survival, defined as‘fitness’, are coupled to metabolic reprogramming processes.However, signals and checkpoints that regulate NK cell fitness
and function in the tumor microenvironment are not well de-fined. Our study focuses on the impact of targeting CIS, anegative regulator of cytokine signaling10,34 in CAR-NK cellsengineered to constitutively express IL-15.
Having demonstrated the antitumor activity of armored CAR-NKcells preclinically and in the clinic,5,6 we exploited the potentialmechanistic synergy that could be achieved by deleting a cy-tokine checkpoint in IL-15–secreting CAR-NK cells. Here wereport that combining IL-15-secreting CAR-NK cells with CISHdeletion enhances antitumor activity more than either strategyalone. Using a xenograft mouse model of NK-resistant Rajilymphoma, we showed that CISH KO CAR19/IL-15 CB-NK cellspersist twice as long as control CAR19/IL-15 NK cells. We at-tribute this gain of function to IL-15–driven Akt/mTORC1 andMYC signaling secondary to removal of the CIS checkpoint, witha consequent increase in glycolytic activity. These data areconsistent with a recent report showing that deleting CISH iniPSC NK cells improves their metabolism and antitumor activ-ity.34 Our findings have clinical relevance because they establish,to our knowledge for the first time, proof-of-principle that tar-geting a critical cytokine checkpoint in cytokine-secreting ar-mored CAR-NK cells promotes their fitness and endows themwith superior antitumor function.
This increased antitumor activity was not associated with highertoxicity in the animals. While the NSG mouse model has limi-tations for the study of cytokine release syndrome,35 the absenceof overt toxicity such as rapid weight loss and early deathssupport the safety of our approach. A legitimate concern withCISH KO is that in the absence of a cytokine checkpoint, IL-15may drive malignant transformation of CAR-NK cells. However,our extensive studies using transcriptomic analysis, autonomousgrowth experiments, and in vivo studies did not show any evi-dence of long-term toxicity or malignant transformation of CISHKO CAR19/IL-15 NK cells.
Previous reports have shown that CISH deletion in NK cells isbeneficial only in murine tumor models where IL-15 or IL2was present in the tumor microenvironment or administeredexogenously.10,36 In our study in xenografted mice, there was noappreciable increase in the activity of NT NK cells or CAR19 NKcells (without IL-15 transgene) after CISH KO; the only im-provement was noted in mice treated with CISH KO CAR19/IL-15 NK cells. This suggests that the robust antitumor activity ofCISH KO CAR-NK cell depends upon the availability of IL-15 inthe tumor microenvironment. Thus, incorporation of the IL-15gene in the CAR construct, which avoids the toxicities seen withsystemic IL-15,27,28 likely played an important role in the en-hanced antitumor activity of CISH KO iC9/CAR19/IL-15 NK cellsin our tumor model. Given the absence or limited concentration
Figure 5 (continued)groups described in panel B. Bars representmean values with standard deviation. (E) BLI data from 5 groups of NSGmice treatedwith Raji alone (n5 5), Rajiplus 1 dose of 33 106 of iC9/CAR19/IL-15 control NK cells (n5 5) or iC9/CAR19/IL-15CISH KONK cells (n5 5), or Raji plus 1 dose of 103 106 of iC9/CAR19/IL-15 control NK cells(n 5 5) or iC9/CAR19/IL-15 CISH KO NK cells (n 5 3). (F-G) The average radiance (F) and survival curves (G) are shown for the 5 groups of mice described in panel E. Statisticalsignificance is represented by *P # .05 or **P # .01. (H) Photomicrographs of hematoxylin and eosin (H&E) and immunohistochemical CD20 staining of liver (top) and bonemarrow (BM) (bottom) frommice engraftedwith Raji B cell lymphoma either untreated or treated with iC9/CAR19/IL-15CISH KOor iC9/CAR19/IL-15 CTLRNK cells (103 106 doselevel). Representative images show absence of neoplastic B cells in liver and bonemarrow of a mouse treated with iC9/CAR19/IL-15CISH KONK cells in comparison with similartreatment with iC9/CAR19/IL-15 NK cells retainingCISH expression. Images were taken at 103 (liver) and 53 (bonemarrow) using a Leica DFC 495 camera. (I) Bar graph showingthe percentage of NK cells (CD32CD561CD451) present in peripheral blood frommice treated with iC9/CAR19/IL-15 control vs iC9/CAR19/IL-15CISH KONK cells at days 7, 14,21, and 28. Bars represent mean values with standard deviation. Statistical significance is represented by *P # .05 or **P # .01. (J) Graph showing body weights of NSG micegroups described in panel E over time.
CHECKPOINT DELETION IN ARMORED CB CAR-NK CELLS blood® 4 FEBRUARY 2021 | VOLUME 137, NUMBER 5 633
Dow
nloaded from http://ashpublications.org/blood/article-pdf/137/5/624/1798880/bloodbld2020007748.pdf by U
NIVER
SITY OF H
OU
STON
user on 03 March 2021

of IL-15 in the microenvironment of some cancers, expressingthis cytokine in the CAR construct is essential to achieving anoptimal therapeutic effect from CISH KO.
Our results suggest that removal of the CIS checkpoint mayincrease the metabolic fitness of armored CAR-NK cells byenhancing the activity of downstreammetabolic pathways. In themodel we propose (visual abstract), CISH KO releases the brakeon IL-15 signaling, which in turn enhances Akt/mTORC1activity,30 leading to upregulation of c-MYC and therefore gly-colysis, specifically in response to tumor targets. We havepreviously shown that upon activation, CAR19/IL-15 NK cellssecrete more IL-15.6 We now propose that upon activation bythe tumor, the higher levels of IL-15 in the microenvironmentleads to increased IL-15/Akt/mTORC1 and c-MYC signaling inCISH KO CAR19/IL-15 NK cells. We would emphasize that in ourstudies, c-MYC expression and the resultant shift in metabolismtoward aerobic glycolysis31 in CISH KO iC9/CAR19/IL-15 CB-derived NK cells were only apparent when the NK cells werecultured with tumor targets. This observation is important, as anexaggerated increase in glycolysis in ex vivo–expanded T cellshas been reported to severely impair the ability of CD81 T cellsto persist long-term and form memory cells in vivo.37 Hence,careful tuning of NK cell metabolism to ensure a timely increasein aerobic glycolysis in response to tumor stimulation would bedesirable.
In summary, this is the first report of a genetic engineeringstrategy combining armored CAR engineering and CISH de-letion in CB-derived NK cells. When tested in a preclinical tumormodel, this cellular product eliminated CD191 lymphoma cellswithout signs of serious toxicity. Our findings support themerging of armored CAR engineering and cytokine checkpointgene editing to enhance the therapeutic potential of NK cells inthe clinic.
AcknowledgmentsSupported in part by the generous philanthropic support to The Uni-versity of Texas MD Anderson Cancer Center Moonshot program, bygrants from the Cancer Prevention and Research Institute of Texas(RP160693) and the National Institutes of Health, National Cancer In-stitute (1 R01 CA211044-01 and PO1 5P01CA148600-03) and by CancerCenter Support (CORE) grant CA016672 (to the Flow Cytometry andCellular Imaging Facility and the A sequencing core facility at AndersonCancer Center). The authors acknowledge the support of a DeutscheKnochen Mark Spenderdatei Mechtild Harf research grant and a Societyfor Immunotherapy of Cancer-Amgen Cancer Immunotherapy in He-matologic Malignancies fellowship award (M.D.).
AuthorshipContribution: M.D., R.B., and P.P.B. performed experiments andinterpreted and analyzed data; N.B. performed western blot andseahorse assay experiments and interpreted and analyzed data; E.G.,
T G T A C A GC A G T GGC T GG T GG
• • A • • • • • • • • • • • • • • • • • 1406• • • • • • • • • • • • • • • • • • • • 1112• • • G • • • • • • • • • A • • • • • • 719G C C • • • • • • • A • • • • • • C • • 595• • C • • • • • • • G • • • A • • • • • 576• • G • • • • • • • C A • • • • • • • • 561G A C • • G • • • • • • • • • • • • • • 482
A C • • • • • • • • • • • - • • • • • • 296• C • • • • • • • A • • • • • • • G T • 239• • • • G • • • • • A • • • • • • A • • 218G • A • • • • • • • C A • • • • • G A • 207A • G T • • • • • • A • • • • • • • • • 200G • G • • • • • • • G • • • • • • • A • 196• • • • • • • • • A • • • • • • • • • • 188G C A C • • • • • • • A • • • • • G T • 187G T C • • • • • • • A • • • • • • • • • 177G • G • • • • • • • • • • • • • T G • • 176G T G • • • • • • • • • • • G • • G T • 175G A G • • • • • • • A • • • • • • • • • 173G • • • • • • • • • • • • • • • • G T • 167
G • • • • • • • • • G • • • • T • G T • G 163
A • • • • • • • • • A • • • • • • A T • 161• A G • A • • • • • • • • • • • • G T • 155• C • • • • • • • • • • • G • • • • • • 151C T G • • • • • • A • • • • • • • G A • 128A C C • • • • • • • • • • • • • • A • • 122• • • • • • • • G • C • • • • • • G • C 109C A • • • • • • • • A A • • • • A G T • 98• • • • • • • • • • A • • • A • C • • • 98G • C • • • • • • • • • • • • • • A • A 97C A • • G G • • • • • A • • • • • • • • 96G A • G • • • • • • G T • • • • • • • A 80
• C • • • • • • • • G • • • • • • • • • 80A A • • • • • • • A • • • T G • T G • 79• A • • T • A • • • • • • • • • • A • • 76A A • • • • C • • • • • • • • • C • • • 72A C • • • • • • • • C • • • • • A • • • 71G A G G • • • • • • • • • • • • • G A • 65A C C • • • • • • • • • • • • • • G • • 59
C T G • • • • • • • C • • T G • T G • 57C A G • • • • • • • • • C • • • • • A • 53A T G • • • • • • • • • • • • • • G • A 51A T G • • • • • • • • • • - • • • • • • 46• • A G • • C • • • • • • • • • • • • • 45• • • C • • • • • • G • • • • • • G • • 45G A • • • • • • • • G • • • • • • G • • 43G • • • T • • • • • • T • • • • • • • • 39
A • • • • • • • G • G A • • • • • G • • 38A • G • • • • • • • • • • • • • • G • • 37
T
C
A
G
G
G
GUIDE-SeqReads
GUIDE-SeqReads
GUIDE-SeqReadsA GGC C A C A T A G T GC T GC A C A
• • • • • • • • • • • • • • • • • • • • 917T T T • • • • • • • • • A • • • • • • • 346• T • • T • • • • • • • • • • A • • • • 275• A • • • C • • • • • • • • • • • • • • 209G T T T • • • • • • • • • • • • • • • • 137
C • • A • • • • C • • • • • • • • • • • 59• • A A • • • • C • • • • • • • • • G • 25G • • • • • • • • • • A • • • • • • A G 17• • • A • • • • G T • C T G C A • • 13T • • • • • • • G • • • • • • A • • • T 11• C A • • • • • • • • G • • • A • • • • 6• • A • • • A • • • - • A • • C • • • C 4• • • • • • • T • • • G • • • A • • • • 2• • • A T • • • A • • • • G • A • • A • 2
G
A C • • • • • • • • • • • - • • • • • • 36A • G • • • • • • A • • • • • • • G • • 36• • • • • T • • • • • • • • • • • G • T 34C A G • • • • • • • A • • • • • • G A • 33• • • • • • • T • • • • • • • • A G • T 32• • • C A • • • • • G • • • • • • • • • 30• • • • • • • T G T G • • T • • • • • • 30G • • • • • • • • • • • • T G • T G • 30C C • • G • • A G T G A C T G • A G • 28C • • • • • A A • • • • A • • • • • • A 27A • • • • • A • • • • • • • • • A G • • 27- - - • • • A G • • A • • • • • • • • • 26G • • • T • • T • • • • • • • • • • • • 25• • • • • • C • • C • • • • • • • G • A 24• C • • • • • • • • • • • • • • • A • A 23A • G • • • • • • • • • • • • • C • • • 22A A C • • • • • • • • • T • • • • G A • 21A T A G • • • • • • • • • T G • T G • 19C T G • • • • • • • • • • T G • A G • • 18G • • • T • • • • • • • • T G • T G • 18• • A G • • • • • • • • • • • • • • • • 17• • C • • • • • • • G A • • • • A G T • 16G T • • • • • • • • • • C T A • T G • 14A T G • • • • • • • • A • • C T • G T A 13• • • G • • • G • • G • • • • • • • A • 12• C • • A • • • • • C A • • • • • • • • 11• • A G T • • • • • • • • • • • • G T • 11A C • • • • • • • • G • • • • • A • • • 11G C A • • • • • • • • • T • • • • • • • 10C A C • • • • • • • G • • • • A • • T • 10G • • • G • • • • • • • • • C T • G T • 10A • C • • T • • • • • • • • • • • • T A 8• • • • • • • G • • • • • • G • T G T 8C • C • • • • • • • G • • • • • • • • • 8• • • G • • • • • • G A • • • • • • • • 8A • • • • • T • • • • • • T • • • • • T 7• T • • • • • • • • • • • • • • • • • • 7
A G
• C C • • • • • • • • • • G C T • G • • 6• • G • • • • • • • A • • • • • T G • T 6G • • • • • • • • • • • • T • • • G A • 5G • • • • • • • G • C A • • • • • G C • 5G • C • G • • • • • • • • • • • • • • T 5
• A A • • • • • • • • • • T • • • • • A 5• • • • • • • • • • C A T • • A • • • • 5A • A • T G C • • • • A • • • • • • • • 5• A • • • • • • • • G • • • • T A G T • 4• A G • • • • • • • • A C • • • • • A • 4• • • • • • • • • • • • • T A • • G • A 3A • C • • • • • • A • • C T G • T G • 3• • G • • • • • • • - • • • • • • G • • 2• • • • • • • G • • G • C T G • T • • • 2A • • • T G • • • • A • • • • • • • T • 2A • • • • • • A G • C A • • • • • • • • 2
A
CISH site 1 CISH site 2 CISH site 2(Continued)
A
B
CISH site 2
88.7
11.3
On-TargetOff-Target
CISH site 1
54.7 45.3
On-TargetOff-Target
DCISH guide 1 + 2
Panel 1CISH guide 1 + 2
Panel 2WT Cas9IDT HIFI Cas9
WT Cas9IDT HIFI Cas9
100
10
1
0.1Targeted loci (70)*
% in
serti
ons/d
elet
ions
100
10
1
0.1Targeted loci (11)*
CISH guide 1Panel 1
CISH guide 1Panel 2
WT Cas9IDT HIFI Cas9
WT Cas9IDT HIFI Cas9
Targeted loci (70)*
100
10
1
0.1
% in
serti
ons/d
elet
ions
100
10
1
0.1Targeted loci (11)*
C
Figure 6. Identification of Cas9 off-target sites byGUIDE-seq and quantification of potential Cas9 off-target cleavage sites using rhAmpSeq technology. (A) Sequencesof off-target sites identified by GUIDE-seq for 2 guides targeting the CISH locus. The guide sequence is listed on top with off-target sites shown below. The on-target site isidentified with a black square. Mismatches to the guide are shown and highlighted in color with insertions shown in gray. The number of GUIDE-seq sequencing reads are shownto the right of each site. 10 mM Alt-R crRNA XT complexed to Alt-R transactivating CRISPR RNA was delivered into HEK293 cells that constitutively express Cas9 nuclease bynucleofection. (B) Pie charts indicate the fractional percentage of the total unique, CRISPR-Cas9–specific read counts that are on-target (red) and off-target (blue). Total editing atthe on- and off-target sites identified by GUIDE-Seq was measured using rhAmpSeq, a multiplexed targeted enrichment approach for next-generation sequencing. For each ofthe 2CISH targeting guides, ampliconswere designed around eachCas9 cleavage site with reads.1%of the on-target GUIDE-seq reads. RNP complexes formedwith eitherWTCas9 (blue) or Alt-R HiFi Cas9 (red) were delivered via electroporation into expandedNK cells. (C) Insertion/deletion formation at each targeted loci forCISH guide 1 (panel 1, 11-plex) and CISH guide 2 (panel 2, 70-plex) when a single RNP complex was delivered. The on-target locus is indicated with a black asterisk underneath the first 2 bars of eachgraph. (D) Insertion/deletion formation at each targeted loci when CISH guide 1 and CISH guide 2 were codelivered. The on-target locus is indicated with a black asteriskunderneath the first 2 bars of each graph.
634 blood® 4 FEBRUARY 2021 | VOLUME 137, NUMBER 5 DAHER et al
Dow
nloaded from http://ashpublications.org/blood/article-pdf/137/5/624/1798880/bloodbld2020007748.pdf by U
NIVER
SITY OF H
OU
STON
user on 03 March 2021

N.U., A.K.N.C., J.L., G.O., E.E., M. Kaplan, V.N., M.B., L.B., X.W., andX.R.J. assisted with experiments; V.M., Y.X., Y.S., K.C., and J.W.assisted with RNA-sequencing analysis; D. Mak assisted with masscytometry sample processing; S.K. and N.P. assisted with masscytometry analysis; M.F., A.R., and N.V. performed and commentedon confocal microscopy for mitochondrial studies; M.S.S., G.R.R.,R.T., M.S.M., G.K., H.L., and M.A.B. performed off-target effect ex-periments and analysis and commented on the manuscript; N.W.F.performed pathologic examination and staining of mice tissues; M.Konopleva, N.V., E.J.S., R.E.C., K.C., E.L., S. Ang, S. Acharya, R.J.S.,S.L., and L.S. commented on the manuscript; D. Marin, M.M., L.N.K.,N.I., M.S., L.L., H.S., F.L.W.I.L., P.P.B., and Y.L. provided advice onexperiments and commented on the manuscript; K.R. and M.D.designed and directed the study; and K.R., M.D., and L.M.-F. wrotethe manuscript.
Conflict-of-interest disclosure: K.R., M.D., R.B., P.P.B., E.L., E.J.S, R.E.C.,D.M., and The University of TexasMDAnderson Cancer Center (MDACC)have an institutional financial conflict of interest with Takeda Pharma-ceutical for the licensing of the technology related to the research re-ported here. MDACC has implemented an Institutional Conflict ofInterest Management and Monitoring Plan to manage and monitor theconflict of interest with respect to MDACC’s conduct of any other on-going or future research related to this relationship. M.A.B., M.S.S.,G.R.R., M.S.M., G.K., and R.T. are employed by IDT, which manufacturesreagents similar to some described in the paper; M.A.B., M.S.M., R.T.,and G.R.R. own equity in DHR, the parent company of IDT. H.L. is aconsultant for IDT. The remaining authors declare no competing financialinterests.
ORCID profiles: M.D., 0000-0002-6026-8397; N.B., 0000-0003-0618-4798; M.F., 0000-0001-9971-4166; A.R., 0000-0002-1197-0198; G.O.,0000-0002-8548-5072; M. Kaplan, 0000-0003-0079-8617; S. Acharya,0000-0002-3907-9321; X.R.J., 0000-0002-8938-8886; S.K., 0000-0002-0347-4207; N.P., 0000-0003-1873-5542; L.B., 0000-0003-2624-8576;
R.T., 0000-0003-1283-9594; M.S.S., 0000-0002-9189-2547; G.R.R.,0000-0003-4634-5787; M.S.M., 0000-0002-8737-785X; M.A.B., 0000-0002-4218-857X; H.L., 0000-0003-4874-2874; N.W.F., 0000-0002-7711-6031; K.C., 0000-0003-4013-5279; M. Konopleva, 0000-0002-9347-2212; R.E.C., 0000-0002-4314-5037.
Correspondence: Katayoun Rezvani, Department of Stem CellTransplantation and Cellular Therapy, The University of Texas MDAnderson Cancer Center, Houston, TX, 77030-4009; e-mail:[email protected].
FootnotesSubmitted 22 June 2020; accepted 29 August 2020; prepublished onlineon Blood First Edition 9 September 2020. DOI 10.1182/blood.2020007748.
*M.D. and R.B. contributed equally to this study.
All requests for raw data and materials will be reviewed by MD AndersonCancer Center to verify if the request is subject to any intellectualproperty or confidentiality obligations. Any data and materials that canbe shared by the corresponding author will be released freely or via aMaterial Transfer Agreement if deemed necessary.
The online version of this article contains a data supplement.
There is a Blood Commentary on this article in this issue.
The publication costs of this article were defrayed in part by pagecharge payment. Therefore, and solely to indicate this fact, this article ishereby marked “advertisement” in accordance with 18 USC section1734.
REFERENCES1. Morvan MG, Lanier LL. NK cells and cancer:
you can teach innate cells new tricks. Nat RevCancer. 2016;16(1):7-19.
2. Daher M, Rezvani K. Next generation naturalkiller cells for cancer immunotherapy: thepromise of genetic engineering. Curr OpinImmunol. 2018;51:146-153.
3. Mehta RS, Shpall EJ, Rezvani K. Cord blood asa source of natural killer cells. Front Med(Lausanne). 2016;2:93.
4. Sarvaria A, Jawdat D, Madrigal JA,Saudemont A. Umbilical cord blood naturalkiller cells, their characteristics, and potentialclinical applications. Front Immunol. 2017;8:329.
5. Liu E, Marin D, Banerjee P, et al. Use of CAR-transduced natural killer cells in CD19-positivelymphoid tumors. N Engl J Med. 2020;382(6):545-553.
6. Liu E, Tong Y, Dotti G, et al. Cord blood NKcells engineered to express IL-15 and a CD19-targeted CAR show long-term persistence andpotent antitumor activity. Leukemia. 2018;32(2):520-531.
7. Pfefferle A, Huntington ND. You have got afast CAR: chimeric antigen receptor NK cells incancer therapy. Cancers (Basel). 2020;12(3):E706.
8. Krebs DL, Hilton DJ. SOCS proteins: negativeregulators of cytokine signaling. Stem Cells.2001;19(5):378-387.
9. Linossi EM, Babon JJ, Hilton DJ, Nicholson SE.Suppression of cytokine signaling: the SOCS
perspective. Cytokine Growth Factor Rev.2013;24(3):241-248.
10. Delconte RB, Kolesnik TB, Dagley LF, et al. CISis a potent checkpoint in NK cell-mediatedtumor immunity. Nat Immunol. 2016;17(7):816-824.
11. Zhang JG, Farley A, Nicholson SE, et al. Theconserved SOCS box motif in suppressors ofcytokine signaling binds to elongins B and Cand may couple bound proteins to protea-somal degradation. Proc Natl Acad Sci USA.1999;96(5):2071-2076.
12. Yoshimura A, Nishinakamura H, Matsumura Y,Hanada T. Negative regulation of cytokinesignaling and immune responses by SOCSproteins. Arthritis Res Ther. 2005;7(3):100-110.
13. Inagaki-Ohara K, Hanada T, Yoshimura A.Negative regulation of cytokine signaling andinflammatory diseases. Curr Opin Pharmacol.2003;3(4):435-442.
14. Hoyos V, Savoldo B, Quintarelli C, et al.Engineering CD19-specific T lymphocyteswith interleukin-15 and a suicide gene toenhance their anti-lymphoma/leukemia ef-fects and safety. Leukemia. 2010;24(6):1160-1170.
15. Vera J, Savoldo B, Vigouroux S, et al. T lym-phocytes redirected against the kappa lightchain of human immunoglobulin efficiently killmature B lymphocyte-derived malignant cells.Blood. 2006;108(12):3890-3897.
16. Li L, Chen H, Marin D, et al. A novel immaturenatural killer cell subpopulation predicts
relapse after cord blood transplantation.Blood Adv. 2019;3(23):4117-4130.
17. Shah N, Martin-Antonio B, Yang H, et al.Antigen presenting cell-mediated expansionof human umbilical cord blood yields log-scale expansion of natural killer cells with anti-myeloma activity. PLoS One. 2013;8(10):e76781.
18. Tsai SQ, Zheng Z, Nguyen NT, et al. GUIDE-seq enables genome-wide profiling of off-target cleavage by CRISPR-Cas nucleases.NatBiotechnol. 2015;33(2):187-197.
19. Dobosy JR, Rose SD, Beltz KR, et al. RNaseH-dependent PCR (rhPCR): improved speci-ficity and single nucleotide polymorphismdetection using blocked cleavable primers.BMC Biotechnol. 2011;11(1):80.
20. Cherkassky L, Morello A, Villena-Vargas J,et al. Human CAR T cells with cell-intrinsic PD-1 checkpoint blockade resist tumor-mediatedinhibition. J Clin Invest. 2016;126(8):3130-3144.
21. Chong EA, Melenhorst JJ, Lacey SF, et al. PD-1 blockade modulates chimeric antigen re-ceptor (CAR)-modified T cells: refueling theCAR. Blood. 2017;129(8):1039-1041.
22. Matsuda T, Yamamoto T, Kishi H, YoshimuraA, Muraguchi A. SOCS-1 can suppressCD3zeta- and Syk-mediated NF-AT activationin a non-lymphoid cell line. FEBS Lett. 2000;472(2-3):235-240.
23. Palmer DC, Guittard GC, Franco Z, et al. Cishactively silences TCR signaling in CD81 T cellsto maintain tumor tolerance. J ExpMed. 2015;212(12):2095-2113.
CHECKPOINT DELETION IN ARMORED CB CAR-NK CELLS blood® 4 FEBRUARY 2021 | VOLUME 137, NUMBER 5 635
Dow
nloaded from http://ashpublications.org/blood/article-pdf/137/5/624/1798880/bloodbld2020007748.pdf by U
NIVER
SITY OF H
OU
STON
user on 03 March 2021
24. Mukherjee M, Mace EM, Carisey AF, AhmedN, Orange JS. Quantitative imaging ap-proaches to study the CAR immunologicalsynapse. Mol Ther. 2017;25(8):1757-1768.
25. Krenciute G, Prinzing BL, Yi Z, et al. Transgenicexpression of IL15 improves antiglioma ac-tivity of IL13Ra2-CAR T cells but results inantigen loss variants. Cancer Immunol Res.2017;5(7):571-581.
26. Felices M, Lenvik AJ, McElmurry R, et al.Continuous treatment with IL-15 exhaustshuman NK cells via a metabolic defect. JCIInsight. 2018;3(3):96219.
27. Conlon KC, Lugli E, Welles HC, et al.Redistribution, hyperproliferation, activationof natural killer cells and CD8 T cells, andcytokine production during first-in-humanclinical trial of recombinant human interleukin-15 in patients with cancer. J Clin Oncol. 2015;33(1):74-82.
28. Waldmann TA, Lugli E, Roederer M, et al.Safety (toxicity), pharmacokinetics, immuno-genicity, and impact on elements of the nor-mal immune system of recombinant human IL-
15 in rhesus macaques. Blood. 2011;117(18):4787-4795.
29. Donnelly RP, Loftus RM, Keating SE, et al.mTORC1-dependent metabolic reprogram-ming is a prerequisite for NK cell effectorfunction. J Immunol. 2014;193(9):4477-4484.
30. Marçais A, Cherfils-Vicini J, Viant C, et al. Themetabolic checkpoint kinase mTOR is essen-tial for IL-15 signaling during the developmentand activation of NK cells.Nat Immunol. 2014;15(8):749-757.
31. Donnelly RP, Finlay DK. Glucose, glycolysisand lymphocyte responses. Mol Immunol.2015;68(2 2 Pt C):513-519.
32. Carter SL, Eklund AC, Kohane IS, Harris LN,Szallasi Z. A signature of chromosomal in-stability inferred fromgene expression profilespredicts clinical outcome in multiple humancancers. Nat Genet. 2006;38(9):1043-1048.
33. Vakulskas CA, Dever DP, Rettig GR, et al. Ahigh-fidelity Cas9 mutant delivered as a ri-bonucleoprotein complex enables efficientgene editing in human hematopoietic stem
and progenitor cells. Nat Med. 2018;24(8):1216-1224.
34. Zhu H, Blum RH, Bernareggi D, et al.Metabolic reprograming via deletion of CISHin human iPSC-derived NK cells promotesin vivo persistence and enhances anti-tumoractivity. Cell Stem Cell. 2020;27(2):224-237.e6.
35. Giavridis T, van der Stegen SJC, Eyquem J,Hamieh M, Piersigilli A, Sadelain M. CAR Tcell-induced cytokine release syndromeis mediated by macrophages and abatedby IL-1 blockade. Nat Med. 2018;24(6):731-738.
36. Putz EM, Guillerey C, Kos K, et al. Targetingcytokine signaling checkpoint CIS activatesNK cells to protect from tumor initiation andmetastasis. OncoImmunology. 2017;6(2):e1267892.
37. Sukumar M, Liu J, Ji Y, et al. Inhibiting gly-colytic metabolism enhances CD81 T cellmemory and antitumor function. J Clin Invest.2013;123(10):4479-4488.
636 blood® 4 FEBRUARY 2021 | VOLUME 137, NUMBER 5 DAHER et al
Dow
nloaded from http://ashpublications.org/blood/article-pdf/137/5/624/1798880/bloodbld2020007748.pdf by U
NIVER
SITY OF H
OU
STON
user on 03 March 2021