Embed Size (px)
Citation preview

259CYCLOSTRATIGRAPHY OF THE TRIASSIC TO JURASSIC DEEP-SEA SEQUENCES IN JAPAN:
FREQUENCY MODULATION FOR STRATIGRAPHIC CORRELATION
MASAYUKI IKEDA
Department of Earth Sciences, Graduate School of Science and Engineering, Ehime University, 790-8577, e-mail: [email protected]
Abstract—This study demonstrates that the frequency modulation of astronomically-related sedimentary rhythmscan be used as a potential stratigraphic correlation tool for Mesozoic strata. For this purpose, cyclostratigraphicanalyses were conducted on Upper Triassic to Lower Jurassic bedded chert sequences consisting of alternatingchert-shale beds from the Kurusu and Katsuyama sections (Inuyama area, central Japan), and the Pisenaizawasection in the Shizunai area, northern part of Japan, spanning 30 Myr, 20 Myr, and 15 Myr period, respectively.The average duration of each chert–shale couplet in each section is consistent with ca. 20 ka precession cycle.Wavelet spectral analysis of a bed number series of chert-bed thickness reveals ca. 5, 20, and 100 bed cycles, whichcorrespond to the periodicities of the ca. 100, 400, and 2000 ka eccentricity cycles, respectively, assuming eachchert–shale couplet as a ca. 20 ka precession cycle. The similar patterns of the frequency modulation of the ca. 20bed cycles detected from these sections are interpreted as the result of the frequency modulation of ca. 20 kaprecession cycle within each 405 ka eccentricity cycle of constant periodicity. The timing of frequency modulationof ca. 20 bed cycle is synchronous between Katsuyama and Kurusu sections based on the high-resolution bios-tratigraphy across the Triassic-Jurassic boundary. Based on the stratigraphic variations in the frequency modula-tion of the ca. 20 bed cycle, the horizon of potential Triassic-Jurassic boundary is recognized in the Pisenaizawasection. This correlation is supported by the in-phase relationship of ca. 2 Myr cycle of the chert bed-thicknessvariation across the Triassic-Jurassic boundary among these sequences.
INTRODUCTION
The orbital cyclicity recorded in sedimentary rhythms provides ahigh-resolution time scale for geologic records (e.g., Fischer, 1986). Theastronomically calibrated time scale is nearly complete for Cenozoicstrata, and attempts have been made to extend it to Mesozoic and olderstrata (e.g., Hinnov and Ogg, 2008). For Triassic strata, astronomicallycontrolled sedimentary cycles are recognized on a global scale, such asthe lacustrine sequences in North America, Europe, and Africa (e.g.,Olsen and Kent, 1996, 1999; Vollmer et al., 2007; Deenen et al., 2010;Olsen et al., 2011), the carbonate platforms in Europe and China (e.g.,Ruhl et al., 2010; Huang et al., 2011; Wu et al., 2012), and the pelagicdeep-sea sequences in Japan (Ikeda et al., 2010a, b; Ikeda and Tada,2013). However, the Triassic astronomical time scale is under construc-tion due to the limit of length of these records and the difficulty of thestratigraphic correlation between the different sections.
Conversely, bedded chert accumulated continuously for long-termperiods in pelagic Panthalassa before the Cretaceous, and consists ofrhythmic alternations of chert and shale controlled by astronomical cycles(e.g., Fischer, 1976; Hori et al., 1993; Ikeda et al., 2010a, b; Ikeda andTada, 2013). Consequently, the bedded chert sequences are the potentialtemplate for pre-Cretaceous cyclostratigraphy (Ikeda et al., 2010a).Nevertheless, to establish a continuous cyclostratigraphy of the beddedchert sequence, the bedded chert sequences need to be correlated be-tween the different sections with high resolution. Lithostratigraphic cor-relation using some key beds is a high-resolution and useful method atleast at the regional scale (e.g., Sugiyama, 1997; Ikeda et al., 2010a), butit is difficult to correlate between distant localities solely bylithostratigraphy. Radiolarian and conodont biostratigraphy is used ex-tensively for correlation of bedded chert sequences and for age constraint(e.g., Yao et al., 1980; Sugiyama, 1997). However, biostratigraphic reso-lution for bedded chert is generally on the order of millions of years,depending on fossil occurrence (e.g., Sugiyama, 1997). This resolution isseveral orders coarser than that of cyclostratigraphy, which uses theastronomical parameters, such as the ca. 20 ka precession cycle, the ca.40 ka obliquity cycle, and the ca. 100 ka eccentricity cycle. Therefore,orbital-scale, high-resolution stratigraphy in addition to cyclostratigraphy,
is necessary for cyclostratigraphic correlation between different locali-ties (e.g., Olsen et al., 1996; Ruhl et al., 2010).
Aside from these basic orbital cycles, it is known that astronomi-cal parameters modulate at amplitudes and frequencies on time scaleslonger than 100 ka (e.g., Hinnov, 2000). Although the amplitude of theastronomical cycles recorded in stratigraphic records can vary in differ-ent regions through non-linear interactions within Earth surface systems,frequency modulation should be recorded linearly in strata on a globalscale (e. g. Hinnov, 2000). Thus, if the similar frequency modulations ofthe astronomical rhythms are detected from strata at different localities,their frequency modulations could be used as a potential stratigraphiccorrelation tool.
To demonstrate this possibility, this study examined the strati-graphic variations in the frequency of ca. 20 bed cycles, which are con-sidered the result of frequency modulation of ca. 20 ka precession cycleswithin 405 ka eccentricity cycles of constant periodicity (e.g., Ikeda etal., 2010a). I adopted the method of Ikeda et al. (2010a) to the UpperTriassic to Lower Jurassic bedded chert sequences in Japan. Studiedsections are the Katsuyama and Kurusu section in the Inuyama area,central Japan and the Pisenaizawa section in the Shizunai area, northernpart of Japan, which cover intervals of ca. 30 Myr, 20 Myr, and 15 Myr,respectively. To estimate the duration of each chert-shale couplet, thisstudy established bed-by-bed scale high-resolution lithostratigraphy ofbedded chert sequences at each section, and confirmed the ca. 20 kaprecession-cycle origin of the chert-shale couplets based on the bios-tratigraphic age. To detect the astronomical cycle from the sedimentaryrhythms of bedded chert at each section, wavelet spectral analyses wereconducted on a bed-number series of chert-bed thicknesses. Based on thehigh-resolution biostratigraphic correlation of the end-Triassic extinc-tion interval between Katsuyama and Kurusu sections (Carter and Hori,2005; Kuroda et al., 2010), I confirmed the validity of the frequencymodulation of ca. 20 bed cycle as the stratigraphic correlation tool. ThePisenaizawa section, where the end-Triassic extinction interval was notwell constrained, was then correlated with the Katsuyama and Kurususections by using the frequency modulation of ca. 20 bed cycle. Thiscyclostratigraphic correlation was validated by the phase relations of ca.100 bed (2 Myr) cycles among these sequences. These results provide a
Tanner, L.H., Spielmann, J.A. and Lucas, S.G., eds., 2013, The Triassic System. New Mexico Museum of Natural History and Science, Bulletin 61.

260new cyclostratigraphic method for stratigraphic correlation of the sec-tions without high-resolution age control.
GEOLOGIC SETTING
General Geology and Lithostratigrpahy
The Katsuyama section (e.g., Hori, 1990, 1997; Matsuoka et al.,1994; Carter and Hori, 2005) and Kurusu section (e.g., Hori, 1988, 1990,1992, 1997; Kuroda et al., 2010) are located in the Inuyama area, south-western part of the Mino Terrane, Central Japan (Fig. 1). The MinoTerrane is a Paleozoic–Mesozoic accretionary complex consisting ofgreenstone, limestone, bedded chert, and clastic rocks (Wakita, 1988).The accretionary complex exposed in the Inuyama area comprises MiddleTriassic to Lower Jurassic bedded chert and Middle Jurassic clasticrocks, which are repeated as tectonic slices (Fig. 1; Matsuda and Isozaki,1991; Yao et al., 1980). The Katsuyama and Kurusu sections are locatedin different thrust sheets, slices CH-3 and CH-4, respectively (Fig. 1;e.g., Yao et al., 1980). According to the distribution of these thrust sheets,the two sections were originally several tens of kilometer apart (e.g.,Kimura and Hori, 1993).
The Pisenaizawa section is located in the Shizunai area, southernpart of the Kamuikotan metamorphic complex, northern part of Japan, adistance of ca. 1000 km from the Inuyama area (Fig. 1). The Kamuikotancomplex is a Mesozoic accretionary complex consisting of greenstone,limestone, bedded chert, and clastic rocks (e.g., Suzuki et al., 1961; Horiand Sakakibara, 1994), which were formed in Early Cretaceous time. Thebedded chert sequence from this area spans from the Upper Triassic toLower Cretaceous, and is well exposed along the Pisenaizawa River,Hokkaido, Japan (Hori and Sakakibara, 1994).
The bedded chert sequence was generally deposited on the pelagicdeep-sea floor of Panthalassa below the carbonate compensation depth(CCD), whereas the clastic rocks are considered to have been depositedwithin a trench in a subduction zone (e.g., Matsuda and Isozaki, 1991).Paleomagnetic studies of the bedded chert sequence in the study areasuggest that the site of deposition moved from low latitudes during theMiddle Triassic to middle latitudes during the Lower Jurassic as a courseof plate motion (Fig. 1; Shibuya and Sasajima, 1986; Oda and Suzuki,2000; Ando et al., 2001).
The bedding of these pelagic deep-sea sequences consists of alter-nating thick chert and thin shale beds, the so-called chert-shale couplet.The alternation of chert-shale couplets was considered the result of thecyclical accumulation of biogenic SiO2 in environments with extremelyslow accumulation of shale with probable eolian dust (Hori et al., 1993).Hori et al. (1993) also proposed that the individual chert–shale coupletsof the Upper Triassic to Lower Jurassic bedded chert at the Katsuyamaand Kurusu sections in the Inuyama area may represent astronomicalcycles, as the average duration represented by each couplet is 10–70 ka,with median durations of 20 ka for the Upper Triassic and 40 ka for theLower Jurassic; these values roughly agree with the periodicities of theprecession and obliquity cycles, respectively. The sedimentary rhythmsof the Middle Triassic bedded chert sequence in the Inuyama area havebeen proven to be of astronomical origin based on the hierarchal cyclicitiesof ca. 100 ka, 405 ka, 1800 ka, and 3600 ka from chert-bed thicknessvariation (Ikeda et al., 2010a).
The studied Katsuyama section consists of Norian to Toarcianbedded chert, 36 m thick, which is red, green-gray, purple, and black incolor (Fig. 2; e.g., Hori, 1990; Matsuoka et al., 1994; Sugiyama, 1997;Ikeda and Tada, 2013). The lower and middle parts of this section con-tain ca. 30 mm-thick red shale beds, which correlate to the shale bedsnamed CS-2 and CS-3 of Sugiyama (1997), in ascending order (Fig. 2).The lower limit of this section consists of a white chert bed, which is ca.200 mm thick, about 0.5 m below the CS-2 bed. The upper limit of thissection consists of a green-gray chert bed just below a white chert bed ca.500 mm thick, which correlates to the massive Toarcian white chert ofHori (1990). The bed number of this section is defined such that the red
chert bed just above a white chert bed, which is the lower limit of ourcolumnar section, is assigned as number 1, and the bed number increasesup section until bed number 1596.
The Kurusu section consists of Rhaetian to Toarcian bedded cherts,ca. 22 m thick, which are mostly greenish-gray in color (Fig. 2; Hori,1988, 1990, 1992). There are no remarkable thick shale beds in the lowerto middle part of this section (Fig. 2; Hori, 1988, 1990). The bed numberis referenced after Hori et al. (2007), and increases up section. The lowerlimit of this section is cut by a fault just below a green-gray chert (bednumber KU – 125 of Hori et al., 2007). The upper limit of the Kurususection consists of a green-gray chert (bed number KU + 625 of thisstudy), just below a red shale bed ca. 100 mm thick. The bottom of thisred shale bed is deformed by a fault.
The Pisenaizawa section studied consists of Norian red siliceousshale, ca. 5 m thick, Norian to the Valanginian red bedded chert, ca. 90 mthick, Valanginian to Hauterivian varicolored shale, ca. 6 m thick, andHauterivian to Barremian black shale, ca. 5 m thick with frequent interca-lation of acidic tuff, in ascending order (Hori and Sakakibara, 1994). Thepurple bedded chert, ca. 0.5 m thick, is intercalated within the lower partof this section (Fig. 2). The lowest purple chert bed of this purplebedded chert is assigned as bed number PS – 1, and the bed numberincreases up section and decrease down section. The bedded chert se-quence of bed number PS – 438 to PS + 240 is discussed below toestablish the cyclostratigraphy across the Triassic-Jurassic boundary.
Biostratigraphy
The age for the Upper Triassic to Lower Jurassic bedded chertsequences is established based on the radiolarian-conodont-ammonoidbiostratigraphic correlation to reference sections where numerical ageshave been estimated. The ages of the stage boundaries are after Ogg(2012) and Ogg and Hinnov (2012). The Norian/Rhaetian boundary in
FIGURE 1. A, A geologic map of the Inuyama area showing the location ofthe Katsuyama and Kurusu sections (modified from Matsuda and Isozaki,1991). B, Location map of study areas showing the Inuyama area in theMino Terrane and the Sizunai area in the Kamuikotan (inset).

261
FIG
UR
E 2.
The
est
imat
ed a
vera
ge s
edim
enta
tion
rate
s an
d th
e av
erag
e du
ratio
ns o
f in
divi
dual
che
rt-sh
ale
coup
lets
for
the
Upp
er T
riass
ic to
Low
er J
uras
sic
bedd
ed c
hert
sequ
ence
s at
A, K
atsu
yam
a se
ctio
n;B
, Kur
usu
sect
ion
in t
he I
nuya
ma
area
, Cen
tral
Japa
n; a
nd C
, Pis
enai
zaw
a se
ctio
n in
the
Shi
zuna
i ar
ea, n
orth
ern
part
of J
apan
. The
ave
rage
dur
atio
ns o
f th
e co
uple
ts w
ere
estim
ated
fro
m t
he d
urat
ion
of th
e in
terv
als
of in
tere
st d
ivid
ed b
y th
e nu
mbe
r of
bed
s (s
ee th
e te
xt f
or d
etai
ls).
The
rang
es o
f th
e es
timat
ed d
urat
ions
are
bas
ed o
n er
rors
in th
e ag
es o
f ge
olog
ical
sta
ge b
ound
arie
s (O
gg, 2
012;
Mun
dil
et a
l., 2
010,
Hüs
ing
et a
l., 2
011)
and
unc
erta
intie
s in
the
stra
tigra
phic
pos
ition
s of
the
geol
ogic
al b
ound
arie
s de
scrib
ed b
y ra
diol
aria
n zo
nes
are
base
d on
Hor
i (19
88, 1
990,
199
2, 1
997)
, Hor
i and
Sak
akib
ara
(199
4),
Sugi
yam
a (1
997)
, C
arte
r an
d H
ori
(200
5),
Hor
i et
al.
(200
7),
and
Kur
oda
et a
l. (2
010)
. Th
e lit
holo
gic
type
s of
bed
ded
cher
t ar
e m
odif
ied
afte
r Su
giay
ama
(199
7);
B-,
F- a
nd A
-typ
es a
repr
edom
inat
ed b
y >
1 m
m t
hick
sha
le b
eds,
< 1
mm
thi
ck s
hale
bed
s, a
nd t
he a
ltern
atio
n of
B-
and
F-ty
pes
with
in 1
m. N
or, R
ht, H
et, S
in, P
lb, a
nd T
oa =
Nor
ian,
Rha
etia
n, H
etta
ngia
n, S
inem
uria
n,Pl
iens
bach
ian
and
Toar
cian
sta
ges.

262the Katsuyama section is correlated to the last occurrence of the radiolar-ian Betracclum deweveri within the interval between beds 400 and 430 inthe Katsuyama section (Sugiyama, 1997), based on the radiolarian bios-tratigraphic correlation with the Queen Charlotte Islands, Canada, wherethe Norian/Rhaetian boundary is identified as the Gnomohaloritescordilleranus/Paracochloceras amoenum ammonoid zone boundary(Carter, 1993; Carter and Orchard, 2007). This ammonoid zone bound-ary is correlated with Paracochloceras asuessi/Vandaites stuerzenbaumiammonoid zone in the Steinbergkogel section, Austria, where the Norian/Rhaetian boundary was estimated as 209.5±1.0 Ma by magneto-stratigraphic correlation with the astronomically tuned geomagnetic po-larity time scale of the Newark Supergroup (Hüsing et al., 2011; Olsen etal., 2011; Ogg, 2012).
The end-Triassic extinction intervals in the Katsuyama and Kurususections were well constrained within the interval of chert bed number2534 and the interval between KU + 30 and KU + 37, respectively, basedon the radiolarian faunal turnover from Globolaxtorum tozeri zone toPantanellium tanuense zone of Carter and Hori (2005) with the lastoccurrence of conodont Misikella posthernsteini (Hori, 1992; Carter andHori, 2005, Kuroda et al., 2010). Across the end-Triassic extinctioninterval, the radiolarian fauna shows a similar turnover pattern betweenthe pelagic bedded chert sequence in the Inuyama area and the shallowmarine sequence in the Queen Charlotte Islands, Canada (Carter andHori, 2005). In the Queen Charlotte Islands, the radiolarian turnover wasalso followed by the last occurrence of the conodont Norigondolella sp.and the Triassic ammonoid Choristoceras rhaeticum, and predated bythe first occurrence of Jurassic ammonoid Psiloceras aff. primocostatum(Tipper and Guex, 1994; Williford et al., 2007). A similar ammonoidturnover at the end-Triassic is widely found in shallow marine sequences,such as the New York Canyon section in the U.S.A., the Pucara sectionin Peru and the St. Audrie’s Bay section in the U.K. (e.g. Warrington etal., 2008; Schoene et al., 2010). The correlation among these areas issupported by using the positive excursion of organic carbon isotopeafter the sharp negative excursion (Hesselbo et al., 2002; Ward et al.,2001, 2004, 2007; Williford et al., 2007; Kuroda et al., 2010).
A U-Pb age of 201.36 ± 0.13 Ma was measured at the horizonbetween the end-Triassic extinction interval and the Triassic-Jurassicboundary in the Pucara section (Schoene et al., 2010). Additionally, theduration of the interval between the extinction interval and the Triassic-Jurassic boundary, which are characterized by the last occurrences of theTriassic fauna and flora, including the conodont Misikella posthernsteini,and the first occurrence of Jurassic ammonoid Psiloceras planorbis,respectively, was estimated as 6 precession cycles (~ 120 kyr), accordingto the cyclostratigraphy at the St. Audrie’s Bay section (Ruhl et al.,2010). Based on these chronostratigraphic constraints, the end-Triassicextinction in the Inuyama bedded chert can be constrained within thetime interval of 201.36 ± 0.20 Ma. The age uncertainty arises from theU-Pb age error and the duration of the end-Triassic extinction interval inthe Pucara and St. Audrie’s sections, respectively, as described above(Schoene et al., 2010; Ruhl et al., 2010; Ogg and Hinnov, 2012). TheSinemurian/Pliensbachian boundary at the Kurusu section is correlatedto the horizon within the middle part of the Parahsuumsimplum (Ps) IIofHori (1990, 1997) assemblage zone within the interval between KU +400 and KU + 500 in the Kurusu section (Hori, 1988, 1997). The age ofthe Sinemurian/Pliensbachian boundary is assigned as 190.8 ± 1.0 Ma(Ogg and Hinnov, 2012). The Pliensbachian/Toarcian boundary is corre-lated with the interval between bed number 1560 and 1580 in theKatsuyama section based on the uppermost part of P. simplum IV Subzoneof Hori (1990, 1997) (Trillus elkhornensis Assemblage zone) and thelower part of the H. hexagonus (Hh) Zone (Hori, 1990, 1997; Gröcke etal., 2010). These radiolarian zones equate to the radiolarian zones inCarter et al. (2010) of Eucyrtidiellum nagaiae–Praeparvicingula tlellensisto Elodium pessagnoi–H. hexagonus. The ages of these radiolarian zoneswere constrained as upper Pliensbachian and lower Toarcian, respec-
tively, by ammonite biostratigraphy of Queen Charlotte Islands andother areas from North America (Carter et al., 2010). Thus, the upper-most part of the P. simplum IV Subzone of Hori (1990, 1997) is equiva-lent to the Emaciaticeras emaciatum/Dactylioceras tenuicostatum am-monite Zone boundary of Europe, where the Pliensbachian/Toarcianboundary was assigned as 182.7 ± 0.5 Ma (Ogg and Hinnov, 2012). Thiscorrelation is supported by the negative excursion of organic carbonisotope (Grocke et al., 2010). In the Pisenaizawa section, the Norianradiolarian fossils were obtained ca. 20 m below the PS – 1 (Hori andSakakibara, 1994). The duration of the Norian was assigned as the inter-val between 228.4 ± 2.0 Ma and 209.5 ± 1.0 Ma (Ogg, 2012). The lowerToarcian radiolarian fossils Tricolocapsa sp. and Bagotum sp. were ob-tained ca. 10 m above PS – 1 (Hori and Sakakibara, 1994).
METHOD
The method of Ikeda et al. (2010a) was used to detect astronomi-cal cycles from the sedimentary rhythms of the Upper Triassic to LowerJurassic bedded chert sequence in the Katsuyama, Kurusu, andPisenaizawa sections. For this purpose, I established high-resolutionlithostratigraphy by measuring the thicknesses of individual chert andshale beds in each outcrop with a precision of one mm. At each outcrop,some transects were selected with minimal lateral change in bed thick-ness caused by tectonic deformation and diagenesis. I constructed con-tinuous columnar sections ca. 36 m, 22 m and 15 m thick based on bed bybed thickness measurements of 1565, 751, and 679 chert and shale bedsat the Katsuyama, Kurusu, and Pisenaizawa sections, respectively (Fig.3). The thickness of the shale beds is generally less than 10 mm and theestimation errors are large for cyclostratigraphy (Ikeda et al., 2010a);consequently, this study did not examine the cyclicities of shale-bedthickness variation.
The average durations of chert–shale couplets for each intervalwere estimated from the average thickness of the couplets divided by themedian sedimentation rate (Fig. 2). This study also performed waveletanalyses on bed-number series of chert-bed thickness in order to assessthe dominant cyclicities and their modulations in the amplitude andfrequency of the stratigraphic variations in chert-bed thickness. Thewavelet analyses were conducted by using a series of Matlab algorithmsmodified from those developed by Torrence and Compo (1998). Thisprogram can identify whether peaks in the spectrum of the time seriesare significant against the red-noise (autoregressive lag1) backgroundspectrum. The analysis was carried out in the bed number domain ratherthan in the depth domain, because the sedimentation rates are consideredto have changed significantly between chert beds and intercalated shalebeds (e.g., Hori et al., 1993).
RESULTS
Chert-bed Thickness Variations of the Upper Triassic to LowerJurassic Bedded Chert Sequences in Japan
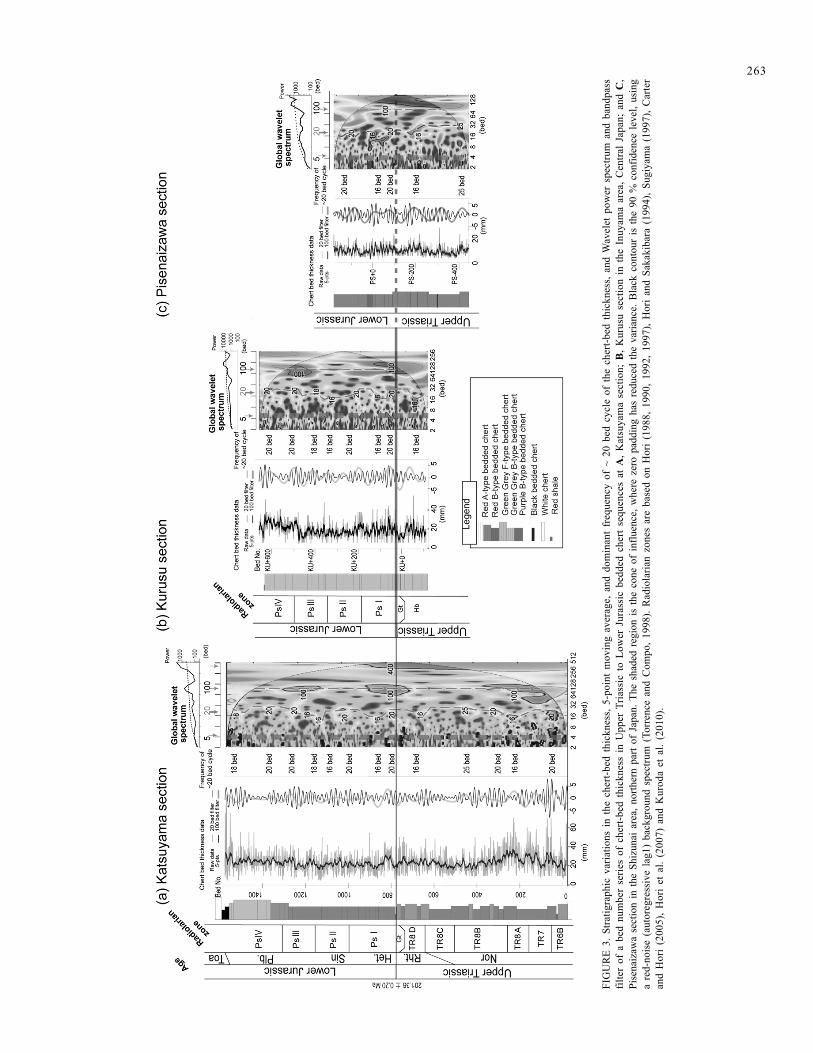
The stratigraphic variation in chert-bed thickness and its 5-pointmoving average in the Katsuyama, Kurusu, and Pisenaizawa sections isshown in Figure 3. In the Katsuyama section, chert-bed thickness rangesfrom 5 to 92 mm, with an average of 24 mm and standard deviation of 10mm. The smoothed stratigraphic variations in chert-bed thickness showca. 100 bed cyclicity with the amplitude of ca. 10 mm (Fig. 3). In theKurusu section, chert-bed thickness ranges from 8 to 80 mm with anaverage of 28 mm and standard deviation of 11 mm. The smoothedstratigraphic variations in chert-bed thickness show ca. 100 bed cyclicitywith an amplitude of ~ 7 mm (Fig. 3). In the Pisenaizawa section, chert-bed thickness ranges from 5 to 49 mm with an average of 17 mm andstandard deviation of 7 mm. The smoothed stratigraphic variations inchert-bed thickness show ca. 100 bed cyclicity with the amplitude of ~ 5mm (Fig. 3).
263
FIG
UR
E 3.
Stra
tigra
phic
var
iatio
ns i
n th
e ch
ert-b
ed t
hick
ness
, 5-p
oint
mov
ing
aver
age,
and
dom
inan
t fr
eque
ncy
of ~
20
bed
cycl
e of
the
che
rt-be
d th
ickn
ess,
and
Wav
elet
pow
er s
pect
rum
and
ban
dpas
sfil
ter
of a
bed
num
ber
serie
s of
che
rt-be
d th
ickn
ess
in U
pper
Tria
ssic
to
Low
er J
uras
sic
bedd
ed c
hert
sequ
ence
s at
A, K
atsu
yam
a se
ctio
n; B
, Kur
usu
sect
ion
in t
he I
nuya
ma
area
, Cen
tral
Japa
n; a
nd C
,Pi
sena
izaw
a se
ctio
n in
the
Shiz
unai
are
a, n
orth
ern
part
of J
apan
. The
sha
ded
regi
on is
the
cone
of
influ
ence
, whe
re z
ero
padd
ing
has
redu
ced
the
varia
nce.
Bla
ck c
onto
ur is
the
90 %
con
fiden
ce le
vel,
usin
ga
red-
nois
e (a
utor
egre
ssiv
e la
g1)
back
grou
nd s
pect
rum
(To
rren
ce a
nd C
ompo
, 199
8). R
adio
laria
n zo
nes
are
base
d on
Hor
i (1
988,
199
0, 1
992,
199
7), H
ori
and
Saka
kiba
ra (
1994
), Su
giya
ma
(199
7), C
arte
ran
d H
ori
(200
5), H
ori
et a
l. (2
007)
and
Kur
oda
et a
l. (2
010)
.

264Comparison Between the Average Duration of Individual
Chert–Shale Couplets and Precession Cycle
The sedimentation rate of each interval was estimated based onthe age models of studied sections (Fig. 2). In the Katsuyama section, therate during the Rhaetian to Pliensbachian was 0.6–1.0 m/myr, with amedian rate of 0.8 m/myr; In the Kurusu section, the rate during theHettangian-Sinemurian was 0.6–0.9 m/myr, with a median rate of 0.7 m/myr; In the Pisenaizawa section, the rate during the Norian toPliensbachian was 0.6–1.0 m/myr, with a median rate of 0.8 m/myr (Fig.2). The estimated ranges in the sedimentation rates include age estima-tion errors for the geological boundaries (Ogg, 2012; Ogg and Hinnov,2012) and the uncertainties in the stratigraphic positions of the bound-aries (Fig. 2).
The average durations of chert–shale couplets for each intervalwere estimated based on the above sedimentation rates (Fig. 2). In theKatsuyama section, the average duration of an individual chert–shalecouplet is between 17 and 28 ka (median value, 22 ka) for the Rhaetian,18 and 27 ka (median value, 21 ka) for the Hettangian to Pliensbachian,and 19 and 25 ka (median value, 22 ka) for the Rhaetian to Pliensbachian,respectively (Fig. 2a). In the Kurusu section, the duration is between 15and 25 ka (median value, 21 ka) for the Hettangian-Sinemurian (Fig. 2b).In the Pisenaizawa section, the duration is 17 and 28 ka (median value, 20ka) for the Norian to Pliensbachian (Fig. 2c). These estimated averagedurations for an individual chert–shale couplet are consistent with the 17to 21 ka duration of the precession cycle during Late Triassic to EarlyJurassic time (Berger et al., 1989).
Cyclostratigraphic Analysis of Chert-bed Thickness Variation
The results of wavelet analyses of the bed number series of chert-bed thickness in the Katsuyama, Kurusu, and Pisenaizawa sections areshown in Figure 3. In the Katsuyama section, the global wavelet powerspectrum of the bed number series of chert-bed thickness variationsshows cyclicities of ca. 3 to 5 beds, ca. 100 beds, and ca. 500 beds abovethe 90 % confidence level, and a secondary peak at ca. 20 bed (Fig. 3a).The wavelet spectrum of the bed number series of chert-bed thicknessvariations revealed occurrences of the ca. 20 bed cycle in intervals be-tween bed number 40 and 120, 200 and 250, 1000 and 1040, and 1100and 1120 above the 10 % significant level (Fig. 3a). The ~ 20 bed cyclemodulates its frequency at 16 beds between bed numbers 200 and 250,and 25 beds between beds 400 and 450. This wavelet spectrum alsoshows the ca. 100 bed cycle within the intervals between bed number 0and 400, 700 and 900, 1200 and 1300, and 1500 and 1563 above the 90% confidence level (Fig. 3a).
In the Kurusu section, the global wavelet power spectrum of thebed number series of chert-bed thickness variations shows cyclicities ofca. 3 to 5 beds and ca. 100 beds above the 90 % confidence level, andsecondary peak at ca. 20 bed (Fig. 3b). Wavelet spectrum of the bednumber series of chert-bed thickness variations revealed occurrences ofthe ca. 20 bed cycle in intervals between bed number KU – 90 and - 60above the 10 % significant level (Fig. 3b). The ca. 20 bed cycle modulatesits frequency at 16 beds between bed number KU – 125 and - 60, at 20beds between bed number KU – 60 and + 50, at 16 beds between KU +50 and +120, at 20 beds between KU + 150 and 200, at 16 beds betweenKU + 200 and 400, at 18 beds between KU + 400 and + 480, and at 20beds between KU + 480 and 620 (Fig. 3b). This wavelet spectrum alsoshows the ca. 100 bed cycle within the intervals between KU – 100 and+ 100, and KU + 420 and + 600 above the 90 % confidence level (Fig. 3).
In the Pisenaizawa section, the global wavelet power spectrum ofthe bed number series of chert-bed thickness variations shows cyclicitiesof ca. 3 to 5 beds and ca. 100 beds above the 90 % confidence level, andsecondary peak at ca. 20 bed (Fig. 3c). The wavelet spectrum of the bednumber series of chert-bed thickness variations revealed occurrences ofthe ca. 20 bed cycle in intervals between bed number PS – 70 and + 20
above the 10 % significant level (Fig. 3b). The ca. 20 bed cycle modulatesits frequency at 25 beds between bed number PS – 400 and – 220, at 16beds between bed number PS – 220 and – 150, at 20 beds between PS –160 and – 80, at 16 beds between PS – 60 and + 0, and at 20 beds betweenPS + 20 and + 180 (Fig. 3b). The wavelet spectrum of the bed numberseries of chert-bed thickness variations revealed occurrences of the ca.100 bed cycle within the intervals between PS – 300 and + 0 (Fig. 3).
The end-Triassic extinction interval in the Katsuyama section islocated at the maximum of the ca. 5 bed cycle, ca. 15 beds below themaximum of the ca. 20 bed cycle, and ca. 60 beds below the maximum ofthe ca. 100 bed cycle (Fig. 3a). In the Kurusu section, the end-Triassicextinction interval is also located in the interval from the maximum of theca. 5 bed cycle, ca. 7 beds below the maximum of the ca. 20 bed cycle, andca. 60 beds below the maximum of the ca. 100 bed cycle, to the minimumof the ca. 5 bed cycle, the maximum of the ca. 20 bed cycle, and ca. 53beds below the maximum of the ca. 100 bed cycle in the Katsuyamasection (Fig. 3b).
DISCUSSION
Frequency Modulation of the Astronomical Rhythms of theBedded Chert Sequences across the Triassic-Jurassic Boundary
To establish the cyclostratigraphy of the Upper Triassic to LowerJurassic bedded chert sequences in the Katsuyama, Kurusu, andPisenaizawa sections, the cyclostratigraphic method of Ikeda et al. (2010a)was adapted to these sequences. The estimated durations of a chert-shalecouplet agree with the 17–21 ka duration of the precession cycle duringthe Late Triassic to Early Jurassic (Berger et al., 1989). Therefore, it isreasonable to assume that each chert–shale couplet corresponds to asingle precession cycle. Based on this, the significant spectral peaks atca. 5 bed, 20 bed, and 100 beds of the wavelet spectrum of the bednumber series of the chert-bed thickness are consistent with the durationof ca. 100 ka, 405 ka, and 2000 ka eccentricity cycles (Fig. 3; e.g., Bergeret al., 1989, Laskar et al., 2004). Collectively, the similarities in theperiodicities of the dominant cycles and their hierarchy of chert-bedthickness variations with those of the astronomical cycles supports thehypothesis that the cyclicities of chert-bed thickness variations in bed-ded chert are paced by the astronomical cycles (e.g., Ikeda et al., 2010a).
On the basis of this cyclostratigraphy, we tried to demonstratethe frequency modulation of the astronomical rhythms as a stratigraphiccorrelation tool. To test this possibility, we correlate the bedded chertbetween the Katsuyama section and the Kurusu section by high-resolu-tion biostratigraphy. In the Katsuyama and Kurusu sections, the end-Triassic extinction intervals are well constrained by the radiolarian andconodont biostratigraphy with resolutions of ~ 19 ka and ~133 Ka,respectively (Carter and Hori, 2005; Kuroda et al., 2010), assuming achert-shale couplet represents ~ 19 ka precession cycle. Based on thiscorrelation, the frequency change of ~ 20 bed cycles in the Katsuyamasection between ~ 16 beds and ~ 20 beds is well correlated with those inthe Kurusu section (Fig. 3).
The frequency modulation of ~ 20 bed cycles detected in thisstudy are caused by the frequency modulation of the ~ 20 ka precessioncycle by each 405-ka eccentricity cycle (e.g., Ikeda et al., 2010a). Thefrequency modulations of the precession cycles are the result of thecomplex gravitational interactions among the planets (e.g., Hinnov et al.,2000; Huybers and Aharanson., 2010), and mainly related with the cha-otic behavior of Earth-Mars secular resonance (e.g., Laskar, 1990; Laskaret al., 2004). Because this frequency modulation is not a simple cycle,but chaotic, the frequency modulation of ~20 bed cycles can be regardedas a fingerprint time, suggesting a possible stratigraphic tool. This idea issupported by the results showing the same patterns of the frequencymodulation at the Katsuyama and Kurusu sections (Fig. 3). Therefore, itis certain that the frequency modulations of the astronomical rhythmscan be used as a potential stratigraphic correlation tool independent fromother methods.

265Recognition of the Potential Triassic-Jurassic Boundary by the
Frequency Modulation of the Astronomical Rhythms
On the basis of the frequency modulation of the astronomicalrhythms, the potential Triassic-Jurassic boundary was recognized in thebedded chert sequence in the Pisenaizawa section by correlation of thefrequency modulation of ca. 20 bed cycle with those in the Katsuyamaand Kurusu section (Fig. 3). The cyclostratigraphy of the Pisenaizawabedded chert shows the frequency modulation of ca. 20 bed cycle, similarto those in the Katsuyama and Kurusu sections (Fig. 3). According to thetiming of the frequency modulation of ca. 20 bed cycles from 16 beds to20 beds, and then back to 16 beds at the interval from Ps – 200 to – 120in the Pisenaizawa section, we tentatively correlate this interval with theend-Triassic extinction interval in the Katsuyama and Kurusu sections(Fig. 3). To support this correlation, the phase of the ca. 2 Myr (ca. 100bed) cycle at this interval in the Pisenaizawa section was compared withthose of the Katsuyama and Kurusu sections (Fig. 3). According to high-resolution biostraigraphy, the end-Triassic extinction interval atKatsuyama section corresponds to 100 ka before the 405 ka cycle maxi-mum and 500 ka before the ca. 2 Myr cycle maximum (Fig. 3). Thesetimings are consistent with the base of the extinction interval in theKurusu section (Fig. 3). In the Pisenaizawa section, the timing of theseastronomical cycles is correlated with PS – 116 within the tentative end-Triassic mass extinction interval (Fig. 3). This result supports the con-clusion that the end-Triassic extinction interval at the Kurusu section canbe correlated by the frequency modulation of the ca. 20 bed cycle (Fig.3). The timing of the astronomical cycles at the end-Triassic are consis-tent with the cyclostratigraphic results of the shallow marine Tethyansequence at the St. Audrie’s section in the U.K. (Ruhl et al., 2010) and thelacustrine sequences of the Newark Supergroup (e.g., Whiteside et al.,2007, 2010). These similarities further support our cyclostratigraphicresults and the possibility of coincidence of the end-Triassic extinctionamong terrestrial, shallow marine Tethys, and pelagic Panthalassa realms.Because the paleoclimatic and paleoceanographic implications are be-yond the focus of this study, a more detailed discussion of this topic willbe presented elsewhere (Ikeda et al., in prep). The in-phase relationshipof the ca. 2 Myr cycle among these bedded-chert sequences, in additionto the similar pattern of the frequency modulation of ca. 20 bed cyclesupports the stratigraphic correlation using the Ps – 105 to Ps – 122chert beds as the end-Triassic extinction interval. Further geochronologicstudies in the Pisenaizawa section will test this hypothesis, and providethe basis of a pre-Cretaceous astronomical time scale, because theInuyama and Sizunai bedded chert sequences range from the Lower Tri-assic to Lower Jurassic and the Upper Triassic to Lower Cretaceous,respectively.
CONCLUSION
Cyclostratigraphic analyses of Upper Triassic to Lower Jurassicbedded chert sequences were conducted at the Katsuyama and Kurususections, in the Inuyama area, central Japan, and Pisenaizawa section inthe Shizunai area, northern part of Japan. The average duration of chert–shale couplets estimated by the age model based on biostratigraphy isconsistent with the length of the precession cycle during the Triassic toJurassic (Berger et al., 1989). Spectral analysis of a bed number series ofthickness variations in chert beds reveals ca. 100 ka, 400 ka, and 2000 kaeccentricity cycles, assuming that each chert–shale couplet representsthe ca. 20 ka precession cycle. The periodicity of one sedimentary cycleand the hierarchy of the dominant cycles supports the idea that thesedimentary rhythm of bedded chert is paced by the astronomical cycles.
The similar patterns of the frequency modulation of ca. 20 bedcycle were detected from these sections. The high-resolution biostrati-graphic constraints of the end-Triassic mass extinction in the Katsuyamaand Kurusu sections reveal the synchronous frequency modulation of ca.20 bed cycles with each other. This result suggests that these frequencymodulations of ca. 20 bed cycles could be used as a potential indepen-dent cyclostratigraphic correlation tool without other age constraints.
Based on this, we tentatively estimated the age of the Kamuikotansection by using the patterns of the frequency modulation of ca. 20 bedcycles similar to those in the Katsuyama and Kurusu sections. Thiscorrelation is consistent with the phase of the ca. 2 Myr cycle in the end-Triassic extinction interval in the Katsuyama and Kurusu sections, StAudrie’s Bay section, and Newark Supergroup. The frequency modula-tions of the astronomical rhythms could be used as the new stratigraphiccorrelation tool and provide the basis for the astronomical time scalebefore the Cretaceous and the understanding of global environmentalchanges, such as the Triassic-Jurassic boundary event.
ACKNOWLEDGMENTS
I thank Prof. Paul E. Olsen (Lamont-Doherty Earth Observatory,Columbia University) for his constructive comments on cyclostratigraphyand astronomical theory, Dr. T. Ito (National Astronomical Observatoryof Japan) for his advice concerning astronomical theory and the orbitalcalculation model, Dr. H. Miyahara (Institute for Cosmic Ray Research,The University of Tokyo) for her advice regarding spectral analysis, andDr. S. Takahashi for his fruitful discussion. This research was partlysupported by grants from the Japan Society for the Promotion of Sci-ence (20098755 and 20127776), Overseas Internship Program for Out-standing Young Earth and Planetary Researchers, and Fujiwara NaturalHistory Foundation awarded to M. Ikeda.
REFERENCES
Ando, A., Kodama, K. and Kojima, S., 2001, Low-latitude and SouthernHemisphere origin of Anisian (Triassic) bedded chert in the Inuyamaarea, Mino terrene, central Japan: Journal of Geophysical Research, v.106, p. 1973-1986.
Berger, A., Loutre, M.-F. and Dehant, V., 1989, Influence of the changinglunar orbit on the astronomical frequencies of pre-Quaternary insola-tion patterns: Paleoceanography, v. 4, p. 555-564.
Carter, E.S., 1993, Biochronology and paleontology of uppermost Triassic(Rhaetian) radiolarians, Queen Charlotte Islands, British Columbia,Canada: Mémoires de Géologie (Lausanne), v. 11, 175 pp.
Carter, E.S. and Hori, R.S., 2005, Global correlation of the radiolarianfaunal change across the Triassic-Jurassic boundary: Canadian Journal ofEarth Sciences, v. 42, p. 777–790.
Carter, E.S. and Orchard, M.J., 2007, Radiolarian – conodont – ammonoidintercalibration around the Norian-Rhaetian boundary and implicationsfor trans-Panthalassan correlation: Albertiana, v. 36, p. 149–163.
Carter, E.S., Gorican, Š., Guex, J., O'Dogherty, L., De Wever, P., Dumitrica,P., Hori, R.S., Matsuoka, A. and Whalen, P.A., 2010, Global radiolarianzonation for the Pliensbachian, Toarcian and Aalenian: Palaeogeography,Palaeoclimatology, Palaeoecology, v. 297, p. 401–419
Deenen, M.H.L., Ruhl, M., Bonis, N.R., Krijgsman, W., Kuerschner, W.M.,Reitsma, M. and Van Bergen, M.J., 2010, A new chronology for the end-Triassic mass extinction: Earth and Planetary Science Letters, v. 291, p.113–125.
Fischer, A.G., 1976, Pelagic sediments as clues to Earth behavior: Memoriedella Societa Geologica Italianna, v. 15, p. 1-18.
Fischer, A.G., 1986, Climate rhythms recorded in strata: Annual Review ofEarth and Planetary Science, v. 14, p. 351-376.
Gröcke , D.R., Hori R.S., Trabucho-Alexandre J., Kemp D.B. and SchwarkL., 2011, An open marine record of the Toarcian oceanic anoxic event:Solid Earth, v. 2, p. 245–257.
Hesselbo, S.P., Robinson, S.A., Surlyk, F. and Piasecki, S., 2002, Terrestrial

266and marine extinction at the Triassic–Jurassic boundary synchronizedwith major carbon-cycle perturbation: A link to initiation of massivevolcanism?: Geology, v. 30, p. 251–254.
Hinnov, L.A., 2000, New perspectives on orbitally forced stratigraphy:Annual Review of Earth and Planetary Sciences, v. 28, p. 419-475.
Hinnov, L.A. and Ogg, J.G., 2008, Cyclostratigraphy and the astronomicaltime scale: Stratigraphy, v. 4, p. 239-251.
Hori, R., 1988, Some characteristic radiolarians from Lower Jurassic beddedcherts of the Inuyama area, Southwest Japan: Transactions of the Pro-ceedings of the Palaeontological Society of Japan N. S., v. 151, p. 543–563.
Hori, R., 1990, Lower Jurassic radiolarian zones of SW Japan: Transactionsof the Proceedings of the Palaeontological Society of Japan N. S., v.159, p. 562-586.
Hori, R., 1992, Radiolarian biostratigraphy at the Triassic-Jurassic Periodboundary in bedded cherts from the Inuyama area, central Japan: Journalof Geoscience Osaka City University, v. 35, p. 53–65.
Hori, R., 1997, The Toarcian radiolarian event in bedded cherts from south-western Japan: Marine Micropaleontology, v. 30, p. 159–169.
Hori, S.R. and Sakakibara, M., 1994, A chert-clastic sequence spanning theLate Triassic-Early Cretaceous Period of the Kamuikotan Complex inthe Shizunai area, south-central Hokkaido, Japan: Journal of the Geo-logical Society of Japan, v. 100, p. 575-583.
Hori, S.R., Cho, C. and Umeda, H., 1993, Origin of cyclicity in Triassic-Jurassic radiolarian bedded cherts of the Mino accretionary complexfrom Japan: The Island Arc, v. 3, p. 170-180.
Hori, S.R., Fujiki, T., Inoue, E. and Kimura, J.-I., 2007, Platinum groupelement anomalies and bioevents in the Triassic-Jurassic deep-sea sedi-ments of Panthalassa: Palaeogeography, Palaeoclimatology, Palaeo-ecology, v. 244, p. 391-406.
Huang, C., Tong, J., Hinnov, L. and Chen, Z., 2011, Did the great dying oflife take 700 k.y.? Evidence from global astronomical correlation of thePermian-Triassic boundary interval: Geology, v. 39, p. 779–782.
Hüsing, S.K., Cascella, A., Hilgen, F.J., Krijgsman, W., Kuiper, K.F., Turco,E and Wilson, D., 2010, Astrochronology of the Mediterranean Langhianbetween 15.29 and 14.17 Ma: Earth Planetary Science Letters, v. 290,p. 254–269.
Huybers, P. and Aharonson, O., 2010, Orbital tuning, eccentricity, and thefrequency modulation of climatic precession: Paleoceanography, v. 25.no. PA4228. ISSN 0883-8305.
Ikeda M. and Tada, R., 2013, Long-period astronomical cycles from theUpper Triassic to Lower Jurassic bedded chert sequence, Inuyama, Ja-pan; Geologic evidence for the chaotic evolution of Solar Planets: Earth,Planets and Space, v. 65 p. 1-10.
Ikeda, M., Tada, R. and Sakuma, H., 2010a, Astronomical cycle origin ofbedded chert; Middle Triassic bedded chert sequence, Inuyama, Japan:Earth and Planetary Science Letters, v. 297, p. 369-378.
Ikeda M., Tada, R., Karasuda, A. and Sakuma, H., 2010b, Long-periodastronomical cycles from the Upper Triassic to Lower Jurassic beddedchert sequence: Implications for Jurassic Cyclostratigraphy: Earth Sci-ence Frontiers, v. 17, p. 112-113.
Kimura, K. and Hori, R., 1993, Offscraping accretion of Jurassic chert-clastic complexes in the Mino-Tamba Belt, central Japan: Journal Struc-tural Geology, v. 15, p. 145–161.
Kuroda, J., Hori, R.S., Suzuki, K., Gröcke, D and Ohkouchi, N., 2010,Marine osmium isotope record across the Triassic-Jurassic boundaryfrom a Pacific pelagic site: Geology, v. 38, p. 1095–1098.
Laskar, J., 1990, The chaotic motion of the solar-system—A numericalestimate of the size of the chaotic zone: Icarus v. 88, p. 266–291.
Laskar, J., Robutel, P., Joutel, F., Gastineau, M., Correia, A.C.M. and Levrard,B., 2004, A long term numerical solution for the insolation quantities ofthe Earth: Astronomy and Astrophysics, v. 428, p. 261–285.
Matsuda, T. and Isozaki, Y., 1991, Well-documented travel history of Me-sozoic pelagic chert in Japan: from remote ocean to subduction zone:Tectonics v. 10, p. 475-499.
Matsuoka, A., Hori R., Kuwahara K., Hiraishi M., Yao A. and Ezaki Y.,1994, Triassic–Jurassic radiolarian-bearing sequences in the Mino Ter-rane, Central Japan: Guide Book for Interrad VII Field Excursion, p. 19-
61.Oda, H. and Suzuki, H., 2000, Paleomagnetism of Triassic and Jurassic red
bedded chert of the Inuyama area, central Japan: Journal GeophysicalResearch, v. 105, p. 743-767.
Ogg, J.G., 2012, The Triassic period; in Gradstein, F.M., et al., eds., AGeologic Time Scale 2012: Cambridge, UK, Cambridge University Press,p. 681–730.
Ogg, J.G. and Hinnov, L.A., 2012, Jurassic; in Gradstein, F.M., et al., eds., AGeologic Time Scale 2012: Cambridge, UK, Cambridge University Press,p. 731–791.
Olsen, P.E. and Kent, D.V., 1996, Milankovitch climate forcing in thetropics of Pangaea during the Late Triassic: Palaeogeography,Palaeoclimatology, Palaeoecology, v. 122, p. 1-26.
Olsen, P.E. and Kent, D.V., 1999, Long-period Milankovitch cycles fromthe Late Triassic and Early Jurassic of eastern North America and theirimplications for the calibration of the early Mesozoic timescale and thelong-term behavior of the planets: Philosophical Transactions RoyalSociety London series, A, v. 357, p. 1761-1786.
Olsen, P.E., Kent, D.V., Cornet, B., Witte. W.K. and Schlische, R.W., 1996,High-resolution stratigraphy of the Newark rift basin (early Mesozoic,eastern North America): Geological Society of America Bulletin, v. 108,p. 40-77.
Olsen, P.E., Kent, D.V. and Whiteside, H., 2011, Implications of the New-ark Supergroup-based astrochronology and geomagnetic polarity timescale (Newark-APTS) for the tempo and mode of the early diversifica-tion of the Dinosauria: Earth and Environmental Science Transactionsof the Royal Society of Edinburgh, v. 101, p. 201-229.
Ruhl, M., Deenen, M.L., Abels, H.A., Bonis, N.R., Krijgsman, W. andKürschner, W.M., 2010, Astronomical constraints on the duration ofthe early Jurassic Hettangian stage and recovery rates following the end-Triassic mass extinction (St Audrie's Bay/East Quantoxhead, UK): Earthand Planetary Science Letters, v. 295, p. 262–276.
Schoene, B., Guex, J., Bartolini, A., Schaltegger, U. and Blackburn, T., 2010,Correlating the end-Triassic mass extinction and flood basalt volcanismat the 100000-year level: Geology, v. 38, p. 387–390.
Shibuya, H. and Sasajima, S., 1986, Paleomagnetism of red cherts: a casestudy in the Inuyama area, central Japan: Journal Geophysical Research,v. 91, p. 105–116.
Sugiyama, K., 1997, Triassic and Lower Jurassic radiolarian biostratigraphyin the siliceous claystone and bedded chert units of the southeasternMino Terrane, Central Japan: Bulletin Mizunami Fossil Museum, v. 24,p. 79–193.
Suzuki, M., Osanai, H., Matsui, K. and Watanabe, J., 1961, Idonnappudake(Kusiro-56). Explanatory text of the Geological map of Japan: Geologi-cal Survey of Hokkaido, Hokkaido Development Agency, 64 p.
Tipper, H.W. and Guex, J., 1994, Preliminary remarks on the Hettangianammonite succession in Queen Charlotte Islands, British Columbia; inCariou, E. and Hantzperque, P., eds., 3rd International Symposium onJurassic Stratigraphy, Poitiers, France: Geobios, Mémoire Spécial, v. 17,p. 477–483.
Torrence, C. and Compo, G.P., 1998, A practical guide to wavelet analysis:Bulletin American Meteorological Society, v. 79, p. 61–78.
Vollmer, T., Werner, R., Weber, M., Tougiannidis, N., Röhling, H.G.. andHambach, U., 2008, Orbital control on Upper Triassic playa cycles ofthe Steinmergel-Keuper (Norian): A new concept for ancient playa cycles:Palaeogeography, Palaeoclimatology, Palaeoecology, v. 267, p. 1-16.
Wakita, K., 1988, Origin of chaotically mixed rock bodies in the EarlyJurassic to Early Cretaceous sedimentary complex of the Mino Terrane,central Japan: Bulletin Geological Survey Japan, v. 39, p. 675–757.
Ward, P.D., Haggart, J.W., Carter, E.S., Wilbur, D., Tipper, H.W. and Evans,T., 2001, Sudden productivity collapse associated with the Triassic–Jurassic boundary mass extinction: Science, v. 292, p. 1148–1151.
Ward, P.D., Garrison, G.H., Haggart, J.W., Kring, D.A. and Beattie, M.J.,2004, Isotopic evidence bearing on Late Triassic extinction events,Queen Charlotte Islands, British Columbia, and implications for theduration and cause of the Triassic/Jurassic mass extinction: Earth Plan-etary Science Letters, v. 224, p. 589–600.
Ward, P.D., Garrison, G.H., Williford, K.H., Kring, D., Goodwin, D., Beattie,

267M., and McRoberts, C., 2007, The organic carbon isotopic and paleon-tological record across the Triassic–Jurassic boundary at the candidateGSSP section at Ferguson Hill, Muller Canyon, Nevada, USA:Palaeogeography, Palaeoclimatology, Palaeoecology, v. 244, p. 279–287.
Warrington, G., Cope, C.W. and Ivimey-Cook, H.C., 2008, The St Audrie'sBay-Doniford Bay section, Somerset, England: updated proposal for acandidate Global Stratotype Section and Point for the base of theHettangian Stage, and of the Jurassic System: International Subcommis-sion on Jurassic Stratigraphy Newsletter, v. 35, p. 2–66.
Whiteside, J.H., Olsen, P.E., Kent, D.V., Fowell, S.J. and Et-Touhami M.,2007, Synchrony between the Central Atlantic magmatic province andthe Triassic-Jurassic mass extinction event: Palaeogeography,Palaeoclimatology, Palaeoecology, v. 244, p. 345 - 367.
Whiteside, J.H., Olsen, P.E., Eglinton, T.I., Brookfield, M.E. and Sambrotto,R.N., 2010, Compound-specific carbon isotopes from Earth’s largestflood basalt province directly link eruptions to the end-Triassic massextinction: Proceedings of the National Academy of Sciences, v. 107, p.6721–6725.
Williford, K.H., Ward, P.D., Garrison, G.H. and Buick, R., 2007, An ex-tended organic carbon-isotope record across the Triassic–Jurassic bound-ary in the Queen Charlotte Islands, British Columbia, Canada:Palaeogeography, Palaeoclimatology, Palaeoecology, v. 244, p.290–296.
Wu H., Zhang S., Feng Q., Jiang G., Li H. and Yang T., 2012, Milankovitchand sub-Milankovitch cycles of the Early Triassic Daye Formation,South China and their geochronological and paleoclimatic implications:Gondwana Research, v. 22, p. 748–759.
Yao, A., Matsuda, T. and Isozaki, Y., 1980, Triassic and Jurassic radiolariansfrom the Inuyma area, central Japan: Journal of Geosciences, OsakaCity University, v. 23, p. 135–154.