Embed Size (px)
Citation preview

Tallin, Estonia – June 17, 2014 - First policy dialogue
First Policy Dialogue Tallin, EstoniaJune 17, 2014

Tallin, Estonia – June 17, 2014 - First policy dialogue
OverviewMain findings of the country profile of Estonia

Tallin, Estonia – June 17, 2014 - First policy dialogue
Source: Eurostat, 2011 and Sixth monitoring report FP7
FP Performance and wider innovation indicators for Estonia benchmarked to EU 28 and EU 13 averages
Tallin, Estonia – June 17, 2014 - First policy dialogue
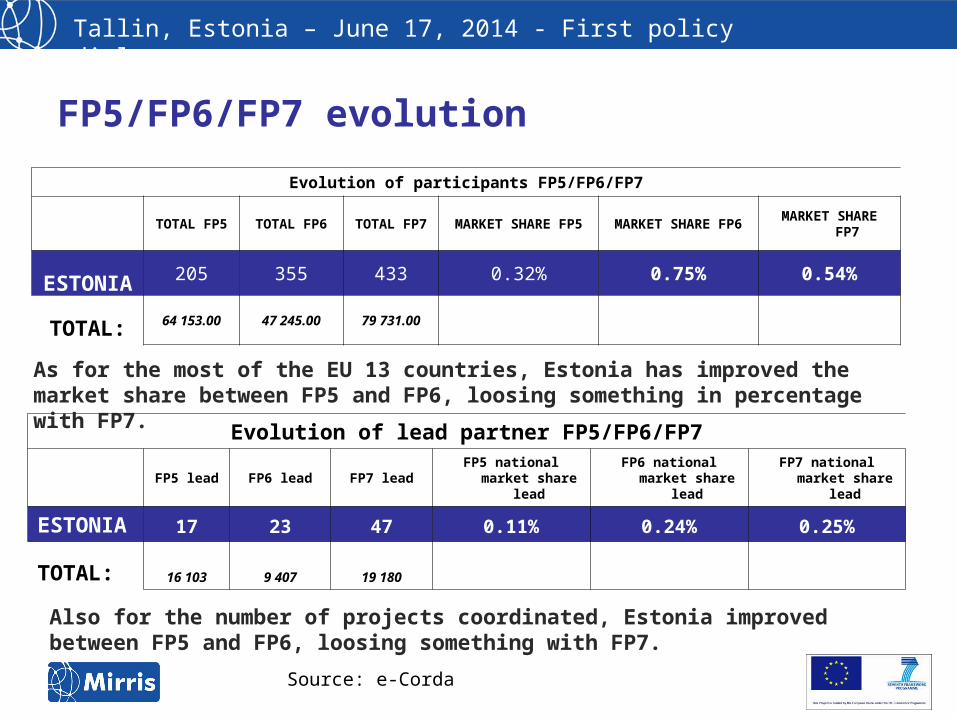
Evolution of participants FP5/FP6/FP7
TOTAL FP5 TOTAL FP6 TOTAL FP7 MARKET SHARE FP5 MARKET SHARE FP6 MARKET SHARE FP7
ESTONIA 205 355 433 0.32% 0.75% 0.54%
TOTAL: 64 153.00 47 245.00 79 731.00
Evolution of lead partner FP5/FP6/FP7
FP5 lead FP6 lead FP7 lead FP5 national market
share leadFP6 national market
share leadFP7 national market
share lead
ESTONIA 17 23 47 0.11% 0.24% 0.25%
TOTAL: 16 103 9 407 19 180
As for the most of the EU 13 countries, Estonia has improved the market share between FP5 and FP6, loosing something in percentage with FP7.
Also for the number of projects coordinated, Estonia improved between FP5 and FP6, loosing something with FP7.
Source: e-Corda
FP5/FP6/FP7 evolution

Tallin, Estonia – June 17, 2014 - First policy dialogue
Beneficiaries in mobility programmes – FP7 People
Activities included: 1. Initial Training of Researchers 2. Life-long Training and Career Development (including Co-funding) 3. Industry-Academia Pathways and Partnerships 4. International Dimension – European and world Fellowships
If we assume that being part of a network has an impact to participation, it is useful to look at the mobility programmes over time.
Developments in the participation in the mobility programmes
FP5participants
FP6participants
FP7Participants(2007- 2011)
FP5 nationalmarket shareparticipants
FP6 nationalmarket shareparticipants
FP7 nationalmarket shareparticipants
EE 29 21 41 0.37% 0.34% 0.34%
Source: e-Corda

Tallin, Estonia – June 17, 2014 - First policy dialogue
OverviewFP7 participants per target groups
Source: e-Corda
Tallin, Estonia – June 17, 2014 - First policy dialogue
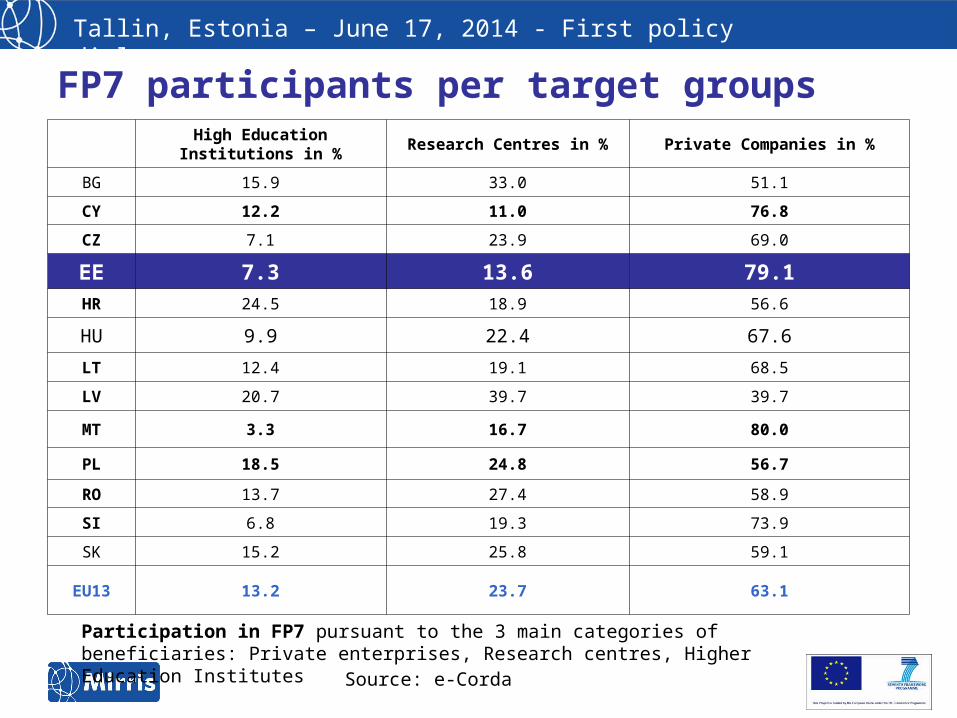
FP7 participants per target groups High Education Institutions in % Research Centres in % Private Companies in %
BG 15.9 33.0 51.1
CY 12.2 11.0 76.8
CZ 7.1 23.9 69.0
EE 7.3 13.6 79.1HR 24.5 18.9 56.6
HU 9.9 22.4 67.6
LT 12.4 19.1 68.5
LV 20.7 39.7 39.7
MT 3.3 16.7 80.0
PL 18.5 24.8 56.7
RO 13.7 27.4 58.9
SI 6.8 19.3 73.9
SK 15.2 25.8 59.1
EU13 13.2 23.7 63.1
Participation in FP7 pursuant to the 3 main categories of beneficiaries: Private enterprises, Research centres, Higher Education Institutes
Source: e-Corda

Tallin, Estonia – June 17, 2014 - First policy dialogue
HEI: EU 13 TOP 10Rank ORGANIZATION PARTICPATIONS Country
1 UNIVERSITY OF LJUBLJANA 137 SI
2 CHARLES UNIVERSITY OF PRAGUE 100 CZ
3 BUDAPEST UNIVERSITY OF TECHNOLOGY AND ECONOMIES 93 HU
4 UNIVERSITY OF CYPRUS 90 CY
5 UNIVERSITY OF TARTU 84 EE
6 UNIVERSITY OF WARSAW 80 PL
7 CZECH TECHNICAL UNIVERSITY IN PRAGUE 72 CZ
8 WARSAW UNIVERSITY OF TECHNOLOGY 62 PL
9 JAGIELLONIAN UNIVERSITY 56 PL
10 CENTRAL EUROPEAN UNIVERSITY 48 HU

Tallin, Estonia – June 17, 2014 - First policy dialogue
ORGANIZATION PARTICPATIONS
UNIVERSITY OF TARTU 84
TALLIN UNIVERSITY OF TECHNOLOGY 35
ESTONIAN UNIVERSITY OF LIFE SCIENCES 11
TALLIN UNIVERSITY 11
ESTONIAN ACADEMY OF ARTS 1
ESTONIAN INTERUNIVERSITY POPULATION RESEARCH CENTRE 1
ESTONIAN ACADEMY OF SECURITY SCIENCES 1
HEI – Estonian organizations in FP7
Tallin, Estonia – June 17, 2014 - First policy dialogue
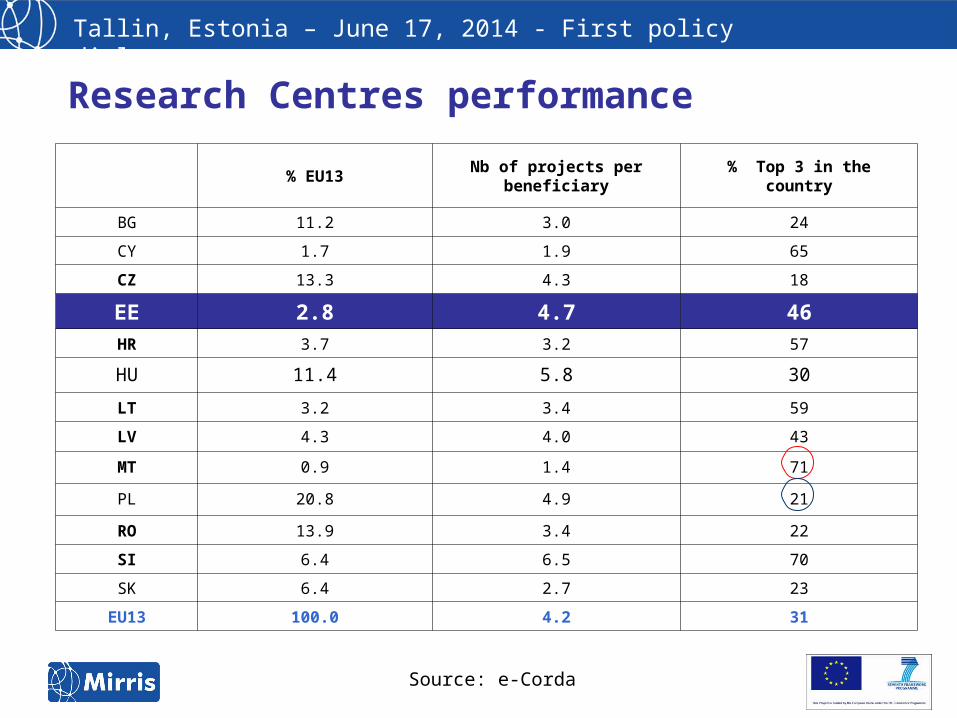
% EU13 Nb of projects per beneficiary % Top 3 in the country
BG 11.2 3.0 24
CY 1.7 1.9 65
CZ 13.3 4.3 18
EE 2.8 4.7 46HR 3.7 3.2 57
HU 11.4 5.8 30
LT 3.2 3.4 59
LV 4.3 4.0 43
MT 0.9 1.4 71
PL 20.8 4.9 21
RO 13.9 3.4 22
SI 6.4 6.5 70
SK 6.4 2.7 23
EU13 100.0 4.2 31
Research Centres performance
Source: e-Corda

Tallin, Estonia – June 17, 2014 - First policy dialogue
Rank Organisation Participations Country
1 INSTITUT JOZEF STEFAN 120 SI
2INSTYTUT PODSTAWOWYCH PROBLEMOW TECHNIKI POLSKIEJ AKADEMII
NAUK 52 PL
3BAY ZOLTAN ALKALMAZOTT KUTATASI KOZHASZNU NONPROFIT
KFT. 43 HU
4 INSTYTUT CHEMII BIOORGANICZNEJ PAN 43 PL
5MAGYAR TUDOMANYOS AKADEMIA SZAMITASTECHNIKAI ES
AUTOMATIZALASI KUTATO INTEZET 34 HU
6MAGYAR TUDOMANYOS AKADEMIA WIGNER FIZIKAI
KUTATOKOZPONT 29 HU
7MAGYAR TUDOMANYOS AKADEMIA ENERGIATUDOMANYI
KUTATOKOZPONT 26 HU
8UNITATEA EXECUTIVA PENTRU FINANTAREA INVATAMANTULUI SUPERIOR,
A CERCETARII, DEZVOLTARII SI INOVARII 26 RO
10
TECHNOLOGICKE CENTRUM AKADEMIE VED CESKE REPUBLIKY 25 CZ
10
RUDER BOSKOVIC INSTITUTE 25 HR
Research Centres: EU 13 TOP 10

Tallin, Estonia – June 17, 2014 - First policy dialogue
Organisation Participations
EESTI INNOVATSIOONI INSTITUUT 21
ESTONIAN ACADEMY OF SCIENCES 6
TARTU OBSERVATORY 6
INSTITUTE OF BALTIC STUDIES 5
PRAXIS CENTRE FOR POLICY STUDIES 5
ESTONIAN INSTITUTE FOR SUSTAINABLE DEVELOPMENT/STOCKOLM ENVIROMENTAL INSTITUTE TALLIN CENTRE 4
NATIONAL INSTITUTE OF CHEMICAL PFHYSICS AND BYOPHISICS 4
INSTITUTE OF CYBERNETICS OF TUT 4
REC – Estonian organizations in FP7

Tallin, Estonia – June 17, 2014 - First policy dialogue
% EU13 No.of projects per beneficiary % Top 3 in the country
BG 6.5 1.6 15
CY 4.4 2.0 21
CZ 14.4 1.8 14
EE 6.1 1.5 13
HR 4.2 1.9 29
HU 12.9 1.9 15
LT 4.3 1.3 12
LV 1.6 1.2 26
MT 1.7 2.0 33
PL 18.2 1.6 11
RO 11.2 1.6 10
SI 9.1 1.6 12
SK 5.5 1.6 18
EU13 100.0 1.7 15
PRC performance
Source: e-Corda

Tallin, Estonia – June 17, 2014 - First policy dialogue
Small and Medium Enterprises performance
% EU13 No. of projects per beneficiary % Top 3 in the country
BG 6.5 1.7 20
CY 5.2 1.8 23
CZ 13.8 1.6 8
EE 7.5 1.5 14
HR 3.0 2.0 44
HU 14.4 1.9 18
LT 4.7 1.3 14
LV 1.8 1.2 30
MT 1.8 2.2 38
PL 16.9 1.5 12
RO 10.3 1.7 14
SI 9.0 1.6 16
SK 5.1 1.5 19
EU13 100.0 1.6 17
Source: e-Corda
Tallin, Estonia – June 17, 2014 - First policy dialogue
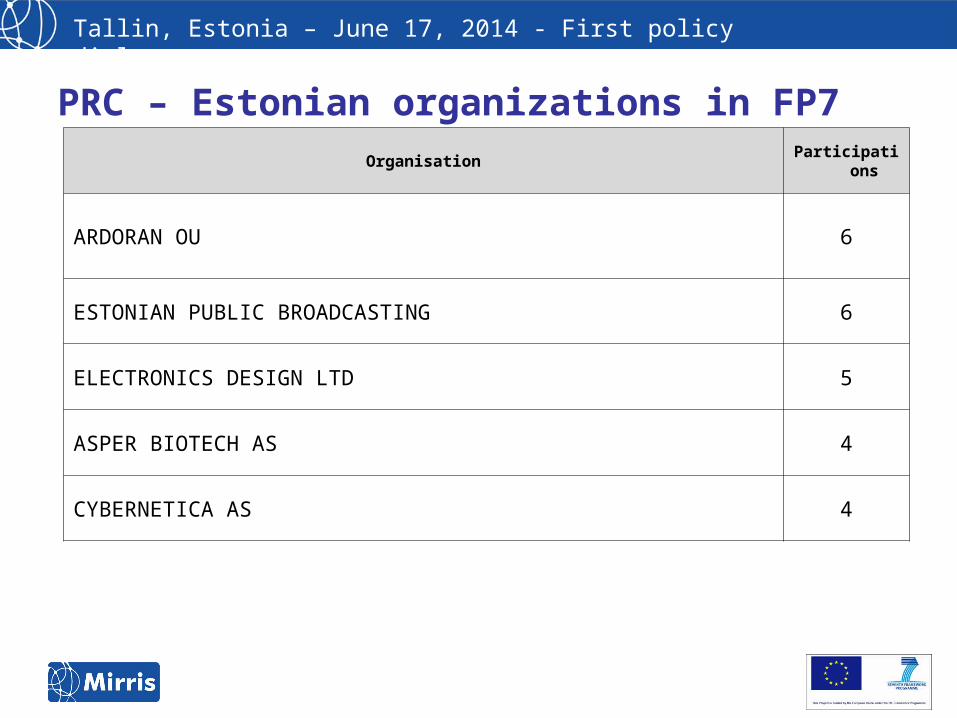
Organisation Participations
ARDORAN OU 6
ESTONIAN PUBLIC BROADCASTING 6
ELECTRONICS DESIGN LTD 5
ASPER BIOTECH AS 4
CYBERNETICA AS 4
PRC – Estonian organizations in FP7

Tallin, Estonia – June 17, 2014 - First policy dialogue
TOTAL EU 27
WithEU15
WithEU 12
With candidate andassociated countries
With nationalstakeholders
EE 4,493 3,622 871 921 292
Geographical overview Estonia collaborative links for all the programmes of FP7
Source: Sixth Monitoring report FP7 – Table B3 of EU27 Collaborative links for all programmes. E-Corda estraction date: 2013/02/26. Croatia is included in the “Candidate countries”
EU 15 countries with which Estonia cooperates the most: -UK: 521-DE: 516-IT: 366-ES: 340-FR: 321
EU 12 countries with which Estonia cooperates the most: -PL: 123 -RO: 93-HU: 91Candidate and associated countries: -NO: 167-CH: 111-TR: 84

Tallin, Estonia – June 17, 2014 - First policy dialogue
OverviewFP7 participants per Thematic Priorities
Tallin, Estonia – June 17, 2014 - First policy dialogue
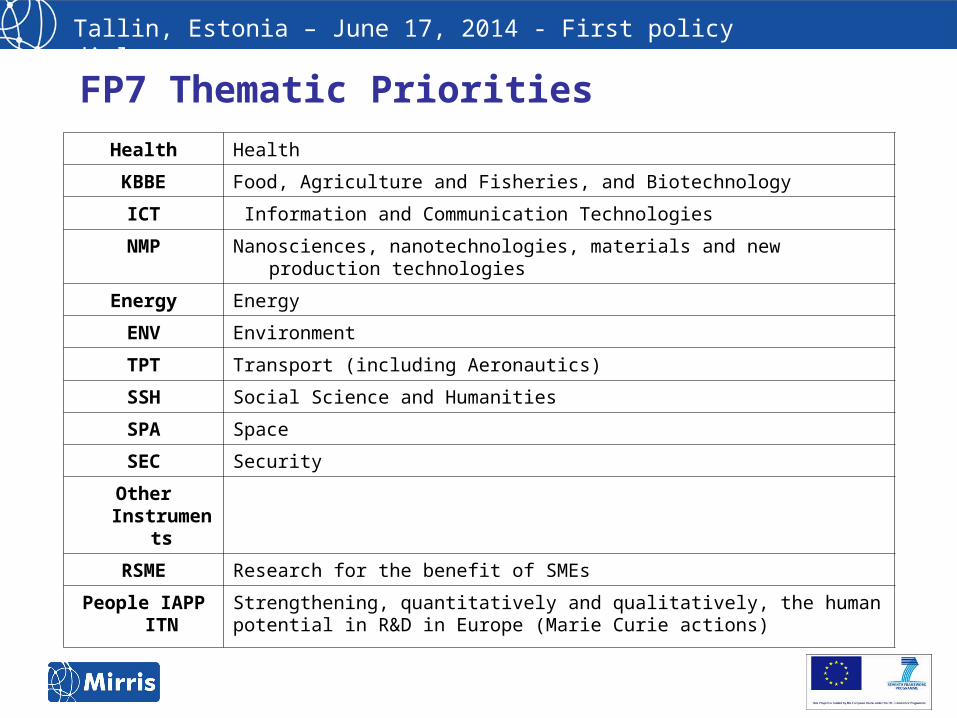
FP7 Thematic PrioritiesHealth Health
KBBE Food, Agriculture and Fisheries, and Biotechnology
ICT Information and Communication Technologies
NMP Nanosciences, nanotechnologies, materials and new production technologies
Energy Energy
ENV Environment
TPT Transport (including Aeronautics)
SSH Social Science and Humanities
SPA Space
SEC Security
Other Instruments
RSME Research for the benefit of SMEs
People IAPP ITN Strengthening, quantitatively and qualitatively, the human potential in R&D in Europe (Marie Curie actions)

Tallin, Estonia – June 17, 2014 - First policy dialogue
SPA: Space; SEC: Securuty; TPT: Transport

Tallin, Estonia – June 17, 2014 - First policy dialogue
SPA: Space; SEC: Securuty; TPT: Transport

Tallin, Estonia – June 17, 2014 - First policy dialogue
Participation in ERC
Participation in ERC / FP7 (2007-2013)
CYPRUS 4
ESTONIA 2
SLOVENIA 1

Tallin, Estonia – June 17, 2014 - First policy dialogue
OverviewFunding Issues
Structural Factors affecting participation to EU programmes
Source: e-Corda

Tallin, Estonia – June 17, 2014 - First policy dialogue
Contribution to EU budget 2012 (%)
Return on FP7 2007-2012(%)
Return on Structural Funds 2007-2013 (%)
BG 0.27 0.28 1.98
CY 0.12 0.22 0.19
CZ 0.99 0.68 7.77
EE 0.11 0.23 1.00
HU 0.60 0.75 7.36
LT 0.21 0.17 2.00
LV 0.15 0.16 1.34
MT 0.04 0.05 0.25
PL 2.53 1.17 19.57
RO 0.95 0.41 5.68
SI 0.24 0.45 1.23
SK 0.46 0.21 2.36
Sources: Eurostat and Sixth Monitoring report FP7
Returns on EU budget

Tallin, Estonia – June 17, 2014 - First policy dialogue
ERDF-FP7 participation
FP7 contribution 2007-2013(m euro)
ERDF earmarked budget for R&D 2007-2013 (m euro)
85.8 655
• Is the ERDF perceived as investment for future participation in FP7/H2020?
• Are there any projects to develop synergies in the near future?
• S3?
Source: DG Research and DG Regio – Cohesion policy 2007-20013: Research and Innovation

Tallin, Estonia – June 17, 2014 - First policy dialogue
International mobility of researchers
In 2010 in Estonia the percentage of doctoral candidates (ISCED 6) who were citizens of another EU-27 Member State was 5.3%, lower with the EU 27 average of 7.8%₁.In Estonia non-EU doctoral candidates were 1.5% of all candidates (EU average of 20.0%₂)
1 Researchers’ Report 2013 Country Profile: Estonia2 idem
Participation in International networksA recent survey in ICT area demonstrated that the coordinators choose their research team in 49% from previous collaborations and 27% on the suggestion of other consortium members. This means that for a collaborative research, networking and cooperation skills may be as important as research expertise, which represents a barrier for newcomers who are not well connected to European networks.

Tallin, Estonia – June 17, 2014 - First policy dialogue
Beneficiaries of the mobility programmes – FP7 PeopleDevelopments in the participation in the mobility programmes
FP5participants
FP6participants
FP7Participants(2007- 2011)
FP5 nationalmarket shareparticipants
FP6 nationalmarket shareparticipants
FP7 nationalmarket shareparticipants
EE 29 21 41 0.37 % 0.34 % 0.34 %
Source: 5th FP7 monitoring report and e-Corda
Knowledge of English among the population
% population able to hold conversation in English
EE 50
EU 28 49,5
EU 15 56,0
EU 13 43,1
Notes: For % of people able to have an English conversation, UK and IE are excluded. Also only EU citizens are included

Tallin, Estonia – June 17, 2014 - First policy dialogue
Performance v/s Potential
Actual participation (n°projects) 412
Estimate 1 (By population)Difference
238+174
Estimation 2 (By R&D Staff)Difference
198+214
Estimate 3 (By scholarly int. publications)Difference
231+181
Estimate 4 (Success rate)Difference
422-10

Tallin, Estonia – June 17, 2014 - First policy dialogue
The Decision Tree for participating in Horizon 2020
Source: Mirris Scoping Paper - Eurada

Tallin, Estonia – June 17, 2014 - First policy dialogue
OverviewParticipation patterns
Source: e-Corda

Tallin, Estonia – June 17, 2014 - First policy dialogue
“By Necessity”
“By Opportunity”
Attitudes towards FP7
By Necessity: Stands for striving for EU budget=Extra budget
By opportunity: Stands for being EU projects an opportunity to capitalise on excellence
Disclaimer: The above noted statements are not based on the scientific point of view, but are based on the analytical findings

Tallin, Estonia – June 17, 2014 - First policy dialogue
Opportunistic
Laziness
ItalyDenmarkFinlandSwedenGreece
Possible attitude towards FP7 – 2nd part
Strategic approach: Italy –Setting up of a national agency to enhance the participation in EU research - APRE; Denmark, Finland and Sweden: Research and Innovation as key national strategyTactical approach: Greece: role of diaspora and education abroad. The connections of individuals may be an useful source of connection to facilitate the participation in EU research programmes. Belgium: Legal headquarters of many EU organizations.
NetherlandsUK
SpainGreece
France………
Strategic/tactical
Tallin, Estonia – June 17, 2014 - First policy dialogue
OverviewFindings
Source: e-Corda

Tallin, Estonia – June 17, 2014 - First policy dialogue
FP Performance and wider innovation indicators for Estonia benchmarked to EU 28 and EU 13 averages
Source: Eurostat, 2011 and Sixth monitoring report FP7

Tallin, Estonia – June 17, 2014 - First policy dialogue
Key highlights to be addressedMain findings from the scoping paper
Estonia success rate in applying for FP7 is higher than the EU13 average (EE 21.2 % vs EU13 18.4) and very close to the EU 27 average (21.7%) ;
The gain per head of population is 52.3€, compares to an EU 13 average of 13.50€, and close to EU 27 standing at €58.04. The average number of € per beneficiary in Estonia is a bit lower than the EU 13 average (165 k vs 167), and far from EU27 average (324k).

Tallin, Estonia – June 17, 2014 - First policy dialogue
Questions and Answers

Tallin, Estonia – June 17, 2014 - First policy dialogue
What influence is due to structural issues: quality of excellence in R&D capability of drafting good proposals awareness of the stakeholders
What influence have subjective and perception issues: reputation of the R&D eco-system openness for involvement in networks talent to transform an idea into a proposal
What influence have objective issues: date of full membership to the EU size of the population costs of wages number of stakeholders targeted by the FP7 programme availability of national budget quality of research
Tallin, Estonia – June 17, 2014 - First policy dialogue
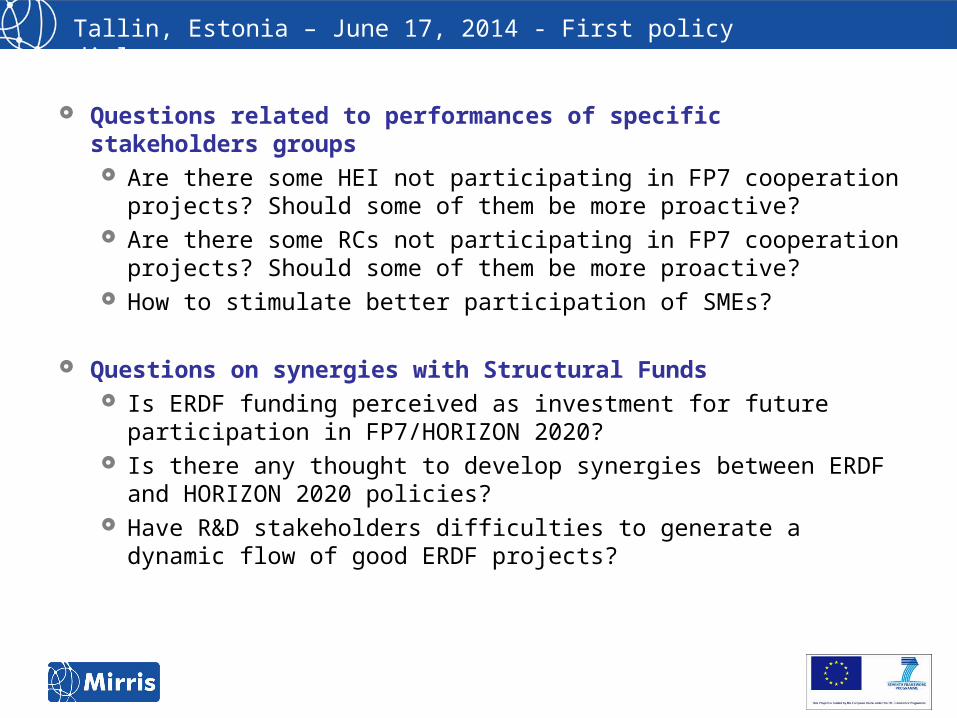
Questions related to performances of specific stakeholders groups Are there some HEI not participating in FP7 cooperation projects?
Should some of them be more proactive? Are there some RCs not participating in FP7 cooperation projects?
Should some of them be more proactive? How to stimulate better participation of SMEs?
Questions on synergies with Structural Funds Is ERDF funding perceived as investment for future participation in
FP7/HORIZON 2020? Is there any thought to develop synergies between ERDF and
HORIZON 2020 policies? Have R&D stakeholders difficulties to generate a dynamic flow of good
ERDF projects?

Tallin, Estonia – June 17, 2014 - First policy dialogue
What tools should be put in place in order to increase the quantity and the quality of the submitted projects?
How the awareness of stakeholders influence participation? Should Estonia try to increase the amount captured per project instead of increasing the total number of projects funded?
To ensure the higher number of proposals to bring a larger number of primo-users of EU funding or to help current beneficiaries to be involved in more projects?
……………………….
Questions on where to go