Embed Size (px)
Citation preview
Talking Freight -- Big Ships
Lee KindbergDirector, Environment & SustainabilityMaersk Line

Port-related operations are significant sources of air emissions and greenhouse gases.
2

Big ships have higher efficiencies and provide enormous economies of scale – and lower emissions per unit.
Largest variable costs are personnel and fuel.
• Vessels carry 18 to 20 personnel.
• New vessels have additional technologies for energy efficiency
• Some existing vessels were “Eco-retrofit”
• Bridge elevation increases capacity with minimal additional energy use.
3

Energy efficiency
LESS CO2
35%Engine Hull Design Capacity Waste Heat
Recovery System
Economy of scale Environmentally improved
18,000+ TEU vessels set new standards for energy efficiency and environmental performance.
4

Vessel size, age and speed are the major determinants of fuel consumption and emissions.
Vessel TEUCO2 Dry g/TEU km
CO2 Reefer g/TEU km
Year built
Maersk Wolfsburg 1,713 75 118 2010
SL Racer 4,360 58 95 1995
SL Champion 4,360 50 88 1994
Susan Maersk 9,640 39 70 1997
Georg Maersk 11,078 33 69 2004
Maersk Edmonton 13,492 35 80 2011
Emma Maersk 15,550 37 66 2006
Majestic Maersk 18,340 26 54 20130
10
20
30
40
50
60
70
80
0 5000 10000 15000 20000
CO
2 E
mis
sio
ns (
g/
TEU
km
)
Vessel capacity (TEU)
Emissions per TEU by ship sizeCCWG Dry Container method
Methodology: Clean Cargo Working Group https://www.bsr.org/en/collaboration/groups/clean-cargo-working-groupMaersk Line data is verified by Lloyd’s Register
5

Clean Cargo Working Group annual benchmarking study
Source: BSR Clean Cargo Working Group, 2014 Environmental Performance study of ~2900 vessels.
6
Other air emissions are proportional to fuel use and
CO2.

Vessels are increasingly fuel efficient. This reduces fuel use, CO2 and other air emissions in our customers’ supply chains.
New vessels
Eco-Retrofitting vessels
Network design
“Smart steaming”
Big data
2016 results:
Maersk Line -42% less CO2 per container per km vs. 2007
CCWG –34% vs. 2009
2020 Maersk Line goal: Reduce CO2 by 60% vs. 2007
verified by:
7

8

How big is big?
• Draft depends on loading & trim
• Air draft = Height - actual draft
Example:
• Edinburgh class (13,000 TEU)
• Height from keel to mast: 66m
• Typical draft: 12.1m to 13.7m
• Air draft:
• 66m – 12.1 m = 53.9 m
• 66m – 13.7 m = 52.3 m
Vessel TEULOA (meters)
Beam (meters)
Keel to top of mast (m)
Max Summer Draft (m)
Air draft @ Summer draft (m)
MAERSK WOLFSBURG 1,713 175 28 45.3 9.5 35.8
SL CHAMPION 4,360 292 32 55.2 13 42.2
SUSAN MAERSK 9,640 347 43 63.4 15 48.4
GEORG MAERSK 11,078 367 43 68 15.9 52.1
MAERSK EDMONTON 13,492 367 48 66 16 50
EMMA MAERSK 15,550 399 56 73 16 57
MAJESTIC MAERSK 18,340 399 59 73 16 57
9

Challenges
Will they fit?
• Air draft
• Turning basin and berth length
• Crane height
• Shore power connection locations
Network planning and vessel deployment
Capacity utilization
Stowage planning
10
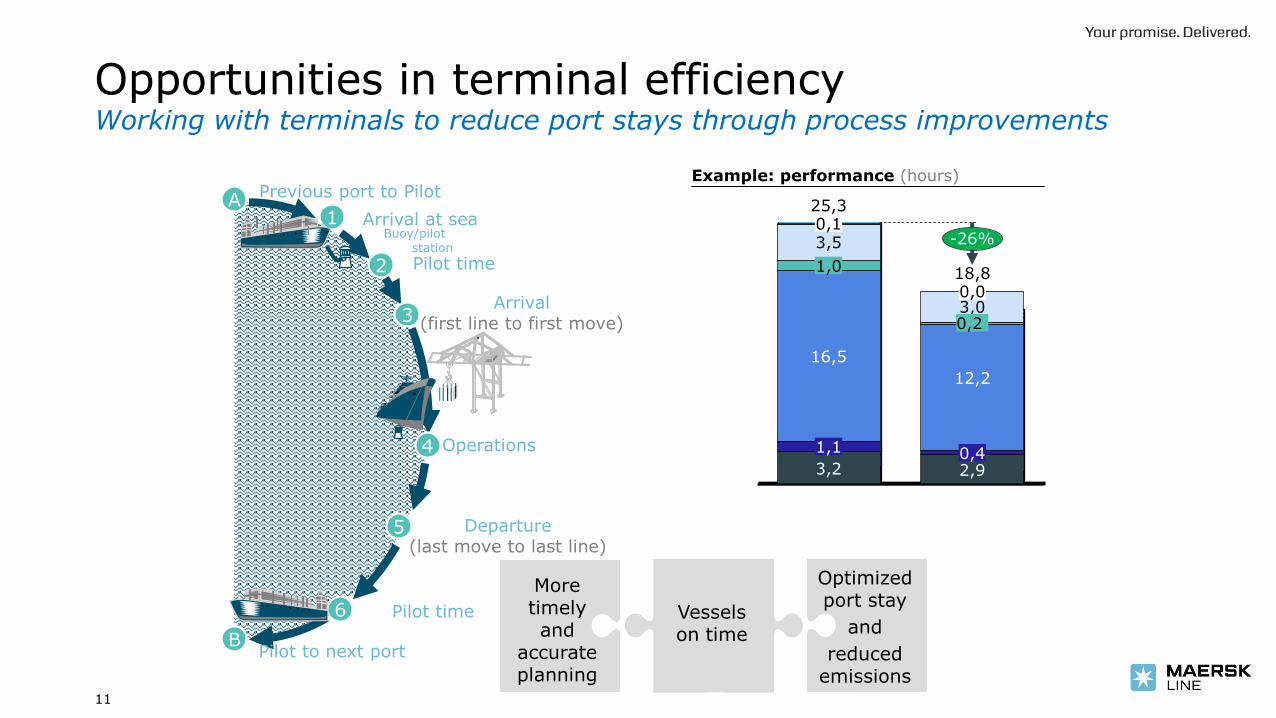
Opportunities in terminal efficiencyWorking with terminals to reduce port stays through process improvements
Arrival at sea1
Pilot time 2
Arrival(first line to first move)3
Operations4
Departure(last move to last line)
5
Pilot time 6
Buoy/pilot station
Previous port to PilotA
Pilot to next portB
Example: performance (hours)
18,8
-26%
2,90,4
12,2
0,0
25,3
3,2
1,1
16,5
1,0
3,50,1
3,00,2
Vessels on time
More timely and
accurate planning
Optimized port stay
and
reduced emissions
11


![[창업에듀]45.3 시장기회 고객 욕구와 시장 세분화](https://img.dokumen.tips/doc/110x75/58ce65511a28ab2f268b66ff/453-58ce65511a28ab2f268b66ff.jpg)