Embed Size (px)
Citation preview
Acta Cryst. (2017). B73, doi:10.1107/S2052520617001354 Supporting information
Volume 73 (2017)
Supporting information for article:
Taking the halogen bonding-hydrogen bonding competition one step further: Complexes of difluoroiodomethane with trimethyl-phosphine, dimethyl sulfide and chloromethane
Yannick Geboes, Frank De Proft and Wouter A. Herrebout

23
Table S1.1: Cartesian coordinates of the MP2/aug-cc-pVDZ-PP optimized geometry of difluoroiodomethane.
X Y Z
CHF2I C 0.461801 -1.276126 0.000000 H 1.552810 -1.382611 0.000000 F -0.060896 -1.882815 1.101579 F -0.060896 -1.882815 -1.101579 I -0.060896 0.810001 0.000000
Table S1.2: Cartesian coordinates of the MP2/aug-cc-pVDZ optimized geometry of trimethylphosphine.
X Y Z TMP P 0.000000 0.000000 0.618978 C 0.000000 1.626598 -0.285498 H -0.889964 2.208825 -0.001487 H 0.889964 2.208825 -0.001487 H 0.000000 1.481355 -1.378927 C -1.408675 -0.813299 -0.285498 H -1.467917 -1.875144 -0.001487 H -2.357881 -0.333681 -0.001487 H -1.282891 -0.740678 -1.378927 C 1.408675 -0.813299 -0.285498 H 2.357881 -0.333681 -0.001487 H 1.467917 -1.875144 -0.001487 H 1.282891 -0.740678 -1.378927
Table S1.3: Cartesian coordinates of the MP2/aug-cc-pVDZ optimized geometry of dimethyl sulfide.
X Y Z DMS S 0.000000 0.674247 0.000000 C -1.370330 -0.522675 0.000000 H -2.309643 0.047454 0.000000 H -1.334542 -1.152689 -0.900834 H -1.334542 -1.152688 0.900834 C 1.370330 -0.522675 0.000000 H 1.334542 -1.152689 -0.900834 H 2.309643 0.047454 0.000000 H 1.334542 -1.152689 0.900834
Table S1.4: Cartesian coordinates of the MP2/aug-cc-pVDZ optimized geometry of chloromethane.
CH3Cl X Y Z

24
CH3Cl C 0.000000 0.000000 -1.134242 H 0.000000 1.040001 -1.477217 H -0.900667 -0.520001 -1.477217 H 0.900667 -0.520001 -1.477217 Cl 0.000000 0.000000 0.661006
Table S2.1: Cartesian coordinates of the MP2/aug-cc-pVDZ-PP optimized geometry of the hydrogen bonded complex between CHF2I and trimethylphosphine.
X Y Z
CHF2I C -1.216105 1.353406 -0.000007 H -0.132928 1.531390 -0.000019 F -1.797300 1.906772 -1.100901 F -1.797275 1.906778 1.100897 I -1.556091 -0.778530 0.000002 TMP P 2.433219 0.310927 -0.000005 C 2.626429 -0.879781 -1.413081 H 1.740677 -1.530608 -1.468765 H 2.700723 -0.323563 -2.360047 H 3.527461 -1.503794 -1.290861 C 4.140404 1.046128 -0.000009 H 4.271464 1.679600 -0.890422 H 4.271460 1.679624 0.890387 H 4.915127 0.261437 0.000003 C 2.626421 -0.879749 1.413099 H 2.700709 -0.323510 2.360052 H 1.740667 -1.530573 1.468791 H 3.527452 -1.503766 1.290898
Table S2.2: Cartesian coordinates of the MP2/aug-cc-pVDZ-PP optimized geometry of the halogen bonded complex between CHF2I and trimethylphosphine.
X Y Z
CHF2I C 3.039329 0.000074 -0.120817 H 3.521408 0.000128 -1.106167 F 3.443285 -1.103496 0.579305 F 3.443117 1.103684 0.579340 I 0.894182 -0.000089 -0.330647 TMP P -2.597960 -0.000069 -0.084146 C -2.962250 1.415033 1.061597

25
H -2.183466 1.468763 1.837625 H -2.946416 2.360742 0.498785 H -3.946593 1.299233 1.545139 C -4.168149 -0.000761 -1.076796 H -4.197578 0.889428 -1.723114 H -4.197437 -0.891692 -1.722098 H -5.055548 -0.000457 -0.422101 C -2.962026 -1.413920 1.063213 H -2.946027 -2.360269 0.501483 H -2.183240 -1.466632 1.839308 H -3.946393 -1.297731 1.546613

26
Table S2.3: Cartesian coordinates of the MP2/aug-cc-pVDZ-PP optimized geometry of the hydrogen bonded complex between CHF2I and dimethyl sulfide.
X Y Z
CHF2I C -0.785959 1.258032 -0.381791 H 0.079193 1.257115 -1.054250 F -0.488219 1.947842 0.756259 F -1.860138 1.858460 -0.964421 I -1.281284 -0.778912 0.124298 DMS S 2.745384 0.432273 -0.507237 C 2.637149 0.518652 1.308262 H 2.514127 1.574865 1.584687 H 1.767347 -0.049505 1.669318 H 3.559797 0.130779 1.763817 C 2.888789 -1.375358 -0.664189 H 2.002971 -1.868460 -0.238243 H 2.953370 -1.612667 -1.735166 H 3.800441 -1.730811 -0.162384
Table S2.4: Cartesian coordinates of the MP2/aug-cc-pVDZ-PP optimized geometry of the halogen bonded complex between CHF2I and dimethyl sulfide.
X Y Z
CHF2I C -2.639583 0.000071 -0.002747 H -3.199738 0.000218 -0.945700 F -2.982435 -1.103272 0.727881 F -2.982301 1.103281 0.728144 I -0.520886 -0.000012 -0.388345 DMS S 2.929895 -0.000077 -0.424875 C 2.967183 1.372335 0.770366 H 2.930865 2.310712 0.199858 H 2.094133 1.323466 1.437999 H 3.896366 1.343011 1.357619 C 2.967139 -1.372225 0.770669 H 2.094094 -1.323176 1.438295 H 2.930784 -2.310727 0.200369 H 3.896326 -1.342805 1.357911

27
Table S2.5: Cartesian coordinates of the MP2/aug-cc-pVDZ-PP optimized geometry of the hydrogen bonded complex with a secondary C-H···F between CHF2I and chloromethane.
X Y Z
CHF2I C -0.341590 1.277646 -0.128791 H 0.442884 1.290430 -0.893239 F -1.301935 2.198920 -0.414227 F 0.193498 1.594957 1.086312 I -1.222580 -0.684963 -0.035059 CH3Cl
C 2.847452 -0.704367 0.946920 H 2.382405 0.045316 1.595374 H 3.855860 -0.952773 1.294024 H 2.222981 -1.601401 0.880877 Cl 2.990197 -0.003711 -0.704497
Table S2.6: Cartesian coordinates of the MP2/aug-cc-pVDZ-PP optimized geometry of the hydrogen bonded complex with a secondary C-H···I between CHF2I and chloromethane.
X Y Z
CHF2I C -0.676612 1.305798 -0.000004 H 0.402006 1.498825 -0.000030 F -1.257116 1.857254 -1.101066 F -1.257061 1.857249 1.101089 I -1.011921 -0.824659 0.000000 CH3Cl C 3.096877 -1.100970 0.000022 H 2.582231 -1.451300 -0.900496 H 2.582225 -1.451256 0.900554 H 4.146207 -1.414069 0.000033 Cl 3.060303 0.697955 -0.000023
Table S2.7: Cartesian coordinates of the MP2/aug-cc-pVDZ-PP optimized geometry of the halogen bonded complex between CHF2I and chloromethane.
X Y Z
CHF2I C 2.439103 -0.010448 -0.000231 H 2.987805 -0.959635 -0.001505 F 2.782525 0.717958 -1.101619 F 2.782955 0.715250 1.102809 I 0.322673 -0.385166 -0.000280 CH3Cl C -3.173743 1.461749 0.000851

28
H -4.185999 1.879482 0.001089 H -2.627700 1.761309 -0.899947 H -2.627660 1.760383 0.901930 Cl -3.313505 -0.331435 -0.000066
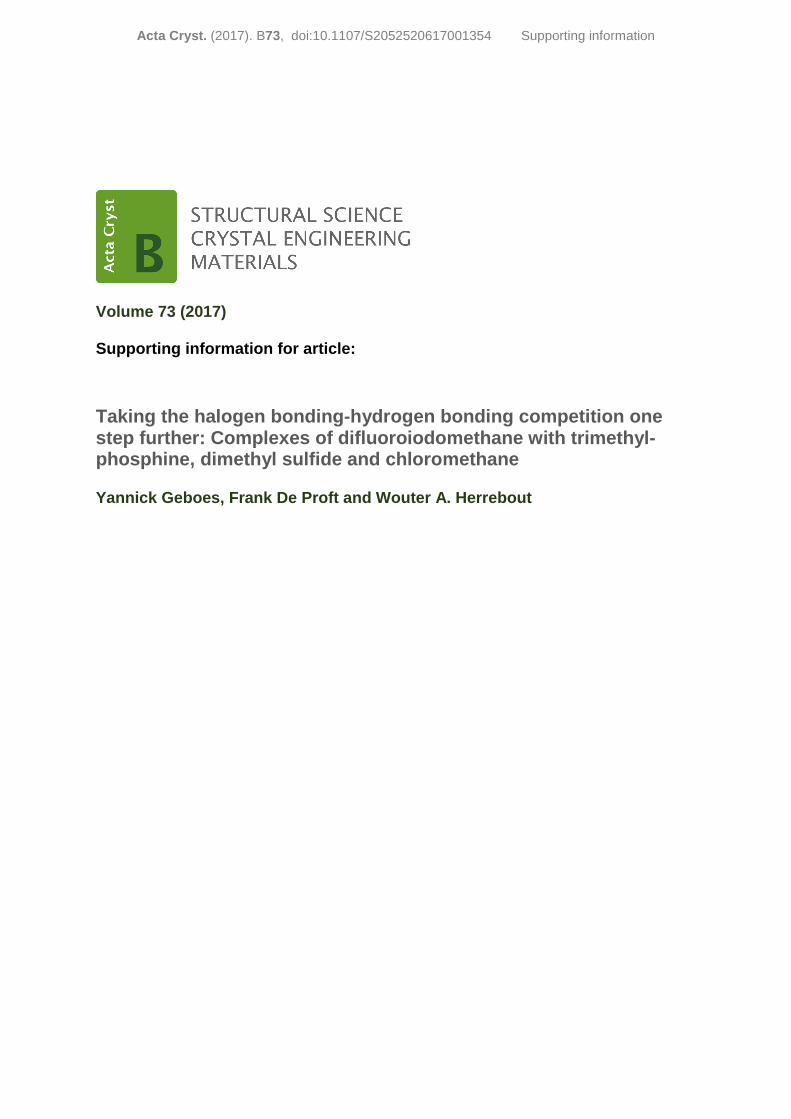
Table S3A: MP2/aug-cc-pVDZ-PP vibrational frequencies, in cm-1, infrared intensities, in km mol-1, and Raman intensities, in Å4 amu-1, for the hydrogen bonded complex of CHF2I and trimethylphosphine and both monomers, as well as the complexation shift Δν.
Monomer Hydrogen bonded complex Frequency IR intensity Raman intensity Frequency Δν IR intensity Raman intensity
CHF2I
ν1 (A’) 3192.4 3.6 94.4 3172.8 -19.6 18.9 210.1
ν2 (A’) 1279.7 99.2 7.5 1280.3 0.6 129.6 31.5 ν3 (A’) 1074.1 300.4 3.2 1070.1 -3.9 309.6 3.5 ν4 (A’) 652.5 81.8 18.4 651.0 -1.5 72.8 10.9 ν5 (A’) 549.4 2.9 1.8 551.0 1.6 5.3 2.0 ν6 (A’) 276.0 0.2 6.6 272.7 -3.3 0.01 6.2 ν7 (A”) 1346.0 4.1 2.7 1369.5 23.5 8.9 1.0 ν8 (A”) 1096.9 186.9 1.9 1092.7 -4.2 164.9 1.5 ν9 (A”) 277.0 0.0004 1.2 275.5 -1.5 0.002 0.9
TMP ν1 (A1) 3148.5 33.6 160.8 3151.3 2.7 28.5 148.6 ν2 (A1) 3043.5 29.4 528.4 3045.9 2.3 30.0 526.0 ν3 (A1) 1469.0 9.2 1.5 1468.7 -0.3 8.0 0.9 ν4 (A1) 1314.7 5.1 7.3 1315.6 1.0 9.0 5.5 ν5 (A1) 957.8 20.1 5.0 959.4 1.5 34.9 4.2 ν6 (A1) 660.9 0.5 26.5 662.8 1.9 0.9 28.0 ν7 (A1) 287.5 1.0 1.5 287.8 0.3 0.9 1.4 ν8 (A2) 3168.1 0.0 0.0 3170.5 2.4 0.2 3.3 ν9 (A2) 1440.1 0.0 0.0 1439.3 -0.8 0.2 0.3 ν10 (A2) 776.6 0.0 0.0 779.5 2.9 0.0001 0.03 ν11 (A2) 164.1 0.0 0.0 164.5 0.4 0.007 0.01 ν12 (E) 3167.9 11.5 95.9 3170.2 2.3 8.6 78.4 ν13 (E) 3149.3 3.0 18.4 3152.4 3.1 2.6 23.2 ν14 (E) 3046.9 16.7 4.2 3049.3 2.4 14.1 14.8 ν15 (E) 1456.7 8.7 3.0 1456.0 -0.7 6.8 3.9 ν16 (E) 1446.2 3.1 9.5 1445.9 -0.3 2.6 8.4 ν17 (E) 1290.0 2.3 0.7 1290.6 0.7 2.4 0.7 ν18 (E) 946.6 16.5 0.5 948.9 2.3 16.4 0.9 ν19 (E) 831.0 0.2 0.3 833.2 2.2 0.2 0.4 ν20 (E) 718.3 11.6 11.8 722.8 4.5 9.4 13.0
29
ν21 (E) 249.8 0.2 2.8 248.2 -1.6 0.2 2.3 ν22 (E) 207.4 0.0009 0.6 207.3 -0.1 0.003 0.4
Van der Waals vibrations: 6.3 cm-1, 0.07 km mol-1, 0.1 Å4 amu-1, 27.1 cm-1, 0.2 km mol-1, 0.06 Å4 amu-
1, 33.3 cm-1, 0.2 km mol-1, 0.5 Å4 amu-1, 46.7 cm-1, 0.8 km mol-1, 0.5 Å4 amu-1, 50.3 cm-1, 0.8 km mol-
1, 0.2 Å4 amu-1, 65.4 cm-1, 0.2 km mol-1, 0.7 Å4 amu-1.

30
Table S3B: MP2/aug-cc-pVDZ-PP vibrational frequencies, in cm-1, infrared intensities, in km mol-1, and Raman intensities, in Å4 amu-1, for the hydrogen bonded complex of CHF2I and trimethylphosphine-d9 and both monomers, as well as the complexation shift Δν.
Monomer Hydrogen bonded complex Frequency IR intensity Raman intensity Frequency Δν IR intensity Raman intensity
CHF2I
ν1 (A’) 3192.4 3.6 94.4 3172.8 -19.6 17.5 200.9
ν2 (A’) 1279.7 99.2 7.5 1280.6 0.9 129.8 28.9 ν3 (A’) 1074.1 300.4 3.2 1070.2 -3.9 307.3 3.7 ν4 (A’) 652.5 81.8 18.4 651.2 -1.3 74.5 13.3 ν5 (A’) 549.4 2.9 1.8 551.0 1.6 5.3 2.0 ν6 (A’) 276.0 0.2 6.6 272.8 -3.2 0.008 6.5 ν7 (A”) 1346.0 4.1 2.7 1369.5 23.5 8.7 1.0 ν8 (A”) 1096.9 186.9 1.9 1092.7 -4.2 164.2 1.4 ν9 (A”) 277.0 0.0004 1.2 275.5 -1.5 0.002 0.9
TMP-d9 ν1 (A1) 2330.8 15.5 84.8 2333.2 2.4 13.1 87.2 ν2 (A1) 2184.5 10.3 254.0 2186.0 1.5 10.6 250.2 ν3 (A1) 1058.7 8.5 0.9 1058.4 -0.4 7.1 0.6 ν4 (A1) 1021.8 3.7 15.4 1022.0 0.2 6.6 16.3 ν5 (A1) 779.8 14.3 2.3 781.3 1.5 22.5 1.7 ν6 (A1) 597.0 0.0 20.0 598.6 1.6 0.2 18.6 ν7 (A1) 246.1 0.5 1.1 246.9 0.8 0.4 0.8 ν8 (A2) 2344.5 0.0 0.0 2346.4 1.9 0.001 0.2 ν9 (A2) 1041.0 0.0 0.0 1040.1 -0.9 0.002 0.2 ν10 (A2) 582.2 0.0 0.0 584.4 2.3 0.002 0.02 ν11 (A2) 116.8 0.0 0.0 117.2 0.4 0.003 0.006 ν12 (E) 2345.4 3.7 50.1 2347.3 1.9 2.9 43.6 ν13 (E) 2332.7 1.4 11.4 2335.1 2.4 1.0 12.2 ν14 (E) 2186.9 6.7 0.7 2188.5 1.5 5.5 5.3 ν15 (E) 1052.1 4.8 1.2 1051.3 -0.8 5.4 1.5 ν16 (E) 1044.7 0.2 4.5 1044.4 -0.4 0.2 3.9 ν17 (E) 1009.0 8.5 3.5 1009.7 0.7 8.9 3.5 ν18 (E) 760.6 15.4 1.8 762.9 2.3 15.1 2.7 ν19 (E) 652.0 3.6 6.9 655.9 3.9 1.9 7.7 ν20 (E) 625.1 0.5 0.7 626.6 1.5 0.2 0.8 ν21 (E) 208.8 0.1 2.3 207.9 -0.8 0.09 1.8 ν22 (E) 150.6 0.01 0.1 150.3 -0.2 0.01 0.1
Van der Waals vibrations: 5.9 cm-1, 0.08 km mol-1, 0.1 Å4 amu-1, 25.3 cm-1, 0.1 km mol-1, 0.04 Å4 amu-
1, 32.2 cm-1, 0.2 km mol-1, 0.4 Å4 amu-1, 43.5 cm-1, 0.7 km mol-1, 0.5 Å4 amu-1, 45.3 cm-1, 0.6 km mol-

31
1, 0.2 Å4 amu-1, 63.6 cm-1, 0.2 km mol-1, 0.7 Å4 amu-1.

32
Table S4A: MP2/aug-cc-pVDZ-PP vibrational frequencies, in cm-1, infrared intensities, in km mol-1, and Raman intensities, in Å4 amu-1, for the halogen bonded complex of CHF2I and trimethylphosphine and both monomers, as well as the complexation shift Δν.
Monomer Halogen bonded complex Frequency IR intensity Raman intensity Frequency Δν IR intensity Raman intensity
CHF2I
ν1 (A’) 3192.4 3.6 94.4 3180.3 -12.1 8.7 168.9
ν2 (A’) 1279.7 99.2 7.5 1278.5 -1.2 147.4 9.0 ν3 (A’) 1074.1 300.4 3.2 1068.1 -6.0 349.6 4.6 ν4 (A’) 652.5 81.8 18.4 647.5 -5.0 45.4 95.4 ν5 (A’) 549.4 2.9 1.8 544.7 -4.7 2.7 6.1 ν6 (A’) 276.0 0.2 6.6 272.0 -4.0 4.5 31.1 ν7 (A”) 1346.0 4.1 2.7 1343.7 -2.3 4.2 3.6 ν8 (A”) 1096.9 186.9 1.9 1079.6 -17.2 183.7 1.7 ν9 (A”) 277.0 0.0004 1.2 278.6 1.6 0.04 1.5
TMP ν1 (A1) 3148.5 33.6 160.8 3151.6 3.1 31.3 188.2 ν2 (A1) 3043.5 29.4 528.4 3046.0 2.5 35.6 563.3 ν3 (A1) 1469.0 9.2 1.5 1467.7 -1.3 7.4 1.6 ν4 (A1) 1314.7 5.1 7.3 1315.4 0.7 3.9 17.1 ν5 (A1) 957.8 20.1 5.0 957.6 -0.3 72.2 22.1 ν6 (A1) 660.9 0.5 26.5 662.3 1.4 0.9 26.5 ν7 (A1) 287.5 1.0 1.5 286.2 -1.4 0.7 2.3 ν8 (A2) 3168.1 0.0 0.0 3170.0 1.9 3.9 32.9 ν9 (A2) 1440.1 0.0 0.0 1439.0 -1.1 0.01 0.05 ν10 (A2) 776.6 0.0 0.0 779.1 2.6 0.0 0.01 ν11 (A2) 164.1 0.0 0.0 163.9 -0.2 0.0008 0.002 ν12 (E) 3167.9 11.5 95.9 3170.9 3.0 6.2 65.4 ν13 (E) 3149.3 3.0 18.4 3152.8 3.5 2.3 29.9 ν14 (E) 3046.9 16.7 4.2 3049.4 2.5 13.4 18.5 ν15 (E) 1456.7 8.7 3.0 1455.5 -1.2 9.2 4.2 ν16 (E) 1446.2 3.1 9.5 1445.0 -1.2 2.2 8.5 ν17 (E) 1290.0 2.3 0.7 1290.9 0.9 4.0 1.2 ν18 (E) 946.6 16.5 0.5 948.9 2.3 16.0 0.8 ν19 (E) 831.0 0.2 0.3 832.1 1.2 0.8 0.6 ν20 (E) 718.3 11.6 11.8 724.7 6.4 8.7 16.0 ν21 (E) 249.8 0.2 2.8 245.3 -4.5 0.2 2.8 ν22 (E) 207.4 0.0009 0.6 207.0 -0.3 0.02 0.4
Van der Waals vibrations: 3.7 cm-1, 1.0 km mol-1, 0.009 Å4 amu-1, 12.0 cm-1, 0.7 km mol-1, 0.6 Å4 amu-
1, 12.4 cm-1, 1.5 km mol-1, 0.5 Å4 amu-1, 52.0 cm-1, 2.4 km mol-1, 3.7 Å4 amu-1, 52.9 cm-1, 0.004 km

33
mol-1, 0.2 Å4 amu-1, 57.7 cm-1, 0.8 km mol-1, 0.4 Å4 amu-1.

34
Table S4B: MP2/aug-cc-pVDZ-PP vibrational frequencies, in cm-1, infrared intensities, in km mol-1, and Raman intensities, in Å4 amu-1, for the halogen bonded complex of CHF2I and trimethylphosphine-d9 and both monomers, as well as the complexation shift Δν.
Monomer Halogen bonded complex Frequency IR intensity Raman intensity Frequency Δν IR intensity Raman intensity
CHF2I
ν1 (A’) 3192.4 3.6 94.4 3180.3 -12.1 8.7 168.6
ν2 (A’) 1279.7 99.2 7.5 1278.6 -1.1 150.6 9.4 ν3 (A’) 1074.1 300.4 3.2 1067.9 -6.1 359.8 3.8 ν4 (A’) 652.5 81.8 18.4 647.2 -5.4 43.9 100.5 ν5 (A’) 549.4 2.9 1.8 544.7 -4.7 2.7 6.1 ν6 (A’) 276.0 0.2 6.6 272.2 -3.8 4.0 32.0 ν7 (A”) 1346.0 4.1 2.7 1343.7 -2.3 4.2 3.6 ν8 (A”) 1096.9 186.9 1.9 1079.6 -17.2 184.0 1.7 ν9 (A”) 277.0 0.0004 1.2 278.5 1.6 0.04 1.4
TMP-d9 ν1 (A1) 2330.8 15.5 84.8 2333.6 2.7 12.5 127.0 ν2 (A1) 2184.5 10.3 254.0 2186.1 1.6 12.7 263.2 ν3 (A1) 1058.7 8.5 0.9 1057.6 -1.1 9.3 0.7 ν4 (A1) 1021.8 3.7 15.4 1022.1 0.3 3.7 20.8 ν5 (A1) 779.8 14.3 2.3 780.1 0.2 46.1 10.8 ν6 (A1) 597.0 0.0 20.0 598.2 1.2 0.0 21.2 ν7 (A1) 246.1 0.5 1.1 245.7 -0.4 0.5 1.3 ν8 (A2) 2344.5 0.0 0.0 2346.3 1.8 0.5 6.4 ν9 (A2) 1041.0 0.0 0.0 1040.0 -1.0 0.0001 0.04 ν10 (A2) 582.2 0.0 0.0 584.3 2.1 0.0003 0.008 ν11 (A2) 116.8 0.0 0.0 116.7 -0.1 0.0004 0.001 ν12 (E) 2345.4 3.7 50.1 2347.7 2.3 2.2 39.4 ν13 (E) 2332.7 1.4 11.4 2335.4 2.8 0.7 14.5 ν14 (E) 2186.9 6.7 0.7 2188.5 1.6 5.1 6.1 ν15 (E) 1052.1 4.8 1.2 1051.0 -1.1 4.5 1.8 ν16 (E) 1044.7 0.2 4.5 1043.7 -1.0 0.2 4.0 ν17 (E) 1009.0 8.5 3.5 1010.1 1.1 8.0 5.0 ν18 (E) 760.6 15.4 1.8 763.7 3.0 13.5 3.3 ν19 (E) 652.0 3.6 6.9 657.7 5.7 3.6 5.7 ν20 (E) 625.1 0.5 0.7 625.6 0.5 0.3 1.6 ν21 (E) 208.8 0.1 2.3 206.0 -2.7 0.1 2.2 ν22 (E) 150.6 0.01 0.1 149.8 -0.8 0.04 0.1
Van der Waals vibrations: 3.6 cm-1, 1.0 km mol-1, 0.007 Å4 amu-1, 11.0 cm-1, 0.6 km mol-1, 0.6 Å4 amu-
1, 11.4 cm-1, 1.2 km mol-1, 0.5 Å4 amu-1, 50.2 cm-1, 2.5 km mol-1, 3.5 Å4 amu-1, 50.8 cm-1, 0.02 km mol-

35
1, 0.1 Å4 amu-1, 54.9 cm-1, 0.4 km mol-1, 0.3 Å4 amu-1.
36
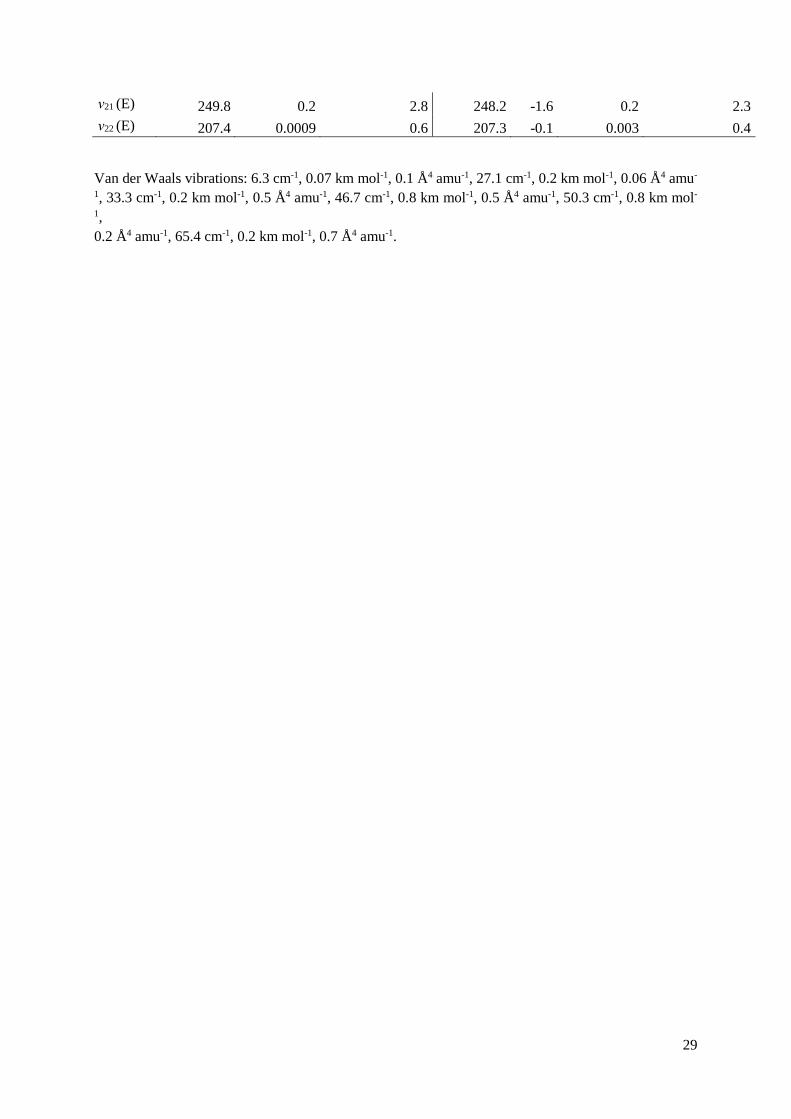
Table S5A: MP2/aug-cc-pVDZ-PP vibrational frequencies, in cm-1, infrared intensities, in km mol-1, and Raman intensities, in Å4 amu-1, for the hydrogen bonded complex of CHF2I and dimethyl sulfide and both monomers, as well as the complexation shift Δν.
Monomer Hydrogen bonded complex Frequency IR intensity Raman intensity Frequency Δν IR intensity Raman intensity
CHF2I
ν1 (A’) 3192.4 3.6 94.4 3202.1 9.7 3.0 99.6
ν2 (A’) 1279.7 99.2 7.5 1276.8 -2.9 100.4 17.0 ν3 (A’) 1074.1 300.4 3.2 1068.2 -5.9 269.8 3.3 ν4 (A’) 652.5 81.8 18.4 650.5 -2.0 72.7 14.0 ν5 (A’) 549.4 2.9 1.8 550.1 0.7 4.0 1.5 ν6 (A’) 276.0 0.2 6.6 273.5 -2.5 0.03 5.9 ν7 (A”) 1346.0 4.1 2.7 1344.4 -1.6 6.7 5.2 ν8 (A”) 1096.9 186.9 1.9 1092.9 -4.0 209.0 3.1 ν9 (A”) 277.0 0.0004 1.2 277.6 0.7 0.09 1.0
DMS ν1 (A1) 3186.3 9.8 92.1 3187.8 1.4 5.8 74.2 ν2 (A1) 3062.2 31.8 338.0 3063.7 1.5 24.5 329.7 ν3 (A1) 1473.5 0.3 7.6 1472.7 -0.8 2.1 7.8 ν4 (A1) 1352.5 0.8 0.9 1353.1 0.6 1.2 1.0 ν5 (A1) 1046.4 8.6 0.4 1047.9 1.5 8.0 0.3 ν6 (A1) 713.3 2.8 22.1 710.9 -2.4 2.8 19.3 ν7 (A1) 260.8 0.03 3.0 260.6 -0.2 0.05 2.4 ν8 (A2) 3168.0 0.0 16.5 3172.0 4.0 0.2 12.1 ν9 (A2) 1450.1 0.0 10.3 1448.3 -1.8 0.4 9.3 ν10 (A2) 945.6 0.0 0.1 948.8 3.2 0.01 0.5 ν11 (A2) 171.2 0.0 0.1 174.2 3.0 0.04 0.06 ν12 (B1) 3159.9 21.3 119.4 3165.0 5.1 17.2 99.4 ν13 (B1) 1462.5 12.9 0.02 1460.7 -1.8 10.7 0.5 ν14 (B1) 982.7 4.1 0.006 985.7 3.0 10.9 0.4 ν15 (B1) 187.1 0.8 0.09 188.5 1.4 1.1 0.1 ν16 (B2) 3187.4 3.4 42.0 3190.0 2.6 2.7 43.4 ν17 (B2) 3066.9 26.3 2.8 3068.0 1.1 20.5 6.1 ν18 (B2) 1464.2 13.6 0.03 1462.9 -1.2 8.0 0.2 ν19 (B2) 1326.0 6.5 0.1 1325.9 -0.1 4.2 0.1 ν20 (B2) 912.7 0.2 0.2 915.2 2.5 0.1 0.1 ν21 (B2) 765.1 0.1 8.5 762.7 -2.3 0.4 7.0
Van der Waals vibrations: 24.5 cm-1, 0.6 km mol-1, 0.5 Å4 amu-1, 31.4 cm-1, 0.3 km mol-1, 0.4 Å4 amu-
1, 36.8 cm-1, 1.1 km mol-1, 0.2 Å4 amu-1, 61.8 cm-1, 0.04 km mol-1, 1.2 Å4 amu-1, 72.7 cm-1, 0.3 km mol-

37
1, 0.5 Å4 amu-1, 91.6 cm-1, 7.3 km mol-1, 0.2 Å4 amu-1.

38
Table S5B: MP2/aug-cc-pVDZ-PP vibrational frequencies, in cm-1, infrared intensities, in km mol-1, and Raman intensities, in Å4 amu-1, for the hydrogen bonded complex of CHF2I and dimethyl sulfide-d6 and both monomers, as well as the complexation shift Δν.
Monomer Hydrogen bonded complex Frequency IR intensity Raman intensity Frequency Δν IR intensity Raman intensity
CHF2I
ν1 (A’) 3192.4 3.6 94.4 3202.1 9.7 2.9 99.6
ν2 (A’) 1279.7 99.2 7.5 1277.1 -2.6 101.4 16.0 ν3 (A’) 1074.1 300.4 3.2 1069.4 -4.6 254.4 3.3 ν4 (A’) 652.5 81.8 18.4 650.4 -2.1 73.4 13.1 ν5 (A’) 549.4 2.9 1.8 550.1 0.7 4.0 1.5 ν6 (A’) 276.0 0.2 6.6 273.5 -2.5 0.03 5.9 ν7 (A”) 1346.0 4.1 2.7 1344.9 -1.1 6.1 4.9 ν8 (A”) 1096.9 186.9 1.9 1093.5 -3.4 201.8 3.2 ν9 (A”) 277.0 0.0004 1.2 277.6 0.6 0.09 1.1
DMS-d6 ν1 (A1) 2361.4 4.6 45.5 2363.7 2.3 2.1 35.0 ν2 (A1) 2194.1 16.7 162.8 2195.0 0.8 12.9 158.2 ν3 (A1) 1064.3 0.5 3.0 1063.2 -1.1 13.1 3.4 ν4 (A1) 1037.4 1.2 5.6 1036.0 -1.4 0.3 5.5 ν5 (A1) 837.1 3.9 1.7 837.4 0.2 3.0 1.3 ν6 (A1) 655.7 2.7 17.4 654.5 -1.2 2.2 16.3 ν7 (A1) 223.6 0.0 2.2 223.7 0.1 0.05 1.8 ν8 (A2) 2350.5 0.0 8.5 2353.5 3.0 0.08 6.2 ν9 (A2) 1046.5 0.0 4.3 1044.4 -2.1 7.6 3.7 ν10 (A2) 708.3 0.0 0.4 710.6 2.3 0.008 0.7 ν11 (A2) 122.8 0.0 0.1 126.3 3.5 0.04 0.09 ν12 (B1) 2344.4 10.8 63.9 2348.2 3.9 8.6 53.5 ν13 (B1) 1056.3 7.2 0.0 1054.2 -2.1 17.7 0.4 ν14 (B1) 751.1 0.9 0.1 753.2 2.1 2.8 0.4 ν15 (B1) 136.8 0.8 0.1 139.4 2.6 1.9 0.1 ν16 (B2) 2360.9 1.2 22.7 2362.1 1.2 1.6 25.8 ν17 (B2) 2197.7 15.2 0.5 2198.2 0.5 11.8 2.4 ν18 (B2) 1060.2 7.9 0.1 1058.7 -1.5 0.7 0.2 ν19 (B2) 1017.4 2.5 0.6 1016.0 -1.4 0.9 0.5 ν20 (B2) 720.2 0.0 7.3 718.8 -1.3 0.1 6.0 ν21 (B2) 686.0 0.0 0.1 687.8 1.8 0.003 0.05
Van der Waals vibrations: 22.5 cm-1, 0.5 km mol-1, 0.4 Å4 amu-1, 31.0 cm-1, 0.3 km mol-1, 0.4 Å4 amu-
1, 36.2 cm-1, 1.0 km mol-1, 0.2 Å4 amu-1, 54.5 cm-1, 0.07 km mol-1, 0.9 Å4 amu-1, 67.1 cm-1, 0.9 km mol-

39
1, 0.5 Å4 amu-1, 83.8 cm-1, 4.6 km mol-1, 0.1 Å4 amu-1.
Table S6A: MP2/aug-cc-pVDZ-PP vibrational frequencies, in cm-1, infrared intensities, in km mol-1, and Raman intensities, in Å4 amu-1, for the halogen bonded complex of CHF2I and dimethyl sulfide and both monomers, as well as the complexation shift Δν.
Monomer Halogen bonded complex Frequency IR intensity Raman intensity Frequency Δν IR intensity Raman intensity CHF2I
ν1 (A’) 3192.4 3.6 94.4 3183.2 -9.3 7.2 148.4 ν2 (A’) 1279.7 99.2 7.5 1279.5 -0.2 135.6 8.0 ν3 (A’) 1074.1 300.4 3.2 1069.0 -5.0 327.5 2.8 ν4 (A’) 652.5 81.8 18.4 650.5 -2.0 54.0 58.5 ν5 (A’) 549.4 2.9 1.8 545.6 -3.8 2.6 4.0 ν6 (A’) 276.0 0.2 6.6 274.1 -1.9 3.1 20.1 ν7 (A”) 1346.0 4.1 2.7 1344.2 -1.8 3.8 3.2 ν8 (A”) 1096.9 186.9 1.9 1082.2 -14.6 181.7 1.7 ν9 (A”) 277.0 0.0004 1.2 279.3 2.3 0.01 1.5
DMS ν1 (A1) 3186.3 9.8 92.1 3188.3 1.9 6.6 89.9 ν2 (A1) 3062.2 31.8 338.0 3062.3 0.1 24.3 311.5 ν3 (A1) 1473.5 0.3 7.6 1471.5 -2.0 2.8 9.7 ν4 (A1) 1352.5 0.8 0.9 1352.2 -0.3 0.2 7.5 ν5 (A1) 1046.4 8.6 0.4 1047.4 1.1 6.5 0.6 ν6 (A1) 713.3 2.8 22.1 710.5 -2.8 3.3 19.0 ν7 (A1) 260.8 0.03 3.0 261.1 0.3 0.03 2.5 ν8 (A2) 3168.0 0.0 16.5 3170.6 2.6 0.4 14.5 ν9 (A2) 1450.1 0.0 10.3 1448.3 -1.8 0.3 8.6 ν10 (A2) 945.6 0.0 0.1 948.9 3.3 0.003 0.4 ν11 (A2) 171.2 0.0 0.1 173.6 2.4 0.02 0.09 ν12 (B1) 3159.9 21.3 119.4 3163.6 3.7 16.3 113.3 ν13 (B1) 1462.5 12.9 0.02 1461.2 -1.4 13.6 0.5 ν14 (B1) 982.7 4.1 0.006 984.9 2.3 13.6 0.7 ν15 (B1) 187.1 0.8 0.09 188.0 0.9 1.8 0.4 ν16 (B2) 3187.4 3.4 42.0 3189.3 1.9 1.7 32.6 ν17 (B2) 3066.9 26.3 2.8 3066.7 -0.2 18.7 7.5 ν18 (B2) 1464.2 13.6 0.03 1461.5 -2.6 8.0 0.4 ν19 (B2) 1326.0 6.5 0.1 1326.0 0.1 3.5 0.09 ν20 (B2) 912.7 0.2 0.2 914.9 2.2 0.2 0.2 ν21 (B2) 765.1 0.1 8.5 762.3 -2.8 0.4 7.2

40
Van der Waals vibrations: 6.3 cm-1, 2.5 km mol-1, 0.05 Å4 amu-1, 32.2 cm-1, 0.0002 km mol-1, 1.0 Å4 amu-1, 32.5 cm-1, 2.0 km mol-1, 0.6 Å4 amu-1, 63.9 cm-1, 1.5 km mol-1, 1.8 Å4 amu-1, 67.2 cm-1, 0.007 km mol-1, 0.8 Å4 amu-1, 106.5 cm-1, 12.3 km mol-1, 2.9 Å4 amu-1.

41
Table S6B: MP2/aug-cc-pVDZ-PP vibrational frequencies, in cm-1, infrared intensities, in km mol-1, and Raman intensities, in Å4 amu-1, for the halogen bonded complex of CHF2I and dimethyl sulfide-d6 and both monomers, as well as the complexation shift Δν.
Monomer Halogen bonded complex Frequency IR intensity Raman intensity
CHF2I
ν1 (A’) 3192.4 3.6 94.4 3183.2 -9.3 7.2 148.8 ν2 (A’) 1279.7 99.2 7.5 1279.5 -0.2 136.1 7.9 ν3 (A’) 1074.1 300.4 3.2 1069.4 -4.7 311.5 2.1 ν4 (A’) 652.5 81.8 18.4 650.4 -2.1 52.9 60.6 ν5 (A’) 549.4 2.9 1.8 545.6 -3.8 2.6 4.0 ν6 (A’) 276.0 0.2 6.6 274.0 -1.9 3.1 20.0 ν7 (A”) 1346.0 4.1 2.7 1344.2 -1.8 3.9 3.2 ν8 (A”) 1096.9 186.9 1.9 1082.2 -14.6 181.4 1.7 ν9 (A”) 277.0 0.0004 1.2 279.3 2.3 0.01 1.5
DMS-d6 ν1 (A1) 2361.4 4.6 45.5 2363.2 1.9 2.9 46.5 ν2 (A1) 2194.1 16.7 162.8 2194.0 -0.2 13.0 148.8 ν3 (A1) 1064.3 0.5 3.0 1062.0 -2.4 20.4 5.5 ν4 (A1) 1037.4 1.2 5.6 1036.0 -1.4 0.6 9.2 ν5 (A1) 837.1 3.9 1.7 836.9 -0.3 2.6 1.5 ν6 (A1) 655.7 2.7 17.4 654.3 -1.4 4.6 13.0 ν7 (A1) 223.6 0.0 2.2 224.3 0.7 0.05 1.9 ν8 (A2) 2350.5 0.0 8.5 2352.4 1.9 0.2 7.2 ν9 (A2) 1046.5 0.0 4.3 1045.1 -1.4 0.2 3.6 ν10 (A2) 708.3 0.0 0.4 710.9 2.6 0.004 0.8 ν11 (A2) 122.8 0.0 0.1 126.4 3.6 0.01 0.1 ν12 (B1) 2344.4 10.8 63.9 2347.2 2.8 7.8 58.6 ν13 (B1) 1056.3 7.2 0.0 1055.1 -1.2 8.8 0.1 ν14 (B1) 751.1 0.9 0.1 753.1 2.1 2.2 0.9 ν15 (B1) 136.8 0.8 0.1 140.3 3.5 4.3 1.1 ν16 (B2) 2360.9 1.2 22.7 2362.6 1.7 0.6 17.5 ν17 (B2) 2197.7 15.2 0.5 2197.3 -0.3 10.9 3.0 ν18 (B2) 1060.2 7.9 0.1 1057.9 -2.3 4.7 0.2 ν19 (B2) 1017.4 2.5 0.6 1016.1 -1.3 1.7 0.5 ν20 (B2) 720.2 0.0 7.3 718.5 -1.6 0.1 5.9 ν21 (B2) 686.0 0.0 0.1 687.8 1.8 0.0008 0.1
Van der Waals vibrations: 6.0 cm-1, 2.2 km mol-1, 0.03 Å4 amu-1, 30.2 cm-1, 0.002 km mol-1, 1.0 Å4 amu-1, 31.4 cm-1, 1.9 km mol-1, 0.6 Å4 amu-1, 61.0 cm-1, 0.009 km mol-1, 0.5 Å4 amu-1, 61.3 cm-1, 1.3

42
km mol-1, 1.6 Å4 amu-1, 94.9 cm-1, 8.4 km mol-1, 2.2 Å4 amu-1.

43
Table S7: MP2/aug-cc-pVDZ-PP vibrational frequencies, in cm-1, infrared intensities, in km mol-1, and Raman intensities, in Å4 amu-1, for the hydrogen bonded complex with a secondary C-H···F interaction of CHF2I and chloromethane and both monomers, as well as the complexation shift Δν.
Monomer Hydrogen bonded complex (C-H···Cl + F···H-C) Frequency IR intensity Raman intensity Frequency Δν IR intensity Raman intensity
CHF2I
ν1 (A’) 3192.4 3.6 94.4 3208.2 15.7 0.8 82.7
ν2 (A’) 1279.7 99.2 7.5 1280.8 1.1 101.4 8.9 ν3 (A’) 1074.1 300.4 3.2 1067.8 -6.3 266.0 3.0 ν4 (A’) 652.5 81.8 18.4 650.1 -2.5 75.2 15.9 ν5 (A’) 549.4 2.9 1.8 549.6 0.2 3.4 1.5 ν6 (A’) 276.0 0.2 6.6 275.0 -1.0 0.09 6.0 ν7 (A”) 1346.0 4.1 2.7 1342.8 -3.2 0.7 5.1 ν8 (A”) 1096.9 186.9 1.9 1093.8 -3.1 216.3 2.6 ν9 (A”) 277.0 0.0004 1.2 278.2 1.2 0.07 1.1
CH3Cl ν1 (A) 3109.9 24.4 147.2 3111.6 1.7 17.0 139.7 ν2 (A) 1369.8 13.2 0.006 1370.0 0.3 11.1 0.1 ν3 (A) 750.4 25.3 17.9 741.4 -8.9 23.8 14.7 ν4 (E) 3230.5 3.6 48.9 3235.5 5.0 2.6 40.3 ν5 (E) 1474.7 5.0 4.0 1472.3 -2.5 9.6 3.7 ν6 (E) 1031.9 2.1 0.6 1034.2 2.2 3.5 0.6
Van der Waals vibrations: 22.8 cm-1, 2.2 km mol-1, 0.9 Å4 amu-1, 26.6 cm-1, 0.8 km mol-1, 0.5 Å4 amu-
1, 41.9 cm-1, 1.3 km mol-1, 0.2 Å4 amu-1, 56.6 cm-1, 0.3 km mol-1, 0.2 Å4 amu-1, 70.2 cm-1, 0.7 km mol-
1, 0.3 Å4 amu-1, 80.7 cm-1, 7.3 km mol-1, 1.0 Å4 amu-1.

44
Table S8: MP2/aug-cc-pVDZ-PP vibrational frequencies, in cm-1, infrared intensities, in km mol-1, and Raman intensities, in Å4 amu-1, for the hydrogen bonded complex with a secondary C-H···I interaction of CHF2I and chloromethane and both monomers, as well as the complexation shift Δν.
Monomer Hydrogen bonded complex (C-H···Cl + I···H-C) Frequency IR intensity Raman intensity Frequency Δν IR intensity Raman intensity
CHF2I
ν1 (A’) 3192.4 3.6 94.4 3205.2 12.7 1.6 115.7
ν2 (A’) 1279.7 99.2 7.5 1279.1 -0.6 104.5 13.2 ν3 (A’) 1074.1 300.4 3.2 1073.0 -1.1 309.9 3.3 ν4 (A’) 652.5 81.8 18.4 650.2 -2.3 75.8 15.9 ν5 (A’) 549.4 2.9 1.8 550.8 1.4 4.5 1.8 ν6 (A’) 276.0 0.2 6.6 273.9 -2.1 0.04 6.3 ν7 (A”) 1346.0 4.1 2.7 1354.6 8.7 6.5 1.6 ν8 (A”) 1096.9 186.9 1.9 1097.2 0.4 176.1 1.8 ν9 (A”) 277.0 0.0004 1.2 276.2 -0.8 0.0 1.0
CH3Cl ν1 (A) 3109.9 24.4 147.2 3111.9 2.0 16.4 142.6 ν2 (A) 1369.8 13.2 0.006 1369.9 0.2 12.0 0.1 ν3 (A) 750.4 25.3 17.9 741.9 -8.5 24.1 14.5 ν4 (E) 3230.5 3.6 48.9 3236.0 5.5 3.3 42.6 ν5 (E) 1474.7 5.0 4.0 1470.6 -4.2 11.1 3.5 ν6 (E) 1031.9 2.1 0.6 1033.6 1.6 3.1 0.6
Van der Waals vibrations: 5.7 cm-1, 0.6 km mol-1, 0.6 Å4 amu-1, 18.5 cm-1, 3.7 km mol-1, 0.1 Å4 amu-1, 28.5 cm-1, 0.2 km mol-1, 0.6 Å4 amu-1, 57.2 cm-1, 0.04 km mol-1, 0.03 Å4 amu-1, 61.1 cm-1, 0.04 km mol-1, 0.4 Å4 amu-1, 72.2 cm-1, 6.2 km mol-1, 0.7 Å4 amu-1.

45
Table S9: MP2/aug-cc-pVDZ-PP vibrational frequencies, in cm-1, infrared intensities, in km mol-1, and Raman intensities, in Å4 amu-1, for the halogen bonded complex of CHF2I and chloromethane and both monomers, as well as the complexation shift Δν.
Monomer Halogen bonded complex Frequency IR intensity Raman intensity Frequency Δν IR intensity Raman intensity
CHF2I
ν1 (A’) 3192.4 3.6 94.4 3189.4 -3.0 4.6 113.8
ν2 (A’) 1279.7 99.2 7.5 1281.2 1.5 119.1 6.8 ν3 (A’) 1074.1 300.4 3.2 1071.6 -2.5 312.1 2.8 ν4 (A’) 652.5 81.8 18.4 654.5 2.0 72.8 26.5 ν5 (A’) 549.4 2.9 1.8 548.0 -1.4 2.8 2.1 ν6 (A’) 276.0 0.2 6.6 276.9 1.0 0.8 8.9 ν7 (A”) 1346.0 4.1 2.7 1345.1 -0.9 4.1 2.8 ν8 (A”) 1096.9 186.9 1.9 1089.6 -7.3 185.1 1.8 ν9 (A”) 277.0 0.0004 1.2 278.7 1.7 0.01 1.4
CH3Cl ν1 (A) 3109.9 24.4 147.2 3109.6 -0.3 17.3 144.7 ν2 (A) 1369.8 13.2 0.006 1369.3 -0.4 8.2 0.7 ν3 (A) 750.4 25.3 17.9 743.2 -7.2 23.6 15.4 ν4 (E) 3230.5 3.6 48.9 3232.7 2.2 3.3 46.1 ν5 (E) 1474.7 5.0 4.0 1471.7 -3.0 9.2 3.5 ν6 (E) 1031.9 2.1 0.6 1032.7 0.7 4.1 0.8
Van der Waals vibrations: 5.0 cm-1, 4.6 km mol-1, 0.7 Å4 amu-1, 22.5 cm-1, 2.1 km mol-1, 0.8 Å4 amu-1, 26.5 cm-1, 0.6 km mol-1, 0.3 Å4 amu-1, 43.6 cm-1, 0.02 km mol-1, 0.05 Å4 amu-1, 51.2 cm-1, 0.1 km mol-
1, 0.5 Å4 amu-1, 69.5 cm-1, 7.3 km mol-1, 1.1 Å4 amu-1.

46
Table S10: Experimental vibrational frequencies for the monomer and complexes, as well as experimental complexation shifts (Δνexp) and MP2/aug-cc-pVDZ-PP calculated complexation shifts (Δνcalc), in cm-1, for the halogen bonded complex (XB) and hydrogen bonded complex (HB) of difluoroiodomethane (CHF2I) with trimethylphosphine (TMP) dissolved in LKr at 130 K.
Assignment νmonomer νcomplex,XB Δνexp,XB Δνcalc,XB νcomplex,HB Δνexp,HB Δνcalc,HB
CHF2I ν1 3003.3 2989.9a -13.4 -12.1 2989.9a -13.4 -19.6 ν5+ ν7+ ν8 2993.9 -24.3 21.0 ν3+ ν8 2171.2 2145.2 -26.0 -23.2 2160.6 -10.6 -8.1 2ν3 2144.1 2129.0 -15.1 -11.9 2133.9 -10.2 -7.9 ν7 1337.2 1335.5 -1.7 -2.3 23.5 ν2 1247.6 1244.0 -3.6 -1.2 1247.8 0.8 0.6 ν8 1107.6 1087.7 -19.9 -17.2 1101.8 -5.8 -4.2 ν3 1077.1 1070.7 -6.4 -6.0 1072.5 -4.6 -3.9 ν4 633.6 628.5 -5.1 -5.0 663.1 -0.5 -1.5 ν5 567.8 563.2 -4.6 -4.7 568.3 0.5 -1.6 2ν6 536.8 TMP ν12 2971.9 2974.6 2.7 3.0 2974.6 2.7 2.3 ν1 2957.7 2961.0 2.3 3.1 2961.0 2.3 2.7 ν13 2957.7 2961.0 2.3 3.5 2961.0 2.3 3.1 ν2 2897.2 2899.2 2.0 2.5 2899.2 2.0 2.3 ν14 2897.2 2899.2 2.0 2.5 2899.2 2.0 2.4 ν3 1436.6 1436.2 -0.4 -1.3 1436.2 -0.4 -0.3 ν15 1426.9 1426.1 -0.8 -1.2 1426.1 -0.8 -0.7 ν16 1418.3 1417.9 -0.4 -1.2 1417.9 -0.4 -0.3 ν6 + ν20 1359.4 1366.9 7.5 7.8 1366.9 7.5 6.4 2ν6 1310.9 1314.5 3.6 2.7 1314.5 3.6 3.8 ν4 1295.1 1297.7 2.6 0.7 1297.7 2.6 1.0 ν17 1278.7 1280.8 2.1 0.9 1280.8 2.1 0.7 ν5 949.0 948.8 -0.2 -0.3 950.5 1.5 1.5 ν18 937.6 939.8 2.2 2.3 939.8 2.2 2.3 ν19 825.3 827.2 1.9 1.2 827.2 1.9 2.2 ν20 708.7 715.0 6.3 6.4 713.1 4.4 4.5 ν6 654.1 656.0 1.9 1.4 656.0 1.9 1.9
a Shoulder of TMP complex band
47
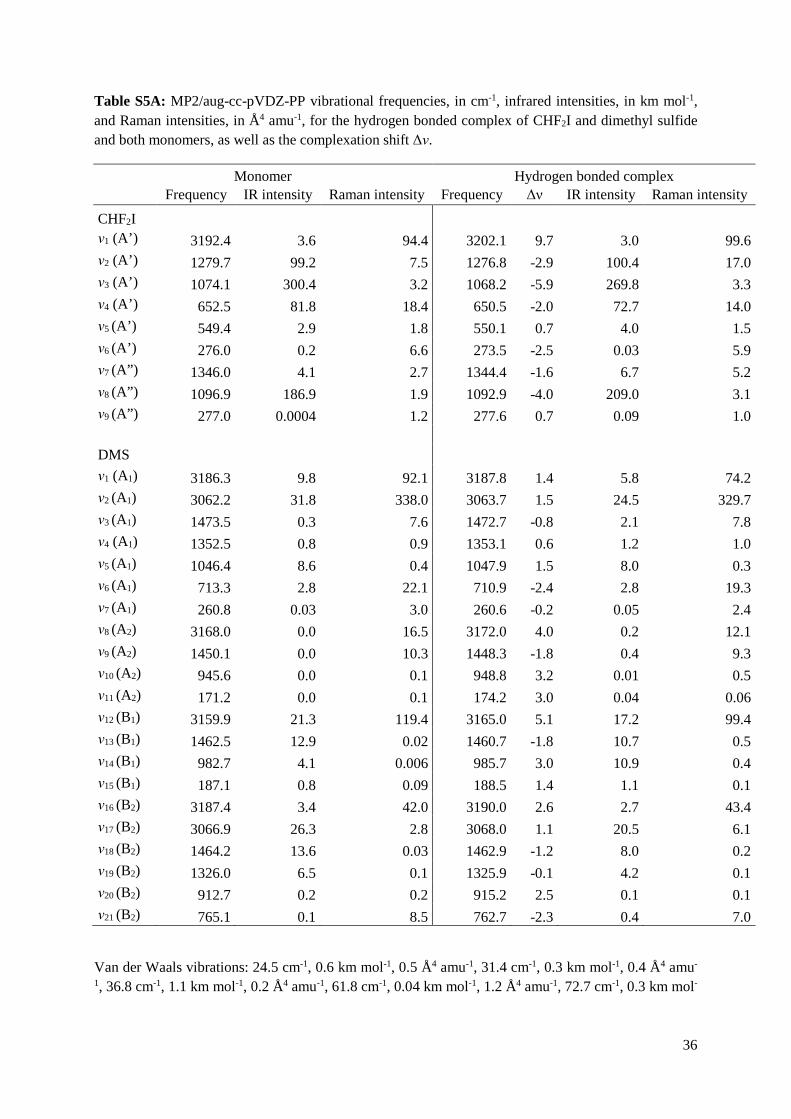
Table S11: Experimental vibrational frequencies for the monomer and complexes, as well as experimental complexation shifts (Δνexp) and MP2/aug-cc-pVDZ-PP calculated complexation shifts (Δνcalc), in cm-1, for the halogen bonded complex (XB) and hydrogen bonded complex (HB) of difluoroiodomethane (CHF2I) with dimethyl sulfide (DMS) dissolved in LKr at 130 K.
Assignment νmonomer νcomplex,XB Δνexp,XB Δνcalc,XB νcomplex,HB Δνexp,HB Δνcalc,HB CHF2I ν1 3003.3 2994.5 -8.8 -9.3 2994.5 -8.8 9.7 ν5+ ν7+ ν8 2993.9 -20.3 -4.9 ν3+ ν8 2170.7 2150.9 -19.8 -19.7 2163.0 -7.7 -9.9 2ν3 2143.7 2132.7 -11.0 -10.1 2132.7 -11.0 -11.7 ν7 1337.3 1336.2 -1.1 -1.8 1336.2 -1.1 -1.6 ν2 1247.6 1247.9 0.3 -0.2 1247.9 0.3 -2.9 ν8 1107.3 1092.7 -14.6 -14.6 1103.6 -3.7 -4.0 ν3 1077.1 1072.5 -4.6 -5.0 1072.5 -4.6 -5.9 ν4 633.6 632.3 -1.3 -2.0 663.3 -1.3 -2.0 ν5 567.7 564.3 -3.4 -3.8 568.0 0.3 0.7 2ν6 536.3 533.0 -3.3 -3.8 533.0 -3.3 -5.0 DMS ν1 2992.0 2994.4 2.4 1.9 2994.4 2.4 1.4 ν16 2992.0 2994.4 2.4 1.9 2994.4 2.4 2.6 ν12 2965.5 2970.3 4.8 3.7 2970.3 4.8 5.1 ν17 2920.4 2921.9 1.5 -0.2 2921.9 1.5 1.1 ν2 2917.3 2918.9 1.6 0.1 2918.9 1.6 1.5 2883.8 2864.6 2862.4 -2.2 2862.4 -2.2 2856.5 2855.3 -1.2 2855.3 -1.2 2ν9 2838.4 2836.3 -2.1 -3.5 2836.3 -2.1 -3.7 ν3 1444.4 1442.8 -1.6 -2.0 1444.4 0.0 -0.8 ν18 1438.9 1437.2 -1.7 -2.6 1437.2 -1.7 -1.2 ν13 1432.8 1432.2 -0.6 -1.4 1432.2 -0.6 -1.8 ν4 (vw) 1331.8 -0.3 0.6 ν19 1310.4 1311.5 1.1 0.1 1311.5 1.1 -0.1 ν5 1030.8 1032.0 1.2 1.1 1032.0 1.2 1.5 ν14 973.3 975.3 2.0 2.3 975.3 2.0 3.0 ν20 901.8 904.0 2.2 2.2 904.0 2.2 2.5 ν6 696.2 694.0 -2.2 -2.8 696.2 -2.2 -2.4
Table S13: Overview of the different van ‘t Hoff plots constructed for the halogen bonded complex between CHF2I and TMP or TMP-d9 in LKr in the 120-156 K temperature interval, showing the estimated mole fractions of each monomer, range of the integrated monomer and complex bands and complex enthalpies ∆H° (LKr).
xCHF2I xTMP Integrated CHF2I band (cm-1)
Integrated TMP band (cm-1)
Integrated Complex band (cm-1)
∆H° (LKr) a
1.1 × 10⁻⁴ 1.9 × 10⁻³ 1128-1093 3000-2930 1095-1080 -15.6(2) 6.1 × 10⁻⁵ 9.4 × 10⁻⁴ 646-622 834.4-819.5 1095-1080 -15.6(3) 1.9 × 10⁻⁴ 1.9 × 10⁻³ b 1128-1093 2263-2185 1095-1080 -15.0(1) a Values are given with the standard deviation of the linear regression in parentheses. b Measurement involving TMP-d9, rather than TMP.

48

49
Table S14: Overview of the different van ‘t Hoff plots constructed for the hydrogen bonded complex between CHF2I and TMP or TMP-d9 in LKr in the 120-156 K temperature interval, showing the estimated mole fractions of each monomer, range of the integrated monomer and complex bands and complex enthalpies ∆H° (LKr).
xCHF2I xTMP Integrated CHF2I band (cm-1)
Integrated TMP band (cm-1)
Integrated Complex band (cm-1)
∆H° (LKr) a
1.1 × 10⁻⁴ 1.9 × 10⁻³ 1128-1093 3000-2930 1110-1095 -10.40(5) 6.1 × 10⁻⁵ 9.4 × 10⁻⁴ 646-622 834.4-819.5 1109-1095 -10.3(1) 1.9 × 10⁻⁴ 1.9 × 10⁻³ b 1128-1093 2263-2185 1110-1095 -10.8(1) a Values are given with the standard deviation of the linear regression in parentheses. b Measurement involving TMP-d9, rather than TMP.
Table S15: Overview of the different van ‘t Hoff plots constructed for the halogen bonded complex between CHF2I and DMS or DMS-d6 in LKr in the 120-156 K temperature interval, showing the estimated mole fractions of each monomer, range of the integrated monomer and complex bands and complex enthalpies ∆H° (LKr).
xCHF2I xDMS Integrated CHF2I band (cm-1)
Integrated DMS band (cm-1)
Integrated Complex band (cm-1)
∆H° (LKr) a
3.8 × 10⁻⁵ 1.9 × 10⁻³ 1263-1234 997-955 CHF2I ν8 (1092.6) -12.0(2) 1.1 × 10⁻⁴ 1.9 × 10⁻³ b 1263-1232 2275-2195 CHF2I ν8 (1092.6) c -11.3(3) 1.9 × 10⁻⁴ 1.9 × 10⁻³ 1262-1238 1322-1302 CHF2I ν8 (1092.6) c -10.8(2) 1.9 × 10⁻⁴ 1.9 × 10⁻³ b 1262.5-1235 2280-2185 CHF2I ν8 (1092.6) c -11.1(1) a Values are given with the standard deviation of the linear regression in parentheses. b Measurement involving DMS-d6, rather than DMS. c Intensity obtained from a band fit analysis.
Table S16: Overview of the different van ‘t Hoff plots constructed for the hydrogen bonded complex between CHF2I and DMS or DMS-d6 in LKr in the 120-156 K temperature interval, showing the estimated mole fractions of each monomer, range of the integrated monomer and complex bands and complex enthalpies ∆H° (LKr).
xCHF2I xDMS Integrated CHF2I band (cm-1)
Integrated DMS band (cm-1)
Integrated Complex band (cm-1)
∆H° (LKr) a
3.8 × 10⁻⁵ 1.9 × 10⁻³ 1263-1234 997-955 1114-1090 -8.0(2) 1.1 × 10⁻⁴ 1.9 × 10⁻³ b 1124-1093 2275-2195 1118-1090 -7.1(3) 1.9 × 10⁻⁴ 1.9 × 10⁻³ 1262.1238 1322-1302 1116-1091 -7.4(1) 1.9 × 10⁻⁴ 1.9 × 10⁻³ b 1262.5-1235 2280-2185 1114-1089 -8.3(2) a Values are given with the standard deviation of the linear regression in parentheses. b Measurement involving DMS-d6, rather than DMS.

50
Figure S1: Plots of the reduced density gradient versus the electron density multiplied by the sign of the second Hessian eigenvalue (left) and gradient isosurfaces (s = 0.5 a.u., right) for the hydrogen bonded complex (top) and the halogen bonded complex (bottom) between CHF2I and trimethylphosphine.

51
Figure S2: Plots of the reduced density gradient versus the electron density multiplied by the sign of the second Hessian eigenvalue (left) and gradient isosurfaces (s = 0.5 a.u., right) for the hydrogen bonded complex (top) and the halogen bonded complex (bottom) between CHF2I and dimethyl sulfide.
Figure S3: Plots of the reduced density gradient versus the electron density multiplied by the sign of the second Hessian eigenvalue (left) and gradient isosurfaces (s = 0.5 a.u., right) for the hydrogen bonded complexes with a secondary C-H···F (top) or C-H···I interaction (middle) and the halogen bonded complex (bottom) between CHF2I and CH3Cl.

52
Figure S4: Infrared spectra of selected spectral regions for the mixtures of difluoroiodomethane with trimethylphosphine dissolved in LKr at 130 K. In each panel, trace a represents the mixed solution, while traces b and c show the rescaled spectra of the solutions containing only difluoroiodomethane or trimethylphosphine, respectively. Trace d represents the spectrum of the complex which is obtained by subtracting the rescaled traces b and c from trace a. Bands due to the halogen and hydrogen bonded complexes observed in traces d are marked with an asterisk (*) or open circle (°), respectively. Estimated mole fractions of the solutions of the mixtures are 5.6 × 10⁻⁵ for CHF2I and 3.8 × 10⁻³ for TMP in panel A, 9.4 × 10⁻⁴ for CHF2I and 9.4 × 10⁻⁴ for TMP in panel B and 5.6 × 10⁻⁵ for CHF2I and 2.4 × 10⁻³ for TMP-d9 in panel C.
Figure S5: Infrared spectra of selected spectral regions for the mixtures of difluoroiodomethane with dimethyl sulfide dissolved in LKr at 130 K. In each panel, trace a represents the mixed solution, while traces b and c show the rescaled spectra of the solutions containing only difluoroiodomethane or dimethyl sulfide, respectively. Trace d represents the spectrum of the complex which is obtained by subtracting the rescaled traces b and c from trace a. Bands due to the halogen and hydrogen bonded complexes observed in traces d are marked with an asterisk (*) or open circle (°), respectively. Estimated mole fractions of the solutions of the mixtures are 5.6 × 10⁻⁵ for CHF2I and 3.8 × 10⁻³ for DMS in panel A and 9.4 × 10⁻⁴ for CHF2I and 1.9 × 10⁻³ for DMS in panel B.
640 630720 7101110 1100 1090 1080 1070
A B C
*°* °*
abc
d
abc
d
Wavenumber (cm-1)
Abs
orba
nce
abc
d°
1110 1100 1090 1080 1070 570 560
*°
°* abc
d
Abs
orba
nce
Wavenumber (cm-1)
° *
A B
abc
d
53
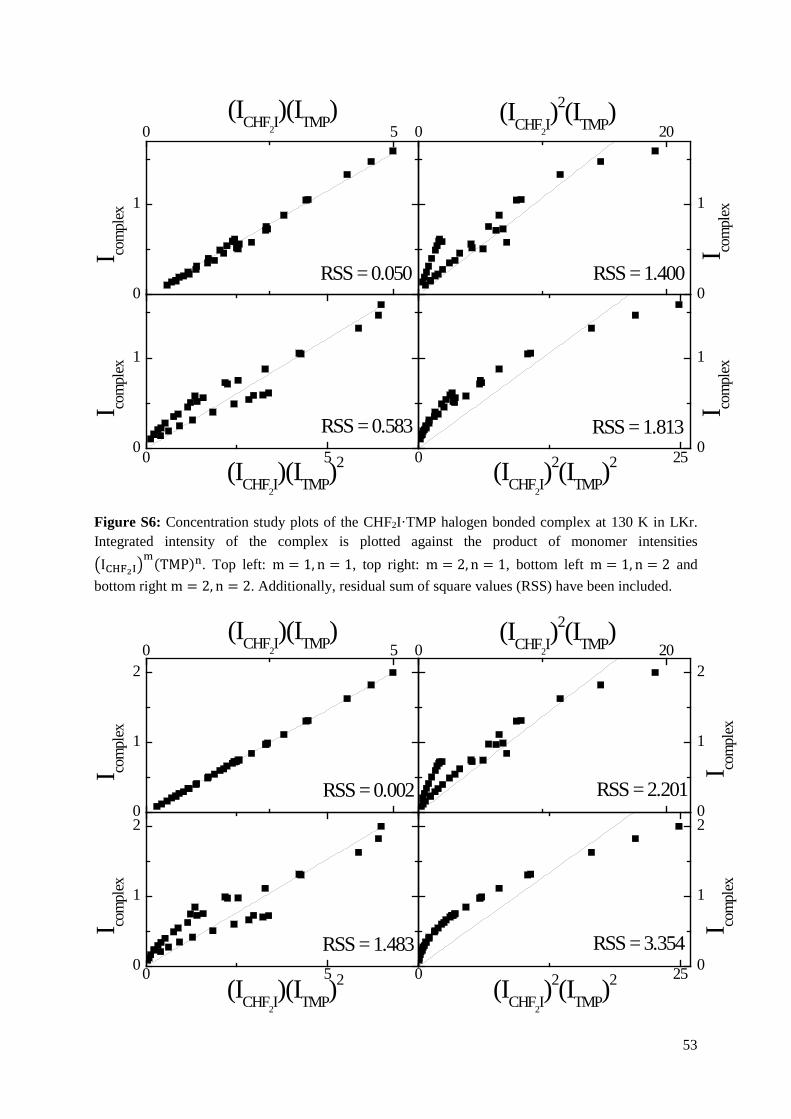
Figure S6: Concentration study plots of the CHF2I·TMP halogen bonded complex at 130 K in LKr. Integrated intensity of the complex is plotted against the product of monomer intensities �ICHF2I�
m(TMP)n. Top left: m = 1, n = 1, top right: m = 2, n = 1, bottom left m = 1, n = 2 and bottom right m = 2, n = 2. Additionally, residual sum of square values (RSS) have been included.
0
1
0 5
0 50
1
0 20
0
1
0 25 0
1
(ICHF2I)(ITMP)
I com
plex
RSS = 1.400
I com
plex
(ICHF2I)(ITMP)
2
RSS = 1.813RSS = 0.583
RSS = 0.050
(ICHF2I)2(ITMP)
I com
plex
I com
plex
(ICHF2I)2(ITMP)
2
0
1
20 5
0 50
1
2
0 20
0
1
2
0 25 0
1
2
(ICHF2I)(ITMP)
I com
plex
I com
plex
(ICHF2I)(ITMP)
2
(ICHF2I)2(ITMP)
I com
plex
RSS = 3.354RSS = 1.483
RSS = 2.201
I com
plex
(ICHF2I)2(ITMP)
2
RSS = 0.002

54
Figure S7: Concentration study plots of the CHF2I·TMP hydrogen bonded complex at 130 K in LKr. Integrated intensity of the complex is plotted against the product of monomer intensities �ICHF2I�
m(TMP)n. Top left: m = 1, n = 1, top right: m = 2, n = 1, bottom left m = 1, n = 2 and bottom right m = 2, n = 2. Additionally, residual sum of square values (RSS) have been included.
Figure S8: Concentration study plots of the CHF2I·DMS halogen bonded complex at 130 K in LKr. Integrated intensity of the complex is plotted against the product of monomer intensities �ICHF2I�
m(DMS)n. Top left: m = 1, n = 1, top right: m = 2, n = 1, bottom left m = 1, n = 2 and bottom right m = 2, n = 2. Additionally, residual sum of square values (RSS) have been included.
0 1250
1
2
0 100
0
1
2
0 600 0
1
20
1
20 10 20
I com
plex
(ICHF2I)(IDMS)
2
RSS = 2.088 RSS = 4.291
(ICHF2I)2(IDMS)
I com
plex
I com
plex
(ICHF2I)2(IDMS)
2
RSS = 2.691RSS = 0.034
(ICHF2I)(IDMS)
I com
plex

55
Figure S9: Concentration study plots of the CHF2I·DMS hydrogen bonded complex at 130 K in LKr. Integrated intensity of the complex is plotted against the product of monomer intensities �ICHF2I�
m(DMS)n. Top left: m = 1, n = 1, top right: m = 2, n = 1, bottom left m = 1, n = 2 and bottom right m = 2, n = 2. Additionally, residual sum of square values (RSS) have been included.
Figure S10: Typical van ‘t Hoff plots of the hydrogen bonded complexes (filled) and halogen bonded complexes (hollow) of CHF2I with dimethyl sulfide (round) and trimethylphosphine (square) in LKr.
0 1250
1
2
0 100
0
1
2
0 600 0
1
20
1
20 10 20
I com
plex
(ICHF2I)(IDMS)
2
RSS = 2.088 RSS = 4.291
(ICHF2I)2(IDMS)
I com
plex
I com
plex
(ICHF2I)2(IDMS)
2
RSS = 2.691RSS = 0.034
(ICHF2I)(IDMS)
I com
plex
0,0064 0,0072 0,0080
-6
-3
0
ln(I co
mpl
ex/((
I CHF 2I)(I
Lew
is Ba
se))
1/T (1/K)

56
Figure S11: Complexation shifts (in cm-1) of the CHF2I ν1 mode plotted against the C···S distance (in Å) for the partially optimized hydrogen bonded complex with the C-H···S angle (□) and C-H···S angle and C-H···S-C dihedral angle (○) from the equilibrium geometry.
Figure S12: Distribution of MP2/aug-cc-pVDZ-PP ab initio frequencies for the CH stretching mode of the hydrogen bonded complex between CHF2I and DMS-d6 at 130 K, obtained from a Monte Carlo sample of the internal coordinates describing the relative orientation of both molecules. Division of the frequencies was made using a bin-width of 1 wavenumber.
4 5
0
10
20
Com
plex
atio
n Sh
ift (c
m-1)
r(C···S) (Å)
3160 3200 3240
0
20
40
Coun
t
Wavenumber (cm-1)

57
Figure S13: Plot of the enthalpy ratio of ∆H°XB∆H°HB
versus chemical hardness η (in eV), as calculated
using the method of Tozer et al. for the complexes formed between difluoroiodomethane and the Lewis bases trimethylamine, dimethyl ether, trimethylphosphine and dimethyl sulfide.
5.5 6.0 6.5
1.0
1.2
1.4
1.6
∆ H° X
B/∆H°
HB
η (eV)


![Halogen(Bonding:(( An(Effective(Toolin(Anion(Coordination ......The halogen bonding (XB), namely the interactions where halogen atoms function as electrophilic species [1], has proven](https://img.dokumen.tips/doc/110x75/5f98522b6666ea1f3772a610/halogenbonding-aneffectivetoolinanioncoordination-the-halogen-bonding.jpg)

![Insights into the crystallisation process from anhydrous ... · bonding and halogen bonding.[11] Hydrogen bonding has been found to stabilise crystal structures and to play a major](https://img.dokumen.tips/doc/110x75/5f26ffaf57bb03333a7ca42d/insights-into-the-crystallisation-process-from-anhydrous-bonding-and-halogen.jpg)
![Compound, [TpBut ]MgF: Hydrogen Bonding, Halogen Bonding ... · lyophilized to afford [TpBut,Me]MgF as a white powder (90 mg, 89% yield). Colorless Colorless crystals of [Tp But,Me](https://img.dokumen.tips/doc/110x75/5b956ef509d3f2205c8cc39a/compound-tpbut-mgf-hydrogen-bonding-halogen-bonding-lyophilized-to.jpg)


![Halogen and Hydrogen Bonding Benzothiophene Diol ...The nature of the halogen bond and the forces involved have been investi-gated by several research groups.[4] The halogen bond interac-tion](https://img.dokumen.tips/doc/110x75/607b435b03e7652c244f17f4/halogen-and-hydrogen-bonding-benzothiophene-diol-the-nature-of-the-halogen-bond.jpg)
![Fluorinated azobenzenes as supramolecular halogen-bonding ......halogen bonding was used to assemble molecules, leading to a variety of supramolecular architectures [8-19], as well](https://img.dokumen.tips/doc/110x75/5f98522a6666ea1f3772a60c/fluorinated-azobenzenes-as-supramolecular-halogen-bonding-halogen-bonding.jpg)