Embed Size (px)
Citation preview

Taking Control – Peak Flow ManagementAt Village Creek Water Reclamation FacilityJanuary 27, 2017

• Presentation #1
– Project Team
– Village Creek Water Reclamation Facility Overview
– Peak Flow Management Project Overview
– Basin Sizing and Optimization
• Presentation #2
– CMAR Process
– Construction Activities

HRC Improvements
Pipeline
Hydraulics
On-Site Resident Project
Representative
Peak Flow Storage Basin
Environmental Review
Process Integration
Geotechnical
Construction Manager at Risk
(CMAR)
Owner/Operator
Village Creek Water Reclamation Facility

• City of Fort Worth’s only wastewater treatment facility
• Serves over 1,000,000 people in Fort Worth and 22 wholesale customers/cities
• Activated sludge process with Tertiary Treatment
• High Rate Clarification for wet weather flows over 255 MGD
• Reclaimed Water System
• Energy Recovery System
• Beneficial Reuse of Biosolidsby Land Application

• Permitted Treatment Capacity
– 166 MGD Daily Average Flow
– 369 MGD 2-Hr Peak Flow
• Sustainable Peak Treatment Capacity (SPTC)
– Observed historical 3-day peak flow capable of being treated by VCWRF (also known as Extended Peak)
– Current – 250 MGD
– 2030 – 320 MGD
• 2HR Functional Treatment Capacity (2HR FTC)
– Peak operating capacity of the functional unit
– processes at VCWRF
– Current – 303 MGD
– 2030 – 388 MGD


• 2012 Master Plan identified the projected 2HR peak flow will exceed VCWRF permitted treatment capacity in 2015
• Construct peak flow storage basin instead of amending VCWRF permit to increase functional peak flow treatment capacity to include HRC treatment (383 MGD)

• Conveyance vs treatment
• Use existing infrastructure and City owned property to save capital dollars
• Greatest flexibility with lowest responsible cost
• Minimize interruptions with plant operations
• CMAR as alternative delivery method to accelerate schedule
• $14M savings over Master Plan recommended alternative

• Increase HRC firm pumping capacity to 110 MGD
• Add redundant HRC chemical feed equipment
• Add sluice gate at HRC influent to connect to HRC drain system
• Add sluice gates at Box OO for flow management
• 6,400 LF 84-inch PFSB pipeline
• PFSB flow metering
• 1,400 LF 36-inch PFSB drain pipeline
• Use existing chlorine system for odor control
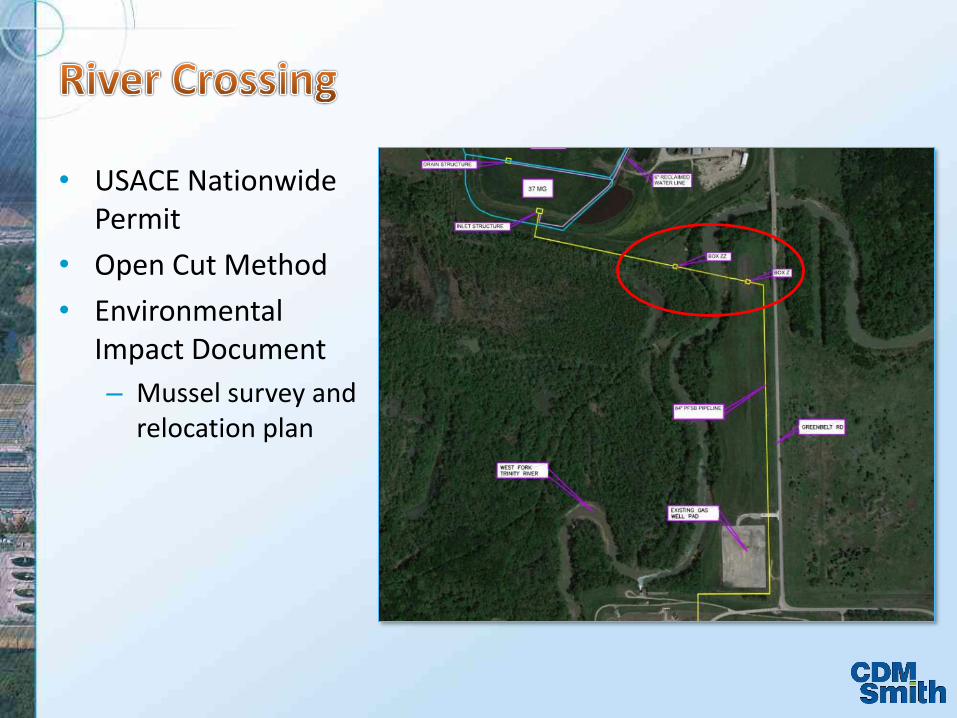
• USACE Nationwide Permit
• Open Cut Method
• Environmental Impact Document
– Mussel survey and relocation plan

• Two earthen basins with 275 MG total storage
• Use existing Sludge Only Landfill levee on south, west, and north sides
• Add approx. 4,000 LF of new interior and exterior levee
• Extend reclaimed water line for basin cleaning


PHF = 494 mgd
2030 Hydrograph Developed from Master Plan
Sustainable Peak Treatment Capacity (SPTC)
SPTC (320) + HRC (110) = 430 MGD
2HR FTC (388) + HRC (110) = 498 MGD64 MGD
9 hrs
21 hrs

Highest Peak duringNov. 11, 2008 Event:
475 MGD
2030 Hydrograph Developed from SCADA Data
Sustainable Peak Treatment Capacity (SPTC)
SPTC (320) + HRC (110) = 430 MGD
2HR FTC (388) + HRC (110) = 498 MGD
8 hrs
45 MGD
4 hrs

Highest Peak duringOct. 22, 2009 Event:
446 MGD
2030 Hydrograph Developed from SCADA Data
Sustainable Peak Treatment Capacity (SPTC)
SPTC (320) + HRC (110) = 430 MGD
2HR FTC (388) + HRC (110) = 498 MGD
2 days 20 hrs
3 days 5 hrs
6 days 14 hrs
14 hrs
16 MGD

MASTER PLAN SINGLE EVENT SCADA SINGLE EVENT SCADA MULTIPLE EVENT
2015 2020 2030 2015 2020 2030 2015 2020 2030
PHFMGD 380 418 494 364 403 475 341 377 466
SPTCMGD 250 250 320 250 250 320 250 250 320
HRC PEAK FLOW
PUMPINGMGD
110 110 110 110 110 110 110 110 110
2HR FTCMGD 303 303 388 303 303 388 303 303 388
AVAILABLE 2HR PEAK CAPACITY
MGD
413 413 498 413 413 498 413 413 498
DURATIONABOVE STC
HRS4 9 9 1 5 4 0 14 14


≈


ParameterExisting (2010) 2015 2020 2030
SPTC, mgd 250 250 250 320 310 300
Hydrographs Developed from SCADA Data
Highest Hydrograph Peak Hourly Flow (PHF), mgd 345 364 403 475 475 475
Overall Average Flow (OAF), mgd 120 135 150 190 190 190
Maximum PFSB Volume Required, MG 70 117 298 209 276 358
Events in 5-year Period 24 25 31 27 30 32
Maximum Duration of Use in an Event, days 5.1 9.8 15 12 14 16
Hydrographs in Master Plan
Highest Hydrograph Peak Hourly Flow (PHF), mgd 361a 380 418 494 494 494
Maximum PFSB Volume Required, MG N/A 62 91 85 94 103
Maximum Duration of Use in an Event, days N/A 1.8 2.3 1.8 2.0 2.1
Maximum Total Flow to PFSB, mgd N/A 130 168 174 184 194


Existing Sludge
Only Landfill
Existing
Dewatering
Facility

Cell 2
≈ 238 MG
Cell 1
≈ 40 MG
SWAT Training