Embed Size (px)
Citation preview

Poverty reduction and environmental management:
TAKING ACTIONIN ASIAN CITIES

Poverty reduction and environmental management:
TAKING ACTIONIN ASIAN CITIES

5
Copyright ecoBUDGET Trademark is registered by ICLEI European Secretariat GmbH
DisclaimerThis publication has been produced with the financial assistance of the EuropeanUnion. The contents of this document are the sole products of Realising DReAMS forSouth and Southeast Asian Local Authorities and can under no circumstances beregarded as reflecting the position of the European Union.
European CommissionThis project is funded by the European Union
Visibility of fundingThe Realising DReAMS project has been supported by the European Union Directorate-General
development and cooperation-EuropeAid
Contributors to the GuideThis publication was coordinated and edited by Cristina Garzillo, ICLEI European Secretariat
Other contributers:- Holger Robrecht, Deputy Regional Director, ICLEI Europe- Claudia Kiso, Project Officer, ICLEI Europe- Esther Lee, Project Assistant, ICLEI Europe- Bedoshruti Sadhukhan, Senior Manager (Sustainability), ICLEI South Asia- Rahul Singh, Project Officer (Sustainability), ICLEI South Asia- Darleen Gela, Project Officer, ICLEI Southeast Asia - Victorino Aquitania, Regional Director, ICLEI Southeast Asia- Ric Marfiga, Project Assistant, ICLEI Southeast Asia- Atty. John Titus J. Vistal, Provincial Planning and Development Coordinator and Project Senior Expert, Province of Bohol- Engr. Ronilita M. Bunado Ppdo, Environment Development Sector Head and Project Junior Expert, Province of Bohol- Dr. Nestor M. Pestelos, Project Manager, DReAMS Project Management Office Bohol- Mr. Metodio B. Maraguinot Jr., Project Deputy Manager, DReAMS Project Management Office Bohol- Anders Lundgren, Environmental Coordinator, Municipality of Växjö- Julia Ahlrot, Environmental Strategist, Municipality of Växjö- Pamela Lama, International Relations and Projects Office, Municipality of Bologna- Raffaella Gueze, Environmental Quality Unit, Municipality of Bologna- Mr. Christopher Leonides P. Racho, Municipal Planning and Development Coordinator, Municipality of Balilihan- Ms. Adelene P. Ga-As, Mayor’s Office Staff, Municipality of Balilihan- Engr. Gerry V. Araneta, Municipal Planning and Development Coordinator, Municipality of Jagna- Ms. Amelia S. Balaba, Municipal Planning and Development Office Staff, Municipality of Jagna
- Engr. Maria Nenita R. Chiu, Municipal Planning and Development Coordinator, Municipality of Maribojoc- Ms. Amor Maria J. Vistal, Executive Assistant to the Municipal Mayor, Municipality of Maribojoc- Engr. Joseph R. Anania, Municipal Planning and Development Coordinator, Municipality of Pilar- Engr. Ednardo A. Avenido, Municipal Planning and Development Coordinator, Municipality of Talibon- Ms. Joannevit R. Avenido, Municipal Planning and Development Office Staff, Municipality of Talibon- Engr. Noel. C Mendaǹa, Municipal Planning and Development Coordinator, Municipality of Tubigon- Mrs. Yolanda L. Labella, Municipal Agriculturist, Municipality of Tubigon- Ms. Rita Amor M. Narvasa, Planning Officer, Municipality of Tubigon
Acknowledgement- Hon. Erico B. Aumentado (Deceased) Governor (2007 to 2010), Province of Bohol- Hon. Edgardo M. Chatto, Governor (2010 to Present), Province of Bohol- Hon. Concepcion O. Lim, Vice-Governor, Province of Bohol- Hon. Abeleon R. Damalerio, Board Member and Project Senior Officer, Province of Bohol- Ms. Coleen R. Montalba, Project Finance Officer, DReAMS Project Management Office (Bohol)- Mr. Anthony C. Irving, Project IT Expert, DReAMS Project Management Office (Bohol)- Mr. Nathanael O. Hinay, Project PDMS Specialist, DReAMS Project Management Office (Bohol)- Ritu Thakur, Senior Project Officer (Sustianability), ICLEI South Asia- Zeny Ranario, Administrative Assistant, ICLEI Southeast Asia- Bo Frank, Mayor, Municipality of Växjö- Giovanni Fini, Environmental Quality Unit, Municipality of Bologna- Gabriele Magli, CSR (Corporate Social Responsibility), Gruppo Hera- Roberto Diolaiti, Director of the Environment and Energy Department, Municipality of Bologna- Ashraful Haque, Chief Engineer, Rajshahi City Corporation- Tshering Yangchen, Environment Officer, Thimpu Thromde- Ravi Sankar, Project Associate, Guntur Municipal Corporation- Hon. Dominisio L. Chatto, Mayor, Municipality of Balilihan- Hon. Efren M. Chatto, Vice-Mayor, Municipality of Balilihan- Hon. Fortunato R. Abrenilla, Mayor, Municipality of Jagna- Hon. Exuperio C. Lloren, Vice-Mayor, Municipality of Jagna- Hon. Leoncio B. Evasco Jr., Mayor, Municipality of Maribojoc- Hon. Fructuoso F. Redulla Jr., Vice-Mayor, Municipality of Maribojoc- Hon. Wilson L. Pajo, Mayor, Municipality of Pilar- Hon. Wilfredo L. Bernante Jr., Vice-Mayor, Municipality of Pilar- Hon. Restituto B. Auxtero, Mayor, Municipality of Talibon- Hon. Marcos Q. Aurestila, Vice-Mayor, Municipality of Talibon- Hon. William R. Jao, Mayor, Municipality of Tubigon- Hon. Virgilio C. Fortich, Vice-Mayor, Municipality of Tubigon
Printed byBarba Press
Layout byTine Kromer, tinekromer.com
DReAMS
ecoBUDGET

7
TABLE Of CONTENTS
1 What is this publication about? 8
2 Introduction 12
2.1 Understanding urban poverty 12
2.2 The Millennium Development Goals and environmental sustainability 16
3 Towards an integration of poverty and environment 18
3.1 Finding synergies 18
3.2 The need for North-South and South-South cooperation 21
4 Delivering environmental management and poverty alleviation at the local level: synergies and instruments 26
4.1 Reducing poverty through data and management tools 26
4.2 Interface between ecoBUDGET and poverty database
monitoring system (PDMS) 32
4.3 Local implementation 35
5 Conclusion and the way forward 66

9
DReAMS project, funded by the EU Directorate–General (DG) Development and Cooperation – EuropeAid, whose aim is to bridge the gap between poverty reduction and environmental protection, both of which have regrettably been considered separately up to now.
We argue that improved management of the local environmental, natural and cultural resources together with improved access to urban services contributes directly to poverty reduction, more sustainable livelihoods and social order. In order to do so, we first explore the links between poverty and environmental resources through the use of a poverty database monitoring system (PDMS) and an environmental management system (ecoBUDGET).
Secondly, we “zoom in” on the situation of Asian governments: Bohol in the Philippines, Guntur in India, Rajshahi in Bangladesh, and Thimphu in Bhutan. We then present ways in which the PDMS supports local governments to identify the poor segment of the population within the city. By doing so, it shows exactly which population or area within the city is a hot spot in need of attention. Once the specific spatial location and the “use” of the environment is identified, ecoBUDGET can support decision-makers to take concrete actions based on local policies, programmes and priorities.
1 WHAT IS THISPUBLICATIONABOUT?
“What is the way forward to eradicate poverty while strengthening the environmental agenda?” This publication tackles a question posed by many heads of State and Government, researchers and citizens. “Poverty”, Indira Gandhi famously announced at the 1972 United Nations Conference on the Human Environment in Stockholm, “is the worst form of pollution”.
Eradicating poverty is indeed the greatest global challenge and an indispensable requirement for sustainable development. But the intrinsic interlinkages with environmental protection are not always recognised, and the two global issues are often treated separately.
However, compared to the Rio Earth Summit in 1992, the current situation allows for a long-term reflection on the role of national and local governments in developing and utilising sustainable development strategies.
The outcome of the Rio+20 Summit recognised that the poor depend directly on ecosystems for their livelihoods, their economic, social and physical well-being, and their cultural heritage.
This is precisely the background of the Realising

11
The use of such instruments for and with key local governments, non state actors and communities is critical to achieving the Millennium Development Goals (MDGs) - particularly 1 Poverty alleviation and 7 Ecological sustainability - and to providing a more solid footing for decision-making at the local level. The shift to poverty alleviation through environmental resource management requires cross-disciplinary innovation and capability of moving at the interface of different disciplines. The social, cultural and environmental transformation envisaged by the project in the implementing local governments must thus be accompanied by a larger set of policies. We address these policy solutions and the need for a set of Sustainable Development Goals (SDGs) in the final section.
Aims of this publication
To provide a source of inspiration for improving urban development by means of considering the links between poverty and environment in local decision-making.
To guide decision-makers and actors to understand the importance of urban governance and to include sustainability management within their policy agenda.
To introduce ecoBUDGET and Poverty Database Monitoring System (PDMS) as an integrated approach to address poverty and environmental degradation in Asian cities.
To provide ideas and good practices examples of integrated action, and policy responses in the partner cities of the Realising DReAMS Project.

13
Eradicating poverty is the greatest global challenge we face, and an indispensable requirement for sustainable development since 1992.
We need to be precise in our use of the term poverty in order to assess the means of its alleviation through integrated management of natural resources. Therefore, a broad definition of poverty must be applied to varying economic conditions of cities (Gordon, 2005).
“Poverty is a denial of choices and opportunities, a violation of human dignity. It means not having enough to feed, a school or clinic to go to, the land to grow one’s food, a job to earn one’s living. It means insecurity, powerlessness, and exclusion of individuals”. By this we mean that poverty can be defined in absolute and relative overall terms (United Nations, 1998 and 1995):
Absolute Poverty refers to the deprivation of minimal income and access to services for basic human needs (food, water, sanitation, health, shelter, education, and information).
Relative-Overall Poverty highlights relative social inequality caused by a lack of participation
2 INTRODUCTION
2.1 Understanding urban poverty
in decision-making and civil society, depicted by mass poverty in developing countries, pockets of poverty and unemployment in developed countries, low-wage workers, and sudden poverty as a result of natural disaster or conflict.
In fact, absolute and relative-overall poverty can be found in both rural and urban settings. Absolute poverty is more typical in the less developed countries of Latin America, Africa, and Asia, while relative-overall poverty is more common in the highly industrialised and developed countries of North America, Europe, or Australia.
Absolute poverty remains a serious issue in developing regions. Approximately 41.6% of the population in India survive on less than $1.25 a day (Parsons, 2008). In addition, we need to consider that over the next 30 years almost 98% of global population growth is projected to take place in developing countries (UNFPA, 1999).
In recent years, the population in the urban areas of South and South East Asia have been steadily increasing, even if the growth rate has shown a marginal decrease. In 2010, about 42.6% of the population in Asia lived in urban areas, with an urban growth rate of 2.3% (Internet World Stats, 2011). The population growth rate varies from country to country in Asia. In 2010, it was recorded as 1.2% for Bangladesh, 1.4% in India and 1.7% in

15
Bhutan and Philippines (World Bank, 2011). However, in the same year, the urban population growth rate was reported as 2.85% in Bangladesh, 2.42% in India, 4.9% in Bhutan, depicting the increased urbanisation in these countries (World Bank Indicators, 2012).
The increase in urbanisation, better livelihood opportunities in the cities, and the hope of better living conditions drives large number of people to move to cities from rural areas. Because of the lack of proper housing facilities at affordable rates in large cities, the migrated population tends to settle down in informal settlements, and ultimately constitute the urban poor in these cities. The percentage of urban poor varies in the different countries in South and South East Asia. In general, urbanisation levels and the extent of urban poverty are high in South Asian countries and moderate in South East Asian countries. In the very large cities of Delhi, Mumbai, Kolkata and Chennai, almost half of the population is said to live below the poverty line.
In spite of the apparent increase in financial status of the migrant population moving from poorer rural areas to the more affluent urban areas, their impoverishment does not diminish to any great extent. This is because living conditions not only depend on the economic conditions of people, but are also affected by other factors such as access to urban services, lack of social security, insecurity of housing tenure, lack of decision making power, and poor urban governance among others (Gunewardena, 1999).
Along with rapid urbanisation, the concept of poverty has evolved radically, from a one-dimensional indicator of income levels to a multi-dimensional notion of relative deprivation and social exclusion associated with a lack of social, economic, and political ties to society and access to decent income, housing, healthcare, education, and social networks (Valdalbero, 2010).
Reduction of poverty is also the foremost concern as expressed in the UN MDGs (Laquian, 2004), discussed in detail in the next section. Poverty reduction can be achieved not only through improvement in the economic conditions of the poor segment of the population, but also through an improvement in their living conditions. A number of schemes have been undertaken by the governments of different countries to improve the living standards of the urban poor. A large part of these government schemes focus on improvement of urban infrastructure, including rehabilitation of slums through the provision of better urban services. However, the infrastructures developed through these schemes are often not maintained properly, since they frequently do not have
operation and maintenance concepts built into the project implementation. Lack of management can cause a reduction in the life of the developed infrastructure, reducing the benefits of such development.
In recent years, several community based developmental programmes have been designed, which focus on building social cohesion while simultaneously empowering communities to take decisions for their own development and encouraging participation in sustainable development processes. More and more local governments are involving local communities in management, operations and even monitoring of developmental programmes. For instance, the Self Help Groups (women groups) in many Indian cities are involved in employment generation activities, which include small-scale enterprises. These groups are also involved in the development, management and monitoring of local developmental plans such as community toilets, community centres, and so on. In Delhi, the Bhagidari initiative was launched to involve local communities in developmental planning including Resident Welfare Associations in rain water harvesting, management of community parks, maintenance of storm water drains in the locality, and so on. In the City of Rajshahi in Bangladesh, Community Development Centres, comprised of members of slum areas, have been created and now take an active part in planning the local development of the slums with support from central and local governments.
The link between development projects and the sustainability agenda is the focus of this publication. As the discussion above has emphasised, the key agency for initiating this link is local government itself.

17
sustainable development into local government policies, halve the proportion of people who lack access to safe drinking water and sanitation, and halve the number of slum dwellers by 2015.
The MDGs challenge the traditional income-based poverty approach that has been used for many years. Poverty is not just the absence of money. Livelihood, health, vulnerability to environmental change and full participation in governance are identified as areas that can improve people’s lives.
This is precisely the basic premise of the Realising DReAMS (Development of Resources and Access to Municipal Services) for South and Southeast Asian Local Authorities project which is funded by the ‘Development and Cooperation – EuropeAid’ DG of the European Commission. It is explicitly addressed at local authorities in Least Developed Countries. It has been implemented in two target local governments in two different Asian Least Developed Countries (Thimphu in Bhutan and Rajshahi in Bangladesh), supported by two additional Asian local governments (Bohol in the Philippines, also coordinator of the project, and Guntur in India) and by two European cities (Växjö in Sweden and Bologna in Italy). This is intended to create a reinforced system based both on South-South and North-South cooperation through sharing experiences and cross-cultural learning.
It is clear that the level of urban poverty in developing countries is alarmingly high. It demonstrates the urgent need for appropriate policy measures and global action to combat poverty. Appropriate policy measures need a reliable database and targets. How can absolute poverty be measured and tackled by technical approaches? One systematic approach has been developed by the UN in line with the MDGs. It reflects economic, social, and basic human needs to be met in a region suffering from absolute poverty (Schwartzman, 1998).
The question of bringing commitments down to the local level is here particularly interesting, as the local level concerns implementation, which has so far not been sufficiently developed.
During the Millennium Summit in September 2000, 189 nations signed the UN Millennium Declaration, which emphasised the observance of the treaties on sustainable development and international humanitarian law under the Principles of the UN charter. By signing the Declaration, world leaders publicly committed themselves to free people from extreme poverty and fundamental deprivations by 2015 (UNDP, 2011).
The Declaration presents over 48 indicators that can be used by a country to monitor its progress towards achieving the eight MDGs: eradicating hunger, achieving universal primary education, promoting gender equality, reducing child mortality, improving maternal health, combating HIV and Malaria, ensuring environmental sustainability, and promoting global partnership for development. At the heart of MDGs lies sustainable human development - only through combining inclusive economic growth and environmental sustainability can the needs of the poor be met and extreme poverty alleviated (UN, 2008).
However, the scope of this publication is not to analyse how to achieve the eight MDGs in their entirety. Our task is more specific. We wish to look more closely at Goal 1 (Eradication of Poverty) and Goal 7 (Environmental Sustainability), and describe the interaction between the two. Goal 1 is to eradicate extreme poverty and hunger by halving the number of people whose income is less than $1/day (absolute poverty line) and those who suffer from hunger. Goal 7 is to ensure environmental sustainability, which means to integrate the principles of
2.2 The Millennium Development Goals and environmental sustainability
Fig 1 The Millennium Development Goals (MDGs) Source: United Nations, 2008

19
is often used as a fertiliser for this kind of agriculture. Apart from the provisioning services, the natural systems also help in regulating the microclimate, including air, water and soil quality. Natural systems provide a habitat for urban biodiversity and provide cultural and aesthetic benefits to the citizens. Any impact on resources, especially one which affects their municipal or provisioning services, have an inordinately strong impact on the life and livelihood of the urban poor. Just as a degraded environment impacts negatively on health, safety and livelihood, at the same time, the poor depend on environmental resources and so bear their damage more heavily. Poor people lack the financial capital to invest and often use the available natural capital to survive. For a population who depend on natural resources, this process of consuming them often results in increasing poverty (European Commission, 2007).
Because of the close interlinkage between natural and environmental resources with the lives of people in cities, it is necessary to use these resources in a planned and sustainable manner. The degradation of natural resources such as land or water will certainly
3 TOWARDS ANINTEGRATION OfPOVERTY ANDENVIRONMENT
3.1 finding synergies
Human well-being and most economic activity depends on a healthy environment. A focus on nature’s benefits – ecosystem services – allows us to see both the direct and indirect ways in which we depend on the natural environment (TEEB, 2010). Basic urban services are closely related to natural or environmental resources in the city, directly or indirectly. Municipal functions like water supply, waste water management, solid waste disposal, etc. are interlinked to the environmental resources of land, water, biodiversity and so on. The natural resources of a city are especially important to the urban poor, who are often directly dependent on them for the provision of food, energy, water and livelihood opportunities. People living in slums often practise animal husbandry to supplement their income, depending on the urban biodiversity for fodder. Urban and peri-urban agriculture, another means of livelihood for the urban poor, are also dependent on nearby rivers for water and riverbeds for fertile lands. Treated and untreated wastewater

21
affect land use patterns, water supply systems, urban biodiversity, waste disposal, treatment systems and so on. Invariably, the urban poor, who lack the financial resources to counter these impacts, are most severely affected because of their low resilience capacity.
In many cities in the global North, it is now recognised that natural systems, such as green spaces, watersheds or wetlands around it, provide free services to the citizens, including both tangible benefits such as maintaining good air quality or treating sewage water before it is released into a river, and intangible benefits such as enhancing health and quality of life. Cities like New York are paying to conserve watersheds to keep their water supply secure. The economic value of the Credit River Watershed in Ontario has been estimated at 371 million USD per year when considering the benefits of wetland services, riparian forests, urban forests, etc. (TEEB case, 2010). Even in developing countries, the importance of conservation of natural systems is being recognised. After a series of floods in Mumbai in India, the city managers are now regulating and managing drainage by maintaining natural streams and nallahs (water channels). A private water bottling company in the Philippines is supporting farmers in Mt. Kala-on Natural Park to practise sustainable agroforestry to conserve spring water, which is used by the plant for bottling.
In the global South, as explained above, a large population of urban poor depend on natural resources like urban forests and lakes or rivers as a basis of livelihood through urban agriculture, fishery or animal husbandry. Apart from this direct economic benefit, natural resources are the support systems for basic urban services, and are vital for a functional urban system.
A large number of the environmental problems that are being faced by developing countries due to urbanisation and unsustainable economic development have already been faced earlier in developed countries. Local governments in developed countries are actively taking steps to mitigate the impacts of unplanned developmental practices by turning towards sustainable practices (O’Neill K., Rudden J.P., 2011). For instance, the City of Barcelona is restoring medieval canals and protecting urban green spaces by modifying their housing development, creating eco-districts in the City. The City of Bologna in Italy contributes to the reduction of greenhouse gas emissions at the local level through the creation of a partnership between the Municipality and companies to plant trees and improve biological diversity in the municipal area. To reduce their susceptibility to urban flooding and increase groundwater recharge,
cities such as Tokyo and Seoul have already implemented large-scale rainwater harvesting measures including public reservoirs and high technology (Monta V., Price H., 2012). These and other initiatives can serve as good practices, which can be emulated by cities in the South, with suitable modifications to make them locally relevant and applicable.
3.2 The need for North-South and South-South Cooperation
One of the most significant means of supporting poverty reduction and management of natural resources locally is North-South and South-South cooperation.
It has been the policy of the European Commission to assign high priority to projects oriented towards strengthening capacity development in developing countries, and to support projects in local governments in such countries willing to advance local sustainability, particularly projects serving as the basis for them to gain experience in their own context.
The programmes have the aim not to establish a rigid pattern for the implementation of cooperation programmes, but rather to design the approach of each programme to best suit the local problems and priorities of the countries and cities concerned. Considering the terms North-South and South-South cooperation, “North” generally refers to developed countries or members of OECD. “South” generally refers to developing countries, even if they are located north of the equator (Rogers, P., Jalal, K., Boyd, J., 2008). North and South need to be considered as a whole and cooperation is not only aid, but also reciprocity, association and co-responsibility.
Urban environmental management often requires North-South cooperation to address multi-sectoral challenges, make the best use of synergies and increase efficiency and effectiveness in the use of cities’ resources. However, some problems are local in character (e.g. desertification) and therefore require cooperation among the affected cities in the South. Developing countries can promote and implement South-South cooperation, not as a substitute, but rather as a complement to North-South cooperation, allowing cities to work more closely together and provide joint services for the benefit of their communities.

23
According to the partners of the DReAMS project, the biggest challenge concerning the two-way transfer of knowledge between European and Asian partners is how to make this transfer. There are common concerns for all, including overcoming cultural and language barriers, identifying those elements of the European experience that are relevant to the Asian partners, presenting them in an efficient way, critically examining and evaluating how the work is undertaken (from both sides) and why it is undertaken in such a way. Some partners emphasised that they gained knowledge in environmental solutions and sometimes very different basic ideas of what constitutes quality of life, perhaps influenced by the very different local contexts. This process often shines a light on weak areas within an organisation, and allows staff members to observe internal structures and procedures from another perspective.
South-South cooperation includes the promotion of technical assistance from an expert city of the South to other Southern cities in the development of social/environmental policies and programmes. It is well recognised that the knowledge, skills and technical expertise that can be exchanged through South-South cooperation are in many cases those that are particularly suitable for meeting similar development challenges faced by other countries of the South.The DReAMS project calls for both North-South and South-South cooperation through the involvement of European (Bologna and Växjö) and Asian cities (Bohol and Guntur).
Long-term cooperation between these cities promoted a better understanding of cultural differences, as well as an enhanced acknowledgement of those differences. It also promoted awareness of diverse dimensions and drivers, and supported the creation of joint responsibility for a balanced development within local contexts.
History of the co-operationBoth Bologna and Växjö were initially involved as partners in the European ecoBUDGET project (2001-2003), supported by the EU LIFE programme, in which the environmental budgeting process was for the first time introduced and tested. In 2004 the two cities initiated the ecoBUDGET-Asia project, under the Asia-Urbs Programme of the EU, led by Bologna. The scope of the project was to export the ecoBUDGET model from European to Asian local governments (Guntur Municipal Corporation in India and the Province of Bohol in the Philippines), through a series of field visits and training activities, under the guidance of ICLEI. In 2009, the Realising DReAMS project was submitted by the Province of Bohol to the EU and then selected for funding within the Non-State Actors and Local Authorities for Development Programme, with the aim of further introducing and testing the environmental budget in other Asian countries: Bangladesh (Rajshahi) and Bhutan (Thimphu).
The European Commission’s Directorate-General for Development and Cooperation – EuropeAid, established in 2011, plays a crucial role in designing state-of-the-art development policy for all developing countries, enhancing policy coherence for development while further improving implementation and delivery mechanisms; defining future development policy both within the EU as well as contributing to the setting of standards internationally; contributing to global challenges ahead. The overall aim is to reduce poverty in the world; ensure sustainable development and promote democracy, peace and security.

25
What did you learn?
“One delegation posed a relevant but unpredictable question during the kick-off meeting: Why do you have targets to increase cycling, can you decide whether people shall go by bike or car? Questions like that make our brain think differently, which is good”.
Asked to give a view on their experience in the technical cooperation and knowledge exchange, the European partners expressed their concerns on whether the environmental work conducted in their cities could be adapted to the Asian context.
They highlighted that they could act as a role model in terms of methodology, organisation, and project management, but mostly on a theoretical and inspirational level. As mentioned before, many problems and challenges are local in character and countries in the global south may have shared experiences and development processes. This is where the South-South cooperation is needed to complement the Northern input. It is clear that through cooperation initiatives, a wealth of innovative, successful local development solutions are made available. Through the cooperation framework, cities’ expertise and experience should increase, as well as the capacity to articulate their own needs.
?

27
4 DELIVERING ENVIRONMENTAL MANAGEMENT AND POVERTY ALLEVIATION AT THE LOCAL LEVEL: SYNERGIES AND INSTRUMENTS
Timely and accurate data are indispensable to informed policy and decision making (Zukang, 2011). In 1992, at the Earth Summit in Rio, UN member states and stakeholders highlighted the critical role of data and information. Chapter 40 of Agenda 21 is aimed at bridging the data gap and improving information availability to ensure that decisions are based increasingly on sound information. 20 years on, the outcome document of the Rio+20 Summit refers to
4.1 Reducing poverty through data and management tools
strengthening institutional capacities, including planning, management and conducting own monitoring and assessments. The DReAMS project meets this need by introducing a poverty database monitoring system (PDMS) for providing data and input, and an environmental management system (ecoBUDGET) to manage and steer the nexus of poverty and environment. The instruments assist local decision-makers to manage the environment, achieve the MDGs and strengthen the mainstreaming of poverty -environment into developmental projects and local planning and programmes.
ecoBUDGET is an environmental management system developed by ICLEI to help local governments plan, monitor and report the consumption of natural resources within their municipal territory. The aim

29
of ecoBUDGET is to promote a sustainable use of natural resources as well as environmental quality by setting locally defined key targets. In practice, ecoBUDGET, in conformity with community (financial) budgeting, seeks to help the community to sustainably account and manage natural resources such as air quality, climate stability, soil, biodiversity and general human well-being.
The PDMS (see Figure 3) is database software, which has been developed by the Provincial Planning and Development Office (PPDO) of Bohol along with the Bohol Local Development Foundation (BLDF). It consists of 18 indicators, which record and rank the levels of deprivation in municipalities and neighbourhoods, including literacy, electricity, garbage disposal, sanitation, unemployment, water and wastewater disposal among others. It assists governance by acting as a tool to identify and rank the levels of deprivation at the municipal, locality and household level and to identify areas requiring poverty reduction support. It also tracks the impact of specific interventions including their correlation over time and provides data on which policy decisions can be made. It is a vital tool to bring convergence of efforts of all development partners in addressing basic social, economic and environmental problems of communities.
Figure 2: The triangle shows the cycle of ecoBUDGET Source: ICLEI, 2007
The town or district council determines a periodic environmental budget, which sets budgetary limits and environmental quality goals for the use and consumption of natural resources (budgets can be adjusted from one period to another). Through the use of indicators, ecoBUDGET regularly informs elected officials, staff and the general public how their decisions impact the natural resources capital available to the community.
Figure 3: The PDMS homepage Source: Copyright © 2012 Bohol Local Development Foundation

31
Livelihood Dimensions
Health
Education
Living standard and
environment
Economic status
MDG
MDG 4: Reduce child
mortality
MDG 5: Improve maternal
health
MDG 2: Ensure universal
education
MDG 3: Eliminate gender
disparity
MDG 6: Combat HIV/AIDS
MDG 7: Ensure environmental
sustainability
MDG 1: Eradicate extreme
poverty and hunger
PDMS Indicators
Child malnutrition
Child mortality
Maternal mortality
School dropout rate
Literacy
Non-potable water
Distance to drinking water
Sanitation
Housing
Cooking fuel
Electricity
Solid waste/water waste
disposal
Calamities/disasters
Trees planted
Income threshold
Unemployment
Food threshold Tenure status
The table below shows the linkages between PDMS indicators, livelihood dimensions, and MDGs.
Table 1: Linkages between PDMS indicators, livelihood dimensions, and MDGs Own source (adapted from TEEB, 2010)
Although there is wide recognition across political, technical and academic spectra that conservation of natural resources is critical to realising economic development and poverty reduction, it is noted that managing the environment is a complex process requiring a whole range of supportive policy and programming frameworks (indicators, strategies and guidelines, data or mechanisms to collect it), commitment from policy makers, and competent technical professionals.
The environmental, social and economic pillars can be integrated into local management and local governments’ decisions through cyclic and integrated management processes. An integrated management system consists of five major steps that are repeated in regular cycles according to the specific circumstances. A baseline review documenting the current environmental and poverty situation, legal requirements and political priorities prepares the ground. On this basis, objectives and targets are discussed, agreed, set and approved, and actions and initiatives are identified (Master Budget). The timeframes related to these targets provide for future monitoring, review and evaluation of the process (Budget Balance). New information permits the validation of established policies, and if necessary new decisions are taken, and the cycle recommences. The cyclical methodology is the decisive characteristic of all management instruments and is of course an idealised representation, as the different steps flow into each other or in some cases spread out over the entire cycle. A pre-requisite for successful cyclic and integrated management processes is a deep understanding of the mutual dependencies that exist between the five steps.

33
4.2 Interface between ecoBUDGET and PDMS
The Realising DReAMS project provides a simple methodology, integrating the two tested instruments described above to monitor the improvement in poverty levels brought about by better municipal services as a result of management of environmental and natural resources. It also analyses how the living conditions and economic situation of communities and individuals interact with environmental resources and quality.
ecoBUDGET is a political management system and supports management decision making, whereas the PDMS is the software that supports the system. The PDMS will give contributions primarily in the following stages of the ecoBUDGET implementation (see figure 4):
baseline review or preparation – in which it will generate exact data through a household level survey.
monitoring and evaluation – in which it will generate data to assess whether poverty alleviation has actually occurred due to improvement of municipal services through environmental and natural resource management.
It will thus allow the management system of ecoBUDGET to proceed from a city level management system to a household level management system.
Figure 4: PDMS in the ecoBUDGET cycle Own source
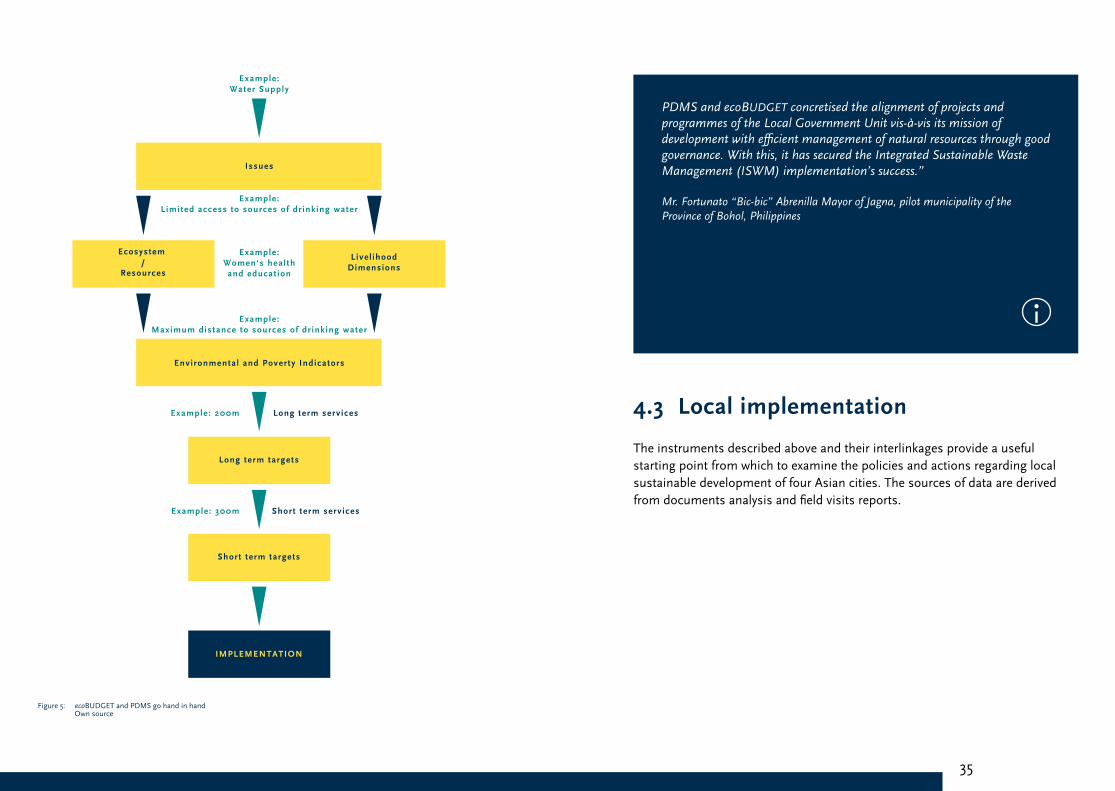
The PDMS software helps local governments identify the poor segment of their population within the city, and identify exactly which area within the city is a “hot spot” in need of attention with reference to a specific indicator. Once that is identified, ecoBUDGET is used to take specific actions to improve the indicators, through active interventions based on local policies, programmes and priorities. ecoBUDGET will manage the environmental resources in a planned, time bound and target oriented manner so as to benefit the urban poor (see Figure 5). The improvement of the environmental and social indicators chosen is monitored and recorded. The process encourages political and social buy-in through active involvement of the local administrative and political authorities as well as the public in general. At the end of the year, the budget balance shows the actual changes in the selected indicators. The PDMS software is used to assess the poverty status through regular surveys at the household level. A comparison of the different statuses gives an idea of the alleviation of poverty brought about by the improvement of basic municipal services through environmental and natural resource management, as described in the cases on the next pages.
35
Figure 5: ecoBUDGET and PDMS go hand in hand Own source
PDMS and ecoBUDGET concretised the alignment of projects and programmes of the Local Government Unit vis-à-vis its mission of development with efficient management of natural resources through good governance. With this, it has secured the Integrated Sustainable Waste Management (ISWM) implementation’s success.”
Mr. Fortunato “Bic-bic” Abrenilla Mayor of Jagna, pilot municipality of the Province of Bohol, Philippines
The instruments described above and their interlinkages provide a useful starting point from which to examine the policies and actions regarding local sustainable development of four Asian cities. The sources of data are derived from documents analysis and field visits reports.
4.3 Local implementation

37
CASE 1 –
GUNTUR(INDIA)
Background Information on Guntur
Guntur is the fourth largest city in the southern state of Andhra Pradesh in India and serves as the district headquarters. It has an area of 168.41 km2, which is divided into 52 wards. It has a population of above 600,000. It is an important educational, political as well as commercial centre in the district. Agricultural trade in chillies, cotton and tobacco form a significant portion of the urban economy.
The Guntur Municipal Council, constituted in 1887, was upgraded to a Municipal Corporation in 1994. During 2012 Guntur Municipal Corporation limits have been expanded by merging 10 surrounding villages into the corporation.
ecoBUDGET Master Budget
Guntur Municipal Corporation (GMC) has been using ecoBUDGET since 2006, when the first Master Budget was formulated with indicators and targets set for five major environmental issues: water quality, water quantity, green city, waste management and air quality.
Under the Realising DReAMS project, GMC acted
Guntur
Guntur Municipal Profile
Population: 651,382 (as per 2011 census)Electoral Wards: 52Households Size: 131,075 (before merging)Slum Population: 197,920 (before merging)Average household size: 4.7 persons

39
as a regional lighthouse city to support the newer pilot cities of Rajshahi (Bangladesh) and Thimphu (Bhutan) in using ecoBUDGET. In the project, the GMC reviewed and revised the Master Budget, modifying old targets and adding new ones. The project also introduced GMC to the PDMS software, which will be used along with ecoBUDGET to plan poverty reduction schemes to help the urban poor in the city. Representatives of GMC visited the pilot cities to share their experiences in using ecoBUDGET and promote peer to peer knowledge sharing.
GMC ratified the ecoBUDGET Master Budget in August 2010. Six environmentalissues were selected, and indicators were identified as in the table below:
1. Water Quality/Quantity Increase in the number of parameters monitored and the /frequency of monitoring Increased supply of drinking water per capita Increased number of households using rain water harvesting system
2. Waste Management Increased percentage of waste collection and waste segregation in the city
3. Environment/ Green area cover Increase in total surface coverage of green areas Plantation with good survival rates of plants Increase in number of ponds and parks in the city Development of a biodiversity inventory in the city
4. Health (Slum development) Increase in the number of slums developed (in terms of physical / environmental and social elements)
5. Energy Energy conservation through solar lighting in parks and LED lights along streets
6. Education Percentage increase in annual indicators related to government schools, at both primary and senior levels
The GMC set short-term and long-term targets for these indicators, on the basis of available baseline values. Actions were identified in the City Corporation andundertaken to achieve the set targets for a period of two years, and the indicators were closely monitored. This was reported under the project in the budget balance, outlining targets achieved within the indicators.
PDMS
The PDMS software was introduced in the last phase of the project in the City ofGuntur. The GMC used already existing household-level surveys conducted under the Government of Andhra Pradesh scheme “Mission for Elimination of Poverty in Municipal Areas”. Data included information at the household level regarding socioeconomic status, access to education, drinking water supply, sanitation services, and health services.
In Guntur there are 187 slums, including both notified and non-notified. This data has covered all slum households in Guntur and assesses the socio-economic status of all the urban poor. It is envisaged that the PDMS software would help to monitor the improvement in the living standards in these areas by regular survey update.
Common issues in ecoBUDGET and PDMS
Water Resource: Availability of drinking water in the slum households has been surveyed under the PDMS. The quality and quantity of water supplied is also being monitored through ecoBUDGET.
Slum Development: The household level survey assesses the socio-economic status of the slum population. ecoBUDGET monitors the number of slums with better infrastructure for sanitation, roads, schools etc., thereby indicating the overall improvement in well being of the population brought about through improved urban services.
Education: The survey under PDMS focused on the education level - literacy and school dropouts - in the slums. In order to improve the education level in municipal schools, ecoBUDGET is monitoring theannual pass percentages in the schools.

41
Results
Water Resource (Water Quality/Quantity/Rain Water Harvesting)
Water quality and quantity were among the priority issues for GMC. Water supply is indeed the first basic urban service under the responsibility of the GMC. Before implementation of the Master Budget, GMC was monitoring two parameters, namely residual chlorine and temperature in drinking water supplied to households. GMC has tried to increase the number of monitored parameters to 14, as well as the frequency of analysis to two samples per day at each reservoir (GMC has 20 reservoirs i.e. 40 samples per day).
In order to achieve this goal, GMC has installed the Supervisory Control and Data Acquisition (SCADA) system to view the status of the water system and assess the leakage and loss of water from each reservoir. The system can monitor flow and water pressure from the water source and the amount of residual chlorine in the water. Guntur city is already using mobile water testing Jaltara kits (approved by UNICEF) and has a water quality testing laboratory. GMC is currently working on one set of a more fully fledged water testing laboratory. The GMC is now able to conduct two analyses of 40 samples per day for four parameters including Chlorine, Temperature, Hardness and pH.
The World Bank has given aid of 4.6 million Rupees under its water supply scheme, which GMC has used for automation of chlorine control through SCADA. In order to increase the supply of potable water in the city, GMC had granted 83,000 Rupees for extending pipelines to uncovered areas. Before the implementation of the Master Budget, only 70 million litres per day (MLD) of water were supplied to households by the GMC. At the end of 2012, GMC achieved a marked improvement on water supply with 97 MLD per capita of potable water available.
Rapid urbanisation and an increase in population have intensified pressure on water resources of the city, leading to the extraction of ground water and subsequent depletion of the water table. In order to tackle the problem, GMC announced that they would increase percentage cover of households using the Rain Water Harvesting (RWH) system from 1% to 5% by the end of the Master Budget. In addition, the Corporation has started awareness programmes on rain water harvesting in the city and made it mandatory for any new construction, such as multi-storey buildings, hospitals, commercial malls, etc. As a result of this, currently the city has 400 percolation pits and 28 storm water pits.
Health (Slum Development)
Guntur is a rapidly developing city with a population of 651,382 persons (as per the 2011 census) and includes a significant population of slum dwellers. Recent estimates put the population living in slums at 197,920. As part of the project committed to poverty alleviation through better resource management, GMC has adopted the Central Government scheme “Integrated Housing and Slum Development Programme” (IHSDP). The objective of this scheme is holistic slum development, creating a healthy and enabling urban environment by providing adequate shelter and basic infrastructure facilities (new houses for the poor, sanitation, water supply, roads, drainage, street lighting, sewerage etc). There are approximately 187 slum (133 notified and 54 non-notified) in Guntur Municipal Corporation. Currently, 48 slums have been developed under the IHSDP scheme. GMC is planning to develop the remaining slums under the “Rajiv Awas Yojana” (RAY) project.
Figure 6: Supervisory Control and Data Acquisition

43
Education (Municipal Schools)
The poorer families in Guntur cannot afford to pay private school fees for their children’s education. These people generally send their children to a municipal school, which educates the most marginalised children. As such, the GMC has taken special steps to improve and strengthen the education system in municipal schools, to guarantee this fundamental human right. In order to provide quality education through strengthening the municipal schools system, GMC has undertaken the following activities:
A special classes scheme for all high school children
Distribution of study and basic learning material (for slow learners) free of cost
Encouragement to schools to participate in science fairs organised by GMC
Appointment of special officers to review schools’ education facilities
Educational excursions for students on municipal grants
Printed assignments for evaluating and monitoring students
As a result, the performances of the municipal schools (both high and primary schools) showed an improvement. The percentage of students passing the high school exams increased from 78% (2010-11 value) to 85% (2011-12 sessions). Primary schools also marked good results (98% of students passed exams in 2011-12).
Asset-Based Community Development (Abcd) Projects
The municipal government wants to position Guntur as an environment-friendly city, and this cannot be achieved without the participation of local communities and relevant NGOs.
The Guntur Municipal Cooperation identified local assets which can be transformed into projects for both poverty reduction and environmental protection. In particular, the Nolanda Nagar Park is being developed from previously idle land owned by the municipal government. In addition, another green project is to transform idle land owned by the Municipal Government into mini parks for relaxing or sport activities. Such parks provide employment to those involved in their development and maintenance.
Figure 8: Waste water treatment plant
Figure 7: Transformed parks in Guntur

45
CASE 2 –
RAjSHAHI(BANGLADESH)
Background Information on Rajshahi
Rajshahi city is situated on the north bank of river Padma and is the headquarters of the Rajshahi Administrative Division of Bangladesh. The city is a centre of excellence for education with a large number of institutions and is often called the Education City of Bangladesh. A variety of religions such as Islam, Hinduism and Christianity peacefully co-exist in the city. Social and communal harmony among people, friendly politics and economic well being further support a peaceful life in the city. As it is the place where Rajshahi silk originally comes from, the city also has the name “Silk City”, and is well known for its delicious mango and litchi.
Rajshahi Municipality is one of the first municipalities in Bangladesh and was established in 1876. It was renamed as Rajshahi Pourashabha or Municipal Corporation in 1987, and was finally named Rajshahi City Corporation (RCC) in 1992. The city is spread over an area of 93.60 km2, with a population of about 750,000. Almost 20% of the population reside in slums. Besides the City Corporation, the Rajshahi Unnayan Kortripokhkho (Rajshahi Development Authority or RDA) is responsible for planning the development of the city and coordinating development related work.
Rajshahi
Rajshahi Municipal Profile
Population: 763,952 (2011 Census)Slum Population: 156,793Slum Households: 27,665Households’ size: 5.1 personsElectoral Ward: 30

47
ecoBUDGET Master Budget
RCC adopted its first ecoBUDGET Master Budget in the year 2010 under the Realising DReAMS project. The Master Budget indicators and targets were largely based on the “Mayor’s City Vision 2018”. The Master Budget selected seven environmental issues and identified measurable indicators, as shown in the table below:
1. Water Resource Increased water supply for households Reduction in non revenue water Focus on rain water harvesting
2. Sanitation Decrease in the number of septic tank outlets in drains Increased community based collection of waste Better coverage of toilets, with 100% coverage planned for 2015
3. Green growth Increase the green cover of the city
4. Health Decreased percentage of water borne disease patients Increased immunisation rates of children and pregnant women
5. Solid waste Solid waste collection at night Focus on segregation and processing of solid waste Awareness programmes in schools and markets
6. Energy conservation Use of energy saving devices in houses, offices and streets
7. Transportation Sustainable transportation system for the city
The Corporation has set short and long term targets for the above indicators on the basis of current baseline value and the long term vision for the city. Currently, the targets and actions are being implemented and monitored.
PDMS
RCC conducted the PDMS survey with the help of a questionnaire in 11 communities. The original PDMS questionnaire was adapted to suit local conditions and preferences. The Community Development Centres (CDCs) – local community groups – conducted the survey and entered the data. In August 2012, RCC organised a meeting with different community leaders seeking their help with data collection for PDMS and with the implementation of ecoBUDGET. This survey was conducted in association with an existing initiative of the RCC, the Urban Partnership for Poverty Reduction, also working towards poverty alleviation in the City of Rajshahi.
CDC Name
Shahazi Para
Zianagar
Chamar Para
Koyerdara Kirstanpara
Boro Banagram Raipara
Choto Banagram (North)
Jamalpur
Ramchandrapur Baze
Kalza (East)
Char Satbaria (East)
Dharmpur Baze Kalza
Mohon Pur
TOTAL
Total
Households
464
600
272
142
530
601
448
567
415
531
476
5046
Cluster Name
Lalgolap
Krishnochura
Shapla
Shimul
Padma
Mollika
Alor shandhane
Chandramollika
Nill Nad
Bonolota
Asra Alo
S.N.
1
2
3
4
5
6
7
8
9
10
11
Total
Population
2018
2175
1413
618
2386
1731
1949
2858
1805
2310
1309
20572

49
The RCC also received training from the Province of Bohol under the Realising DReAMS project. Specifically, the officials were trained on how to encode the data collected through the survey into the PDMS software installed in the Corporation. This data will be used for developmental planning in order to achieve the targets set in the ecoBUDGET Master Budget.
Common issues in ecoBUDGET and PDMS
Water Resource: The PDMS questionnaire gathers information regarding the availability of potable water to households in the slums. The Master Budget also gives importance to this issue by monitoring the amount of water supplied to households and reducing non-revenue water.
Sanitation: The PDMS questionnaire gathers information on the access to sanitary facilities for slum dwellers. The ecoBUDGET Master Budget also monitors solid waste management and access to toilets. It also tries to monitor the reduction of water pollution by preventing the connection of septic tanks to open drains.
Health: The PDMS questionnaire surveys the access to health services for the population in the slums. The ecoBUDGET Master Budget monitors the level of immunisation of children and pregnant women, again establishing a link to access to health services.
Thus, both tools can be used in tandem to assess the socio-economic status of the slums and to promote focused development activities in these areas.
ResultsWater Resource
Before the implementation of ecoBUDGET, 54% of households were estimated to receive their drinking water supply from the corporation. To improve this reality, RCC has set a short-term target to increase supply of safe and potable water to households to 65% by 2012 and to deliver 100% water supply coverage by 2018. The corporation has also undertaken some structural improvements to achieve the planned targets, such as installation of reservoirs and extension of the pipelines. Currently 72% of households have access to potable water in the city.
In its first ecoBUDGET cycle, RCC announced it will reduce its non-revenue water rate to 30%. Since major losses of water have occurred through the water hydrants, the corporation has decided to close down 100 hydrants. The corporation repaired its leaking pipelines and took action against any illegal water connections. Unfortunately RCC was only able to reduce Non Revenue Water by 2%.
Since ground water is an important source of water for both domestic and irrigation purposes in Rajshahi, increased demand for ground water in agriculture and other sectors is affecting the availability of drinking water. For this reason, the RCC has shown interest in improving water harvesting facilities and installed five rain water tanks in the city.
Sanitation
Rajshahi city is dependent on its water bodies for various purposes including disposal of waste water and irrigation for agriculture. Rajshahi District is surrounded by many rivers such as the Padma, Jamuna and Bar0nai, which flow Southern, Eastern and Northern side of Rajshahi respectively. Rajshahi has a network of drains to collect surface run-off from the city, running from the Padma in the south, through the city and out towards River Baraonai. These drains release sewage and industrial waste into the river that causes water pollution and is a serious health concern. RCC has decided to decrease the number of outlets of septic tanks in open drains (50 were closed down) and started a campaign to spread awareness among the people. The corporation has also

51
engaged people in waste collection under the umbrella of a community based collection programme.
The sanitation problem is most evident among the urban poor (especially for women). Bangladesh has been putting much effort in achieving 100% access to toilets in both rural and urban areas. Almost 10% of households in Rajshahi city did not have access to toilets before the ecoBUDGET implementation. Under the Mayor’s Vision 2018 scheme, 350 toilets have been constructed by the RCC, causing a marginal increase in access.
HealthAccording to the Master Budget, the immunisation of both pregnant mothers and their children was to be increased to 100% from existing rates of 34% and 95% respectively. In order to achieve the goal, RCC initiated a vaccination programme for mother and child. RCC has immunised more than 7,000 children and 17,000 pregnant women.
Figure 9: A poor community targeted by PDMS

53
CASE 3 –
THIMPHU(BHUTAN)
Background Information on Thimphu
Thimphu is the capital city of Bhutan, with an area of 26 km2. It is 15 km long and 3 km wide. It is situated along the Wangchu river with a total population of 79,185 (PHCB 2006), which is more than 40% of the entire urban population of Bhutan, with a population density of about 3,030 per km2. Thimphu is the political and economic centre of Bhutan and its economy is heavily dominated by agriculture and livestock. Tourism is a major contributor to the local economy but is strictly regulated to maintain a balance between traditional and modern lifestyles.
Thimphu Municipal Corporation (TMC) was establishedin 1995 through a royal decree. It became an autonomous corporation in 1999, following the enactment of the Municipal Act of 1999. With the democratic process introduced in the country, Thimphu Thromde is now managed and guided by the City Council with an elected Mayor (Thrompon) and seven Councillors (Thumis). The Mayor acts as the Chairman of the Council and the Executive Secretary acts as the Member Secretary. The mandate of Thimphu Thromde is to provide efficient and effective services to the residents, commensurate with the growth of the city, and to ensure that development occurs in a planned and harmonious manner.
Thimphu
Profile of Thimphu Thromde
Area: 26.13 Km2
Population: 104,214Household: 20,000 approx. Zone: 6 (zones)

55
ecoBUDGET Master Budget
Thimphu initiated its first ecoBUDGET cycle under the Realising DReAMS project in 2010, when the Local Implementation Team presented the project and the draft Master Budget to the 92nd City Committee Meeting for ratification. The Local Implementation Team is composed of members from the six divisions of Thimphu Thromde: Urban Planning, Engineering, Development Control, Administration, Environment, and Education. Five environmental issues were chosen, and indicators were selected for each of these issues as highlighted in the table below:
1. Solid waste Reduction in the amount of waste received at landfill site Segregation of waste at source Increase the amount of organic waste for compost Reduce the amount of oil waste entering the river from the city
2. Water Resource Increase number of parameters tested for water quality Increase number of households with continuous water supply Monitoring of unaccounted loss of water
3. Health Reduce the number of diseases caused due to unhealthy lifestyle Reduce the number of stray dogs
4. Biodiversity and ecosystem Increase in number of green areas Protection of biodiversity
5. Transportation Increase in number of electric cars in the city
For each of the selected indicators, short-term and long-term targets were set on the basis of the current or baseline value of the indicators. Each activity was reported and monitored throughout the two year period in which the tool was implemented.
PDMS
Thimphu Thromde conducted the PDMS survey in about 6,242 households with the support of a questionnaire developed for the city. This is approximately half of the total number of households. The standard PDMS questionnaire used in the Philippines and in other contexts such as Timor Leste and Solomon Islands, was revised to suit the local conditions.
In order to conduct the PDMS survey in the city, an orientation training workshop was carried out for the enumerators, explaining the benefits of the survey and the questionnaire to be followed. The survey was completed by 29 enumerators between 3rd April and 15th May 2011.
Thimphu Thromde also received training modules from the Province of Bohol on how to encode the data collected into the PDMS software, and on analysis of the data. Therefore, officials can now use the data for developing further policy options and planning.
Common issues in ecoBUDGET and PDMS
Water Resource: The water resources are being monitored through the ecoBUDGET Master Budget in an effort to increase drinking water supply to all households, reducing unaccounted loss of water as well as improving drinking water quality. The drinking water availability is also featured prominently in the PDMS survey, and can be used to effectively plan activities in the ecoBUDGET system.
Health: The ecoBUDGET Master Budget is monitoring health conditions of the city by improving access to green areas. Diseases are also being monitored through the PDMS survey.

57
Figure 10: Ladjophaka, identified through PDMS as the most disadvantaged community in Thimphu
ResultsWater Resource
Before the implementation of ecoBUDGET, Thimphu Thromde was monitoring drinking water quality through eight parameters, including colour, pH, conductivity, temperature, hardness, etc. However, when water quality and quantity became the priority issues in the ecoBUDGET cycle, it was decided to increase the monitored parameters including the Fecal coliform bacteria in water.
Thimphu Thromde also set targets to increase the number of water sources used by the municipality, the number of households receiving continuous water supply, and the monitoring of unaccounted loss of water, in order to improve both water supply and quantity. To achieve this goal, another water treatment plant was planned in addition to the two already existing plants. The city has been maintaining its existing water reservoir and has also constructed a new reservoir. A new water treatment plant and an additional water supply plant with a capacity of 1.7 MLD were constructed in Changzamtog.
The World Bank and the Asian Development Bank signed a Memorandum of Understanding with the Bhutan Government to provide water supplies to southern and northern parts of Thimphu. The Asian Development Bank will cover 79% of the project costs to supply water to the northern part of the city, which includes Changbangdu, Lungtenphu, Semtokha and Babesa. On the other hand, the World Bank will cover Hejo, Jungzhina, Samteling, Pamtsho, Taba, Langjophakha and Dechencholing. The projects will draw water from the Dechephu stream for the northern area, and the Chamgang stream for the southern area. It is expected that construction will be complete by mid 2013.
Thimphu Thromde initiated a plantation programme around the water bodies, so that the impacts of flood and soil erosion can be reduced. Continuous maintenance of water pipelines improved the quantity of water supplied. At present, 65% of the households of Thimphu receive potable water, which was 20% before the implementation of ecoBUDGET.

59
Figure 13: Entrance to the Gross National Happiness Commission office
Health
Many Non Communicable Diseases (NCDs) are often associated with an unhealthy life style and can affect all age groups, especially in low-income countries. To lessen the impact of NCDs, a comprehensive approach is needed. Appropriate physical activities or exercises are one important method of curing such diseases. Therefore, Thimphu Thromde decided to construct the biggest recreational park (named Centenary Park) in Changangkha of Thimphu City. This will help citizens in their daily physical exercise and promote a healthier lifestyle in the city. At the end of December 2012, the outer boundary of the park was constructed. In addition, the existing parks were revamped and installed with new facilities. The Bhutan Trust Foundation provided assistance for construction and maintenance. Furthermore, the Department of Disaster management section, Environment division identified two new areas for the construction of two more recreational parks in city.
Besides providing recreational parks to help citizens achieve a healthier life, Thimphu Thromde is also determined to reduce the number of stray dogs in the city. It was decided to stabilise and document the number of stray dogs by implementing a sterilisation programme under the umbrella of the National Dog Population Management and Rabies Control Project, a joint project of the Royal Government of Bhutan (RGoB) and the Humane Society International (HSI). A trust named Animal Saving Trust has been appointed to take care of stray dogs. As a result of these activities, Thimphu city has able to reduce its stray dog population by 22%. This is a large increase in the target of 10% set out in its ecoBUDGET Master Budget.
Happiness
The Gross National Happiness Commission, established to ensure that the country’s plans and programmes are aligned with the GNH four pillars of development, is particularly interested in the linkage between PDMS and ecoBUDGET, and will further study how the software and survey tool could be used in the current programme to target 116 slum communities.
Figure 11: Compacting of solid waste site
Figure 12: Compost plant

61
CASE 3 –
TUBIGON (PHILIPPINES)
Background Information on Tubigon
Tubigon is a coastal municipality located along the north-eastern coast of the Province of Bohol. It is 54 kilometres from the capital City of Tagbilaran via the Tagbilaran North Road, and 21 nautical miles south of Cebu City. The municipality has a total land area of 8,186.96 hectares divided among its 34 barangays (administrative divisions), six of which are island barangays. Tubigon had a total population of 41,608 in the year 2010, with 8,621 households and an average household size of 4.8 persons.
Tubigon was formally established as a town in 1819 by the authority of Governor Wilkan, the Spanish Governor of Cebu. “El Pueblo de Tubigon” was the official seal inscribed. Since this time, Tubigon has continued to establish development frameworks that ensure municipal improvement and environmental sustainability. Through doing so, the city facilitates orderly business and economic growth that will encourage investment, promote livelihood and bolster employment opportunities. Thus, in July 2008 Tubigon’s income classification was upgraded from a third into a first class municipality by the Department of Finance’s Bureau of Local Government Finance. Tubigon’s major economic activities are agricultural (farming and fishery) and commercial trading.
Tubigon
Tubigon Municipal Profile
Area: 81,8696 Km2
Population: 41,608Household: 8,621Average Household Size: 4.8 persons

63
ecoBUDGET Master Budget
The municipality of Tubigon has been using ecoBUDGET since 2005, when the first environmental Master Budget was formulated. The first instance used 2004 baseline data as the reference year value. Since then, Tubigon has continued to implement and monitor the progress of its environmental Master Budgets, conducting an annual review of its targets. The latest revision of the environmental Master Budget took place in 2010, with the updating of the targets for 2011. A new resource (water for irrigation) was added to the environmental issue on water supply. There are four priority environmental issues contained in the environmental Master Budget of Tubigon:
1. Water Resource Drinking Water: Increase number of parameters tested for water quality Monitoring of unaccounted for loss of water Water for Irrigation: Increase number of impounding/diversion dams Increase number of irrigated farm areas Monitor increase in crop production
2. forest Cover (Upland & Coastal Zones) Increase in number of green areas Improve survival rate of plants within plantations
3. Marine Habitat Increase number and area of established Marine Protected Areas (MPA) Increase coral and sea grass cover
4. Solid waste Reduction in the amount of waste received at controlled dump site Segregation of waste at source Increase in number of households practicing waste segregation
For each of the selected indicators, short-term and long-term targets were set based on the current or baseline value. Each activity was integrated into the departmental work plan of each sector. Targets and accomplishments are reported and monitored annually.
PDMS
In April 2003, the Department of Interior and Local Government (DILG) issued a memorandum circular providing local government units with policy guidelines for the adoption of the 13 Core Local Poverty Indicators1, used for poverty diagnosis and planning. The guideline emphasised the need to diagnose the situation of the community based on 13 core local poverty indicators, looking specifically at factors influencing quality of life. As a result, the Bohol Local Development Foundation, (BLDF) Inc., in partnership with the Provincial Government of Bohol Planning and Development Office, developed the initial version of the LPRAP software.
Adopting all other directives on local poverty diagnosis set by the DILG memorandum circular and modifying the survey tool of the Community-based Monitoring System (CBMS), the LPRAP software was pilot tested by 17 selected municipalities including Tubigon. 13 indicators were reduced to 12 by fusing the 12th and 13th indicators, namely elementary and secondary participation rates, into one – school drop outs. Additional indicators were also added outside of the core indicator to include: Electricity, Food Shortage, Literacy, Disability, Health Insurance, Maternal Mortality, Garbage Disposal and Waste Water Disposal.
Under the Sustainable Economic Growth and Effective Service Delivery (SLG-SEG/ESD) Project, BLDF in partnership with the Holy Name University Center for Local Governance and the Bohol Provincial Planning and Development Office, further developed the LPRAP software into the Poverty Database Monitoring System (PDMS) software. The software makes possible the accurate targeting of households, sub-villages, and villages for projects and other interventions in support of poverty reduction. Later, with the updating of data, it can be a tool for tracking the impact of specific interventions, including their correlation over time.
With the municipality’s adoption of PDMS, Tubigon has been provided a tool to enhance the poverty focus of development plans, projects and programmes. The first household poverty survey was carried out in 2004, and the subsequent surveys in 2007 and 2010. Core poverty Indicators are used as a basis for the survey tool. The software tool is used to process the data that will in turn be used for local poverty-focused planning at various levels.
1 Education core indicators i.e. elementary and secondary participation rates were later classified under “school drop-outs”

65
Common issues in ecoBUDGET and PDMS
Water Resource: The assessment of both the ecoBUDGET and PDMS tools showed that interventions designed to address both poverty and environmental issues and concerns have similar objectives, i.e. interventions to address low income households. The construction of small water-impounding and mini-diversion dams/canals will not only help farmers economically through an increase in crop production, but it is also environmentally helpful. By utilising the water resources from the rivers, it induces the formation of a micro-habitat and naturally replenishes the surface waters and aquifer.
ResultsWater Resource for Irrigation
The selection of the Local Government Unit’s (LGU’s) catalyst project, i.e. Construction and Rehabilitation of Mini-Diversion Dams, was recommended by the Local Implementing Team (LIT) because the intervention could be designed to address issues and concerns for both poverty reduction and environmental sustainability. The project addresses optimum utilisation of a water resource for use in agricultural production and addresses poverty issues with regard to low income households, particularly for farming communities.
With the available data, the municipality included the construction of micro-impounding or diversion dams in its priority development agenda, specially designed for the marginal farmers in the highland barangays who till rice farms dependent on rain.
Figure 14: Mangrove planting
Figure 15: Tree planting excursion
The twin goals of the project are to address both environmental and poverty issues by optimally utilising water resources for agricultural production. The idea is to provide an irrigation facility for marginalised farmers by making use of the municipality’s environmental assets, particularly water from the rivers. The water from rivers is utilised to irrigate farmlands before it gushes forth to the catch basin or to the sea. With sufficient supply of water for irrigation it is expected that agricultural outputs will increase. This will hopefully result in increased income for households.

67
The PDMS household survey was conducted in the Asian local governments at either municipality or neighbourhood level, and the data was encoded, processed and stored within the system. The poorest villages or neighbourhoods and priority problems were defined based on core poverty indicators, and possible interventions were identified in the Master Budget. The mapping features showed the social impact of environmental interventions suggested at household or community levels. This served to illustrate how Master Budget activities and interventions contributed in a given year to decreasing the levels of deprivation defined by core poverty indicators. It is expected that such results will play a key role in influencing the preparation of draft municipal poverty reduction plans and other developmental programmes and their annual reviews.
In addition, it is important to note that cooperation with other local governments can be an extraordinary element to support dedicated actions on environmental management and poverty reduction, the process of which may appear sometimes slow and be characterised by challenges rather than success (Evans et al, 2005). Clearly, important geographical and cultural differences often make it difficult to replicate the lesson learned from one country to another. Working with other local
5 CONCLUSIONSAND THE WAY fORWARD
This publication has so far examined the ways in which Asian local governments tackle the issues of environmental management and poverty reduction in response to the challenges of sustainable development. This section draws together the key themes described earlier and provides conclusions on the nature of such links.To recap, the issues analysed were:
Why, and the ways in which, there needs to be an integrated management approach for ensuring a healthy environment and poverty reduction
How North-South and South-South cooperation can be conditions that permit such links
How local governments are primary “movers” for local-level policies towards the attainment of MDGs 1 and 7
As has been seen, the nexus between environmental resources, livelihood and poverty is very strong, especially in the Asian context. The Realising DReAMS project demonstrated how the PDMS can be used in the planning, implementation and monitoring of municipal environmental plans. In particular, there is a relationship between sectoral plans, the poverty database and the Master Budget indicators.

69
governments requires a readiness for learning, but often results in enhanced and reinvigorated local policies “at home”. The Realising DReAMS project was based on the idea of cities learning from each other, with both South-South cooperation and North-South cooperation. The city corporation officials had the opportunity to travel to other project cities on completely different sides of the world and observe for themselves how other municipalities are working for environmental sustainability. Much of the insights for the identification of key principles came from the lessons learnt, and were translated into action in some cities.
The question of linking together environmental and livelihood commitments is particularly evident in the case of the MDGs. The Realising DReAMS project demonstrated the importance of bringing these issues down to the local level. It also sought to recognise the multi-directional links between gender and environment, such as resource use and poverty and rights, instead of addressing them in silos.
Pushing the MDGs framework forwards, the Asian local governments tried to specifically address climate change, sustainable development and biodiversity, which are essential to the post-2015 development agenda. In fact, the current over-arching development framework of the MDGs expires in 2015. The post-2015 agenda is an urgent priority for the international community and needs to preserve the clear and simple message of the MDGs in order to build political momentum and strengthen measurability for progress. The importance of the universal applicability of the agenda was highlighted by a number of delegations, which noted that the MDGs are “too narrow” and need to be re-examined.
During the Rio+20 preparations there was growing support for the elaboration of a set of Sustainable Development Goals (SDGs), or at least for beginning a process to define such goals. In addition, the outcome document adopted at Rio+20 recognises “the importance and utility of a set of SDGs, which...should address and incorporate in a balanced way all three dimensions of sustainable development and their interlinkages”. Therefore, “the SDGs should be action-oriented, concise and easy to communicate, limited in number, aspirational, global in nature and universally applicable to all countries while taking into account different national realities, capacities and levels of development and respecting national policies and priorities”.Thoughts must be given to the interlinkages between SDGs and MDGs. The Millennium Declaration will still be relevant in the post-2015 development
agenda, and the current principles and priorities of the SDGs discussions and the post-MDGs discussions are very similar, meaning that they could be merged. To develop SDGs and the post-MDGs development framework in isolation could hinder the full and effective linkage between environmental sustainability and poverty eradication.
The SDGs can become the new basis for redefining the MDGs, whilst still reflecting the MDGs intentions. At the same time, sustainable development requires additional efforts in all areas, including those not adequately reflected in the original MDGs, such as tackling climate change, building resilience, managing equitable distribution of natural resources, and achieving economic equity.
Clearly, systems and tools are needed for concrete implementation at the local level. The combined use of ecoBUDGET and PDMS has been proven to more clearly establish the correlation between environmental resources and poverty reduction, thereby adopting a “dual target and impact approach” to its policy for strategic operations (FMDF, 2012). It is therefore an effective potential decision-making system in the post-2015 development agenda.

71
REfERENCES
[1] Gordon, D. (2005), Indicators of Poverty & Hunger, University of Bristol. http://www.un.org/esa/socdev/unyin/documents/ydiDavidGordon_poverty.pdf
[2] UN (1998), UN Commission on Social Development, available at http://www.un.org/esa/socdev/unyin/documents/ydiDavidGordon_poverty.pdf
[3] Parsons, A. (2008), World Bank Poverty Figures: What do they mean?. Share the World’s Resources. http://www.stwr.org/globalization/world-bank-poverty-figures-what-do-they-mean.html
[4] UNFPA (1999), “Demographic Trends by Region”, Population Issues-1999, available at URL: http://www.unfpa.org/6billion/populationissues/demographic.htm.
[5] Internet World Stats (2011), Population of Asia, available at URL: http://en.worldstat.info/Asia
[6] World Bank (2011), World Development Indicators, available at URL: http://www.indexmundi.com/facts/indicators/SP.POP.GROW/compare?country=in#country=bd:bt:in
[7] World Bank Indicators – Bhutan, India and Bangladesh - Density & urbanization (2012), available at URL: http://www.tradingeconomics.com/bhutan/urban-population-growth-annual-percent-wb-data.html; http://www.tradingeconomics.com/india/urban-population-growth-annual-percent-wb-data.html; http://www.tradingeconomics.com/bangladesh/urban-population-growth-annual-percent-wb-data.html
[8] Valdalbero, D. (2010), World and European Sustainable Cities- Insights from EU research. European Commission, Luxemburg.
[9] Gunewardena D. (1999), “Urban Poverty in South Asia? What do we know? What do we need to know?” Poverty Reduction and Social Progress: New Trends and Emerging Lessons, Regional Dialogue and Consultation on WDR2001for South Asia, Rajendrapur, Bangladesh, available at URL: http://www.rrojasdatabank.info/wpover/gunewardena.pdf
[10] Laquian A.A. (2004), “Who are the Poor and how are they being served in Asian Cities?”, Comparative Urban Studies Project, WWICS, and University of British Columbia, Vancouver, B.C., Canada, available at URL: http://www.google.co.in/url?sa=t&rct=j&q=&esrc=s&source=web&cd=10&cad=rja&ved=0CG4QFjAJ&url=http%3A%2F%2F208elmp02.blackmesh.com%2Fsites%2Fdefault%2Ffiles%2FProd.doc&ei=aI1sULKZA4qnrAeD74DgDA&usg=AFQjCNECTJC2gDy3wrJeywIYnJTu-zHHfw
[11] Schwartzman, S. (2008), The Statistical Measurement of Poverty, UN, available at URL: http://unstats.un.org/unsd/statcom/doc99/rio.pdf
[12] UNDP (2011), Poverty Reduction and UNDP – Fast Facts, UNDP, New York, USA.
[13] Rogers P., Jalal K., Boyd J. (2008), An Introduction to Sustainable Development, Earthscan, London, UK.
[14] European Commission (2007), Environmental Integration Handbook, Bruxelles, Belgium
[15] TEEB – The Economics of Ecosystems and Biodiversity for Local and Regional Policy Makers (2010).
[16] Kennedy M., Wilson J. (2010), “Natural Capital Valuation in the Credit River Watershed, Ontario”, TEEBcase, available at URL: http://www.eea.europa.eu/atlas/teeb/natural-capital-valuation-in-the/view
[17] O’Neill K., Rudden J.P. (2011), Environmental Best Practice and Benchmarking Report, available at URL: http://ec.europa.eu/environment/europeangreencapital/wp-content/uploads/2011/06/Environmental-Best-Practice-Benchmarking-Report-Award-Cycle-2012-2013.pdf
[18] Luthi C., Ingle R. (2012), “Sustainable Sanitation Solutions in Developing World Cities”, Sustainable Cities, Green Media ltd. London, UK.
[19] Francisco H.A. (2010), “Kanlaon Spring Water Plant, Philippines”, TEEBcase, available at URL: http://www.eea.europa.eu/atlas/teeb/kanlaon-spring-water-plant-philippines/view
[20] Monta V., Price H. (2012), “Rainwater Harvesting”, Sustainable Cities, Green Media ltd. London, UK.
[21] Zukang S. (2012), “Information Networking for Sustainable Development”, Global Dialogue, Volume 14:1-4.
[22] Gilbert R., Stevenson D., Girardet H., Stren R. (1996), Making Cities Work The role of Local Authorities in the Urban Environment, Earthscan, London, UK.
[23] Evans, B., Joas, M., Sundback, S. And Theobald, K. (2005), Governing Sustainable Cities, Earthscan, London, UK.
[24] UN (2012), The Future We Want, Rio de Janeiro, Brazil.
[25] FMDV (2012), Cities and environment, creating sustainable wealth – Environmental sustainability: mainspring of economic resilience and social benefit, Case studies, Veolia Environment
ANNEXThe Millennium Development Goals and targets come from the Millennium Declaration, signed by 189 countries, including 147 heads of State and Government, in September 2000 (http://www.un.org/millennium/declaration/ares552e.htm) and from further agreement by member states at the 2005 World Summit (Resolution adopted by the General Assembly - A/RES/60/1, http://www.un.org/Docs/journal/asp/ws.asp?m=A/RES/60/1). The goals and targets are interrelated and should be seen as a whole. They represent a partnership between the developed countries and the developing countries “to create an environment - at the national and global levels alike - which is conducive to development and the elimination of poverty”.
(Please see table on the following pages for more detail.)

73
Goals and Targets(from the Millennium Declaration)
Target 1.A:
Halve, between 1990 and 2015, the proportion
of people whose income is less than one dollar
a day
Target 1.B:
Achieve full and productive employment and
decent work for all, including women and
young people
Target 1.C:
Halve, between 1990 and 2015, the proportion
of people who suffer from hunger
Indicators for monitoring progress
1.1 Proportion of population below $1 (PPP)
per day1
1.2 Poverty gap ratio
1.3 Share of poorest quintile in national
consumption
1.4 Growth rate of GDP per person employed
1.5 Employment-to-population ratio
1.6 Proportion of employed people living below
$1 (PPP) per day
1.7 Proportion of own-account and contributing
family workers in total employment
1.8 Prevalence of underweight children
under-five years of age
1.9 Proportion of population below minimum
level of dietary energy consumption
Source:
Taken from the Official list of MDG indicators
(effective 15 January 2008)
http://mdgs.un.org/unsd/mdg/Host.
aspx?Content=Indicators/OfficialList.htm
Millennium Development Goals (MDGs)
Goal 1: Eradicate extreme poverty and hunger
Goals and Targets(from the Millennium Declaration)
Target 7.A:
Integrate the principles of sustainable
development into country policies and
programmes and reverse the loss of
environmental resources
Target 7.B:
Reduce biodiversity loss, achieving,by 2010, a
significant reduction in the rate of loss
Target 7.C:
Halve, by 2015, the proportion of people
without sustainable access to safe drinking
water and basic sanitation
Target 7.D:
By 2020, to have achieved a significant
improvement in the lives of at least
100 million slum dwellers
Indicators for monitoring progress
7.1 Proportion of land area covered by forest
7.2 CO2 emissions, total, per capita and per
$1 GDP (PPP)
7.3 Consumption of ozone-depleting substances
7.4 Proportion of fish stocks within safe
biological limits
7.5 Proportion of total water resources used
7.6 Proportion of terrestrial and marine
areas protected
7.7 Proportion of species threatened with
extinction
7.8 Proportion of population using an
improved drinking water source
7.9 Proportion of population using an
improved sanitation facility
7.10 Proportion of urban population living
in slums2
Goal 7: Ensure environmental sustainability
1 For monitoring country poverty trends, indicators based on national poverty lines should be used, where available.2 The actual proportion of people living in slums is measured by a proxy, represented by the urban population living in households with at least one of the four characteristics: (a) lack of access to improved water supply; (b) lack of access to improved sanitation; (c) overcrowding (3 or more persons per room); and (d) dwellings made of non-durable material.

75
IMAGE CREDITS Special thanks for the provision of pictures go to the Province of Bohol and its
Municipalities Balilihan, Jagna, Maribojoc, Pilar, Talibon and Tubigon, as well as the
City of Rajshahi, the City of Thimphu, the City of Guntur, the City of Bologna and the City
of Växjö. Without their contributions this guide would be a lot less colourful.
Additional images:
page 60: Josh and Erica Silverstein, Flickr

The Realising DReAMS project, funded by the EU Directorate–General (DG) Development and Cooperation – EuropeAid, is designed with the aim to bridge the gap between poverty reduction and environmental protection through the use of a poverty database monitoring system (PDMS) and an environmental management system (ecoBUDGET). The use of such instruments is critical to achieving the Millennium Development Goals (MDGs) and inspiring a set of Sustainable Development Goals (SDGs).Through illustrative case studies of Asian Local Authorities, the publication shows how these instruments support local governments identify their poor population within the city, providing a more solid footing for decision-making and explores the key mechanisms employed to improve ‘connectivity’ between poverty and environment in local governments across Asia.
DReAMS
ecoBUDGET