Embed Size (px)
Citation preview

Takeda Pharmaceutical Company Limited and its SubsidiariesConsolidated Financial Statements Under IFRSs
and Independent Auditor's Report
For the year ended March 31, 2015
Takeda Pharmaceutical Company Limited

Index
Independent Auditor's Report 1Consolidated Financial Statements
22
【Consolidated Statement of Financial Position】 346
Notes to Consolidated Financial Statements1 Reporting Entity 72 Basis of Preparation 73 Significant Accounting Policies 94 Operating Segments 165 Selling, General and Administrative Expenses 176 Other Operating Income and Expenses 187 Finance Income and Expenses 188 Income Taxes 199 Earnings Per Share 21
10 Other Comprehensive Income 2111 Property, Plant and Equipment 2212 Goodwill 2313 Intangible Assets 2414 Investment Property 2615 Other Financial Assets 2616 Inventories 2617 Trade and Other Receivables 2718 Cash and Cash Equivalents 2719 Assets and Disposal Groups Held for Sale 2720 Bonds and Loans 2821 Other Financial Liabilities 2922 Leases 2923 Employee Benefits 3024 Provisions 3225 Other Liabilities 3226 Trade and Other Payables 3227 Equity and Other Equity Items 3328 Financial Instruments 3329 Share-based Payments 3930 Cash Flow Information 4331 Subsidiaries and Associates 4432 Related Party Transactions 4633 Business Combinations 4634 Contingent Liabilities 4635 Subsequent Events 46
Page
【Consolidated Statement of Cash Flows】
Items
【Consolidated Statement of Operations】【Consolidated Statement of Operations and Other Comprehensive Income】
【Consolidated Statement of Changes in Equity】

Independent Auditor’s Report To the Board of Directors of Takeda Pharmaceutical Company Limited: We have audited the accompanying consolidated financial statements of Takeda Pharmaceutical Company Limited (the “Company”) and its consolidated subsidiaries, which comprise the consolidated statement of operations, statement of operations and other comprehensive income, statement of financial position, statement of changes in equity and statement of cash flows for the year ended March 31, 2015, and notes, comprising a summary of significant accounting policies and other explanatory information. Management’s Responsibility for the Consolidated Financial Statements Management is responsible for the preparation and fair presentation of these consolidated financial statements in accordance with International Financial Reporting Standards, and for such internal control as management determines is necessary to enable the preparation of consolidated financial statements that are free from material misstatement, whether due to fraud or error. Auditor’s Responsibility Our responsibility is to express an opinion on these consolidated financial statements based on our audit. We conducted our audit in accordance with auditing standards generally accepted in Japan. Those standards require that we comply with ethical requirements and plan and perform the audit to obtain reasonable assurance about whether the consolidated financial statements are free from material misstatement. An audit involves performing procedures to obtain audit evidence about the amounts and disclosures in the consolidated financial statements. The procedures selected depend on our judgement, including the assessment of the risks of material misstatement of the consolidated financial statements, whether due to fraud or error. In making those risk assessments, we consider internal control relevant to the entity’s preparation and fair presentation of the consolidated financial statements in order to design audit procedures that are appropriate in the circumstances, while the objective of the financial statement audit is not for the purpose of expressing an opinion on the effectiveness of the entity’s internal control. An audit also includes evaluating the appropriateness of accounting policies used and the reasonableness of accounting estimates made by management, as well as evaluating the overall presentation of the consolidated financial statements. We believe that the audit evidence we have obtained is sufficient and appropriate to provide a basis for our audit opinion. Opinion In our opinion, the consolidated financial statements present fairly, in all material respects, the financial position of the Company and its consolidated subsidiaries as of March 31, 2015, and their financial performance and cash flows for the year then ended in accordance with International Financial Reporting Standards. KPMG AZSA LLC June 26, 2015 Osaka, Japan
1

【Consolidated Financial Statements】【Consolidated Statement of Operations 】
Millions of yen
NoteFiscal 2013
(April 1, 2013 toMarch 31, 2014)
Fiscal 2014(April 1, 2014 to
March 31, 2015)Revenue 4 1,691,685 1,777,824Cost of sales (490,263) (520,990)Gross profit 1,201,422 1,256,834
Selling, general and administrative expenses 5 (556,210) (612,613)Research and development expenses (341,560) (382,096)Amortization and impairment losses on intangible assets associated with products
13 (143,202) (176,402)
Other operating income 6 23,861 107,181Other operating expenses 6 (45,038) (322,158)Operating profit (loss) 4 139,274 (129,254)
Finance income 7 49,297 15,357Finance expenses 7 (30,720) (32,878)Share of profit of associates accounted for using the equity method Profit (loss) before tax 158,851 (145,437)Income tax benefit (expenses) 8 (49,292) 2,403Net profit (loss) for the year 109,558 (143,034)
Attributable to:Owners of the Company 106,658 (145,775)Non-controlling interests 2,900 2,741Net profit (loss) for the year 109,558 (143,034)
Earnings per share (yen)Basic earnings (loss) per share 9 135.10 (185.37)Diluted earnings (loss) per share 9 134.95 (185.37)
【Consolidated Statement of Operations and Other Comprehensive Income 】Millions of yen
NoteFiscal 2013
(April 1, 2013 toMarch 31, 2014)
Fiscal 2014(April 1, 2014 to
March 31, 2015)Net profit (loss) for the year 109,558 (143,034)
Other comprehensive income (loss)Items that will not be reclassified to profit or loss Remeasurements of defined benefit plans 10 8,836 (4,532)
8,836 (4,532)Items that may be reclassified subsequently to profit or loss Exchange differences on translation of foreign operations 10 230,774 (47,559)
Net changes on revaluation of available-for-sale financial assets
10 (3,789) 15,040
Cash flow hedges 10 (1,714) (774)225,271 (33,293)
Other comprehensive income (loss) for the year, net of tax 234,107 (37,826)Total comprehensive income (loss) for the year 343,666 (180,860)
Attributable to:Owners of the Company 339,158 (186,618)Non-controlling interests 4,507 5,759Total comprehensive income (loss) for the year 343,666 (180,860)
1,000 1,337
2

【Consolidated Statement of Financial Position】Millions of yen
NoteFiscal 2013
(As of March 31, 2014)Fiscal 2014
(As of March 31, 2015)ASSETSNON-CURRENT ASSETS
Property, plant and equipment 11 542,253 526,162Goodwill 12 814,671 821,911Intangible assets 13 1,135,597 939,381Investment property 14 32,083 30,218Investments accounted for using the equity method 10,001 10,425Other financial assets 15 192,806 241,323Other non-current assets 40,772 52,192Deferred tax assets 8 208,424 154,506Total non-current assets 2,976,607 2,776,120
CURRENT ASSETSInventories 16 254,329 262,354Trade and other receivables 17 430,620 444,681Other financial assets 15 184,981 61,275Income taxes recoverable 12,044 22,148Other current assets 43,510 63,225Cash and cash equivalents 18 666,048 652,148 Subtotal 1,591,531 1,505,830Assets held for sale 19 1,005 14,243Total current assets 1,592,536 1,520,072
Total assets 4,569,144 4,296,192
Millions of yen
NoteFiscal 2013
(As of March 31, 2014)Fiscal 2014
(As of March 31, 2015)LIABILITIES AND EQUITY
LIABILITIESNON-CURRENT LIABILITIES
Bonds and loans 20 704,580 629,416Other financial liabilities 21, 22 110,129 70,105Net defined benefit liabilities 23 76,497 91,686Provisions 24 14,399 47,075Other non-current liabilities 25 39,555 78,778Deferred tax liabilities 8 280,595 156,132Total non-current liabilities 1,225,755 1,073,191
CURRENT LIABILITIESBonds and loans 20 155,404 99,965Trade and other payables 26 184,900 170,782Other financial liabilities 21, 22 48,817 42,105Income taxes payable 52,332 41,071Provisions 24 125,349 418,587Other current liabilities 25 235,953 238,469 Subtotal 802,754 1,010,978Liabilities held for sale 19 - 5,846Total current liabilities 802,754 1,016,824
Total liabilities 2,028,509 2,090,016
EQUITYShare capital 27 63,562 64,044Share premium 27 39,866 59,575Treasury shares 27 (621) (18,203)Retained earnings 1,901,307 1,601,326Other components of equity 466,624 430,305
Equity attributable to owners of the Company 2,470,739 2,137,047Non-controlling interests 69,896 69,129 Total equity 2,540,635 2,206,176
Total liabilities and equity 4,569,144 4,296,192
3

【Consolidated Statement of Changes in Equity】
Fiscal 2013 (April 1, 2013 to March 31, 2014)Millions of yen
Exchangedifferences ontranslation of
foreignoperations
Net changes onrevaluation ofavailable-for-sale financial
assets
As of April 1, 2013 63,541 40,257 (587) 1,927,795 177,083 64,598
Net profit for the year 106,658
Other comprehensive income 229,068 (3,827)
Comprehensive income for the year - - - 106,658 229,068 (3,827)
Issuances of new shares 21 21
Acquisitions of treasury shares (37)
Disposals of treasury shares 0 3
Dividends 27 (142,119)
Changes in the ownership interest insubsidiaries
Transfers from other components of equity 8,973
Share-based payments 29 643
Put options written on non-controllinginterests
27 (1,055)
Total transactions with owners 21 (391) (34) (133,145) - -
As of March 31, 2014 63,562 39,866 (621) 1,901,307 406,151 60,771
Cash flowhedges
Remeasurementsof defined benefit
plansTotal
As of April 1, 2013 1,416 - 243,097 2,274,103 64,183 2,338,286
Net profit for the year - 106,658 2,900 109,558
Other comprehensive income (1,714) 8,973 232,501 232,501 1,607 234,107
Comprehensive income for the year (1,714) 8,973 232,501 339,158 4,507 343,666
Issuances of new shares - 42 42
Acquisitions of treasury shares - (37) (37)
Disposals of treasury shares - 3 3
Dividends 27 - (142,119) (1,148) (143,267)
Changes in the ownership interest insubsidiaries
- - 2,354 2,354
Transfers from other components of equity (8,973) (8,973) - -
Share-based payments 29 - 643 643
Put options written on non-controllinginterests
27 - (1,055) (1,055)
Total transactions with owners - (8,973) (8,973) (142,523) 1,206 (141,317)
As of March 31, 2014 (298) - 466,624 2,470,739 69,896 2,540,635
Note
Equity attributable to owners of the Company
Non-controllinginterests
Total equityOther components of equity
Total
Equity attributable to owners of the Company
Note
Other components of equity
Retainedearnings
Treasury sharesShare premiumShare capital
4

Fiscal 2014 (April 1, 2014 to March 31, 2015)Millions of yen
Exchangedifferences ontranslation of
foreignoperations
Net changes onrevaluation ofavailable-for-sale financial
assets
As of April 1, 2014 63,562 39,866 (621) 1,901,307 406,151 60,771
Net profit (loss) for the year (145,775)
Other comprehensive income (50,459) 14,914
Comprehensive income for the year - - - (145,775) (50,459) 14,914
Issuances of new shares 483 483
Acquisitions of treasury shares (17,587)
Disposals of treasury shares 0 2
Dividends 27 (141,781)
Changes in the ownership interest insubsidiaries
(7,901)
Transfers from other components of equity (4,524)
Share-based payments 29 7,948 3
Put options written on non-controllinginterests
27 11,277
Total transactions with owners 483 19,708 (17,583) (154,206) - -
As of March 31, 2015 64,044 59,575 (18,203) 1,601,326 355,692 75,685
Cash flowhedges
Remeasurementsof defined benefit
plansTotal
As of April 1, 2014 (298) - 466,624 2,470,739 69,896 2,540,635
Net profit (loss) for the year - (145,775) 2,741 (143,034)
Other comprehensive income (774) (4,524) (40,843) (40,843) 3,017 (37,826)
Comprehensive income for the year (774) (4,524) (40,843) (186,618) 5,759 (180,860)
Issuances of new shares - 965 965
Acquisitions of treasury shares - (17,587) (17,587)
Disposals of treasury shares - 2 2
Dividends 27 - (141,781) (2,446) (144,227)
Changes in the ownership interest insubsidiaries
- (7,901) (4,079) (11,980)
Transfers from other components of equity 4,524 4,524 - -
Share-based payments 29 - 7,951 7,951
Put options written on non-controllinginterests
27 - 11,277 11,277
Total transactions with owners - 4,524 4,524 (147,073) (6,525) (153,598)
As of March 31, 2015 (1,073) - 430,305 2,137,047 69,129 2,206,176
NoteTotal
Equity attributable to owners of the Company
Note
Equity attributable to owners of the Company
Non-controllinginterests
Total equityOther components of equity
Treasury sharesRetainedearnings
Other components of equity
Share capital Share premium
5

【Consolidated Statement of Cash Flows 】Millions of yen
NoteFiscal 2013
(April 1, 2013 toMarch 31, 2014)
Fiscal 2014(April 1, 2014 to March 31, 2015)
Cash flows from operating activitiesNet profit (loss) for the year 109,558 (143,034)Depreciation, amortization and impairment loss 215,743 260,951Loss (gain) on sale and disposal of property, plant and equipment (*) (5,544) (32,309)Loss (gain) on sale of investment securities (40,465) (8,891)Income tax expenses 49,292 (2,403)Decrease (increase) in trade and other receivables (42,504) (32,515)Decrease (increase) in inventories (16,919) (14,548)Increase (decrease) in trade and other payables 2,306 (7,082)Increase (decrease) in provisions 3,988 316,471Other 40,647 (80,020) Subtotal 316,103 256,619Income taxes paid (182,647) (74,102)Tax refunds and interest on tax refunds received 15,264 -Net cash from (used in) operating activities 148,720 182,517
Cash flows from investing activitiesInterest received 1,081 2,464Dividends received 3,473 3,689Payments into time deposits (80,946) (3,364)Proceeds from withdrawal of time deposits 3,345 81,616Payments for acquisition of property, plant and equipment (50,108) (48,232)Proceeds from sale of property, plant and equipment (*) 13,366 33,903Payments for acquisition of intangible assets (28,411) (60,486)Payments for acquisition of investments (60,740) (207)Proceeds from sale and redemption of investments 48,924 83,741Payments for acquisition of subsidiaries 30 (3,342) -Other (698) (1,776)Net cash from (used in) investing activities (154,057) 91,347
Cash flows from financing activitiesNet increase (decrease) in short-term loans (617) (8)Proceeds from long-term loans 130,000 -Repayments of long-term loans (167) (63)Proceeds from issuance of bonds 119,681 -Redemption of bonds - (119,430)Purchase of treasury shares (37) (17,587)Interest paid (4,939) (5,229)Dividends paid (142,133) (141,637)Payments for acquisition of non-controlling interests - (11,073)Other (5,287) (5,971)Net cash from (used in) financing activities 96,502 (300,998)
Net increase (decrease) in cash and cash equivalents 91,164 (27,134)Cash and cash equivalents at the beginning of the year 18, 30 545,580 666,048Effects of exchange rate changes on cash and cash equivalents 29,303 16,329Cash and cash equivalents at the end of the year 18, 30 666,048 655,243
(*) This item includes gain or loss on or proceeds from sale of investment property and assets held for sale.
6

【Notes to Consolidated Financial Statements】
1
2 Basis of Preparation
Amendment to definition of investment entity and accountingtreatment for the investments
IFRS 12New disclosure requirements related to the amendment to IFRS10
IFRIC 21 Clarification of the accounting for levies
The above standards and interpretations have not had a material impact on the consolidated financial statements.
(3) Basis of Measurement
(4) Presentation Currency
(5) Use of Judgments, Estimates and Assumptions
(6) Changes in Accounting Policies
Description of new standards, interpretations and amendments
IAS 32 Presentation of offsetting financial assets and financial liabilities
IAS 39Amendment to novation of derivatives and continuation of hedgeaccounting
IFRS 10
The accounting standards and interpretations applied by the Companies, effective from Fiscal 2014, are as follows.
IFRS
Financial Instruments: Presentation
Financial Instruments: Recognition andMeasurement
Consolidated Financial Statements
Disclosure of Interests in Other Entities
Levies
Reporting Entity
(1) Compliance with IFRS
(2) Approval of Financial Statements
・Probability of an outflow of resources embodying economic benefits on contingent liabilities (Note 34)
・Recoverability of deferred tax assets (Note 8)
・Significant assumptions used in discounted cash flow projections for impairment tests of goodwill and intangible assets (Note 12 and13)
The consolidated financial statements are presented in Japanese yen, which is the Company’s functional currency. All financialinformation presented in Japanese yen has been rounded to the nearest million, except when otherwise indicated.
The preparation of the consolidated financial statements in accordance with IFRS requires management to make judgments,estimates and assumptions that affect the application of accounting policies and the reported amounts of assets, liabilities, revenueand expenses. Actual results may differ from these estimates.
・Measurement of defined benefit obligations (Note 23)・Accounting and measurement of provisions (Note 24)・Evaluation of contingent consideration in business combinations (Note 33)
The details of businesses and principle business activities of the Company and its subsidiaries (collectively referred to hereinafter asthe "Companies") are stated in Note 4, "Operating Segments".
The Company's consolidated financial statements for the year ended March 31, 2015 were approved on June 26, 2015 byRepresentative Director President & CEO Christophe Weber and Global Finance, Head of Corporate Finance Iwaaki Taniguchi.
Takeda Pharmaceutical Company Limited (hereinafter referred to as the “Company”) is a company incorporated in Japan.
The consolidated financial statements have been prepared on a historical cost basis except for the financial instruments stated inNote 3, "Significant Accounting Policies".
The Company has prepared the consolidated financial statements under International Financial Reporting Standards (hereinafterreferred to as "IFRS").
Judgments, estimates and assumptions made by management that may have a significant effect on the amounts recognized in theconsolidated financial statements are as follows:
7

Mandatoryadoption
(From thefiscal year
beginning onor after)
To beadopted by
theCompanies
[Consolidated Statement of Cash Flows]
1. In this fiscal year, the Company changed the classification of "Interest received" and "Dividends received" from Cash flows fromoperating activities to Cash flows from investing activities and the classification of "Interest paid" from Cash flows from operatingactivities to Cash flows from financing activities to better reflect the nature of the Companies' cash flow management.As a result, 1,081 million yen of "Interest received" and 3,473 million yen of "Dividends received" which were classified as Cash flowsfrom operating activities in Fiscal 2013 are restated as Cash flows from investing activities, and 4,939 million yen of "Interest paid"which was classified as Cash flows from operating activities in Fiscal 2013 is restated as Cash flows from financing activities.
2. “Increase (decrease) in provisions” which was included in “Other” within Cash flows from operating activities in Fiscal 2013 ispresented as a separate item in Fiscal 2014 due to an increase in the amount.Accordingly, 3,988 million yen which was included in “Other” within Cash flows from operating activities in Fiscal 2013 is nowpresented separately as “Increase (decrease) in provisions”.
3. “Payments for purchase of treasury shares” included in “Other” within Cash flows from financing activities in Fiscal 2013 ispresented as a separate item from "Other" in Fiscal 2014 due to an increase in the amount.Accordingly, cash outflow of 37 million yen which was included in “Other” within Cash flows from financing activities in Fiscal 2013 isnow presented separately as “Purchase for treasury shares”.
Fiscal yearending March2018
New revenue standard which supersedes IAS 18 "Revenue", IAS11 "Construction Contracts" and a number of revenue-relatedinterpretations
IFRS 15Revenue from Contractswith Customers
January 1,2017
Fiscal yearending March2016
Amendment to the accounting for contributions from employeesand third parties to defined benefit plans
July 1, 2014Employee BenefitsIAS 19
Intangible AssetsJanuary 1,2016
Fiscal yearending March2017
Amendment to clarify the acceptable methods of amortization
IFRS 11 Joint ArrangementsJanuary 1,2016
Fiscal yearending March2017
Amendment to the accounting for acquisitions of an interest in ajoint operation
(7) Changes in Presentation
(8) New Standards and Interpretations Not Yet Adopted
IFRS Description of new standards, interpretations and amendments
Amendment to the classification, measurement and recognitionof financial instruments and hedge accounting
Fiscal yearending March2019
January 1,2018
Financial InstrumentsIFRS 9
The new standards, interpretations and amendments that have been issued for the consolidated financial statements which theCompanies have not yet applied as of the approval date of the consolidated financial statements are set forth in the table below. TheCompanies are currently assessing the possible impact the application will have on the consolidated financial statements.
IAS 16Property, Plant andEquipment
January 1,2016
Fiscal yearending March2017
Amendment to clarify the acceptable methods of depreciation
IAS 38
IFRS 10
IFRS 12
IAS 28
Consolidated FinancialStatementsDisclosure of Interests inOther EntitiesInvestments inAssociates and JointVentures
January 1,2016
Fiscal yearending March2017
Clarifying exceptions for applying consolidation and the equitymethod for investment entities
IFRS 10
IAS 28
Consolidated FinancialStatementsInvestments inAssociates and JointVentures
January 1,2016
Fiscal yearending March2017
Ammendments to the accounting treatment for sale orcontribution of assets between an investor and its associate orjoint venture
8

3
1) Subsidiaries
(1) Basis of Consolidation
Subsidiaries are entities which are controlled by the Company.
The assets and liabilities of foreign operations are translated using the spot exchange rates at the end of the reporting period, whileincome and expenses of foreign operations presented in net profit or loss and other comprehensive income are translated using theexchange rates at the dates of the transactions or rates that approximate the exchange rates at the dates of the transactions.Exchange differences arising from translation are recognized as other comprehensive income. In cases in which foreign operationsare disposed of, the cumulative amount of exchange differences related to the foreign operations is recognized as part of the gain orloss on disposal.
The consolidated financial statements include some investments in associates of which the end of the reporting period is differentfrom that of the Company. Necessary adjustments are made to account for significant transactions or events that occur due to thedifference in the end of the reporting period.Intra-group profits on transactions with associates accounted for using the equity method are eliminated against the investment to theextent of the Companies’ equity interest in the associates. Intra-group losses are eliminated in the same way as Intra-group profitsunless there is evidence of impairment.
Monetary assets and liabilities denominated in foreign currencies are retranslated into the functional currency using the spotexchange rates at the end of each reporting period, and non-monetary assets and liabilities measured at fair value that aredenominated in foreign currencies are retranslated into the functional currency using the spot exchange rates at the date when the fairvalue was measured.
Exchange differences arising on the translation or settlement are recognized in profit or loss. However, exchange differences arisingfrom the translation of financial instruments designated as financial assets measured at fair value through other comprehensiveincome and from cash flow hedges are recognized as other comprehensive income.
When there are changes in ownership interest in subsidiaries and the Companies retain control over the subsidiaries, they areaccounted for as equity transactions. Any difference between the adjustment to non-controlling interests and the fair value ofconsideration transferred or received is recognized directly in equity attributable to owners of the Company.
Investments in associates are accounted for using the equity method and recognized at cost on the acquisition date.
2) Associates
2) Foreign operations
Foreign currency transactions are translated into the functional currency using the exchange rates at the dates of the transactions orrates that approximate the exchange rates at the dates of the transactions.
The consolidated financial statements are based on financial statements of the Company and its subsidiaries and associates.
(2) Foreign Currency Translation
The financial statements of the subsidiaries are included in the consolidated financial statements from the date that controlcommences until the date that control is lost.When the end of the reporting period of a subsidiary is different from that of the Company, the subsidiary prepares its financialstatements for consolidation purpose based on the provisional accounting as of the Company's closing date.
All intra-group balances and transactions, and any unrealized income and expenses arising from intra-group transactions areeliminated in preparing the consolidated financial statements.
Associates are entities over which the Companies have significant influence, but do not have control or joint control, over the financialand operating policies.
Business combinations are accounted for using the acquisition method. The identifiable assets acquired and the liabilities assumedare measured at the fair values at the acquisition date. Goodwill is measured as the excess of the sum of the considerationtransferred, the amount of any non-controlling interests in the acquiree and the fair value of the acquirer's previously held equityinterest in the acquiree less the fair value of identifiable assets acquired, net of liabilities assumed at the acquisition date. Theconsideration transferred for the acquisition of a subsidiary is measured as the fair value of the assets transferred, the liabilitiesincurred to former owners of the acquiree and the equity interests issued by the Companies.Non-controlling interests are initially measured either at fair value or at the non-controlling interests’ proportionate share of therecognized amounts of the acquiree’s identifiable net assets on a transaction-by-transaction basis.Acquisition related costs are recognized as expenses in the period they are incurred.Changes in the Companies' ownership interests in subsidiaries arising from transactions between the Companies and non-controllinginterests that do not result in the Companies losing control over a subsidiary are treated as equity transactions and, therefore, do notresult in adjustments to goodwill.
1) Foreign currency transactions
3) Business combinations
Significant Accounting Policies
9

1) Sale of goods
Revenue is measured at fair value of the consideration received or receivable taking into account the amount of any trade discountsand volume rebates, etc. allowed by the Companies.
( i ) The Companies have transferred to the buyer the significant risks and rewards of ownership of the goods;
Royalty and service income are recognized on an accrual basis in accordance with the substance of the relevant agreement.
(4) Income Taxes
(5) Earnings per Share
2) Deferred taxes
(ii ) The Companies retain neither continuing managerial involvement to the degree usually associated with ownership nor effective control over the goods sold;
Deferred tax assets and liabilities are not recognized for the following temporary differences:
Income taxes payable and recoverable, including those from prior fiscal years, are measured at the amount that is expected to be paidto or recovered from the taxation authorities using the tax rates and tax laws that have been enacted or substantively enacted by theend of reporting period.
・The initial recognition of assets and liabilities in transactions that are not business combinations and affect neither accounting profitnor taxable profit (loss) at the time of the transaction
Deferred taxes are calculated based on the temporary differences between the carrying amounts for financial reporting purposes andthe amounts used for taxation purposes at the end of the reporting period. Deferred tax assets are recognized for deductibletemporary differences, unused tax credits and unused tax losses to the extent that it is probable that future taxable profit will beavailable against which they can be utilized. Deferred tax liabilities are generally recognized for taxable temporary differences.
・Deductible temporary differences arising from investments in subsidiaries and associates, when it is not probable that the temporarydifferences will reverse in the foreseeable future and that taxable profit will be available against which the temporary differences canbe utilized
Basic earnings per share is calculated by dividing profit or loss for the year attributable to owners of ordinary shares of the Companyby the weighted-average number of ordinary shares outstanding during the reporting period, adjusted by the number of treasuryshares. Diluted earnings per share is calculated by adjusting all the effects of dilutive potential ordinary shares.
Current taxes are measured at the amount expected to be paid to or recovered from the taxation authorities, using the tax rates andtax laws that have been enacted or substantively enacted by the end of the reporting period. Current taxes are recognized in profit orloss, except for the taxes which arise from business combinations and are recognized either in other comprehensive income ordirectly in equity.
Deferred tax assets and liabilities are offset when there is a legally enforceable right to offset current tax assets against current taxliabilities and the deferred tax assets and liabilities are for those related to income taxes levied by the same taxation authority on thesame taxable entity.
Income taxes consist of current taxes and deferred taxes.
2) Royalty and service income
・Taxable temporary differences arising from investments in subsidiaries and associates when the timing of the reversal of thetemporary differences is controllable and it is not probable that they will reverse in the foreseeable future
Deferred tax assets and liabilities are measured at the tax rates that are expected to apply to the periods in which the temporarydifferences are expected to reverse based on the tax rates and tax laws that have been enacted or substantively enacted by the endof the reporting period.
1) Current taxes
・The initial recognition of goodwill
Revenue from the sale of goods is recognized when all the following conditions have been satisfied:
(v ) The costs incurred or to be incurred in respect to the transaction can be measured reliably.
(iii) The amount of revenue can be measured reliably;(iv) It is probable that the economic benefits associated with the transaction will flow to the Companies; and
(3) Revenue
10
(9) Investment Property
( i ) The technical feasibility of completing the intangible asset so that it will be available for use or sale
(v ) The availability of adequate technical, financial and other resources to complete the development and to use or sell
(iii) The availability to use or sell the intangible asset(iv) How the intangible asset will generate probable future economic benefits
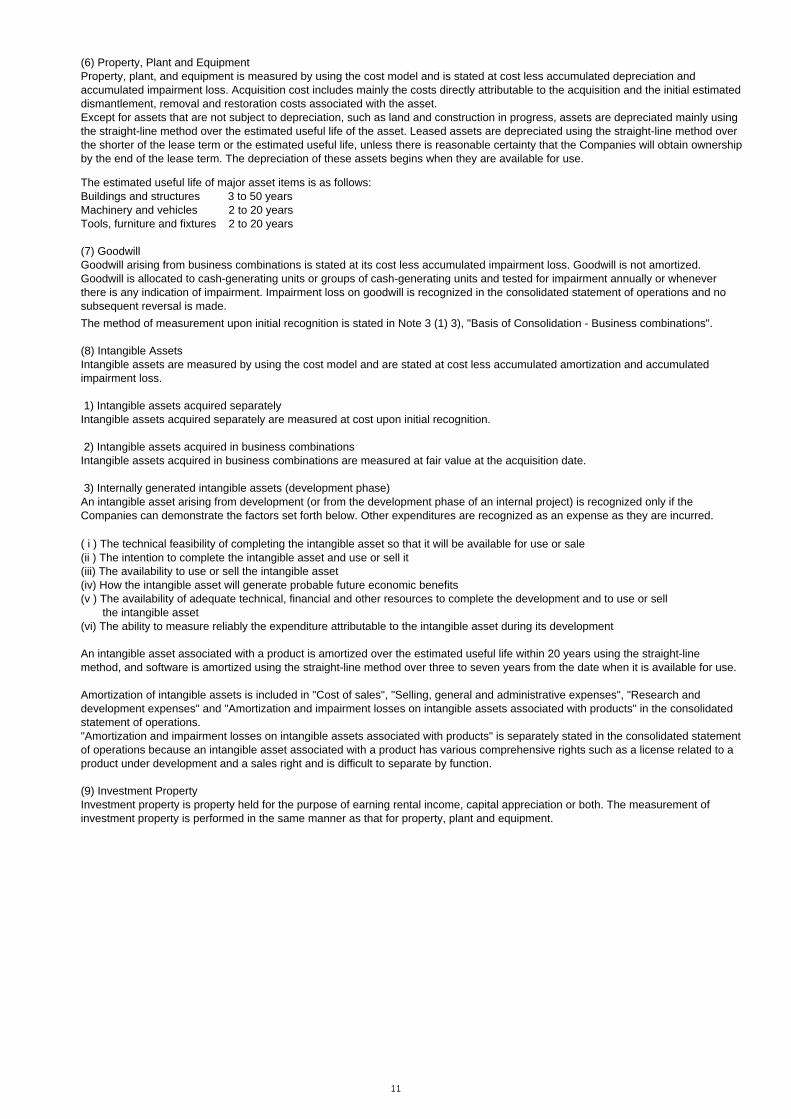
Investment property is property held for the purpose of earning rental income, capital appreciation or both. The measurement ofinvestment property is performed in the same manner as that for property, plant and equipment.
An intangible asset associated with a product is amortized over the estimated useful life within 20 years using the straight-linemethod, and software is amortized using the straight-line method over three to seven years from the date when it is available for use.
Property, plant, and equipment is measured by using the cost model and is stated at cost less accumulated depreciation andaccumulated impairment loss. Acquisition cost includes mainly the costs directly attributable to the acquisition and the initial estimateddismantlement, removal and restoration costs associated with the asset.
Intangible assets acquired separately are measured at cost upon initial recognition. 1) Intangible assets acquired separately
2) Intangible assets acquired in business combinationsIntangible assets acquired in business combinations are measured at fair value at the acquisition date.
3) Internally generated intangible assets (development phase)
(6) Property, Plant and Equipment
The estimated useful life of major asset items is as follows:
Intangible assets are measured by using the cost model and are stated at cost less accumulated amortization and accumulatedimpairment loss.
(7) Goodwill
(8) Intangible Assets
The method of measurement upon initial recognition is stated in Note 3 (1) 3), "Basis of Consolidation - Business combinations".
Except for assets that are not subject to depreciation, such as land and construction in progress, assets are depreciated mainly usingthe straight-line method over the estimated useful life of the asset. Leased assets are depreciated using the straight-line method overthe shorter of the lease term or the estimated useful life, unless there is reasonable certainty that the Companies will obtain ownershipby the end of the lease term. The depreciation of these assets begins when they are available for use.
Goodwill arising from business combinations is stated at its cost less accumulated impairment loss. Goodwill is not amortized.Goodwill is allocated to cash-generating units or groups of cash-generating units and tested for impairment annually or wheneverthere is any indication of impairment. Impairment loss on goodwill is recognized in the consolidated statement of operations and nosubsequent reversal is made.
Buildings and structures 3 to 50 yearsMachinery and vehicles 2 to 20 yearsTools, furniture and fixtures 2 to 20 years
Amortization of intangible assets is included in "Cost of sales", "Selling, general and administrative expenses", "Research anddevelopment expenses" and "Amortization and impairment losses on intangible assets associated with products" in the consolidatedstatement of operations."Amortization and impairment losses on intangible assets associated with products" is separately stated in the consolidated statementof operations because an intangible asset associated with a product has various comprehensive rights such as a license related to aproduct under development and a sales right and is difficult to separate by function.
the intangible asset(vi) The ability to measure reliably the expenditure attributable to the intangible asset during its development
An intangible asset arising from development (or from the development phase of an internal project) is recognized only if theCompanies can demonstrate the factors set forth below. Other expenditures are recognized as an expense as they are incurred.
(ii ) The intention to complete the intangible asset and use or sell it
11

Leases are classified as finance leases if substantially all the risks and rewards incidental to ownership are transferred to the lessee.Leases other than finance leases are classified as operating leases.
At the commencement of the lease term, the Companies recognize finance leases as assets and liabilities in the consolidatedstatement of financial position at amounts equal to the fair value of the leased property or, if lower, the present value of the minimumlease payments, each determined at the inception of the lease.
Lease income from operating leases is recognized in income on a straight-line basis over the lease term, unless another systematicbasis is more representative of the time pattern in which use benefit derived from the leased asset is diminished.
The costs for defined contribution plans are recognized as expenses when the employees render the related service. 2) Defined contribution plans
The Companies assess the carrying amounts of non-financial assets at the end of the reporting period, excluding inventories,deferred tax assets, assets held for sale and assets arising from employee benefits, to determine whether there is any indication ofimpairment. If any such indication exists, or in cases in which an impairment test is required to be performed each year, therecoverable amount of the asset is estimated. In cases in which the recoverable amount cannot be estimated for each asset, they areestimated at the cash-generating unit level.
(14) Assets Held for Sale
The recoverable amount of an asset or a cash-generating unit is determined at the higher of its fair value less cost of disposal or itsvalue in use. In the determining the value in use, the estimated future cash flows are discounted to their present value using adiscount rate that reflects the time value of money and the risks specific to the asset. If the carrying amount of the asset or cash-generating unit exceeds the recoverable amount, impairment loss is recognized in profit or loss and the carrying amount is reduced tothe recoverable amount.
An asset or asset group for which the cash flows are expected to arise principally from sale rather than continuing use is classified asan asset held for sale when it is highly probable that the asset or asset group will be sold within one year, the asset or asset group isavailable for immediate sale in its present condition, and the management of the Companies are committed to the sale. In such cases,the asset held for sale is measured at the lower of its carrying amount or its fair value less costs to sell.
1) Defined benefit plans
An asset or a cash-generating unit other than goodwill for which impairment loss was recognized in prior years is assessed at the endof reporting period to determine whether there is any indication that the impairment loss recognized in prior periods may no longerexist or may have decreased. If any such indication exists, the recoverable amount of the asset or cash-generating unit is estimated.In cases in which the recoverable amount exceeds the carrying amount of the asset or cash-generating unit, the impairment loss isreversed up to the lower of the estimated recoverable amount or the carrying amount that would have been determined if noimpairment loss had been recognized in prior years. The reversal of impairment loss is immediately recognized in profit or loss.
The Companies use the projected unit credit method to determine the present value, the related current service cost and the pastservice cost by each defined benefit obligation. The discount rate is determined by reference to market yields on high qualitycorporate bonds at the end of the reporting period. The net defined benefit liabilities (assets) in the consolidated statement of financialposition are calculated by deducting the fair value of the plan assets from the present value of the defined benefit obligations.Remeasurements of defined benefit plans are recognized in full as other comprehensive income and then transferred to retainedearnings in the period in which they are recognized.
(13) Cash and Cash Equivalents
(11) Impairment of Non-financial Assets
2) As lessor
(10) Leases
1) As lessee
(12) Inventories
Cash and cash equivalents consist of cash on hand, demand deposits and short-term, highly liquid investments that are readilyconvertible to known amounts of cash and subject to insignificant risk of change in value and due within three months from the dateof acquisition.
Inventories are measured at the lower of cost or net realizable value. The cost of inventories is determined mainly by using theweighted-average cost formula. The cost of inventories includes purchase costs, costs of conversion and other costs incurred inbringing the inventories to the present location and condition. Net realizable value is the estimated selling price in the ordinary courseof business less the estimated costs of completion and the estimated costs necessary to make the sale.
Lease payments for operating leases are recognized as expenses on a straight-line basis over the lease term, unless anothersystematic basis is more representative of the time pattern of the user's benefit.
The Companies sponsor lump-sum payments on retirement, pensions and other plans such as post-retirement medical care as post-employment benefit plans. They are classified into defined benefit plans and defined contribution plans.
(15) Post-Employment Benefit
12

Exchange differences on monetary assets are recognized in profit or loss.
Available-for-sale financial assets are measured at fair value as of the end of reporting period, and the gains and losses arising fromchanges in fair value are recognized in other comprehensive income.
(ii) Subsequent measurement
Financial assets at fair value through profit or loss are measured at fair value, and any gains or losses arising on remeasurement arerecognized in profit or loss.
Dividends on available-for-sale financial assets (equity instruments) are recognized in profit or loss in the reporting period when theCompanies’ right to receive the dividends is established.
(16) Provisions
(17) Financial Instruments
(c) Loans and receivables
(d) Available-for-sale financial assets
(a) Financial assets at fair value through profit or loss
Loans and receivables are measured at amortized cost using the effective interest method less any impairment loss. Interest incomeis recognized principally by applying the effective interest rate, unless the recognition of interest is immaterial as in the case of short-term receivables.
Held-to-maturity investments are measured at amortized cost using the effective interest method less any impairment loss.The effective interest method is a method of calculating the amortized cost of a financial asset or a financial liability and allocating theinterest income or interest expense over the relevant period. The effective interest rate is the rate that exactly discounts estimatedfuture cash receipts or payments through the expected life of the financial instrument or, when appropriate, a shorter period to theinitial net carrying amount of the financial asset or financial liability.
(b) Held-to-maturity investments
Provisions are recognized when the Companies have present legal or constructive obligations as a result of past events, it is probablethat outflows of resources embodying economic benefits will be required to settle the obligations and reliable estimates can be madeof the amount of the obligations.
Financial assets are recognized in the consolidated statement of financial position when the Companies become a party to thecontractual provisions of the instruments. At the initial recognition, the financial assets are classified based on the nature and purposein accordance with the following:
(a) Financial assets at fair value through profit or loss
1) Financial assets(i) Initial recognition and measurement
(d) Available-for-sale financial assets
Financial assets except for financial assets at fair value through profit or loss are initially measured at fair value plus transaction coststhat are directly attributable to the acquisition.
(b) Held-to-maturity investments
(c) Loans and receivables
Either held-for-trading financial assets or financial assets designated as financial assets at fair value through profit or loss
Non-derivative financial assets with fixed or determinable payments and fixed maturities that the Companies have the positive intent and ability to hold to maturity
Non-derivative financial assets and either designated as available-for-sale financial assets or not classified as (a) financial assets at fair value through profit or loss, (b) held-to-maturity investments or (c) loans and receivables
Non-derivative financial assets with fixed or determinable payments that are not quoted in an active market
13
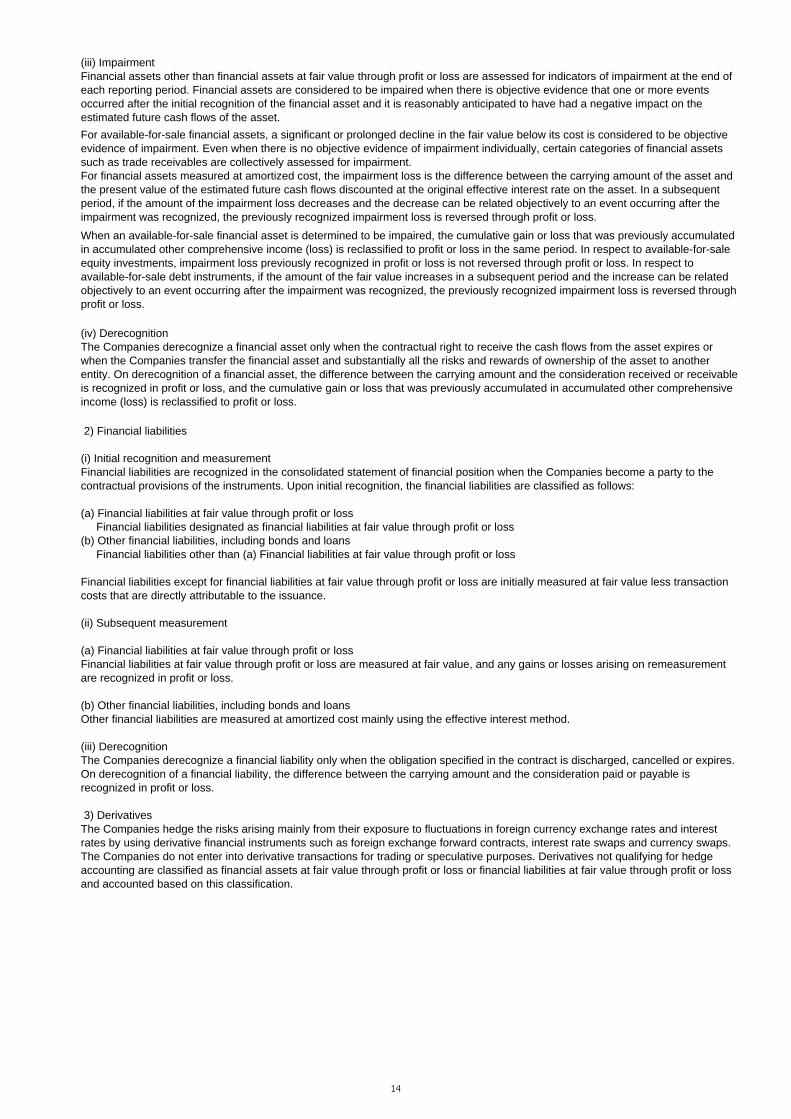
Financial liabilities designated as financial liabilities at fair value through profit or loss(b) Other financial liabilities, including bonds and loans Financial liabilities other than (a) Financial liabilities at fair value through profit or loss
(ii) Subsequent measurement
The Companies derecognize a financial asset only when the contractual right to receive the cash flows from the asset expires orwhen the Companies transfer the financial asset and substantially all the risks and rewards of ownership of the asset to anotherentity. On derecognition of a financial asset, the difference between the carrying amount and the consideration received or receivableis recognized in profit or loss, and the cumulative gain or loss that was previously accumulated in accumulated other comprehensiveincome (loss) is reclassified to profit or loss.
The Companies derecognize a financial liability only when the obligation specified in the contract is discharged, cancelled or expires.On derecognition of a financial liability, the difference between the carrying amount and the consideration paid or payable isrecognized in profit or loss.
3) Derivatives
Financial liabilities except for financial liabilities at fair value through profit or loss are initially measured at fair value less transactioncosts that are directly attributable to the issuance.
Financial liabilities at fair value through profit or loss are measured at fair value, and any gains or losses arising on remeasurementare recognized in profit or loss.
Financial assets other than financial assets at fair value through profit or loss are assessed for indicators of impairment at the end ofeach reporting period. Financial assets are considered to be impaired when there is objective evidence that one or more eventsoccurred after the initial recognition of the financial asset and it is reasonably anticipated to have had a negative impact on theestimated future cash flows of the asset.
Other financial liabilities are measured at amortized cost mainly using the effective interest method.(b) Other financial liabilities, including bonds and loans
(iii) Derecognition
Financial liabilities are recognized in the consolidated statement of financial position when the Companies become a party to thecontractual provisions of the instruments. Upon initial recognition, the financial liabilities are classified as follows:
For financial assets measured at amortized cost, the impairment loss is the difference between the carrying amount of the asset andthe present value of the estimated future cash flows discounted at the original effective interest rate on the asset. In a subsequentperiod, if the amount of the impairment loss decreases and the decrease can be related objectively to an event occurring after theimpairment was recognized, the previously recognized impairment loss is reversed through profit or loss.
(a) Financial liabilities at fair value through profit or loss
(iii) Impairment
(iv) Derecognition
When an available-for-sale financial asset is determined to be impaired, the cumulative gain or loss that was previously accumulatedin accumulated other comprehensive income (loss) is reclassified to profit or loss in the same period. In respect to available-for-saleequity investments, impairment loss previously recognized in profit or loss is not reversed through profit or loss. In respect toavailable-for-sale debt instruments, if the amount of the fair value increases in a subsequent period and the increase can be relatedobjectively to an event occurring after the impairment was recognized, the previously recognized impairment loss is reversed throughprofit or loss.
(i) Initial recognition and measurement
For available-for-sale financial assets, a significant or prolonged decline in the fair value below its cost is considered to be objectiveevidence of impairment. Even when there is no objective evidence of impairment individually, certain categories of financial assetssuch as trade receivables are collectively assessed for impairment.
The Companies hedge the risks arising mainly from their exposure to fluctuations in foreign currency exchange rates and interestrates by using derivative financial instruments such as foreign exchange forward contracts, interest rate swaps and currency swaps.The Companies do not enter into derivative transactions for trading or speculative purposes. Derivatives not qualifying for hedgeaccounting are classified as financial assets at fair value through profit or loss or financial liabilities at fair value through profit or lossand accounted based on this classification.
2) Financial liabilities
(a) Financial liabilities at fair value through profit or loss
14

The cumulative gain or loss that was previously recognized in other comprehensive income is reclassified to profit or loss in the sameperiod when the cash flows of the hedged items are recognized in profit or loss and in the same line item in the consolidatedstatement of operations.
1) Equity-settled share-based payments
2) Cash-settled share-based payments
(18) Government Grants
(20) Capital
(19) Share-based Payments
The Companies measure the services acquired and the corresponding increase in equity at the fair value of the equity instrumentsgranted and recognize the amount as an expense over the vesting period and the corresponding amount as an increase in equity.
1) Ordinary shares
2) Treasury shares
4) Hedge accounting
When the Companies acquire treasury shares, the consideration paid is recognized as a deduction from equity. When theCompanies sell the treasury shares, the difference between the carrying amount and the consideration received is recognized inshare premium.
Hedge accounting is discontinued when the Companies revoke the designation, when the hedging instrument expires or is sold,terminated or exercised or when the hedge no longer qualifies for hedge accounting.
Proceeds from the issuance of ordinary shares by the Company are included in share capital and share premium.
The effective portion of changes in the fair value of derivatives designated and qualifying as cash flow hedges is recognized in othercomprehensive income. The gain or loss relating to the material ineffective portion is recognized immediately in profit or loss.
The Companies designate certain derivatives as cash flow hedges and adopt hedge accounting for such derivatives. The Companiesdocument the relationship between hedging instruments and hedged items based on the strategy for undertaking hedge transactionsat the inception of the transaction. The Companies also assess whether the derivatives used in hedging transactions are highlyeffective in offsetting changes in cash flows of hedged items both at the hedge inception and on an ongoing basis.
The Companies measure the services received and the liability incurred at the fair value of the liability and recognize the amount as anexpense over the vesting period and the corresponding amount as an increase in liability. The Companies remeasure the fair value ofthe liability at the end of each reporting period and at the date of settlement and recognize any changes in fair value in profit or loss.
The Companies implement share-based payment programs and make equity and cash-settled share-based payments.
Government grants are recognized when there is reasonable assurance that the Companies will comply with the conditions attachedto them and receive the grants. Government grants for the purchasing of property, plant and equipment are recognized as deferredincome and then recognized as income on a systematic basis over the useful lives of the related assets. Government grants forexpenses incurred are recognized as income on a systematic basis over the periods in which the Companies recognize as expensesthe related costs for which the grants are intended to compensate.
15

4
Fiscal 2013 (April 1, 2013 to March 31, 2014)
Millions of yen
EthicalDrugs
ConsumerHealthcare
Other
1,529,073 72,857 89,755 1,691,685112,101 16,382 10,790 139,274
49,297(30,720)
158,851 Other material items of income and expenses
Millions of yen
EthicalDrugs
ConsumerHealthcare
Other
182,082 705 5,415 188,20324,616 - 2,924 27,539
Fiscal 2014 (April 1, 2014 to March 31, 2015)
Millions of yen
EthicalDrugs
ConsumerHealthcare
Other
1,614,509 73,579 89,736 1,777,824(178,884) 17,189 32,441 (129,254)
15,357(32,878)
(145,437) Other material items of income and expenses
Millions of yen
EthicalDrugs
ConsumerHealthcare
Other
186,468 497 5,549 192,51568,437 - - 68,437
(Note 1) Details of revenues are as follows:Millions of yen
1,605,424 1,690,29686,261 87,528
1,691,685 1,777,824
(Note 2) In Fiscal 2014, the Company discontinued the presentation of "Intersegment sales and transfers" which reflects the decision to change the management structure to focus on sales to external customers. As a result, only "Revenues" which represents sales to outside customers is shown in the above table. To ensure comparability, the amounts reported in Fiscal 2013 have been restated according to the new classification.
Finance expenses
1,691,685139,274
Total
188,20327,539
Total
1,777,824(129,254)
68,437
Operating Segments
Fiscal 2014(April 1, 2014 to March 31, 2015)
Depreciation and amortization
Finance expenses
Reportable SegmentsConsolidated
financialstatements
Share of profit of associatesaccounted for using the equitymethod
Sales of goods
Depreciation and amortizationImpairment loss
Total
192,515
Reportable Segments
Total
Fiscal 2013(April 1, 2013 to March 31, 2014)
Finance income
Consolidatedfinancial
statements
(1) Reportable Segments
1,000
1,337
Consolidatedfinancial
statements
Reportable Segments
Royalty and service revenues
Share of profit of associatesaccounted for using the equitymethod
Profit before tax
Total
Operating profitRevenues (Notes 1 and 2)
Reportable Segments
Impairment loss
Profit (Loss) before tax
The Companies manage the business by product/service type. The Company or its subsidiaries serving as the headquarters of eachbusiness creates comprehensive product/service strategies for the Japanese and overseas markets and implement such businessactivities in accordance with the strategies.
Operating profit (loss)Revenues (Notes 1 and 2)
Finance income
The Companies categorize Ethical Drugs, Consumer Healthcare and Other as its three reportable segments. Financial data isavailable separately for each of these segments and the financial results for all reportable segments are periodically reviewed by theCompany’s Board of Directors in order to make decisions on the proper allocation of business resources and to evaluate the businessperformance of the respective segments. The Ethical Drugs segment includes the manufacture and sale of ethical drugs. TheConsumer Healthcare segment includes the manufacture and sale of OTC drugs and quasi-drugs. The Other segment includes themanufacture and sale of reagents, clinical diagnostics, chemical products and other businesses.
Consolidatedfinancial
statements
16

1) External revenues
Millions of yen
733,882 352,065 320,015 89,571 81,245 85,371 29,536 1,691,685
Millions of yen
712,813 426,129 325,285 81,321 85,374 111,412 35,489 1,777,824
2) Non-current assetsMillions of yen
519,578 690,301 1,319,695 2,529,574502,621 710,907 1,107,310 2,320,839
Millions of yen
270,575 259,673
5
Millions of yen
105,253 113,212Salaries 133,631 139,998
40,665 42,96415,380 15,834
UnitedStates
Japan
Russia/CIS
Others Total
Medipal Holdings Corporation and the Group
(Note) Financial instruments, deferred tax assets and net defined benefit assets are excluded. Goodwill and intangible assets related to the acquisition of Nycomed, which are impracticable to allocate to each country, are included in "Europe and others." The amount was 1,152,959 million yen and 950,294 million yen as of March 31, 2014 and 2015, respectively.
Fiscal 2013(April 1, 2013 to March 31, 2014)
Fiscal 2014(April 1, 2014 to March 31, 2015)
Post-employment benefit costs
LatinAmerica
Asia
Ethical Drugs andConsumer Healthcare
Fiscal 2013 (April 1, 2013 to March 31, 2014)
Fiscal 2014 (April 1, 2014 to March 31, 2015)
Total
Selling, General and Administrative ExpensesThe major items in "Selling, general and administrative expenses" for each year are as follows:
(3) Information on Major Customers
Russia/CIS
(2) Geographic Information
Fiscal 2013(April 1, 2013 to
March 31, 2014)
Fiscal 2014(April 1, 2014 to
March 31, 2015)
Revenue from a single external customer exceeded 10% of the consolidated revenue and the details are as follows:
LatinAmerica
As of March 31, 2015
(Note 1) Revenues are attributable to countries or regions based on the customer location.
UnitedStates
As of March 31, 2014
JapanUnitedStates
(Note 2) In Fiscal 2014, the Company changed the regional classification to ensure consistency with its global organizational structure. The "North America" region was divided into "United States" and "Canada", and "Canada" and previous "Europe" were integrated into "Europe and Canada". To ensure comparability, the amounts reported in Fiscal 2013 have been restated according to the new classification.(Note 3) "Others" region includes Middle East, Oceania and Africa.
Asia
Europeand
Canada
Europeand
Canada
Europe andothers
Japan
Reportable Segments
Advertising and sales promotion expenses
Others Total
Bonuses
17

6(1) Other Operating Income
Millions of yen
2,630 3,1494,316 3,900
4,721 6,504
5,618 9,48923,861 107,181
(2) Other Operating ExpensesMillions of yen
2,2413,220 1,489
13,215 12,0353,057 6,2335,394 12,907
- 274,05615,130 13,19545,038 322,158
7(1) Finance Income
Millions of yen
1,369 2,3133,320 3,263
40,483 8,8914,103 -
22 89049,297 15,357
(2) Finance ExpensesMillions of yen
4,888 5,796
- 2,73111,750 1,1432,252 5,341
30,720 32,878
Finance Income and Expenses
Rental income
Fair value remeasurements on contingent consideration recognized in business combinations (Note)
- 51,324
(Note) This amount includes the partial reversal of contingent consideration related to the acquisition of URL Pharma, Inc of 53,841 million yen. Contingent consideration is an obligation of the acquirer to transfer additional assets or equity interests to the former owners of an acquiree as part of the exchange for control of the acquiree if specified future events occur or conditions are met, and is remeasured to fair value at each fiscal year end until the contingency is resolved.
Loss on Actos litigation (Note 2)
Total
1,653
Severance expenses Consultancy expenses
Expenses directly attributable to rental income
OthersTotal
Fiscal 2014(April 1, 2014 to March 31, 2015)
Royalty income on transfers of operations
Fiscal 2013(April 1, 2013 to March 31, 2014)
Fiscal 2014(April 1, 2014 to March 31, 2015)
Other Operating Income and Expenses
32,815
Impairment loss on available-for-sale financial assets
825
Fiscal 2013(April 1, 2013 to March 31, 2014)
Other expenses
Gains on sale of available-for-sale financial assets
Gain on sale of non-current assets 6,577
11,003 16,213
Fiscal 2013(April 1, 2013 to March 31, 2014)
Donations and contributionsRestructuring expenses (Note 1)
Gains on revaluation of derivatives
Fiscal 2013(April 1, 2013 to March 31, 2014)
Others
Fair value remeasurements on contingent consideration
Foreign currency exchange losses
Fiscal 2014(April 1, 2014 to March 31, 2015)
Others
Government grants
Total
Dividend income
5,022
Others
(Note 1) Expenses from reorganizations, such as expenses incurred in the consolidation of sites and functions (including potential mergers and liquidations of subsidiaries) and reductions in the workforce in building an efficient operating model, are recorded as restructuring expenses.
Interest income
Total
Losses on valuation of derivatives
Interest expense
Fiscal 2014(April 1, 2014 to March 31, 2015)
(Note 2) The Company and its subsidiaries in the U.S. ("Takeda") have reached an agreement expected to resolve the vast majority of ACTOS product liability lawsuits pending in the U.S. against Takeda. Accordingly, Takeda recognized a provision of $2.7 billion (324.1 billion yen) for covering the settlement and other related expenses. Takeda also recognized an insurance receivable of 50.0 billion yen as other financial assets which is anticipated to be covered by product liability insurance. The net amount was booked as other operating expense.
18

8
1) Deferred tax assets and liabilities reported in the consolidated statement of financial positionMillions of yen
208,424 154,506280,595 156,132(72,170) (1,626)
2) The major items and changes in deferred tax assets and liabilitiesMillions of yen
As of April 1,2013
Recognized inprofit or loss
Recognized inother
comprehensiveincome
Acquisitionsthrough
businesscombinations
OthersAs of March
31, 2014
113,579 16,264 - - - 129,844Inventories 25,037 1,271 - - 1,790 28,099
(49,350) 2,580 - - (1,094) (47,864)Intangible assets (276,038) 28,895 - (4,059) (35,574) (286,776)
(39,189) 3,735 2,591 - 22 (32,841)Accrued expenses and provisions 58,664 (2,978) - - 4,162 59,848Post-employment benefit plans 695 (434) (4,771) - 1,351 (3,160)Deferred income 9,731 (693) - - 119 9,157Unused tax losses 18,528 (4,561) - - 2,711 16,677Tax credits 36,058 9,708 - - 286 46,052
Others 23,337 (4,246) 1,033 - 1,693 21,817Total (92,429) 50,079 (1,147) (4,059) (24,614) (72,170)
Millions of yen
As of March31, 2014
Recognized inprofit or loss
Recognized inother
comprehensiveincome
Acquisitionsthrough
businesscombinations
OthersAs of March
31, 2015
129,844 (52,537) - - - 77,307Inventories 28,099 3,369 - - (1,144) 30,324
(47,864) (1,149) - - 1,927 (47,086)Intangible assets (286,776) 38,933 - - 20,181 (227,663)
(32,841) 288 (1,213) - 544 (33,222)Accrued expenses and provisions 59,848 106,249 - - (508) 165,589Post-employment benefit plans (3,160) 3,461 966 - 1,417 2,684Deferred income 9,157 (3,120) - - (12) 6,026Unused tax losses 16,677 2,634 - - (2) 19,309Tax credits 46,052 (40,125) - - (94) 5,833
Others 21,817 (10,032) 427 - (2,149) 10,063Total (72,170) 50,205 179 - 20,160 (1,626)
3) The unused tax losses and deductible temporary differences for which deferred tax assets were not recognized Millions of yen
142,039 113,26211,571 2,629
-
Research and development expenses
539
-
Deferred tax assets
Unused tax losses (Note)
2,234
Fiscal 2013(As of March 31, 2014)
Fiscal 2014(As of March 31, 2015)
Deductible temporary differences
Undistributed profits of overseas subsidiaries and associates
(13,481)
-Undistributed profits of overseas subsidiaries and associates
Net totalDeferred tax liabilities
(13,023)
The Companies consider the probability that a portion of or all of the future deductible temporary differences or unused tax losses canbe utilized against future taxable profits on recognition of deferred tax assets. In assessing the recoverability of deferred tax assets,the Companies consider the scheduled reversal of deferred tax liabilities, projected future taxable profits and tax planning strategies.Based on the level of historical taxable profits and projected future taxable profits during the periods in which the temporarydifferences become deductible, the Companies determined that it is probable that the tax benefits can be utilized.
-
Income Taxes(1) Deferred Taxes
Fiscal 2013(As of March 31, 2014)
Fiscal 2014(As of March 31, 2015)
(10,789)
Available-for-sale financial assets
Research and development expenses
-
Property, plant and equipment
Available-for-sale financial assets
Property, plant and equipment
(80) (13,023)
19

(Note) Expiry schedule of the unused tax losses for which deferred tax assets were not recognizedMillions of yen
310 908521 447371 465540 593
4,886 240135,412 110,608142,039 113,262
Millions of yen
99,372 47,802(50,079) (50,205)
49,292 (2,403)
(Unit:%)
38.0 35.67.2 (4.9)
(3.1) (28.8)(18.7) 11.0
1.5 (7.0)
7.2 (7.9)(0.4) 2.631.0 1.7
3rd year
Effect of changes in applicable tax rates
Total
Fiscal 2013(April 1, 2013 to March 31, 2014)
Fiscal 2014(April 1, 2014 to March 31, 2015)
Fiscal 2013(April 1, 2013 toMarch 31, 2014)
Fiscal 2014(April 1, 2014 toMarch 31, 2015)
(0.2)
Deferred tax expenses include the benefits arising from previously unused tax losses, tax credits and temporary differences of priorperiods. These effects decreased deferred tax expenses by 7,276 million yen and 2,737 million yen for the years ended March 31,2014 and 2015, respectively.
Effective tax rate
Statutory tax rateNon-deductible expenses for tax purposes
(0.3) 1.1
Fiscal 2013(As of March 31, 2014)
Total
5th year
Changes in tax effects of undistributed profit of overseas subsidiaries
4th year
Adjustments from the statutory tax rate to the effective tax rate are set forth below. The effective tax rate represents the ratio ofincome taxes to profit before tax.
Deferred tax expenses
-
1st year2nd year
After 5th year
4) Taxable temporary differences for which deferred tax liabilities were not recognizedNo deferred tax liability is recognized in respect to these differences if the Company is in a position to control the timing of the reversalof the temporary differences and it is probable that such differences will not reverse in the foreseeable future. The aggregate amountsof temporary differences associated with investments in subsidiaries and associates for which deferred tax liabilities were notrecognized were 130,448 million yen and 191,218 million yen as of March 31, 2014 and 2015, respectively.
The major components of Income tax expenses for each fiscal year are as follows:
Current tax expenses include the benefits arising from previously unused tax losses, tax credits and temporary differences of priorperiods. These effects decreased current tax expenses by 1,362 million yen and 21 million yen for the years ended March 31, 2014and 2015, respectively.
According to the promulgation of “The Act for Partial Amendment of the Income Tax Act, etc.”(Act No. 9 of 2015) and “The Act forPartial Amendment of the Local Tax Act, etc.”(Act No. 2 of 2015) on March 31, 2015, the statutory tax rate which the Company usedfor calculation of deferred tax assets and deferred tax liabilities has been changed from 35.6% in the previous fiscal year to 33.0% forthose which are expected to be recovered or paid from April 1, 2015 to March 31, 2016 and to 32.2% for those which are expected tobe recovered or paid on and after April 1, 2016.As a result of this change, deferred tax assets (after offsetting deferred tax liabilities) and changes in fair value of cash flow hedgesthat are recognized in the consolidated statement of operations and other comprehensive income decreased by 7,452 million yen and47 million yen, respectively, while deferred tax expenses, net changes on revaluation of available-for-sale financial assets, andremeasurements of defined benefit plans increased by 11,250 million yen, 2,829 million yen and 1,016 respectively.
Fiscal 2014(As of March 31, 2015)
(2) Income Tax Expenses
Current tax expenses
Tax creditsDifferences in applicable tax rates of subsidiaries
Changes in unrecognized deferred tax assets
Others
Tax effects from advance pricing agreements for transfer pricing taxation
According to the promulgation of “The Act for Partial Amendment of the Income Tax Act, etc.”(Act No. 10 of 2014) on March 31,2014, the special corporate tax for reconstruction was not imposed from the fiscal year started April 1, 2014. By this promulgation,the statutory tax rate of the Company and the domestic subsidiaries for the year ended March 31, 2015 has been changed from38.0% to 35.6%.
20

9
875 -
135.10 (185.37)134.95 (185.37)
10
Millions of yen
230,774 (47,559)- -
230,774 (47,559)- -
34,093 25,123(40,473) (8,869)(6,380) 16,253
2,591 (1,213)
22,775 55,912(25,522) (57,113)(2,747) (1,201)
1,033 427(1,714) (774)
13,607 (5,499)(4,771) 966
234,107 (37,826)
Fiscal 2014(April 1, 2014 toMarch 31, 2015)
(47,559)
15,040
Before tax effects
Amounts arising during the year
786,391
Reclassification adjustments to profit or lossBefore tax effects
Remeasurements of defined benefit plansTax effects
Remeasurements of defined benefit plans(Note 4)
(Note 3) Cash flow hedges represent the effective portion of changes in the fair value of derivatives designated and qualifying as cash flow hedges.
Fiscal 2014(April 1, 2014 toMarch 31, 2015)
106,658
-
Tax effects
Amounts arising during the year
Net changes on revaluation of available-for-salefinancial assetsCash flow hedges (Note 3)
Total other comprehensive income
790,340
(4,532)8,836
Fiscal 2013(April 1, 2013 toMarch 31, 2014)
Reclassification adjustments to profit or loss
Tax effects
Net changes on revaluation of available-for-salefinancial assets (Note 2)
Amounts arising during the yearReclassification adjustments to profit or loss
Cash flow hedges
(Note 1) Exchange differences on translating foreign operations consist of differences on foreign currency translation for financial statements of foreign operations to the presentation currency.
Tax effects
The basis for calculating basic and diluted earnings per share (attributable to ordinary shareholders) for the years ended March 31,2014 and March 31, 2015 is as follows:
Exchange differences on translation of foreignoperations (Note 1)
Exchange differences on translating foreignoperations
230,774
(3,789)
Amounts arising during the year
Weighted average number of shares during the year (thousands of shares) [basic]
(Note 4) Remeasurements of defined benefit plans consist of (1) actuarial gains and losses resulting from increases or decreases in the present value of the defined benefit obligation because of changes in actuarial assumptions and experience adjustments and (2) the return on plan assets, excluding the amounts included in net interest on the net defined benefit liability (asset).
Dilutive effect (thousands of shares)
Net profit for the year attributable to ordinaryshareholders of the Company
Weighted average number of shares during the year (thousands of shares) [diluted]
Net profit (loss) attributable to owners of the Company (millions of yen)Net profit not attributable to ordinary shareholders of the Company (millions of yen)
Basic (yen)
Other Comprehensive IncomeAmounts arising during the year, reclassification adjustments to profit or loss and tax effects for each component of othercomprehensive income are as follows:
Net profit (loss) used for calculation of earnings per share (millions of yen)
The number of shares that do not have dilutive effects and were not included in the calculation of diluted earnings per share were1,133 thousand shares and 7,820 thousand shares as of March 31, 2014 and 2015, respectively.
Diluted (yen)
Earnings Per Share
106,658
789,465
Fiscal 2013(April 1, 2013 toMarch 31, 2014)
(145,775)
-
(145,775)
786,391
Earnings (loss) per share
Before tax effects
(Note 2) Net changes on revaluation of available-for-sale financial assets represent the changes in fair value on available-for-sale financial assets at the end of each reporting period.
21

11
1) Acquisition costMillions of yen
Buildingsand
structures
Machineryand vehicles
Tools,furniture
and fixturesLand Construction
in progressTotal
495,884 397,690 113,632 82,263 19,497 1,108,9675,808 11,003 7,503 666 18,924 43,903
9 148 25 - - 1825,892 11,485 1,904 92 (19,815) (442)
(7,300) (7,479) (1,800) (1,882) - (18,461)(624) - - (75) - (699)
12,418 11,221 3,229 1,773 1,163 29,8051,128 (174) 413 (97) 3,158 4,429
513,215 423,895 124,907 82,739 22,926 1,167,6836,745 13,522 6,952 1,379 25,060 53,659
- - - - - -6,274 10,197 2,680 233 (19,416) (33)
(12,139) (13,137) (3,241) (32) - (28,548)(7,108) (17,905) (1,434) (1,213) (70) (27,731)
(698) (4,891) 620 (511) (261) (5,740)352 17,435 178 (239) 58 17,785
506,642 429,117 130,663 82,355 28,298 1,177,076
2) Accumulated depreciation and accumulated impairment lossesMillions of yen
Buildingsand
structures
Machineryand vehicles
Tools,furniture
and fixturesLand Construction
in progressTotal
(197,316) (277,337) (86,641) (862) - (562,156)(19,614) (28,295) (11,428) - - (59,337)(1,289) (1,072) (8) (1,135) - (3,503)
Transfers 575 - - - - 575Disposals 4,521 6,970 1,217 629 - 13,337
133 - - - - 133(4,493) (7,392) (2,408) (106) - (14,399)
156 (27) (214) 6 - (80)(217,327) (307,152) (99,482) (1,469) - (625,430)(20,727) (26,821) (11,150) - - (58,698)
(400) (548) (4) (4) - (956)Transfers 10 - - - - 10Disposals 10,756 12,686 2,789 - - 26,231
6,052 16,530 1,278 156 - 24,016(746) 2,498 (188) 28 - 1,593
243 (17,375) (685) 138 - (17,678)(222,139) (320,182) (107,442) (1,150) - (650,913)
Transfers
As of April 1, 2013
Property, Plant and Equipment
Acquisitions through business combinations
Foreign currency translation differences
Reclassification to assets held for sale
As of March 31, 2015
As of April 1, 2013Depreciation expenses
Foreign currency translation differences
Disposals
Others
As of March 31, 2014
(1) The Changes in Acquisition Cost, Accumulated Depreciation and Accumulated Impairment Losses and the Carrying Amount byCategory
Additions
Reclassification to assets held for sale
Disposals
As of March 31, 2014
Impairment loss
AdditionsAcquisitions through business combinations
Transfers
Others
Others
Depreciation expenses
As of March 31, 2015
Reclassification to assets held for sale
Foreign currency translation differences
Reclassification to assets held for sale
Impairment loss
Foreign currency translation differencesOthers
22

3) Carrying amountMillions of yen
Buildingsand
structures
Machineryand vehicles
Tools,furniture
and fixturesLand Construction
in progressTotal
298,569 120,353 26,991 81,401 19,497 546,811295,888 116,743 25,425 81,270 22,926 542,253284,503 108,935 23,222 81,205 28,298 526,162
Millions of yen
11,316 3,70310,517 3,28012,476 4,443
12
1) Acquisition costMillions of yen
714,024 814,6714,548 -
96,099 7,240814,671 821,911
2) Accumulated impairment lossesMillions of yen
- -- -- -- -
3) Carrying amountMillions of yen
714,024814,671821,911
Impairment loss was recognized in the consolidated statement of operations for the year ended March 31, 2015. Of the totalimpairment loss of 956 million yen, 777 million yen was included in "Cost of sales", 124 million yen was included in “Selling, generaland administrative expenses” and 55 million yen was included in "Research and development expenses", respectively. The assets forwhich impairment loss was recognized were "Land", "Buildings and structures" and "Machinery and vehicles" in the Ethical Drugssegment, and the recoverable amount of the major assets was 1,409 million yen. The carrying amounts of these assets were reducedto the recoverable amounts due to the significant decline in expected profitability. Those recoverable amounts were measured at thefair value less costs of disposal by using values such as expected sales amounts. This fair value is classified as Level 3 in the fairvalue hierarchy.The definition of the fair value hierarchy is stated in Note 28, "Financial Instruments".
As of April 1, 2013
(4) Pledged Assets
Balance at the end of the fiscal year
Balance at the beginning of the fiscal year
The carrying amount of property, plant and equipment pledged as collateral for a bank loan was 1,889 million yen and 2,129 millionyen as of March 31, 2014 and 2015, respectively.
(1) The Changes in Acquisition Cost and Accumulated Impairment Loss and the Carrying Amount
The amount of contractual commitments for the acquisition of property, plant and equipment was 1,843 million yen and 27,983 millionyen as of March 31, 2014 and 2015, respectively.
(5) Commitments
Goodwill
(2) Assets Held Under Finance Leases
Machinery and vehicles
The carrying amounts of assets held under finance leases included in property, plant and equipment are as follows:
Buildings and structuresAs of April 1, 2013
As of March 31, 2014
As of March 31, 2014
Fiscal 2014(April 1, 2014 toMarch 31, 2015)
Impairment loss was recognized in the consolidated statement of operations for the year ended March 31, 2014. Of the totalimpairment loss of 3,503 million yen, 2,762 million yen was included in "Cost of sales", 457 million yen was included in “Selling,general and administrative expenses” and 285 million yen was included in "Research and development expenses", respectively. Theassets for which impairment loss was recognized were "Land", "Buildings and structures" and "Machinery and vehicles" in the EthicalDrugs segment and Other segment, and the recoverable amount of the major assets was 3,209 million yen. The carrying amounts ofthese assets were reduced to the recoverable amounts due to the significant decline in expected profitability. Those recoverableamounts were measured at the fair value less costs of disposal by using values such as expected sales amounts. This fair value isclassified as Level 3 in the fair value hierarchy.
Balance at the end of the fiscal year
As of March 31, 2014
Acquisitions through business combinationsForeign currency translation differences
As of March 31, 2015
As of April 1, 2013
As of March 31, 2015
Impairment lossesForeign currency translation differences
As of March 31, 2015
Balance at the beginning of the fiscal year
(3) Impairment Loss
Fiscal 2013(April 1, 2013 toMarch 31, 2014)
Fiscal 2013(April 1, 2013 toMarch 31, 2014)
Fiscal 2014(April 1, 2014 toMarch 31, 2015)
23

Millions of yen
814,671 821,911
13
1) Acquisition costMillions of yen
Software
Intangibleassets
associatedwith products
Others Total
42,081 1,549,499 22,816 1,614,3958,680 29,021 3,897 41,598
- 13,864 - 13,864(3,065) (1,137) (64) (4,266)
3,903 187,704 388 191,99651,598 1,778,951 27,037 1,857,5867,212 25,606 15,076 47,894
- - - -(6,994) (36,097) (24) (43,116)
4,992 8,684 1,837 15,51356,808 1,777,143 43,926 1,877,877
Cash-generating unit group (Note)Fiscal 2013
(As of March 31, 2014)
Additions
Fiscal 2014(As of March 31, 2015)
Foreign currency translation differencesAs of March 31, 2015
The value in use substantially exceeds the relevant carrying amount in all cash-generating groups, and management considers that itis not likely that a significant impairment loss would be recognized even if the growth rate and discount rate used in the calculationfluctuated within a reasonable range.
As of April 1, 2013
(1) The Changes in Acquisition Cost, Accumulated Amortization and Accumulated Impairment Loss and the Carrying Amount byCategory
The value in use is calculated by discounting the estimated future cash flows based on a three-year projection approved bymanagement and an applied growth rate. The applied growth rate was determined by considering the long-term average growth rateof the market or country to which the cash-generating unit group belongs (Fiscal 2013: 2.2%-3.5%, Fiscal 2014: 1.9%-2.7%).The discount rates (post-tax) were calculated based on the weighted average cost of capital in the markets or countries to which eachcash-generating unit group belongs (Fiscal 2013: 4.9%-9.5%, Fiscal 2014: 5.0%-8.1%).
Intangible Assets
438,084
Disposals
Disposals
Acquisitions through business combinations
Acquisitions through business combinations
- overseas sales excluding U.S. sales
(2) Impairment Testing for Goodwill
Ethical drugs
Foreign currency translation differencesAs of March 31, 2014Additions
(Note) "Ethical drugs" consists of a number of cash-generating units (groups of units) in addition to the groups presented in the above table.
499,498
Impairment loss for goodwill is recognized if the recoverable amount of goodwill is less than the carrying amount. When recognized,the carrying amount is reduced to the recoverable amount. The recoverable amount is measured at its value in use. As a result ofimpairment testing for the years ended March 31, 2014 and 2015, the Companies did not recognize any impairment loss for goodwillbecause the recoverable amount of each cash-generating unit group exceeded the carrying amount.
The carrying amounts of significant goodwill allocated to the following cash-generating unit groups for each fiscal year are as follows:
24

2) Accumulated amortization and accumulated impairment lossesMillions of yen
Software
Intangibleassets
associatedwith products
Others Total
(26,465) (479,741) (12,383) (518,589)(6,300) (120,108) (1,507) (127,915)
- (23,093) - (23,093)2,310 1,073 39 3,423
(3,733) (51,819) (262) (55,814)(34,188) (673,688) (14,113) (721,989)(7,439) (123,221) (2,229) (132,889)
- (67,481) - (67,481)- 4,028 - 4,028
5,807 33,767 24 39,599(3,546) (53,747) (2,471) (59,764)
(39,366) (880,341) (18,789) (938,496)
3) Carrying amountMillions of yen
Software
Intangibleassets
associatedwith products
Others Total
15,615 1,069,758 10,433 1,095,80617,411 1,105,263 12,924 1,135,59717,442 896,802 25,138 939,381
Reversal of impairment loss
The impairment losses that the Companies recognized for the year ended March 31, 2015 were 67,481 million yen.The amounts recognized in the consolidated statement of operations as "Amortization and impairment losses on intangible assetsassociated with products" were 53,181 million yen due to a significant decline in expected profitability, and the recoverable amountswere 119,006 million yen. Also, the amounts recognized as "Research and development expenses" were 14,300 million yen due to adecision to discontinue development activities and significant decline in expected profitability, and the recoverable amounts were1,103 million yen.The losses were recognized in the Ethical Drugs segment. In addition, the Companies recognized the reversal of impairment lossesas "Other operating income" due to the revaluation of product impaired in prior periods, and the amount was 4,028 million yen.
(2) Significant Intangible Assets
(3) Impairment Loss
Foreign currency translation differences
The impairment loss that the Companies recognized for the year ended March 31, 2014 was 23,093 million yen due to a significantdecline in expected profitability and was recognized in the consolidated statement of operations as "Amortization and impairmentlosses on intangible assets associated with products", and the recoverable amount was 47,983 million yen. The losses wererecognized in the Ethical Drugs segment.
The remaining amortization period is 7-12 years as of March 31, 2015 for the assets acquired through the acquisition of Nycomedand three years for the assets acquired through the acquisition of Millennium.
(4) Commitments
As of March 31, 2015
As of April 1, 2013
As of March 31, 2015
Impairment loss
As of April 1, 2013
Undiscounted commitments for the acquisition of intangible assets were 183,804 million yen and 221,001 million yen as of March 31,2014 and 2015, respectively. These commitments mainly include development milestone payments in relation to pipelines underdevelopment and expected maximum commercial milestone payments in relation to launched products. As for the pipelines underdevelopment, the possibility of launch is uncertain and the related commercial payments were not included in the commitments.
Disposals
Amortization
Foreign currency translation differencesDisposals
As of March 31, 2014
Impairment loss
As of March 31, 2014
Intangible assets associated with products such as Pantoprazole acquired through the acquisition of Nycomed were recognized inthe consolidated statement of financial position. The carrying amount was 629,854 million yen, 671,309 million yen and 512,212million yen as of April 1, 2013, March 31, 2014 and March 31, 2015, respectively. Also, intangible assets associated with productssuch as Velcade acquired through the acquisition of Millennium were recognized in the consolidated statement of financial position.The carrying amount was 199,474 million yen, 169,101 million yen and 141,833 million yen as of April 1, 2013, March 31, 2014 andMarch 31, 2015, respectively.
Amortization
Impairment loss was calculated by deducting the recoverable amount from the carrying amount. The recoverable amount wasmeasured based mainly on the value in use, and the discount rates used for the calculation (post-tax) were from 7.7% to 9.0% andfrom 7.0% to 15.0% for the years ended March 31, 2014 and 2015, respectively. A part of the recoverable amount was measured atthe fair value less cost of disposal (the amount that was expected to be received by selling the assets). This fair value is classified asLevel 3 in the fair value hierarchy. The definition of the fair value hierarchy is stated in Note 28, "Financial Instruments".
There were no material internally generated intangible assets at the end of each reporting period.
25
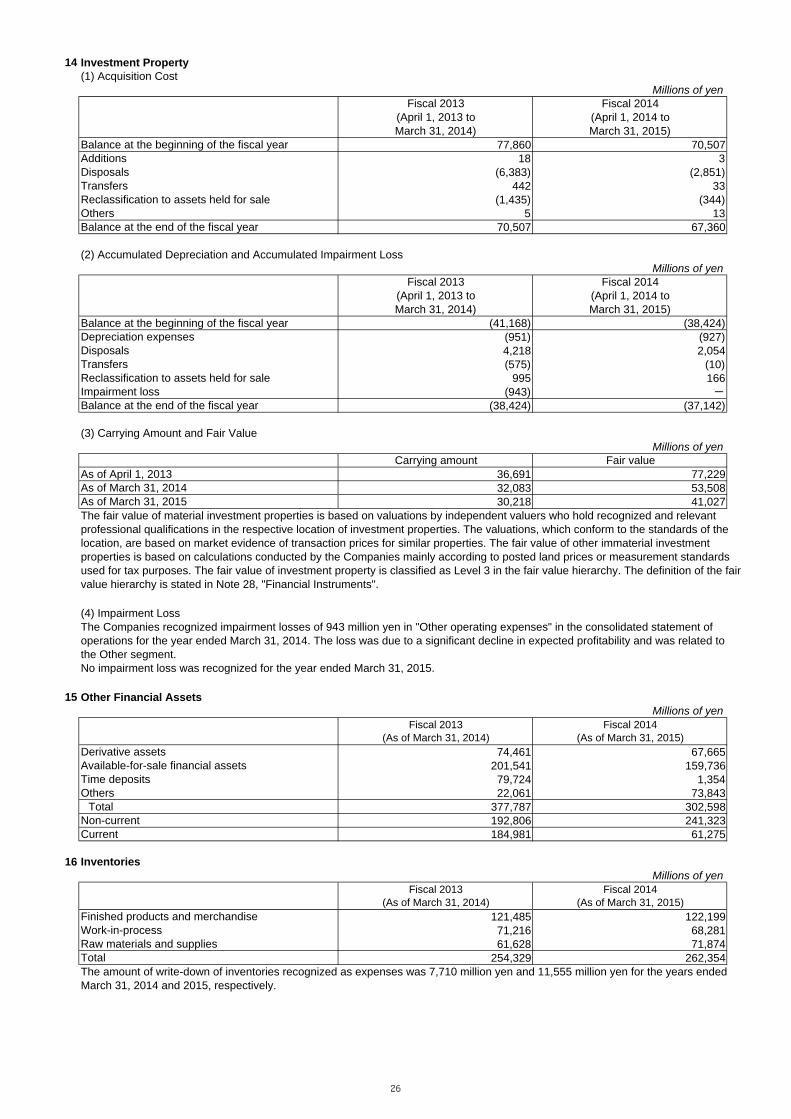
14(1) Acquisition Cost
Millions of yen
77,860 70,50718 3
(6,383) (2,851)442 33
(1,435) (344)5 13
70,507 67,360
(2) Accumulated Depreciation and Accumulated Impairment LossMillions of yen
(41,168) (38,424)(951) (927)4,218 2,054(575) (10)
995 166(943) -
(38,424) (37,142)
(3) Carrying Amount and Fair ValueMillions of yen
36,691 77,22932,083 53,50830,218 41,027
15Millions of yen
74,461 67,665201,541 159,73679,724 1,35422,061 73,843
377,787 302,598192,806 241,323184,981 61,275
16Millions of yen
121,485 122,19971,216 68,28161,628 71,874
254,329 262,354
Impairment loss
Additions
Raw materials and supplies
(4) Impairment LossThe Companies recognized impairment losses of 943 million yen in "Other operating expenses" in the consolidated statement ofoperations for the year ended March 31, 2014. The loss was due to a significant decline in expected profitability and was related tothe Other segment.No impairment loss was recognized for the year ended March 31, 2015.
TransfersDisposals
Carrying amount Fair value
Fiscal 2013(April 1, 2013 toMarch 31, 2014)
Balance at the beginning of the fiscal year
Balance at the end of the fiscal year
Balance at the end of the fiscal year
Transfers
Others
Depreciation expenses
Investment Property
Disposals
Reclassification to assets held for sale
Fiscal 2013(April 1, 2013 toMarch 31, 2014)
Others
Work-in-process
Non-current
As of March 31, 2014
The amount of write-down of inventories recognized as expenses was 7,710 million yen and 11,555 million yen for the years endedMarch 31, 2014 and 2015, respectively.
Finished products and merchandise
Available-for-sale financial assets
Total
Fiscal 2014(April 1, 2014 toMarch 31, 2015)
Fiscal 2014(April 1, 2014 toMarch 31, 2015)
Derivative assets
Reclassification to assets held for sale
Time deposits
Total
Current
As of March 31, 2015
Balance at the beginning of the fiscal year
The fair value of material investment properties is based on valuations by independent valuers who hold recognized and relevantprofessional qualifications in the respective location of investment properties. The valuations, which conform to the standards of thelocation, are based on market evidence of transaction prices for similar properties. The fair value of other immaterial investmentproperties is based on calculations conducted by the Companies mainly according to posted land prices or measurement standardsused for tax purposes. The fair value of investment property is classified as Level 3 in the fair value hierarchy. The definition of the fairvalue hierarchy is stated in Note 28, "Financial Instruments".
As of April 1, 2013
Other Financial Assets
Fiscal 2013(As of March 31, 2014)
Fiscal 2014(As of March 31, 2015)
Fiscal 2013(As of March 31, 2014)
Fiscal 2014(As of March 31, 2015)
Inventories
26

17Millions of yen
380,370 404,08054,680 43,835(4,430) (3,234)
430,620 444,681
18Millions of yen
353,178 461,006312,870 191,141666,048 652,148
19
(1) Assets Held for Sale Millions of yen
393 237612 597
1,005 834
(2) Disposal Groups Held for Sale Millions of yen
- 3,958
- 3,527
- 3,096
- 1,218
- 978
- 631
- 13,408
- 2,480
- 1,928
- 481
- 957
- 5,846
Provisions
Other financial assets
The disposal groups held for sale as of March 31, 2015 consisted of a group of assets and liabilities of Mizusawa IndustrialChemicals, Ltd. and its subsidiaries ("Mizusawa Group") which was related to the Other segment and reclassified as held for salebased on management's decision to sell all of the Company's shares in Mizusawa Industrial Chemicals, Ltd.The assets and liabilities of the Mizusawa Group were measured at book value as the fair value less costs to sell exceeded thecarrying amount.
Trade receivables
Inventories
Others
Total assets
Loans
The assets held for sale as of March 31, 2015 were also reclassified from land and buildings based on management's decision to sellcertain assets in Germany and Japan related to the Ethical Drug segment. The decision to sell the assets in Germany was made inconnection with the restructuring in Europe. The assets in Japan were unused real estate.
Property, plant and equipment
Cash and cash equivalents
Trade and other payables
Total
Buildings and structuresTotal
The fair value of assets is based on valuations by independent valuers who hold recognized and relevant professional qualifications inthe respective location of assets held for sale. The valuations, which conform to the standards of the location, are based on marketevidence of transaction prices for similar assets. The fair value of assets held for sale is classified as Level 3 in the fair valuehierarchy. The definition of the fair value hierarchy is stated in Note 28, "Financial Instruments".
Cash and deposits
The assets held for sale as of March 31, 2014 were reclassified from land and buildings based on management's decision to sellcertain assets in Germany and Japan. The decision to sell the assets in Germany was made in connection with the restructuring inEurope and was related to the Ethical Drug segment, while the assets in Japan were related to the Other segment. In connection withthe reclassification, the Companies recognized impairment loss of 247 million yen on investment property related to the Othersegment in "Other operating expenses" in the consolidated statement of operations for the year ended March 31, 2014.
Land
Short-term investments
Trade and Other Receivables
Cash and Cash Equivalents
Fiscal 2013(As of March 31, 2014)
Fiscal 2014(As of March 31, 2015)
Trade and other receivables
Others
Total liabilities
Other receivablesAllowance for doubtful receivablesTotal
Fiscal 2013(As of March 31, 2014)
Fiscal 2014(As of March 31, 2015)
Fiscal 2013(As of March 31, 2014)
Fiscal 2014(As of March 31, 2015)
Fiscal 2013(As of March 31, 2014)
Fiscal 2014(As of March 31, 2015)
Assets and Disposal Groups Held for Sale
27

20Millions of yen
Averageinterest rate
(%)(Note 1)
Due
154,115 69,965 0.4 -
63 30,000 0.4 -
1,226 - - -
859,984 729,380 - -
704,580 629,416 - -
155,404 99,965 - -
Millions of yen
Name ofbond
Date ofissuance
Fiscal 2013(As of
March 31,2014)
Fiscal 2014(As of
March 31,2015)
Interest rate(%)
CollateralDate ofmaturity
11thUnsecured
straightbonds
March 22,2012
69,929 69,965 0.4 -March 22,
2016
12thUnsecured
straightbonds
March 22,2012
59,915 59,943 0.4 -March 22,
2017
13thUnsecured
straightbonds
March 22,2012
59,893 59,920 0.5 -March 22,
2018
U.S. dollarunsecured
senior notes(Due in2015)
July 17,2012
154,115[US$1.5
billion]- 1.0 -
March 17,2015
U.S. dollarunsecured
senior notes(Due in2017)
July 17,2012
153,877[US$1.5
billion]
179,788[US$1.5
billion]1.6 -
March 17,2017
- - 617,444 489,380 - - -
Takeda Pharmaceutical Company Limited
Takeda Pharmaceutical Company Limited
Total
Company name
(*) The U.S. dollar unsecured senior notes were issued in overseas markets and are presented in [U.S. dollar amounts]. The amount for the redemption of and interest on these foreign currency notes was fixed in Japanese yen based on currency swaps at the time of issuance.
Takeda Pharmaceutical Company Limited
Takeda Pharmaceutical Company Limited
Takeda Pharmaceutical Company Limited (*)
Takeda Pharmaceutical Company Limited (*)
July 19,2019
59,867
1.0
0.6March 2018 -
July 2020
Takeda Pharmaceutical Company Limited
15thUnsecured
straightbonds
Current
March 2017 -July 2020
Bonds (excluding current portion of bonds)(Note 2)
241,250
Short-term loans
Current portion of bonds (Note 2)
0.5
463,330 419,416
59,892
Non-current
Long-term loans (excluding current portion of long-term loans)
(Note 2) A summary of the terms of bonds is as follows:
-July 17,
20200.7
Bonds and Loans
July 19,2013
-
Total
(Note 1) "Average interest rate" represents the weighted average rate on the balance as of March 31, 2015, except for that of loans to which the Company applies hedge accounting through the use of interest rate swaps. The interest rate fixed by the interest rate swaps are used for such loans.
14thUnsecured
straightbonds
210,000
Current portion of long-term loans
July 19,2013
Fiscal 2014(As of March 31, 2015)
Fiscal 2013(As of March 31, 2014)
59,850 59,873
28

21Millions of yen
4,005 8,60717,470 19,446
44,095 13,000158,946 112,210110,129 70,10548,817 42,105
22
Millions of yen
Fiscal 2013(As of March
31, 2014)
Fiscal 2014(As of March
31, 2015)
Fiscal 2013(As of March
31, 2014)
Fiscal 2014(As of March
31, 2015)
3,645 4,078 2,871 3,28713,667 15,081 11,828 13,2403,319 3,253 2,770 2,918
20,631 22,412 17,470 19,4463,161 2,966
17,470 19,44614,598 16,1582,871 3,287
Millions of yen
9,031 9,37020,771 20,9969,795 5,853
39,598 36,219
Others
Other Financial Liabilities
Total
Between one and five years
71,158
Present value of minimumlease payments
Present value of minimum lease payments
Current
(2) Operating Lease Obligations
Current
Contingent consideration arising from business combinations
The schedule of future minimum lease payments under non-cancellable operating leases as of each fiscal year end is as follows:
Non-current
More than five years
Less: Future financial charges
Leases(1) Finance Lease Obligations
Lease payments recognized as expenses were 11,066 million yen and 11,880 million yen for the years ended March 31, 2014 and2015, respectively.
Within one year
Finance lease obligations
Fiscal 2013(As of March 31, 2014)
Fiscal 2014(As of March 31, 2015)
93,377
Non-current
The weighted average interest rates of the non-current and current finance lease obligations as of March 31, 2015 were 4.5% and3.5%, respectively.
Between one and five years
More than five yearsTotal
Derivative liabilities
Within one year
Total
Minimum lease payments
Fiscal 2013(As of March 31, 2014)
Fiscal 2014(As of March 31, 2015)
29

23
Consolidated statement of operationsMillions of yen
10,947 10,928
Consolidated statement of financial positionMillions of yen
309,312 325,859268,617 283,37776,497 91,68635,802 49,203
1) Defined benefit obligations
Millions of yen
293,748 309,3129,342 9,4974,926 5,040
(912) 1,695(11) 94
(17,751) (16,770)11,593 (5,313)
309,312 325,859
Millions of yen
(12,917) (14,205)14,171 16,026(5,461) (8,026)
6,168 8,905
Remeasurements of defined benefit plans
(Note) Net defined benefit assets were included in "Other non-current assets" on the consolidated statement of financial position, except for 177 million yen included in "Assets held for sale" in Fiscal 2014.
Balance at the beginning of the fiscal year
Balance at the end of the fiscal year
In this analysis, the other variables are assumed to be fixed.
Overseas
A 0.5% change in significant actuarial assumptions would affect the present value of defined benefit obligations by the amountsshown below:
Japan
Overseas
Increase by 0.5%Decrease by 0.5%Increase by 0.5%Decrease by 0.5%
Fiscal 2013(As of March 31, 2014)
Fiscal 2014(As of March 31, 2015)
Discount rate1.0%
1.7%
Fiscal 2013(April 1, 2013 toMarch 31, 2014)
Fiscal 2014(April 1, 2014 toMarch 31, 2015)
(1,064)
Past service costs
Net amount of liabilities and assets recognized in the consolidated statement of financial position
Current service costs
Actuarial gains and losses arising from changes in demographic assumptions
(1) Defined Benefit Plans
Net defined benefit assets (Note)
Benefits paidForeign currency translation differences
(i) Changes in present value
Interest expenses
1.1%
3.2%
Discount rate
The benefits under defined benefit plans are provided based on years of service, compensation at the time of retirement and otherfactors. Contributions to the defined benefit plans are based on a number of factors including the tax deductibility of contributions,funding status of plan assets, actuarial calculations and other considerations. The amounts recognized in the consolidated statementof operations and the consolidated statement of financial position are as follows:
Present value of defined benefit obligations
The remaining weighted average duration of the defined benefit obligations were 12.7 years and 14.4 years as of March 31, 2014 and2015, respectively.
Experience adjustments
Japan
(iii) Sensitivity analysis
Employee Benefits
8,672
(294) 23,369
(ii) Significant actuarial assumptions used to determine the present value
40,695
Fiscal 2013(As of March 31, 2014)
Fiscal 2014(As of March 31, 2015)
42,483
Fair value of plan assets
Fiscal 2013(As of March 31, 2014)
Fiscal 2014(As of March 31, 2015)
Actuarial gains and losses arising from changes in financial assumptions
Net defined benefit liabilities
Fiscal 2013(April 1, 2013 toMarch 31, 2014)
Fiscal 2014(April 1, 2014 toMarch 31, 2015)
Defined benefit costs
30

Millions of yen
250,407 268,6173,310 3,703
5,745 6,011(14,544) (13,607)
2,627 152268,617 283,377
Millions of yen
41,174 25,091 37,915 61,26526,475 73,566 27,931 54,99920,412 81,898 12,617 88,65188,061 180,555 78,462 204,915
Millions of yen
228,909 233,79865,017 64,51960,088 75,523
The amount of defined contribution costs was 13,512 million yen and 18,288 million yen for the years ended March 31, 2014 and2015, respectively. The above amounts include contributions to publicly provided plans.
No quotedprices in
activemarkets
Others
The pension funds are independent of the Companies and funded only by contributions from the Companies. The Companies'investment policies are designed to secure the necessary returns in the long-term within acceptable risk levels to ensure payments ofpension benefits to eligible participants, including future participants. The acceptable risk level in the return rate on the plan assets isderived from a detailed study considering the mid- to long-term trends and the changes in income such as contributions andpayments. Based on policies and studies, after consideration of issues such as the expected rate of return and risks, the Companiesformulate a basic asset mix which aims at an optimal portfolio on a long-term basis with the selection of appropriate investmentassets.
Benefits paidForeign currency translation differences
Interest income on plan assets
Fiscal 2013(As of March 31, 2014)
Fiscal 2013(April 1, 2013 toMarch 31, 2014)
Equities
Remeasurements of defined benefit plans
Total plan assets
(3) Other Employee Benefits Expenses
(ii) Breakdown of fair value by asset class
Others
Fiscal 2014(April 1, 2014 to March 31, 2015)
Salary
Fiscal 2013(April 1, 2013 to March 31, 2014)
Contributions by the employer
The return on plan assets, excluding amounts included in interest income on plan assets
Bonds
18,501
The employer contributions to plan assets expected to be paid for the year ending March 31, 2016 are 5,411 million yen.
(i) Changes in fair value
The above table does not include severance expenses. Severance expenses are included in "Other operating expenses" (Refer toNote 6, "Other Operating Income and Expenses").
Bonuses
Fiscal 2014(As of March 31, 2015)
With quotedprices in
activemarkets
2) Plan assets
No quotedprices in
activemarkets
Fiscal 2014(April 1, 2014 toMarch 31, 2015)
21,073
Balance at the end of the fiscal year
(2) Defined Contribution Plans
Major employee benefits expenses other than retirement benefits for each fiscal year are as follows:
With quotedprices in
activemarkets
Balance at the beginning of the fiscal year
31

24
Millions of yen
4,948 1,909 - 13,857 71,864 47,170 139,748165 - 324,056 10,526 200,890 35,844 571,480
(199) (303) - (9,798) (180,374) (35,802) (226,476)- - - (1,710) (24,761) (2,268) (28,738)
4,962 1,606 324,056 12,521 79,146 43,370 465,662
25Millions of yen
167,356 206,44329,530 64,62478,623 46,179
275,508 317,24739,555 78,778
235,953 238,469
26Millions of yen
129,345 124,36555,555 46,417
184,900 170,782
Foreign currency translation differences
48 - - (354) 11,527 (1,573) 9,647
Provision forsales
(Note 5)
(Note 1) Accrued expenses include liabilities related to employee benefits including accrued bonuses. The amount of the liabilities was 85,598 million yen and 121,643 million yen as of March 31, 2014 and 2015, respectively.
Total
(Note 2) Deferred income and revenue includes government grants for the purchase of property, plant and equipment. The amount of the grants was 23,698 million yen and 28,640 million yen as of March 31, 2014 and 2015, respectively. The major item in government grants was for the Company's investment for the development and production of new influenza vaccines. The grant is recognized as income on a systematic basis over the same accounting period in which depreciation expense for the related facility is recognized.
(Note 5) Provision for sales is related mainly to sales rebates and sales returns for products and merchandises and includes sales linked rebates such as government health programs in the U.S. These are expected to be paid out mainly within one year.
Trade payables
Non-current
Fiscal 2013(As of March 31, 2014)
Fiscal 2014(As of March 31, 2015)
Trade and Other Payables
Others
Other payables
Fiscal 2013(As of March 31, 2014)
Other Liabilities
Provision forSMON
compensation(Note 2)
(Note 4) Provision for restructuring is related to the reorganization announced officially in January 2012, including a consolidation of a number of sites and functions and the reduction of the workforce mainly in Europe and the U.S. Provision for restructuring is recognized when the Companies have a detailed formal plan for the restructuring and have raised a valid expectation in those affected people that it is certain that the Companies will carry out the restructuring. The timing of payments will be affected by future business plans.
Provision forrestructuring
(Note 4)
OthersTotal
(Note 1) Asset retirement obligations are related to expenses for removing asbestos used in buildings and manufacturing plants in Japan under the "Ordinance on Prevention of Asbestos Hazards" and expenses for the disposal of PCB waste in the relevant equipment in Japan under the "Act on Special Measures Concerning Promotion of Proper Treatment of PCB Wastes." These are expected to be paid out mainly after more than one year, but the timing will be affected by future business plans.
Provisions
(Note 2) Provision for SMON compensation is stated at an amount calculated in accordance with the Memorandum Regarding Settlements and the settlements entered into with the Nationwide Liaison Council of SMON Patients' Associations, etc., in September 1979 in order to prepare for the future costs of health care and nursing care with regard to the subjects of the settlements applicable to the Company at the end of the fiscal year.
Deferred income and revenue (Note 2)
Current
Accrued expenses (Note 1)
The breakdown and changes in "Provisions" for each fiscal year are as follows:
Total
As of April 1, 2014IncreasesDecreases (utilized)Decreases (reversed)
As of March 31, 2015
Assetretirementobligations
(Note 1)
Provision forACTOS
compensation(Note 3)
Fiscal 2014(As of March 31, 2015)
(Note 3) Provision for ACTOS compensation is stated at an amount estimated by the future settlement and other related losses regarding ACTOS product liability lawsuits in U.S. in order to prepare for the future payments and losses.
32

27
Thousands of shares
3,500,000 3,500,000
789,666 789,68115 243
789,681 789,924
Totaldividends
(millions ofyen)
Dividendsper share
(yen)
71,059 90.0071,060 90.00
71,060 90.0071,064 90.00
Totaldividends
(millions ofyen)
Dividendsper share
(yen)
28
1) Risk management policy(2) Financial Risk Management
The put options written on non-controlling interests by an overseas subsidiary are measured at present value and recognized as afinancial liability, while the same amount is deducted from share premium. The amount was 10,257 million yen and 11,312 million yenas of April 1 2013 and March 31, 2014, respectively. Since all the options were exercised, there were no options remaining as ofMarch 31, 2015.
March 31, 2013
Outstanding shares
At the end of the fiscal year
December 1, 2014
The number of treasury shares included in the above "Outstanding shares" was 206 thousand shares, 213 thousand shares and 4,032 thousand shares as of April 1, 2014, March 31, 2014 and 2015, respectively.
At the beginning of the fiscal year
June 27, 2013
Annual Shareholders Meeting (June 27, 2014)
Fiscal 2013(April 1, 2013 toMarch 31, 2014)
Resolution
Board of Directors (October 30, 2014)
Dividends declared for which the effective date falls in the following fiscal year are set forth below:
(2) Dividends Paid
The Companies promote risk management to reduce the financial risks arising in the process of business operations. The Companiesstrive to prevent the occurrence of the underlying causes of risk and to reduce the impact of risks that materialize. The Companiesuse derivative financial instruments only to hedge the risks described below based on the Companies' policy for which the extent ofuse of derivative financial instruments and standards for selecting correspondent financial institutions are determined.
Fiscal 2014(April 1, 2014 toMarch 31, 2015)
Authorized shares
Effective date
(1) The Number of Authorized Shares and Outstanding Shares
Annual Shareholders Meeting (June 26, 2013)
September 30, 2014
Financial Instruments
Equity and Other Equity Items
Fiscal 2014 (April 1, 2014 to March 31, 2015)
(Note) The shares issued by the Company are ordinary shares with no par value that have no restrictions on any rights.
Board of Directors (October 31, 2013) September 30, 2013
The fundamental principles of the Companies' capital risk management are to build and maintain a steady financial base for thepurpose of maintaining soundness and efficiency of operations and achieving sustainable growth. According to these principles, theCompanies conduct capital investment and profit distribution such as dividends and repayment of loans based on steady operatingcash flows through development and sale of competitive products.
Basis date
(1) Capital Management
March 31, 2014
Resolution Basis date Effective date
(3) Put Options Written on Non-controlling Interests
Annual Shareholders Meeting (June 26, 2015)
The fair value of put options is based on valuations by independent valuers and classified as Level 3 in the fair value hierarchy.Changes in the fair value are recognized in share premium. The definition of the fair value hierarchy is stated in Note 28, "FinancialInstruments".
June 29, 201590.00 March 31, 2015
December 2, 2013
Exercise of share options
June 30, 2014
Fiscal 2013 (April 1, 2013 to March 31, 2014)
The number of treasury shares as of March 31, 2015 includes 3,812 thousand shares held by the Employee Stock Ownership Plan ("ESOP") Trust and the Board Incentive Plan ("BIP") Trust. The ESOP and BIP Trust acquired 3,813 thousand shares and sold one thousand shares during the year ended March 31, 2015.
In the above table, total dividends approved by the Board of Directors on October 30, 2014 included dividends of 343 million yen paidto the treasury shares held by the ESOP and BIP Trust.
In the above table, total dividends approved at the Annual Shareholders Meeting held on June 26, 2015 include dividends of 343million yen paid to the treasury shares held by the ESOP and BIP Trust.
71,081
33

Millions of yen
Cash and cash equivalents 666,048 652,148
532,405 519,877201,541 159,736
Millions of yen
3,055 2,989
1) Credit risk management
Millions of yen
Within 30days
Over 30days butwithin 60
days
Over 60days butwithin 90
days
Over 90days but
within oneyear
Over oneyear
30,680 11,091 4,569 5,947 7,284 1,78915,006 5,190 3,037 1,163 3,373 2,243
The amounts in the above table are net of allowances for doubtful receivables.
Amount past due
Loans and receivables
Fiscal 2013(As of March 31, 2014)
For derivatives, the Companies enter into the trading contracts only with highly rated financial agencies in order to minimizecounterparty risk. If necessary, the Companies obtain rights to collateral or guarantees on the receivables.
Fiscal 2014(As of March 31, 2015)
1,808 4,852
62,814
(3) Credit Risk
71,158
Cash reserves of the subsidiaries are concentrated mostly with the Company and regional treasury centers located in the UnitedStates and Europe through the group cash pooling system. These cash reserves are invested exclusively in highly rated short-termbank deposits and bonds of highly rated issuers, etc., within the investment limits determined by taking into consideration investmentratings and terms under the Companies’ policies for fund management and, therefore, have limited credit risk. Cash reserves otherthan those subject to the group cash pooling system are managed by each consolidated subsidiary in accordance with the Company’s management policies.
Fiscal 2013(As of March 31, 2014)
Fiscal 2014(As of March 31, 2015)
As of March 31, 2015
Financial liabilities at fair value through profit or loss (derivatives)
Financial instruments possessed by the Companies are exposed to various risks such as customer credit risk, liquidity risk andmarket risks caused by changes in the market environment such as fluctuations in the preice of foreign currency, interest rates riskand market prices.
93,377
932,183Other financial liabilities, including bonds and loans
949
The maximum exposure to credit risk without taking account of any collateral held at the end of reporting period is represented by thecarrying amount of the financial instrument which is exposed to credit risk on the consolidated statement of financial position.
1,106,448
5,618
Trade and other receivables are exposed to customer credit risk. The Company monitors the status of overdue balances, reviewsoutstanding balances for each customer and regularly examines the credibility of major customers in accordance with the Company'spolicies for credit management to facilitate the early evaluation and the reduction of potential credit risks.
72,653
Financial liabilities at fair value through profit or loss (contingent considerations arising from business combinations)
2) Details of financial instruments and the related risks(i) Financial assets
Financial assets at fair value through profit or loss (derivatives)
Available-for-sale financial assets
As of March 31, 2014
Total
Derivative transactions to which hedge accounting is applied
(ii) Financial liabilities
2) Age of financial assets that are past due
Derivative transactions to which hedge accounting is applied
34

Millions of yen
3,254 4,5481,114 1,366(117) (411)(229) (1,927)
526 (298)4,548 3,278
1) Liquidity risk management
2) Financial liabilities by maturityMillions of yen
Carryingamount
Contractamount
Within oneyear
Betweenone and
two years
Betweentwo and
three years
Betweenthree andfour years
Betweenfour and
five years
More thanfive years
617,444 618,490 154,245 70,000 214,245 60,000 - 120,000242,539 242,539 1,289 31,250 - 80,000 - 130,000
4,005 4,007 2,218 786 660 418 123 (198)
489,380 490,108 70,000 240,108 60,000 - 60,000 60,000240,000 240,000 30,000 - 80,000 - 60,000 70,000
8,607 8,596 6,571 697 677 402 209 40
As of March 31, 2015
Loans
(4) Liquidity Risk
The Corporate Finance Department at the corporate headquarters manages liquidity risk and establishes an adequate managementframework for liquidity risk to secure stable short-, mid- and long-term funds and sufficient liquidity for operations. The Companiesmanage liquidity risk by continuously monitoring forecasted cash flows, actual cash flows and the balance of available-for-salefinancial assets.
Derivative liabilities
As of March 31, 2014Bonds and loans
The Corporate Finance Department at the corporate headquarters enters into derivative hedging contracts according to the Company’s policies which determine the authority for entering into such transactions and the transaction limits. The Corporate Business Center,which is independent of the Corporate Finance Department, books derivative trades and directly confirms the transaction balanceswith counterparties. The European regional treasury center manages these transactions in accordance with the Company’smanagement policies.
Decreases (reversed)
3) Allowance for doubtful receivables
Bonds and loans
Foreign currency translation differences
As a general rule, the Company and the European regional treasury center manage foreign currency risks. Accordingly, thesubsidiaries do not bear the risks of fluctuations in exchange rates. Foreign currency risks are hedged by applying forward exchangecontracts to the expected net positions of trade receivables and payables, etc., in each foreign currency on a monthly basis.
The Companies use forward exchange contracts, currency swaps and currency options for individually significant foreign currencytransactions.
Fiscal 2013(April 1, 2013 toMarch 31, 2014)
Fiscal 2014(April 1, 2014 toMarch 31, 2015)
For bonds denominated in a foreign currency, the Company uses currency swaps and applies hedge accounting. The contractamount of foreign currency bonds was 308,490 million yen (3,000 million U.S. dollars) and 180,108 million yen (1,500 million U.S.dollars) as of March 31, 2014 and 2015, respectively.
Major market risks to which the Companies are exposed are 1) foreign currency risk, 2) interest rate risk and 3) price fluctuationrisk. The Companies use derivatives, such as forward exchange contracts, for the purpose of hedging.
Increases
1) Foreign currency risk
Balance at the end of the fiscal year
Balance at the beginning of the fiscal year
(ii) Forward exchange contracts and currency swaps
Bonds
Derivative liabilities
Bonds
Loans
(i) Foreign currency risk management
(5) Market Risk
Decreases (utilized)
35

(a) Forward exchange contractsMillions of yen
Contractamount
Over oneyear
Fair valueContractamount
Over oneyear
Fair value
Selling
USD 15,425 - (91) 19,212 - 372EUR 6,635 - (52) 30,667 - 945NTD 1,743 - (21) 6,096 - (325)BAHT 2,014 - (80) 2,007 - (94)INR 707 - (46) 878 - (18)CNY 430 - (22) - - -WON 1,836 - (65) 1,383 - (107)
Buying
USD 10,295 - (168) 12,041 - 1,795EUR 76,217 - 1,232 119,786 4,246 (4,260)GBP 15,095 - 65 7,576 - (177)SGD 3,680 - 16 3,193 - 63
(b) Currency swapsMillions of yen
Contractamount
Over oneyear
Fair valueContractamount
Over oneyear
Fair value
Buying
USD 317,600 159,258 72,653 185,962 183,035 62,291
(c) Currency optionsMillions of yen
Contractamount
Over oneyear
Fair valueContractamount
Over oneyear
Fair value
EUR - - - 32,520 - 1,040
(ii) Interest rate swapsMillions of yen
Notionalamount
Over oneyear
Fair valueNotionalamount
Over oneyear
Fair value
200,000 200,000 (2,639) 200,000 170,000 (2,989)The above swaps are related to loans to which hedge accounting is applied.
Fiscal 2013(As of March 31, 2014)
Fiscal 2014(As of March 31, 2015)
Interest rate swaps
Fiscal 2014(As of March 31, 2015)
The above swaps are related to bonds denominated in foreign currency to which the Company applies hedge accounting.
(iii) Foreign exchange sensitivity analysis
Fiscal 2013(As of March 31, 2014)
The Companies use interest rate swaps that fix the amount of interest payments from certain loans with floating interest rates tomanage interest rate risks.
Buying (put option)
(i) Interest rate risk management
Fiscal 2013(As of March 31, 2014)
Fiscal 2014(As of March 31, 2015)
Fiscal 2014(As of March 31, 2015)
2) Interest rate risk
The Companies are exposed mainly to foreign currency risks of the U.S. dollar and Euro. A depreciation of the yen by 5% against theU.S. dollar and Euro would impact profit or loss by 2,707 million yen and 8,528 million yen as of March 31, 2014 and 2015,respectively. These amounts do not include the effects of foreign currency translation on financial instruments in the functionalcurrency, or on assets, liabilities, revenue and expenses of foreign operations. The other variable factors are assumed to be fixed.
Fiscal 2013(As of March 31, 2014)
36

(ii) Share forward contractsMillions of yen
Contractamount
Over oneyear
Fair valueContractamount
Over oneyear
Fair value
9,188 2,710 (326) 3,164 - 523The above derivatives are related to cash-settled share-based payments to which hedge accounting is applied.The "Contract amount" is computed by multiplying the number of shares by the forward contract unit price.
Put options written on non-controlling interests are stated in Note 27, "Equity and Other Equity Items".
2) Fair value hierarchy
Share forward (net settlement)
The fair value of available-for-sale financial assets is measured at quoted prices or quotes obtained from financial institutions.
For equity instruments, the Companies manage the risk of price fluctuations in the instruments by continually assessing the situationby reviewing share prices and financial positions of the issuers. If the issuer is a company with a business relationship, theCompanies continually assess the need for such investments by taking into consideration the business relationship with thesecompanies.
For certain cash-settled share-based payments which are exposed to the movement in the Company's share price, the Companymanages the exposure through the use of share forward contracts.
The fair value of held-to-maturity investments is measured at quoted prices.
(iv) Available-for-sale financial assets
(vi) Other financial liabilities, including bonds and loans
Level 3: Fair value that is calculated based on valuation techniques which include input that is not based on observable market data
Other current items are settled in a short period, and the coupon rates of other non-current items reflect market interest rates.Therefore, the carrying amounts of these liabilities approximate their fair values.
(iii) Loans and receivables
The fair value of bonds is measured at quotes obtained from financial institutions, and the fair value of loans is measured as thepresent value of future cash flows discounted using the applicable effective interest rate on the loans, taking into consideration thecredit risk by each group classified in a specified period.
(6) Fair Value of Financial Instruments
(v) Derivative transactions to which hedge accounting is applied
(i) Financial assets and liabilities at fair value through profit or loss
(ii) Held-to-maturity investments
(i) Price fluctuation risk management
Loans and receivables are settled in a short period. Therefore, their carrying amounts approximate their fair values.
Level 2: Fair value that is calculated using an observable price other than that categorized in Level 1 directly or indirectly
Fiscal 2014(As of March 31, 2015)
3) Price fluctuation risk
Fiscal 2013(As of March 31, 2014)
Level 1: Fair value measured at quoted prices in active markets
(iii) Market price sensitivity analysis
1) Fair value measurements
The analysis shows that if the market price for the underlying equity instruments, the equity securities held by the Companies andinvestments in trusts which hold equity securities on behalf of the Companies had increased by 10%, the hypothetical impact on othercomprehensive income (before tax effect) would have been 13,872 million yen and 15,717 million yen as of March 31, 2014 and 2015,respectively. Other variable factors are assumed to be fixed.
The fair value of derivatives for which hedge accounting was not applied is measured at quotes obtained from financial institutions.The fair value measurement of contingent considerations arising from business combinations is stated in Note 33, "BusinessCombinations".
The fair value of derivatives to which hedge accounting is applied is measured in the same manner as "(i) Financial assets andliabilities at fair value through profit or loss".
37

3) Fair value of financial instruments
Millions of yen
617,444 621,107 489,380 493,776241,313 241,896 240,000 240,656
4) Fair value measurement recognized in the consolidated statement of financial positionMillions of yen
Level 1 Level 2 Level 3 Total
- 1,808 - 1,808- 72,653 - 72,653
138,723 59,932 - 198,655138,723 134,393 - 273,116
- 949 - 949- 3,055 - 3,055- 4,005 - 4,005
Millions of yenLevel 1 Level 2 Level 3 Total
- 4,852 - 4,852- 62,814 - 62,814
157,168 6 - 157,174157,168 67,672 - 224,840
- 5,618 - 5,618- 2,989 - 2,989- 8,607 - 8,607
Assets:
Liabilities:
Contingent considerations arising from business combinations are not included in the above table and are stated in Note 33, "Business Combinations".
Financial assets at fair value through profit or loss (derivatives)
Derivative transactions to which hedge accounting is applied
As of March 31, 2015
Total
Put options written on non-controlling interests are not included in the above table and are stated in Note 27, "Equity and Other Equity Items".
Available-for-sale financial assets for which it was difficult to reliably measure the fair value are excluded from the table. The carryingamounts of such assets were 2,886 million yen and 2,562 million yen as of March 31, 2014 and 2015, respectively.
Available-for-sale financial assets
Available-for-sale financial assets
Liabilities:
The carrying amount and fair value of financial instruments at the reporting date are set forth in the table below.
Financial liabilities at fair value through profit or loss (derivatives)
Total
As of March 31, 2014
(Note) There were no transfers among Level 1, Level 2 and Level 3 during each reporting period.
Derivative transactions to which hedge accounting is applied
Financial assets at fair value through profit or loss (derivatives)
(Note) The amounts to be paid within a year are included.
Derivative transactions to which hedge accounting is applied
Assets:
Derivative transactions to which hedge accounting is applied
Total
Financial instruments measured at fair value and whose fair value approximates the carrying amount are excluded from the tablebelow.
The fair value of bonds and long-term loans are classified as Level 2 in the fair value hierarchy.
Total
Bonds (Note)Long-term loans (Note)
Fiscal 2013(As of March 31, 2014)
Fiscal 2014(As of March 31, 2015)
Carrying amount Fair value Carrying amount Fair value
Financial liabilities at fair value through profit or loss (derivatives)
38

29
1) Share options to which IFRS 2 is applied
1st seriesfor FY2013
2nd seriesfor FY2013
4,730 4,82023.67 22.08
6.5 11.03.81 3.730.46 0.76
(4) 2nd series for FY2011
July 15, 2031
Number of personsNumber of options
(shares)
July 10, 20105 Directors
Share-based Payments
July 17, 2022
66,900(1) FY 2009
(1) Equity-settled Share-based Payments (Share Option Plans)
As for corporate officers and senior management, the holder of the options must be a director or an employee holding another similarposition within the Companies in order to exercise the options. This shall not apply in cases in which the holder retires due toexpiration of their term of office, mandatory retirement or for other justifiable reasons.
As for directors, the holder of the options must be a director of the Company in order to exercise the options. However, this shall notapply in cases in which the holder retires due to the expiration of their term of office or for other justifiable reasons.
Expiry date
July 10, 2009
4 Directors 59,200
64,600
Date of grant
(i) Share options outstanding as of the grant dates were as follows;
The share based awards do not have vesting conditions for them to be exercised.Share options granted to a person who retires due to expiration of his or her term of office or mandatory retirement or for otherjustifiable reasons are exercisable immediately following the date of retirement even if it is earlier than the vesting date.
From the year ended March 31, 2015, no more share options are to be granted.
The Companies adopt share-based payment programs to improve medium- to long-term business results and thereby enhancecorporate value.
July 10, 2019
(6) 2nd series for FY2012
The fair value of options is calculated based on the Black-Scholes option pricing model. The assumptions used for measurement areas follows:
1,133,100
August 27, 2012 July 17, 2032
July 15, 2021
(2) FY 2010 July 10, 2020
1,973,800
(5) 1st series for FY2012 4 Directors
1,564,400 July 15, 2011
45,900
113 Corporate officersand senior management
July 15, 2011
5 Directors
(3) 1st series for FY2011
(7) 1st series for FY2013 4 Directors July 19, 2013 July 19, 2023
62,600 July 17, 2012
118 Corporate officersand senior management
134 Corporate officersand senior management
(Note) Expected volatility is calculated by considering historical volatility of the Company's share price over a period commensurate with the option life.
Fiscal 2014(April 1, 2014 toMarch 31, 2015)
The fair value of one option at the grant date for the 1st series and 2nd series for FY2013 was 3,709 yen and 553 yen, respectively.
Fiscal 2013(April 1, 2013 toMarch 31, 2014)
Risk-free interest rate (%)
Option life (year)Expected dividend rate (%)
January 10, 2014 July 19, 2033
The expenses for share options recognized in the consolidated statement of operations for the years ended March 31, 2014 and 2015were 685 million yen and 631 million yen, respectively.
-
Weighted average share price (yen)
(8) 2nd series for FY2013
Expected volatility (%) (Note)
-
-
--
-
39

Number ofoptions(shares)
Weightedaverageexercise
price (yen)
Number ofoptions(shares)
Weightedaverageexercise
price (yen)
Number ofoptions(shares)
Weightedaverageexercise
price (yen)
Number ofoptions(shares)
Weightedaverageexercise
price (yen)
45,900 1 1,133,100 4,981 - - - -
(14,500) 1 - - (34,500) 1 (208,500) 3,707
7,000 4,6457,500 4,645
14,500
34,500 4,696190,400 5,42218,100 6,450
243,000
- - - -
- - - -
No share options were exercised during Fiscal 2013 and 2014.
13,538,200
- - -
4,638,400
Forfeited/expired before vesting
3,716 213,500
--
1 4,025
70,500 1
Corporate officers andsenior management
Directors
Balance at the beginning of the fiscal year
182,100
Fiscal 2013(April 1, 2013 to March 31, 2014)
9,600
-
Balance at the beginning of the fiscal year
1
(iii) Share options exercised during the period
Fiscal 2013(April 1, 2013 to March 31, 2014)
19,600 1
9,600
-
1 1
Expiry date
(iii) Share options exercised during the period
FY2010
Total
-
4,025
2) Share options to which IFRS 2 is not applied (Granted after November 7, 2002 but vested before the first-time adoption of IFRS (April 1, 2012)).
FY2010
The weighted average exercise price and weighted average remaining contractual life of the share options outstanding at the end ofthe fiscal year were 3,848 yen and 18 years and 3,883 yen and 17 years as of March 31, 2014 and 2015, respectively.
1,359,200
179,000
-
1
-
3,705
Fiscal 2014(April 1, 2014 to March 31, 2015)
DirectorsCorporate officers andsenior management
Exercised
(32,900) 3,716
Granted
-
Exercised
-
Balance at the end of the fiscal year
213,500
Weighted averageexercise price (yen)
Number of options(shares)
-Forfeited/expired after vesting
7 Directors
Weighted averageexercise price (yen)
July 11, 2008
-
1
- - - -
Exercisable balance atthe end of the fiscal year
Date of grant
Total
4,040
-Forfeited/expired before vesting
9,600
-
Exercised number of options (shares)
Exercised number of options (shares)
Average share price at the date ofexercise (yen)
-Forfeited/expired after vesting
(ii) Changes in the number of share options and each weighted average exercise price were as follows:
(1) FY2008
Granted
Balance at the end of the fiscal year
4,429,9001
53,300 -
Number of personsNumber of options
(shares)
1 9,600
The weighted average exercise price and weighted average remaining contractual life of the share options outstanding at the end ofthe period were one yen and four years and one yen and three years as of March 31, 2014 and 2015, respectively.
Average share price at the date ofexercise (yen)
2nd series for FY2011
-
62,400
Exercisable balance atthe end of the fiscal year
9,600
July 11, 2018
4,638,400
-
1st series for FY2011
(ii) Changes in the number of share options and each weighted average exercise price are as follows:Fiscal 2014
(April 1, 2014 to March 31, 2015)
2nd series for FY2012
Fiscal 2013 (April 1, 2013 to March 31, 2014)
(i) Share options outstanding as of the grant dates were as follows:
Fiscal 2014 (April 1, 2014 to March 31, 2015)
Number of options(shares)
40

ESOP BIP ESOP BIP
- - 4,722 4,780- - 17.31 17.65- - 1.0-3.0 0.9-2.9- - 3.81 3.77- - 0.09 0.09
- - 3,157,758 235,019
- - - -
Balance at the beginning of the fiscal year
- -
As for the directors and certain members of the Companies' senior management, the rights of a half of granted points (1 point = 1share) vest by a third every year over a period of three years from the date of grant. The other 50% of the rights vest after three yearsfrom the date of grant. As for the Companies' senior management other than the above, the rights vest by a third every year over aperiod of three years.The fair value of a granted point for the directors for the year ended March 31, 2015 was 4,600 yen (vesting period: June, 2015),4,420 yen (vesting period: June, 2016), 4,240 yen (vesting period: June, 2017). The fair value of a granted point for the Companies'senior management for the year ended March 31, 2015 was 4,542 yen (vesting period: June, 2015), 4,362 yen (vesting period: June,2016), 4,183 yen (vesting period: June, 2017). The weighted average fair value of the BIP and ESOP Trust was 4,353 yen and 4,361yen, respectively.
Balance at the end of the fiscal year
- - 3,003,020 235,019
Fiscal 2013(April 1, 2013 to March 31, 2014)
Fiscal 2014(April 1, 2014 to March 31, 2015)
Number of point Number of point Number of point Number of point
- -
GrantedForfeited/expired before vesting
The fair value of the granted points was measured based on the fair value which was calculated using Monte Carlo simulations.The assumptions used in the Monte Carlo simulations are as follows:
Fiscal 2013(April 1, 2013 toMarch 31, 2014)
Fiscal 2014(April 1, 2014 toMarch 31, 2015)
Weighted average share price (yen)Expected volatility (%) (Note)
(2) Equity-settled Share-based Payments (Stock Grant Plans)
Contractual life (year)Expected dividend rate (%)Risk-free interest rate (%)(Note) Expected volatility is calculated by considering historical volatility of the Company's share price over a period commensurate with the contractual life.
- - (154,738) -
Exercised
The Company has adopted stock grant plans for the directors of the Company and the Companies' senior management.The expenses for the stock grant plans recognized in the consolidated statement of operations for the year ended March 31, 2015were 7,240 million yen. There were no expenses for the plans recognized for the year ended March 31, 2014.
The weighted average remaining contractual life of the granted points outstanding as of March 31, 2015 was two years and one yearfor the BIP and ESOP Trust, respectively.
ESOP BIP ESOP BIP
As for the directors, the Company has adopted the Board Incentive Plan (BIP). The BIP is an incentive plan for directors which isstructured with reference to Performance Share Plans and Restricted Share Plans in the U.S., wherein the Company's shares thatare acquired by the BIP Trust are granted to the directors based on achievement of certain performance indicators among othercriteria (beneficiaries may receive cash by converting the Company's shares under the BIP Trust into cash according to theprovisions of the trust agreement).As for the Companies' senior management, the Company has adopted the Employee Stock Ownership Plan (ESOP). The ESOP isan incentive plan for employees which is structured with reference to ESOP programs in the U.S., wherein the Company's sharesacquired by the ESOP Trust are granted to employees based on positions and achievement of certain performance indicators amongother criteria (beneficiaries may receive cash by converting the Company's shares under the ESOP Trust into cash according to theprovisions of the trust agreement).Vesting conditions are basically subject to continued service from grant date to vesting date.
41

1) Phantom stock appreciation rights (PSARs)
2) Restricted stock units (RSUs)
- -
- -
- -
Granted
Exercised
Balance at the beginning of the fiscal year
14,452,004
(258,198)
(2,198,770)
(3) Cash-settled Share-based Payments
-
(Note) The Company has applied hedge accounting to a portion of the RSUs payments through the use of share forward contracts as the hedging instrument.
Fiscal 2014(April 1, 2014 to March 31, 2015)
11,780,249 4,599
-
Number of rights
Balance at the end of the fiscal year
4,652,660
Weighted averageexercise price (yen)
Weighted averageexercise price (yen)
5,401
421,016
(2,069,596)
(412,250)
Some overseas subsidiaries have adopted two types of cash-settled share-based payment plans to specified employees basedmainly on the Company's share price. The expenses for the cash-settled share-based payments recognized in the consolidatedstatement of operations were 14,585 million yen and 12,479 million yen for the years ended March 31, 2014 and 2015, respectively.The carrying amount of the cash-settled share-based payments liabilities recognized in the consolidated statement of financialposition was 28,028 million yen and 27,037 million yen as of March 31, 2014 and 2015, respectively.
Exercisable balance atthe end of the fiscal year
4,457
PSARs are settled by cash at the difference between the share price at the grant date and the date of exercise. The rights vest by athird every year over a period of three years from the end of the fiscal year in which the rights were granted. The exercise period is 10years from the end of the fiscal year in which the rights were granted.
Fiscal 2013(April 1, 2013 to March 31, 2014)
Fiscal 2014(April 1, 2014 to March 31, 2015)
14,881,602
Weighted averageexercise price (yen)
4,600
4,388
14,881,602 4,600
(187,624)
-
The total intrinsic value of vested PSARs and RSUs was 13,809 million yen and 20,884 million yen as of March 31, 2014 and 2015,respectively.
4,202
-
2,902,239
1,384,028
RSUs are settled by cash at the share price on the vesting date along with dividend payments during the period from the grant date tothe vesting date. The rights vest by a third every year over a period of three years from the end of the fiscal year in which the rightswere granted. RSUs do not have exercise prices because the pay-out amounts are the share prices on the vesting date multiplied bythe number of rights vested.
5,037
4,652,660
Forfeited/expired before vesting
5,37312,344,335
Exercised
-2,484,391-
3,154,501 -
(466,735)
(2,091,445) 4,834
-Forfeited/expired before vesting
Balance at the end of the fiscal year
4,712
Number of rights
Granted
Number of rightsWeighted average
exercise price (yen)Number of rights
(351,874)
Exercisable balance atthe end of the fiscal year
2,117,043
4,497
Balance at the beginning of the fiscal year
4,232,267
Fiscal 2013(April 1, 2013 to March 31, 2014)
11,441,092
(2,237,411)
(59,398)
4,938
Forfeited/expired after vesting
42

30(1) Payments for acquisition of subsidiaries
1) Fiscal 2013 (April 1, 2013 to March 31, 2014)
Millions of yen
15,432
(3,228)(2,000)11,154
2) Fiscal 2014 (April 1, 2014 to March 31, 2015)
(2) Cash and cash equivalents
Millions of yen
- 3,096
3,342
The increase in major items of identifiable assets acquired and liabilities assumed due to the acquisition of subsidiaries' shares suchas those of Inviragen, Inc. of U.S., and the related consideration and payments for the acquisition are as follows:
There were no acquisitions of subsidiaries during the year ended March 31, 2015.
860
Fiscal 2013(April 1, 2013 toMarch 31, 2014)
Fiscal 2014(April 1, 2014 toMarch 31, 2015)
Cash and cash equivalents in the consolidated statement of financial position
Cash and cash equivalents on consolidated statement of cashflows
666,048
The reconciliation between cash and cash equivalents in the consolidated statement of cash flows and in the consolidated statementof financial position is as follows:
Non-current assets
89
Amount
Current assets (except for cash and cash equivalents)Non-current liabilitiesCurrent liabilities
Cash Flow Information
7,722
Cash and cash equivalents included in assets held for sale
Total considerationContingent consideration included in total considerationCash and cash equivalents included in assets acquiredPayments for aquisition of subsidiaries
652,148
666,048 655,243
43

31
(Consolidated Subsidiaries)Voting sharecapital held
(%)
Subsidiaries and AssociatesThe breakdown of the Company's major subsidiaries and associates as of March 31, 2015 is as follows:
Company name
Takeda Development Center Americas, Inc. U.S.A. 100.0
Takeda Ventures, Inc.
U.S.A.
Operating segment
100.0
Denmark 100.0
Takeda Pharmaceuticals International GmbH Switzerland 100.0
Takeda California, Inc. U.S.A. 100.0
Takeda Vaccines, Inc. U.S.A. 100.0
U.S.A. 100.0
Takeda Europe Holdings B.V. Netherlands 100.0
Takeda A/S
Millennium Pharmaceuticals, Inc.
Ethical Drugs Takeda America Holdings, Inc. U.S.A. 100.0
Takeda Pharmaceuticals International, Inc. U.S.A. 100.0
Takeda Pharmaceuticals U.S.A., Inc. U.S.A. 100.0
Country
Takeda Austria GmbH Austria 100.0
Takeda Pharma Ges.m.b.H Austria 100.0
Takeda France S.A.S. France 100.0
Takeda Pharma A/S Denmark 100.0
Takeda Italia S.p.A. Italy 100.0
Takeda Pharmaceuticals Europe Limited United Kingdom 100.0
Takeda GmbH Germany 100.0
Takeda Pharma Vertrieb GmbH & Co. KG Germany 100.0
Takeda Nycomed AS Norway 100.0
Takeda Belgium SCA/CVA Belgium 100.0
Takeda Christiaens SCA/CVA Belgium 100.0
Takeda UK Limited United Kingdom 100.0
Takeda Oy Finland 100.0
Takeda Pharma AG Switzerland 100.0
Takeda Farmaceutica Espana S.A. Spain 100.0
Takeda Netherland B.V. Netherlands 100.0
Takeda Pharma AB Sweden 100.0
Takeda Pharma Sp. z o.o. Poland 100.0
Takeda Hellas S.A. Greece 100.0
Takeda Ireland Limited Ireland 100.0
Takeda Cambridge Limited United Kingdom 100.0
Takeda Development Centre Europe Ltd. United Kingdom 100.0
44
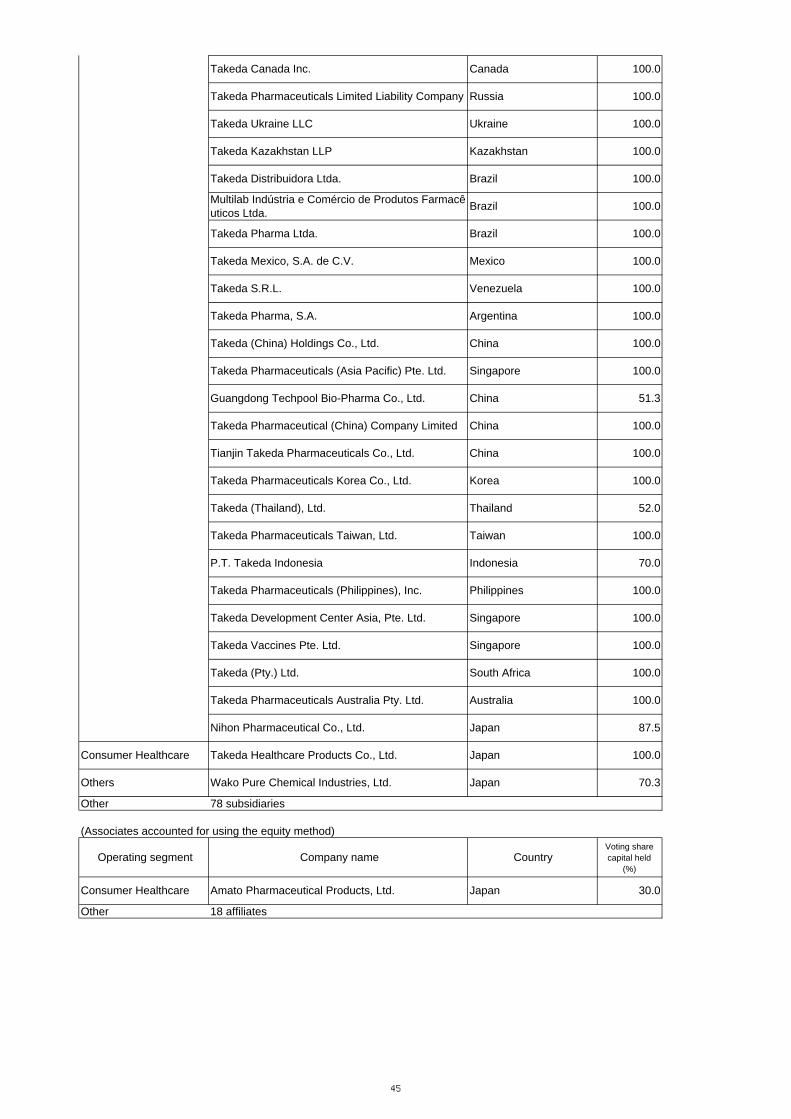
Other 78 subsidiaries
(Associates accounted for using the equity method)Voting sharecapital held
(%)
Other 18 affiliates
30.0
Operating segment
Amato Pharmaceutical Products, Ltd. JapanConsumer Healthcare
CountryCompany name
Takeda Pharmaceuticals Limited Liability Company Russia 100.0
Takeda Ukraine LLC Ukraine 100.0
Takeda Kazakhstan LLP Kazakhstan 100.0
Takeda Canada Inc. Canada 100.0
China
China
Takeda Distribuidora Ltda. Brazil 100.0
Multilab Indústria e Comércio de Produtos Farmacêuticos Ltda.
Brazil 100.0
Takeda Pharma Ltda. Brazil 100.0
Takeda Mexico, S.A. de C.V. Mexico 100.0
100.0
Others Wako Pure Chemical Industries, Ltd. Japan 70.3
Takeda Development Center Asia, Pte. Ltd. Singapore 100.0
Takeda Vaccines Pte. Ltd. Singapore 100.0
Takeda (Pty.) Ltd. South Africa 100.0
Takeda Pharmaceuticals (Philippines), Inc. Philippines 100.0
Takeda Pharmaceuticals Australia Pty. Ltd. Australia 100.0
Consumer Healthcare Takeda Healthcare Products Co., Ltd. Japan 100.0
Nihon Pharmaceutical Co., Ltd. Japan 87.5
China 100.0
Tianjin Takeda Pharmaceuticals Co., Ltd. China 100.0
Takeda Pharmaceuticals Korea Co., Ltd. Korea 100.0
Guangdong Techpool Bio-Pharma Co., Ltd.
Takeda Pharmaceuticals Taiwan, Ltd. Taiwan 100.0
51.3
Takeda (Thailand), Ltd. Thailand 52.0
P.T. Takeda Indonesia Indonesia 70.0
Takeda Pharmaceuticals (Asia Pacific) Pte. Ltd. Singapore 100.0
Takeda S.R.L. Venezuela 100.0
Takeda Pharma, S.A. Argentina 100.0
Takeda (China) Holdings Co., Ltd.
Takeda Pharmaceutical (China) Company Limited
45
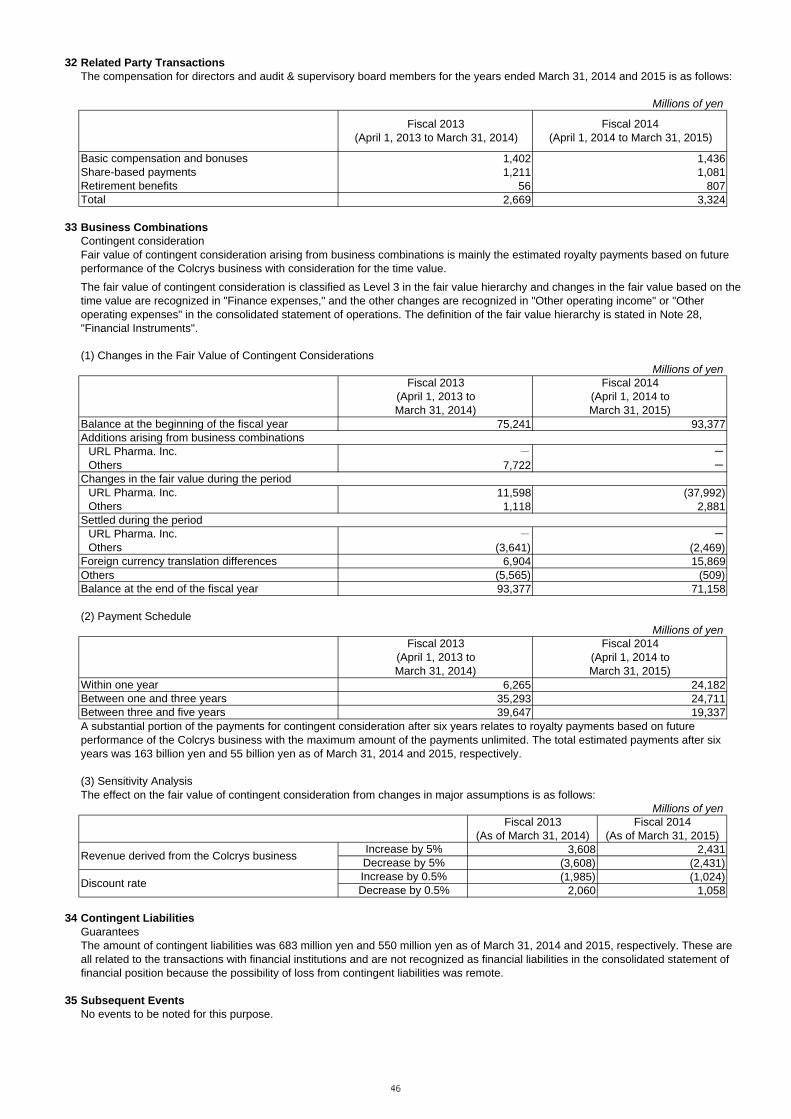
32
Millions of yen
1,402 1,4361,211 1,081
56 8072,669 3,324
33Contingent consideration
(1) Changes in the Fair Value of Contingent ConsiderationsMillions of yen
75,241 93,377
- -7,722 -
11,598 (37,992)1,118 2,881
- -(3,641) (2,469)
6,904 15,869Others (5,565) (509)
93,377 71,158
(2) Payment ScheduleMillions of yen
6,265 24,18235,293 24,71139,647 19,337
Millions of yen
3,608 2,431(3,608) (2,431)(1,985) (1,024)
2,060 1,058
34
35No events to be noted for this purpose.
Fiscal 2014(As of March 31, 2015)
Increase by 5%Decrease by 5%Increase by 0.5%Decrease by 0.5%
Fiscal 2013(As of March 31, 2014)
(3) Sensitivity Analysis
Fiscal 2013(April 1, 2013 toMarch 31, 2014)
Fiscal 2014(April 1, 2014 toMarch 31, 2015)
Fiscal 2013(April 1, 2013 toMarch 31, 2014)
Fiscal 2014(April 1, 2014 toMarch 31, 2015)
Contingent Liabilities
Fiscal 2014(April 1, 2014 to March 31, 2015)
Others
The compensation for directors and audit & supervisory board members for the years ended March 31, 2014 and 2015 is as follows:
URL Pharma. Inc.
Additions arising from business combinations
Changes in the fair value during the period
Fair value of contingent consideration arising from business combinations is mainly the estimated royalty payments based on futureperformance of the Colcrys business with consideration for the time value.
Share-based payments
OthersForeign currency translation differences
GuaranteesThe amount of contingent liabilities was 683 million yen and 550 million yen as of March 31, 2014 and 2015, respectively. These areall related to the transactions with financial institutions and are not recognized as financial liabilities in the consolidated statement offinancial position because the possibility of loss from contingent liabilities was remote.
A substantial portion of the payments for contingent consideration after six years relates to royalty payments based on futureperformance of the Colcrys business with the maximum amount of the payments unlimited. The total estimated payments after sixyears was 163 billion yen and 55 billion yen as of March 31, 2014 and 2015, respectively.
Retirement benefitsTotal
Subsequent Events
URL Pharma. Inc.
The fair value of contingent consideration is classified as Level 3 in the fair value hierarchy and changes in the fair value based on thetime value are recognized in "Finance expenses," and the other changes are recognized in "Other operating income" or "Otheroperating expenses" in the consolidated statement of operations. The definition of the fair value hierarchy is stated in Note 28,"Financial Instruments".
The effect on the fair value of contingent consideration from changes in major assumptions is as follows:
Fiscal 2013(April 1, 2013 to March 31, 2014)
URL Pharma. Inc.
Basic compensation and bonuses
Business Combinations
Balance at the beginning of the fiscal year
Revenue derived from the Colcrys business
Others
Related Party Transactions
Discount rate
Settled during the period
Balance at the end of the fiscal year
Within one yearBetween one and three yearsBetween three and five years
46