Embed Size (px)
Citation preview

Postadress: Besöksadress: Telefon:
Box 1026 Gjuterigatan 5 036-10 10 00 (vx)
551 11 Jönköping
TAILORING PROPERTIES TO REPRESENT
HPDC TENSILE AND FATIGUE BEHAVIOUR
IN ALUMINIUM-SILICON CAST ALLOY
PROTOTYPES
Martin Ignacio Riestra Perna
EXAM WORK 2015
MATERIALS AND MANUFACTURING
Postadress: Besöksadress: Telefon:
Box 1026 Gjuterigatan 5 036-10 10 00 (vx)
551 11 Jönköping
This exam work has been carried out at the School of Engineering in
Jönköping in the subject area of Materials and Manufacturing. The work
is a part of the Master of Science programme in Product development
and Materials.
The author takes full responsibility for opinions, conclusions and
findings presented.
Examiner: Anders Jarfors
Supervisor: Salem Seifeddine, Emma Sjölander
Scope: 30 credits
Date: August 2015
Abstract
1
Abstract
The work presented aims to find alternatives for the prototyping of components by sand and plaster mold manufacturing processes that deliver properties similar to high pressure die casting (HPDC).
Sand and plaster test samples have been casted. The Al-7Si-0.35Mg alloy has been tested in as cast condition and in a heat treated condition; T5 for sand cast samples and T6 for those plaster cast. The Al-7Si-2Cu-0.35Mg alloy was also tested in as cast condition. Tensile, fatigue and hardness tests have been performed. Microstructural investigation comprising secondary dendrite arm spacing, defects, Fe-rich β-phases and Si size measurements has been performed on the different conditions. The results have been compared to available data for Al-9Si-3Cu-(Fe) alloy used in HPDC. The T5 heat treated sand cast condition has shown to have properties similar to HPDC. All other sand cast conditions, including the previously tested Al-9Si-3Cu-(Fe) alloy, have been shown to be reasonable alternatives.

Summary
2
Summary
Tailoring properties to represent HPDC tensile and fatigue behaviour in aluminium-silicon cast alloy prototypes presents the work completed during a master thesis carried out in the School of Engineering at Jönköping University and Scania CV AB by an exchange student of the Escuela Técnica Superior de Ingenieros Industriales of Universidad Politécnica de Madrid (Spain).
Driven by reducing the consumption of energy, particularly of fossil fuels, cast aluminium alloys are becoming a lightweight alternative to cast iron in certain applications. For the design of aluminium alloy components that are to be produced in series, there is a need for prototypes that represent the mechanical properties expectable from the serial produced components since this prototypes will be subjected to actual working conditions tests.
Through experimental procedures on standardized samples, this work presents solutions for producing this prototypes. Fatigue, tensile and hardness tests have been performed on six different conditions to assess the influence in properties of two processes, two alloy systems and two heat treatments. Microstructure characterization has also been done for the six conditions tested.
Fatigue life, tensile properties and microstructure characteristics have been compared to standard values as well as to values from previously tested prototyping options and for serial production methods.
Four different prototyping solutions have been found to be reasonable options.
Keywords
Aluminium alloys, Prototyping solutions, Sand cast, Plaster cast, Tensile properties, Fatigue properties

Contents
3
Contents
1 Introduction .............................................................................. 5
1.1 BACKGROUND ............................................................................................................................. 5 1.2 PURPOSE AND RESEARCH QUESTIONS .......................................................................................... 6 1.3 DELIMITATIONS .......................................................................................................................... 6 1.4 OUTLINE ..................................................................................................................................... 7
2 Theoretical background ........................................................... 8
2.1 ALUMINIUM ................................................................................................................................ 8 2.2 ALUMINIUM-SILICON ALLOYS..................................................................................................... 8 2.3 SOLIDIFICATION ........................................................................................................................ 10 2.4 MODIFICATION .......................................................................................................................... 11 2.5 DEFECTS ................................................................................................................................... 12 2.6 HEAT TREATMENT..................................................................................................................... 13 2.7 ALLOYING ELEMENTS ............................................................................................................... 14
2.7.1 Magnesium...................................................................................................................... 15
2.7.2 Copper ............................................................................................................................ 16
2.7.3 Magnesium and Copper .................................................................................................. 16
2.8 MECHANICAL PROPERTIES ........................................................................................................ 19 2.8.1 Tensile strength ............................................................................................................... 19
2.8.2 Fatigue limit ................................................................................................................... 22
3 Method and implementation ................................................ 26
3.1 MATERIALS ............................................................................................................................... 26 3.2 PROCESS ................................................................................................................................... 27
3.2.1 Sand ................................................................................................................................ 27
3.2.2 Plaster ............................................................................................................................. 27
3.3 HEAT TREATMENT..................................................................................................................... 27 3.4 MATERIAL CHARACTERIZATION ................................................................................................ 29
3.4.1 Microscopic .................................................................................................................... 29
3.4.2 Fractographic ................................................................................................................. 31
3.4.3 Radiographic .................................................................................................................. 31
3.4.4 Tensile test ...................................................................................................................... 32
3.4.5 Hardness ......................................................................................................................... 32
3.4.6 Fatigue test ..................................................................................................................... 33
4 Results and discussion ............................................................ 36
4.1 MICROSTRUCTURE .................................................................................................................... 36 4.1.1 SDAS ............................................................................................................................... 38 4.1.2 Defects ............................................................................................................................ 39 4.1.3 Intermetallics & Silicon eutectic ..................................................................................... 41
4.2 MECHANICAL PROPERTIES ........................................................................................................ 43 4.2.1 Tensile ............................................................................................................................. 44 4.2.2 Hardness ......................................................................................................................... 49 4.2.3 Fatigue ............................................................................................................................ 50
5 Discussion of method and conclusions ................................ 59
5.1 DISCUSSION OF METHOD ........................................................................................................... 59 5.2 CONCLUSIONS ........................................................................................................................... 61 5.3 FUTURE WORK .......................................................................................................................... 61
6 Acknowledgements ................................................................ 63

Contents
4
7 References ............................................................................... 64
8 Appendices .............................................................................. 67
8.1 APPENDIX 1. DESIGNATION SYSTEM OF SAMPLES ..................................................................... 67 8.2 APPENDIX 2. RESULTS FOR TENSILE TESTS. ............................................................................... 68 8.3 APPENDIX 3. RESULTS FOR FATIGUE TESTS ............................................................................... 70

Introduction
5
1 Introduction The challenge to produce lightweight components with the adequate mechanical properties has driven the automotive industry to increase the production of cast aluminium products.
For certain applications, cast aluminium products offer a lighter alternative to products traditionally made of steel or cast iron while delivering similar mechanical properties.
When large series of cast aluminium products is needed, the most common manufacturing procedure is high pressure die casting (HPDC). The dies and tooling costs for this process call for prototypes cast with other methods, typically sand or plaster processes, which can represent the mechanical behaviour of the final product.
The present document compiles the work carried out as final project work within the product development and materials master programme.
1.1 Background
During the design or re-design process of a product or component, the mechanical and physical properties needed for that product are decided. Before starting with the production of a product, it is common practice to prepare prototypes to evaluate and iterate on its design. In order to be representative of the final product, these prototypes need not only to have the same geometrical shape of the product but to have properties as similar as possible to it.
Scania CV AB aims to cast several components using HPDC manufacturing processes. One of the characteristics of this process is a high cost for dies and equipment [1]. For components that will be HPDC with Al-9Si-3Cu-(Fe) (EN AC 46000) alloy, Scania uses nowadays sand and plaster casted prototypes. Due to the high cost of the dies, it is important that the properties achieved for the prototypes are similar to those achieved by HPDC EN AC 46000.
Previous trials with the EN AC 46000 alloy have been plaster and sand cast by Hackås Precisionsgjuteri AB and Unnarydmodell respectively for Scania. Since the EN AC 46000 alloy is a secondary aluminium alloy, it has too high iron content to give a reasonable elongation for plaster casting. For sand casting it seems to yield reasonable results.
The Al-7Si-0.35Mg (EN AC 42100) alloy is commonly used for sand and plaster casting, but the properties achieved with plaster casting are far from those achieved for HPDC. Also, the fatigue limit for this alloy is unknown.
According to D. Apelian et al. [2] the mechanical properties can be tailored by controlling three key sets of variables:
Process variables, which include molten metal treatment, local solidification time, manufacturing method, etc.
Introduction
6
System variables, which include chemical compositions, level of modification, grain refinement, etc.
Post-solidification variables, which include solution heat treatment, quenching, aging, etc.
Bearing this in mind, by adjusting the process, system and post-solidification variables properties similar to those delivered by EN AC 46000 HPDC alloy could be possible to reach.
The purpose of this study is then driven by the objective of adjusting this variables within the limitations set by the sand and plaster casting method available in the two companies that produce the prototypes, and the alloy preselected by Scania.
1.2 Purpose and research questions
The aim of this study is to gain knowledge on variables related to the alloys when using sand and plaster molds for prototyping purposes. The focus is on developing the knowledge necessary to cast prototypes with mechanical properties that are representative of HPDC alloys and processes. In this sense, the following research questions have been formulated:
1. What is the fatigue limit for the EN AC 42100 alloy in as-cast condition, both for sand and plaster molds?
2. Can tensile and fatigue properties similar to that of EN AC 46000 alloy casted with the HPDC process be achieved with a copper addition to EN AC 42100 alloy casted in sand or plaster molds in as-cast condition?
3. Can tensile and fatigue properties similar to that of EN AC 46000 alloy casted with the HPDC process be achieved by heat treatment to EN AC 42100 alloy casted in sand or plaster molds?
1.3 Delimitations The work presented here does not cover the following:
1. Different concentrations of Cu additions to the EN AC 42100 alloy. Only one concentration is evaluated through experimental work.
2. Heat treatment of the alloys with Cu addition.
3. Optimization of heat treatments.
4. Fracture initiation and propagation analysis.
5. Techniques for fitting of fatigue results. The Scania proprietary software (UTM2) was used.

Introduction
7
1.4 Outline
The report is organized in the following order:
In chapter one, an introduction to the whole work is presented.
Under the “Theoretical background” title, in chapter two, a summary of the available literature revised by the author is carried on in order to set the basis for the election of the experimental procedures, the collection of data and the interpretation of it.
Chapter three, “Method and implementation”, explains the experimental procedures followed. The casting processes, the heat treatments used and the tests that were performed can be found.
Following that, in the “Results and discussion” chapter, the results from the experiments and the analysis of data is presented. A discussion and comparison to previous results is also presented.
In chapter five, “Discussion of method and conclusions”, a discussion of the method used, the conclusions extracted from the results and the possible future work related to this work are laid out.
In chapter six “Acknowledgements”, the author expresses his gratefulness to the people who made this work possible.
The chapter named “References” lists the literature used in this work.
The “Appendices” chapter contains experimental results from this work.

Theoretical background
8
2 Theoretical background
2.1 Aluminium
Aluminium is the most abundant metal and third most abundant element in the Earth’s crust (after oxygen and silicon). It is mostly found in its silicate or oxide state. The most economical process to obtain it involves converting bauxite (chief aluminium ore) into alumina or aluminium oxide (Al2O3) through the Bayer process and then via the Hall-Héroult process reduce this oxide into pure aluminium. This process is energy intensive; around 14MWh are needed to produce 1 tonne of pure aluminium from 4 tonnes of bauxite ore [3]. Re-melting aluminium only takes about 5% of the energy used to produce primary aluminium and there is no downgrading of its properties. This makes aluminium a 100% recyclable material.
Commercially available pure aluminium has a purity grade of 99% aluminium. It has a density of 2700 Kg/m3, melting point around 660ºC, high reflectivity, high electrical conductivity and thermal conductivity and is very resistant to atmospheric corrosion [4]. In its unalloyed state it is very soft and ductile. By alloying it with other elements, enhanced properties can be obtained [5].
Two groups of alloys can be differentiated: wrought and cast alloys. Each group is then subdivided in different classes according to alloying elements. Copper, magnesium, zinc or silicon are the main alloying elements for aluminium.
2.2 Aluminium-Silicon alloys
Aluminium-Silicon based alloys constitute 85% to 90% of the total of cast aluminium products. Silicon as the main alloying element results in excellent castability, good corrosion resistance as well as machinability and weldability [6].
The cast aluminium-silicon system follows the equilibrium phase diagram presented in Figure 1. This phase diagram is useful to understand what phases form, at what temperature they form, the relative amounts of alloying elements in each phase (and how they are distributed) and the easiness to place a specific alloying element into aluminium [7].
Three main types of alloys can be differentiated according to the amount of silicon [6]:
Hypoeutectic (5 wt. % - 10 wt. %)
Eutectic (10 wt. % -13 wt. %)
Hypereutectic (13 wt. % – 20 wt. %)
The typical morphologies for these three types of alloys can be seen in Figure 1 b-d. Hypoeutectic alloys are formed of primary aluminium dendrites surrounded by Al-Si eutectic. This type of alloys give usually high strength and high ductility [6].

Theoretical background
9
Figure 1. (a) Aluminium-Silicon equilibrium phase diagram. (b) Hypoeutectic alloy microstructure. (c) Eutectic alloy microstructure. (d) Hypereutectic alloy
microstructure [8].
Eutectic alloys are those that have most of its microstructure as a eutectic phase of aluminium-silicon. They usually have a narrow freezing range, excellent fluidity, are easy to cast, have good wear resistance and are ductile if not heat treated or alloyed with other elements [6].
Hypereutectic alloys consist on primary silicon particles imbedded in the Al-Si eutectic. The higher amount of silicon provides this kind of alloy with a great wear resistance but makes them harder to machine because silicon is abrasive [6].
An important parameter for Al-Si alloys is the secondary dendrite arm spacing (SDAS). This parameter governs to some extent the mechanical properties [5]. It is locally linked to the cooling rate of the casting. Longer SDAS results in coarser phases and lower properties.

Theoretical background
10
2.3 Solidification
Cast aluminium silicon alloys can be cast in a wide variety of molds and techniques. Some of these are sand casting, plaster casting, gravity die casting, low and high pressure die casting. The different molds and processes result in different solidification behaviours and different defect formation [1].
Depending on the material of the mold, the ability to evacuate heat from the molten metal is different, therefore providing different cooling rates. As stated before, cooling rates are linked with SDAS. Cooling rates of 0.05 – 0.2 ºC/s are common for plaster molds or for dry sand while 50 – 500 ºC/s can be achieved in a metal die in HPDC [4].
An empirical equation for the relation between the solidification time and the
SDAS can be seen in equation 1 where 𝑡𝑓 is the solidification time, 𝑛 and 𝐾 are
alloy specific constants [9].
𝑆𝐷𝐴𝑆 = 𝐾𝑡 𝑓𝑛 (eq. 1)
An illustration of the measure and the concept of the SDAS can be seen in Figure 2:
Figure 2. Secondary dendrite arm spacing. Linear intercept measurement method [7]. Three dimensional representation.
According to the phase diagram in Figure 1, the typical solidification of an Al-7Si alloy follows this process:
After the melt is introduced in the mold, it starts to cool down. When the temperature is around 615 ºC, aluminium crystals start to form. This crystals continue growing, segregating silicon from the solidifying aluminium to the liquid melt, until the temperature is 577 ºC. At this temperature the eutectic mixture of aluminium and silicon starts to form [7].
Theoretical background
11
The coarseness of the microstructure is strongly dependant on the composition and casting process. HPDC causes a fine microstructure with small dendritic cells, small arm spacing, small grain size and small Fe-rich platelets. This is due to the rapid cooling. Permanent mold or sand casting provide slower cooling rates resulting in coarser dendrites and lamellar or acicular eutectic silicon particles for unmodified alloys close to the eutectic composition.
2.4 Modification
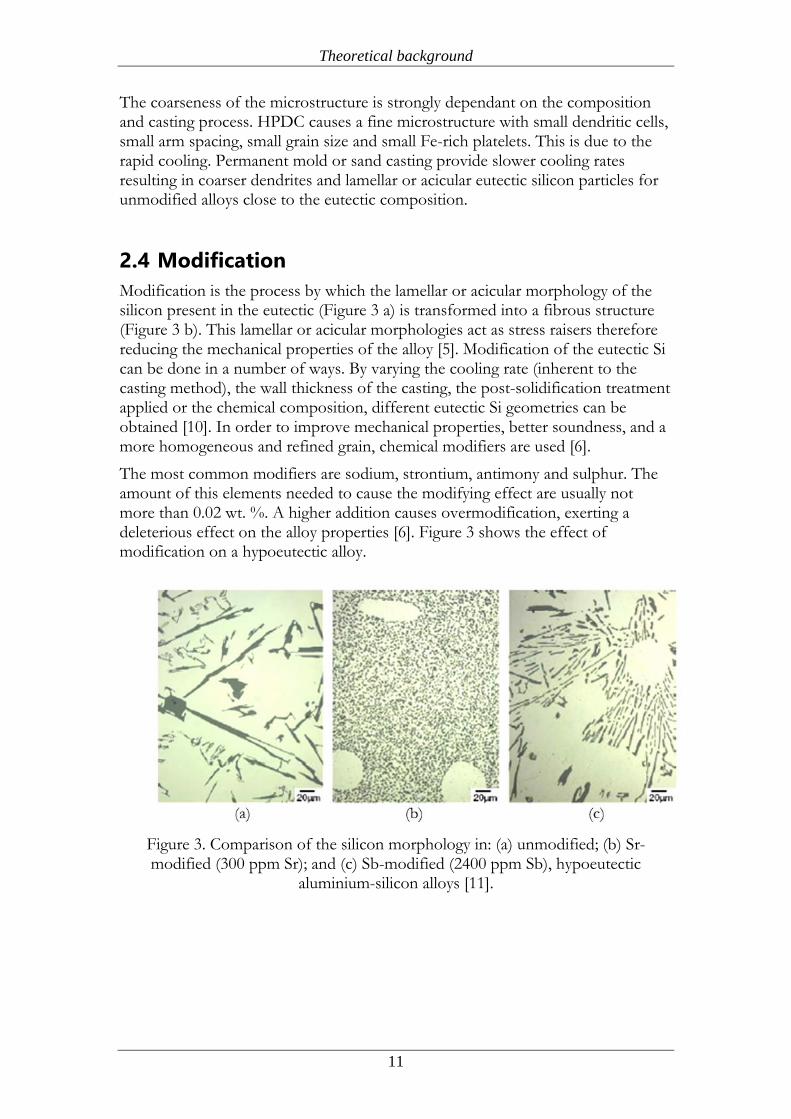
Modification is the process by which the lamellar or acicular morphology of the silicon present in the eutectic (Figure 3 a) is transformed into a fibrous structure (Figure 3 b). This lamellar or acicular morphologies act as stress raisers therefore reducing the mechanical properties of the alloy [5]. Modification of the eutectic Si can be done in a number of ways. By varying the cooling rate (inherent to the casting method), the wall thickness of the casting, the post-solidification treatment applied or the chemical composition, different eutectic Si geometries can be obtained [10]. In order to improve mechanical properties, better soundness, and a more homogeneous and refined grain, chemical modifiers are used [6].
The most common modifiers are sodium, strontium, antimony and sulphur. The amount of this elements needed to cause the modifying effect are usually not more than 0.02 wt. %. A higher addition causes overmodification, exerting a deleterious effect on the alloy properties [6]. Figure 3 shows the effect of modification on a hypoeutectic alloy.
Figure 3. Comparison of the silicon morphology in: (a) unmodified; (b) Sr-modified (300 ppm Sr); and (c) Sb-modified (2400 ppm Sb), hypoeutectic
aluminium-silicon alloys [11].

Theoretical background
12
2.5 Defects
Defects during the casting operation can be of different nature. Gas and shrinkage pores, cold fills, dross, alumina skins (oxide films) and iron rich intermetallics are some of these [1]. These defects result in lower and scattered mechanical properties [5].
Liquid aluminium is prone to absorb hydrogen and to form oxides on its surface. Hydrogen appears in aluminium from the dissociation of water vapour at the surface of the melt following the reaction:
2𝐴𝑙(𝑙) + 3𝐻2𝑂(𝑔) → 𝐴𝑙2𝑂3(𝑠) + 6𝐻
This reaction is favoured by temperature. Once an oxide layer is formed on the surface of the melt it will protect the rest of the melt. This protective layer stops being protective over 930ºC. The water vapour source can be the atmosphere, added fluxes, crucibles, combustion gases, refractories, foundry tools and even charge materials [6].
When the melt is poured into the mold, this oxide layers and hydrogen are mixed within the casting. In addition to this, when the melt solidifies, if there are feeding problems, shrinkage porosity will appear.
Gas pores are formed due to the nucleation of a gas bubble in the solidifying solid. Most of these gas bubbles are generally hydrogen resulting from the decrease of solubility in Al with the drop of temperature during solidification. When the dendrites grow, the gas bubbles are trapped in between. Nucleation of this gas bubbles needs very high levels of hydrogen. A melt that has properly been degassed will have a low level of pure gas porosity. The general degassing processes are: natural degassing, gas purging and vacuum degassing. Of these three, the one more widely spread in industry is gas purging. This process consists on forcing bubbles of another gas such as dry nitrogen or argon into the melt. These bubbles will help nucleate bubbles of hydrogen in the melt that will then float to the surface. Forcing the gas in the melt can be done through a graphite lance equipped with a porous graphite head to improve the effectiveness of the treatment [6].
Shrinkage pores appear during solidification when phases contract, leaving a gap that is not feed with melt because it is isolated from the liquid.
The majority of microporosity is due to a combination of both gas and shrinkage pores. Typical morphologies of these type of pores can be found in Figure 4. Gas pores have a spherical morphology while shrinkage pores appear as an irregular three dimensional shape [12]. Microporosity usually happens in interdendritic areas since these are the last to solidify. Here a collaborative effect of both types of porosity lead to the formation of the pore. It must be stated that the formation of a pore is usually assisted with inclusions in the melt [6].

Theoretical background
13
Figure 4. Optical micrographs of: (a)shrinkage pore and (b) gas pore [13].
2.6 Heat treatment
Aluminium alloys can be heat treated to improve their properties. The term heat treatment is used to describe thermal practices that modify the metallurgical structure of the product to control the properties obtained.
The designation used for the standard heat treatments for aluminium is [14]:
F, as-cast
T4, solution heat treated and quenched
T5, artificially aged from as-cast condition
T6, solution heat treated, quenched, and artificially aged
T7, solution heat treated, quenched, and overaged
Heat treatments can be optimized for each specific alloy and casting process. It has been shown that the heat treatment process should be taken as a whole, and not just solution treatment and ageing parameters [15].
Solution heat treatment aims to dissolve soluble phases containing Mg and Cu that have formed during solidification and homogenize the alloying elements. The time needed for homogenization is determined by the nature of the atoms diffusing, the treatment temperature and the coarseness of the microstructure normally represented by the SDAS. The temperature and time of the treatment is intimately related to the alloy composition and the solidification process. Temperatures just below the eutectic are favoured but incipient melting of last solidified phases should be avoided [14]. Not all phases formed during solidification dissolve during solution treatment. Phases found in Al-Mg-Si alloys such as β-Mg2Si are relatively easy to dissolve, phases containing Fe such as π-Al8Mg3FeSi6 are hard to dissolve and β-Al5FeSi platelets needs long times at high temperatures to fragment and undergo gradual dissolution [15]. The third aim of a solution treatment is to spheridize eutectic silicon particles. During the treatment, silicon particles first fragment and spheroidize and then coarsen. The as cast morphology and size of the particles as well as the temperature of the treatment strongly influences the

Theoretical background
14
time needed to produce the spheroidization [15]. Optimal treatment parameters for a sand cast Al-7Si-0.35Mg Sr modified alloy are 3-6 hours at 540ºC [16].
The objective of quenching is to supress precipitation upon cooling of the casting from the solution treatment temperature therefore obtaining a supersaturated matrix. The process consists in a rapid cooling from solution temperature to room temperature. This is usually performed by introducing the product in water kept at different temperatures depending on the treatment [14]. Casting alloys are sensible to quench rates. Below 4 ºC/s the sensitivity to cooling rates increases with Mg concentration. Above 4 ºC/s the sensitivity is independent of Mg content.
Ageing or precipitation heat treating makes reference to the change in properties that happen in the metallurgical structure as a function of time. The objective of ageing is to obtain a uniform distribution of small precipitates. It is related to the formation of Guinier-Preston (GP) zones, which are clusters that contain a high fraction of solute atoms, in the microstructure. This GP zones evolve from clusters of atoms that form from the supersaturated matrix after the solution treatment and quenching. For this reason, the effect of a T5 treatment will be improved if a fast cooling after solidification is performed before the artificial ageing [15].The dependence with time is highly alloy dependent. The process can be accelerated through artificial ageing at temperatures ranging from 90 ºC to 260ºC [14]. At this temperatures precipitates are usually larger in size than GP zones and atoms can move over larger distances [15].
Figure 5. Schematic graph of various heat treatments
2.7 Alloying elements
To modify the properties of aluminium-silicon alloys, other alloying elements and a combination between alloying elements and heat treatments may be used. Among these the two more important are magnesium and copper.
Theoretical background
15
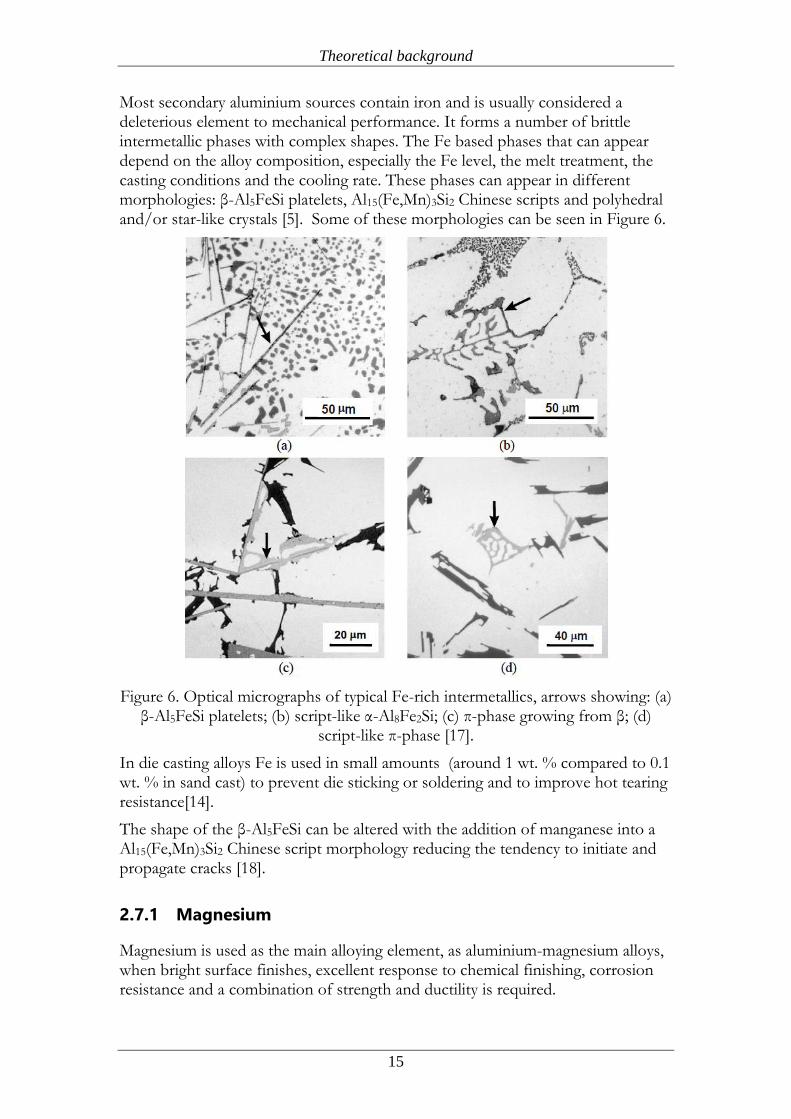
Most secondary aluminium sources contain iron and is usually considered a deleterious element to mechanical performance. It forms a number of brittle intermetallic phases with complex shapes. The Fe based phases that can appear depend on the alloy composition, especially the Fe level, the melt treatment, the casting conditions and the cooling rate. These phases can appear in different morphologies: β-Al5FeSi platelets, Al15(Fe,Mn)3Si2 Chinese scripts and polyhedral and/or star-like crystals [5]. Some of these morphologies can be seen in Figure 6.
Figure 6. Optical micrographs of typical Fe-rich intermetallics, arrows showing: (a) β-Al5FeSi platelets; (b) script-like α-Al8Fe2Si; (c) π-phase growing from β; (d)
script-like π-phase [17].
In die casting alloys Fe is used in small amounts (around 1 wt. % compared to 0.1 wt. % in sand cast) to prevent die sticking or soldering and to improve hot tearing resistance[14].
The shape of the β-Al5FeSi can be altered with the addition of manganese into a Al15(Fe,Mn)3Si2 Chinese script morphology reducing the tendency to initiate and propagate cracks [18].
2.7.1 Magnesium
Magnesium is used as the main alloying element, as aluminium-magnesium alloys, when bright surface finishes, excellent response to chemical finishing, corrosion resistance and a combination of strength and ductility is required.
Theoretical background
16
It is added to aluminium-silicon alloys to improve hardness and strength after heat treatment. It is also used in aluminium-silicon alloys that contain copper or nickel. Up to 0.7 wt. % it gives a very strong heat treatment response [14].
The properties of alloys containing Mg will be affected by how the Mg is present in the matrix, be it as coarse phases after solidification, as atoms in solid solution, as GP zones formed at room temperature or as precipitates during artificial ageing [18]. In as cast condition, the addition of Mg has a strengthening effect through the precipitation of Mg2Si and the transformation of the deleterious β-Al5FeSi platelets into a Chinese script phase with a composition close to Al8Mg3FeSi6 [19].
The precipitation sequence during ageing in Al-Si-Mg would be [16]:
i. Precipitation of GP zones (needles about 10 nm long);
ii. Intermediate phase β’-Mg2Si, (homogeneous precipitation);
iii. Intermediate phase β’-Mg2Si, (heterogeneous precipitation);
iv. Equilibrium phase β-Mg2Si, fcc structure (a= 0.639 nm), rod or plate-shaped (0.1×1µm).
Alloys containing Mg have a fast response to natural hardening. After 1 hour an increase in hardness can be seen reaching a plateau after 100 hours. No further hardening will happen after this [16].
2.7.2 Copper
Copper generally improves strength and hardness, both in as cast and heat treated conditions. It reduces hot tear resistance and increases the potential interdendritic shrinkage [14].
In aluminium alloys it forms a solid solution with a maximum solubility of 5.65 wt. % in equilibrium. It solidifies as Al2Cu after the main aluminium-silicon eutectic reaction in two forms: one as fine eutectic and the other one as blocky. If the Cu appears as a continuous network at grain boundaries, a loss of ductility will be observed. If it forms spheroidised particles in solid solution distributed homogeneously, an increase in strength will be obtained while retaining substantial ductility [5].
2.7.3 Magnesium and Copper
The addition of Mg and Cu together as alloying elements has been studied by various authors.
The sequence of solidification in Al-Si-Cu-Mg casting alloys during solidification can be described as follows [6]:

Theoretical background
17
i. Formation of a primary α-aluminium dendritic network at temperatures below 610°C, leading to an increase in the concentration of Si, Cu and Mg in the remaining liquid.
ii. At about 560°C, the aluminium-silicon eutectic temperature, the eutectic mixture of Si and Al forms, leading to further increase in Cu and Mg content in the remaining liquid.
iii. At about 540°C, Mg2Si and Al8Mg3FeSi6 form.
iv. At about 525°C, the interdendritic, sometimes called “massive” or “blocky” Al2Cu phase forms together with Al5FeSi platelets.
v. At about 507°C a eutectic of Al2Cu with interspersed Al forms. The phase Al5Mg8Si6Cu2 also forms at this temperature, usually with an ultrafine eutectic structure.
In as cast condition, in a study carried by Ouellet and Samuel [20] no significant difference in hardness behaviour was found for Mg additions over 0.3 wt. % to a Al-8Si-3Cu-Fe type alloy. Additions up to 0.33 wt. % were found to have a hardening effect up to 52%. A marginal hardening effect (6.5%) was found with an increase of Mg up to 0.5 wt. %. The Mg addition was found to lower the formation temperature of Mg2Si and Al2Cu+Al5Mg8Si6Cu2, increasing this way the melting temperature range for this alloy. It was also found that the amount of Al5Mg8Si6Cu2 increased with Mg content.
Both Cu and Mg enhance the strength properties in as cast and heat treated alloys. Among various interactions, those between magnesium and silicon, copper and aluminium and magnesium, copper and silicon are most significant [20].
Regarding heat treated conditions, 0.45 wt. % Mg additions to Al-5Si-3Cu was also studied by Ouellet and Samuel [21] showing an enhancement to heat treatment response both for T5 and T6. It also seems to facilitate the precipitation of Al5Mg8Si6Cu2 phase particles. Sr additions in this alloy seem to cause severe segregation of Cu containing intermetallics. This leads to the formation of blocky Al2Cu phase. During solution heat treatment, the dissolution of Al2Cu and Al5Mg8Si6Cu2 is rather slow due to the segregation of Cu-phases in Sr modified alloys. Solutioning at a temperature higher than the melting point of Al2Cu or Al5Mg8Si6Cu2 causes partial or complete melting of this phases which then reduce the alloy strength [21].
The cooperative precipitation of Al2Cu and Mg2Si phases in fine particles during ageing is responsible for alloy hardening. In peak aged condition Al2Cu and β’-Mg2Si are metastable phases coherent with matrix. Increased ageing time or temperature increases the size of particle. Moreover, equilibrium θ (Al2Cu) and β’ (Mg2Si) phases become incoherent particles and decrease the alloy strength. The size of this precipitated particles varies between 0.2-0.5 µm [21].
According to Apelian et al. [16], maximum concentration of Mg and Si particles in solid solution is achieved when the solution temperature is close to eutectic temperature.

Theoretical background
18
Shabestari et al. [22] investigated the effect of additions up to 2.5 wt. % Cu to an Al-7Si-Mg alloy. This was also studied by Seifeddine et al. [23]. What can be observed in Figure 7 is that density is increased with increased Cu additions and cooling rates. An increase in porosity was also observed with Cu additions. The possible mechanisms explaining this phenomena are [22]:
Ternary reaction at 525°C caused by Cu addition. At this temperature, copper content is high in the melt. When it solidifies, the volumetric shrinkage is increased and there is no liquid melt left to feed the cavities.
Hydrogen activity coefficient decreases with increased copper content, decreasing hydrogen solubility.
Figure 7. Change in density with Cu additions for an Al–7Si–0.35Mg alloy with different cooling conditions [22].
It seems that porosity formation is a process related to diffusion, therefore it will decrease with higher cooling rates. The influence of Cu additions related to different cooling conditions can be seen in Figure 8.
Figure 8. Influence of Cu additions to a Al–7Si–0.35Mg alloy with different cooling conditions [22].
Since porosity nucleates in the dendrite-eutectic interface, high cooling rates which produce smaller dendrites and eutectic cells will also reduce porosity.
Seifeddine et al. [23] observed that the coarseness and area fractions of phases like Al2Cu embedded as blocky and eutectic in between the dendrites and the Q-

Theoretical background
19
Al5Mg8Si6Cu2 phase was found to increase with increased copper levels, which is in accordance with the other authors cited here. Mg2Si phases are hardly found in Al-Si-Cu-Mg alloys. The reason for this can be explained by the cooling conditions, but also by the matrix ability to host elements. The silicon in solid solution in the α-Al matrix seems to be governed by cooling conditions and is not influenced by the copper additions.
2.8 Mechanical properties
2.8.1 Tensile strength
Tensile strength is a measure of a material’s ability to withstand a load under tension [24]. The information that the tensile test provides is used as basic design parameters and for acceptance test of the specifications of a material [25].
The uniaxial tensile test is one of the most common tests for determining several mechanical properties of a material. The results of the test are plotted as a stress-strain curve, also known as engineering stress-strain, using the data of load-elongation collected during the test. The Figure 9 shows a typical stress-strain curve [24].
Figure 9. Stress-Strain curve [25].
In it, the yield strength (Ys) representing the elastic limit of the material, the tensile strength or ultimate tensile strength (UTS) that represents the maximum load the material can take before necking of the sample begins and the fracture limit are marked. The impracticality of determining the exact point where the behaviour turns from elastic to plastic leads to the use of the “0.2% yield strength” as the measure when the material has experienced a 0.2% plastic deformation [24, 25].
The stress (S) is calculated as the load (P) divided by the cross-sectional area (A0) following equation 2.

Theoretical background
20
𝑆 =𝑃
𝐴0 (eq. 2)
Since during the testing there is a deformation of the sample being tested, the cross-sectional area decreases. The load required to deform the sample also falls. The average stress as calculated above decreases. To give a more accurate representation of the material behaviour, the true stress-true strain curve is introduced. The true stress is based on the instantaneous cross-sectional area and the true strain on instantaneous strain measurement [25]. Figure 10 shows qualitatively the difference between stress-strain curve and true stress-true strain curve.
Figure 10. Comparison of engineering and true stress-strain curves [25].
The true stress (σ) and true strain (ε) can be calculated from the engineering stress (S) and engineering strain (e) using equations 3 and 4.
𝜎 =𝑃
𝐴0 (𝑒 + 1) = 𝑆(𝑒 + 1) (eq. 3)
𝜀 = ln (𝑒 + 1) (eq. 4)
In addition, tensile properties such as Ys or UTS can sometimes be obtained indirectly by using hardness measurements. Fairly accurate quantitative relations can be done between hardness and other mechanical properties such as UTS, Ys and strain hardening coefficient [26].
The term hardness refers to the ability of a material to resist permanent indentation or deformation when in contact with an indenter under load. Hardness testing is among the simplest and the least expensive method of mechanical characterization of a material since it does not require an elaborate specimen preparation, involves rather inexpensive testing equipment, and is relatively quick. Several standards are available depending on the measurement performed. Some of these are Vickers, Brinell, Knopp or Rockwell.
The tensile behaviour for Al-Si alloys with additions of Mg and Cu has been studied by several authors.

Theoretical background
21
In additions to Al-Si-Mg alloys it has been observed that UTS increases because of Cu-bearing phases in the interdendritic spaces caused by the addition of Cu. Smaller SDAS yields finer silicon microstructures, secondary phases and smaller Fe-bearing intermetallic phases. All this would result in an improvement of UTS and elongation to fracture limits [22].
The relation between percentage of Cu addition, cooling rates and tensile properties such as UTS, Ys and elongation to fracture can be observed in Figure 11.
Figure 11. Influence of Cu percentage and cooling conditions on UTS, Ys and Elongation percentage in a Al-7Si-0.35Mg alloy [22].
The addition of Cu was shown to have an increase in Ys and UTS while it produced a decrease of ductility partially attributed to Si particles that tend to get coarser and partially to the formation of Cu bearing intermetallics in Al-Si-Cu-Mg alloys [23].
A decrease in the cooling rate, increasing the SDAS, will simultaneously decrease the UTS, Ys and elongation percentage [10, 23, 27].

Theoretical background
22
Figure 12. Influence of SDAS and increasing Cu levels on tensile strength of an Al-7Si-0.4Mg alloy. Cu levels increase from 0 to 5.4 wt. % following alphabetical
order from A to H [23].
The fracture surfaces of the tested samples are useful to understand how ductile or brittle a material is and also what mechanisms initiated the fracture. In this regard, the fracture surface has been observed to be in coarse dimples with intergranular look, characteristic of brittle, low ductility materials for low Cu additions (<2.5 wt. %)[22, 23]. Higher Cu levels accompany coarser structures and the mode of failure is nearly always transgranular [23].
On the other side, as explained before, the addition of Cu increases the porosity of the castings. This acts as stress concentrators, increasing with Cu content and therefore decreasing strength.
The balance between the strengthening effect of Cu additions and the negative effect of increased porosity caused by this additions will play a primary role in determining the UTS [22].
Approaching the same concept with additions of Mg to Al-Si-Cu base alloys, it was shown that the presence of Mg increased the UTS, Ys and hardness upon artificial ageing. Elongation percentage experienced a reduction with the increase of Mg content [20].
2.8.2 Fatigue limit
Fatigue is the progressive, localized, and permanent structural damage that occurs when a material is subjected to cyclic or fluctuating strains at nominal stresses that have maximum values less than (and often much less than) the static yield strength of the material [28].
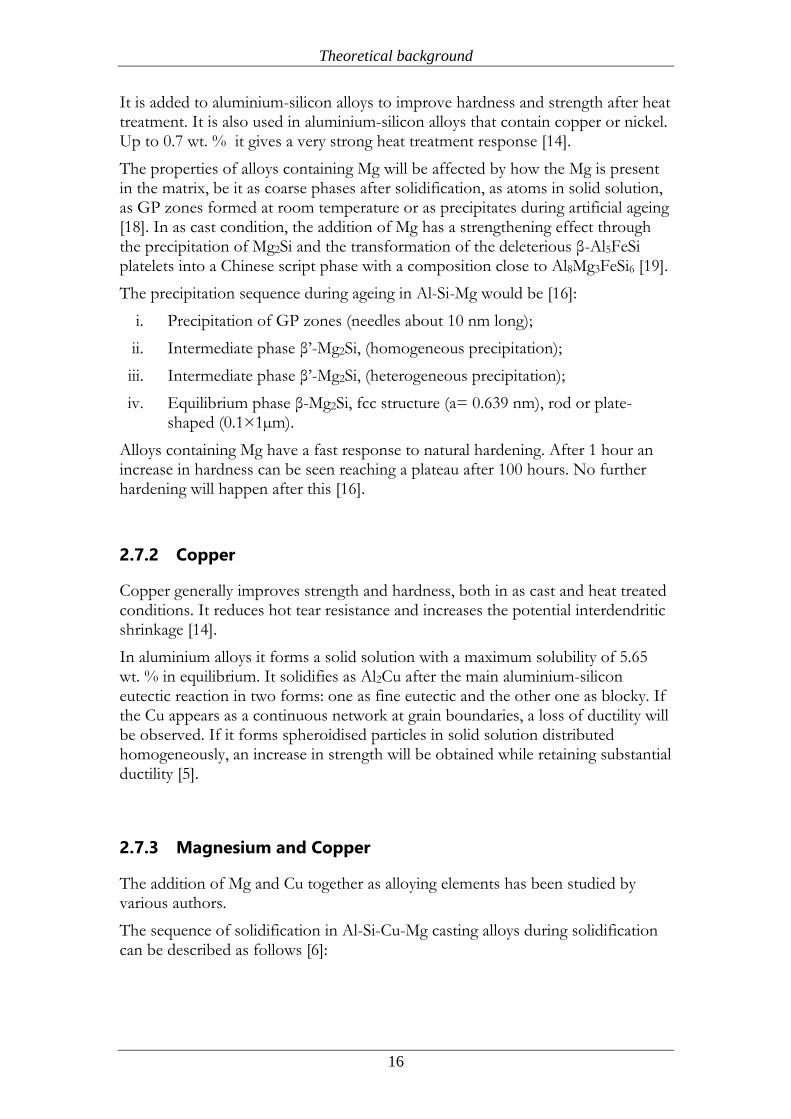
Three simultaneous conditions are required for the occurrence of fatigue damage: cyclic stress, tensile stress, and plastic strain. If any one of these three conditions is not present, a fatigue crack will not initiate and propagate. The plastic strain resulting from cyclic stress initiates the crack; and the tensile stress (which may be localized tensile stresses caused by compressive loads) promotes crack propagation [28]. A simplified scheme of this process can be seen in Figure 13.
Theoretical background
23
Figure 13. Sequence of processes during fatigue in metallic materials [29].
There are three basic types of fatigue properties, which are:
Stress-life (S-N) Strain-life (ε-N) Fracture mechanic crack growth (da/dN-ΔK)
Each of these properties are usually related to a design philosophy: Stress-life is paired to a safe-life infinite-life criteria and strain-life to a safe-life finite-life criteria. These two use the assumption of “no cracks”. When this assumption cannot be made, linear elastic fracture mechanics crack growth provides a characterization and quantification of the stress field.
Stress-life is characterized by the S-N curve, also called Wöhler curve. It represents the number of cycles needed at a certain stress level to produce failure of the sample. In this method, failure is usually defined as separation of the sample. Important parameters in testing are [28, 29]:
Stress ratio (R): 𝑅 = 𝜎𝑚𝑖𝑛
𝜎𝑚𝑎𝑥 (eq. 5)
Mean stress (σm): 𝜎𝑚 = 𝜎𝑚𝑎𝑥+𝜎𝑚𝑖𝑛
2 (eq. 6)
Mean strain (εm): 𝜀𝑚 = 𝜀𝑚𝑎𝑥+𝜀𝑚𝑖𝑛
2 (eq. 7)
Stress amplitude (Δσ/2): Δσ
2=
𝜎𝑚𝑎𝑥−𝜎𝑚𝑖𝑛
2 (eq. 8)
Plastic strain amplitude (Δεpl/2): Δε𝑝𝑙
2=
Δε
2−
Δσ
2 (eq. 9)
In which σmin, σmax, εmin, εmax represent the absolute minimum and maximum stress and strain values respectively.

Theoretical background
24
The stress ratio is of particular importance since it is useful for analysing crack-closure effects. R = -1 (σm = 0) represents fully reversed cycling and R = 0 (σmin = 0) cycling in pure tension compression [29]. The data points obtained by testing have a strong stochastic scattering and statistical methods should be used to obtain reliable fatigue limits [29].
The use of a finite-life approach comes to place when higher loads and stresses push the use of materials in their plastic region. For this reason, a characterization based on the strain makes more sense and so strain-life plots (ε-N plots) are used.
There are several experimental approaches for testing materials. The most common are the Wöhler tests. In them, the test specimens have a standard cylindrical or flat geometry and are subjected to fixed stress or strain under torsion, push-pull or bending loads. Tests are considered to be in high cycle fatigue (HCF) regime when number of cycles Nf > 104 and low-cycle fatigue (LCF) regime when Nf ≤ 104 [29].
As stated before, the initiation of a crack is of key importance in the evaluation of fatigue properties. For high-cycle fatigue (HCF) loading conditions and high-strength materials, the component’s fatigue life can be determined by the crack initiation phase up to a 90%. This process usually occurs at the specimen surface due to stress concentrators and maximum load conditions in the case of bending or torsion fatigue. Some common concentrators can be [29]:
Surface roughness or notches.
Surface protrusions.
Non-metallic inclusions.
Second phases, precipitations or pores.
Grain and phase boundaries.
According to S. Siegfanz et al. [30], the morphology of the solid solution/eutectic microstructure determines the fatigue crack propagation mechanism despite the significance of gas and shrinkage porosities in aluminium alloys. A high amount of solid solution Mg produces an increase in strength and therefore an increase in the fatigue life. In HCF regime the propagation of the crack is shear-stress controlled corresponding to high crack propagation rates. In the eutectic phase area, the propagation is decelerated by the Si particles that have a blocking effect. The crack path that is straight in the aluminium solid solution areas is deflected in the eutectic region. This has also been observed by Lados et al. [31]. As a consequence of this, a flat surface can be seen in the aluminium dendritic surface, while a rough surface can be observed in the eutectic region. As a general rule, a crack will seek the path of least resistance presented by the most damaged microstructural features ahead of it. SDAS has been found to be the critical microstructural feature controlling the crack growth as it represents the size of plastic zones with possibly damaged microconstituents [31].

Theoretical background
25
Porosity reduces the time to crack initiation by creating a high stress concentration region adjacent to this microstructural defect and is thus mainly responsible for decreasing the fatigue life. As the surface pore size increases, there is a marked decrease in the duration of the fatigue life itself [32]. An increase of pore fraction has been also shown to decrease fatigue life for sand and permanent mold castings. Not only the pore fraction but also the distribution of this pores is important.[33]. In defect free surfaces, the Si particles size and morphology has been found to be an alternative crack initiation site. Coarse and acicular Si particles are prone to be preferential initiation sites. Si particle-Al α-matrix interface in the interdendritic regions has been found to act as fatigue crack initiation sites [34].
A study carried on by A. Thirugnanam et al. [35] on Al-7Si-Mg with different Mg content alloys showed that crack propagates more along the Si particles than the Al-α matrix in Sr modified alloys. High Mg additions enhances the formation of hard brittle phases such as the Mg2Si and π -phase (Al9FeMg3Si5) that lowers the ductility and consequently the fracture toughness.
The tortuosity of the cracks was shown to be higher for low Mg content alloys compared to those with higher Mg values. The crack branching was found to decrease with the increase in Mg. Those alloys with Mg content up to 0.5 wt. % had an interdendritic type of fracture. All the different alloy compositions showed a mixed type of fracture (ductile and brittle) and striations surrounding the crack initiation area [35].
Yi et al.[36] studied the influence of Fe-content on the fatigue behaviour of Sr modified Al-7Si-0.35Mg T6 treated. They showed that the increase in Fe-content reduced fatigue life for Nf >106 cycles and that Fe-rich platelets promoted the formation of a fatigue crack for Fe levels > 0.55 wt. %.

Method and implementation
26
3 Method and implementation In order to determine possible solutions for prototyping, a total of six different conditions were selected:
1. Sand cast EN AC 42100 As cast.
2. Sand cast EN AC 42100 T5.
3. Sand cast EN AC 42100 + 2 wt. % Cu addition as cast.
4. Plaster cast EN AC 42100 As cast.
5. Plaster cast EN AC 42100 T6.
6. Plaster cast EN AC 42100 + 2 wt. % Cu addition as cast.
The different heat treatments were selected since T6 for sand casting and T5 for plaster casting had previously been shown by Scania to produce tensile properties above HPDC properties for the sand cast case and below for the plaster cast case. A schematic representation of this conditions in relation with the three key variables explained in chapter 1.1 can be seen in Figure 14.
Figure 14. Schematic representation of the conditions tested in this work.
3.1 Materials
Test samples where casted using the EN AC 42100 alloy provided by Dybacken Metall AB. The standard composition for this alloy can be seen in Table 1.
Table 1. EN AC 42100 standard alloy composition
Alloy Si Fe Cu Mn Mg Zn Ti
EN AC 42100 6,5-7,5 <0,15 <0,03 <0,1 0,3-0,45 <0,07 0,1-0,18
For the sand process, addition of Na for modification and TiBAl for grain refinement was in the form of a master alloy. Cu chips were used for the condition with Cu addition.
For the plaster process, the available information from the foundry is that Sr was used for modification.

Method and implementation
27
3.2 Process
3.2.1 Sand
Sand casted prototypes were produced by Unnarydmodell. Melting was carried on in a 100 kg furnace. Degassing was performed with the addition of degassing tablets followed by the addition of the master alloys for modification and grain refinement.
For the alloy with Cu additions, the Cu chips were put in aluminium foil and pushed to the bottom of the furnace. The melt was then slowly rotated to ensure homogeneous distribution of the Cu addition but avoiding the breakage of the protective oxide surface skin. All tools that came in contact with the melt had previously been coated to avoid contamination. The melt was then kept at 720 ºC.
Before proceeding with the casting of the samples, a spark test spectrometer composition analysis was performed on a sample casted in a steel mold.
The molten metal was poured from a ladle into each mold. These were designed with the fatigue sample geometry for five samples each with a parting line in the middle. The ladle was refilled for each pouring. The cope was pushed down when pouring the melt.
After cooling down, the samples were blasted with 0.5 mm diameter stainless steel balls on all surfaces.
3.2.2 Plaster
The procedure at Hackås Precisionsgjuteri, as reported by the company, was as follows:
After the melting of the base alloy, and the additions of Sr for modification, the melt was degassed with Nitrogen for four and a half minutes approximately and then left to rest overnight. Casting process was started next morning with an untouched melt. A sample for spectrometric analysis was taken. Finding the results in acceptance to SS EN 1706, the melt was gravity casted in the plaster mold (two samples per mold).
In the case of Cu addition alloy, after melting, Cu was added. Degassing was not performed for reasons out of their control and the melt was left to rest overnight.
The procedure followed the next day was the same as for the base alloy samples.
3.3 Heat treatment
Sand cast samples from Unnaryd foundry were T5 heat treated by the foundry at 180ºC for 5 hours.

Method and implementation
28
Plaster cast samples from Hackås foundry were T6 treated at JTH with an artificial ageing tailored to achieve hardness results similar to that of HPDC. In order to choose the parameters for the treatment, one fatigue sample was first cut into five pieces. One of these was kept as a reference sample while the other four were subjected to the following treatment:
1. Solution heat treatment at 530ºC for 6 hours with 20 minutes for heating samples in a Nabertherm L40/11 furnace. Temperature was assured at the sample position by previously logging the temperature with a type N thermocouple.
2. Quench with agitation in hot tap water measured at 54ºC with a type N thermocouple.
3. Natural ageing for 24 hours at room temperature.
4. Artificial ageing at 180ºC in a Nabertherm TR-120 furnace with air circulation with 20 minutes for heating samples. The pieces were taken out after 1, 2, 5 and 20 hours respectively. The temperature drop for the pieces left in the furnace when one piece was taken out was measured to be 2 ºC reaching the treatment temperature again in 1 minute.
The results from the hardness measurements to select the artificial ageing time are presented in Figure 15.
Figure 15. Hardness measurements for tailoring artificial ageing in T6 treatment.
After evaluation of the results for each different ageing time, a 5 hour artificial ageing time was selected as it provided hardness values most similar to those previously measured by Scania. The samples received a heat treatment following the same parameters and procedure as followed for the study to choose the parameters.
A fixture for performing the heat treatment on several samples at the same time was designed and produced at JTH. Figure 16 shows one of the fixtures used.
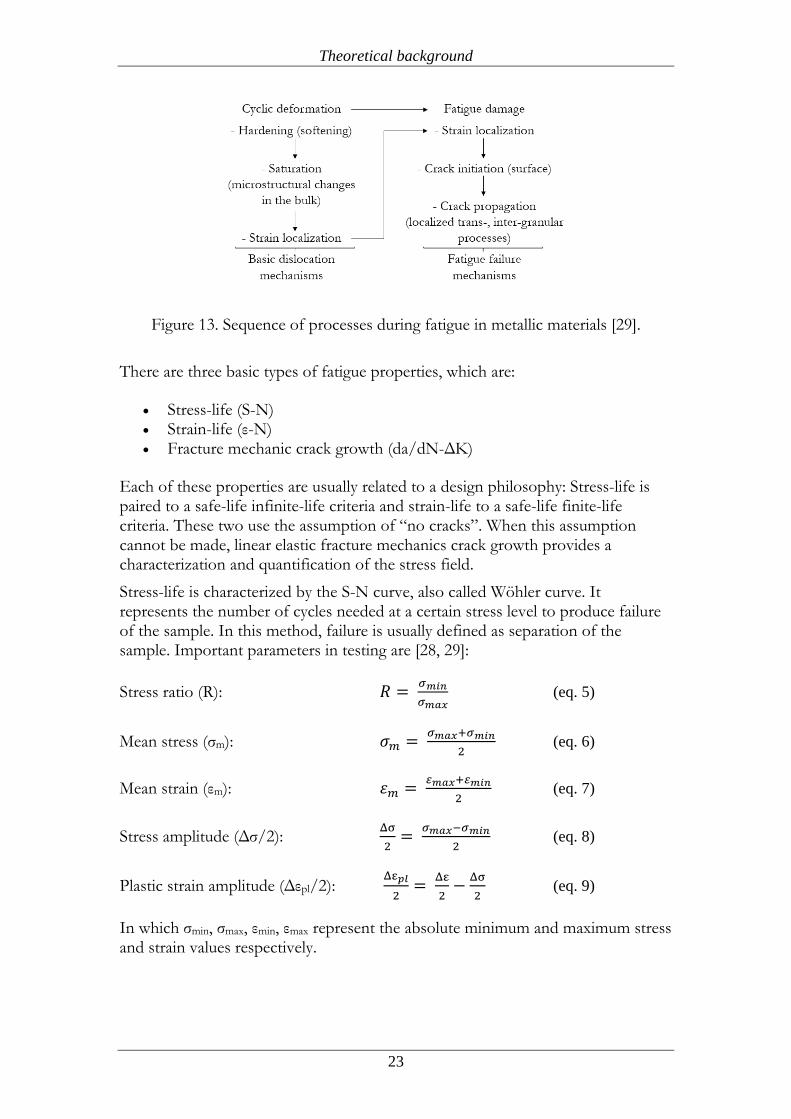
50
82
92 96101
0
20
40
60
80
100
120
0 5 10 15 20 25
HB
W 5
/25
0
Time (h)

Method and implementation
29
Figure 16. Fixture for performing heat treatment of flat samples.
3.4 Material characterization
3.4.1 Microscopic
Samples for microscopic investigation were taken from tensile testing samples representative of each different alloy, casting date and heat treatment date as shown in Table 2. They were cut from an area at least 20 mm separated from the fracture surface and 5 mm from the clamping surface. A schematic representation of the surface studied can be seen in Figure 17.
Figure 17. Cut lines for microscopic investigation. Dotted lines represent where the sample for investigation was cut.
Table 2. Samples for microscopic investigation
Process Alloy Treatment Cast date Heat treatment date
Sand EN AC 42100 As cast 2015-04-02 -
Sand EN AC 42100 As cast 2015-04-13 -
Sand EN AC 42100 T5 2015-04-02 2015-04-02
Sand EN AC 42100 T5 2015-04-13 2015-04-13
Sand EN AC 42100+Cu As cast 2015-04-17 -
Plaster EN AC 42100 As cast 2015-03-25 -
Plaster EN AC 42100 T6 2015-03-25 2015-04-08
Plaster EN AC 42100 T6 2015-03-25 2015-04-28
Plaster EN AC 42100+Cu As cast 2015-03-25 -

Method and implementation
30
The mentioned samples were cut with an abrasive cutter and then hot mounted in 40 mm diameter mounts with a Struers CitoPress-20 applying 175 bar of pressure with 180ºC heating for 4 minutes. After that, they were first grinded for 20 seconds applying 60 N force and then polished following standard procedures.
Optical microscopy was performed with a Zeiss AX10 ImagerM2m. Image analysis was done with the microscope software. Panoramic images of the whole prepared surface were taken to have an idea of the overall defects of the samples as well as the location of these.
In the case of samples from the same condition but different casting or heat treatment date, the investigation was performed on both samples and results were compared.
For SDAS determination, 15 measurements were taken, using the linear intercept method, from 3 to 4 different locations on the mounted sample. Measurements were started on one corner of the sample proceeding to the centre as shown in red in Figure 18. Then the average and the standard deviation was calculated.
Figure 18. SDAS measuring positions procedure
Defects were measured according to Scania standard STD4369 as the maximum length on the polished surface. According to this standard, two or more isolated defects were measured as one when the distance “X” between these was smaller than half of their added length. Figure 19 illustrates this concept.
Figure 19. Criteria for combining two defects when X ≤ 1/2(L1+L2) [37].
Following this same standard, the inner defect level was selected. According to it, there are five levels of defects, where level 1 the minimum defect level. Length of Fe platelets and Si particles was measured in 3 different positions randomly selected.

Method and implementation
31
3.4.2 Fractographic
Qualitative fractographic investigation was performed both by visual inspection documented with pictures taken with a Canon 1100D with a 18-55 lens and macro photography adapters and through stereomicroscopy with a Zeiss Stereo DiscoveryV12 microscope. Due to the principles of stereomicroscopy, images taken from that process are hard to understand. Markings on these images, along with the description of what was perceived during the investigation is presented.
The process followed for this qualitative investigation was based on comparing the position, overall geometry and colouring of the fracture surfaces within the condition studied. Figure 20 shows how samples were aligned for the investigation. Both parts of the separated samples were put next to each other and the “odd one out” that seemed to have a different colour, fracture surface morphology, or that had fractured through a location far from what was observed on the rest of the samples was picked and investigated with the stereo microscope. A reference sample from the condition with similar stress load during testing was investigated along.
Figure 20.Scheme showing how samples were aligned for the qualitative fractographic investigation. The sample marked in red represents a sample that
would be considered different.
3.4.3 Radiographic
Samples to be fatigue tested were first radiographed in an X-ray Bosello equipment to determine porosity levels and possible defects. Samples were introduced in the equipment in groups of five. They were marked to keep track on the position in which they were tested. A wire-scale according to ISO9915 (W10AL) was placed facing the radiation source in front of one of the samples

Method and implementation
32
along with an 8 mm steel ball to determine the maximum resolution of the test and to allow for measurements of phenomena. The emitter voltage and current was kept in the interval of (51kV, 54kV) and (2.3mA, 3mA). Images were processed with the in-build image processor of the X-Ray equipment.
To keep track of possible surface defects the four faces of the samples were also photographed.
3.4.4 Tensile test
Tensile samples were machined from the fatigue test geometry following the specifications in Figure 21. Samples from the same condition (foundry, alloy, treatment) were machined with a numerical control milling machine with the same setup. A total of 5 samples from each option were used.
Figure 21. Tensile test geometry
Tests were performed in a 100 kN axial capacity Zwick/Roell Z100 machine with a 20mm gauge length clip-on extensometer.
Clamping pressure was of 100 mBar. A preload of 200 N was applied to straighten the rods. The test was position controlled with an elongation rate of 0.006 mm/s.
A Matlab script taking the strain and the force applied as inputs was used to evaluate the results. In it, the interval for calculating Young’s modulus (E) was selected from an engineering stress-strain plot. True stress-true strain plot was then calculated following the reasoning explained in 2.8.1.
The average and the standard deviation was calculated from the results obtained with Matlab.
3.4.5 Hardness
Hardness measurements for the different conditions were performed according to HBW 2.5/62.5 (SS-EN ISO 6506-1:2014) with a KB3000BUZ machine. Three indentations were made on each of the samples that had previously been mounted and polished as explained in 3.4.1.
Indentations were measured with the machine built-in software.

Method and implementation
33
3.4.6 Fatigue test
The sample geometry for the fatigue tests can be seen in Figure 22.
Figure 22. Fatigue testing geometry
All samples were measured using a digital calliper. Several points were measured in the same sample. The minimum value was chosen for each dimension measured.
High cycle bending fatigue tests were performed in a fatigue rig designed by Scania. This rig works as follows:
The load is applied via a spring of known Young’s modulus value connected to an adjustable eccentric disc fixed to a motor. By varying the eccentricity and the geometry of the springs, different loads and stress ratios (R) can be achieved. Figure 23 shows one of the two testing rigs used.
Figure 23. Fatigue testing rig: a) clamped test sample b) spring c) eccentricity
In order to calculate the stress applied, the system can be modelled as seen in Figure 24.

Method and implementation
34
Figure 24. Schematic of a mounted sample in the fatigue rig.
The stress applied to the sample can then be calculated as the superposition of two loading conditions: a uniaxial load in the x direction with force P and a cantilevered beam with a moment applied at the free end.
The resulting equation is:
𝜎 = 𝑃
ℎ𝑑 (
6𝐿
𝑑+ 1) (eq. 10)
𝐿 = 𝐿3 − 𝐿2 −𝐷
2 (eq. 11)
Where L3 and L2 are the distances from Figure 24 and D, d and h are geometric parameters measured from the sample.
According to the Scania technical report 7023850, a geometric correction factor of 1.04 should be applied to this maximum stress.
A total of 20 samples could be tested at the same time. A distribution of the different conditions tested was used for each run to avoid testing all the samples for a condition at the same time. The stress ratio was set at R=-1 (fully reversed load). Samples that were not broken after 3 million cycles were considered run outs.
After testing, the information recorded by the rig was analysed with a Matlab script to check loading conditions. Loading conditions for two samples are presented in Figure 25 as an example of the analysis performed with the Matlab script.

Method and implementation
35
Figure 25. Load conditions plot. To the left is a plaster cast EN AC 42100 Cu addition sample loaded to 60 N that broke at around 1.6 million cycles. To the
right a run out sand cast EN AC 42100 in as cast condition loaded at 60 N.
The stress was then calculated using the formula mentioned in equation 10 and the 1.04 geometric correction. This test results were later on analysed using the Scania software UTM2. In it, a semi- logarithmic S-N curve was used to evaluate the results. A 3rd grade polynomial was fitted to the S-N data using the maximum likelihood method.

Results and discussion
36
4 Results and discussion In this chapter the results obtained by following the experimental procedure just explained are presented. An analysis on these results and the motivation for the different decisions taken during the analysis is given. Comparison to available results from other solutions previously tested by Scania and with the HPDC reference properties are also presented. Results are then discussed with respect to the literature reviewed by the author.
The resulting compositions for the two different alloys, measured at Sapa Technology using an optical emission spectrometer, can be seen in Table 3.
Table 3. Alloy compositions
Alloy Si Fe Cu Mn Mg Cr Ni Zn Ti Pb Na
Sand EN AC 42100
7.2 0.12 <0.01 <0.01 0.45 <0.01 <0.01 <0.01 0.14 <0.01 0.0038
Sand EN AC 42100 + Cu
8.3 0.31 2 0.08 0.42 <0.01 0.01 0.28 0.16 0.03 0.0046
Plaster EN AC 42100
7.1 0.05 <0.01 <0.01 0.25 <0.01 <0.01 <0.01 0.11 <0.01 <0.0001
Plaster EN AC 42100 + Cu
7 0.13 1.7 <0.01 0.36 <0.01 <0.01 <0.01 0.12 <0.01 <0.0001
It is important to note that, there is a noticeable difference in the composition of the Cu addition condition for the sand cast process. While all plaster cast samples and EN AC 42100 alloy sand cast samples are within the standard for EN AC 42100, the sand cast Cu addition condition has Si, Fe and Zn values over the intervals set for the EN AC 42100 alloy. While the higher level of Si should not produce a drastic change in properties, the higher levels of Fe are likely to result in higher Fe-rich platelets with the subsequent decrease in mechanical properties.
4.1 Microstructure
As established in 2.3, the microstructure is strongly dependent on the compositions and casting processes. In this study sand and plaster molds were used. Micrographs of the different conditions tested can be seen in Figure 26 a-e. Previously EN AC 46000 sand casted (Figure 26 g) and HPDC (Figure 26 h) micrographs tested by Scania are also presented for comparison. Notice that all micrographs are taken with the same magnification.
Differences between sand, plaster and HPDC can be seen. While clearly different sized, dendrites can be recognised both in sand and plaster cast micrographs. It is not as clear in the HPDC case. The main differences within the same casting procedures for the different alloys and conditions that can be seen in these micrographs (Figure 26) are in terms of porosity shape and quantity. No significant difference was found for the case of samples from the same condition casted or heat treated on different dates. The results presented in the following sections consider then the most representative value for this cases.

Results and discussion
37
a) Sand cast, as-cast
b) Plaster cast, as-cast
c) Sand cast, T5 treated
d) Plaster cast, T6 treated
e) Sand cast, Cu addition as-cast
f) Plaster cast, Cu addition as-cast
g) Sand cast, EN AC 46000
h) HPDC, EN AC 46000
Figure 26. Micrographs with same magnification (500µm scale bar); (a-d) are EN AC 42100 alloy, (e, f) are EN AC 42100 + Cu alloy and (g, h) are EN AC 46000
alloy.

Results and discussion
38
4.1.1 SDAS
As explained in the introduction to this chapter, dendrites in sand and plaster samples had different size. Due to the morphology of the dendrites observed, the average number of dendrites intercepted in the measurements was different; only 3 dendrites in line were found for HPDC while for sand and plaster cast samples this average was 5. Figure 27 shows an example of this difference. Notice that the micrographs are taken with different magnification. The number of dendrites intercepted in the measurements and the coarseness of these was bigger as the measuring positions neared the centre.
a)
b)
Figure 27. SDAS measurements: a) Sand cast EN AC 42100 Cu addition (200µm scale bar) b) HPDC EN AC46000 as cast (50µm scale bar).
The average and standard deviation for the SDAS measurements is presented in
Figure 28. Values for EN AC 46000 sand cast and HPDC are presented for comparison.
Figure 28. SDAS (µm) average and standard deviation.
2123
20
5551
47
19
8
0
10
20
30
40
50
60
70
As cast T5 Cuadditon
As cast T6 Cuadditon
Sand Cast HPDC
SAND EN AC 42100 PLASTER EN AC 42100 EN AC 46000
SDA
S (µ
m)

Results and discussion
39
As can be observed in Figure 28, the different conditions can be grouped by their casting procedure, regardless of the alloy. Doing so, sand cast samples have a SDAS of around 20 µm, plaster cast samples of around 50 µm and HPDC of 8 µm. Related to what was explained in chapter 2.3, it can be affirmed that cooling rates for sand casting are higher than for plaster casting and that HPDC has a higher cooling rate than both prototyping processes here discussed. This is all in accordance to the reviewed literature [22, 23] and what was presented in 2.3.
What might also be observed in Figure 28 is that the standard deviation for plaster casting is considerably bigger than for sand casting and HPDC. Taking into account the different positions used for measuring SDAS (Figure 18), the increase of dendrites intercepted in the measurements as the measuring position nears the centre, and the different cooling rates found, the standard deviation could be interpreted as an indicator of the difference between the surface and the centre of the samples in terms of this measurement, meaning that a bigger difference in SDAS can be found for plaster cast samples than for sand cast samples or HPDC samples. This would be in accordance with what was found by Seifeddine [5] relating local solidification times to the differences in microstructure. It could also be assumed that for thicknesses under 6 mm (which is the sample thickness), small variations in SDAS can be expected in sand casted and HPDC parts.
4.1.2 Defects
The radiographic investigation showed that there were no defects in the form of porosity or inclusions above 0.2 mm in size, which was the minimum resolution for the equipment.
Upon micrographic investigation, defects were found to be generally in the form of porosity. In Figure 29 the maximum defect size can be observed.
Figure 29. Maximum defect size (µm).
According to the Scania standard, this defects were classified in levels. This classification is presented in Table 4.
668
1191
372299
584
947
677
146
0
200
400
600
800
1000
1200
1400
As cast T5 Cuadditon
As cast T6 Cuadditon
SandCast
HPDC
SAND EN AC 42100 PLASTER EN AC 42100 EN AC 46000
Max
imu
m d
efe
ct s
ize
(µ
m)

Results and discussion
40
Table 4. Defect level according to Scania standard (STD4369)
SAND EN AC 42100 PLASTER EN AC 42100 EN AC 46000
As cast T5 Cu addition As cast T6 Cu addition Sand Cast HPDC
Defect Level 3 4 2 2 3 3 3 1
Since the porosity is related to the casting procedure and alloy, and not to the heat treatment performed, the maximum defect size could be then considered to be around 1.2 mm (defect level 4) for sand cast EN AC 42100 conditions, around 0.4 mm (defect level 2) for the sand cast Cu addition, around 0.6 mm (defect level 3) for the plaster cast EN AC 42100 conditions and around 1.0 mm (defect level 3) for the Cu addition one. Figure 30 shows some examples of the gas and shrinkage porosity found.
a)
b)
c)
d)
e) f)
Figure 30. Examples of the defects found in: Sand cast a) EN AC 42100 As cast, b) EN AC 42100 T5, c) EN AC 42100 2%Cu As cast; and plaster cast d) EN AC 42100 As cast, e) EN AC 42100 T6 and f) EN AC 42100 1.7% Cu As cast
These results seem somehow contradictory. According to the literature reviewed (presented in chapter 2.7.3) porosity should have increased with the addition of Cu to the base alloy. This happened in the case of plaster cast conditions, but, the same was not observed in the sand cast conditions. It has already been set that the Cu addition sand cast samples have a variation in composition with respect to the base alloy but taking into consideration the mechanisms suggested in the literature that produce this increase in porosity, that is, a ternary reaction at 525°C caused by Cu addition and the decrease in hydrogen solubility, the porosity content for the Cu addition condition should at least be the same as in the base alloy condition, but not smaller. One possible explanation for this observations can be due to the different procedure used to determine porosity. While the biggest pore size has been used for the investigation, the literature reviewed used volumetric porosity percent as the difference between the measured samples and a reference sample considered to be the lowest porosity. With this in mind, porosity volume

Results and discussion
41
could have increased for the Cu addition condition while the size of these pores could be smaller. Another rather simple possible explanation for this seemingly contradictory result would be that just by chance, the surface investigated for the Cu addition condition was pore free and that by polishing the same surface again, bigger pores would be found.
Comparing to the defect levels found for EN AC 46000, all conditions suggested in this work were found to have a higher level of defects that the HPDC process and a similar one compared to the sand cast process.
4.1.3 Intermetallics & Silicon eutectic
The different processes and alloys yielded different intermetallic phases and sizes. The focus of the measurements has been in Fe-rich phases that appeared as platelets called β-phase. Values for the maximum size of Fe-rich platelets and Si particles are presented along with those for EN AC 46000 sand cast and HPDC in Figure 31.
Figure 31. Maximum size for Fe-rich phases and Si particles (µm).
For the interpretation of the Fe-rich platelets size, the alloy composition should be kept in mind. Regarding the Fe content, all samples are within the 0.05-0.13 wt. % interval except for the sand cast EN AC 42100 with Cu addition, which has a 0.3 wt. % Fe content, being 0.15 wt. % the maximum stated in the standard for EN AC 42100.
Since β-phase platelets are not substantially altered during heat treatment [17], the maximum size for a given alloy and process can be generalized regardless of the heat treatment performed. Assuming this, it can be said that for the EN AC 42100 base alloy maximum β-phase platelets are around 80 µm and 250 µm for sand and plaster casting respectively. For the Cu addition, the values would be of 140 µm
82
46
140156
246
163
100
2935 33
7288
121
179
41
280
50
100
150
200
250
300
As cast T5 Cuadditon
As cast T6 Cuadditon
SandCast
HPDC
SAND EN AC 42100 PLASTER EN AC 42100 EN AC 46000
Max
imu
m s
ize
(µ
m)
Fe Max
Si Max

Results and discussion
42
and 180 µm. Comparison between this two last values should be done carefully due to the increased Fe level for the sand cast Cu addition case.
One possible explanation for the decrease in β-phase platelets for the Cu addition condition in the plaster process could be due to an increase of Fe intermetallics with Cu, reducing the amount of Fe available to grow into platelets.
Regarding the eutectic Si size, as Figure 31 shows, plaster cast yielded bigger Si particles than sand casting. Compared to β-phase platelets, Si was found to be smaller in all cases except for plaster cast Cu addition.
Concerning the eutectic Si morphology, differences can be seen in the Si shape from sand cast samples to plaster cast samples. This is illustrated in Figure 32. While both alloys are chemically modified (Na for sand casting, Sr for plaster casting), plaster cast alloys display a partial modification while sand cast alloys display a full modification in the shape of fibrous Si. Although the cooling rate has an influence in the modification process, with the right amount of modifier, even at lower cooling rates, full modification should be possible to achieve [6]. It is important to note that even though the amount of modifier measured for the plaster conditions seems to be within range, only free modifier atoms in the melt can cause modification. In conversations with the foundry, it has been mentioned that there might be a reaction between the Sr added and the mold material reducing the effective Sr available for modification [38].
The case for the T6 treated alloy deserves special mention. During solutioning, the tips of the needle-like eutectic Si should become rounded [15]. As can be seen in Figure 32 and Figure 33 this has not been the case.
a)
b)
c)
d)
e)
f)
Figure 32. Eutectic Si morphologies: Sand cast a) EN AC 42100 As cast, b) EN AC 42100 T5, c) EN AC 42100 2%Cu As cast and plaster cast d) EN AC 42100
As cast, e) EN AC 42100 T6 and f) EN AC 42100 1.7% Cu As cast.

Results and discussion
43
Figure 33. Micrograph showing the different morphologies of eutectic Si in a T6 treated EN AC 42100 plaster cast alloy (10x magnification): a) round shaped Si, b)
needle-like shaped Si.
Other intermetallics were also found. For the EN AC 42100 base alloy, Fe-rich intermetallics in the shape of Chinese script were observed as well as Mg2Si. In the alloys with Cu additions, Q phase-Al5Mg8Si6Cu2 and Al2Cu-eutectic were spotted. Figure 34 shows some of the phases found in the different conditions.
Figure 34. Micrographs showing different intermetallics found in: Sand cast a) EN AC 42100 As cast, b) EN AC 42100 T5, c) EN AC 42100 2%Cu As cast; and
plaster cast d) EN AC 42100 As cast, e) EN AC 42100 T6 and f) EN AC 42100 1.7% Cu As cast.
4.2 Mechanical properties
As was stated in chapter 1.1 the mechanical properties are influenced by the process, system and post-solidification variables. This influence has been evaluated with tensile, fatigue and hardness tests.

Results and discussion
44
4.2.1 Tensile
The most representative curve for each condition has been plotted in Figure 35. All the test results can be found in Appendix 2 (8.2). For each condition, the curve that had UTS, Ys and elongation values closer to the average was selected as the representative one.
Figure 35. Tensile curves
It is clear that in the as cast conditions, the performance of the sand cast conditions is better than the plaster cast ones. While elongation is slightly smaller, UTS and Ys is higher for the sand cast conditions. Heat treated conditions and Cu addition conditions show an improvement with respect to the as cast conditions. The condition that shows higher tensile values is the T6 treated plaster cast EN AC 42100 while the lowest values where found for the plaster cast EN AC 42100 in as cast condition.
The values for UTS, Ys and elongation to fracture are presented in Figure 36, Figure 37 and Figure 38 with the correspondent standard deviation. Values from previous test performed by Scania for sand cast Al-10Si-Mg (EN AC 43100) in as cast and T6 condition and for EN AC 46000 sand cast and HPDC are presented also [39-41]. The dotted horizontal line in red represents the value for EN AC 46000 according to standard SS-EN 1706:2010.

Results and discussion
45
Figure 36. UTS (MPa)
The only condition that is within range of the value established by the standard is the plaster cast EN AC 42100 T6 treated (230 MPa). It is important to notice that the standard deviation for this condition is bigger than for the other conditions studied in this work. From the five samples studied, three performed in the surroundings of 240 MPa while the other two only reached around 210 MPa.
It can be noted that the sand cast process yielded higher values in the as cast and Cu addition conditions compared to the equivalent conditions in the plaster cast process. It is easy to discern the effect of heat treatment for both processes. In the case of sand casting, the T5 treatment (188 MPa) yielded an 11% increase in terms of UTS. An 80% increase was achieved with the T6 treatment in the plaster cast samples.
With respect to the Cu addition, for the plaster process (137 MPa) it was shown to improve the strength in 10% with respect to the base alloy (125 MPa). In the case of the sand process, the average was found to be the same as for the base alloy in as cast condition (169 MPa). Due to the big difference in composition that was already explained in the beginning of this chapter, interpretation of this result should be done with care
169
188
169
125
230
137
165
224
179
225
100
120
140
160
180
200
220
240
260
As cast T5 +2%CuAs cast
As cast T6 +1.7%CuAs cast
As cast T6 SandCast
HPDC
SAND EN AC 42100 PLASTER EN AC 42100 SAND EN AC43100
EN AC 46000
UTS
(M
Pa)
240
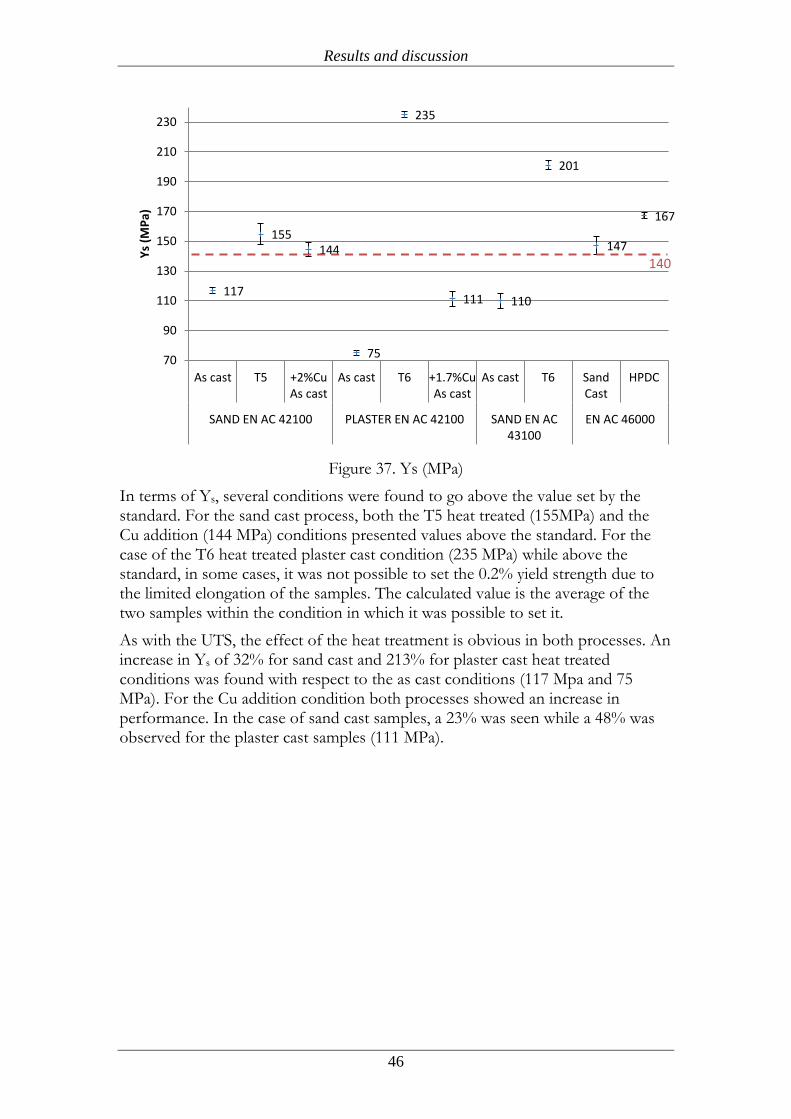
Results and discussion
46
Figure 37. Ys (MPa)
In terms of Ys, several conditions were found to go above the value set by the standard. For the sand cast process, both the T5 heat treated (155MPa) and the Cu addition (144 MPa) conditions presented values above the standard. For the case of the T6 heat treated plaster cast condition (235 MPa) while above the standard, in some cases, it was not possible to set the 0.2% yield strength due to the limited elongation of the samples. The calculated value is the average of the two samples within the condition in which it was possible to set it.
As with the UTS, the effect of the heat treatment is obvious in both processes. An increase in Ys of 32% for sand cast and 213% for plaster cast heat treated conditions was found with respect to the as cast conditions (117 Mpa and 75 MPa). For the Cu addition condition both processes showed an increase in performance. In the case of sand cast samples, a 23% was seen while a 48% was observed for the plaster cast samples (111 MPa).
117
155144
75
235
111 110
201
147
167
70
90
110
130
150
170
190
210
230
As cast T5 +2%CuAs cast
As cast T6 +1.7%CuAs cast
As cast T6 SandCast
HPDC
SAND EN AC 42100 PLASTER EN AC 42100 SAND EN AC43100
EN AC 46000
Ys
(MP
a)
140

Results and discussion
47
Figure 38. Elongation to fracture (%)
In regard to the elongation to fracture, the base alloy in both casting processes showed values above the standard (2.0% for sand cast and 2.1% for plaster cast processes). The average for the T5 treated sand cast condition (1.1%) was found to be above the standard value, but the standard deviation for this case should be kept in mind.
Both heat treated conditions showed a decrease in elongation with respect to the as cast condition. A 43% decrease was seen for the sand cast process while a 74% was observed in the case of plaster cast samples (0.6%).There was also a decrease in elongation values for the Cu addition conditions. With respect to the base alloy in as cast condition, this decrease was calculated to be 65% for the sand cast process (0.7%) and 63% for the plaster cast (0.8%).
The influence of the process used can be evaluated best in the as-cast condition for the base alloy. Through SDAS measurements, it has already been settled that the sand cast process resulted in higher cooling rates than the plaster cast process. This means that the microstructure is coarser for plaster casting. Furthermore, it was shown that the eutectic Si was only partially modified in the case of plaster cast samples. All of this is in accordance to what was explained in the modification chapter (2.4) and tensile properties chapter (2.8.1) that would result in lower tensile properties. Values for similar SDAS as the sand cast process (23 µm) using a gradient solidification technique were observed in as cast condition by Seifeddine [5]. Around 210 MPa UTS, 110 MPa Ys and 2% elongation which correspond in terms of elongation and Ys to the ones observed in this work. Using the same solidification technique, Bogdanoff and Dahlström [27] observed for SDAS of 25 µm, values of 210 MPa in UTS, 125 MPa Ys and 10 % elongation and for 55 µm 150 MPa UTS, 80 MPa Ys and 6% elongation. In this case, only the Ys is similar, UTS and elongation to fracture values are above the ones observed in this work.
1,99
1,14
0,69
2,10
0,54
0,78
1,3
0,840,77
1,1
0,30
0,50
0,70
0,90
1,10
1,30
1,50
1,70
1,90
2,10
2,30
As cast T5 +2%CuAs cast
As cast T6 +1.7%CuAs cast
As cast T6 SandCast
HPDC
SAND EN AC 42100 PLASTER EN AC 42100 SAND EN AC43100
EN AC 46000
Elo
nga
tio
n t
o f
ract
ure
(%
)
<1

Results and discussion
48
The difference that can be seen in the improvement that the heat treatments have produced is related with the treatment itself. As explained in the heat treatment chapter (2.6), the T6 heat treatment includes a solution heat treatment while the T5 treatment consists only of an artificial ageing from the as cast state. In this regard, the improvement of properties experienced in the sand cast process hints that the cooling of the casting in this process is fast enough to retain atoms in solid solution in the matrix.
Due to the already mentioned variation in the composition of the sand cast Cu addition condition, the basic assumption that the variation of properties is due to the Cu added cannot be done. A possible explanation for the results shown could be that the detriment on mechanical properties (explained in chapter 2.7) considering the increase in β-phase platelets size that was observed for the sand condition in 4.1.3 has balanced with the expected increment on tensile properties with the addition of Cu as explained in 2.7.3. Furthermore, the increased size of β-phase platelets would mean a higher decrease in elongation. According to the literature reviewed, the results achieved with the Cu addition in the plaster cast process are below what could be expected. As is shown in Figure 12, for an SDAS of 50 µm Seifeddine et al.[23] found an UTS around 220 MPa with a 1.7 wt. % Cu addition using the gradient solidification technique. The results achieved in the present work was of 137 MPa with 1.7 wt. % Cu.
The difference in the values observed with the gradient solidification technique and those of this work could be related to differences in porosity as the gradient solidification technique is reported to have generally a low defect content [23]. Also, while the solidification time (related through the SDAS) can be ruled out, the cooling time in the mold can be expected to be lower for the gradient solidification technique, resulting in different concentration of solutes hosted by the matrix and therefore yielding higher tensile properties.
Comparing to the previously tested conditions, T6 plaster cast samples perform similarly to the T6 sand cast EN AC 43100 alloy and the HPDC EN AC 46000 in terms of UTS (230 MPa, 224 MPa and 225 MPa respectively). It should be noted that the average HPDC value does not reach the value stated in the standard (240 MPa). From the point of view of Ys, both T6 treated conditions outperform the HPDC case which in turn is above the standard (235 MPa, 201 MPa and 167 MPa). Regarding the elongation to fracture, the T6 treated conditions do not reach the minimum 1% elongation value of the standard while HPDC is a little above it.
Looking at the sand cast alloys, the average and spread for the EN AC 42100 and EN AC 43100 in terms of UTS and Ys is quite similar (UTS: 169MPa, 165 Mpa; Ys: 117MPa and 110MPa respectively). Concerning the elongation to fracture, while both are over the standard, the EN AC 42100 alloy provides a bigger elongation (2%) compared to the EN AC 43100 (1.3%). The EN AC 46000 alloy shows higher UTS and Ys than these two, but lower elongation to fracture (179MPa, 147MPa and 0.8%). The standard deviation for this alloy is also considerably bigger, especially in terms of UTS. It might be noticed that the

Results and discussion
49
results obtained for the EN AC 42100 Cu addition in the sand cast process are quite similar to those achieved with the EN AC 46000 alloy.
4.2.2 Hardness
Hardness measurements are presented in the graphic in Figure 39 along with available results for EN AC 43100 alloy [40] and EN AC 46000 alloy [42]. The dotted horizontal line in red represents the value for EN AC 46000 according to standard SS-EN 1706:2010.
Figure 39. Brinell hardness measurements.
Conditions above 80 HB value are the T6 heat treated EN AC 42100 plaster cast (103 HB) and the Cu addition EN AC 42100 sand cast (82 HB). The T5 heat treated EN AC 42100 sand cast falls short with a 78 HB value. The only condition reaching the values of the tested HPDC (102 HB) is the T6 treated. With 68 HB and 53 HB for the EN AC 42100 as cast condition sand cast and plaster cast respectively, neither of the base alloys reached the standard. The heat treatment in both processes improved the base alloy value. A 14% improvement was achieved with the T5 treatment and a 94% improvement with the T6 treatment. Cu additions also produced an increase in hardness in both casting processes. For the sand casting process a 21% increase was observed and for the plaster cast process (72 HB) a 36%. Previously tested conditions performed above the standard value. Sand cast EN AC 43100 (99 HB) and EN AC 46000 (97 HB) performed considerably better than the EN AC 42100 alloy in the same process.
68
78
82
53
103
72
9997
102
40
50
60
70
80
90
100
110
As cast T5 +2%CuAs cast
As cast T6 +1.7%CuAs cast
As cast SandCast
HPDC
SAND EN AC 42100 PLASTER EN AC 42100 SAND ENAC 43100
EN AC 46000
HB 80
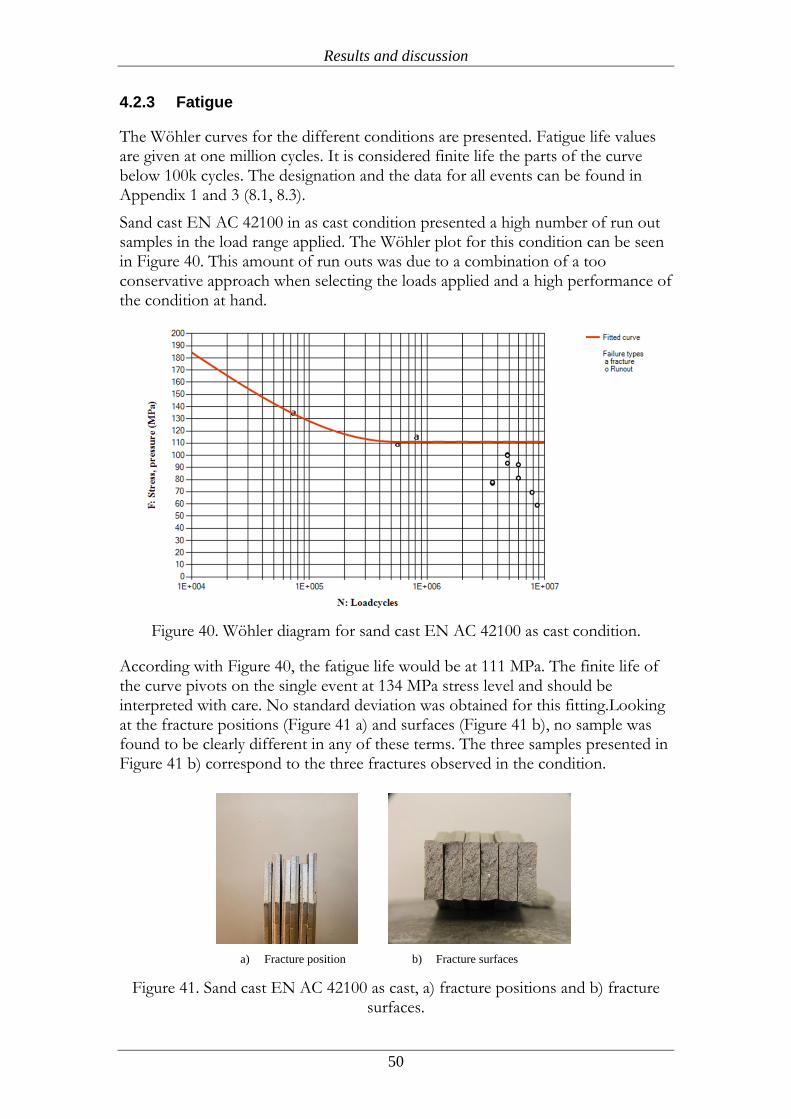
Results and discussion
50
4.2.3 Fatigue
The Wöhler curves for the different conditions are presented. Fatigue life values are given at one million cycles. It is considered finite life the parts of the curve below 100k cycles. The designation and the data for all events can be found in Appendix 1 and 3 (8.1, 8.3).
Sand cast EN AC 42100 in as cast condition presented a high number of run out samples in the load range applied. The Wöhler plot for this condition can be seen in Figure 40. This amount of run outs was due to a combination of a too conservative approach when selecting the loads applied and a high performance of the condition at hand.
Figure 40. Wöhler diagram for sand cast EN AC 42100 as cast condition.
According with Figure 40, the fatigue life would be at 111 MPa. The finite life of the curve pivots on the single event at 134 MPa stress level and should be interpreted with care. No standard deviation was obtained for this fitting.Looking at the fracture positions (Figure 41 a) and surfaces (Figure 41 b), no sample was found to be clearly different in any of these terms. The three samples presented in Figure 41 b) correspond to the three fractures observed in the condition.
a) Fracture position
b) Fracture surfaces
Figure 41. Sand cast EN AC 42100 as cast, a) fracture positions and b) fracture surfaces.

Results and discussion
51
The T5 heat treated condition presented a similar Wöhler curve (Figure 42) as in the as cast condition, and for the same reason as the as cast condition, an elevated number of run outs.
Figure 42. Wöhler diagram for sand cast EN AC 42100 T5 heat treated condition.
Similarly to the as cast condition, the finite life part of the curve pivots on the only event at higher stress values (134 MPa). The fatigue life is 111 MPa. The fracture positions and surfaces for this condition are presented in Figure 43. As happened with the as cast condition, no particular sample seems to have a different fracture behaviour from the rest.
a) Fracture position
b) Fracture surfaces
Figure 43. Sand cast EN AC 42100 T5 treated, a) fracture positions and b) fracture surfaces
Two different plots for the sand cast Cu addition condition can be seen in Figure 44. The Wöhler plot for this condition including the twelve events tested, presented a “flat” appearance (Figure 44 a). A closer investigation on the test results showed that two events seemed to change the appearance of the finite life part of the curve. What is more, this two events seemed to have a really low life compared to other events in the surrounding stress range. Loaded at 111 MPa and
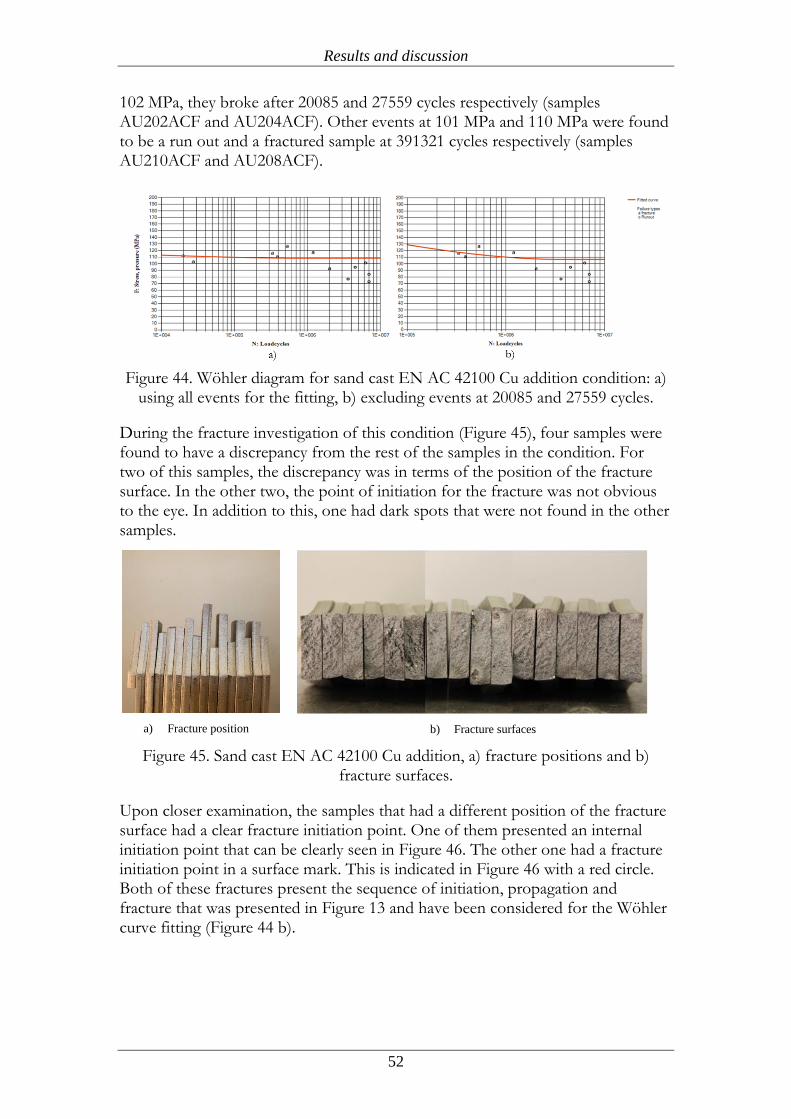
Results and discussion
52
102 MPa, they broke after 20085 and 27559 cycles respectively (samples AU202ACF and AU204ACF). Other events at 101 MPa and 110 MPa were found to be a run out and a fractured sample at 391321 cycles respectively (samples AU210ACF and AU208ACF).
Figure 44. Wöhler diagram for sand cast EN AC 42100 Cu addition condition: a)
using all events for the fitting, b) excluding events at 20085 and 27559 cycles.
During the fracture investigation of this condition (Figure 45), four samples were found to have a discrepancy from the rest of the samples in the condition. For two of this samples, the discrepancy was in terms of the position of the fracture surface. In the other two, the point of initiation for the fracture was not obvious to the eye. In addition to this, one had dark spots that were not found in the other samples.
a) Fracture position
b) Fracture surfaces
Figure 45. Sand cast EN AC 42100 Cu addition, a) fracture positions and b) fracture surfaces.
Upon closer examination, the samples that had a different position of the fracture surface had a clear fracture initiation point. One of them presented an internal initiation point that can be clearly seen in Figure 46. The other one had a fracture initiation point in a surface mark. This is indicated in Figure 46 with a red circle. Both of these fractures present the sequence of initiation, propagation and fracture that was presented in Figure 13 and have been considered for the Wöhler curve fitting (Figure 44 b).
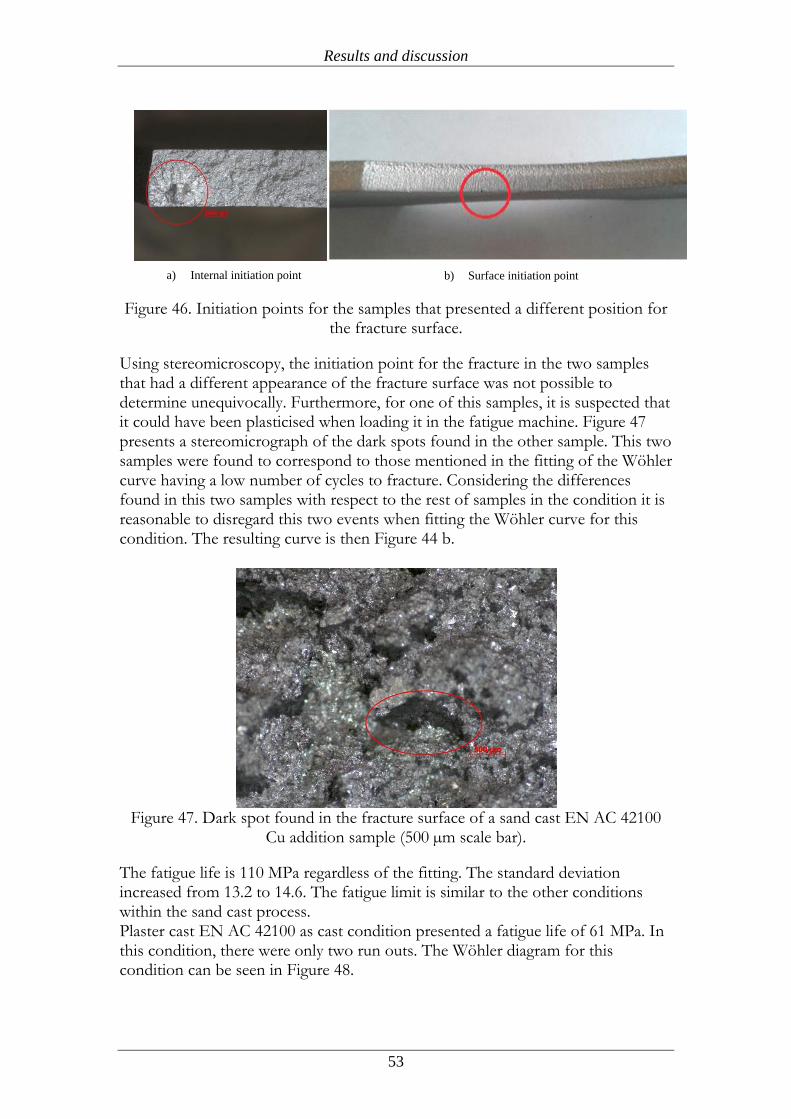
Results and discussion
53
a) Internal initiation point
b) Surface initiation point
Figure 46. Initiation points for the samples that presented a different position for the fracture surface.
Using stereomicroscopy, the initiation point for the fracture in the two samples that had a different appearance of the fracture surface was not possible to determine unequivocally. Furthermore, for one of this samples, it is suspected that it could have been plasticised when loading it in the fatigue machine. Figure 47 presents a stereomicrograph of the dark spots found in the other sample. This two samples were found to correspond to those mentioned in the fitting of the Wöhler curve having a low number of cycles to fracture. Considering the differences found in this two samples with respect to the rest of samples in the condition it is reasonable to disregard this two events when fitting the Wöhler curve for this condition. The resulting curve is then Figure 44 b.
Figure 47. Dark spot found in the fracture surface of a sand cast EN AC 42100
Cu addition sample (500 µm scale bar).
The fatigue life is 110 MPa regardless of the fitting. The standard deviation increased from 13.2 to 14.6. The fatigue limit is similar to the other conditions within the sand cast process. Plaster cast EN AC 42100 as cast condition presented a fatigue life of 61 MPa. In this condition, there were only two run outs. The Wöhler diagram for this condition can be seen in Figure 48.
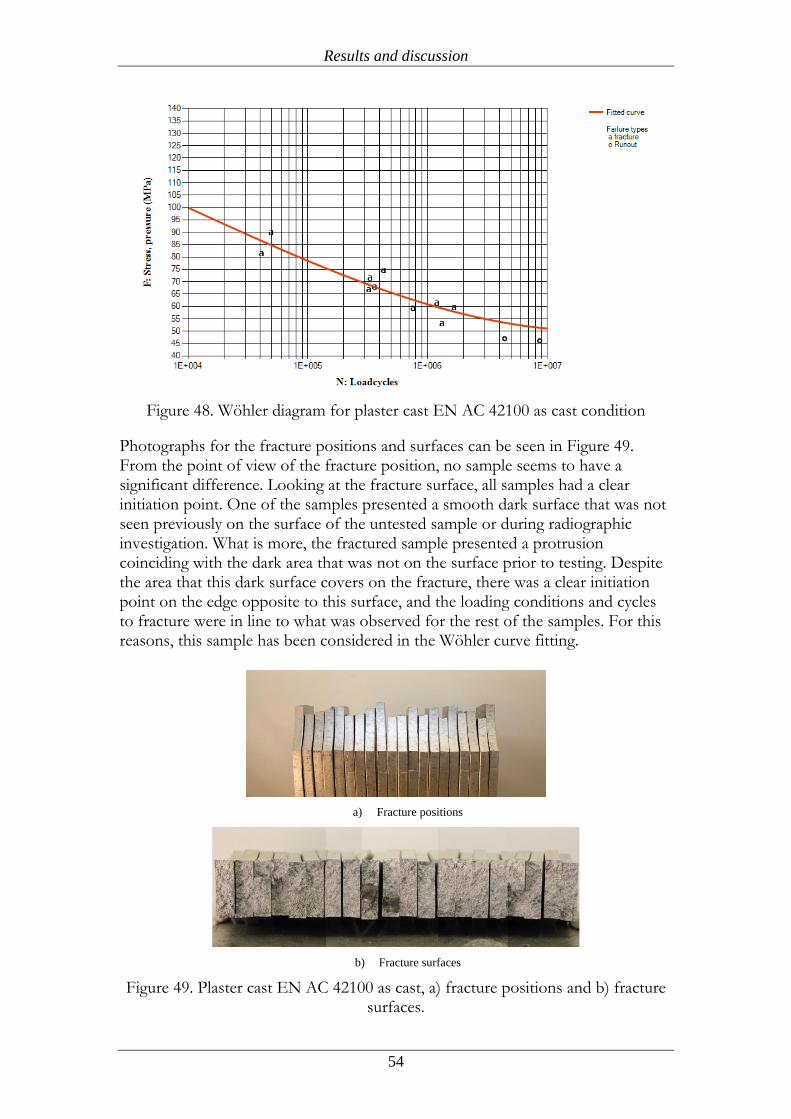
Results and discussion
54
Figure 48. Wöhler diagram for plaster cast EN AC 42100 as cast condition
Photographs for the fracture positions and surfaces can be seen in Figure 49. From the point of view of the fracture position, no sample seems to have a significant difference. Looking at the fracture surface, all samples had a clear initiation point. One of the samples presented a smooth dark surface that was not seen previously on the surface of the untested sample or during radiographic investigation. What is more, the fractured sample presented a protrusion coinciding with the dark area that was not on the surface prior to testing. Despite the area that this dark surface covers on the fracture, there was a clear initiation point on the edge opposite to this surface, and the loading conditions and cycles to fracture were in line to what was observed for the rest of the samples. For this reasons, this sample has been considered in the Wöhler curve fitting.
a) Fracture positions
b) Fracture surfaces
Figure 49. Plaster cast EN AC 42100 as cast, a) fracture positions and b) fracture surfaces.

Results and discussion
55
The T6 heat treatment showed an improvement in terms of fatigue life with respect to the as cast condition. Fatigue limit is 83 MPa which constitutes a 36% improvement with respect to the as cast condition. The events distribution for this condition resulted in six run outs. The Wöhler fitting is presented in Figure 50.
Figure 50. Wöhler diagram for plaster cast EN AC 42100 T6 heat treated
condition
Regarding the fracture positions and surfaces, as can be seen in Figure 51, no sample was found to display differences within the condition.
a) Fracture positions
b) Fracture surfaces
Figure 51. Plaster cast EN AC 42100 T6, a) fracture positions and b) fracture surfaces.
A similar case to the sand cast Cu addition was seen for the Cu addition in plaster cast condition (Figure 52). A failure was recorded at 39639 cycles with a stress level of 60 MPa (sample AH210ACF). At that same stress level another sample presented 2259992 cycles (AH202ACF). Following the same reasoning as for the sand cast case, two different fittings are presented for this condition in Figure 52.

Results and discussion
56
Figure 52. Wöhler diagram for plaster cast EN AC 42100 Cu addition condition:
a) using all events for the fitting, b) excluding the event at 39639 cycles.
The study of the fractured samples quickly points out the event mentioned. Figure 53 shows the fracture positions and surfaces. Upon stereomicroscopic investigation, the crack initiator could not be clearly discerned. Dark coloured areas were seen as well as shrinkage porosity.
a) Fracture position
b) Fracture surfaces
Figure 53. Plaster cast EN AC 42100 Cu addition, a) fracture positions and b) fracture surfaces.
Using the same reasoning as for the sand cast EN AC 42100 Cu addition condition, it is reasonable to disregard this event when fitting the Wöhler curve for this condition. The resulting curve is then the one shown in Figure 52 b.
The change in fatigue life was from 65 MPa for the fitting including all events to 64 MPa for the one excluding the mentioned event. In the case of the fitting excluding the event, the fatigue life value keeps dropping after this value. The standard deviation also experienced a drop in its value, from 9.0 to 6.4. The total run out count was four.
Having now presented the analysis of the six conditions separately, a Wöhler diagram with the six conditions together is presented in Figure 54.

Results and discussion
57
Figure 54. Wöhler curves for the six conditions tested in this work: Sand cast EN AC 42100 1) As cast, 2) T5 heat treated, 3) Cu addition as cast; Plaster cast EN
AC 42100 4) As cast, 5) T6 heat treated, 6) Cu addition as cast.
As can be seen in Figure 54, the sand cast conditions are grouped together. This suggests that the fracture mechanisms are similar for the three conditions. For plaster cast conditions, the as cast condition and Cu addition condition are grouped together and are almost parallel.
Figure 55. Fatigue life values at 1 million cycles.
111 111 110
61
83
66
101107 109
40
50
60
70
80
90
100
110
120
130
As cast T5 +2% Cu As cast T6 +1.7%Cu
Sandcast
Sandcast
HPDC
SAND EN AC 42100 PLASTER EN AC 42100 EN AC43100
EN AC 46000
Fati
gue
life
a 1
m c
ycle
s

Results and discussion
58
The fatigue life for the different conditions tested can be observed in Figure 55 with the corresponding standard deviation interval. The values from previously tested sand cast EN AC 43100 [42] and EN AC 46000 both sand cast and HPDC [43] are presented for comparison.
In accordance to Figure 55, no difference can be acknowledged for the sand cast conditions. Plaster cast samples show variation between the different conditions. While the average for the Cu addition condition is above that for the as cast condition (66 MPa and 61 MPa), according to the standard deviation, no statistical difference can be assured.
Considering that the defect levels in terms of porosity were similar for the six conditions, the alloys that showed a higher cooling rate and a better degree of Si modification also showed a better fatigue performance. With respect to the heat treatments, although the T5 treatment in the sand cast condition produced an increase in tensile properties, such increase was not seen in the fatigue properties. For the case of the T6 treatment, an increase in both tensile and fatigue properties was seen. While the addition of Cu in the sand cast process showed an effect in terms of tensile behaviour, this effect is not apparent in terms of fatigue. This could be interpreted as a balancing effect between the increase of properties expected with the Cu addition and the decrease expected from the increased Fe-content and bigger size of β-platelets. Another interpretation of this results could be that although higher Fe content has been shown to have a detrimental effect in fatigue life [36], the higher Fe amount in this case (0.31 wt. %) has not reached the threshold to become detrimental in terms of fatigue properties and that the mechanism driving the fatigue behaviour can still be considered the same as in the heat treated and as cast sand cast conditions.
With respect to the literature covered in this work, only values for heat treated conditions were found. Kaufman [44] presents values around 60 MPa for notched specimens and 80 MPa for smooth specimens in a T51 treated Al-7Si-0.3Mg alloy. Values for high strength plaster cast Al-7Si-0.3Mg in T6 condition are of around 75 MPa for notched specimens and 100 for smooth ones. In all cases, specimens were test in rotating bending conditions and generally machined or polished. The equivalent conditions tested in this work would perform better than reported by Kaufman for the sand process, and in between the smooth and notched values for the plaster process.
Compared to the previously tested conditions, the sand casting process was shown to yield fatigue life values similar to those for HPDC. The other sand cast conditions, EN AC 43100 alloy and EN AC 46000 alloy also provided values comparable to that of HPDC. The plaster casting process values did not reach the values of the HPDC process.

Discussion and conclusions
59
5 Discussion of method and conclusions
5.1 Discussion of method
The method followed in this work involved three main stages: the theoretic investigation, the experimental procedures and the analysis of the results from the experimental procedures.
The theoretic investigation was focused in obtaining the knowledge necessary to select the different conditions, evaluate the results from the experiments and to determine the delimitations for the work. It was also important to centre the investigation within the context of the work that has been performed by other authors. Based on the theoretical investigation, the level of Cu used for the Cu addition condition and the parameters for the T6 treatment were selected.
The selection of the T6 parameters where chosen taking into account not only the aim of the treatment but also the common practice in the industry.
In this sense, according to literature, the most suitable solution heat treatment seemed to be that at 540ºC for 3-6 hours for a Sr modified sand cast Al-7Si-0.3Mg alloy. Since the condition was plaster cast, a slower cooling rate (and therefore a big SDAS) could be supposed.
The preferred parameters for the treatment would then be 540ºC and 6 hours. From a practical point of view, possible temperature fluctuations in the furnace discourage a solutioning temperature too near to the eutectic temperature. A conservative solutioning temperature of 530ºC was chosen.
Regarding the quenchant, water at around 60ºC produces a quenching rate above 4ºC/s that guarantees enough rapid cooling to assure the freezing of the solution in the matrix. After the quenching, the review of the literature suggested no natural ageing time should be allowed since it has a tendency to delay peak ageing condition and to compress the time interval in which different hardness values can be achieved [15]. Following common industrial procedures, a natural ageing time of 24 hours was allowed before the artificial ageing times of 1, 2, 5 and 20 hours was done.
In attention to the purpose of this work, the experimental procedures selected needed to provide results that could be then compared to available data. For this reason, some of the procedures were straightforward; determining the tensile and fatigue properties was needed in order to compare to the tensile and fatigue properties of HPDC EN AC 46000. Tensile and fatigue tests using the same parameters as those used for obtaining the previous data seemed like the most suitable solution. Following this, the tensile and fatigue tests performed in this work have used the same parameters as those used for determining the previously observed results. Systematic and careful procedures were followed to ensure accurate results.

Discussion and conclusions
60
Using fatigue samples with the casting skin and produced following the regular practices for the two foundries used in this work produces results that represent more accurately the quality and the conditions that the actual prototypes are subjected to.
Related to the thickness of the fatigue samples, the continuum mechanics assumption of plane stress considering thin samples might not hold true for thicker sections, resulting in a different fatigue life. Thicker samples would also have an influence in terms of microstructure.
Not being the main objective for this work, the microstructure characterization and the fracture analysis was approached from a comparative point of view within the conditions tested. For this reason, the values presented for the microstructure characterization lack statistical soundness. A bigger sample size should have been used to provide this. Also, characterization in terms of porosity fraction, and not just size of defects would enhance the comparison between conditions and with available literature.
The results analysis was done following common practices in JTH for the tensile results and in Scania for the fatigue results. Comparison to data from the literature was used when possible. Connected to this, generally speaking, the results presented in the literature reviewed by the author are achieved for castings performed in laboratory conditions, sometimes under highly controlled processes (such as the gradient solidification technique) whereas the results presented in this work come from industry foundries. The comparison of the values can only be partial. In the opinion of the author, this holds especially true for fatigue life comparison, considering the difference in experimental procedures in terms of sample preparation, type of test and stress ratio and taking into account the number of factors presented in 2.8.2 that have an influence.
For the reader’s ease the discussion on fulfilment of research objectives is carried on as an answer to the research questions presented at 1.2.
1. What is the fatigue limit for the EN AC 42100 alloy in as-cast condition, both for sand and plaster molds?
As has been shown in 4.2.3, fatigue life values at one million cycles are 111 MPa and 61 MPa for the EN AC 42100 cast in sand and plaster molds respectively.
2. Can tensile and fatigue properties similar to that of EN AC 46000 alloy casted with the HPDC process be achieved with a copper addition to EN AC 42100 alloy casted in sand or plaster molds in as-cast condition?
Regarding the sand molds, although the alloy tested was found to have a good performance in the terms compared in this work, no conclusive answer can be given due to the high difference in composition observed. New tests ensuring proper composition of the melt would need to be performed to answer this question.
For plaster molds, only the elongation to fracture was found to be above the expected values for EN AC 46000 HPDC, finding lower values for the rest of the

Discussion and conclusions
61
properties. Considering this, properties similar to EN AC 46000 HPDC cannot be achieved with a Cu addition.
3. Can tensile and fatigue properties similar to that of EN AC 46000 alloy casted with the HPDC process be achieved by heat treatment to EN AC 42100 alloy casted in sand or plaster molds?
According to the results presented in this work, using a T5 treatment on sand cast EN AC 42100 samples, properties similar to EN AC 46000 HPDC can be achieved. T6 treatment of the plaster cast EN AC 42100 produces tensile values far from those for EN AC 46000 HPDC both in terms of tensile and fatigue behaviour.
5.2 Conclusions
In accordance to the results and analysis presented, regarding the effect of the process, system and post-solidification variables presented in chapter 1.1, it can be concluded that:
The sand cast process results in smaller SDAS (higher cooling rates) and finer microstructures compared to plaster casting, this results in higher mechanical properties.
The addition of 1.7 wt. % of Cu to EN AC 42100 plaster cast alloy increases UTS and Ys but reduces elongation to fracture.
The T5 treatment increases UTS and Ys but reduces elongation to fracture in sand cast EN AC 42100 alloy.
The T6 treatment increases UTS, Ys and fatigue properties but reduces elongation to fracture in plaster cast EN AC 42100 alloy.
It can be concluded that:
The T5 treated EN AC 42100 alloy sand cast produces the most similar properties to HPDC EN AC 46000 and can be used for prototyping solutions.
Reasonable prototyping alternatives are:
Sand cast EN AC 42100 + 2 wt. % Cu at the composition of this work.
Sand cast EN AC 46000 at 0.7 wt. % Fe level.
Sand cast EN AC 42100 alloy in as cast condition.
5.3 Future work
Based on the results found in this work, the following lines of investigation can be developed in the future:

Discussion and conclusions
62
Heat treatment of the Cu addition conditions. According to the literature reviewed, Cu enhances the properties that can be achieved by heat treatment.
Test EN AC 46000 sand cast conditions with higher Fe content.
Testing of thicker samples to assess the properties that can be achieved in thicker sections in components.
Fractographic analysis of fatigue tested samples to develop more suitable solutions in terms of fatigue life.

Acknowledgements
63
6 Acknowledgements As the author of this work I would like to express my most sincere gratitude to:
My supervisors, Salem Seifeddine and Emma Sjölander for the opportunity to perform this work in Jönköping’s University and Scania. For their guidance and the valuable discussions through this work and also for their trust in my judgment and ability to perform it independently.
Toni Bogdanoff, for his help and teachings to perform the experimental procedures.
Lars Johansson, for his help and teachings when machining samples in the workshop.
Scania and the department of Materials and Manufacturing of the School of Engineering, Jönköping Univeristy for providing the infrastructure and great conditions in which to carry this work.
Unnarydmodell and Hackås Precisionsgjuteri for providing the materials and answers to my questions regarding their processes.
And last but not least, to my family, for being who they are and in turn making me who I am, for their help and support and why not, for their unending jokes of tired trucks.

References
64
7 References
1. Svensson, I.L. and H.i.J. Ingenjörshögskolan, Component Casting with
Simulation. 2003: School of Engineering, Jönköping University.
2. Major, F. and D. Apelian. A Micro structural Atlas of Common Commercial
Al-Si-X Structural Castings. in AFS Aluminum Structural Casting Conference.
2003. Orlando, FL: AFS.
3. Shakhashiri, B.Z., Chemical of the Week: Aluminum. 2008, University of
Wisconsin: SciFun.org.
4. Totten, G.E. and D.S. MacKenzie, Handbook of Aluminum: Vol. 1: Physical
Metallurgy and Processes. 2003: CRC Press.
5. Seifeddine, S., Characteristics of cast aluminium-silicon alloys:
microstructures and mechanical properties, in Department of Mechanical
Engineering / Component Technology - Castings. 2006, Jönköping University:
School of Engineering.
6. Gruzleski, J.E., B.M. Closset, and A.F.s. Society, The Treatment of Liquid
Aluminum-silicon Alloys. 1990: American Foundrymen's Society,
Incorporated.
7. Sigworth, G.K., Fundamentals of solidification in aluminum castings.
International Journal of Metalcasting, 2014. 8(I).
8. Warmuzek, M., Aluminum-Silicon Casting Alloys. Atlas of Microfractographs.
2004: ASM International.
9. Easton, M., C. Davidson, and D. St John, Effect of Alloy Composition on the
Dendrite Arm Spacing of Multicomponent Aluminum Alloys. Metallurgical and
Materials Transactions A, 2010. 41(6): p. 1528-1538.
10. Li, Z., et al., Parameters controlling the performance of AA319-type alloys.
Materials Science and Engineering: A, 2004. 367(1-2): p. 96-110.
11. Dahle, A., et al., Eutectic modification and microstructure development in Al–
Si Alloys. Materials Science and Engineering: A, 2005. 413: p. 243-248.
12. Bäckman, J., Processing aspects for improving mechanical properties in
aluminium castings, in Component technology-Castings. 2000, Jönköping
University.
13. JIANG, H., P. BOWEN, and J.F. KNOTT, Fatigue performance of a cast
aluminium alloy Al-7Si-Mg with surface defects. Journal of materials science,
1999. 34: p. 719-725.
14. Kaufman, J.G., E.L. Rooy, and A.F. Society, Aluminum Alloy Castings:
Properties, Processes, and Applications. 2004: ASM International.
15. Sjölander, E. and S. Seifeddine, The heat treatment of Al–Si–Cu–Mg casting
alloys. Journal of Materials Processing Technology, 2010. 210(10): p. 1249-
1259.
16. Shivkumar, S., C. Keller, and D. Apelian, Ageing behaviour in cast Al-Si-Mg
alloys. American Foundry Society, 1990. 98.
17. Taylor, J.A., The Effect of Iron in Al-Si Casting Alloys. The University of
Queensland,Brisbane, Australia: Cooperative Research Centre for Cast Metals
Manufacturing (CAST).
18. Wang, L., M. Makhlouf, and D. Apelian, Aluminum die casting alloys: Alloy
composition, microstructure, and properties-performance relationships.
International Materials Reviews, 1995. 40(6): p. 221-238.
References
65
19. Samuel, F.H., et al., Effect of Mg and Sr additions on the formation of
intermetallics in Al-6 Wt pct Si-3.5 Wt pct Cu-(0.45) to (0.8) Wt pct Fe 319-
type alloys. Metallurgical and Materials Transactions A, 1998. 29(12): p.
2871-2884.
20. P. Ouellet, F.H.S., Effect of magnesium content on the ageing behaviour of
water chilled Al-Si-Cu-Mg-Fe-Mn. Journal of materials science, 1995.
1995(30).
21. P. Ouellet, F.H.S., Effect of Mg on the ageing behaviour of Al-Si-Cu A319 cast
alloys. Journal of materials science, 1999. 34.
22. Shabestari, S.G. and H. Moemeni, Effect of copper and solidification
conditions on the microstructure and mechanical properties of Al–Si–Mg
alloys. Journal of Materials Processing Technology, 2004. 153-154: p. 193-
198.
23. Seifeddine, S., E. Sjölander, and T. Bogdanoff, On the Role of Copper and
Cooling Rates on the Microstructure, Defect Formations and Mechanical
Properties of Al-Si-Mg Alloys. Materials Sciences and Applications, 2013.
04(03): p. 171-178.
24. Jacobs, M.H., Introduction to Mechanical Properties, Solidification and
Casting, Joining and Corrosion of Aluminium and its Alloys. 1999.
25. Dieter, G.E., Mechanical Behavior Under Tensile and Compressive Loads,
Mechanical Testing and Evaluation, in ASM Handbook, A. International,
Editor. 1986, McGraw-Hill: New York. p. 275-295.
26. Revanka, G., Introduction to Hardness Testing, Mechanical Testing and
Evaluation, in ASM Handbook, A. International, Editor. 2000. p. 197-202.
27. Bogdanoff, T. and J. Dahlström, The influence of copper on an Al-Si-Mg
alloy-Microstructure and mechanical properties, in Component technology-
Castings. 2009, Jönköping University.
28. Fine, M.E. and Y.-W. Chung, Fatigue Failure in Metals, Fatigue and
Fracture, in ASM Handbook. 1996, ASM International. p. 63-72.
29. Krupp, U., Fatigue crack propagation in metals and alloys: microstructural
aspects and modelling concepts. 2007: John Wiley & Sons.
30. Siegfanz, S., et al., Influence of the microstructure on the fatigue damage
behaviour of the aluminium cast alloy AlSi7Mg0.3. Materials Science and
Engineering: A, 2013. 565: p. 21-26.
31. Lados, D.A., D. Apelian, and J.F. Major, Fatigue crack growth mechanisms at
the microstructure scale in AI-Si-Mg cast alloys: Mechanisms in Regions II
and III. Metallurgical and Materials Transactions A: Physical Metallurgy and
Materials Science, 2006. 37(8): p. 2405-2418.
32. Ammar, H., A. Samuel, and F. Samuel, Porosity and the fatigue behavior of
hypoeutectic and hypereutectic aluminum–silicon casting alloys. International
Journal of Fatigue, 2008. 30(6): p. 1024-1035.
33. Linder, J., M. Axelsson, and H. Nilsson, The influence of porosity on the
fatigue life for sand and permanent mould cast aluminium. International
Journal of Fatigue, 2006. 28(12): p. 1752-1758.
34. Han, S.-W., S. Kumai, and A. Sato, Effects of solidification structure on short
fatigue crack growth in Al–7%Si–0.4%Mg alloy castings. Materials Science
and Engineering, 2002: p. 56-63.
35. Thirugnanam, A., et al., Effect of Mg on the fracture characteristics of cast
Al–7Si–Mg alloys. Materials Science and Engineering: A, 2007. 445-446: p.
405-414.
References
66
36. Yi, J.Z., et al., Effect of Fe-content on fatigue crack initiation and propagation
in a cast aluminum–silicon alloy (A356–T6). Materials Science and
Engineering: A, 2004. 386(1-2): p. 396-407.
37. Scania, STD4369. 2012.
38. Vomacka, P. and M. Forss. 2015.
39. Skoglund, P., Technical report 7018985. 2013, Scania AB: Södertälje.
40. Skoglund, P., Technical report 7021064. 2013, Scania AB: Södertälje.
41. Sjölander, E., Technical report 7030015. 2014, Scania AB: Södertälje.
42. Bäckström, D., Technical report 7023390. 2013, Scania AB: Södertälje.
43. Bäckström, D., Technical report 7023576. 2014, Scania AB: Södertälje.
44. Kaufman, J.G., Properties of Aluminum Alloys: Fatigue Data and the Effects
of Temperature, Product Form, and Processing. 2008: ASM International.

Appendices
67
8 Appendices
8.1 Appendix 1. Designation system of samples
The samples were named in the following way:
i.e.: AH203ACT would be Aluminium casted in Hackås with alloy 42100 + Cu,
sample number 03 in as cast condition for tensile testing.

Appendices
68
8.2 Appendix 2. Results for tensile tests. UTS – Ultimate tensile strength Ys – Yield strength E – Elastic modulus eb – Ultimate elongation ep – Ultimate plastic elongation ebUTS – Elongation at UTS Q – Quality index
Sand cast EN AC 42100 As cast
Identifier UTS(MPa) Ys(MPa) E(MPa) eb ep ebUTS Q
AU101ACT 172,76 118,13 72927,25 0,02 0,02 0,02 213,17
AU102ACT 169,91 116,81 58926,62 0,02 0,02 0,02 205,87
AU103ACT 170,74 119,17 76371,84 0,02 0,02 0,02 204,90
AU104ACT 164,57 114,46 66640,09 0,02 0,02 0,02 198,19
AU105ACT 168,74 115,02 69997,96 0,02 0,02 0,02 205,94
Av 169,34 116,72 68972,75 0,0201 0,0174 0,0199 205,61
Std. Dev. 3,05 2,00 6667,12 0,0011 0,0010 0,0011 5,31
Sand cast EN AC 42100 T5
Identifier UTS(MPa) Ys(MPa) E(MPa) eb ep ebUTS Q
AU101HTT 190,36 158,03 71539,93 0,01 0,01 0,01 178,96
AU102HTT 195,41 163,67 75100,64 0,01 0,01 0,01 176,70
AU103HTT 172,23 152,28 65120,68 0,01 0,00 0,01 117,73
AU104HTT 192,45 144,79 65821,66 0,02 0,01 0,02 218,03
AU105HTT 188,40 155,16 78783,51 0,01 0,01 0,01 167,14
Av 187,77 154,79 71273,28 0,0114 0,0087 0,0114 171,71
Std. Dev. 9,07 7,00 5888,50 0,0037 0,0035 0,0036 35,91
Sand cast EN AC 42100 2 wt. % Cu As cast
Identifier UTS(MPa) Ys(MPa) E(MPa) eb ep ebUTS Q
AU206ACT 174,08 140,94 68192,20 0,01 0,01 0,01 117,66
AU207ACT 169,11 151,43 81177,53 0,01 0,00 0,01 35,99
AU208ACT 165,28 145,10 71932,26 0,01 0,00 0,01 44,23
AU209ACT 162,71 145,99 77340,78 0,01 0,00 0,01 37,22
AU210ACT 173,42 138,62 69835,64 0,01 0,01 0,01 122,12
Av 168,92 144,42 73695,68 0,0066 0,0043 0,0069 71,45
Std. Dev. 4,97 4,95 5421,32 0,0017 0,0014 0,0015 44,36

Appendices
69
Plaster cast EN AC 42100 As cast
Identifier UTS(MPa) Ys(MPa) E(MPa) eb ep ebUTS Q
AH101ACT 127,36 76,76 78999,53 0,02 0,02 0,02 162,62
AH102ACT 125,94 73,04 63770,98 0,02 0,02 0,02 166,93
AH103ACT 124,40 73,48 62749,22 0,02 0,02 0,02 160,71
AH104ACT 126,48 77,20 74681,45 0,02 0,02 0,02 161,29
AH105ACT 122,35 74,57 76351,39 0,02 0,02 0,02 147,53
Av 125,31 75,01 71310,51 0,0213 0,0193 0,0210 159,82
Std. Dev. 1,97 1,89 7517,23 0,0023 0,0021 0,0023 7,29
Plaster cast EN AC 42100 T6
Identifier UTS(MPa) Ys(MPa) E(MPa) eb ep ebUTS Q
AH101HTT 240,15 233,57 66793,61 0,01 0,00 0,01 169,26
AH102HTT 243,74 0,00 83106,40 0,00 0,00 0,01 1,45
AH103HTT 214,34 0,00 71565,73 0,00 0,00 0,00 14,24
AH104HTT 240,02 236,42 66221,12 0,01 0,00 0,01 136,09
AH105HTT 211,21 0,00 65959,97 0,00 0,00 0,00 16,82
Av 229,89 235,00 70729,37 0,0049 0,0018 0,0054 67,57
Std. Dev. 15,74 2,02 7287,87 0,0017 0,0013 0,0013 78,78
Plaster cast EN AC 42100 1.7 wt. % Cu As cast
Identifier UTS(MPa) Ys(MPa) E(MPa) eb ep ebUTS Q
AH201ACT 130,96 109,15 69292,91 0,01 0,01 0,01 89,16
AH202ACT 138,60 108,22 71897,86 0,01 0,01 0,01 106,25
AH203ACT 140,68 111,46 67652,33 0,01 0,01 0,01 106,89
AH204ACT 137,84 120,18 53176,01 0,01 0,00 0,01 92,24
AH205ACT 136,58 107,59 71999,02 0,01 0,01 0,01 109,16
Av 136,93 111,32 66803,63 0,0081 0,0060 0,0078 100,74
Std. Dev. 3,65 5,17 7835,37 0,0007 0,0009 0,0008 9,29

Appendices
70
8.3 Appendix 3. Results for fatigue tests Sand cast EN AC 42100 As cast
Stress, pressure(MPa)
for N=100 257.9
N=1000 240.9
N=10000 184.5
N=100000 128.0
Fatigue Limit 111.1
Standard Deviation
Load Ratio R -1.0
Exponent, 10^5 6.95
Limit Life 543000
Sample D
(mm) d
(mm) h
(mm) A
(mm2) Test date
F
high (N)
F
low (N)
Stress
max (MPa)
Stress
min (MPa) Load RO Cycles
AU101ACF 34,1 19,1 6,1 116,8 2015-04-23 52 -53 68,2 -69,5 69,5 X 7837825
AU102ACF 34,1 19,1 6,1 116,5 2015-04-23 43 -45 56,4 -59,0 59 X 8670334
AU103ACF 34,1 19,1 6,1 117,5 2015-05-04 59 -60 76,6 -77,9 77,9 X 3615607
AU104ACF 34,1 19,1 6,1 116,6 2015-05-04 62 -60 81,3 -78,7 81,3 X 6000000
AU105ACF 34,1 19,2 6,1 116,7 2015-05-04 59 -57 77,0 -74,4 77 X 3615607
AU106ACF 34,1 19,2 6,1 117,3 2015-05-04 68 -71 88,4 -92,3 92,3 X 6000000
AU107ACF 34,5 19,5 6,3 121,9 2015-05-11 88 -85 108,2 -104,5 108,2
569031
AU108ACF 34,0 19,2 6,1 116,0 2015-05-11 76 -76 99,9 -99,9 99,9 X 4844048
AU109ACF 34,3 19,1 6,1 115,7 2015-05-11 76 -73 100,5 -96,5 100,5 X 4844048
AU110ACF 34,3 19,2 6,1 115,9 2015-05-11 71 -68 93,5 -89,5 93,5 X 4844048
AU111ACF 34,2 19,2 6,1 116,2 2015-05-18 102 -101 133,8 -132,5 133,8
74343
AU112ACF 34,1 19,3 6,1 117,0 2015-05-18 88 -87 113,9 -112,6 113,9
828795

Appendices
71
Sand cast EN AC 42100 T5
Stress, pressure(MPa)
for N=100 225.1
N=1000 208.1
N=10000 167.9
N=100000 127.6
Fatigue Limit 110.6
Standard Deviation 8.9
Load Ratio R -1.0
Exponent, 10^5 9.04
Limit Life 881000
Sample
D
(mm)
d
(mm)
h
(mm)
A
(mm2) Test date
F high
(N)
F low
(N)
Stress max
(MPa)
Stress min
(MPa) Load RO Cycles
AU101HTF 34,1 19,2 6,1 116,0 2015-04-23 55 -53 87,6 -88,9 72,2 x 7837825
AU102HTF 34,1 19,2 6,1 117,0 2015-04-23 38 32 98,0 -92,8 49,5 x 8670334
AU103HTF 34,2 19,1 6,1 117,0 2015-05-04 72 -74 82,3 -78,4 96,6 x 3615607
AU104HTF 34,2 19,1 6,1 116,8 2015-05-04 67 -68 113,5 -108,2 88,9 x 3615607
AU105HTF 34,1 19,2 6,1 116,5 2015-05-04 75 -71 103,3 -100,8 98 x 3921139
AU106HTF 34,2 19,1 6,1 116,9 2015-05-04 63 -60 96,0 -97,4 82,3 x 6000000
AU107HTF 34,3 19,2 6,1 116,4 2015-05-11 87 -83 92,2 -94,8 113,5 1794298
AU108HTF 34,2 19,5 6,1 119,0 2015-05-11 82 -80 133,5 -131,0 103,3 936865
AU109HTF 34,1 19,1 6,1 116,2 2015-05-11 73 -74 114,9 -114,9 97,4 x 4844048
AU110HTF 34,2 19,2 6,0 115,7 2015-05-11 70 -72 77,0 -73,3 94,8 x 4844048
AU111HTF 34,1 19,3 6,1 117,0 2015-05-18 103 -101 105,6 -110,8 133,5 67296
AU112HTF 34,1 19,1 6,1 117,2 2015-05-18 88 -88 94,8 -88,4 114,9 2652299

Appendices
72
Sand cast EN AC 42100 + 2 wt. % Cu As cast
Stress, pressure(MPa)
for N=1000 184.2
N=10000 156.6
N=100000 129.0
N= 000000 110.1
Fatigue Limit 106.7
Standard Deviation 14.6
Load Ratio R -1.0
Exponent, 10^5 12.02
Limit Life 3740000
Sample
D
(mm)
d
(mm)
h
(mm)
A
(mm2) Test date
F high
(N)
F low
(N)
Stress max
(MPa)
Stress min
(MPa) Load RO Cycles
AU201ACF 34,2 19,2 6,3 120,5 2015-05-04 61 -58 84,0 -81,5 77 x 3615607
AU202ACF 34,2 19,2 6,2 118,1 2015-05-04 82 -86 72,9 -72,9 disregarded 20085
AU203ACF 34,2 19,3 6,2 119,9 2015-05-11 75 -70 91,8 -90,5 94,8 x 4521192
AU204ACF 34,3 19,3 6,1 117,6 2015-05-11 76 -79 109,8 -105,9 disregarded 27559
AU205ACF 34,2 19,3 6,2 119,2 2015-05-11 66 -64 116,1 -113,5 84 x 6998763
AU206ACF 34,2 19,2 6,2 119,0 2015-05-11 57 -57 101,3 -98,7 72,9 x 6998763
AU207ACF 34,2 19,1 6,2 118,2 2015-05-18 71 -70 114,9 109,7 91,8 2038891
AU208ACF 34,2 19,1 6,2 117,2 2015-05-18 84 -81 125,4 -125,4 109,8 391321
AU209ACF 34,3 19,3 6,2 118,8 2015-05-18 91 -89 47,0 -47,0 116,1 1209328
AU210ACF 34,4 19,2 6,1 117,1 2015-05-18 78 -76 43,8 -46,1 101,3 x 6293855
AU211ACF 34,2 19,2 6,1 116,8 2015-05-18 88 84 70,5 -74,1 114,9 333555
AU212ACF 34,5 19,1 6,2 118,0 2015-05-18 97 -97 89,4 -88,2 125,4 535337

Appendices
73
Plaster cast EN AC 42100 As cast
Stress, pressure(MPa)
for N=10000 99.9
N=100000 78.5
N=1000000 60.9
N=10000000 51.1
Fatigue Limit 50.2
Standard Deviation 5.0
Load Ratio R -1.0
Exponent, 10^5 8.96
Limit Life 23700000
Sample
D
(mm)
d
(mm)
h
(mm)
A
(mm2) Test date
F high
(N)
F low
(N)
Stress max
(MPa)
Stress min
(MPa) Load RO Cycles
AH101ACF 35,1 20,1 6,0 120,7 2015-05-18 39 -39 82,2 -81,0 47 x 4418161
AH102ACF 35,1 20,2 6,0 122,0 2015-04-23 37 -39 94,9 -93,7 46,1 x 8670334
AH103ACF 35,1 20,0 6,1 122,0 2015-05-04 59 -62 60,9 -60,9 74,1 434578
AH104ACF 35,2 20,2 6,1 123,0 2015-05-04 76 -75 60,4 -58,2 89,4 50125
AH105ACF 35,1 20,1 6,0 121,1 2015-05-11 47 -49 54,6 -54,6 58,8 763677
AH106ACF 35,1 20,3 6,1 123,0 2015-05-11 54 -57 50,1 -50,1 66,5 328569
AH107ACF 35,2 20,3 6,1 123,4 2015-05-11 60 -61 44,1 -44,1 71 336394
AH108ACF 35,2 20,3 6,1 122,8 2015-05-11 69 -69 40,7 -41,9 80,9 41408
AH109ACF 35,3 20,3 6,1 123,1 2015-05-18 45 -43 65,7 -69,2 52,6 1328825
AH110ACF 35,0 20,1 6,0 120,8 2015-05-18 48 -49 76,0 -77,2 59 1693798
AH111ACF 35,1 20,1 6,1 121,5 2015-05-18 50 -51 41,0 -38,7 61 1213113
AH112ACF 35,1 20,0 6,0 121,0 2015-05-18 56 -53 58,1 -60,4 67,4 365462

Appendices
74
Plaster cast EN AC 42100 T6
Stress, pressure(MPa)
F for N=1 000 172.5
N=10 000 138.8
N=100000 105.1
N=1000000 82.9
Fatigue Limit 79.7
Standard Deviation 4.7
Load Ratio R -1.0
Exponent, 10^5 8.11
Limit Life 3070000
Sample
D
(mm)
d
(mm)
h
(mm)
A
(mm2) Test date
F high
(N)
F low
(N)
Stress max
(MPa)
Stress min
(MPa) Load RO Cycles
AH101HTF 35,1 20,3 6,0 122,3 2015-04-23 64 -63 68,7 -69,9 75,2 x 5558738
AH102HTF 35,4 20,3 6,0 122,2 2015-04-23 51 -49 86,0 -88,4 59,9 x 3148172
AH103HTF 35,0 20,3 6,1 124,0 2015-05-04 75 -75 69,6 -68,4 86,9 866110
AH104HTF 35,1 20,1 6,0 120,5 2015-05-04 66 -65 77,3 -75,0 79,6 1710712
AH105HTF 35,1 20,3 6,1 122,6 2015-05-04 64 -62 82,2 -81,0 75,2 1890981
AH106HTF 35,4 20,3 6,0 122,4 2015-05-11 56 -55 94,9 -93,7 65,7 x 3028594
AH107HTF 35,2 20,3 6,1 123,7 2015-05-11 59 -60 60,9 -60,9 69,9 x 4635826
AH108HTF 35,1 20,1 6,0 120,1 2015-05-11 71 -73 60,4 -58,2 88,4 301410
AH109HTF 35,1 20,2 6,0 120,5 2015-05-18 58 -57 54,6 -54,6 69,6 x 4418161
AH110HTF 35,3 20,3 6,0 122,7 2015-05-18 66 -64 50,1 -50,1 75 x 4418161
AH111HTF 35,0 20,3 6,1 122,6 2015-05-18 70 -69 44,1 -44,1 82,2 2514869
AH112HTF 35,1 20,3 6,0 122,6 2015-05-18 81 -80 40,7 -41,9 94,9 328175

Appendices
75
Plaster EN AC 42100 + 1.7 wt. % Cu As cast
Stress, pressure(MPa)
F for N=10000 106.3
N=100000 84.2
N=1000000 65.9
N=10000000 55.3
Fatigue Limit 54.1
Standard Deviation 6.4
Load Ratio R -1.0
Exponent, 10^5 9.30
Limit Life 27400000
Sample
D
(mm)
d
(mm)
h
(mm)
A
(mm2) Test date
F high
(N)
F low
(N)
Stress max
(MPa)
Stress min
(MPa) Load RO Cycles
AH201ACF 35,4 20,3 6,1 122,8 2015-04-23 52 -52 60,9 -60,9 60,9 944365
AH202ACF 35,5 20,4 6,1 125,2 2015-04-23 53 -51 60,4 -58,2 60,4 2259992
AH203ACF 35,2 20,2 6,0 121,5 2015-04-23 46 -46 54,6 -54,6 54,6 2731173
AH204ACF 35,3 20,3 6,1 123,3 2015-04-23 43 -43 50,1 -50,1 50,1 x 8670334
AH205ACF 35,0 20,2 6,0 121,6 2015-04-23 37 -37 44,1 -44,1 44,1 x 8670334
AH206ACF 35,3 20,3 6,1 123,6 2015-04-23 35 -36 40,7 -41,9 41,9 x 8670334
AH207ACF 35,3 20,4 6,1 123,9 2015-05-04 57 -60 65,7 -69,2 69,2 1581066
AH208ACF 35,2 20,2 6,1 122,0 2015-05-04 64 -65 76,0 -77,2 77,2 323258
AH209ACF 35,2 20,5 6,1 125,1 2015-04-17 36 -34 41,0 -38,7 41 x 6000000
AH210ACF 35,1 20,3 6,1 123,8 2015-04-17 50 -52 58,1 -60,4 disregarded 39639
AH211ACF 35,5 20,5 6,1 125,1 2015-05-04 64 -65 72,9 -74,0 74 745161
AH212ACF 35,4 20,4 6,1 124,4 2015-05-04 58 -60 66,7 -69,0 69 328808