Embed Size (px)
Citation preview
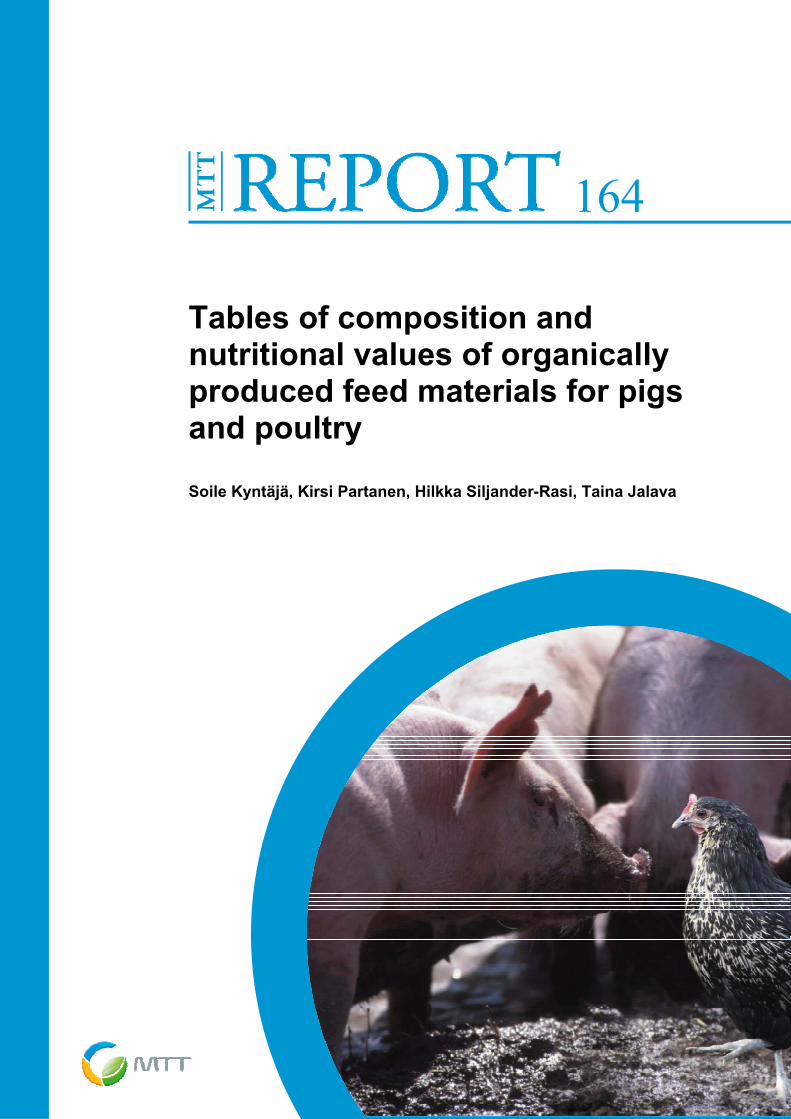
Tables of composition and nutritional values of organically produced feed materials for pigs and poultry Soile Kyntäjä, Kirsi Partanen, Hilkka Siljander-Rasi, Taina Jalava
164
Tables of composition and nutritional values of organically produced feed materials for
pigs and poultry
Soile Kyntäjä, Kirsi Partanen, Hilkka Siljander-Rasi, Taina Jalava
164

This report is included in the work of the EU Core Organic ll research project ICOPP (Improved contribu-tion of local feed ingredient to support 100% organic feed supply to pigs and poultry). Report is part of Work package 2: Feed evaluation of organically produced feed stuffs.
ISBN: 978-952-487-571-4 (Verkkojulkaisu) ISSN: 1798-6419 (Verkkojulkaisu) URN: http://urn.fi/URN:ISBN:978-952-487-571-4 http://www.mtt.fi/mttraportti/pdf/mttraportti164.pdf Copyright: MTT Kirjoittajat: Soile Kyntäjä, Kirsi Partanen, Hilkka Siljander-Rasi, Taina Jalava Julkaisija ja kustantaja: MTT Jokioinen Julkaisuvuosi: 2014 Kannen kuva: Esa Melametsä, Janne Lehtinen / MTT:n arkisto, muokkaus Outi Mäkilä

MTT REPORT 164 3
Tables of composition and nutritional value of organically produced feeds materials for pigs
and poultry
Soile Kyntäjä, Kirsi Partanen*, Hilkka Siljander-Rasi, Taina Jalava MTT, Agrifood Research Finland, Animal Production Research, Metla, PO Box 18, 01301 Vantaa, Finland, [email protected].
*Current address: Snellmanin Lihanjalostus Oy, Kuusisaarentie 1, FI-68600 Pietarsaari, Finland.
Abstract
Organically produced cereals, legumes, oil seed products, forages, silages and new protein feedstuffs were analysed for nutrient composition. In this report, new high quality, protein rich feedstuffs included microalgae, insects and mussel meal. Protein feedstuffs also contained samples from less known plant feed materials for pigs and poultry, such as sainfoin seeds with hulls or dehulled, grass pea seeds and soybean by-product okara.
Feed samples were analysed for dry matter, ash, crude protein, ether extract, crude fibre, neutral and acid detergent fibre, lignin, starch, sugars, amino acids, minerals, phytic acid, phytase activity and in vitro digestibilities according to Boisen and Fernàndez (1995, 1997) to predict the standardised ileal digestibil-ity of amino acids (Boisen 2007). MTT, Agrifood Research Finland, analysed all the feed ingredients that were used in the feeding experiments throughout the ICOPP project. By having all samples analysed in the same place, and using the same methodology, it is possible to compare feed ingredients and transfer the results from country to country.
Furthermore, there is often lack of information concerning analysed nutrient composition of organically produced feed materials. Information in this report can be used in feed optimisation for pigs and poultry on farms and by feed manufactures. Feedstuff names have been compiled based on EU feed catalogue (EU 575/2011).
The calculation of feed energy values for pigs and poultry differs between European countries. In this report, the nutrient contents are translated into the feeding values according to feed evaluation systems used in different European countries. This report contains energy and protein values for pigs based on the French, Dutch and Danish feed evaluation systems. Energy values of feeds were also calculated according the British, German and Swiss feed evaluation systems. Energy values for poultry were presented accord-ing to the Finnish and Dutch feed evaluation systems.
Keywords feed evaluation, organic production, feed materials, chemical composition, energy, protein, amino acids, pigs, poultry

MTT REPORT 164 4
Luonnonmukaisesti tuotettujen rehuaineiden kemiallinen koostumus ja ruokinnallinen arvo sioilla ja siipikarjalla
Soile Kyntäjä, Kirsi Partanen*, Hilkka Siljander-Rasi, Taina Jalava MTT, Kotieläintuotannon tutkimus, 01300 Vantaa, Finland, [email protected] *Current address: Snellmanin Lihanjalostus Oy, Kuusisaarentie 1, FI-68600 Pietarsaari, Finland.
Tiivistelmä
Raportin tavoitteena on tuottaa tietoa luonnonmukaisesti tuotetuista rehuraaka-aineista sikojen ja siipikarjan ruokinnassa. Luonnonmukaisesti tuotetuista viljoista, palkokasveista, öljykasvien siemenistä, säilörehusta ja uusista rehuaineista analysoitiin kemiallinen koostumus. Uudet rehuaineet ovat tässä raportissa esparsetti, peltonätkelmä, soijapulppa (okara) sekä levät, hyönteiset ja simpukat.
Näytteistä analysoitiin kuiva-aine, tuhka, raakavalkuainen, raakarasva, raakakuitu, NDF, ADF, ligniini, tärkkelys, sokerit, aminohappokoostumus, kivennäiskoostumus, fytiinihappo ja fytaasiaktiivisuus. In vitro- sulavuudet määritettiin Boisenin ja Fernàndezin (1995, 1997) mukaan. Standardoidut aminohappojen ohutsuolisulavuudet määritettin Boisenin (2007) mukaisesti. Kaikki rehuaineet analysoitiin Maa- ja elintarviketalouden tutkimuskeskuksen (MTT) laboratoriossa. Analyysitulosten vertailu eri maiden kesken helpottuu, kun kaikki analyysit on tehty samassa paikassa samoin menetelmin. Rehuaineluettelo on koottu ICOPP- projektiin kuuluneista tutkimuksista. Raportin rehuaineet on luokiteltu ja numeroitu EU:n rehuaineluettelon mukaisesti.
Sikojen ja siipikarjan rehujen rehuarvojen laskentaperusteet vaihtelevat huomattavasti Euroopan eri maissa. Tähän raporttiin on koottu rehuluettelon mukaiset rehujen rehuarvot laskettuina eri maiden rehuarvojärjestelmillä. Sikojen energia- ja valkuaisarvot on ilmoitettu Ranskan, Hollannin ja Tanskan laskentaperusteiden mukaan. Lisäksi energia-arvot sioille on laskettu Englannin, Saksan ja Sveitsin energia-arvojärjestelmien mukaisesti. Siipikarjan energia-arvot ilmoitetaan raportissa Suomen ja Hollannin järjestelmän mukaan laskettuna. Keywords: rehuarvo, luonnonmukainen tuotanto, rehuaineet, kemiallinen koostumus, energia, valkuainen, siat, siipi-karja
MTT REPORT 164 5
Table of contents
Table of contents .......................................................................................................................................... 5 1 Introduction ............................................................................................................................................... 6 2 Material and methods ................................................................................................................................ 7
2.1 Chemical analyses of organic feedstuffs ..............................................................................................7 2.1.1 Feed materials ........................................................................................................................... 7 2.1.2 Methods of analysis .................................................................................................................. 7
2.2 Calculation of feeding values of organic feedstuffs ........................................................................... 10 2.2.1 Energy and protein values for pigs ..........................................................................................10 2.2.2 Energy and protein values for poultry ......................................................................................11
2.3 List of abbreviations used in chemical composition tables ................................................................ 12 2.4 List of abbreviations used in feed evaluation tables .......................................................................... 12
3 Results ......................................................................................................................................................13 3.1 Chemical composition of organic feed ingredients ............................................................................ 13 3.2 Amino acid composition of organic feed ingredients ........................................................................ 15 3.3 Mineral content of organic feed ingredients ...................................................................................... 18 3.4 Energy and protein values of organic feed ingredients for pigs ......................................................... 20
3.4.1 The French feed evaluation system: Energy and protein values ..............................................20 3.4.2 The Dutch feed evaluation system: Energy and protein values ...............................................22 3.4.3 The Danish feed evaluation system: Energy and protein values ..............................................24 3.4.4 In vitro digestibilities and calculated standardised amino acid digestibilities .........................26 3.4.5 The British feed evaluation system: Energy values .................................................................29 3.4.6 The German feed evaluation system: Energy values ...............................................................31 3.4.7 The Swiss feed evaluation system: Energy values ...................................................................32
3.5 Energy values for Poultry................................................................................................................... 33 3.5.1 The Finnish feed evaluation system: Energy values ................................................................33 3.5.2 The Dutch feed evaluation system: Energy and protein values ...............................................34
4 References ................................................................................................................................................36 5 Links .........................................................................................................................................................37
MTT REPORT 164 6
1 Introduction
The main aim of this feed table is to increase knowledge of organically produced feed materials for pigs and poultry. It is crucial to present reliable feed values as a base for feed formulation. Different phases of production require knowledge of energy values and nutrient composition to achieve high production re-sults as well as good animal health and welfare. The cost of feeds in organic pig and poultry production is approximately 60 to 70 % of the total production costs. In order to attain economically favourable out-comes, there is an obvious need to gather exact nutritional data as much as possible.
In addition, an important target for this work was to study novel and innovative feed materials for pig and poultry production. Useful information has been obtained about the nutrient composition of potential novel protein feedstuffs for organic pig and poultry production such as grass pea seeds, sainfoin seeds (whole and dehulled), soybean by-product okara, microalgae, mussel meal and Hermetia illucens larvae and meals. Hermetia illucens larvae and meals are not yet permitted for use in pig and poultry nutrition. However, they are potential high quality protein sources for feeding of monogastric domestic animals in the future.
The potential of legumes such as sainfoin, grass pea and sweet lupin seeds for organic pig and poultry production has not been fully explored to date. Because they are not as common feed materials in conven-tional production as peas and faba beans, there has been lack of published analyses of their chemical composition and feeding values. The same issue concerns some by-products of organic food processing. Okara, a soybean by-product from the production of beancurd (tofu), is a potential high quality protein source for organic production.
One purpose of this work was to analyse different roughages for pigs and poultry. In organic production, pigs should be fed roughages daily. However, the contribution of roughages to the nutrient supply of pigs and poultry is not exploited efficiently. A good source of information could encourage farmers to extend silage use to organic pig and poultry feeding.

MTT REPORT 164 7
2 Material and methods
2.1 Chemical analyses of organic feedstuffs
2.1.1 Feed materials
Feed numbers and names are expressed as in EU Catalogue of feed materials (EU 575/2011).
The chemical composition values have been collected from feed sample data of ICOPP partners. The feed materials described in the tables are those which have been used in ICOPP experiments. Feed mate-rials have been collected from following ICOPP partners:
- Wageningen UR Livestock Research, The Netherlands
- ORC, Organic Research Centre, United Kingdom
- Swedish University of Agricultural Sciences, Sweden
- BOKU-University of Natural Resources and Life Sciences Vienna,Austria
- Institute of Organic Farming, Germany
- MTT, Agrifood Research Finland, Finland
- University of Applied Sciences Weihenstephan-Triesdor, Germany
- Louis Bolk Institute, The Netherlands
- Food Animal Initiative, United Kingdom
- Research Institute of Organic Agriculture (FiBL), Switzerland
The country of ICOPP partner and the origin of feed sample is given in the tables s follows: FI = Finland, SE= Sweden, UK= United Kingdom, AT= Austria, NL= Netherlands, DE= Germany, CH= Switzerland
If several samples from same feed material and year were analysed, the average was calculated for those samples. In that case, number of samples (n) and the CV, coefficient of variation %(n=3 or more) or min – max values (n=2) of those samples is also given. If more than one analysis in one year, samples are from different batches of mentioned feed material.
2.1.2 Methods of analysis
The chemical composition of feed materials were analysed in the laboratory of MTT Animal Production Research. It is a testing laboratory (T024) accredited by FINAS and its quality system conforms to the requirements of the following Standard: SFS-EN ISO/IEC 17025.
Feed analyses of proximate composition included dry matter, ash, crude protein (N*6.25), ether exctract (after acid hydrolysis), crude fibre, neutral and acid detergent fibre, lignin, starch and sugars. Amino acid analysis included all amino acids except tryptophan. Mineral analysis included Ca, P, K, Na, Mg, Mn, Fe, Cu, Zn, S and Se. Phytic acid analysis and intrinsic phytase activity were also determined. In vitro digestibilities for pigs included the digestibility of N and DM for the estimation of standardised ileal di-gestibility (SID) of amino acids and the digestibility of OM for the estimation of total tract digestibility of energy.
All values are expressed per kg dry matter.
MTT REPORT 164 8
References to the principal methods used in the chemical analyses and in vitro digestibilities are given below.
Dry matter (DM) DM content was determined by drying samples at 105°C for 20 h.
Ash Ashing at 600°C for 2 h or alternatively at 510°C for 16 h. Official method AOAC-942.05
(Association of Official Analytical Chemists, USA). Ether extract (crude fat) after acid hydrolysis (EE)
Acid hydrolysis with 3 M HCl and ether extraction according to the accredited in-house methods No. 4.21 and 4.22 by Soxcap-Soxtec-Analyzer. Official Method AOAC-920.39 (Association of Official Analytical Chemists, USA) Fat (Crude) or Ether Extract in Animal Feed and Foss Tecator Application Note AN 390).
Nitrogen (Crude protein) by Kjeldahl method
Accredited in-house methods 1120, 1122 and 1125 Kjeldahl; Official method AOAC-984.13 (Association of Official Analytical Chemists, USA) using Cu as a digestion catalyst and using Foss Kjeltec 2400 Analyzer Unit (Foss Tecator AB, Höganäs, Sweden). Crude protein value was achieved by multiplying the nitrogen content by correction factor 6.25.
Crude fibre
by Fibertec 2023 FiberCap system (Foss Tecator AB, Höganäs, Sweden). EEC 92/89, ASN 3802. The determination of crude fibre in feed according to EEC standard using the FiberCap 2021/2023 system.
Neutral detergent fibre (NDF)
NDF Method (Method 6) : Neutral Detergent Fiber in Feeds - Filter Bag Technique (for A200 and A200I) using 25 microns nylon bags (F57, ANKOM Technology) and ANKOM 220 Fiber Analyzer (ANKOM Technology, 2052 O'Neil Road, Macedon NY 14502). Detergent solution was made according to Van Soest, P.J., Robertson, J.B. and Lewis, B.A. 1991. Methods for dietary fibre, neutral detergent fibre and nonstarch polysaccharides in relation to animal nutrition. Journal of Dairy Science, 74: 3583-3597. Sodium sulfite was used in NDF-detergent solution and α-amylase in case of samples containing starch. NDF is expressed without containing residual ash.
Acid Detergent fibre (ADF)
ADF Method (Method 5) : Acid Detergent Fiber in Feeds - Filter Bag Technique (for A200 and A200I) using 25 microns nylon bags (F57, ANKOM Technology) and ANKOM 220 Fiber Analyzer (ANKOM Technology, 2052 O'Neil Road, Macedon NY 14502). Detergent solution was made according to Robertson, J.B. and Van Soest, P.J. 1981. The detergent system of analysis and its application to human foods. In: James, W.D.T. and Theander, O. (eds.). The Analyses of dietary Fibre in Foods. New York, NY, Marcell Dekker. p. 123-158.
Acid Detergent Lignin (ADL)
In-house method 4.18, determination by Fibertec System M Analyzer based on Ordior Application Note AN 304 and Ordior Application Sub Note ASN 3430 (AOAC- Method 973.18. Official Methods of Analysis. Association of Official Analytical Chemists).
Starch
by Salo, M-L. and Salmi, M. 1968. Determination of starch by the amyloglucosidase method. Jounal of the Scientific Agricultural Society of Finland, 40: 38-45.
Water soluble carbohydrates (reducing sugars)
Somogyi, M. 1945. A new reagent for the determination of sugars. Journal of Biological Chemistry 160: 61-68
MTT REPORT 164 9
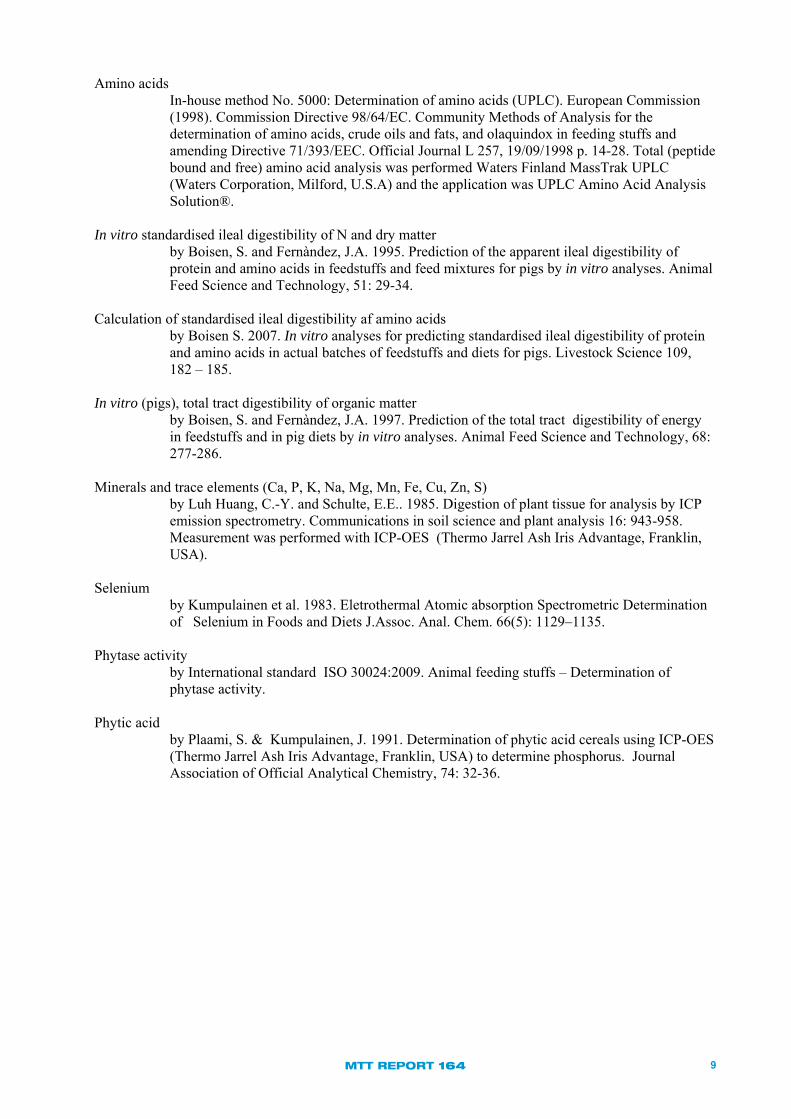
Amino acids In-house method No. 5000: Determination of amino acids (UPLC). European Commission (1998). Commission Directive 98/64/EC. Community Methods of Analysis for the determination of amino acids, crude oils and fats, and olaquindox in feeding stuffs and amending Directive 71/393/EEC. Official Journal L 257, 19/09/1998 p. 14-28. Total (peptide bound and free) amino acid analysis was performed Waters Finland MassTrak UPLC (Waters Corporation, Milford, U.S.A) and the application was UPLC Amino Acid Analysis Solution®.
In vitro standardised ileal digestibility of N and dry matter
by Boisen, S. and Fernàndez, J.A. 1995. Prediction of the apparent ileal digestibility of protein and amino acids in feedstuffs and feed mixtures for pigs by in vitro analyses. Animal Feed Science and Technology, 51: 29-34.
Calculation of standardised ileal digestibility af amino acids
by Boisen S. 2007. In vitro analyses for predicting standardised ileal digestibility of protein and amino acids in actual batches of feedstuffs and diets for pigs. Livestock Science 109, 182 – 185.
In vitro (pigs), total tract digestibility of organic matter
by Boisen, S. and Fernàndez, J.A. 1997. Prediction of the total tract digestibility of energy in feedstuffs and in pig diets by in vitro analyses. Animal Feed Science and Technology, 68: 277-286.
Minerals and trace elements (Ca, P, K, Na, Mg, Mn, Fe, Cu, Zn, S)
by Luh Huang, C.-Y. and Schulte, E.E.. 1985. Digestion of plant tissue for analysis by ICP emission spectrometry. Communications in soil science and plant analysis 16: 943-958. Measurement was performed with ICP-OES (Thermo Jarrel Ash Iris Advantage, Franklin, USA).
Selenium
by Kumpulainen et al. 1983. Eletrothermal Atomic absorption Spectrometric Determination of Selenium in Foods and Diets J.Assoc. Anal. Chem. 66(5): 1129–1135.
Phytase activity
by International standard ISO 30024:2009. Animal feeding stuffs – Determination of phytase activity.
Phytic acid
by Plaami, S. & Kumpulainen, J. 1991. Determination of phytic acid cereals using ICP-OES (Thermo Jarrel Ash Iris Advantage, Franklin, USA) to determine phosphorus. Journal Association of Official Analytical Chemistry, 74: 32-36.

MTT REPORT 164 10
2.2 Calculation of feeding values of organic feedstuffs
2.2.1 Energy and protein values for pigs
Energy and protein values for organically produced cereals, protein feed ingredients, roughages and new feed materials were calculated by several energy evaluation systems based on analysed chemical compo-sition and amino acid composition. In the case of French, Dutch and Danish feed evaluation system, the reference feed ingredient mentioned in the tables, express the origin of digestibility values for that feed ingredient. Evaluation of energy content of pig feed ingredients is based on their digestible (DE), metabolizable (ME) or net (NE) energy contents. The hierarchy between different feed ingredients is de-pended on used energy evaluation.
2.2.1.1 The French feed evaluation system
Energy and protein values are based on INRA-AFZ-AJINOMOTO EUROLYSINE S.A.S. 2004. Energy and protein values are calculated using EvaPig®-calculator (version 1.3.1.7). It provides digestible (DE), metabolizable (ME) and net energy (NE) values for both growing pigs (from weaning up to 150 kg) and for adult pigs (adult sows, boars).
EvaPig® provides values for standardised ileal digestible amino acids. In this report the values for ileal standardised digestible lysine, threonine, methionine, cysteine and valine are expressed as g/kg DM. Cal-culations of all feed materials are based on reference values of EvaPig® ingredients. Reference feed in-gredient is derived from the closest reference ingredient from a biological point of view. If available in other feed evaluation systems, same reference feed ingredient has been used.
EvaPig® manual of equations and coefficients will be found http://www.evapig.com/IMG/pdf/EvaPigManualEquations-3.pdf.
INRA- AFZ based energy evaluation system is used in France, Sweden and Finland.
2.2.1.2 The Dutch feed evaluation system
Energy and protein values based on Dutch CVB Feed table are calculated using Feed Value Calculator (CVB 2007). It provides net energy value, NEv (= net energy value for fat accretion) for calculated feed materials. The energy value of the feed ingredient is also expressed as EW (1NEv = 8.8 MJ NE).
Protein values are calculated as standardised digestible lysine, threonine, methionine, cysteine and valine. The reference feed ingredient has been chosen as close as possible from a biological point of view as in the case of Evapig®-calculation.
Calculation basis, equations and coefficients will be found in CVB Feed Table (CVB 2011).
The Dutch energy system is used in The Netherlands, Norway and Poland.
2.2.1.3 The Danish feed evaluation system
The Danish energy evaluation system (Potential Physiological Energy system, PPE) is based on the theo-retical biochemical utilization of energy by pigs. The Danish energy evaluation system based energy val-ues are expressed as Feed units for growing pigs (1 FEsv = 7.38 MJ physiological energy) and sows (1 FEso = 7.70 MJ physiological energy).
Protein values are calculated as standardised digestible lysine, threonine, methionine, cysteine and valine. In vitro digestibilities at ileal and faecal level for feed materials in this report, have been taken from refer-ence feed ingredient as published in the Danish feed table. Also the standardised ileal digestibilities of individual amino acids are calculated as in reference feed ingredient.
Calculation basis and equations for Danish feed evaluation system (Boisen 2006) are found in http://vsp.lf.dk/~/media/Files/PDF%20-%20Publikationer/Rapporter/Rapport30_DSP_Fodervurderingssystem_Svinefoder.ashx.
MTT REPORT 164 11
2.2.1.4 In vitro digestibilities
In this report standardised digestibility of crude protein (SDCP, %) and amino acids (SDAA, %) in feed materials were calculated from in vitro analyses of enzyme digestibility of crude protein and enzyme in-digestible dry matter (Boisen 2007).
2.2.1.5 The British feed energy evaluation system
The British energy system is based on the work of the French INRA laboratories. Energy values for feed materials are expressed in net energy (NE). Digestible energy (DE) is also expressed in the tables for comparison. Energy digestibilities (ES, %) for growing pigs in this report have taken from Sauvant et. 2004 (marked in table as a reference feed ingredient).
Calculation basis for the British energy evaluation system will be found in a publication by the British Society of Animal Science; Nutrient Requirement Standards for Pigs and in Premier Atlas Ingredients matrix, 2010 (http://www.premiernutrition.co.uk/default.aspx?SectionID=UK_TecAt).
2.2.1.6. The German feed energy evaluation system
The German feed evaluation system for pigs is based on metabolizable energy (ME). Due to missing di-gestibility values, the energy values for roughages were not possible to count. Calculation basis for Ger-man feed evaluation system can be found in http://www.gfe-frankfurt.de/download/ME-Schaetzung.pdf (GfE, 2008).
2.2.1.7. The Swiss feed energy evaluation system
The Swiss Energy system is based on digestible energy (DE). Two different equations are used, depend-ing on crude protein content in feed materials. Due to restricted regression demands for crude protein, crude fat and crude fiber, energy values for all feed materials were not possible to calculate.
Calculation basis and exact equations for Swiss feed evaluation system will be found in http://www.admin.ch/opc/de/classified-compilation/20092465/201407010000/916.307.1.pdf.
2.3 Energy and protein values for poultry
In this report, the energy values for poultry have been calculated using two different evaluation systems, the Finnish and Dutch system. The protein values for poultry have been calculated using the Dutch feed evaluation system.
2.2.2.1 The Finnish feed evaluation system
The Finnish energy value of feed ingredients for poultry is expressed as megajoules (MJ) of metabolizable energy (ME). The values are calculated based on a method presented either by WPSA (1986) or by equation based on digestible nutrients.
More information about Finnish energy system for poultry can be found https://portal.mtt.fi/portal/page/portal/Rehutaulukot/feed_tables_english/feed_tables/basis_of_calculations/energy_value_poultry. 2.2.2.2 The Dutch feed evaluation system
Energy and protein values based on CVB Feed table are calculated using Feed Value Calculator (CVB 2007). Energy values for poultry are expressed as metabolizable energy (ME). System calculates energy values separately for adult animals (adult cocks and laying hens) and for broilers. Amino acids values are calculated as faecal digestible amino acids, g/kg DM. The reference feed ingredient has been chosen as close as possible from a biological point of view. Calculation basis, equations and coefficients are found in CVB Feed Table 2011.

MTT REPORT 164 12
2.4 List of abbreviations used in chemical composition tables
unit description unit description ADF g acid detergent fiber kg kilogram
ADF-N g nitrogen in acid detergent fiber Leu g leucine
ADL g acid detergent lignin Lys g lysine
Ala g alanine Met g methionine
Arg g arginine mg milligram
Ash g crude ash Mg g Magnesium
Asp g aspartic acid Mn mg Manganese
Ca g Calcium Na g Sodium
CF g crude fibre NDF g neutral detergent fiber
CP g crude protein P g Phosphorus
Cu mg Copper Phe g phenylalanine
Cys g cystine Pro g proline
DM dry matter S g Sulphur
EE g crude fat after acid hydrolysis Se mg Selenium
Fe g Iron STA g starch
g gram SUG g sugars
Glu g glutamic acid Thr g threonine
Gly g glycine Tyr g tyrosine
His g histidine Val g valine
Ile g isoleucine Zn mg Zinc
K g Potassium
2.5 List of abbreviations used in feed evaluation tables
unit description dDM % Digestibility of dry matter
DE MJ Digestible energy
dig Cys g faecal digestible cystine
dig Lys g faecal digestible lysine
dig Met g faecal digestible methionine
dN % digestibility of Nitrogen
dOM % digestibility of Organic matter
ED % Digestibility of energy
EW Energy value for pigs
FEso Feed units for sows
FEsv Feed units for growing pigs
ME MJ Metabolizable energy
MJ Megajoule
NE MJ Net energy
NEv MJ Net energy value for fat accretion in pigs
SIDCP % standardized ileal digestibility of crude protein
SID Cys g standardised ileal digestible cystine
SID Lys g standardised ileal digestible lysine
SID Met g standardised ileal digestible methionine
SIDThr g standardised ileal digestible threonine
SIDVal g standardised ileal digestible valine
MTT REPORT 164 13
3 Results
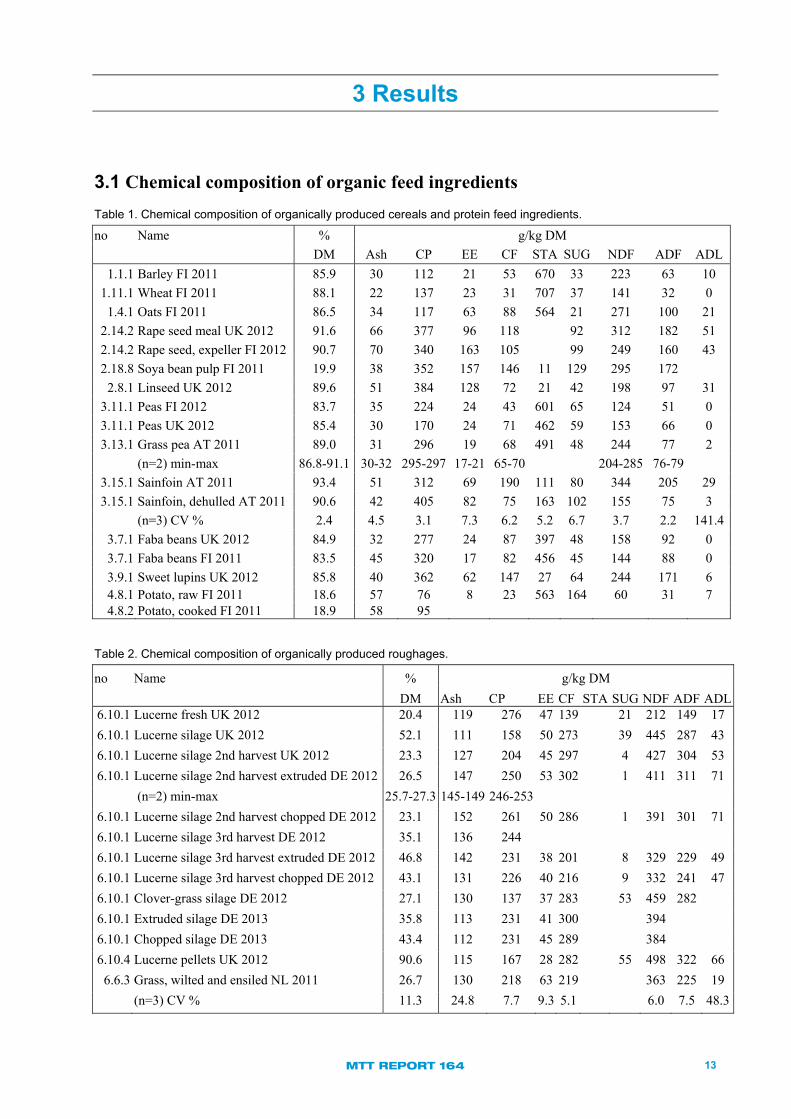
3.1 Chemical composition of organic feed ingredients Table 1. Chemical composition of organically produced cereals and protein feed ingredients. no Name % g/kg DM
DM Ash CP EE CF STA SUG NDF ADF ADL
1.1.1 Barley FI 2011 85.9 30 112 21 53 670 33 223 63 10
1.11.1 Wheat FI 2011 88.1 22 137 23 31 707 37 141 32 0
1.4.1 Oats FI 2011 86.5 34 117 63 88 564 21 271 100 21
2.14.2 Rape seed meal UK 2012 91.6 66 377 96 118 92 312 182 51
2.14.2 Rape seed, expeller FI 2012 90.7 70 340 163 105 99 249 160 43
2.18.8 Soya bean pulp FI 2011 19.9 38 352 157 146 11 129 295 172
2.8.1 Linseed UK 2012 89.6 51 384 128 72 21 42 198 97 31
3.11.1 Peas FI 2012 83.7 35 224 24 43 601 65 124 51 0
3.11.1 Peas UK 2012 85.4 30 170 24 71 462 59 153 66 0
3.13.1 Grass pea AT 2011 89.0 31 296 19 68 491 48 244 77 2
(n=2) min-max 86.8-91.1 30-32 295-297 17-21 65-70 204-285 76-79
3.15.1 Sainfoin AT 2011 93.4 51 312 69 190 111 80 344 205 29
3.15.1 Sainfoin, dehulled AT 2011 90.6 42 405 82 75 163 102 155 75 3
(n=3) CV % 2.4 4.5 3.1 7.3 6.2 5.2 6.7 3.7 2.2 141.4
3.7.1 Faba beans UK 2012 84.9 32 277 24 87 397 48 158 92 0
3.7.1 Faba beans FI 2011 83.5 45 320 17 82 456 45 144 88 0
3.9.1 Sweet lupins UK 2012 85.8 40 362 62 147 27 64 244 171 6 4.8.1 Potato, raw FI 2011 18.6 57 76 8 23 563 164 60 31 7 4.8.2 Potato, cooked FI 2011 18.9 58 95
Table 2. Chemical composition of organically produced roughages.
no Name % g/kg DM
DM Ash CP EE CF STA SUG NDF ADF ADL6.10.1 Lucerne fresh UK 2012 20.4 119 276 47 139 21 212 149 17
6.10.1 Lucerne silage UK 2012 52.1 111 158 50 273 39 445 287 43
6.10.1 Lucerne silage 2nd harvest UK 2012 23.3 127 204 45 297 4 427 304 53
6.10.1 Lucerne silage 2nd harvest extruded DE 2012 26.5 147 250 53 302 1 411 311 71
(n=2) min-max 25.7-27.3 145-149 246-253
6.10.1 Lucerne silage 2nd harvest chopped DE 2012 23.1 152 261 50 286 1 391 301 71
6.10.1 Lucerne silage 3rd harvest DE 2012 35.1 136 244
6.10.1 Lucerne silage 3rd harvest extruded DE 2012 46.8 142 231 38 201 8 329 229 49
6.10.1 Lucerne silage 3rd harvest chopped DE 2012 43.1 131 226 40 216 9 332 241 47
6.10.1 Clover-grass silage DE 2012 27.1 130 137 37 283 53 459 282
6.10.1 Extruded silage DE 2013 35.8 113 231 41 300 394
6.10.1 Chopped silage DE 2013 43.4 112 231 45 289 384
6.10.4 Lucerne pellets UK 2012 90.6 115 167 28 282 55 498 322 66
6.6.3 Grass, wilted and ensiled NL 2011 26.7 130 218 63 219 363 225 19
(n=3) CV % 11.3 24.8 7.7 9.3 5.1 6.0 7.5 48.3
MTT REPORT164 14
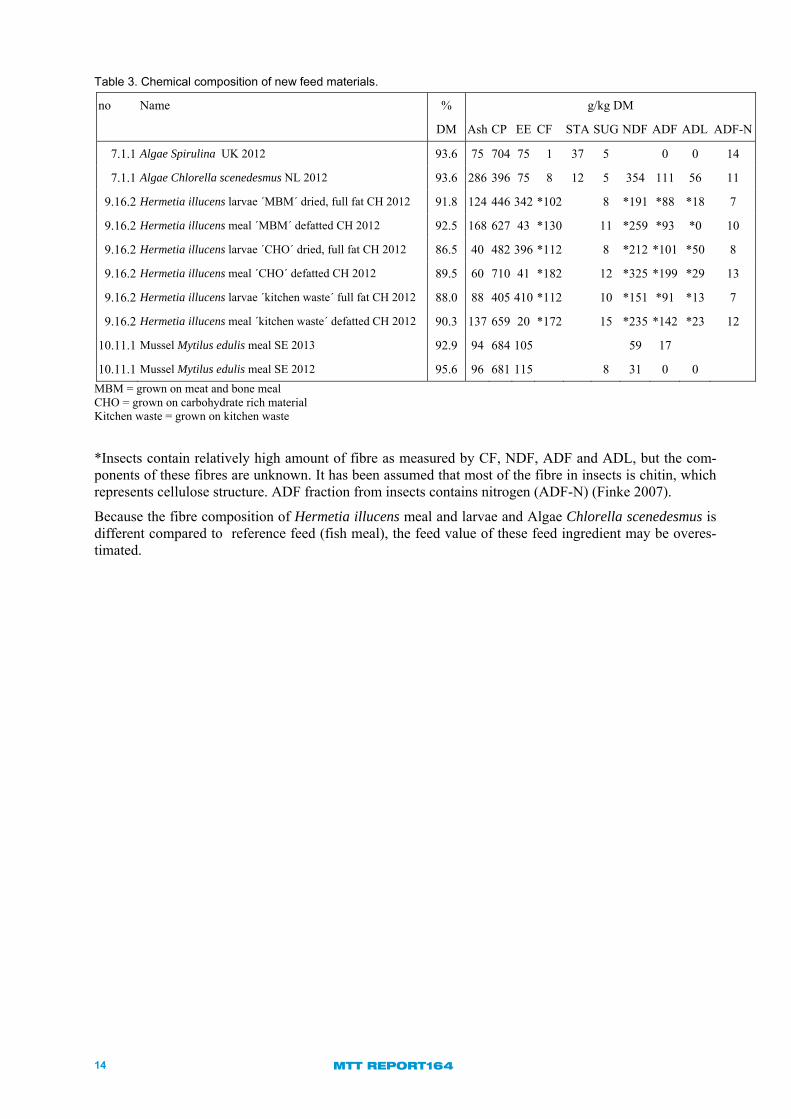
Table 3. Chemical composition of new feed materials.
no Name % g/kg DM
DM Ash CP EE CF STA SUG NDF ADF ADL ADF-N
7.1.1 Algae Spirulina UK 2012 93.6 75 704 75 1 37 5 0 0 14
7.1.1 Algae Chlorella scenedesmus NL 2012 93.6 286 396 75 8 12 5 354 111 56 11
9.16.2 Hermetia illucens larvae ´MBM´ dried, full fat CH 2012 91.8 124 446 342 *102 8 *191 *88 *18 7
9.16.2 Hermetia illucens meal ´MBM´ defatted CH 2012 92.5 168 627 43 *130 11 *259 *93 *0 10
9.16.2 Hermetia illucens larvae ´CHO´ dried, full fat CH 2012 86.5 40 482 396 *112 8 *212 *101 *50 8
9.16.2 Hermetia illucens meal ´CHO´ defatted CH 2012 89.5 60 710 41 *182 12 *325 *199 *29 13
9.16.2 Hermetia illucens larvae ´kitchen waste´ full fat CH 2012 88.0 88 405 410 *112 10 *151 *91 *13 7
9.16.2 Hermetia illucens meal ´kitchen waste´ defatted CH 2012 90.3 137 659 20 *172 15 *235 *142 *23 12
10.11.1 Mussel Mytilus edulis meal SE 2013 92.9 94 684 105 59 17
10.11.1 Mussel Mytilus edulis meal SE 2012 95.6 96 681 115 8 31 0 0
MBM = grown on meat and bone meal CHO = grown on carbohydrate rich material Kitchen waste = grown on kitchen waste
*Insects contain relatively high amount of fibre as measured by CF, NDF, ADF and ADL, but the com-ponents of these fibres are unknown. It has been assumed that most of the fibre in insects is chitin, which represents cellulose structure. ADF fraction from insects contains nitrogen (ADF-N) (Finke 2007).
Because the fibre composition of Hermetia illucens meal and larvae and Algae Chlorella scenedesmus is different compared to reference feed (fish meal), the feed value of these feed ingredient may be overes-timated.
M
TT R
EP
OR
T 1
64
15
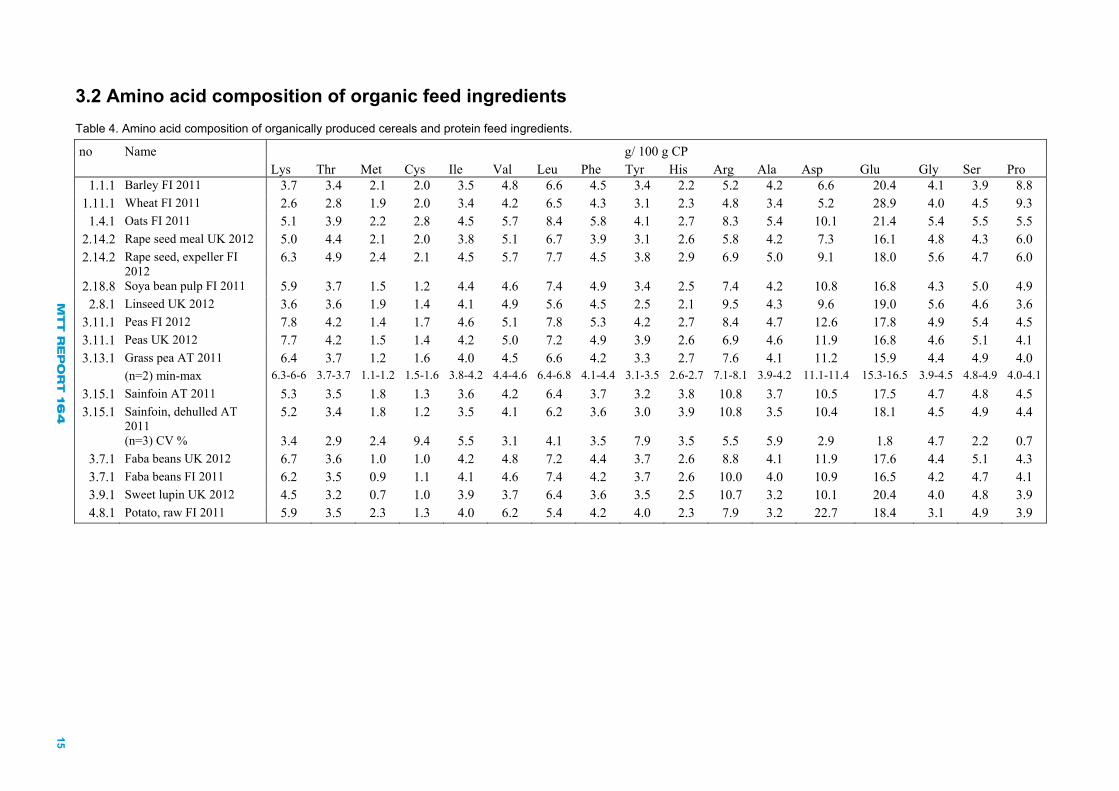
3.2 Amino acid composition of organic feed ingredients Table 4. Amino acid composition of organically produced cereals and protein feed ingredients.
no Name g/ 100 g CP Lys Thr Met Cys Ile Val Leu Phe Tyr His Arg Ala Asp Glu Gly Ser Pro
1.1.1 Barley FI 2011 3.7 3.4 2.1 2.0 3.5 4.8 6.6 4.5 3.4 2.2 5.2 4.2 6.6 20.4 4.1 3.9 8.8 1.11.1 Wheat FI 2011 2.6 2.8 1.9 2.0 3.4 4.2 6.5 4.3 3.1 2.3 4.8 3.4 5.2 28.9 4.0 4.5 9.3 1.4.1 Oats FI 2011 5.1 3.9 2.2 2.8 4.5 5.7 8.4 5.8 4.1 2.7 8.3 5.4 10.1 21.4 5.4 5.5 5.5
2.14.2 Rape seed meal UK 2012 5.0 4.4 2.1 2.0 3.8 5.1 6.7 3.9 3.1 2.6 5.8 4.2 7.3 16.1 4.8 4.3 6.0 2.14.2 Rape seed, expeller FI
2012 6.3 4.9 2.4 2.1 4.5 5.7 7.7 4.5 3.8 2.9 6.9 5.0 9.1 18.0 5.6 4.7 6.0
2.18.8 Soya bean pulp FI 2011 5.9 3.7 1.5 1.2 4.4 4.6 7.4 4.9 3.4 2.5 7.4 4.2 10.8 16.8 4.3 5.0 4.9 2.8.1 Linseed UK 2012 3.6 3.6 1.9 1.4 4.1 4.9 5.6 4.5 2.5 2.1 9.5 4.3 9.6 19.0 5.6 4.6 3.6
3.11.1 Peas FI 2012 7.8 4.2 1.4 1.7 4.6 5.1 7.8 5.3 4.2 2.7 8.4 4.7 12.6 17.8 4.9 5.4 4.5 3.11.1 Peas UK 2012 7.7 4.2 1.5 1.4 4.2 5.0 7.2 4.9 3.9 2.6 6.9 4.6 11.9 16.8 4.6 5.1 4.1 3.13.1 Grass pea AT 2011 6.4 3.7 1.2 1.6 4.0 4.5 6.6 4.2 3.3 2.7 7.6 4.1 11.2 15.9 4.4 4.9 4.0
(n=2) min-max 6.3-6-6 3.7-3.7 1.1-1.2 1.5-1.6 3.8-4.2 4.4-4.6 6.4-6.8 4.1-4.4 3.1-3.5 2.6-2.7 7.1-8.1 3.9-4.2 11.1-11.4 15.3-16.5 3.9-4.5 4.8-4.9 4.0-4.1
3.15.1 Sainfoin AT 2011 5.3 3.5 1.8 1.3 3.6 4.2 6.4 3.7 3.2 3.8 10.8 3.7 10.5 17.5 4.7 4.8 4.5 3.15.1 Sainfoin, dehulled AT
2011 5.2 3.4 1.8 1.2 3.5 4.1 6.2 3.6 3.0 3.9 10.8 3.5 10.4 18.1 4.5 4.9 4.4
(n=3) CV % 3.4 2.9 2.4 9.4 5.5 3.1 4.1 3.5 7.9 3.5 5.5 5.9 2.9 1.8 4.7 2.2 0.7 3.7.1 Faba beans UK 2012 6.7 3.6 1.0 1.0 4.2 4.8 7.2 4.4 3.7 2.6 8.8 4.1 11.9 17.6 4.4 5.1 4.3 3.7.1 Faba beans FI 2011 6.2 3.5 0.9 1.1 4.1 4.6 7.4 4.2 3.7 2.6 10.0 4.0 10.9 16.5 4.2 4.7 4.1 3.9.1 Sweet lupin UK 2012 4.5 3.2 0.7 1.0 3.9 3.7 6.4 3.6 3.5 2.5 10.7 3.2 10.1 20.4 4.0 4.8 3.9 4.8.1 Potato, raw FI 2011 5.9 3.5 2.3 1.3 4.0 6.2 5.4 4.2 4.0 2.3 7.9 3.2 22.7 18.4 3.1 4.9 3.9
M
TT R
EP
OR
T 1
64
16
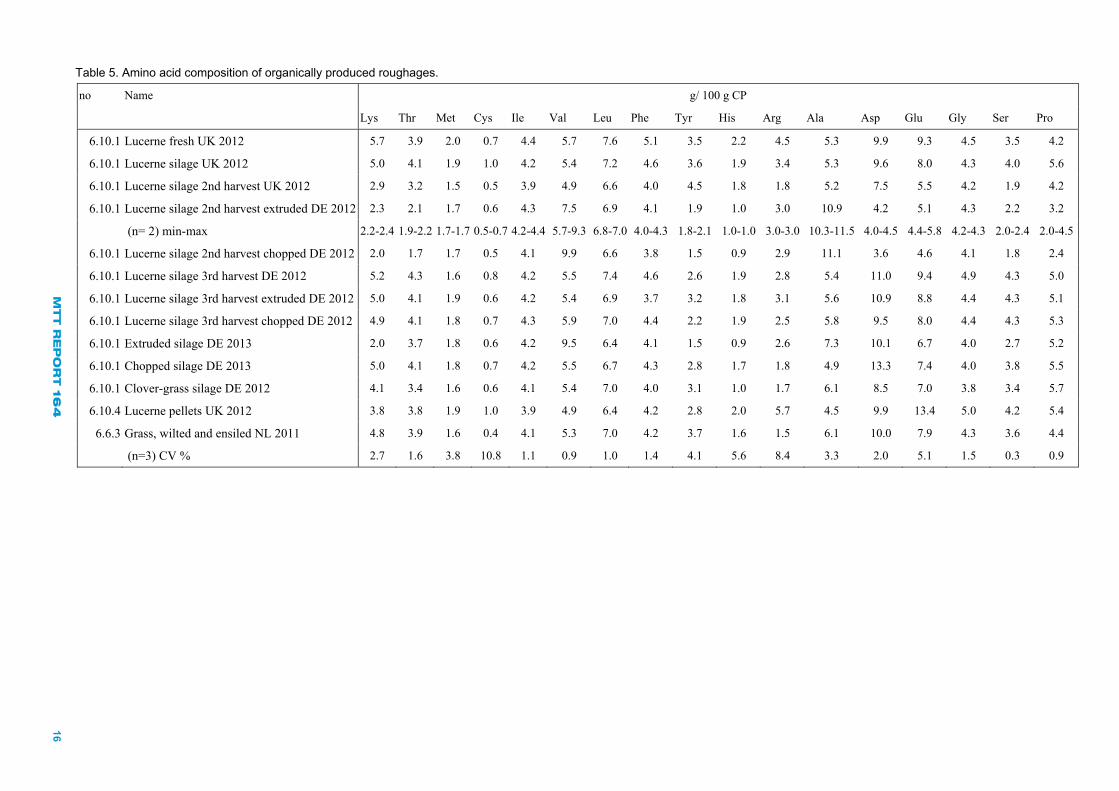
Table 5. Amino acid composition of organically produced roughages.
no Name g/ 100 g CP
Lys Thr Met Cys Ile Val Leu Phe Tyr His Arg Ala Asp Glu Gly Ser Pro
6.10.1 Lucerne fresh UK 2012 5.7 3.9 2.0 0.7 4.4 5.7 7.6 5.1 3.5 2.2 4.5 5.3 9.9 9.3 4.5 3.5 4.2
6.10.1 Lucerne silage UK 2012 5.0 4.1 1.9 1.0 4.2 5.4 7.2 4.6 3.6 1.9 3.4 5.3 9.6 8.0 4.3 4.0 5.6
6.10.1 Lucerne silage 2nd harvest UK 2012 2.9 3.2 1.5 0.5 3.9 4.9 6.6 4.0 4.5 1.8 1.8 5.2 7.5 5.5 4.2 1.9 4.2
6.10.1 Lucerne silage 2nd harvest extruded DE 2012 2.3 2.1 1.7 0.6 4.3 7.5 6.9 4.1 1.9 1.0 3.0 10.9 4.2 5.1 4.3 2.2 3.2
(n= 2) min-max 2.2-2.4 1.9-2.2 1.7-1.7 0.5-0.7 4.2-4.4 5.7-9.3 6.8-7.0 4.0-4.3 1.8-2.1 1.0-1.0 3.0-3.0 10.3-11.5 4.0-4.5 4.4-5.8 4.2-4.3 2.0-2.4 2.0-4.5
6.10.1 Lucerne silage 2nd harvest chopped DE 2012 2.0 1.7 1.7 0.5 4.1 9.9 6.6 3.8 1.5 0.9 2.9 11.1 3.6 4.6 4.1 1.8 2.4
6.10.1 Lucerne silage 3rd harvest DE 2012 5.2 4.3 1.6 0.8 4.2 5.5 7.4 4.6 2.6 1.9 2.8 5.4 11.0 9.4 4.9 4.3 5.0
6.10.1 Lucerne silage 3rd harvest extruded DE 2012 5.0 4.1 1.9 0.6 4.2 5.4 6.9 3.7 3.2 1.8 3.1 5.6 10.9 8.8 4.4 4.3 5.1
6.10.1 Lucerne silage 3rd harvest chopped DE 2012 4.9 4.1 1.8 0.7 4.3 5.9 7.0 4.4 2.2 1.9 2.5 5.8 9.5 8.0 4.4 4.3 5.3
6.10.1 Extruded silage DE 2013 2.0 3.7 1.8 0.6 4.2 9.5 6.4 4.1 1.5 0.9 2.6 7.3 10.1 6.7 4.0 2.7 5.2
6.10.1 Chopped silage DE 2013 5.0 4.1 1.8 0.7 4.2 5.5 6.7 4.3 2.8 1.7 1.8 4.9 13.3 7.4 4.0 3.8 5.5
6.10.1 Clover-grass silage DE 2012 4.1 3.4 1.6 0.6 4.1 5.4 7.0 4.0 3.1 1.0 1.7 6.1 8.5 7.0 3.8 3.4 5.7
6.10.4 Lucerne pellets UK 2012 3.8 3.8 1.9 1.0 3.9 4.9 6.4 4.2 2.8 2.0 5.7 4.5 9.9 13.4 5.0 4.2 5.4
6.6.3 Grass, wilted and ensiled NL 2011 4.8 3.9 1.6 0.4 4.1 5.3 7.0 4.2 3.7 1.6 1.5 6.1 10.0 7.9 4.3 3.6 4.4
(n=3) CV % 2.7 1.6 3.8 10.8 1.1 0.9 1.0 1.4 4.1 5.6 8.4 3.3 2.0 5.1 1.5 0.3 0.9
M
TT R
EP
OR
T 1
64
17
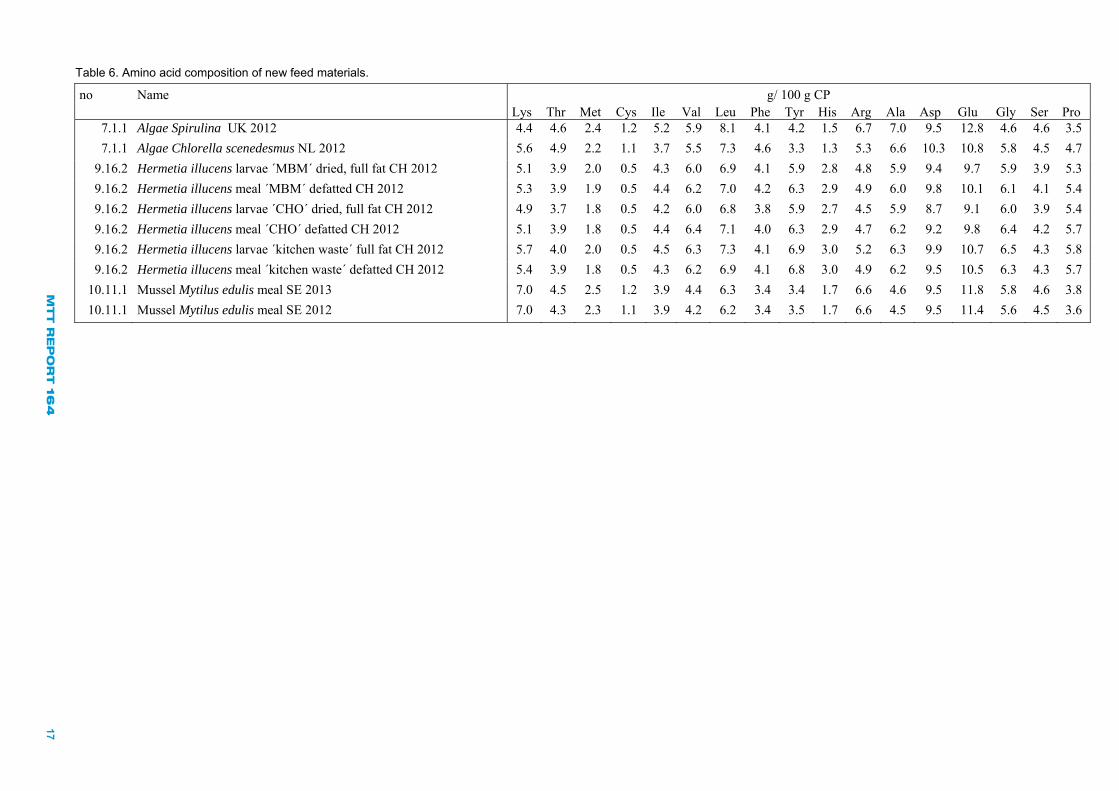
Table 6. Amino acid composition of new feed materials.
no Name g/ 100 g CP Lys Thr Met Cys Ile Val Leu Phe Tyr His Arg Ala Asp Glu Gly Ser Pro
7.1.1 Algae Spirulina UK 2012 4.4 4.6 2.4 1.2 5.2 5.9 8.1 4.1 4.2 1.5 6.7 7.0 9.5 12.8 4.6 4.6 3.5
7.1.1 Algae Chlorella scenedesmus NL 2012 5.6 4.9 2.2 1.1 3.7 5.5 7.3 4.6 3.3 1.3 5.3 6.6 10.3 10.8 5.8 4.5 4.7
9.16.2 Hermetia illucens larvae ´MBM´ dried, full fat CH 2012 5.1 3.9 2.0 0.5 4.3 6.0 6.9 4.1 5.9 2.8 4.8 5.9 9.4 9.7 5.9 3.9 5.3
9.16.2 Hermetia illucens meal ´MBM´ defatted CH 2012 5.3 3.9 1.9 0.5 4.4 6.2 7.0 4.2 6.3 2.9 4.9 6.0 9.8 10.1 6.1 4.1 5.4
9.16.2 Hermetia illucens larvae ´CHO´ dried, full fat CH 2012 4.9 3.7 1.8 0.5 4.2 6.0 6.8 3.8 5.9 2.7 4.5 5.9 8.7 9.1 6.0 3.9 5.4
9.16.2 Hermetia illucens meal ´CHO´ defatted CH 2012 5.1 3.9 1.8 0.5 4.4 6.4 7.1 4.0 6.3 2.9 4.7 6.2 9.2 9.8 6.4 4.2 5.7
9.16.2 Hermetia illucens larvae ´kitchen waste´ full fat CH 2012 5.7 4.0 2.0 0.5 4.5 6.3 7.3 4.1 6.9 3.0 5.2 6.3 9.9 10.7 6.5 4.3 5.8
9.16.2 Hermetia illucens meal ´kitchen waste´ defatted CH 2012 5.4 3.9 1.8 0.5 4.3 6.2 6.9 4.1 6.8 3.0 4.9 6.2 9.5 10.5 6.3 4.3 5.7
10.11.1 Mussel Mytilus edulis meal SE 2013 7.0 4.5 2.5 1.2 3.9 4.4 6.3 3.4 3.4 1.7 6.6 4.6 9.5 11.8 5.8 4.6 3.8
10.11.1 Mussel Mytilus edulis meal SE 2012 7.0 4.3 2.3 1.1 3.9 4.2 6.2 3.4 3.5 1.7 6.6 4.5 9.5 11.4 5.6 4.5 3.6

M
TT R
EP
OR
T 1
64
18
3.3 Mineral content of organic feed ingredients Table 7. Mineral content of organically produced cereals and protein feed ingredients.
no Name g/kg DM % U/kg DM g/kg DM mg/kg DM
Ca P Phytic acid Phytate P/total P Phytase Mg S K Na Fe Cu Zn Mn Se 1.1.1 Barley FI 2011 0.4 4.3 11.3 0.74 1261 1.3 1.3 5.7 0.04 66 4.3 37.5 11.9 0.011
1.11.1 Wheat FI 2011 0.3 4.3 11.6 0.76 1449 1.5 1.4 4.8 0.02 42 4.6 36.5 30.0 0.011
1.4.1 Oats FI 2011 0.6 4.3 10.5 0.68 118 1.3 1.5 5.7 0.04 153 5.0 34.3 29.5 0.015
2.14.2 Rape seed meal UK 2012 6.9 8.8 24.2 0.77 41 4.5 7.4 11.1 0.03 196 5.6 57.5 65.9 0.419
2.14.2 Rape seed, expeller FI 2012 7.5 12.8 34.5 0.76 < 0,0 4.9 5.1 12.2 0.06 107 5.8 56.6 39.7 0.035
2.18.8 Soya bean pulp FI 2011 3.3 3.8 1.5 2.6 12.3 0.24 118 11.3 30.8 25.1
2.8.1 Linseed UK 2012 3.0 6.6 18.0 0.78 < 0,0 4.4 3.7 10.3 0.82 186 19.3 71.9 31.4 0.122
3.11.1 Peas FI 2012 0.6 5.6 11.7 0.58 22 1.3 1.8 11.8 0.02 73 9.1 41.5 5.1 0.012
3.11.1 Peas UK 2012 1.3 4.0 8.9 0.62 118 1.1 1.4 9.5 0.01 32 7.0 30.9 6.4 0.011
3.13.1 Grass pea AT 2011 1.5 3.6 7.0 0.55 12 1.3 2.2 9.2 0.07 101 9.7 43.3 16.1 0.058
3.15.1 Sainfoin AT 2011 7.6 5.5 11.8 0.61 230 1.8 2.6 10.9 0.03 105 8.3 47.4 27.2 0.062
3.15.1 Sainfoin, dehulled AT 2011 1.4 7.3 16.9 0.65 113 1.7 3.3 13.2 77 9.4 61.1 21.1 0.096
(n=2) min-max 1.3-1.4 7.0-7.6 16.2-17.6 0.65-0.66 1.6-1.8 3.2-3.5 12.8-13.6 73-82 9.2-9.6 59.4-62.7 20.8-21.3 0.089-0.102
3.7.1 Faba beans UK 2012 1.3 4.2 10.0 0.68 17 1.0 1.4 10.7 0.03 50 10.9 36.3 9.5 <0.01
3.7.1 Faba beans FI 2011 1.0 8.0 22.3 0.79 < 0,0 1.5 2.0 13.0 0.04 65 16.9 57.8 11.0 0.012
3.9.1 Sweet lupin UK 2012 3.0 5.3 12.0 0.64 96 1.8 2.7 10.1 0.16 80 6.0 30.8 54.9 0.079
4.8.1 Potato, raw FI 2011 2.47 1.6 0.18 1.06 1.7 23.0 0.03 120 6.8 16.2 6.0 <0.01
M
TT R
EP
OR
T 1
64
19
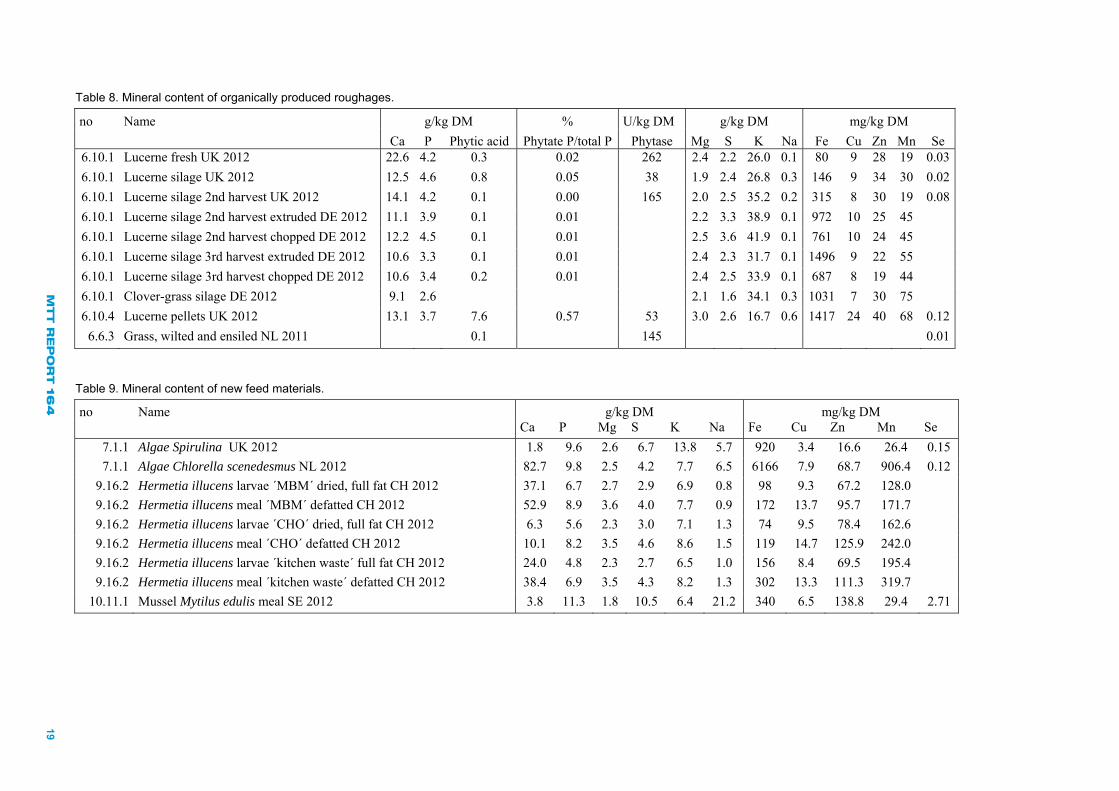
Table 8. Mineral content of organically produced roughages.
no Name g/kg DM % U/kg DM g/kg DM mg/kg DM
Ca P Phytic acid Phytate P/total P Phytase Mg S K Na Fe Cu Zn Mn Se 6.10.1 Lucerne fresh UK 2012 22.6 4.2 0.3 0.02 262 2.4 2.2 26.0 0.1 80 9 28 19 0.03
6.10.1 Lucerne silage UK 2012 12.5 4.6 0.8 0.05 38 1.9 2.4 26.8 0.3 146 9 34 30 0.02
6.10.1 Lucerne silage 2nd harvest UK 2012 14.1 4.2 0.1 0.00 165 2.0 2.5 35.2 0.2 315 8 30 19 0.08
6.10.1 Lucerne silage 2nd harvest extruded DE 2012 11.1 3.9 0.1 0.01 2.2 3.3 38.9 0.1 972 10 25 45
6.10.1 Lucerne silage 2nd harvest chopped DE 2012 12.2 4.5 0.1 0.01 2.5 3.6 41.9 0.1 761 10 24 45
6.10.1 Lucerne silage 3rd harvest extruded DE 2012 10.6 3.3 0.1 0.01 2.4 2.3 31.7 0.1 1496 9 22 55
6.10.1 Lucerne silage 3rd harvest chopped DE 2012 10.6 3.4 0.2 0.01 2.4 2.5 33.9 0.1 687 8 19 44
6.10.1 Clover-grass silage DE 2012 9.1 2.6 2.1 1.6 34.1 0.3 1031 7 30 75
6.10.4 Lucerne pellets UK 2012 13.1 3.7 7.6 0.57 53 3.0 2.6 16.7 0.6 1417 24 40 68 0.12
6.6.3 Grass, wilted and ensiled NL 2011 0.1 145 0.01
Table 9. Mineral content of new feed materials.
no Name g/kg DM mg/kg DM Ca P Mg S K Na Fe Cu Zn Mn Se
7.1.1 Algae Spirulina UK 2012 1.8 9.6 2.6 6.7 13.8 5.7 920 3.4 16.6 26.4 0.15
7.1.1 Algae Chlorella scenedesmus NL 2012 82.7 9.8 2.5 4.2 7.7 6.5 6166 7.9 68.7 906.4 0.12
9.16.2 Hermetia illucens larvae ´MBM´ dried, full fat CH 2012 37.1 6.7 2.7 2.9 6.9 0.8 98 9.3 67.2 128.0
9.16.2 Hermetia illucens meal ´MBM´ defatted CH 2012 52.9 8.9 3.6 4.0 7.7 0.9 172 13.7 95.7 171.7
9.16.2 Hermetia illucens larvae ´CHO´ dried, full fat CH 2012 6.3 5.6 2.3 3.0 7.1 1.3 74 9.5 78.4 162.6
9.16.2 Hermetia illucens meal ´CHO´ defatted CH 2012 10.1 8.2 3.5 4.6 8.6 1.5 119 14.7 125.9 242.0
9.16.2 Hermetia illucens larvae ´kitchen waste´ full fat CH 2012 24.0 4.8 2.3 2.7 6.5 1.0 156 8.4 69.5 195.4
9.16.2 Hermetia illucens meal ´kitchen waste´ defatted CH 2012 38.4 6.9 3.5 4.3 8.2 1.3 302 13.3 111.3 319.7
10.11.1 Mussel Mytilus edulis meal SE 2012 3.8 11.3 1.8 10.5 6.4 21.2 340 6.5 138.8 29.4 2.71

M
TT R
EP
OR
T 1
64
20
3.4 Energy and protein values of organic feed ingredients for pigs
3.4.1 The French feed evaluation system: Energy and protein values
Table 10. Energy values and standardised ileal digestible amino acids of organically produced cereals and protein feed ingredients (EvaPig®).
MJ/kg DM g/kg DM no Name DE
grow. pig
ME grow. pig
NE grow. pig
DE adult pig
ME adult pig
NE adult pig
SID Lys
SID Thr
SID Met
SID Cys
SID Val
Reference feed ingredient
1.1.1 Barley FI 2011 14.7 14.2 11.0 15.1 14.5 11.3 3.1 2.8 2.0 1.9 4.3 Barley
1.11.1 Wheat FI 2011 16.0 15.5 12.1 16.3 15.7 12.3 2.9 3.2 2.3 2.5 4.9 Wheat
1.4.1 Oats FI 2011 14.5 14.0 10.7 15.1 14.3 10.9 4.4 3.2 2.2 2.5 5.2 Oats
2.14.2 Rape seed meal UK 2012 14.9 13.7 8.6 15.8 14.2 9.1 14.3 12.3 7.0 6.1 14.7 Rapeseed meal
2.14.2 Rape seed expeller FI 2012 16.6 15.4 10.1 17.4 15.8 10.5 16.0 12.6 7.0 5.8 15.0 Rapeseed meal
2.18.8 Soya bean pulp FI 2011 16.7 15.5 10.6 18.6 17.0 11.7 18.6 11.3 5.0 3.7 14.3 Soyabean meal
2.8.1 Linseed UK 2012 17.9 16.4 10.8 18.3 16.6 11.1 10.7 10.4 6.0 4.1 14.6 Linseed meal, exp. extr.
3.11.1 Peas FI 2012 16.6 15.9 11.9 17.1 16.2 12.1 14.5 7.1 2.5 2.7 8.7 Pea
3.11.1 Peas UK 2012 15.9 15.3 11.3 16.5 15.8 11.7 10.9 5.5 2.0 1.7 6.5 Pea
3.13.1 Grass pea AT 2011 16.3 15.4 11.0 16.6 15.6 11.2 16.7 9.1 2.9 3.5 11.0 Faba bean, white flowers
3.15.1 Sainfoin AT 2011 13.9 13.1 9.1 14.7 13.8 9.5 14.5 9.0 4.7 3.1 10.7 Faba bean, white flowers
3.15.1 Sainfoin, dehulled AT 2011 18.4 17.2 11.8 18.7 17.3 11.9 19.1 11.6 6.15 3.9 13.8 Faba bean, white flowers
3.7.1 Faba beans UK 2012 15.9 15.1 10.8 16.3 15.4 10.9 15.7 8.0 2.2 2.0 10.4 Faba bean, white flowers
3.7.1 Faba beans FI 2011 16.5 15.5 11.0 16.8 15.7 11.1 17.4 9.3 2.4 2.7 12.0 Faba bean, white flowers
3.9.1 Sweet lupin UK 2012 16.2 15.0 9.3 17.6 16.0 10.2 14.1 9.7 2.1 3.1 11.2 Lupin, blue
4.8.1 Potato, raw FI 2011 15.7 15.4 11.9 15.9 15.5 12.0 3.5 2.1 1.5 0.7 3.7 Potato tuber, dehydrated
M
TT R
EP
OR
T 1
64
21
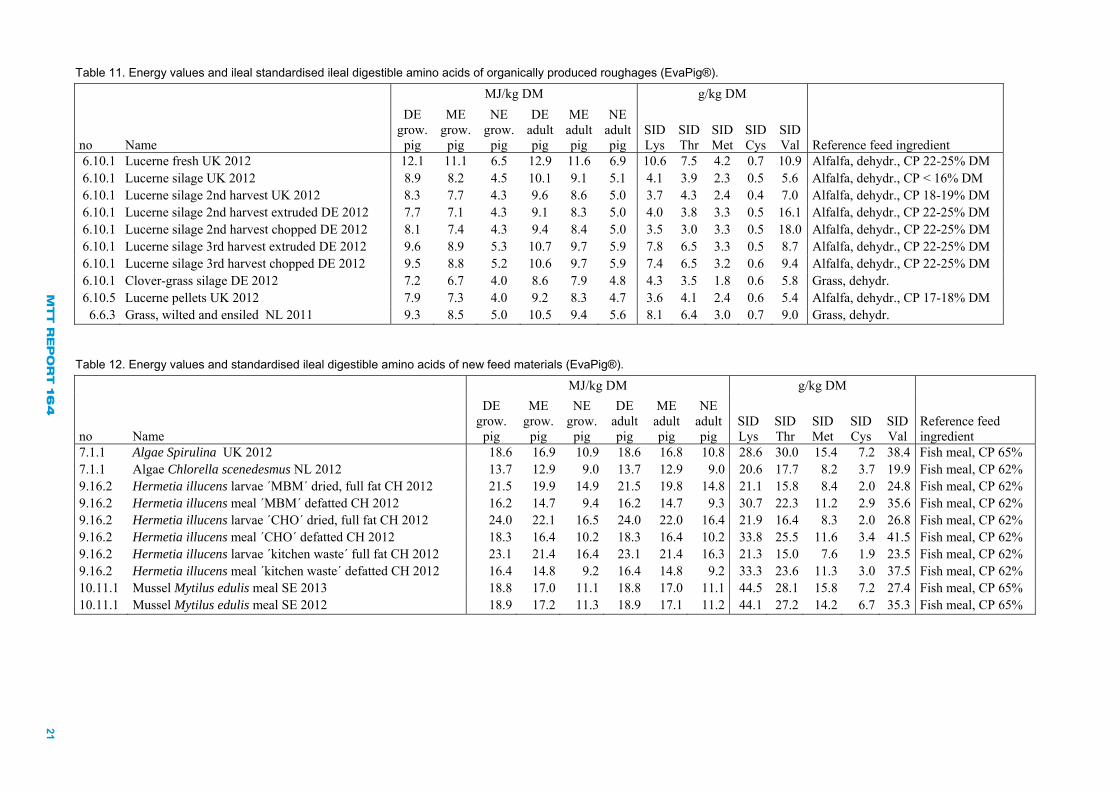
Table 11. Energy values and ileal standardised ileal digestible amino acids of organically produced roughages (EvaPig®). MJ/kg DM g/kg DM
no Name
DE grow.
pig
ME grow.
pig
NE grow.
pig
DE adult pig
ME adult pig
NE adult pig
SID Lys
SID Thr
SID Met
SID Cys
SID Val Reference feed ingredient
6.10.1 Lucerne fresh UK 2012 12.1 11.1 6.5 12.9 11.6 6.9 10.6 7.5 4.2 0.7 10.9 Alfalfa, dehydr., CP 22-25% DM 6.10.1 Lucerne silage UK 2012 8.9 8.2 4.5 10.1 9.1 5.1 4.1 3.9 2.3 0.5 5.6 Alfalfa, dehydr., CP < 16% DM 6.10.1 Lucerne silage 2nd harvest UK 2012 8.3 7.7 4.3 9.6 8.6 5.0 3.7 4.3 2.4 0.4 7.0 Alfalfa, dehydr., CP 18-19% DM 6.10.1 Lucerne silage 2nd harvest extruded DE 2012 7.7 7.1 4.3 9.1 8.3 5.0 4.0 3.8 3.3 0.5 16.1 Alfalfa, dehydr., CP 22-25% DM 6.10.1 Lucerne silage 2nd harvest chopped DE 2012 8.1 7.4 4.3 9.4 8.4 5.0 3.5 3.0 3.3 0.5 18.0 Alfalfa, dehydr., CP 22-25% DM 6.10.1 Lucerne silage 3rd harvest extruded DE 2012 9.6 8.9 5.3 10.7 9.7 5.9 7.8 6.5 3.3 0.5 8.7 Alfalfa, dehydr., CP 22-25% DM 6.10.1 Lucerne silage 3rd harvest chopped DE 2012 9.5 8.8 5.2 10.6 9.7 5.9 7.4 6.5 3.2 0.6 9.4 Alfalfa, dehydr., CP 22-25% DM 6.10.1 Clover-grass silage DE 2012 7.2 6.7 4.0 8.6 7.9 4.8 4.3 3.5 1.8 0.6 5.8 Grass, dehydr. 6.10.5 Lucerne pellets UK 2012 7.9 7.3 4.0 9.2 8.3 4.7 3.6 4.1 2.4 0.6 5.4 Alfalfa, dehydr., CP 17-18% DM
6.6.3 Grass, wilted and ensiled NL 2011 9.3 8.5 5.0 10.5 9.4 5.6 8.1 6.4 3.0 0.7 9.0 Grass, dehydr.
Table 12. Energy values and standardised ileal digestible amino acids of new feed materials (EvaPig®).
MJ/kg DM g/kg DM
no Name
DE grow.
pig
ME grow.
pig
NE grow.
pig
DE adult pig
ME adult pig
NE adult pig
SID Lys
SID Thr
SID Met
SID Cys
SID Val
Reference feed ingredient
7.1.1 Algae Spirulina UK 2012 18.6 16.9 10.9 18.6 16.8 10.8 28.6 30.0 15.4 7.2 38.4 Fish meal, CP 65% 7.1.1 Algae Chlorella scenedesmus NL 2012 13.7 12.9 9.0 13.7 12.9 9.0 20.6 17.7 8.2 3.7 19.9 Fish meal, CP 62% 9.16.2 Hermetia illucens larvae ´MBM´ dried, full fat CH 2012 21.5 19.9 14.9 21.5 19.8 14.8 21.1 15.8 8.4 2.0 24.8 Fish meal, CP 62% 9.16.2 Hermetia illucens meal ´MBM´ defatted CH 2012 16.2 14.7 9.4 16.2 14.7 9.3 30.7 22.3 11.2 2.9 35.6 Fish meal, CP 62% 9.16.2 Hermetia illucens larvae ´CHO´ dried, full fat CH 2012 24.0 22.1 16.5 24.0 22.0 16.4 21.9 16.4 8.3 2.0 26.8 Fish meal, CP 62% 9.16.2 Hermetia illucens meal ´CHO´ defatted CH 2012 18.3 16.4 10.2 18.3 16.4 10.2 33.8 25.5 11.6 3.4 41.5 Fish meal, CP 62% 9.16.2 Hermetia illucens larvae ´kitchen waste´ full fat CH 2012 23.1 21.4 16.4 23.1 21.4 16.3 21.3 15.0 7.6 1.9 23.5 Fish meal, CP 62% 9.16.2 Hermetia illucens meal ´kitchen waste´ defatted CH 2012 16.4 14.8 9.2 16.4 14.8 9.2 33.3 23.6 11.3 3.0 37.5 Fish meal, CP 62% 10.11.1 Mussel Mytilus edulis meal SE 2013 18.8 17.0 11.1 18.8 17.0 11.1 44.5 28.1 15.8 7.2 27.4 Fish meal, CP 65% 10.11.1 Mussel Mytilus edulis meal SE 2012 18.9 17.2 11.3 18.9 17.1 11.2 44.1 27.2 14.2 6.7 35.3 Fish meal, CP 65%
M
TT R
EP
OR
T 1
64
22
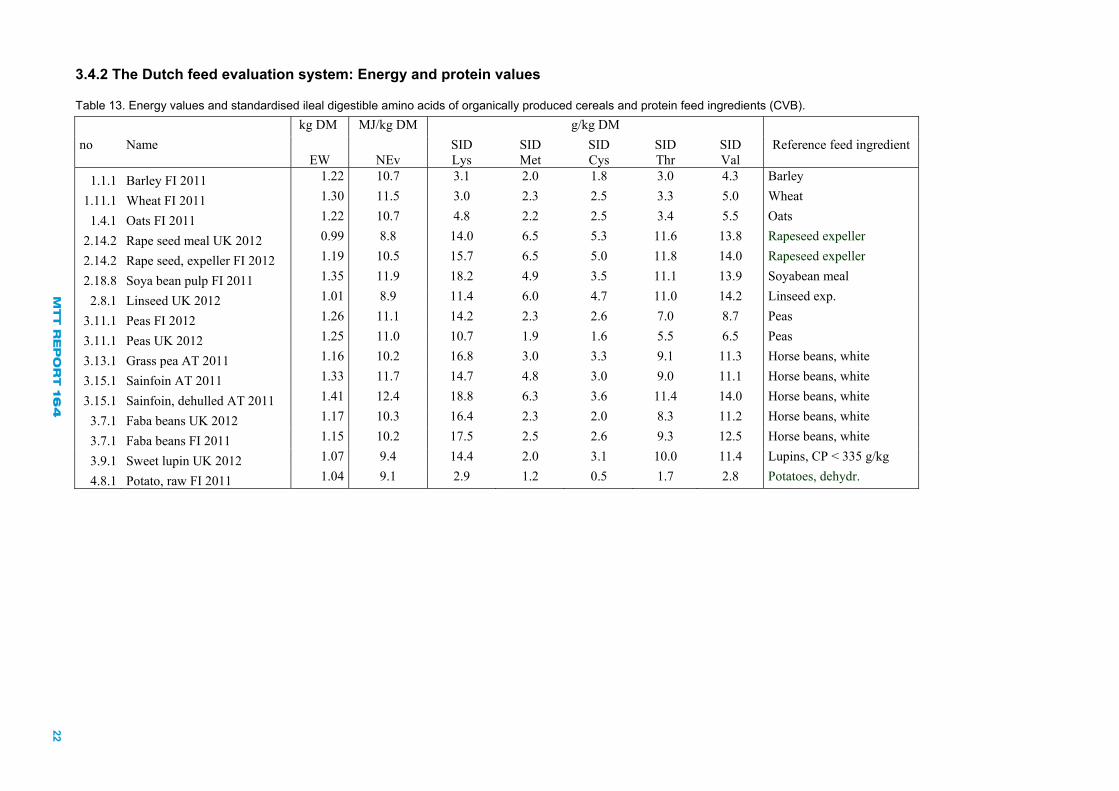
3.4.2 The Dutch feed evaluation system: Energy and protein values
Table 13. Energy values and standardised ileal digestible amino acids of organically produced cereals and protein feed ingredients (CVB). kg DM MJ/kg DM g/kg DM
no Name EW NEv
SID Lys
SID Met
SID Cys
SID Thr
SID Val
Reference feed ingredient
1.1.1 Barley FI 2011 1.22 10.7 3.1 2.0 1.8 3.0 4.3 Barley
1.11.1 Wheat FI 2011 1.30 11.5 3.0 2.3 2.5 3.3 5.0 Wheat
1.4.1 Oats FI 2011 1.22 10.7 4.8 2.2 2.5 3.4 5.5 Oats
2.14.2 Rape seed meal UK 2012 0.99 8.8 14.0 6.5 5.3 11.6 13.8 Rapeseed expeller
2.14.2 Rape seed, expeller FI 2012 1.19 10.5 15.7 6.5 5.0 11.8 14.0 Rapeseed expeller
2.18.8 Soya bean pulp FI 2011 1.35 11.9 18.2 4.9 3.5 11.1 13.9 Soyabean meal
2.8.1 Linseed UK 2012 1.01 8.9 11.4 6.0 4.7 11.0 14.2 Linseed exp.
3.11.1 Peas FI 2012 1.26 11.1 14.2 2.3 2.6 7.0 8.7 Peas
3.11.1 Peas UK 2012 1.25 11.0 10.7 1.9 1.6 5.5 6.5 Peas
3.13.1 Grass pea AT 2011 1.16 10.2 16.8 3.0 3.3 9.1 11.3 Horse beans, white
3.15.1 Sainfoin AT 2011 1.33 11.7 14.7 4.8 3.0 9.0 11.1 Horse beans, white
3.15.1 Sainfoin, dehulled AT 2011 1.41 12.4 18.8 6.3 3.6 11.4 14.0 Horse beans, white
3.7.1 Faba beans UK 2012 1.17 10.3 16.4 2.3 2.0 8.3 11.2 Horse beans, white
3.7.1 Faba beans FI 2011 1.15 10.2 17.5 2.5 2.6 9.3 12.5 Horse beans, white
3.9.1 Sweet lupin UK 2012 1.07 9.4 14.4 2.0 3.1 10.0 11.4 Lupins, CP < 335 g/kg
4.8.1 Potato, raw FI 2011 1.04 9.1 2.9 1.2 0.5 1.7 2.8 Potatoes, dehydr.
M
TT R
EP
OR
T 1
64
23
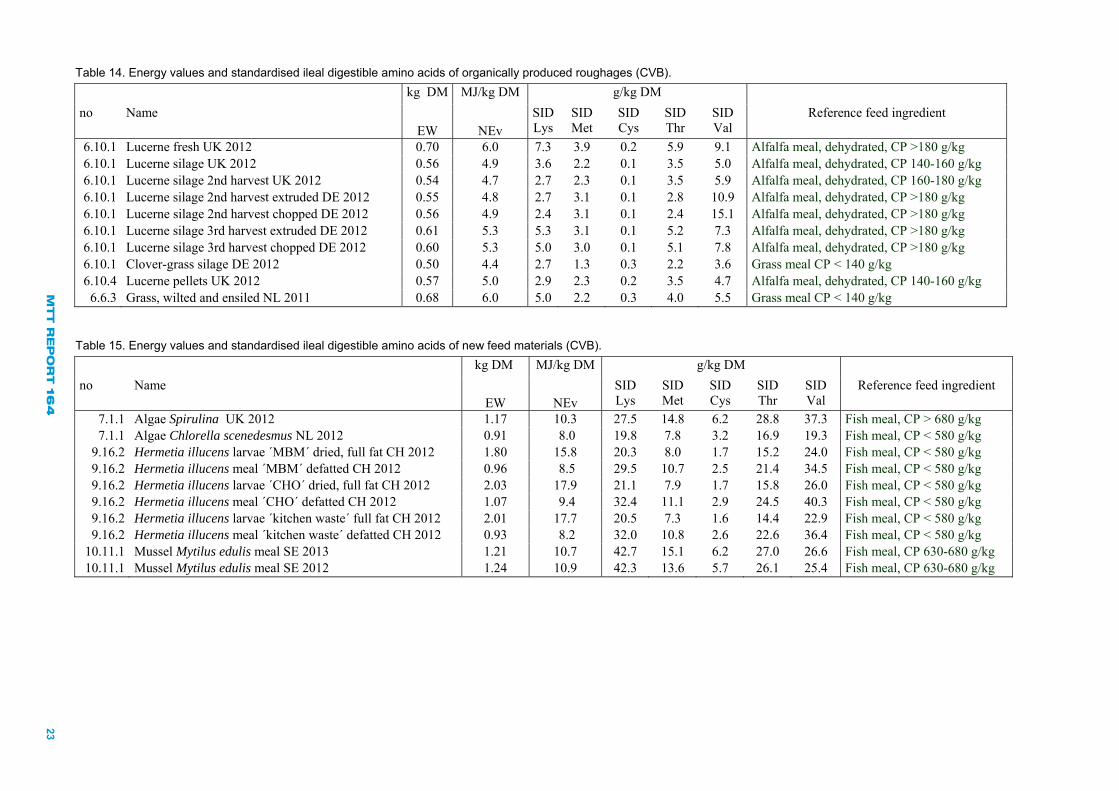
Table 14. Energy values and standardised ileal digestible amino acids of organically produced roughages (CVB). kg DM MJ/kg DM g/kg DM
no Name EW NEv
SID Lys
SID Met
SID Cys
SID Thr
SID Val
Reference feed ingredient
6.10.1 Lucerne fresh UK 2012 0.70 6.0 7.3 3.9 0.2 5.9 9.1 Alfalfa meal, dehydrated, CP >180 g/kg 6.10.1 Lucerne silage UK 2012 0.56 4.9 3.6 2.2 0.1 3.5 5.0 Alfalfa meal, dehydrated, CP 140-160 g/kg 6.10.1 Lucerne silage 2nd harvest UK 2012 0.54 4.7 2.7 2.3 0.1 3.5 5.9 Alfalfa meal, dehydrated, CP 160-180 g/kg 6.10.1 Lucerne silage 2nd harvest extruded DE 2012 0.55 4.8 2.7 3.1 0.1 2.8 10.9 Alfalfa meal, dehydrated, CP >180 g/kg 6.10.1 Lucerne silage 2nd harvest chopped DE 2012 0.56 4.9 2.4 3.1 0.1 2.4 15.1 Alfalfa meal, dehydrated, CP >180 g/kg 6.10.1 Lucerne silage 3rd harvest extruded DE 2012 0.61 5.3 5.3 3.1 0.1 5.2 7.3 Alfalfa meal, dehydrated, CP >180 g/kg 6.10.1 Lucerne silage 3rd harvest chopped DE 2012 0.60 5.3 5.0 3.0 0.1 5.1 7.8 Alfalfa meal, dehydrated, CP >180 g/kg 6.10.1 Clover-grass silage DE 2012 0.50 4.4 2.7 1.3 0.3 2.2 3.6 Grass meal CP < 140 g/kg 6.10.4 Lucerne pellets UK 2012 0.57 5.0 2.9 2.3 0.2 3.5 4.7 Alfalfa meal, dehydrated, CP 140-160 g/kg
6.6.3 Grass, wilted and ensiled NL 2011 0.68 6.0 5.0 2.2 0.3 4.0 5.5 Grass meal CP < 140 g/kg
Table 15. Energy values and standardised ileal digestible amino acids of new feed materials (CVB). kg DM MJ/kg DM g/kg DM
no Name EW NEv
SID Lys
SID Met
SID Cys
SID Thr
SID Val
Reference feed ingredient
7.1.1 Algae Spirulina UK 2012 1.17 10.3 27.5 14.8 6.2 28.8 37.3 Fish meal, CP > 680 g/kg 7.1.1 Algae Chlorella scenedesmus NL 2012 0.91 8.0 19.8 7.8 3.2 16.9 19.3 Fish meal, CP < 580 g/kg
9.16.2 Hermetia illucens larvae ´MBM´ dried, full fat CH 2012 1.80 15.8 20.3 8.0 1.7 15.2 24.0 Fish meal, CP < 580 g/kg 9.16.2 Hermetia illucens meal ´MBM´ defatted CH 2012 0.96 8.5 29.5 10.7 2.5 21.4 34.5 Fish meal, CP < 580 g/kg 9.16.2 Hermetia illucens larvae ´CHO´ dried, full fat CH 2012 2.03 17.9 21.1 7.9 1.7 15.8 26.0 Fish meal, CP < 580 g/kg 9.16.2 Hermetia illucens meal ´CHO´ defatted CH 2012 1.07 9.4 32.4 11.1 2.9 24.5 40.3 Fish meal, CP < 580 g/kg 9.16.2 Hermetia illucens larvae ´kitchen waste´ full fat CH 2012 2.01 17.7 20.5 7.3 1.6 14.4 22.9 Fish meal, CP < 580 g/kg 9.16.2 Hermetia illucens meal ´kitchen waste´ defatted CH 2012 0.93 8.2 32.0 10.8 2.6 22.6 36.4 Fish meal, CP < 580 g/kg
10.11.1 Mussel Mytilus edulis meal SE 2013 1.21 10.7 42.7 15.1 6.2 27.0 26.6 Fish meal, CP 630-680 g/kg 10.11.1 Mussel Mytilus edulis meal SE 2012 1.24 10.9 42.3 13.6 5.7 26.1 25.4 Fish meal, CP 630-680 g/kg
M
TT R
EP
OR
T 1
64
24
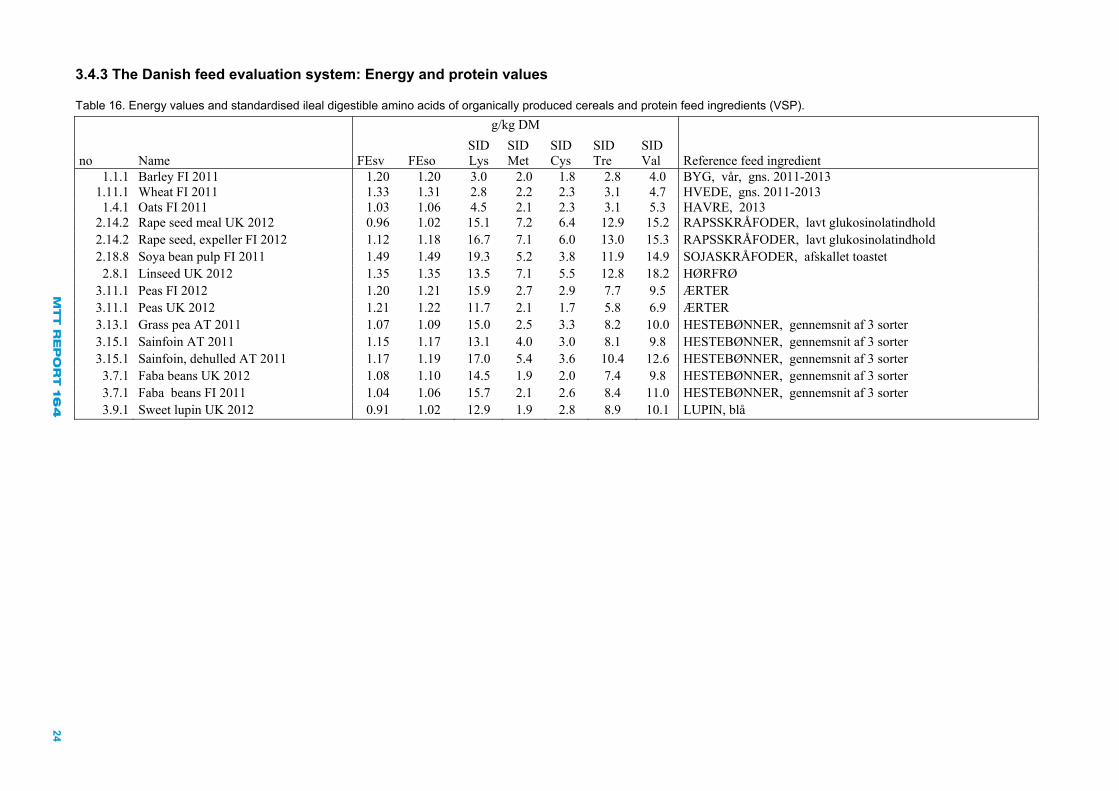
3.4.3 The Danish feed evaluation system: Energy and protein values
Table 16. Energy values and standardised ileal digestible amino acids of organically produced cereals and protein feed ingredients (VSP). g/kg DM
no Name FEsv FEso SID Lys
SID Met
SID Cys
SID Tre
SID Val Reference feed ingredient
1.1.1 Barley FI 2011 1.20 1.20 3.0 2.0 1.8 2.8 4.0 BYG, vår, gns. 2011-2013 1.11.1 Wheat FI 2011 1.33 1.31 2.8 2.2 2.3 3.1 4.7 HVEDE, gns. 2011-2013
1.4.1 Oats FI 2011 1.03 1.06 4.5 2.1 2.3 3.1 5.3 HAVRE, 2013 2.14.2 Rape seed meal UK 2012 0.96 1.02 15.1 7.2 6.4 12.9 15.2 RAPSSKRÅFODER, lavt glukosinolatindhold 2.14.2 Rape seed, expeller FI 2012 1.12 1.18 16.7 7.1 6.0 13.0 15.3 RAPSSKRÅFODER, lavt glukosinolatindhold 2.18.8 Soya bean pulp FI 2011 1.49 1.49 19.3 5.2 3.8 11.9 14.9 SOJASKRÅFODER, afskallet toastet
2.8.1 Linseed UK 2012 1.35 1.35 13.5 7.1 5.5 12.8 18.2 HØRFRØ 3.11.1 Peas FI 2012 1.20 1.21 15.9 2.7 2.9 7.7 9.5 ÆRTER 3.11.1 Peas UK 2012 1.21 1.22 11.7 2.1 1.7 5.8 6.9 ÆRTER 3.13.1 Grass pea AT 2011 1.07 1.09 15.0 2.5 3.3 8.2 10.0 HESTEBØNNER, gennemsnit af 3 sorter 3.15.1 Sainfoin AT 2011 1.15 1.17 13.1 4.0 3.0 8.1 9.8 HESTEBØNNER, gennemsnit af 3 sorter 3.15.1 Sainfoin, dehulled AT 2011 1.17 1.19 17.0 5.4 3.6 10.4 12.6 HESTEBØNNER, gennemsnit af 3 sorter
3.7.1 Faba beans UK 2012 1.08 1.10 14.5 1.9 2.0 7.4 9.8 HESTEBØNNER, gennemsnit af 3 sorter 3.7.1 Faba beans FI 2011 1.04 1.06 15.7 2.1 2.6 8.4 11.0 HESTEBØNNER, gennemsnit af 3 sorter 3.9.1 Sweet lupin UK 2012 0.91 1.02 12.9 1.9 2.8 8.9 10.1 LUPIN, blå
M
TT R
EP
OR
T 1
64
25
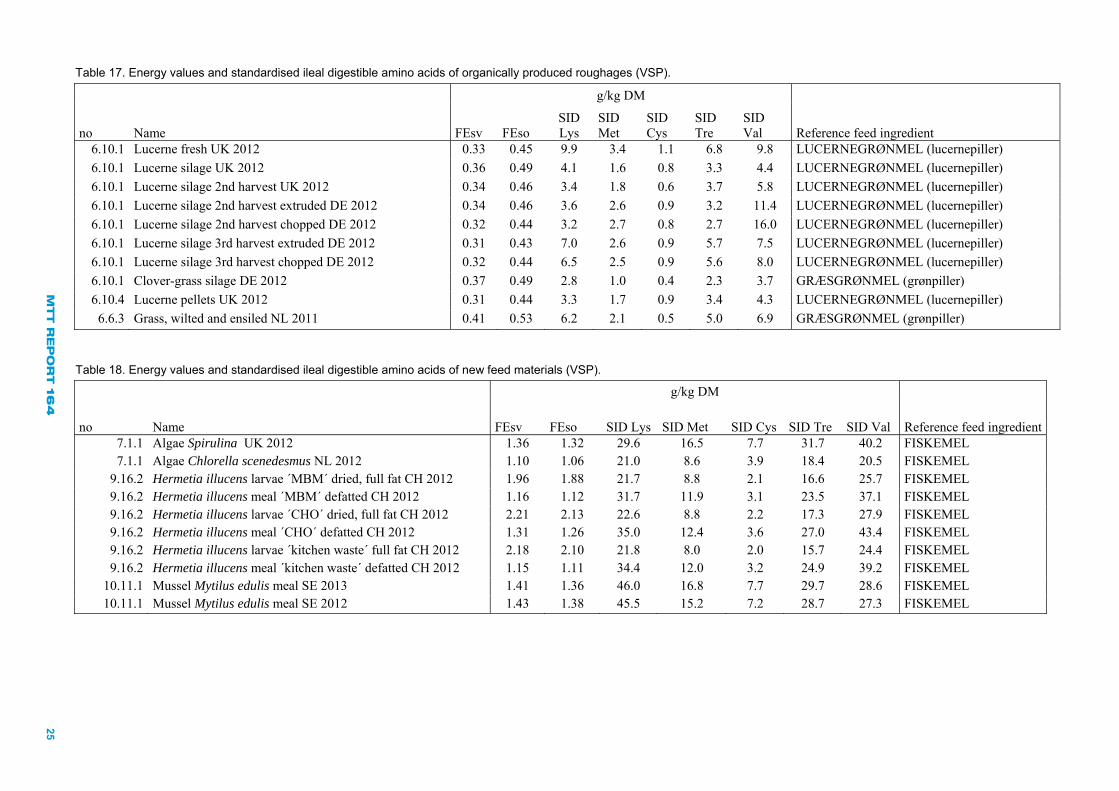
Table 17. Energy values and standardised ileal digestible amino acids of organically produced roughages (VSP).
g/kg DM
no Name FEsv FEso SID Lys
SID Met
SID Cys
SID Tre
SID Val Reference feed ingredient
6.10.1 Lucerne fresh UK 2012 0.33 0.45 9.9 3.4 1.1 6.8 9.8 LUCERNEGRØNMEL (lucernepiller)
6.10.1 Lucerne silage UK 2012 0.36 0.49 4.1 1.6 0.8 3.3 4.4 LUCERNEGRØNMEL (lucernepiller)
6.10.1 Lucerne silage 2nd harvest UK 2012 0.34 0.46 3.4 1.8 0.6 3.7 5.8 LUCERNEGRØNMEL (lucernepiller)
6.10.1 Lucerne silage 2nd harvest extruded DE 2012 0.34 0.46 3.6 2.6 0.9 3.2 11.4 LUCERNEGRØNMEL (lucernepiller)
6.10.1 Lucerne silage 2nd harvest chopped DE 2012 0.32 0.44 3.2 2.7 0.8 2.7 16.0 LUCERNEGRØNMEL (lucernepiller)
6.10.1 Lucerne silage 3rd harvest extruded DE 2012 0.31 0.43 7.0 2.6 0.9 5.7 7.5 LUCERNEGRØNMEL (lucernepiller)
6.10.1 Lucerne silage 3rd harvest chopped DE 2012 0.32 0.44 6.5 2.5 0.9 5.6 8.0 LUCERNEGRØNMEL (lucernepiller)
6.10.1 Clover-grass silage DE 2012 0.37 0.49 2.8 1.0 0.4 2.3 3.7 GRÆSGRØNMEL (grønpiller)
6.10.4 Lucerne pellets UK 2012 0.31 0.44 3.3 1.7 0.9 3.4 4.3 LUCERNEGRØNMEL (lucernepiller)
6.6.3 Grass, wilted and ensiled NL 2011 0.41 0.53 6.2 2.1 0.5 5.0 6.9 GRÆSGRØNMEL (grønpiller)
Table 18. Energy values and standardised ileal digestible amino acids of new feed materials (VSP). g/kg DM
no Name FEsv FEso SID Lys SID Met SID Cys SID Tre SID Val Reference feed ingredient 7.1.1 Algae Spirulina UK 2012 1.36 1.32 29.6 16.5 7.7 31.7 40.2 FISKEMEL 7.1.1 Algae Chlorella scenedesmus NL 2012 1.10 1.06 21.0 8.6 3.9 18.4 20.5 FISKEMEL
9.16.2 Hermetia illucens larvae ´MBM´ dried, full fat CH 2012 1.96 1.88 21.7 8.8 2.1 16.6 25.7 FISKEMEL 9.16.2 Hermetia illucens meal ´MBM´ defatted CH 2012 1.16 1.12 31.7 11.9 3.1 23.5 37.1 FISKEMEL 9.16.2 Hermetia illucens larvae ´CHO´ dried, full fat CH 2012 2.21 2.13 22.6 8.8 2.2 17.3 27.9 FISKEMEL 9.16.2 Hermetia illucens meal ´CHO´ defatted CH 2012 1.31 1.26 35.0 12.4 3.6 27.0 43.4 FISKEMEL 9.16.2 Hermetia illucens larvae ´kitchen waste´ full fat CH 2012 2.18 2.10 21.8 8.0 2.0 15.7 24.4 FISKEMEL 9.16.2 Hermetia illucens meal ´kitchen waste´ defatted CH 2012 1.15 1.11 34.4 12.0 3.2 24.9 39.2 FISKEMEL
10.11.1 Mussel Mytilus edulis meal SE 2013 1.41 1.36 46.0 16.8 7.7 29.7 28.6 FISKEMEL 10.11.1 Mussel Mytilus edulis meal SE 2012 1.43 1.38 45.5 15.2 7.2 28.7 27.3 FISKEMEL
M
TT R
EP
OR
T 1
64
26
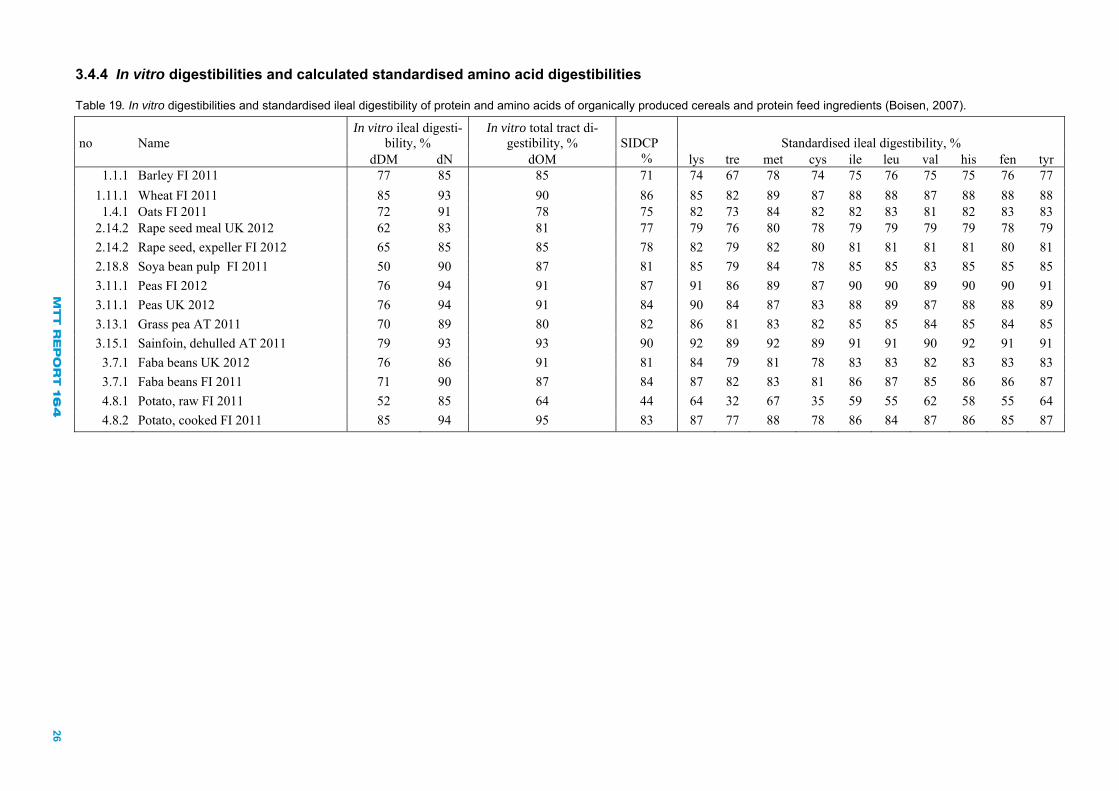
3.4.4 In vitro digestibilities and calculated standardised amino acid digestibilities
Table 19. In vitro digestibilities and standardised ileal digestibility of protein and amino acids of organically produced cereals and protein feed ingredients (Boisen, 2007).
no Name In vitro ileal digesti-
bility, % In vitro total tract di-
gestibility, % SIDCP Standardised ileal digestibility, % dDM dN dOM % lys tre met cys ile leu val his fen tyr
1.1.1 Barley FI 2011 77 85 85 71 74 67 78 74 75 76 75 75 76 77
1.11.1 Wheat FI 2011 85 93 90 86 85 82 89 87 88 88 87 88 88 88 1.4.1 Oats FI 2011 72 91 78 75 82 73 84 82 82 83 81 82 83 83
2.14.2 Rape seed meal UK 2012 62 83 81 77 79 76 80 78 79 79 79 79 78 79
2.14.2 Rape seed, expeller FI 2012 65 85 85 78 82 79 82 80 81 81 81 81 80 81
2.18.8 Soya bean pulp FI 2011 50 90 87 81 85 79 84 78 85 85 83 85 85 85
3.11.1 Peas FI 2012 76 94 91 87 91 86 89 87 90 90 89 90 90 91
3.11.1 Peas UK 2012 76 94 91 84 90 84 87 83 88 89 87 88 88 89
3.13.1 Grass pea AT 2011 70 89 80 82 86 81 83 82 85 85 84 85 84 85
3.15.1 Sainfoin, dehulled AT 2011 79 93 93 90 92 89 92 89 91 91 90 92 91 91
3.7.1 Faba beans UK 2012 76 86 91 81 84 79 81 78 83 83 82 83 83 83
3.7.1 Faba beans FI 2011 71 90 87 84 87 82 83 81 86 87 85 86 86 87
4.8.1 Potato, raw FI 2011 52 85 64 44 64 32 67 35 59 55 62 58 55 64
4.8.2 Potato, cooked FI 2011 85 94 95 83 87 77 88 78 86 84 87 86 85 87

M
TT R
EP
OR
T 1
64
27
Table 20. In vitro digestibilities and standardised ileal digestibility of protein and amino acids of organically produced roughages (Boisen, 2007).
no Name In vitro ileal
digestibility; %In vitro total tract digestibility, %
SIDCP Standardised ileal digestibility, %
dDM dN dOM % lys tre met cys ile leu val his fen tyr
6.10.1 Lucerne fresh UK 2012 60 86 83 77 81 75 81 63 81 81 80 80 81 81
6.10.1 Lucerne silage UK 2012 41 81 58 57 66 54 69 42 67 68 65 62 65 68
6.10.1 Lucerne silage 2nd harvest UK 2012 39 83 60 63 63 55 70 25 70 71 69 67 68 74
6.10.1 Lucerne silage 2nd harvest extruded DE 2012 40 83 62 67 63 49 74 39 74 74 75 59 71 67
6.10.1 Lucerne silage 2nd harvest chopped DE 2012 40 84 60 69 61 44 75 33 75 75 74 57 72 64
6.10.1 Lucerne silage 3rd harvest DE 2012 51 84 75 71 76 70 76 57 76 77 75 73 75 74
6.10.1 Lucerne silage 3rd harvest extruded DE 2012 43 81 69 65 72 64 73 39 72 72 71 68 68 71
6.10.1 Lucerne silage 3rd harvest chopped DE 2012 47 83 68 68 74 67 75 46 74 75 74 71 73 69
6.10.1 Extruded silage DE 2013 44 85 64 73 61 65 76 43 75 75 79 59 73 63
6.10.1 Chopped silage DE 2013 45 86 66 74 76 69 77 50 77 77 76 72 75 75
6.10.1 Clover-grass silage DE 2012 41 85 57 57 65 48 67 68 69 67 44 64 67
6.10.4 Lucerne pellets UK 2012 38 82 53 58 63 53 69 44 67 67 65 63 65 65
6.6.3 Grass, wilted and ensiled NL 2011 48 87 70 71 77 69 77 26 77 78 77 72 76 78

M
TT R
EP
OR
T 1
64
28
Table 21. In vitro digestibilities and standardised ileal digestibility of protein and amino acids of new feed materials (Boisen, 2007). no Name In vitro ileal
digestibility, %In vitro total tract digestibility, %
SIDCP Standardised ileal digestibility, %
dDM dN dOM % lys tre met cys ile leu val his fen tyr
7.1.1 Algae Spirulina UK 2012 77 77 78 75 76 75 76 74 76 76 76 75 76 76
7.1.1 Algae Chlorella scenedesmus NL 2012 58 60 62 53 57 54 57 50 55 56 56 52 55 56
9.16.2 Hermetia illucens larvae ´MBM´ dried, full fat CH 2012 85 78 85 76 77 75 77 71 77 77 77 77 76 77
9.16.2 Hermetia illucens meal ´MBM´ defatted CH 2012 79 78 77 76 77 75 77 71 77 77 77 77 76 77
9.16.2 Hermetia illucens larvae ´CHO´ dried, full fat CH 2012 83 77 83 75 76 74 76 69 76 76 76 76 75 76
9.16.2 Hermetia illucens meal ´CHO´ defatted CH 2012 72 75 74 72 73 72 74 67 74 74 74 74 73 74
9.16.2 Hermetia illucens larvae ´kitchen waste´ full fat CH 2012 87 82 87 80 81 80 81 76 81 81 81 81 80 81
9.16.2 Hermetia illucens meal ´kitchen waste´ defatted CH 2012 78 81 77 79 80 79 79 74 80 80 80 80 79 80
10.11.1 Mussel Mytilus edulis meal SE 2012 89 90 91 89 90 89 90 89 89 89 89 89 89 89

M
TT R
EP
OR
T 1
64
29
3.4.5 The British feed evaluation system: Energy values
Table 22. Energy values of organically produced cereals, protein feed ingredients and roughages (The British Society of Animal Science).
no Name ED DE NE Reference feed ingredient % MJ/kg DM (Sauvant 2004)
1.1.1 Barley FI 2011 81 14.8 11.2 Barley 1.11.1 Wheat FI 2011 88 16.3 12.3 Wheat, soft 1.4.1 Oats FI 2011 64 12.4 9.4 Oats
2.14.2 Rape seed meal UK 2012 68 14.6 8.9 Rapeseed meal 2.14.2 Rape seed, expeller FI 2012 68 15.3 10.1 Rapeseed meal 2.18.8 Soya bean pulp FI 2011 85 19.2 12.5 Soybean meal
2.8.1 Linseed UK 2012 73 15.8 10.1 Linseed, ful fat 3.11.1 Peas FI 2012 88 16.2 11.6 Pea 3.11.1 Peas UK 2012 88 16.0 11.4 Pea 3.13.1 Grass pea AT 2011 86 16.2 11.0 Faba bean, white flowers 3.15.1 Sainfoin AT 2011 86 17.3 10.8 Faba bean, white flowers 3.15.1 Sainfoin, dehulled AT 2011 86 17.8 11.4 Faba bean, white flowers
3.7.1 Faba beans UK 2012 86 16.3 10.9 Faba bean, white flowers 3.7.1 Faba beans FI 2011 86 16.2 10.7 Faba bean, white flowers 3.9.1 Sweet lupin UK 2012 77 15.7 9.4 Lupin, blue
6.10.1 Lucerne fresh UK 2012 51 9.5 5.3 Alfalfa, dehydr., CP 22-25 % dry matter 6.10.1 Lucerne silage UK 2012 40 7.4 3.8 Alfalfa, dehydr., CP <16 % dry matter 6.10.1 Lucerne silage 2nd harvest UK 2012 44 8.1 4.0 Alfalfa, dehydr., CP 18-19 % dry matter 6.10.1 Lucerne silage 2nd harvest extruded DE 2012 51 9.5 4.8 Alfalfa, dehydr., CP 22-25 % dry matter 6.10.1 Lucerne silage 2nd harvest chopped DE 2012 51 9.4 4.7 Alfalfa, dehydr., CP 22-25 % dry matter 6.10.1 Lucerne silage 3rd harvest extruded DE 2012 51 9.1 4.9 Alfalfa, dehydr., CP 22-25 % dry matter 6.10.1 Lucerne silage 3rd harvest chopped DE 2012 51 9.3 5.0 Alfalfa, dehydr., CP 22-25 % dry matter 6.10.1 Clover-grass silage DE 2012 38 6.8 3.3 Grass, dehydrated 6.10.4 Lucerne pellets UK 2012 40 7.2 3.4 Alfalfa, dehydr., CP <16 % dry matter
6.6.3 Grass, wilted and ensiled NL 2011 38 7.1 3.6 Grass, dehydrated

M
TT R
EP
OR
T 1
64
30
Table 23. Energy values of new feed materials (The British Society of Animal Science).
no Name ED DE NE Reference feed ingredient
% MJ/kg DM (Sauvant 2004) 7.1.1 Algae Spirulina UK 2012 85 18.6 10.8 Fish meal, protein 65 % 7.1.1 Algae Chlorella scenedesmus NL 2012 85 13.7 8.5 Fish meal, protein 65 %
9.16.2 Hermetia illucens larvae ´MBM´ dried, full fat CH 2012 85 21.5 15.5 Fish meal, protein 65 % 9.16.2 Hermetia illucens meal ´MBM´ defatted CH 2012 85 16.2 9.1 Fish meal, protein 65 % 9.16.2 Hermetia illucens larvae ´CHO´ dried, full fat CH 2012 85 24.0 17.5 Fish meal, protein 65 % 9.16.2 Hermetia illucens meal ´CHO´ defatted CH 2012 85 18.3 10.2 Fish meal, protein 65 % 9.16.2 Hermetia illucens larvae ´kitchen waste´ full fat CH 2012 85 23.1 17.3 Fish meal, protein 65 % 9.16.2 Hermetia illucens meal ´kitchen waste´ defatted CH 2012 85 16.4 8.9 Fish meal, protein 65 %
10.11.1 Mussel Mytilus edulis meal SE 2013 85 18.8 11.1 Fish meal, protein 65 % 10.11.1 Mussel Mytilus edulis meal SE 2012 85 18.9 11.3 Fish meal, protein 65 %
MTT REPORT 164 31
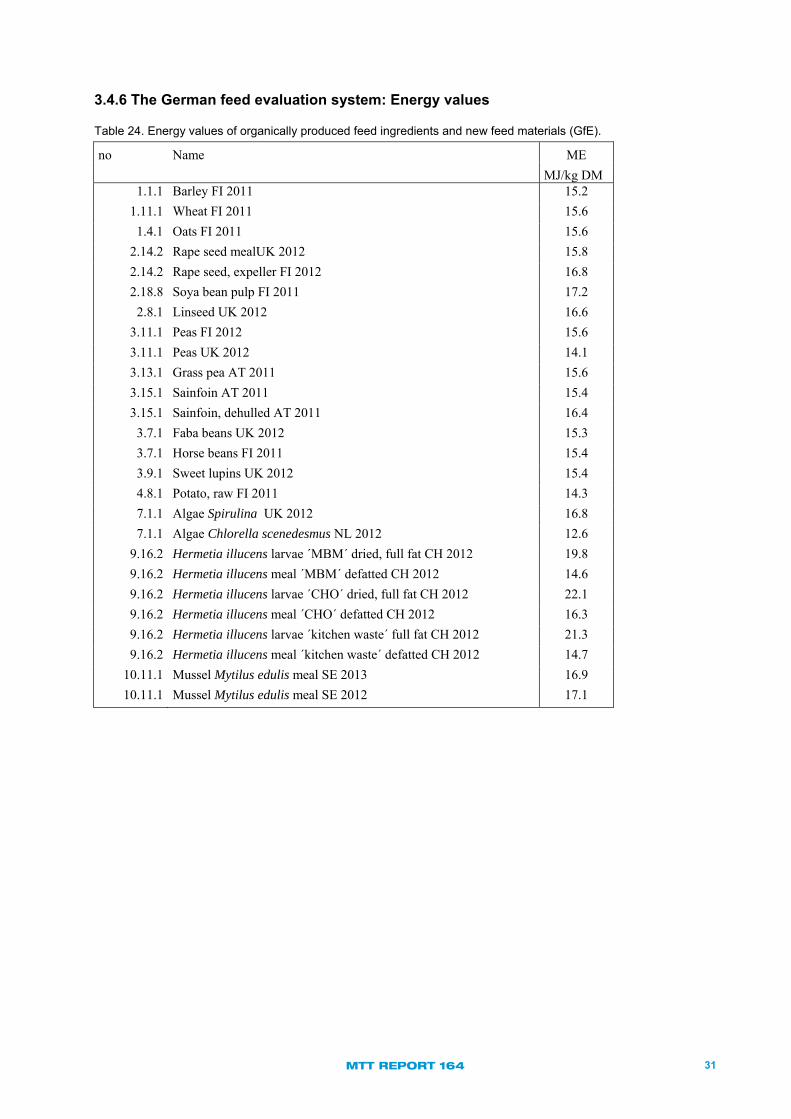
3.4.6 The German feed evaluation system: Energy values
Table 24. Energy values of organically produced feed ingredients and new feed materials (GfE).
no Name ME
MJ/kg DM 1.1.1 Barley FI 2011 15.2
1.11.1 Wheat FI 2011 15.6
1.4.1 Oats FI 2011 15.6
2.14.2 Rape seed mealUK 2012 15.8
2.14.2 Rape seed, expeller FI 2012 16.8
2.18.8 Soya bean pulp FI 2011 17.2
2.8.1 Linseed UK 2012 16.6
3.11.1 Peas FI 2012 15.6
3.11.1 Peas UK 2012 14.1
3.13.1 Grass pea AT 2011 15.6
3.15.1 Sainfoin AT 2011 15.4
3.15.1 Sainfoin, dehulled AT 2011 16.4
3.7.1 Faba beans UK 2012 15.3
3.7.1 Horse beans FI 2011 15.4
3.9.1 Sweet lupins UK 2012 15.4
4.8.1 Potato, raw FI 2011 14.3
7.1.1 Algae Spirulina UK 2012 16.8
7.1.1 Algae Chlorella scenedesmus NL 2012 12.6
9.16.2 Hermetia illucens larvae ´MBM´ dried, full fat CH 2012 19.8
9.16.2 Hermetia illucens meal ´MBM´ defatted CH 2012 14.6
9.16.2 Hermetia illucens larvae ´CHO´ dried, full fat CH 2012 22.1
9.16.2 Hermetia illucens meal ´CHO´ defatted CH 2012 16.3
9.16.2 Hermetia illucens larvae ´kitchen waste´ full fat CH 2012 21.3
9.16.2 Hermetia illucens meal ´kitchen waste´ defatted CH 2012 14.7
10.11.1 Mussel Mytilus edulis meal SE 2013 16.9
10.11.1 Mussel Mytilus edulis meal SE 2012 17.1

MTT REPORT 164 32
3.4.7 The Swiss feed evaluation system: Energy values
Table 25. Energy values of organically produced feed ingredients and new feed materials (Switzerland).
no Name DE
MJ/kg DM 1.1.1 Barley FI 2011 14.8
1.11.1 Wheat FI 2011 16.3
1.4.1 Oats FI 2011 12.8
3.11.1 Peas FI 2012 16.2
3.11.1 Peas UK 2012 14.7
3.13.1 Grass pea AT 2011 14.8
3.15.1 Sainfoin, dehulled AT 2011 16.0
3.7.1 Faba beans UK 2012 14.3
3.7.1 Horse beans FI 2011 14.2
4.8.1 Potato, raw FI 2011 15.3
4.8.2 Potato, cooked FI 2011 15.5
7.1.1 Algae Spirulina UK 2012 18.6
7.1.1 Algae Chlorella scenedesmus NL 2012 14.0
9.16.2 Hermetia illucens meal ´MBM´ defatted CH 2012 16.3
9.16.2 Hermetia illucens meal ´CHO´ defatted CH 2012 18.3
9.16.2 Hermetia illucens meal ´kichen waste´ defatted CH 2012 16.4
10.11.1 Mussel Mytilus edulis meal SE 2013 18.9
10.11.1 Mussel Mytilus edulis meal SE 2012 19.0

MTT REPORT 164 33
3.5 Energy values for Poultry
3.5.1 The Finnish feed evaluation system: Energy values
Table 26. Energy values of organically produced feed ingredients and new feed materials for poultry (MTT). no Name ME
MJ/kg DM 1.1.1 Barley FI 2011 14.0
1.11.1 Wheat FI 2011 14.6
1.4.1 Oats FI 2011 13.4
2.14.2 Rape seed meal UK 2012 10.0
2.14.2 Rape seed, expeller FI 2012 11.3
2.18.8 Soya bean pulp FI 2011 10.5
2.8.1 Linseed UK 2012 10.7
3.11.1 Peas FI 2012 13.2
3.11.1 Peas UK 2012 12.8
3.13.1 Grass pea AT 2011 11.9
3.15.1 Sainfoin AT 2011 10.9
3.15.1 Sainfoin, dehulled AT 2011 12.7
3.7.1 Faba beans UK 2012 11.6
3.7.1 Horse beans FI 2011 11.6
3.9.1 Sweet lupins UK 2012 8.7
4.8.1 Potato, raw FI 2011 14.5
6.10.1 Lucerne fresh UK 2012 4.4
6.10.1 Lucerne silage UK 2012 3.5
6.10.1 Lucerne silage 2nd harvest UK 2012 3.5
6.10.1 Lucerne silage 2nd harvest extruded DE 2012 4.3
6.10.1 Lucerne silage 2nd harvest chopped DE 2012 3.7
6.10.1 Lucerne silage 3rd harvest extruded DE 2012 3.8
6.10.1 Lucerne silage 3rd harvest chopped DE 2012 3.8
6.10.1 Clover-grass silage DE 2012 3.1
6.10.4 Lucerne pellets UK 2012 3.3
6.6.3 Grass, wilted and ensiled NL 2011 4.0
7.1.1 Algae Spirulina UK 2012 15.3
7.1.1 Algae Chlorella scenedesmus NL 2012 12.3
9.16.2 Hermetia illucens larvae ´MBM´ dried, full fat CH 2012 19.3
9.16.2 Hermetia illucens meal ´MBM´ defatted CH 2012 13.4
9.16.2 Hermetia illucens larvae ´CHO´ dried, full fat CH 2012 21.4
9.16.2 Hermetia illucens meal ´CHO´ defatted CH 2012 14.9
9.16.2 Hermetia illucens larvae ´kitchen waste´ full fat CH 2012 21.0
9.16.2 Hermetia illucens meal ´kitchen waste´ defatted CH 2012 13.4
10.11.1 Mussel Mytilus edulis meal SE 2013 15.5
10.11.1 Mussel Mytilus edulis meal SE 2012 15.7
M
TT R
EP
OR
T 1
64
34
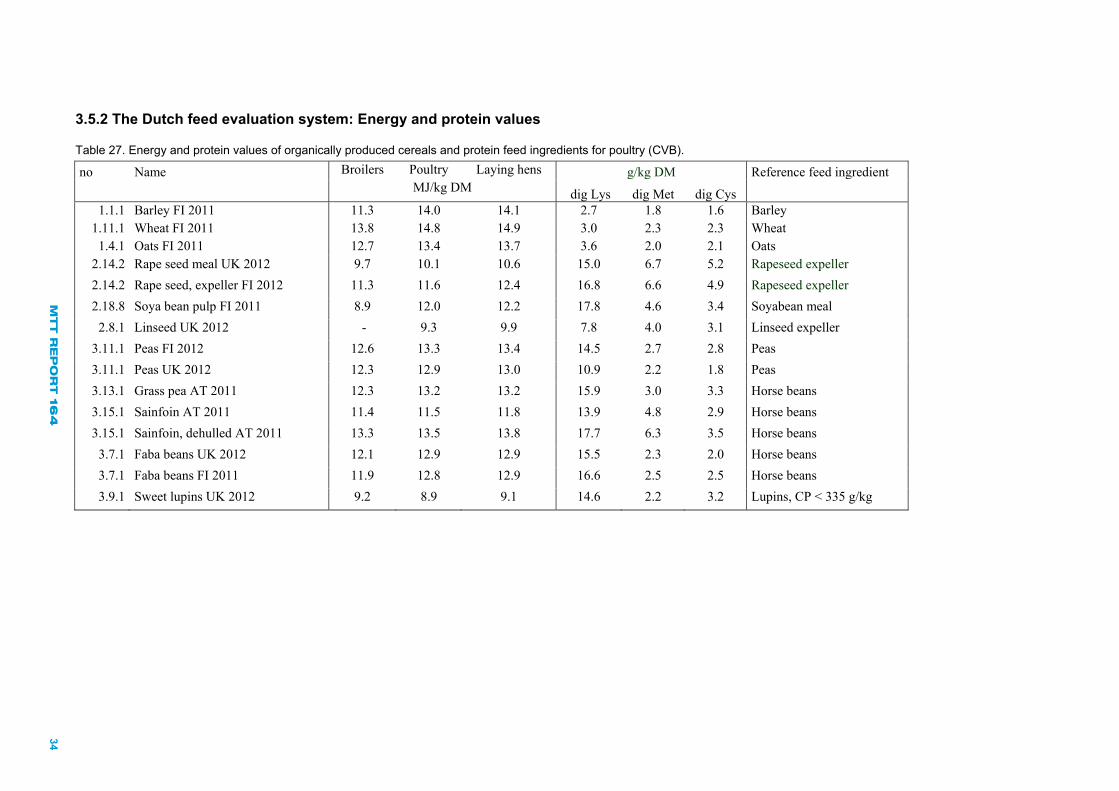
3.5.2 The Dutch feed evaluation system: Energy and protein values
Table 27. Energy and protein values of organically produced cereals and protein feed ingredients for poultry (CVB).
no Name Broilers Poultry Laying hens g/kg DM Reference feed ingredient
MJ/kg DM dig Lys dig Met dig Cys 1.1.1 Barley FI 2011 11.3 14.0 14.1 2.7 1.8 1.6 Barley
1.11.1 Wheat FI 2011 13.8 14.8 14.9 3.0 2.3 2.3 Wheat 1.4.1 Oats FI 2011 12.7 13.4 13.7 3.6 2.0 2.1 Oats
2.14.2 Rape seed meal UK 2012 9.7 10.1 10.6 15.0 6.7 5.2 Rapeseed expeller
2.14.2 Rape seed, expeller FI 2012 11.3 11.6 12.4 16.8 6.6 4.9 Rapeseed expeller
2.18.8 Soya bean pulp FI 2011 8.9 12.0 12.2 17.8 4.6 3.4 Soyabean meal
2.8.1 Linseed UK 2012 - 9.3 9.9 7.8 4.0 3.1 Linseed expeller
3.11.1 Peas FI 2012 12.6 13.3 13.4 14.5 2.7 2.8 Peas
3.11.1 Peas UK 2012 12.3 12.9 13.0 10.9 2.2 1.8 Peas
3.13.1 Grass pea AT 2011 12.3 13.2 13.2 15.9 3.0 3.3 Horse beans
3.15.1 Sainfoin AT 2011 11.4 11.5 11.8 13.9 4.8 2.9 Horse beans
3.15.1 Sainfoin, dehulled AT 2011 13.3 13.5 13.8 17.7 6.3 3.5 Horse beans
3.7.1 Faba beans UK 2012 12.1 12.9 12.9 15.5 2.3 2.0 Horse beans
3.7.1 Faba beans FI 2011 11.9 12.8 12.9 16.6 2.5 2.5 Horse beans
3.9.1 Sweet lupins UK 2012 9.2 8.9 9.1 14.6 2.2 3.2 Lupins, CP < 335 g/kg

M
TT R
EP
OR
T 1
64
35
Table 28. Energy and protein values of organically produced roughages for poultry (CVB).
no Name Broilers Poultry Laying hens g/kg DM Reference feed ingredient
MJ/kg DM dig Lys dig Met dig Cys 6.10.1 Lucerne fresh UK 2012 - 6.4 6.4 10.6 3.7 1.2 Alfalfa meal, dehydrated, CP >180 g/kg 6.10.1 Lucerne silage UK 2012 - 3.4 3.4 4.1 1.6 0.8 Alfalfa meal, dehydrated, CP 140-160 g/kg 6.10.1 Lucerne silage 2nd harvest UK 2012 - 4.3 4.4 3.6 1.9 0.7 Alfalfa meal, dehydrated, CP 160-180 g/kg 6.10.1 Lucerne silage 2nd harvest extruded DE 2012 - 5.1 5.2 3.9 2.8 1.0 Alfalfa meal, dehydrated, CP >180 g/kg 6.10.1 Lucerne silage 2nd harvest chopped DE 2012 - 5.2 5.3 3.5 2.9 0.8 Alfalfa meal, dehydrated, CP >180 g/kg 6.10.1 Lucerne silage 3rd harvest extruded DE 2012 - 5.6 5.7 7.8 2.9 1.0 Alfalfa meal, dehydrated, CP >180 g/kg 6.10.1 Lucerne silage 3rd harvest chopped DE 2012 - 5.5 5.6 7.4 2.8 1.0 Alfalfa meal, dehydrated, CP >180 g/kg 6.10.1 Clover-grass silage DE 2012 - 3.2 3.3 2.5 1.0 0.3 Grass meal CP < 140 g/kg 6.10.4 Lucerne pellets UK 2012 - 3.4 3.4 3.3 1.7 0.9 Alfalfa meal, dehydrated, CP 140-160 g/kg
6.6.3 Grass, wilted and ensiled NL 2011 - 3.8 3.9 4.7 1.6 0.4 Grass meal CP < 140 g/kg
Table 29. Energy and protein values of new feed materials for poultry (CVB).
no Name Broilers Poultry Laying hens g/kg DM Reference feed ingredient
MJ/kg DM dig Lys dig Met dig Cys 7.1.1 Algae Spirulina UK 2012 14.0 15.8 16.2 28.0 15.4 7.4 Fish meal, CP > 680 g/kg 7.1.1 Algae Chlorella scenedesmus NL 2012 11.3 12.4 12.8 19.9 8.0 3.8 Fish meal, CP < 580 g/kg 9.16.2 Hermetia illucens larvae ´MBM´ dried, full fat CH 2012 18.0 19.6 21.3 20.4 8.2 2.0 Fish meal, CP < 580 g/kg 9.16.2 Hermetia illucens meal ´MBM´ defatted CH 2012 12.6 13.8 14.0 30.2 11.0 3.0 Fish meal, CP < 580 g/kg 9.16.2 Hermetia illucens larvae ´CHO´ dried, full fat CH 2012 20.1 21.8 23.8 21.2 8.0 2.1 Fish meal, CP < 580 g/kg 9.16.2 Hermetia illucens meal ´CHO´ defatted CH 2012 13.6 15.5 15.7 32.7 11.3 3.5 Fish meal, CP < 580 g/kg 9.16.2 Hermetia illucens larvae ´kitchen waste´ full fat CH 2012 19.8 21.3 23.3 20.6 7.4 2.0 Fish meal, CP < 580 g/kg 9.16.2 Hermetia illucens meal ´kitchen waste´ defatted CH 2012 12.2 13.9 14.0 32.3 11.1 3.1 Fish meal, CP < 580 g/kg 10.11.1 Mussel Mytilus edulis meal SE 2013 14.2 16.1 16.6 43.5 15.8 7.5 Fish meal, CP 630-680 g/kg 10.11.1 Mussel Mytilus edulis meal SE 2012 14.3 16.2 16.8 43.1 14.2 6.9 Fish meal, CP 630-680 g/kg
MTT REPORT 164 36
4 References
Boisen, S. and Fernàndez, J.A. 1995. Prediction of the apparent ileal digestibility of protein and amino acids in
feedstuffs and feed mixtures for pigs by in vitro analyses. Animal Feed Science and Technology, 51: 29 -
34.
Boisen, S. and Fernàndez, J.A. 1997. Prediction of the total tract digestibility of energy in feedstuffs and in pig diets
by in vitro analyses. Animal Feed Science and Technology, 68: 277-286
Boisen S. 2006. Det danske fodervurderingssystem til svinefoder. Rapport nr. 30. 78 p.
Boisen S. 2007. In vitro analyses for predicting standardised ileal digestibility of protein and amino acids in actual
batches of feedstuffs and diets for pigs. Livestock Science 109:182 – 185.
CVB Feed Table 2011. Chemical compositions and nutritional values of feed materials. Centraal Veevoederbureau:
Lelystad, The Netherlands. 717 p.
CVB. 2007. Feed value Calculator.
Finke, M.D. 2007. Estimate of Chitin in Raw Whole Insects. Zoo Biology 26: 105 – 115.
GfE 2008. Recommedations for the Supply of energy and Nutrients to pigs. DLG-Verlags.GmbH.
Kumpulainen et al. 1983. Eletrothermal Atomic absorption Spectrometric Determination of Selenium in Foods and
Diets J.Assoc. Anal. Chem. 66(5): 1129–1135
Luh Huang, C.-Y. and E.E. Schulte. 1985. Digestion of plant tissue for analysis by ICP emission spectrometry.
Communications in Soil Science and Plant Analysis 16: 943-958.
Plaami, S. & Kumpulainen, J. 1991. Determination of phytic acid cereals using ICP-OES to determine phosphorus.
Journal Association of Official Analytical Chemistry, 74: 32-36
Robertson, J.B. and Van Soest, P.J. 1981. The detergent system of analysis and its application to human foods. In:
James, W.D.T. and Theander, O. (eds.). The Analyses of dietary Fibre in Foods. New York, NY, Marcell
Dekker. p. 123-158.
Salo, M-L. and Salmi, M. 1968. determination of starch by the amyloglucosidase method. Jounal of the Scientific
Agricultural Society of Finland, 40: 38-45.
Sauvant, D., Perez, J.-M. and Tran, G. 2004. Tables of composition and nutritional value of feed materials: pigs,
poultry, cattle, sheep, goats, rabbits, horses, fish. D. Sauvant, J.M. Perez & G.Tran (Eds). Wageningen
Academic Publishers, Wageningen and INRA Editions, Versailles.
Somogyi, M. 1945. A new reagent for the determination of sugars. Journal of Biological Chemistry 160: 61-68.
Van Soest, P.J., Robertson, J.B. and Lewis, B.A. 1991. Methods for dietary fibre, neutral detergent fibre and
nonstarch polysaccharides in relation to animal nutrition. Journal of Dairy Science, 74: 3583-3597.
MTT REPORT 164 37
5 Links
EU feed catalogue: http://eur-lex.europa.eu/legal-content/EN/TXT/PDF/?uri=CELEX:32013R0068&from=EN
The French feed evaluation system for pigs: http://www.evapig.com/IMG/pdf/EvaPigManualEquations-3.pdf
The Danish feed evaluation system for pigs: http://vsp.lf.dk/~/media/Files/PDF%20-%20Publikationer/Rapporter/Rapport30_DSP_Fodervurderingssystem_Svinefoder.ashx
The British feed evaluation system for pigs, The Premier Atlas 2010: http://www.premiernutrition.co.uk/default.aspx?SectionID=UK_TecAt
The German feed evaluation system for pigs, GfE (2008): Prediction of Metabolisable Energy of com-pound feeds for pigs: http://www.gfe-frankfurt.de/download/ME-Schaetzung.pdf
The Swiss feed evaluation system for pigs: http://www.admin.ch/opc/de/classified-compilation/20092465/201407010000/916.307.1.pdf
The Finnish feed evaluation system for poultry: https://portal.mtt.fi/portal/page/portal/Rehutaulukot/feed_tables_english/feed_tables/basis_of_calculations/energy_value_poultry
164