Embed Size (px)
Citation preview
1
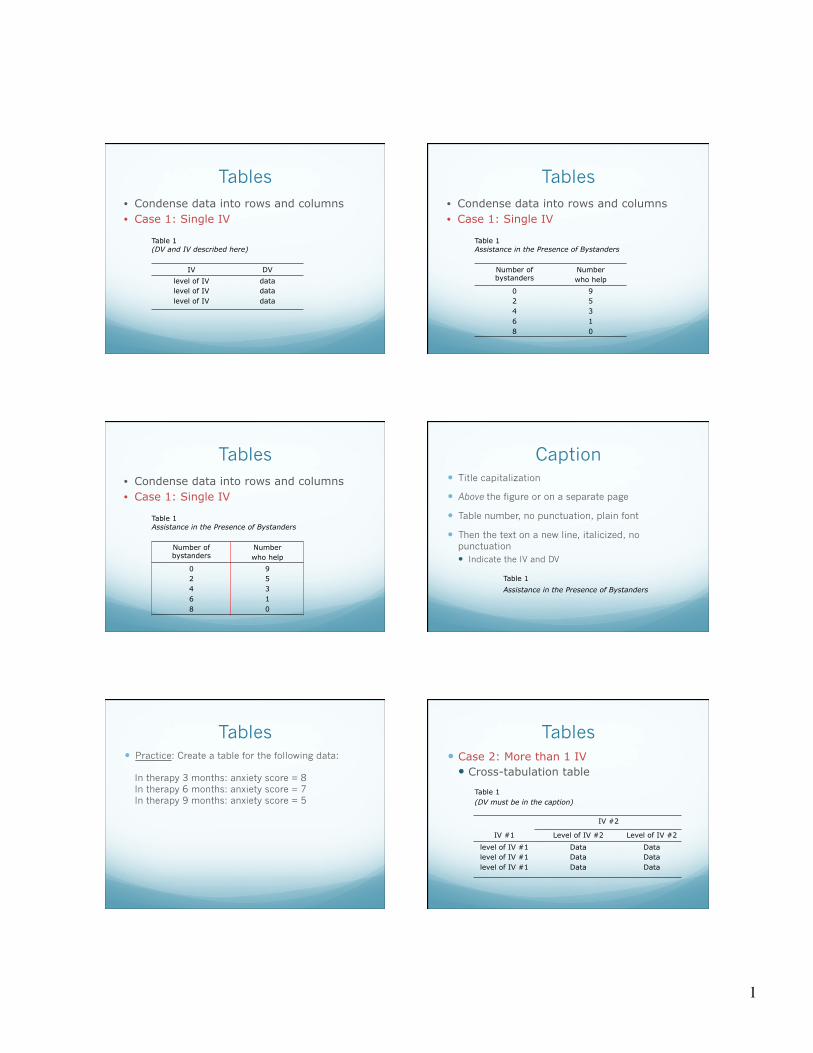
Tables
Table 1 (DV and IV described here)
IV DV level of IV level of IV level of IV
data data data
• Condense data into rows and columns • Case 1: Single IV
Tables
Table 1 Assistance in the Presence of Bystanders
Number of bystanders
Number who help
0 2 4 6 8
9 5 3 1 0
• Condense data into rows and columns • Case 1: Single IV
Tables
Table 1 Assistance in the Presence of Bystanders
Number of bystanders
Number who help
0 2 4 6 8
9 5 3 1 0
• Condense data into rows and columns • Case 1: Single IV
Caption � Title capitalization
� Above the figure or on a separate page
� Table number, no punctuation, plain font
� Then the text on a new line, italicized, no punctuation � Indicate the IV and DV
Table 1 Assistance in the Presence of Bystanders
Tables � Practice: Create a table for the following data:
In therapy 3 months: anxiety score = 8 In therapy 6 months: anxiety score = 7 In therapy 9 months: anxiety score = 5
Tables � Case 2: More than 1 IV � Cross-tabulation table
Table 1 (DV must be in the caption)
IV #2
IV #1 Level of IV #2 Level of IV #2
level of IV #1 level of IV #1 level of IV #1
Data Data Data
Data Data Data

2
Tables � Case 2: More than 1 IV � Cross-tabulation table
Table 1 Number of Males and Females who Assist in the Presence of Bystanders
Gender
Number of bystanders
Females Males
0 2 4 6 8
5 3 1 0 0
4 2 2 1 0
Tables � Practice: Create a table for the following data:
20 yrs old, in therapy 3 months: anxiety score = 9 20 yrs old, in therapy 6 months: anxiety score = 8 20 yrs old, in therapy 9 months: anxiety score = 6 30 yrs old, in therapy 3 months: anxiety score = 7 30 yrs old, in therapy 6 months: anxiety score = 6 30 yrs old, in therapy 9 months: anxiety score = 5 40 yrs old, in therapy 3 months: anxiety score = 8 40 yrs old, in therapy 6 months: anxiety score = 8 40 yrs old, in therapy 9 months: anxiety score = 4
Graphs � Often easier to interpret
� Basics � IV: x-axis
� DV: y-axis � Label axes appropriately
� Do NOT write IV, DV, x, or y on the graph
� Include units
� Caption � No “title” above the graph
Graphs (Figures) � Types
� Line graphs
� Bar graphs
� Scatterplots
A line graph
50
100
150
0 10 R
EAD
ING
SPE
ED (
wpm
)
20 30 40 50
PRINT SIZE (pts)
A bar graph
10
20
30
0 FISH DOG CAT BUNNY
FREQ
UEN
CY
FAVORITE PET
3
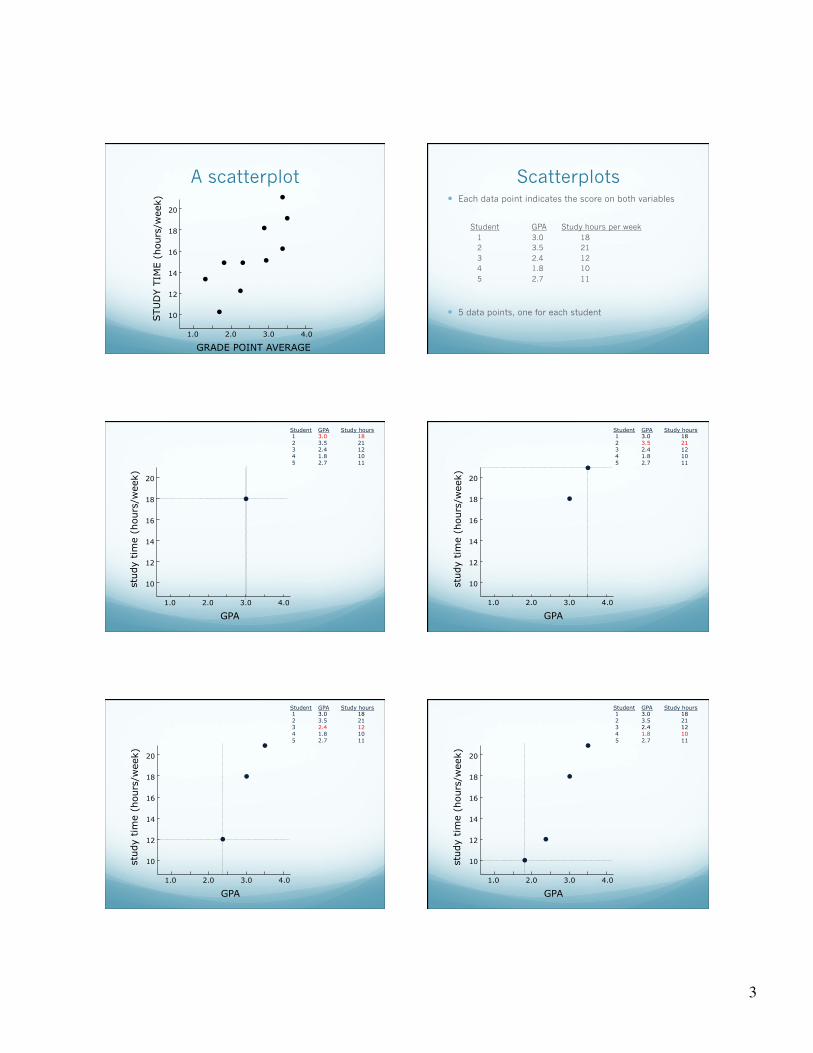
A scatterplot
GRADE POINT AVERAGE
STU
DY
TIM
E (h
ours
/wee
k)
1.0 2.0 3.0 4.0
10
12
14
16
18
20
Scatterplots � Each data point indicates the score on both variables
Student GPA Study hours per week 1 3.0 18 2 3.5 21 3 2.4 12 4 1.8 10 5 2.7 11
� 5 data points, one for each student
Student GPA Study hours 1 3.0 18 2 3.5 21 3 2.4 12 4 1.8 10 5 2.7 11
GPA
stud
y tim
e (h
ours
/wee
k)
1.0 2.0 3.0 4.0
10
12
14
16
18
20
GPA
stud
y tim
e (h
ours
/wee
k)
1.0 2.0 3.0 4.0
10
12
14
16
18
20
Student GPA Study hours 1 3.0 18 2 3.5 21 3 2.4 12 4 1.8 10 5 2.7 11
GPA
stud
y tim
e (h
ours
/wee
k)
1.0 2.0 3.0 4.0
10
12
14
16
18
20
Student GPA Study hours 1 3.0 18 2 3.5 21 3 2.4 12 4 1.8 10 5 2.7 11
Student GPA Study hours 1 3.0 18 2 3.5 21 3 2.4 12 4 1.8 10 5 2.7 11
GPA
stud
y tim
e (h
ours
/wee
k)
1.0 2.0 3.0 4.0
10
12
14
16
18
20

4
Student GPA Study hours 1 3.0 18 2 3.5 21 3 2.4 12 4 1.8 10 5 2.7 11
GPA
stud
y tim
e (h
ours
/wee
k)
1.0 2.0 3.0 4.0
10
12
14
16
18
20
Caption � Sentence capitalization
� Below the figure or on a separate page
� Figure number, followed by a period, italicized
� Then the text: � Indicate IV and DV � For line graphs: “DV as a function of IV”
Figure 1. Reading speed as a function of print size.
A line graph
50
100
150
0 10
REA
DIN
G S
PEED
(w
pm)
20 30 40 50
PRINT SIZE (pts)
Figure 1. Reading speed as a function of print size.
Graphing more than one IV � Use a different symbol for different levels of IV
� Symbols must be easily discriminable
� Must have a legend or labels
A line graph (with two IVs)
50
100
150
0 10 R
EAD
ING
SPE
ED (
wpm
)
20 30 40 50
PRINT SIZE (pts)
normal upside-down
PRINT STYLE
Figure 1. Reading speed as a function of print size and print style.
A line graph (with two IVs)
50
100
150
0 10 R
EAD
ING
SPE
ED (
wpm
)
20 30 40 50
PRINT SIZE (pts)
normal print
upside-down print
Figure 1. Reading speed as a function of print size and print style.

5
Graphing guidelines � Choose axis range carefully
� Influences interpretation of your graph
� Use the same range if you have multiple graphs
Poor choice of axis range
150
300
450
0 10
REA
DIN
G S
PEED
(w
pm)
20 30 40 50
PRINT SIZE (pts)
normal print
upside-down print
Different ranges on similar plots
50
100
150
0
10
REA
DIN
G S
PEED
(w
pm)
20 30 40 50
PRINT SIZE (pts)
A. Upside-down print
150
300
450
0 10
REA
DIN
G S
PEED
(w
pm)
20 30 40 50
PRINT SIZE (pts)
B. Normal print
Graphing guidelines � Do not over-decorate
� The more you decorate, the less you have to say
� Things that are rarely necessary � Color
� 3D graphs
� Gridlines
Unnecessary use of color & gridlines
50
100
150
0 10
REA
DIN
G S
PEED
(w
pm)
20 30 40 50
PRINT SIZE (pts)
Unnecessary 3D effects
10
20
30
0 FISH DOG CAT BUNNY
FREQ
UEN
CY

6
Graphing guidelines � Text style
� Avoid abbreviations
� Write left-to-right (or rotated 90°) � Use simple fonts
� sans serif � Arial, Helvetica, Verdana are suitable � Times, “Handwriting fonts”, and other funky fonts are
not
Practice � Create a graph and caption of these data.
Major Number of students
Botany 45
Greek 16
Mortuary science 20
Carrot science 2
Physics 40
Zoology 35
Practice � Create a plot and caption of these data.
Person Age (years) Hours of sleep per day
1 5 9
2 1 13
3 20 6.5
4 10 8.5
5 70 10
6 50 7
Practice � Create a graph and caption of these data:
20 mph: nausea rating=0
40 mph: nausea rating=1 60 mph: nausea rating=1 80 mph: nausea rating=3
100 mph: nausea rating=3
Practice � Create a graph and caption of these data.
20 mph, facing forward: nausea rating = 0 20 mph, facing backward: nausea rating = 0 40 mph, facing forward: nausea rating = 1 40 mph, facing backward: nausea rating = 5 60 mph, facing forward: nausea rating = 1 60 mph, facing backward: nausea rating = 8 80 mph, facing forward: nausea rating = 3 80 mph, facing backward: nausea rating = 7 100 mph, facing forward: nausea rating = 3 100 mph, facing backward: nausea rating = 9