Embed Size (px)
Citation preview
i
TABLE OF CONTENTS
Paragraph Page
Preface - (iii)
Executive Summary - (v)
CHAPTER-IFINANCES OF THE STATE GOVERNMENT
Summary of Current Year’s Fiscal Transactions 1.1 1
Fiscal Responsibility and Budget Management (FRBM) Act,2005
1.2 3
Growth and Composition of Gross State Domestic Product 1.3 4
Budget Analysis 1.4 4
Resources of the State 1.5 6
Revenue Receipts 1.6 10
Application of resources 1.7 15
Quality of Expenditure 1.8 21
Financial Analysis of Government Expenditure and Investments 1.9 24
Assets and Liabilities 1.10 27
Debt Sustainability 1.11 31
Fiscal Imbalances 1.12 32
Conclusion and recommendations 1.13 35
CHAPTER-IIFINANCIAL MANAGEMENT AND BUDGETARY CONTROL
Introduction 2.1 37
Summary of Appropriation Accounts 2.2 37
Financial Accountability and Budget Management 2.3 38
Non-Reconciliation of Departmental figures 2.4 44
Personal Deposit Accounts 2.5 45
Errors in budgeting process 2.6 45
Conclusion and recommendations 2.7 45
CHAPTER-IIIFINANCIAL REPORTING
Utilization Certificates 3.1 47
Non-submission/delay in submission of accounts 3.2 48
Delays in submission of Accounts/Audit Reports of Autonomous 3.3 49
Audit Report on State Finances for the year ended 31 March 2011
ii
Bodies
Misappropriations, losses, defalcations etc. 3.4 50
Conclusion and recommendations 3.5 51
APPENDICES
1.1
Part A: Structure and Form of Government Accounts 53
Part B: Layout of Finance Accounts 54
Part C: Methodology Adopted for the Assessment of Fiscal Position 55
Part D: State Profile 56
Part E: The Fiscal Responsibility and Budget Management (FRBM) Act,2005
57
1.2 Abstract of Receipts and disbursements for the year 2010-11 58
1.3Statement showing funds transferred to the State implementing Agenciesunder Programmes/Schemes outside the State budget during 2010-11
60
1.4 Assets and Liabilities of the Government of Manipur as on 31 March 2011 63
1.5 Time series data on the State Government finances 64
2.1Statement of various Grants/Appropriations where savings was more than
` one crore in each or more than 25 per cent of the total provision
67
2.2Statement showing expenditure incurred without provisionduring 2010-11
69
2.3 Excess over provision of previous years requiring regularisation 70
2.4 Excess/Unnecessary/Insufficient re-appropriation of funds 70
2.5 Statement showing cases of substantial surrenders (exceeding ` 50 lakh)made during the year 2010-11
73
2.6Statement of various Grants/Appropriations in which savings occurred butno part of which had been surrendered
75
2.7 Statement showing details of saving of ` one crore and above notsurrendered
77
2.8 Statement showing cases of surrender of funds made as on 31 March 2011 79
2.9Statement showing cases of rush of expenditure during March; which wasmore than 25 per cent of total expenditure of the year
80
2.10Statement showing department/institute –wise outstanding AC Bills as onOctober 2011
83
3.1Statement showing outstanding Utilization Certificates as on 31 March2011
84
3.2Statement showing names of Bodies, the accounts of which had not beenreceived
87
3.3Statement showing position of placement of SAR of ADC/ Autonomousbody as on 31 March 2011
88
4.1 Glossary of terms 89
Table of contents
iii
iii
PREFACE
1. This Report has been prepared for submission to the Governor under
Article 151 of the Constitution.
2. Chapters I and II of this Report contain Audit findings on matters
arising from examination of Finance Accounts and Appropriation
Accounts respectively of the State Government for the year ended
31 March 2011.
3. Chapter III on ‘Financial Reporting’ provides an overview and status of
the State Government’s compliance with various financial rules,
procedures and directives issued during the current year.
4. Audit observations on matters arising from performance reviews and
audit of transactions in various departments including the Public Works
and Irrigation and Flood Control Departments, audit of stores and
stock, audit of autonomous bodies, audit of revenue receipts and
departmentally run commercial undertakings for the year ended
31 March 2011 are included in a separate Report.
5. The audit has been conducted in conformity with the Auditing Standards
issued by the Comptroller and Auditor General of India.

v
Executive Summary
Background
TThis Report on the finances of the Government of Manipur is being brought outwith a view to assess objectively the financial performance of the State during theyear 2010-11. The aim of this Report is to provide the State Government withtimely inputs based on actual data so that there is better insight into bothperforming as well as non performing schemes/programmes of the Government.In order to give a perspective to the analysis, an effort has been made to comparethe achievements with the targets envisaged by the State Government in FiscalResponsibility and Budget Management Act, 2005 as well as in the Budgetestimates of 2010-11.
The Report
Based on the audited accounts of the Government of Manipur for the year endingMarch 2011, this Report provides an analytical review of the Annual Accounts ofthe State Government. The Report is in three chapters.
Chapter I is based on audit of Finance Accounts and makes an assessment of theGovernment of Manipur’s fiscal position as on 31 March 2011. It provides aninsight into trends in committed expenditure, borrowing pattern besides a briefaccount of Central funds transferred directly to the State implementing agencies.
Chapter II is based on audit of Appropriation Accounts and gives the grant-by-grant description of appropriations and the manner in which the allocatedresources were managed by the service delivery departments.
Chapter III is an inventory of Manipur Government’s compliance with variousreporting requirements and financial rules.
Audit Report on State Finances for the year ended 31 March 2011
vi
Audit findings and recommendations
FINANCES OF THE STATE GOVERNMENT
Revenue receipts
During 2006-11, around 89 to 91 per cent of the revenue receipts of the Statecame from the Central Government. There has been a significant increase of
` 1557 crore in revenue receipts in 2010-11 mainly due to increase in Grants-in-
aid (` 1072 crore) in the current year. This had a favourable impact on the revenue
receipt of the State. The increase in Share of Union Taxes / Duties, Own Tax andNon-tax collection augmented the healthy revenue receipts during the currentyear. (Paras 1.1, 1.6 and Table 1.8).
Efforts should be made to increase tax compliance and reduce administrativecosts. Timely compliance on all conditionalities that are pre-requisites to releaseof funds and timely utilisation of central funds would help in increasing of State'srevenue receipts.
Expenditure status
During 2006-11, expenditure on capital accounts had increased significantly by
121 per cent from ` 867 crore to ` 1918 crore; exhibiting a steady growth than
revenue expenditure which grew by 69 per cent during the period. (para 1.7.1).Plan expenditure as percentage of total expenditure increased from 40 per cent in2006-07 to 50 per cent in 2010-11 (para 1.7.1).
A similar trend was also noticed in terms of expenditure by activities, and wasorienting more towards developmental activities of Social Services and EconomicServices. However, Non-Plan Revenue Expenditure exceeded the limits set inMTFPS/budget/ThFC (para 1.7.1).
A monitoring mechanism to focus on timely completion of projects should be inplace to ensure that completed projects yield back resources to the economy of theState. Critical areas in planning needs to be focused while allocating funds so thatcapital/plan/development activities undertaken during the last five years do notfalter. Expenditure on NPRE should remain a focal point of attention of theGovernment.
Executive Summary
vii
Fiscal position, fiscal liabilities and sustainability of debt
During 2010-11, due to an increase in the devolution of Grants-in-aid from theCentral Government and share of taxes and duties, the revenue surplus increased
by ` 493 crore. This increase in revenue surplus has enabled the State Government
to contain both fiscal deficit and primary deficit, despite increase in totalexpenditure (para 1.12.1). At 6.18 per cent of GSDP, the fiscal deficit is still wayoff the mark of the ThFC target to limit the ratio at 3.5 per cent of GSDP by2012-13 and at 3 per cent thereafter (para 1.2).
Fiscal Liabilities have been increasing during the last five years, and haveincreased at a faster rate during the last two years (2009-11) as compared to the
previous years. The fiscal liabilities during the current year exceeded by ` 1472
crore than the assessed figure of ` 4652 crore in the MTFPS (Para 1.10.2).
Though there are signs of recovery, cautious and prudent management ofexpenditure and revenue mobilization need to be addressed so that financialposition returns to a comfortable position. The State Government may need togive special attention to limit fiscal deficit-GSDP ratio as recommended by theThFC.
FINANCIAL MANAGEMENT AND BUDGETARY CONTROL
During 2010-11, there was an overall saving of ` 679.14 crore. The overall saving
was the net result of saving of ` 741.56 crore offset by excess of ` 62.42 crore.
The excess of expenditure requires regularization under Article 205 of theConstitution of India. Excess expenditure for the period 2007-10 is yet to beregularized, awaiting recommendation of the Public Accounts Committee toregularize the excess expenditure (Paras 2.2 and 2.3).
There were cases of expenditure without any provision, unnecessary/insufficientsupplementary provision and cases of substantial surrenders. There were alsocases of surrender despite having no funds in the respective heads of accounts
(Para 2.3). Out of ` 2,019.49 crore paid through Abstract Contingent (AC) bills
during 2003-11, Detailed Countersigned Contingent bills for ` 653.29 crore are
outstanding as on October 2011 (Para 2.4).

Audit Report on State Finances for the year ended 31 March 2011
viii
Expenditure without provision and surrender of whole amount/ funds withoutfunds indicate that the budgetary process needs to be improved so as to avoid re-occurrence of such irregularities in future. Supplementary provisions should beused as an instrument to fine tune the flow of expenditure and should be appliedin a judicious manner so that budget provisions and actual expenditure arematched to the extent possible. While a marked improvement in settling ofoutstanding AC bills was visible in the current year, a close and rigorousmonitoring mechanism needs to be applied to adjust AC bills within thirty daysfrom the date of drawal of the amount.
FINANCIAL REPORTING
Utilization Certificates in respect of 1,659 grants and loans paid during 2007-11
involving ` 693.95 crore were in arrear as of March 2011. There were also delays
in placement of Separate Audit Reports before the Legislature, and significantarrears in finalization of accounts by the Autonomous DistrictCouncil/autonomous bodies. Out of 51 departments/autonomous bodies, onlyseven replies were received to ascertain the status of non-adjustment of temporaryadvances, misappropriation, losses etc. (Paras 3.1, 3.2, 3.3 and 3.4).
Government departments should take urgent action for timely receipt ofutilization certificates and necessary steps for finalization of accounts. Inordinatedelay in placement of Separate Audit Reports before the Legislature are a cause ofconcern and prompt action needs to be initiated in this regard.
1
CHAPTER IFINANCES OF THE STATE GOVERNMENT
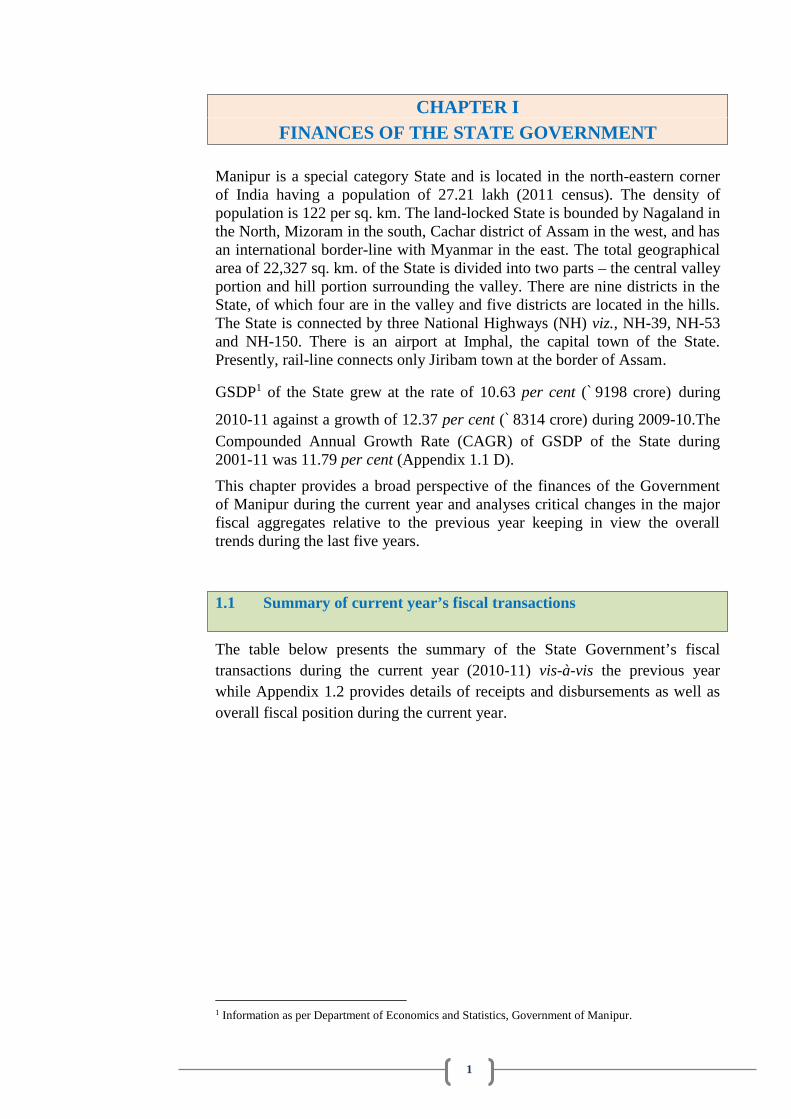
Manipur is a special category State and is located in the north-eastern cornerof India having a population of 27.21 lakh (2011 census). The density ofpopulation is 122 per sq. km. The land-locked State is bounded by Nagaland inthe North, Mizoram in the south, Cachar district of Assam in the west, and hasan international border-line with Myanmar in the east. The total geographicalarea of 22,327 sq. km. of the State is divided into two parts – the central valleyportion and hill portion surrounding the valley. There are nine districts in theState, of which four are in the valley and five districts are located in the hills.The State is connected by three National Highways (NH) viz., NH-39, NH-53and NH-150. There is an airport at Imphal, the capital town of the State.Presently, rail-line connects only Jiribam town at the border of Assam.
GSDP1 of the State grew at the rate of 10.63 per cent (` 9198 crore) during
2010-11 against a growth of 12.37 per cent (` 8314 crore) during 2009-10.TheCompounded Annual Growth Rate (CAGR) of GSDP of the State during2001-11 was 11.79 per cent (Appendix 1.1 D).
This chapter provides a broad perspective of the finances of the Governmentof Manipur during the current year and analyses critical changes in the majorfiscal aggregates relative to the previous year keeping in view the overalltrends during the last five years.
1.1 Summary of current year’s fiscal transactions
The table below presents the summary of the State Government’s fiscaltransactions during the current year (2010-11) vis-à-vis the previous yearwhile Appendix 1.2 provides details of receipts and disbursements as well asoverall fiscal position during the current year.
1 Information as per Department of Economics and Statistics, Government of Manipur.
Audit Report on State Finances for the year ended 31 March 2011
2
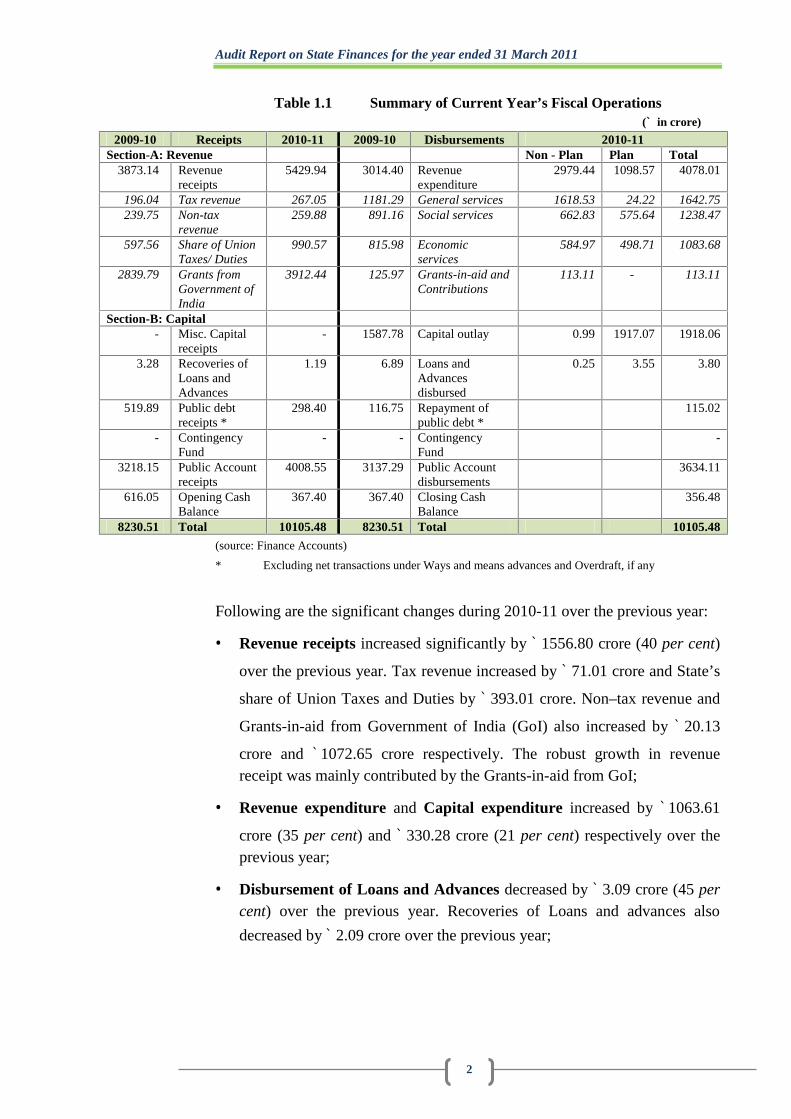
Table 1.1 Summary of Current Year’s Fiscal Operations(` in crore)
2009-10 Receipts 2010-11 2009-10 Disbursements 2010-11Section-A: Revenue Non - Plan Plan Total
3873.14 Revenuereceipts
5429.94 3014.40 Revenueexpenditure
2979.44 1098.57 4078.01
196.04 Tax revenue 267.05 1181.29 General services 1618.53 24.22 1642.75239.75 Non-tax
revenue259.88 891.16 Social services 662.83 575.64 1238.47
597.56 Share of UnionTaxes/ Duties
990.57 815.98 Economicservices
584.97 498.71 1083.68
2839.79 Grants fromGovernment ofIndia
3912.44 125.97 Grants-in-aid andContributions
113.11 - 113.11
Section-B: Capital- Misc. Capital
receipts- 1587.78 Capital outlay 0.99 1917.07 1918.06
3.28 Recoveries ofLoans andAdvances
1.19 6.89 Loans andAdvancesdisbursed
0.25 3.55 3.80
519.89 Public debtreceipts *
298.40 116.75 Repayment ofpublic debt *
115.02
- ContingencyFund
- - ContingencyFund
-
3218.15 Public Accountreceipts
4008.55 3137.29 Public Accountdisbursements
3634.11
616.05 Opening CashBalance
367.40 367.40 Closing CashBalance
356.48
8230.51 Total 10105.48 8230.51 Total 10105.48
(source: Finance Accounts)
* Excluding net transactions under Ways and means advances and Overdraft, if any
Following are the significant changes during 2010-11 over the previous year:
Revenue receipts increased significantly by ` 1556.80 crore (40 per cent)
over the previous year. Tax revenue increased by ` 71.01 crore and State’s
share of Union Taxes and Duties by ` 393.01 crore. Non–tax revenue and
Grants-in-aid from Government of India (GoI) also increased by ` 20.13
crore and ` 1072.65 crore respectively. The robust growth in revenuereceipt was mainly contributed by the Grants-in-aid from GoI;
Revenue expenditure and Capital expenditure increased by ` 1063.61
crore (35 per cent) and ` 330.28 crore (21 per cent) respectively over theprevious year;
Disbursement of Loans and Advances decreased by ` 3.09 crore (45 percent) over the previous year. Recoveries of Loans and advances also
decreased by ` 2.09 crore over the previous year;
Chapter I: Finances of the State Government
3
Public debt receipts decreased sharply by ` 221.49 crore (43 per cent)
over the previous year. Repayments of public debt also decreased by ` 1.73crore over the previous year;
Public Accounts receipts and disbursements increased by ` 790.40 crore
(25 per cent) and ` 496.82 crore (16 per cent) over the previous year. Thus,
net receipts increased by ` 293.58 crore during the year;
The total inflow during 2010-11 was ` 10,105.48 crore against ` 8,230.51
crore in 2009-10, while the total outflow during 2010-11 was ` 9749 crore
against ` 7863.11 crore during the previous year, leading to marginal
decline in cash balances of the State by ` 10.92 crore (3 per cent) over theprevious year.
1.2 Fiscal Responsibility and Budget Management (FRBM) Act, 2005
As per recommendation of the Twelfth Finance Commission (TFC), the StateGovernment has enacted (August 2005) the Manipur Fiscal Responsibility andBudget Management Act (MFRBM) Act, 2005 and MFRBM Rules. The StateGovernment has also developed its own Fiscal Correction Path for the period2005-10 detailing the structural adjustments to achieve its fiscal targets. AMedium Term Fiscal Policy Statement (MTFPS) showing the rolling fiscaltargets in each year was placed in the State Assembly to fine tune its fiscaltargets. According to the recommendations of the Thirteenth FinanceCommission (ThFC), the states should amend/enact FRBM Acts to build in thefiscal reform path worked out. State-specific grants recommended for a stateshould be released upon compliance. Accordingly, the MFRBM Rules, 2010has been amended (July 2010) by the State Government fixing the target ofFiscal deficit – GSDP ratio for fiscal deficit correction path.
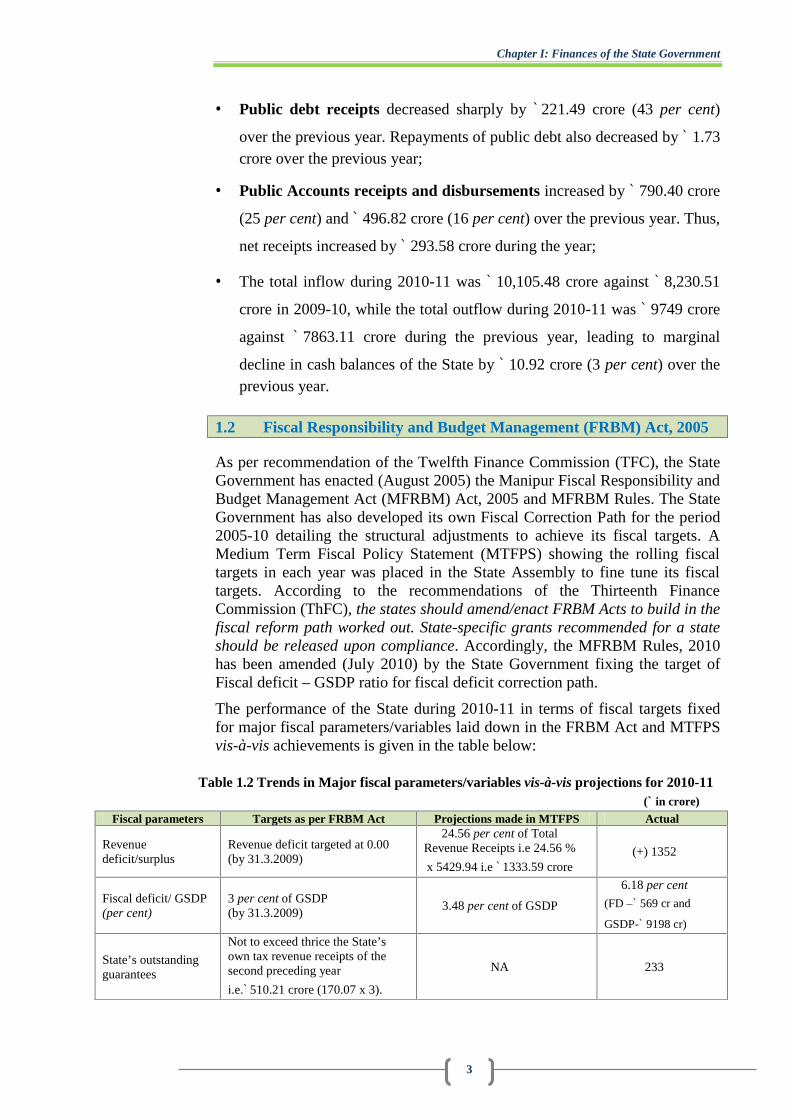
The performance of the State during 2010-11 in terms of fiscal targets fixedfor major fiscal parameters/variables laid down in the FRBM Act and MTFPSvis-à-vis achievements is given in the table below:
Table 1.2 Trends in Major fiscal parameters/variables vis-à-vis projections for 2010-11(` in crore)
Fiscal parameters Targets as per FRBM Act Projections made in MTFPS Actual
Revenuedeficit/surplus
Revenue deficit targeted at 0.00(by 31.3.2009)
24.56 per cent of TotalRevenue Receipts i.e 24.56 %
x 5429.94 i.e ` 1333.59 crore(+) 1352
Fiscal deficit/ GSDP(per cent)
3 per cent of GSDP(by 31.3.2009)
3.48 per cent of GSDP
6.18 per cent
(FD –` 569 cr and
GSDP-` 9198 cr)
State’s outstandingguarantees
Not to exceed thrice the State’sown tax revenue receipts of thesecond preceding year
i.e.` 510.21 crore (170.07 x 3).
NA 233
Audit Report on State Finances for the year ended 31 March 2011
4
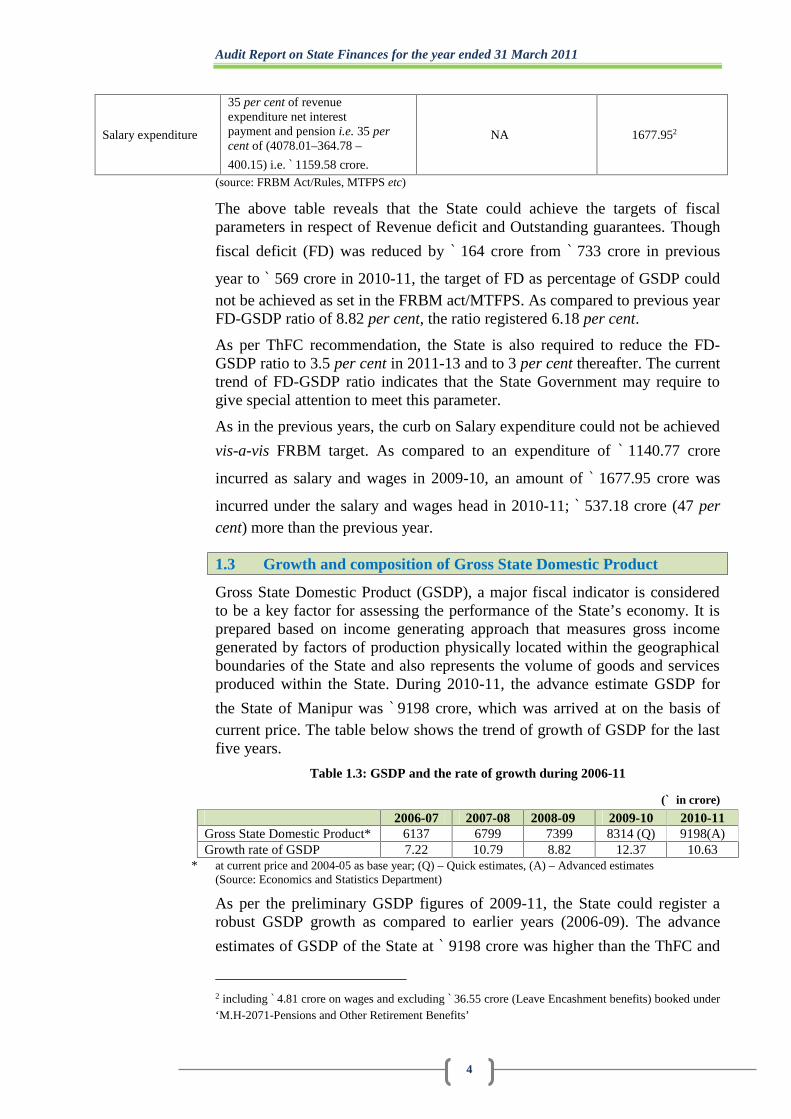
Salary expenditure
35 per cent of revenueexpenditure net interestpayment and pension i.e. 35 percent of (4078.01–364.78 –400.15) i.e. ` 1159.58 crore.
NA 1677.952
(source: FRBM Act/Rules, MTFPS etc)
The above table reveals that the State could achieve the targets of fiscalparameters in respect of Revenue deficit and Outstanding guarantees. Though
fiscal deficit (FD) was reduced by ` 164 crore from ` 733 crore in previous
year to ` 569 crore in 2010-11, the target of FD as percentage of GSDP couldnot be achieved as set in the FRBM act/MTFPS. As compared to previous yearFD-GSDP ratio of 8.82 per cent, the ratio registered 6.18 per cent.
As per ThFC recommendation, the State is also required to reduce the FD-GSDP ratio to 3.5 per cent in 2011-13 and to 3 per cent thereafter. The currenttrend of FD-GSDP ratio indicates that the State Government may require togive special attention to meet this parameter.
As in the previous years, the curb on Salary expenditure could not be achieved
vis-a-vis FRBM target. As compared to an expenditure of ` 1140.77 crore
incurred as salary and wages in 2009-10, an amount of ` 1677.95 crore was
incurred under the salary and wages head in 2010-11; ` 537.18 crore (47 percent) more than the previous year.
1.3 Growth and composition of Gross State Domestic Product
Gross State Domestic Product (GSDP), a major fiscal indicator is consideredto be a key factor for assessing the performance of the State’s economy. It isprepared based on income generating approach that measures gross incomegenerated by factors of production physically located within the geographicalboundaries of the State and also represents the volume of goods and servicesproduced within the State. During 2010-11, the advance estimate GSDP for
the State of Manipur was ` 9198 crore, which was arrived at on the basis ofcurrent price. The table below shows the trend of growth of GSDP for the lastfive years.
Table 1.3: GSDP and the rate of growth during 2006-11
(` in crore)
2006-07 2007-08 2008-09 2009-10 2010-11Gross State Domestic Product* 6137 6799 7399 8314 (Q) 9198(A)Growth rate of GSDP 7.22 10.79 8.82 12.37 10.63
* at current price and 2004-05 as base year; (Q) – Quick estimates, (A) – Advanced estimates(Source: Economics and Statistics Department)
As per the preliminary GSDP figures of 2009-11, the State could register arobust GSDP growth as compared to earlier years (2006-09). The advance
estimates of GSDP of the State at ` 9198 crore was higher than the ThFC and
2 including ` 4.81 crore on wages and excluding ` 36.55 crore (Leave Encashment benefits) booked under‘M.H-2071-Pensions and Other Retirement Benefits’

Chapter I: Finances of the State Government
5
MTFPS projection of ` 8115 crore. The registered growth rate of GSDP at10.63 per cent in 2010-11 was also marginally higher than the ThFC projectedannual growth rate of 10.58 per cent.
1.4 Budget analysis
The budget papers presented by State Government provide description ofprojections or estimations of revenue and expenditure for a particular fiscalyear. The importance of accuracy in the estimation of revenue and expenditureis widely accepted in the context of effective implementation of fiscal policiesfor overall economic management. Several reasons may account for thedeviation of actual realization from budget estimates e.g unanticipated andunforeseen events or under/over estimation of expenditure/revenue, etc. Thetable below and chart presents the consolidated picture of budget estimates andactuals of the State finances during 2010-11.
Audit Report on State Finances for the year ended 31 March 2011
6
Table 1.4: Statement showing budget estimates and Actuals
(` in crore)
Parameters 2010-11 Percentage of excess(+)/ shortfall (-) w.r.t
REBudget
Estimates (BE)Revised
Estimates (RE)Actual
Tax revenue 288.74 250.95 267.05 6.42Non-tax revenue 456.63 353.50 259.88 (-) 26.48Revenue receipts 5368.27 5544.34 5429.94 (-) 2.06Revenue expenditure 4049.79 4301.96 4078.01 (-) 5.21Interest payment 361.40 372.66 364.78 (-) 2.11Capital expenditure 1765.06 2090.32 1918.06 (-) 8.24Disbursement of Loans &Advances
18.20 8.00 3.80 (-) 52.50
Revenue surplus 1318.48 1242.38 1351.93 8.82Fiscal deficit - 282.00 - 852.28 - 568.74 (-) 33.27Primary deficit (-)/surplus (+) - 79.40 - 479.62 - 203.96 (-) 57.47Capital receipts 179.12 - - -Recoveries of Loans andAdvances
3.66 3.66 1.19 (-) 67.49
(source: Budget documents and Finance Accounts)
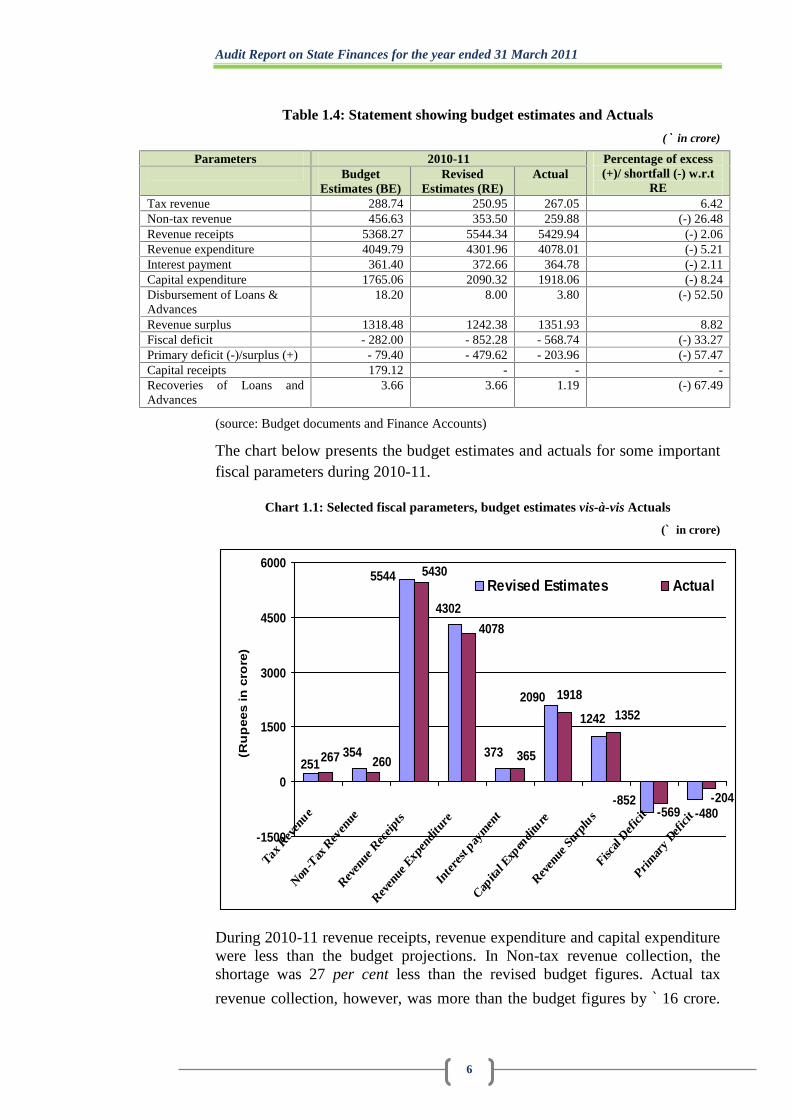
The chart below presents the budget estimates and actuals for some importantfiscal parameters during 2010-11.
Chart 1.1: Selected fiscal parameters, budget estimates vis-à-vis Actuals
(` in crore)
-852-480
12422090
373
4302
5544
354251
-569
5430
-204
13521918
365
4078
260267
-1500
0
1500
3000
4500
6000
Tax R
even
ue
Non-T
ax R
even
ue
Reven
ue R
eceip
ts
Reven
ue E
xpen
ditu
re
Inte
rest
paym
ent
Capita
l Exp
endi
ture
Reven
ue S
urpl
us
Fiscal
Def
icit
Primar
y Def
icit
(Ru
pee
s in
cro
re)
Revised Estimates Actual
During 2010-11 revenue receipts, revenue expenditure and capital expenditurewere less than the budget projections. In Non-tax revenue collection, theshortage was 27 per cent less than the revised budget figures. Actual tax
revenue collection, however, was more than the budget figures by ` 16 crore.
Chapter I: Finances of the State Government
7
The budget project of Interest payment was relatively accurate as there wasmarginal difference with the actual expenditure. The key parameters of deficitsindicators viz., revenue surplus, fiscal deficit and primary deficit were betterthan the budget projects. While revenue surplus was more than the budget
figures by ` 110 crore, fiscal deficit was less than the budget figures by ` 283crore. In case of primary deficit, it was less than the budget by 58 per cent
(` 276 crore).
1.5 Resources of the State
1.5.1 Resources of the State as per Annual Finance Accounts
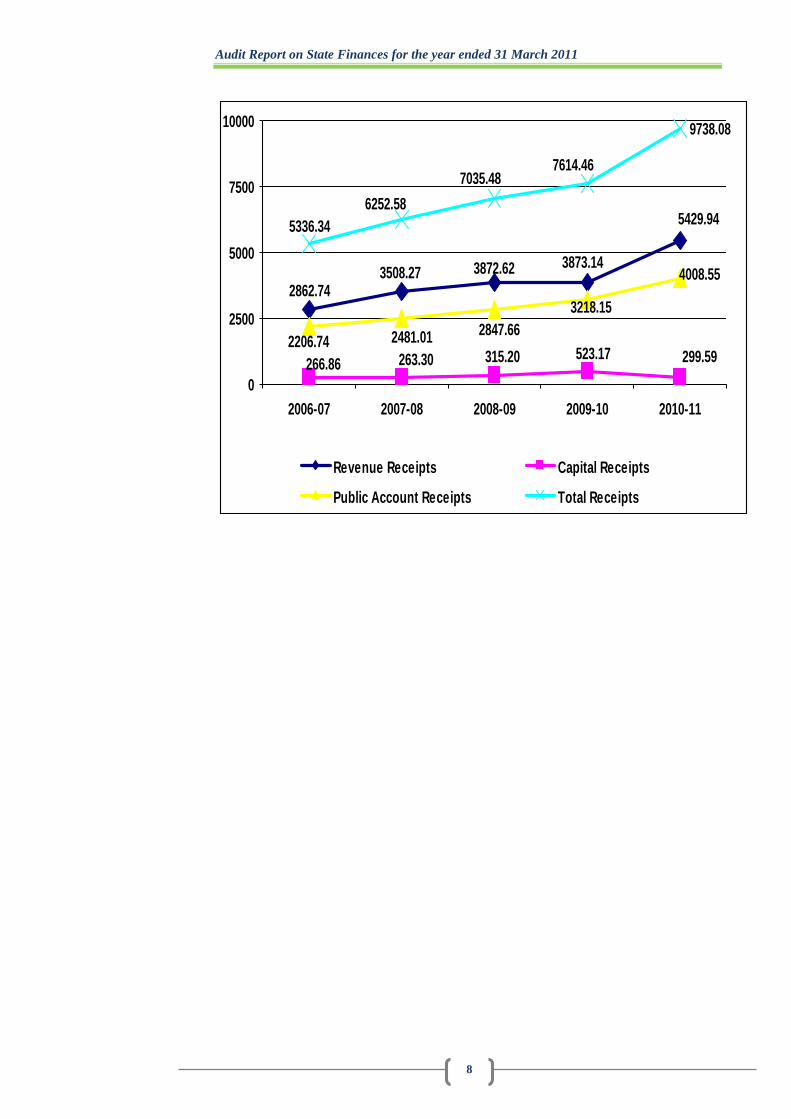
Revenue and capital are the two streams of receipts that constitute theresources of the State Government. Revenue receipts consist of tax revenues,Non-tax revenues, State’s share of union taxes and duties and Grants-in-aidfrom the Government of India (GoI). Capital receipts comprise miscellaneouscapital receipts such as proceeds from disinvestments, recoveries of loans andadvances, debt receipts from internal sources (market loans, borrowings fromfinancial institutions/commercial banks) and loans and advances from GoI aswell as accruals from Public Account. Table-1.1 presents the receipts anddisbursements of the State during the current year as recorded in its AnnualFinance Accounts while Chart 1.2 depicts the trends in various components ofthe receipts of the State during 2006-11. Chart 1.3 depicts the composition ofresources of the State during the current year.
Chart 1.2: Trends in Receipts(Rupees in crore)
Audit Report on State Finances for the year ended 31 March 2011
8
9738.08
5429.94
3873.143872.623508.272862.74
299.59523.17315.20263.30266.86
4008.55
3218.152847.662481.012206.74
7614.467035.48
6252.585336.34
0
2500
5000
7500
10000
2006-07 2007-08 2008-09 2009-10 2010-11
Revenue Receipts Capital Receipts
Public Account Receipts Total Receipts
Chapter I: Finances of the State Government
9
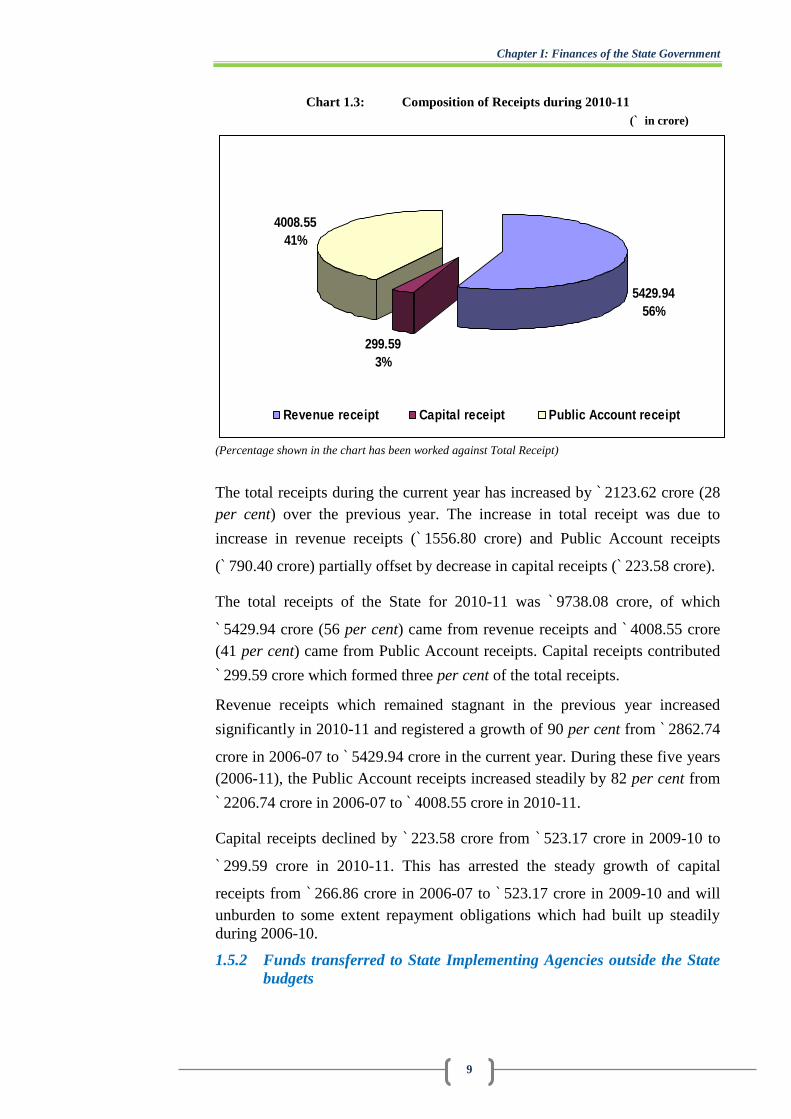
Chart 1.3: Composition of Receipts during 2010-11(` in crore)
5429.9456%
299.593%
4008.5541%
Revenue receipt Capital receipt Public Account receipt
(Percentage shown in the chart has been worked against Total Receipt)
The total receipts during the current year has increased by ` 2123.62 crore (28per cent) over the previous year. The increase in total receipt was due to
increase in revenue receipts (` 1556.80 crore) and Public Account receipts
(` 790.40 crore) partially offset by decrease in capital receipts (` 223.58 crore).
The total receipts of the State for 2010-11 was ` 9738.08 crore, of which
` 5429.94 crore (56 per cent) came from revenue receipts and ` 4008.55 crore(41 per cent) came from Public Account receipts. Capital receipts contributed
` 299.59 crore which formed three per cent of the total receipts.
Revenue receipts which remained stagnant in the previous year increased
significantly in 2010-11 and registered a growth of 90 per cent from ` 2862.74
crore in 2006-07 to ` 5429.94 crore in the current year. During these five years(2006-11), the Public Account receipts increased steadily by 82 per cent from
` 2206.74 crore in 2006-07 to ` 4008.55 crore in 2010-11.
Capital receipts declined by ` 223.58 crore from ` 523.17 crore in 2009-10 to
` 299.59 crore in 2010-11. This has arrested the steady growth of capital
receipts from ` 266.86 crore in 2006-07 to ` 523.17 crore in 2009-10 and willunburden to some extent repayment obligations which had built up steadilyduring 2006-10.
1.5.2 Funds transferred to State Implementing Agencies outside the Statebudgets

Audit Report on State Finances for the year ended 31 March 2011
10
The Central Government has been transferring a sizeable quantum of fundsdirectly to the State Implementing Agencies3 for the implementation ofvarious schemes/programmes in social and economic sectors recognized ascritical especially for human and social development of population. As thesefunds are not routed through the State Budget/State Treasury System, AnnualFinance Accounts do not capture the flow of these funds and to that extentState’s receipts and expenditure as well as other fiscal variables/parametersderived from them are understated. During 2010-11, the Government of India
has transferred an amount of around ` 931.58 crore to the ImplementingAgencies. Details are given in Appendix 1.3. Significant amount released formajor programmes/schemes are detailed in the table below:
Table-1.5: Funds transferred directly to State Implementing Agencies(` in crore)
Sl.No.
Programme/Scheme Implementing Agency in the StateTotal fund releasedby the GoI during
2010-111 Mahatma Gandhi National Rural
Employment Guarantee Scheme (MNREGS)Project Director, District RuralDevelopment Agencies (DRDA)
339.45
2 Sarva Shiksha Abhiyan (SSA) State Implementation Society, SSA 132.533 Pradhan Mantri Gram Sadak Yojana
(PMGSY)Manipur State Rural Roads DevelopmentAgency(MSRRDA)
88.83
4 National Rural Health Mission (NRHM) State Health Society, State TB Societyetc.
51.80
5 National Rural Drinking Water Programme SWSM, Manipur 40.216 Human Resource Development for Health Administrative Officer, Medical
Directorate30.00
7 Integrated Watershed ManagementProgramme(WMP)
Project Director, District RuralDevelopment Agencies (DRDA)
26.70
8 Rashtriya Madhyamic Shiksha Abhiyan(RMSA)
State Implementation Society, SSA25.26
9 Infrastructure Development for product Manipur Development Society 25.1310 National AIDS Control Programme
including STD ControlManipur State AIDS Control Society,Social Awareness Service
23.03
11 Indira Awaz Yojana (IAY) Rural Housing 7 DRDAs 20.5312 National Bamboo Mission State Bamboo Steering Committee 13.07
Total 816.54(Source: Finance Accounts)
The above table shows that an amount of ` 339.45 crore (about 36 per cent ofthe total funds transferred) was given for Mahatma Gandhi National Rural
Employment Guarantee Programme, ` 132.53 crore (about 14 per cent) for
Sarva Shiksha Abhiyan and ` 88.83 crore (about 10 per cent) for Pradhan
Mantri Gram Sadak Yojana. With the transfer of an amount of around ` 931.58crore directly by the GoI to the State Implementing Agencies, the total
availability of State resources increased from ` 9738.08 crore to
` 10, 669.66 crore during the current year.
3 Refer glossary in Appendix 4.1

Chapter I: Finances of the State Government
11
There is no single agency monitoring the funds directly transferred by the GoIand there is no readily available data on how much is actually spent in anyparticular year on major flagship schemes and other important schemes whichare being implemented by the State Implementing Agencies and fundeddirectly by the GoI and therefore, utilization of these funds runs the risk ofpoor accountability. Therefore, it is important to keep the accounts in auniform manner and report the actual expenditure to the GoI, which wouldensure end use of funds.
An analysis of two of these schemes viz., Pradhan Mantri Gram Sadak Yojana(PMGSY) and National Bamboo Mission revealed the following impropermaintenance of accounts:
Pradhan Mantri Gram Sadak Yojana
The activities of the Pradhan Mantri Gram Sadak Yojana in the State arecarried out through Manipur Rural Roads Development Agency (MSRRDA).The MSRRDA transferred the fund released by the GoI to various ProgrammeImplementing Unit (PIU) which are the original implementing Agency.
During 2010-11, ` 88.83 crore was released by the GoI for the programme.
During test check, it was found that out of ` 15.13 crore allotted to PIU,
Ukhrul, ` 18.25 lakh released under three packages were not found entered in
the cash book. Further, instead of ` 11.35 lakh released through another
package, an amount of ` 12.10 lakh had been entered in the cash book. As
such an amount of ` 0.75 lakh had been entered in the cash book in excess ofthe amount released.
The PIU, Ukhrul stated (December 2011) that an amount of ` 18.25 lakhissued by the MSRRDA in March and April 2010 was received by the PIUonly in November 2011. Reasons for such inordinate delay in fundtransmission were not stated in the reply. In respect of the discrepancy of
` 0.75 lakh between fund released and entry in the cash book, no comment hadbeen offered.
National Bamboo Mission
National Bamboo Mission (NBM) is 100 per cent centrally sponsored schemeunder the Ministry of Agriculture. In Manipur, State Bamboo SteeringCommittee (SBSC), under the Forest Department is the implementing agency.The activities of NBM in the State are carried out through Forest DevelopmentAgencies (FDA), Bamboo Development Agencies (BDA) and one NGO4.
During 2010-11 an amount of `13.07 crore including ` 5.91 crore for the NGOwas released by GOI for the programme, the details of which are as shownbelow:-
Table-1.6: Scheme-wise receipt and expenditure under NBM for the year 2010-11
4 FEEDS/KVK-Sylvan

Audit Report on State Finances for the year ended 31 March 2011
12
(` in crore)Sl. No. Name of Implementing Agencies Fund received
1 FDA/Senapati Forest Division 0.642 FDA/Northern Forest Division 1.043 FDA/Eastern Forest Division 0.734 FDA/Tengnoupal Forest Division 0.765 FDA/Southern Forest Division 0.916 FDA/Jiribam Forest Division 0.537 FDA/Western Forest Division 0.738 BDA 1.619 SBSC (Overhead & Training of Field Functionaries) 0.17
10 FEEDS/KVK-Sylvan, Hengbung, Senapati District 5.9111 SBSC (Overhead) 0.04
Grand Total 13.07(Source: Departmental records and records of the Societies)
During test check, it was found that in the FDA, Southern Forest Division (Sl.
No. 5) a total amount of ` 31.63 lakh was found entered in the cash bookwithout mentioning the cheque number and the date. In the records of the
Bamboo Development Agency (Sl. No. 8), an amount of ` 60 lakh released inMarch 2011 had still not been entered (November 2011) in the cash book ofBDA. No reply had been offered as of February 2012.
1.6 Revenue receipts
Statement-11 of the Finance Accounts details the revenue receipts of theGovernment. The revenue receipts consist of its own tax and non-tax revenues,central tax transfers and Grants-in-aid from GoI. The trends of revenuereceipts over the period 2006-11 are presented in Appendix 1.5 and depicted inthe chart below. The trends in revenue receipts relative to GSDP are alsopresented in the table below:
Chart 1.4: Trends in Revenue receipts
527
3912
5430
312303 424 436
991597581550436
2840286826462124
387338733508
2863
0
2000
4000
6000
2006-07 2007-08 2008-09 2009-10 2010-11
Ru
pee
in c
rore
State's Own Revenue Central Tax TransfersGrants-in-Aid Revenue Receipts
Chapter I: Finances of the State Government
13
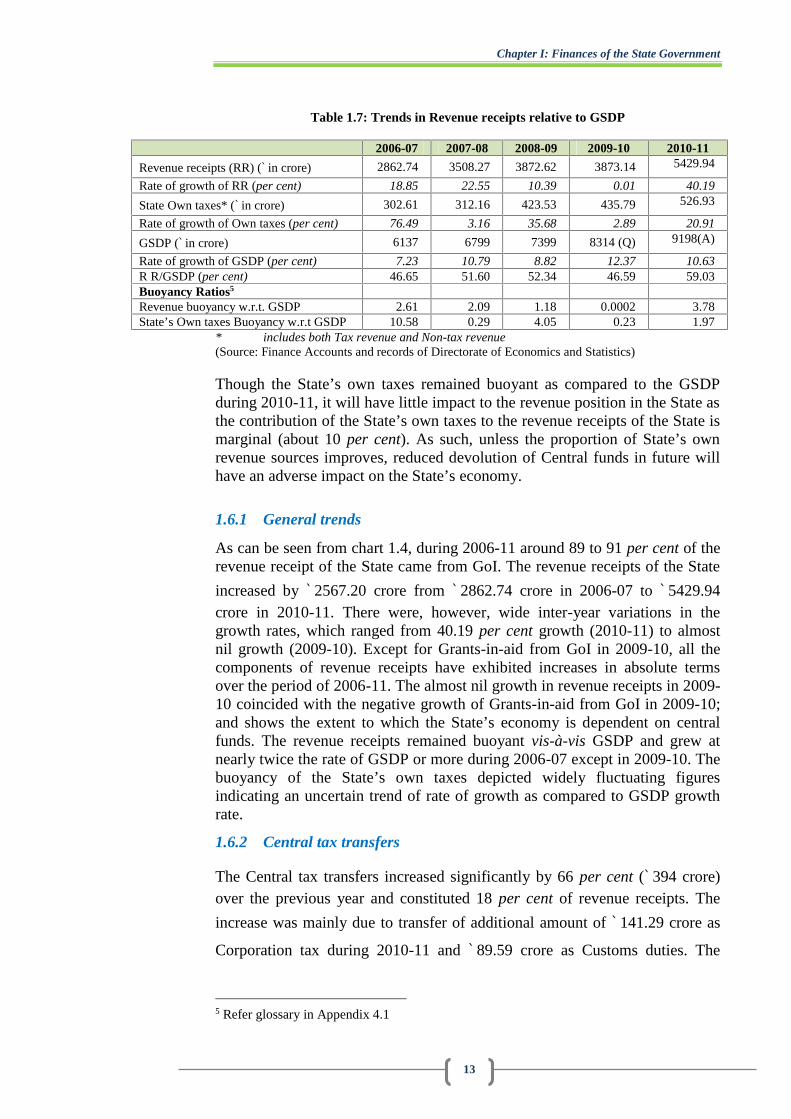
Table 1.7: Trends in Revenue receipts relative to GSDP
2006-07 2007-08 2008-09 2009-10 2010-11
Revenue receipts (RR) (` in crore) 2862.74 3508.27 3872.62 3873.14 5429.94
Rate of growth of RR (per cent) 18.85 22.55 10.39 0.01 40.19
State Own taxes* (` in crore) 302.61 312.16 423.53 435.79 526.93
Rate of growth of Own taxes (per cent) 76.49 3.16 35.68 2.89 20.91
GSDP (` in crore) 6137 6799 7399 8314 (Q) 9198(A)
Rate of growth of GSDP (per cent) 7.23 10.79 8.82 12.37 10.63R R/GSDP (per cent) 46.65 51.60 52.34 46.59 59.03Buoyancy Ratios5
Revenue buoyancy w.r.t. GSDP 2.61 2.09 1.18 0.0002 3.78State’s Own taxes Buoyancy w.r.t GSDP 10.58 0.29 4.05 0.23 1.97
* includes both Tax revenue and Non-tax revenue(Source: Finance Accounts and records of Directorate of Economics and Statistics)
Though the State’s own taxes remained buoyant as compared to the GSDPduring 2010-11, it will have little impact to the revenue position in the State asthe contribution of the State’s own taxes to the revenue receipts of the State ismarginal (about 10 per cent). As such, unless the proportion of State’s ownrevenue sources improves, reduced devolution of Central funds in future willhave an adverse impact on the State’s economy.
1.6.1 General trends
As can be seen from chart 1.4, during 2006-11 around 89 to 91 per cent of therevenue receipt of the State came from GoI. The revenue receipts of the State
increased by ` 2567.20 crore from ` 2862.74 crore in 2006-07 to ` 5429.94crore in 2010-11. There were, however, wide inter-year variations in thegrowth rates, which ranged from 40.19 per cent growth (2010-11) to almostnil growth (2009-10). Except for Grants-in-aid from GoI in 2009-10, all thecomponents of revenue receipts have exhibited increases in absolute termsover the period of 2006-11. The almost nil growth in revenue receipts in 2009-10 coincided with the negative growth of Grants-in-aid from GoI in 2009-10;and shows the extent to which the State’s economy is dependent on centralfunds. The revenue receipts remained buoyant vis-à-vis GSDP and grew atnearly twice the rate of GSDP or more during 2006-07 except in 2009-10. Thebuoyancy of the State’s own taxes depicted widely fluctuating figuresindicating an uncertain trend of rate of growth as compared to GSDP growthrate.
1.6.2 Central tax transfers
The Central tax transfers increased significantly by 66 per cent (` 394 crore)over the previous year and constituted 18 per cent of revenue receipts. The
increase was mainly due to transfer of additional amount of ` 141.29 crore as
Corporation tax during 2010-11 and ` 89.59 crore as Customs duties. The
5 Refer glossary in Appendix 4.1

Audit Report on State Finances for the year ended 31 March 2011
14
central tax transfers also contributed around 25 per cent of increase in revenue
receipts (` 1557 crore) during the year.
1.6.3 Grants-in-aid
Unlike previous year, Grants-in-aid from GoI increased by 38 per cent (` 1072crore) in 2010-11 and contributed nearly 69 per cent of the incrementalrevenue receipts during the year. The Grants-in-aid continued to remain themajor contributor to the revenue receipts of the State and accounted for 72 percent of the revenue receipts of the State. The increase in Grants-in-aid was
mainly contributed by increase in Special Plan Assistance (` 258.69 crore),
Non-Plan Revenue Deficit Grant (` 251.18crore) and Accelerated Irrigation
Benefits Programme (` 231.25 crore).
1.6.4 State’s own resources
As the State’s share in Central taxes and Grants-in-aid are determined on thebasis of recommendations of the Finance Commission, collection of Centraltax receipts and Central assistance for plan schemes etc., the State’sperformance in mobilization of additional resources should be assessed interms of its own resources comprising revenue from its own tax and non-taxsources. The table below shows the trends of tax and non-tax revenue duringthe years 2006-11 as well as the variation between the budget estimates ofrevenue receipts and the actual receipts under the principal heads of tax andnon-tax revenue for the year 2010-11.
Table 1.8: Sector-wise component of Tax revenue and Non-tax revenue(` in crore)
Name of componentYear 2010-11
2006-07 2007-08 2008-09 2009-10 BE 2010-11 Variation in Actual andBE (in per cent)
Tax revenueSales tax 96.64 120.75 141.38 163.28 220.00 227.57 (+) 3.44Other taxes on Incomeand Expenditure
13.28 14.72 15.46 17.63 30.00 18.77 (-) 37.43
Taxes on vehicles 3.19 3.57 4.03 4.34 15.00 4.44 (-) 70.40State excise 3.62 3.75 3.91 4.70 6.00 6.61 (+) 10.16Stamps andregistration fees
2.83 2.93 3.18 4.26 10.00 3.57 (-) 64.30
Others 2.01 1.73 2.11 1.83 7.74 6.09 (-) 21.32Sub-total 121.57 147.45 170.07 196.04 288.74 267.05 (-) 7.51
Non-tax revenueGeneral Services 91.94 62.31 105.12 80.74 214.39 96.36 (-) 55.05Social Services 3.39 4.79 9.78 11.63 14.91 16.25 (+) 8.99Economic Services 50.66 70.00 98.57 114.65 182.32 102.62 (-) 43.71Interest receipts anddividends etc.
35.05 27.61 39.99 32.73 45.01 44.65 (-) 0.80
Fiscal services -- -- -- * - Δ -Sub-total 181.04 164.71 253.46 239.75 456.63 259.88 (-) 43.09
Total 302.61 312.16 423.53 435.79 745.37 526.93 (-)50.6
* ` 0.12 lakh only Δ ` 0.05 lakh only
(a) Own tax revenue
Chapter I: Finances of the State Government
15
The tax revenue during 2010-11 increased by 36 per cent from ` 196.04 crore
in 2009-10 to ` 267.05 crore in 2010-11. The increase of ` 71.01 crore was
mainly contributed by Sales Tax (` 64.28 crore). As in the previous years,
Sales Tax (` 227.57 crore) remained the only major contributor of the Stateown tax resource and accounted for around 85 per cent of the tax. The own taxrevenue-GSDP ratio (2.90 per cent) was marginally higher than the projection(2.75 per cent) made by the ThFC. The Compounded Annual Growth Rate6
(CAGR) of own tax revenue between 2001-02 and 2009-10 was 18.33 percent, which increased to 20.17 per cent between 2001-02 and 2010-11;indicating that the collection of own tax revenue has improved in 2010-11relative to previous years.
Cost of collection
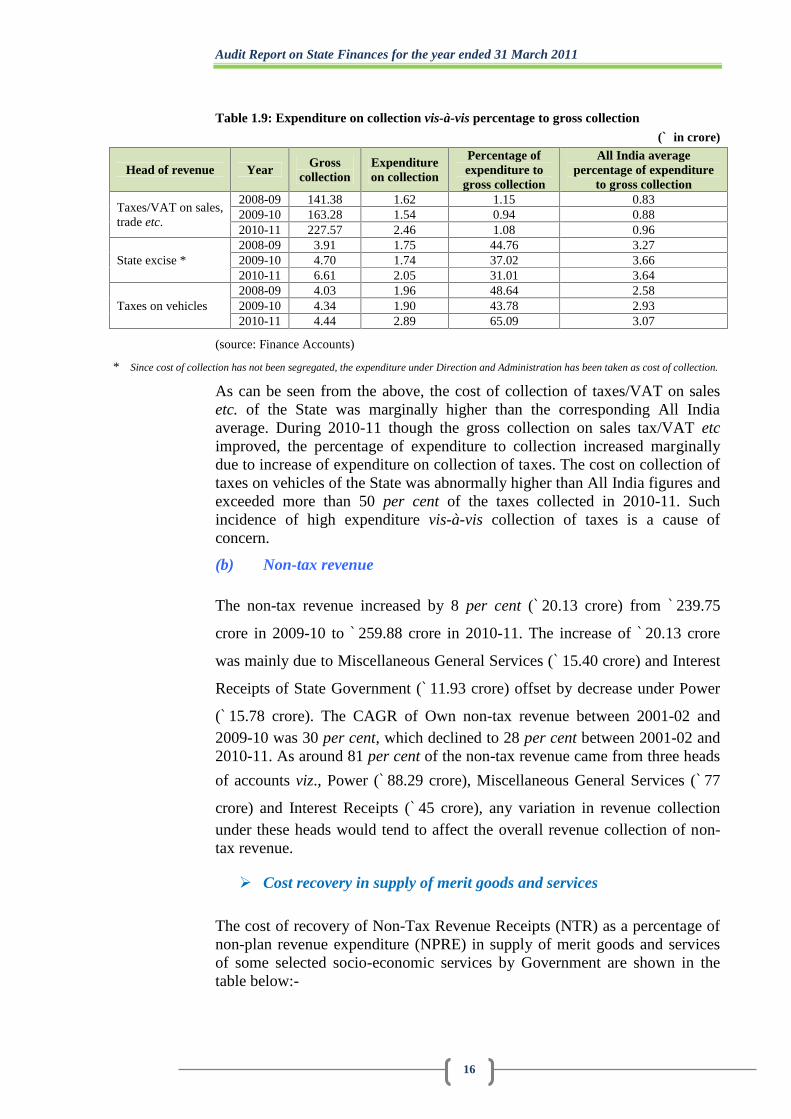
The gross collection of major revenue receipts, expenditure incurred oncollection and the percentage of such expenditure to gross collection during2008-09 to 2010-11 along with relevant All India Average percentage ofexpenditure on collection to gross collection are mentioned in the table below:
6 Compounded Annual Growth Rate is calculated by taking the nth root of the total percentagegrowth rate, where n is the number of years in the period under considered. CAGR = EndingValue/Beginning Value(1/no. of years)- 1
Audit Report on State Finances for the year ended 31 March 2011
16
Table 1.9: Expenditure on collection vis-à-vis percentage to gross collection(` in crore)
Head of revenue YearGross
collectionExpenditureon collection
Percentage ofexpenditure togross collection
All India averagepercentage of expenditure
to gross collection
Taxes/VAT on sales,trade etc.
2008-09 141.38 1.62 1.15 0.832009-10 163.28 1.54 0.94 0.882010-11 227.57 2.46 1.08 0.96
State excise *2008-09 3.91 1.75 44.76 3.272009-10 4.70 1.74 37.02 3.662010-11 6.61 2.05 31.01 3.64
Taxes on vehicles2008-09 4.03 1.96 48.64 2.582009-10 4.34 1.90 43.78 2.932010-11 4.44 2.89 65.09 3.07
(source: Finance Accounts)
* Since cost of collection has not been segregated, the expenditure under Direction and Administration has been taken as cost of collection.
As can be seen from the above, the cost of collection of taxes/VAT on salesetc. of the State was marginally higher than the corresponding All Indiaaverage. During 2010-11 though the gross collection on sales tax/VAT etcimproved, the percentage of expenditure to collection increased marginallydue to increase of expenditure on collection of taxes. The cost on collection oftaxes on vehicles of the State was abnormally higher than All India figures andexceeded more than 50 per cent of the taxes collected in 2010-11. Suchincidence of high expenditure vis-à-vis collection of taxes is a cause ofconcern.
(b) Non-tax revenue
The non-tax revenue increased by 8 per cent (` 20.13 crore) from ` 239.75
crore in 2009-10 to ` 259.88 crore in 2010-11. The increase of ` 20.13 crore
was mainly due to Miscellaneous General Services (` 15.40 crore) and Interest
Receipts of State Government (` 11.93 crore) offset by decrease under Power
(` 15.78 crore). The CAGR of Own non-tax revenue between 2001-02 and2009-10 was 30 per cent, which declined to 28 per cent between 2001-02 and2010-11. As around 81 per cent of the non-tax revenue came from three heads
of accounts viz., Power (` 88.29 crore), Miscellaneous General Services (` 77
crore) and Interest Receipts (` 45 crore), any variation in revenue collectionunder these heads would tend to affect the overall revenue collection of non-tax revenue.
Cost recovery in supply of merit goods and services
The cost of recovery of Non-Tax Revenue Receipts (NTR) as a percentage ofnon-plan revenue expenditure (NPRE) in supply of merit goods and servicesof some selected socio-economic services by Government are shown in thetable below:-

Chapter I: Finances of the State Government
17
Table 1.10: Cost of recovery of socio-economic services during 2009-11(` in crore)
Name of Services
2009-10 2010-11Non-taxrevenuereceipts
Non-planrevenue
expenditure
NTR aspercentageof NPRE
Non-taxrevenuereceipts
Non-planrevenue
expenditure
NTR aspercentageof NPRE
Water Supply andSanitation
9.48 58.17 16 14.21 46.83 30
Irrigation 7.18 11.83 61 10.68 26.85 40
(source: Finance Accounts)
NTR as percentage of NPRE under Water Supply and Sanitation increasedfrom 16 per cent in 2009-10 to 30 per cent in 2010-11. This improvement wasthe net result of decrease in NPRE and increase in NTR over the previousyear. However, in case of Irrigation the corresponding figure declined from 61per cent to 40 per cent. In these two selected services, the NPRE was morethan the NTR in both the years; and therefore efforts needs to be explored tolimit NPRE and increase NTR collection so as to make the provision of theseimportant services self sufficient.
1.6.5 Own resources vis-à-vis assessments of Twelfth/Thirteenth FinanceCommissions
The mobilization of State’s own resources vis-à-vis assessments made by theTFC (2006-10)/ThFC (2010-11) and actuals are as follows:-
Table 1.11: TFC/ThFC recommendations of Tax and Non-Tax vis-à-vis Actuals(` in crore)
YearAssessment of TFC/ThFC Actual Shortfall (percentage)
TaxNon-Tax Total Tax
Non-Tax Total Tax
Non-Tax Total
2006-07 169.65 40.15 209.80 121.57 181.04 302.61 48.08(28) - -2007-08 190.17 48.76 238.93 147.45 164.71 312.16 42.72(22) - -2008-09 213.18 58.34 271.52 170.07 253.46 423.53 43.11(20) - -2009-10 238.98 69.11 308.09 196.04 239.75 435.79 42.94(18) - -2010-11 223.41 49.96 273.37 267.05 259.88 526.93 - - -
(source: Finance Accounts)
The State could not achieve the targets of tax revenue collection fixed by theTFC during the award period of 2006-10. However, the State was able toreduce the shortfall in succeeding years, and was more than the projectedfigure of ThFC in 2010-11. The actual revenue collection from non-taxrevenue, however, was much higher than the TFC/ThFC targets and there wasno shortfall in own revenue collection vis-à-vis TFC/ThFC targets during2006-11.
However, both own tax revenue and non-tax revenue was short of the
projections made in the MTFPS/budget (Own tax revenue -` 288.74 crore and
Non-tax revenue - ` 456.63 crore).
Audit Report on State Finances for the year ended 31 March 2011
18
1.7 Application of resources
Analysis of the allocation of expenditure at the State Government levelassumes significance since major expenditure responsibilities are entrustedwith them. Within the framework of fiscal responsibility legislations, there arebudgetary constraints in raising public expenditure financed by deficit orborrowings. It is therefore important to ensure that the ongoing fiscalcorrection and consolidation process at the State level is not at the cost ofexpenditure, especially expenditure directed towards development and socialsectors.
1.7.1 Growth and composition of expenditure
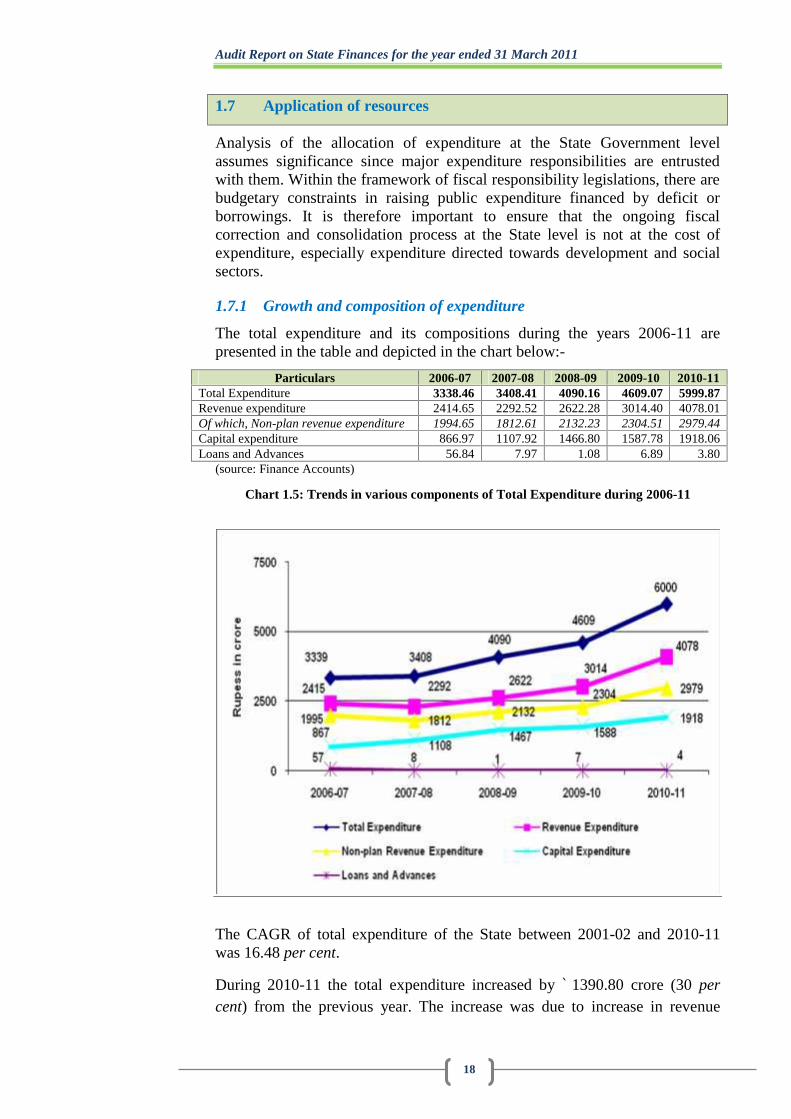
The total expenditure and its compositions during the years 2006-11 arepresented in the table and depicted in the chart below:-
Particulars 2006-07 2007-08 2008-09 2009-10 2010-11Total Expenditure 3338.46 3408.41 4090.16 4609.07 5999.87Revenue expenditure 2414.65 2292.52 2622.28 3014.40 4078.01Of which, Non-plan revenue expenditure 1994.65 1812.61 2132.23 2304.51 2979.44Capital expenditure 866.97 1107.92 1466.80 1587.78 1918.06Loans and Advances 56.84 7.97 1.08 6.89 3.80
(source: Finance Accounts)
Chart 1.5: Trends in various components of Total Expenditure during 2006-11
The CAGR of total expenditure of the State between 2001-02 and 2010-11was 16.48 per cent.
During 2010-11 the total expenditure increased by ` 1390.80 crore (30 percent) from the previous year. The increase was due to increase in revenue
Chapter I: Finances of the State Government
19
expenditure (` 1063.61 crore) and capital expenditure (` 330.28 crore). During2006-11, expenditure on capital accounts had increased significantly by 121
per cent from ` 867 crore to ` 1918 crore; exhibiting a much more steadygrowth than revenue expenditure which grew by 69 per cent during the period.
There was a decrease of expenditure of ` 3.09 crore under Loans andAdvances.
The increase in revenue expenditure (` 1063.61 crore) was mainly due to
Police (`254.18 crore), Pension and other Retirement benefits (` 107.35 crore),
Welfare of Scheduled Castes, Scheduled Tribes and Other backward Classes (`
103.06 crore), General Education (` 96.06 crore) and Medical and Public
Health (`79.32 crore) partially offset by decrease in Compensation to Local
Bodies Raj Institutes (` 12.86 crore).
The increase in capital expenditure (` 330.28 crore) was mainly due to Public
Works (` 161.09 crore), Water Supply and Sanitation (` 119.44 crore), Minor
Irrigation (` 94.44 crore), Flood control Projects (` 30.46 crore) partially offset
by decrease in Urban Development (` 50.25 crore), Tourism (` 34.63 crore),
Education, Sports, Art and Culture (` 26.90 crore).
A comparative study of expenditure in terms of Revenue, Capital and Loansand Advances reveals that since 2006-07 the share of State’s resourcesallocation to capital expenditure increased steadily till 2008-09. However,after 2008-09, the trend has been reversed as the share of capital expenditurestarted declining. The analysis also reveals that expenditure on Loans andAdvances has been curtailed drastically since 2006-07. The components of theshare of expenditure are shown in the chart below:-
Chart 1.6: Trend showing share of components of Total expenditure(In per cent)

Audit Report on State Finances for the year ended 31 March 2011
20
72.33
25.97
1.71
67.25
32.51
0.23
64.11
35.87
0.02
65.39
34.45
0.15
67.97
31.97
0.06
0%
25%
50%
75%
100%
Sh
are
inp
er c
ent
2006-07 2007-08 2008-09 2009-10 2010-11
Revenue Expenditure Capital Expenditure Loans & Advances
The composition of expenditure in terms of Plan and non-plan expenditure isshown in the table below:
Table 1.12: Trends in composition of expenditure in terms of Plan and Non-plan(` in crore)
Types ofExpenditure
2006-07 2007-08 2008-09 2009-10 2010-11
NON-PLANRevenue 1994.65 1812.61 2132.23 2304.51 2979.44Capital 2.42 (-)1.68 3.01 (-)0.80 0.99
Loans and Advances 5.28 3.85 0.34 0.19 0.25Sub-total * 2002.35 (60) 1814.78 (53) 2135.58 (52) 2303.90 (50) 2980.68 (50)
PLANRevenue 420.00 479.91 490.05 709.89 1098.57Capital 864.55 1109.59 1463.79 1588.58 1917.07
Loans and Advances 51.56 4.12 0.74 6.7 3.55Sub-total * 1336.11 (40) 1593.62(47) 1954.58 (48) 2305.17 (50) 3019.19 (50)
TOTAL (Non-Plan and Plan)Revenue 2414.65 2292.52 2622.28 3014.40 4078.01Capital 866.97 1107.91 1466.80 1587.78 1918.06Loans and Advances 56.84 7.97 1.08 6.89 3.80Total Expenditure 3338.46 3408.40 4090.16 4609.07 5999.87
(source: Finance Accounts)* Figures in bracket represent percentage with respect to the Total Expenditure
The table discloses that non-plan expenditure was reduced from 60 per centfrom 2006-07 to 50 per cent in 2010-11, with corresponding increase in Planexpenditure from 40 per cent in 2006-07 to 50 per cent in 2010-11. Theincrease in Plan expenditure was mainly due to increase in capital accounts,
which increased by ` 1052.52 crore (121 per cent) and revenue accounts
` 678.57 crore (162 per cent). Loans and Advances under Plan heads was
reduced significantly from ` 51.56 crore in 2006-07 to about ` four crore only
Chapter I: Finances of the State Government
21
in next four years (2007-11). Under non-plan heads, revenue expenditure has
increased by ` 984.79 crore (50 per cent) from ` 1994.65 crore in 2006-07 to
` 2979.44 crore in 2010-11. Other components under non-plan heads had beenconfined to an insignificant amount.
Non-plan revenue expenditure
Revenue expenditure is incurred to maintain the current level of services andpayment for past obligation and as such does not result in any addition toState’s infrastructure and service network.
As discussed in the preceding para, non-plan revenue expenditure (NPRE) in
2010-11 was ` 2979.44 crore and accounted for nearly 50 per cent of the Totalexpenditure. The NPRE in the current year exceeded the projections made in
the MTFPS/budget estimates (` 2912.57 crore) by ` 66.87 crore.
The targets of various components of expenditure fixed by the ThFC vis-à-visActuals in respect of NPRE are as follows:-
Audit Report on State Finances for the year ended 31 March 2011
22
Table 1.13: ThFC recommendations of NPRE vis-à-vis Actuals(` in crore)
ThFC/Actuals
SalaryGeneralServices
(GS)
InterestPayment(under GS)
Pension(under GS)
SocialServices
EconomicServices
Assignmentto LocalBodies
Total
(1) (2) (3) (4) (5) (6) (7) (8) (9)(2+3+6+7+8)ThFC 1242.73 738.34 350.29 273.78 151.54 135.95 110.46 2379.02
Actuals 1595.497 972.69 364.78 400.15 70.80 227.35 113.11 2979.44
(Source: Thirteenth Finance Commission Report and Finance Accounts)
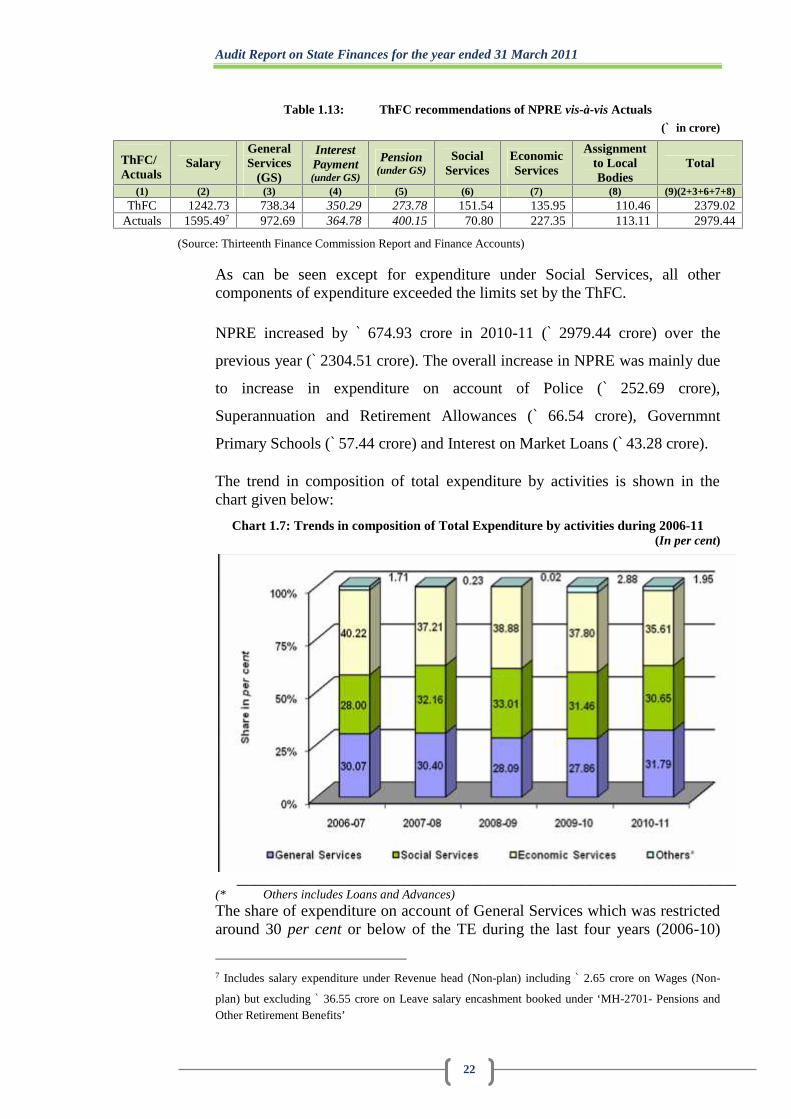
As can be seen except for expenditure under Social Services, all othercomponents of expenditure exceeded the limits set by the ThFC.
NPRE increased by ` 674.93 crore in 2010-11 (` 2979.44 crore) over the
previous year (` 2304.51 crore). The overall increase in NPRE was mainly due
to increase in expenditure on account of Police (` 252.69 crore),
Superannuation and Retirement Allowances (` 66.54 crore), Governmnt
Primary Schools (` 57.44 crore) and Interest on Market Loans (` 43.28 crore).
The trend in composition of total expenditure by activities is shown in thechart given below:
Chart 1.7: Trends in composition of Total Expenditure by activities during 2006-11(In per cent)
_______________________________________________________________________________(* Others includes Loans and Advances)
The share of expenditure on account of General Services which was restrictedaround 30 per cent or below of the TE during the last four years (2006-10)
7 Includes salary expenditure under Revenue head (Non-plan) including ` 2.65 crore on Wages (Non-
plan) but excluding ` 36.55 crore on Leave salary encashment booked under ‘MH-2701- Pensions andOther Retirement Benefits’
Chapter I: Finances of the State Government
23
increased to around 32 per cent of the TE in 2010-11; affecting the share onSocial Services and Economic Services by about one to two per cent.
Expenditure on General Services increased by ` 624 crore8 in 2010-11 over theprevious year. On revenue account, the increase in expenditure on GeneralServices was mainly due to increase in expenditure on account of Police
(` 252.69 crore) and Pensions and Other retirement benefits (` 107.35 crore)while on capital accounts it was mainly on account of Office Buildings
(` 114.94 crore).
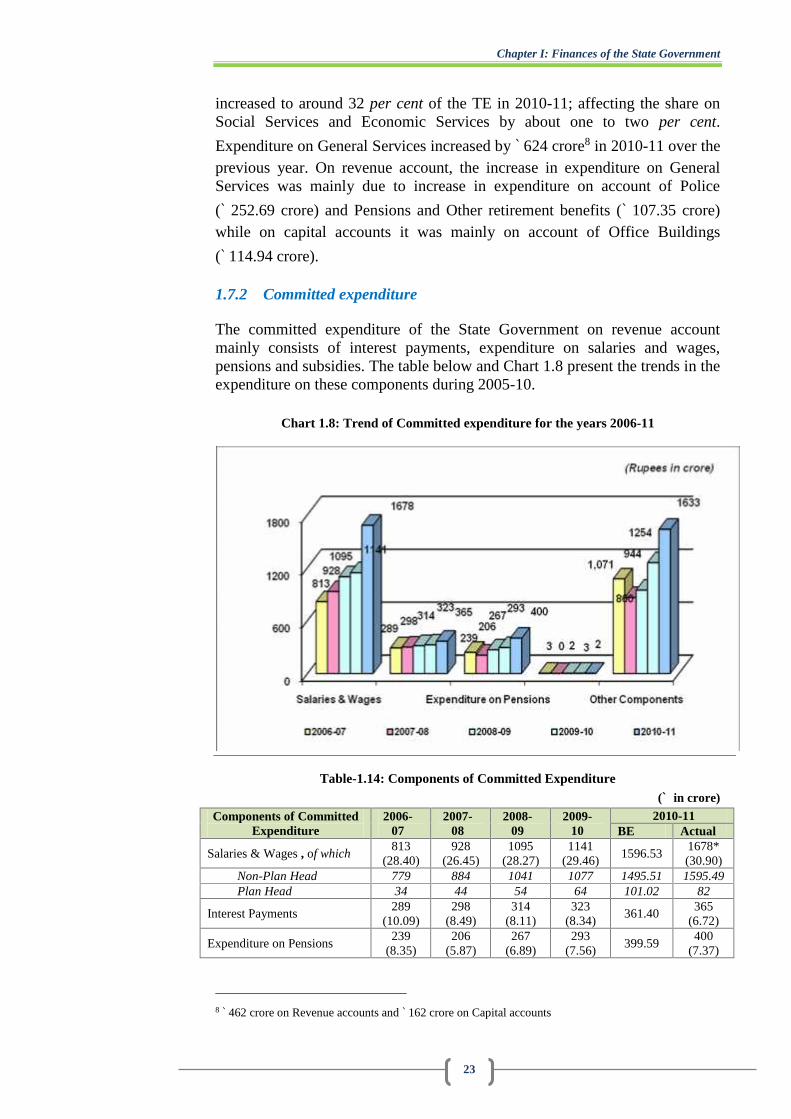
1.7.2 Committed expenditure
The committed expenditure of the State Government on revenue accountmainly consists of interest payments, expenditure on salaries and wages,pensions and subsidies. The table below and Chart 1.8 present the trends in theexpenditure on these components during 2005-10.
Chart 1.8: Trend of Committed expenditure for the years 2006-11
Table-1.14: Components of Committed Expenditure(` in crore)
Components of CommittedExpenditure
2006-07
2007-08
2008-09
2009-10
2010-11BE Actual
Salaries & Wages , of which813
(28.40)928
(26.45)1095
(28.27)1141
(29.46)1596.53
1678*(30.90)
Non-Plan Head 779 884 1041 1077 1495.51 1595.49Plan Head 34 44 54 64 101.02 82
Interest Payments289
(10.09)298
(8.49)314
(8.11)323
(8.34)361.40
365(6.72)
Expenditure on Pensions239
(8.35)206
(5.87)267
(6.89)293
(7.56)399.59
400(7.37)
8 ` 462 crore on Revenue accounts and ` 162 crore on Capital accounts
Audit Report on State Finances for the year ended 31 March 2011
24
Subsidies3
(0.01)- 2
(0.05)3
(0.08)1.90
2(0.03)
Other Components1,071
(37.41)860
(24.52)944
(24.38)1254
(32.38)1690.37
1633(30.07)
Total 2,415(84.35)
2,292(65.34)
2622(67.71)
3014(77.82)
4049.79 4078(75.10)
(source: Budget documents and Finance Accounts)
* including expenditure on account of Wages ` 4.81 crore and excluding ` 36.55 crore on Leave salary
encashment booked under ‘MH-2701- Pensions and Other Retirement Benefits’(Figures in the parentheses indicate percentage to Revenue receipts)
Salaries and wages alone accounted about 31 per cent of revenue receipts of
the State during 2010-11 and increased by ` 537 crore (47 per cent) over the
previous year. The increase in salary expenditure (` 537 crore) in 2010-11over the previous year was nearly twelve times the increase in salary
expenditure (` 46 crore) in 2009-10. Expenditure on salaries under non-plan
heads increased by ` 518 crore (48 per cent) in 2010-11 (` 1595.49 crore) over
the previous year (` 1077 crore), whereas this expenditure on plan head
increased by ` 18 crore (28 per cent) in 2010-11 (` 82 crore) over the previous
year (` 64 crore). The non-plan salary expenditure was more by ` 352.76 crore
than the projection (` 1242.73 crore) made by the ThFC. The considerableincrease in salary expenditure was due to implementation of 6th paycommission recommendation, payment of revised pay arrears for three monthsand dearness allowances and fresh recruitment in Police department.
Interest payments increased by 26 per cent from ` 289 crore in 2006-07 to
` 365 crore in 2010-11. Compared to previous year, interest payments during2010-11 increased by 13 per cent. Interest payments was mainly made on
Interest on Internal debt (` 245.71 crore). Interest on Internal debt accounted
for 67 per cent (` 245.71 crore) while the remaining share was for payment ofinterest on Small Savings, Provident Funds etc. and on Loans and Advancesfrom Central Government. As per cent of revenue receipts, Interest paymentshowed a declining trend and steadily decreased from 10 per cent in 2006-07
to 7 per cent in 2010-11. The overall interest payment (` 364.78 crore) during
the year was higher by ` 14.49 crore than the projection (` 350.29 crore) madeby the ThFC of the year.
Pension payments accounted for 7 per cent of revenue receipts of the State
during 2010-11 and increased by 37 per cent from ` 293 crore in 2009-10 to
` 400 crore in 2010-11. Increase of ` 107 crore in pension payments during2010-11 over the previous year was mainly due to increase in Superannuation
and Retirement Allowances (` 66.54 crore) and Family Pensions (` 26.90
Chapter I: Finances of the State Government
25
crore). As compared to ThFC projection of ` 273.78 crore, the Pension
payment in 2010-11 (` 400.15 crore) was more by 46 per cent (` 126.37 crore).
The State Government has adopted the new Restructured Defined ContributionPension Scheme of the GoI mutatis mutandis in respect of new entrants to theState’s service with effect from 1 January 2005. The contribution of the StateGovernment employees covered under the new scheme increased from a
closing balance of ` 17.60 crore in 2009-10 to ` 33.86 crore in 2010-11. TheState Government, however, had not contributed a matching share of thecontribution of employees. Thus, the liability of the Government would
increase by further ` 33.86 crore.
1.7.3 Financial assistance by State Government to local bodies and otherinstitutions
The quantum of assistance provided by way of grants and loans to local bodiesand others during the current year relative to the previous years is presented inthe table below:
Table 1.15: Financial Assistance to Local Bodies etc.
(` in crore)
Financial Assistance toInstitutions
2006-07 2007-08 2008-09 2009-102010-11
BE ActualEducational Institutions (AidedSchools, Aided Colleges,Universities etc.)
40.20 40.50 29.75 32.04 35.55 35.17
Municipal Corporations andMunicipalities
0.87 1.93 19.90 3.60 7.62 3.81
Other Institutions 1.25 0.84 1.02 1.67 5.82 2.11Total 42.32 43.27 50.67 37.31 48.99 41.09Assistance as percentage of RE 1.75 1.89 1.93 1.24 1.20 1.01
(source: Budget documents and Finance Accounts)
The total assistance (` 41.09 crore) provided during 2010-11 was less than the
estimates made in the budget (` 48.99 crore) by ` 7.9 crore. As compared to
last year, the total assistance increased by ` 3.78 crore in 2010-11. Financialassistance to universities and educational institutions alone constituted nearly86 per cent of the total assistance of the State Government during 2010-11.Amongst education services, maximum assistance was given to Non-
Government Primary Schools (` 21.43 crore).
1.8 Quality of expenditure
The availability of better social and physical infrastructure in the Stategenerally reflects the quality of its expenditure. The improvement in thequality of expenditure basically involves three aspects, viz., adequacy of theexpenditure (i.e. adequate provisions for providing public services); efficiency
Audit Report on State Finances for the year ended 31 March 2011
26
of expenditure use and the effectiveness (assessment of outlay-outcomerelationships for selected services).
1.8.1 Efficiency of Expenditure Use
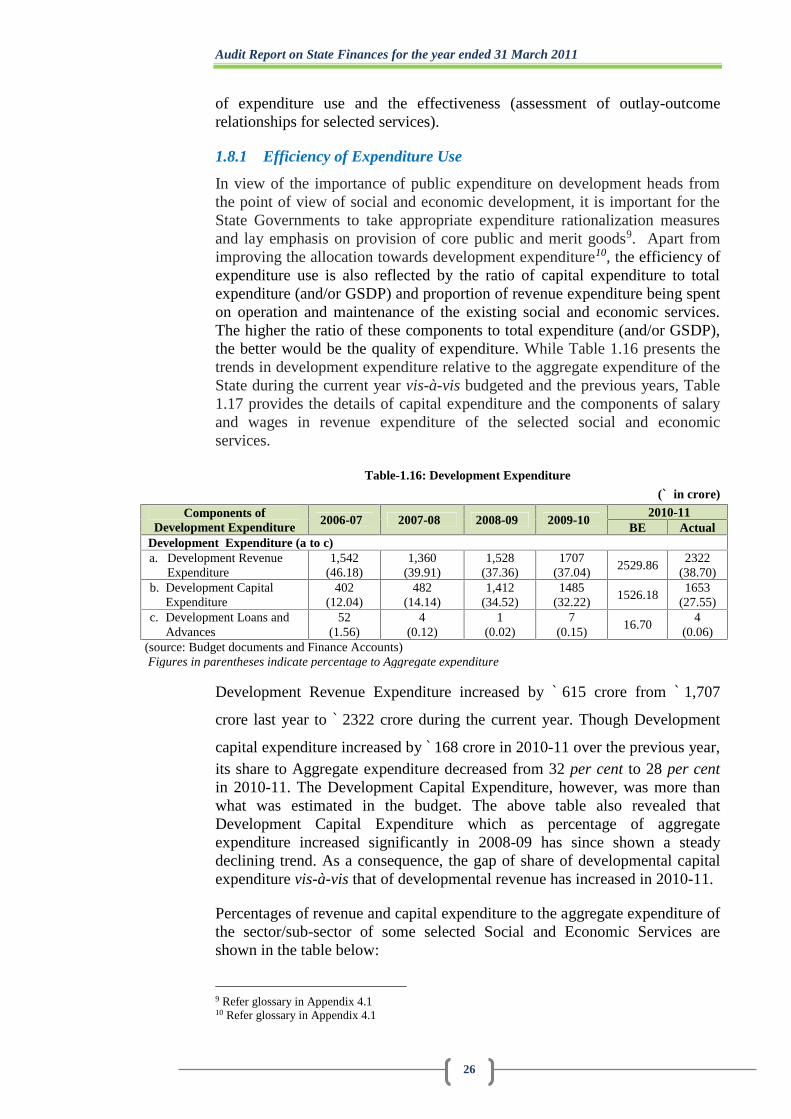
In view of the importance of public expenditure on development heads fromthe point of view of social and economic development, it is important for theState Governments to take appropriate expenditure rationalization measuresand lay emphasis on provision of core public and merit goods9. Apart fromimproving the allocation towards development expenditure10, the efficiency ofexpenditure use is also reflected by the ratio of capital expenditure to totalexpenditure (and/or GSDP) and proportion of revenue expenditure being spenton operation and maintenance of the existing social and economic services.The higher the ratio of these components to total expenditure (and/or GSDP),the better would be the quality of expenditure. While Table 1.16 presents thetrends in development expenditure relative to the aggregate expenditure of theState during the current year vis-à-vis budgeted and the previous years, Table1.17 provides the details of capital expenditure and the components of salaryand wages in revenue expenditure of the selected social and economicservices.
Table-1.16: Development Expenditure
(` in crore)
Components ofDevelopment Expenditure
2006-07 2007-08 2008-09 2009-102010-11
BE ActualDevelopment Expenditure (a to c)a. Development Revenue
Expenditure1,542
(46.18)1,360
(39.91)1,528
(37.36)1707
(37.04)2529.86
2322(38.70)
b. Development CapitalExpenditure
402(12.04)
482(14.14)
1,412(34.52)
1485(32.22)
1526.181653
(27.55)c. Development Loans and
Advances52
(1.56)4
(0.12)1
(0.02)7
(0.15)16.70
4(0.06)
(source: Budget documents and Finance Accounts)Figures in parentheses indicate percentage to Aggregate expenditure
Development Revenue Expenditure increased by ` 615 crore from ` 1,707
crore last year to ` 2322 crore during the current year. Though Development
capital expenditure increased by ` 168 crore in 2010-11 over the previous year,its share to Aggregate expenditure decreased from 32 per cent to 28 per centin 2010-11. The Development Capital Expenditure, however, was more thanwhat was estimated in the budget. The above table also revealed thatDevelopment Capital Expenditure which as percentage of aggregateexpenditure increased significantly in 2008-09 has since shown a steadydeclining trend. As a consequence, the gap of share of developmental capitalexpenditure vis-à-vis that of developmental revenue has increased in 2010-11.
Percentages of revenue and capital expenditure to the aggregate expenditure ofthe sector/sub-sector of some selected Social and Economic Services areshown in the table below:
9 Refer glossary in Appendix 4.110 Refer glossary in Appendix 4.1

Chapter I: Finances of the State Government
27
Table 1.17 –Efficiency of Expenditure in Selected Social and Economic Services(In per cent)
Social/Economic Infrastructure 2009-10 2010-11Share of CE to
TEShare of
S&W in REShare ofCE to TE
Share of S&Win RE
Social Services (SS)General Education 7.66 75.22 4.39 75.31Health and Family Welfare 38.72 74.78 31.21 63.01WS, Sanitation, & HUD 73.94 26.23 78.53 36.59Total (SS) 38.55 57.19 32.66 52.96Economic Services (ES)Agriculture & Allied Activities 3.29 37.54 4.12 39.93Irrigation and Flood Control 79.20 73.46 85.57 77.16Power & Energy 64.21 20.19 59.34 31.29Transport 79.24 26.89 74.30 31.92Total (ES) 53.15 31.91 49.19 34.72Total (SS+ES) 46.52 45.11 41.55 44.45
(source: Finance Accounts)
TE: Total expenditure inclusive of loans and advances of each sector/sub-sector/head; CE: Capitalexpenditure; RE: Revenue expenditure; S&W: Salaries and Wages.
While the share of capital expenditure as ratio of total expenditure in respectof General Education and Health and Family Welfare decreased in 2010-11 ascompared to previous year, the ratio in respect Water Supply, Sanitation andHousing and Urban Development had increased in 2010-11. The decrease ofshare in General Education was mainly due to decrease in capital expenditure
in respect of Secondary Education (` 10.95 crore). In Health and Family
Welfare even though the capital expenditure increased by ` 14.97 crore, itsshare as percentage of total expenditure reduced as expenditure under Revenue
head had increased by much higher rate (` 82.70 crore). The improvement inshare of Water Supply, Sanitation and Housing and Urban Development was
mainly due to increase on account of Water Supply (` 67.67 crore).
Under Economic Services, while the share of capital expenditure inAgriculture and Allied Activities and Irrigation and Flood Control improved,the share in Power and Energy and Transport had decreased in 2010-11 ascompared to previous year. The improvement in Agriculture and AlliedActivities and Irrigation and Flood Control was mainly due to increase in
Capital Outlay on Crop Husbandry (` 7.50 crore) while improvement inIrrigation and Flood Control was mainly due to capital outlay on Major and
Medium Irrigation (` 94.44 crore) respectively. The share of capitalexpenditure under Transport decreased in 2010-11 as a result of the decrease
under Capital Outlay on Roads and Bridges (` 16.19 crore). In Power and
Energy, capital expenditure increased by ` 7.97 crore against increase in
revenue expenditure of ` 43.89 crore. As such, the ratio of capital expenditureto total expenditure had decreased due to large variation in rate of increaseexpenditure under capital and revenue heads.
Audit Report on State Finances for the year ended 31 March 2011
28
Except for Health and Family Welfare share of salary and wages as percentageof revenue expenditure have increased as compared to 2009-10 in all theselected services.
1.8.2 Effectiveness of expenditure, i.e. outlay-outcome relationship
Performance reviews indicating the outlay-outcome relationship are inter-aliaincluded in the State Audit Report. The effectiveness of the expenditure asbrought out in performance review of Public Distribution System in the Statetaken up during 2009-10 is as follows:
A review on Public Distribution System (PDS) revealed that there was shortlifting of wheat and sugar against the allocation made by Government ofIndia. There were instances of diversion of rice, wheat and kerosene.Monitoring, inspection and the activities of the vigilance committee at Stateand District level were found to be inadequate. Monitoring mechanism andinspection of Fair Price Shop at different levels needs strengthening toprevent pilferage of commodities. The review also revealed that the StateGovernment did not formulate guidelines for identification of beneficiariesand review of households. PDS consumers were denied the intended benefitof having PDS items at prescribed scale and affordable price in a timelymanner. Bank interest on Cash Credit Account was charged from thebeneficiaries even when credit facilities were not availed of and instead ofavailing of transport subsidy and Hill Transport Subsidy Scheme, the StateGovernment charged beneficiaries the cost of transportation by fixing highend retail price.
(Paragraph 1.1 of Audit Report 2009-10)
1.9 Financial analysis of Government expenditure and investments
In the post-FRBM framework, the State is expected to keep its fiscal deficit(and borrowing) not only at low levels but also meet its capitalexpenditure/investment (including loans and advances) requirements. Inaddition, in a transition to complete dependence on market based resources,the State Government needs to initiate measures to earn adequate return on itsinvestments and recover its cost of borrowed funds rather than bearing thesame on its budget in the form of implicit subsidy and take requisite steps toinfuse transparency in financial operations. This section presents the broadfinancial analysis of investments and other capital expenditure undertaken bythe Government during the current year vis-à-vis previous years.
1.9.1 Incomplete projects
The department-wise information pertaining to incomplete projects of whichthe scheduled date of completion is already over as on 31 March 2011 is givenin the table below:
Table 1.18: Department-wise Profile of Incomplete Projects(` in crore)
Department No. of Incomplete Initial Cumulative actual
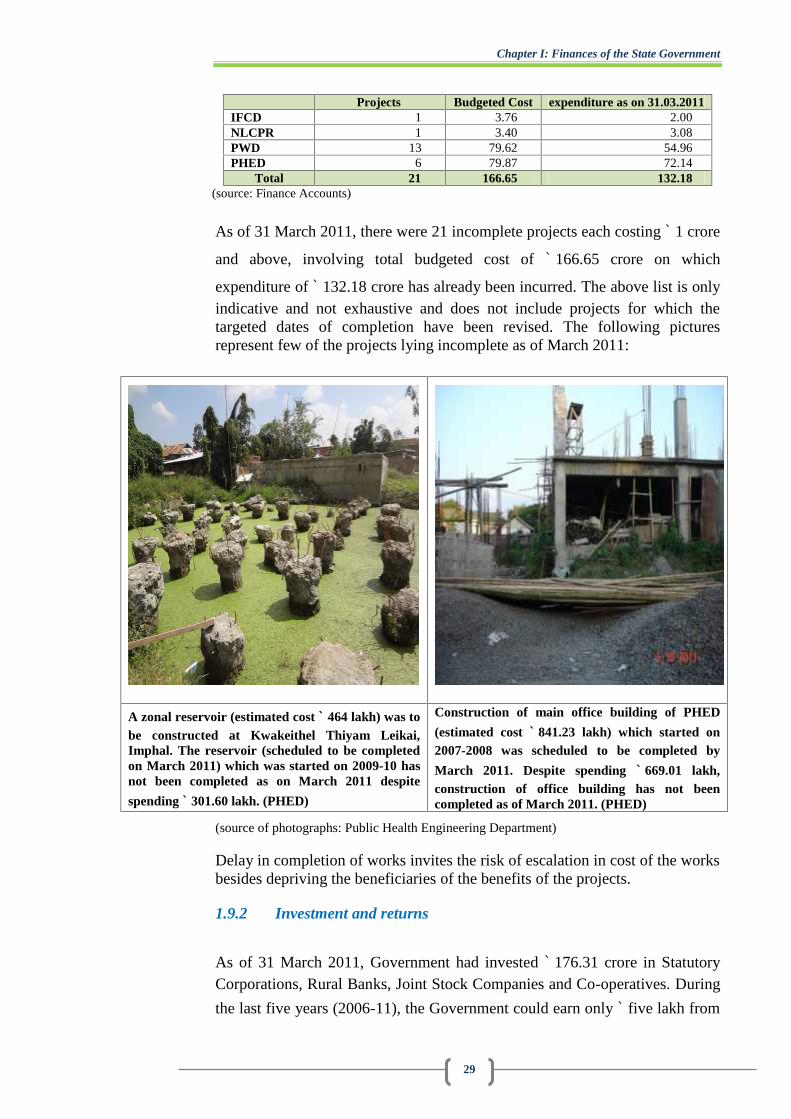
Chapter I: Finances of the State Government
29
Projects Budgeted Cost expenditure as on 31.03.2011IFCD 1 3.76 2.00NLCPR 1 3.40 3.08PWD 13 79.62 54.96PHED 6 79.87 72.14
Total 21 166.65 132.18(source: Finance Accounts)
As of 31 March 2011, there were 21 incomplete projects each costing ` 1 crore
and above, involving total budgeted cost of ` 166.65 crore on which
expenditure of ` 132.18 crore has already been incurred. The above list is onlyindicative and not exhaustive and does not include projects for which thetargeted dates of completion have been revised. The following picturesrepresent few of the projects lying incomplete as of March 2011:
A zonal reservoir (estimated cost ` 464 lakh) was tobe constructed at Kwakeithel Thiyam Leikai,Imphal. The reservoir (scheduled to be completedon March 2011) which was started on 2009-10 hasnot been completed as on March 2011 despite
spending ` 301.60 lakh. (PHED)
Construction of main office building of PHED
(estimated cost ` 841.23 lakh) which started on2007-2008 was scheduled to be completed by
March 2011. Despite spending ` 669.01 lakh,construction of office building has not beencompleted as of March 2011. (PHED)
(source of photographs: Public Health Engineering Department)
Delay in completion of works invites the risk of escalation in cost of the worksbesides depriving the beneficiaries of the benefits of the projects.
1.9.2 Investment and returns
As of 31 March 2011, Government had invested ` 176.31 crore in StatutoryCorporations, Rural Banks, Joint Stock Companies and Co-operatives. During
the last five years (2006-11), the Government could earn only ` five lakh from
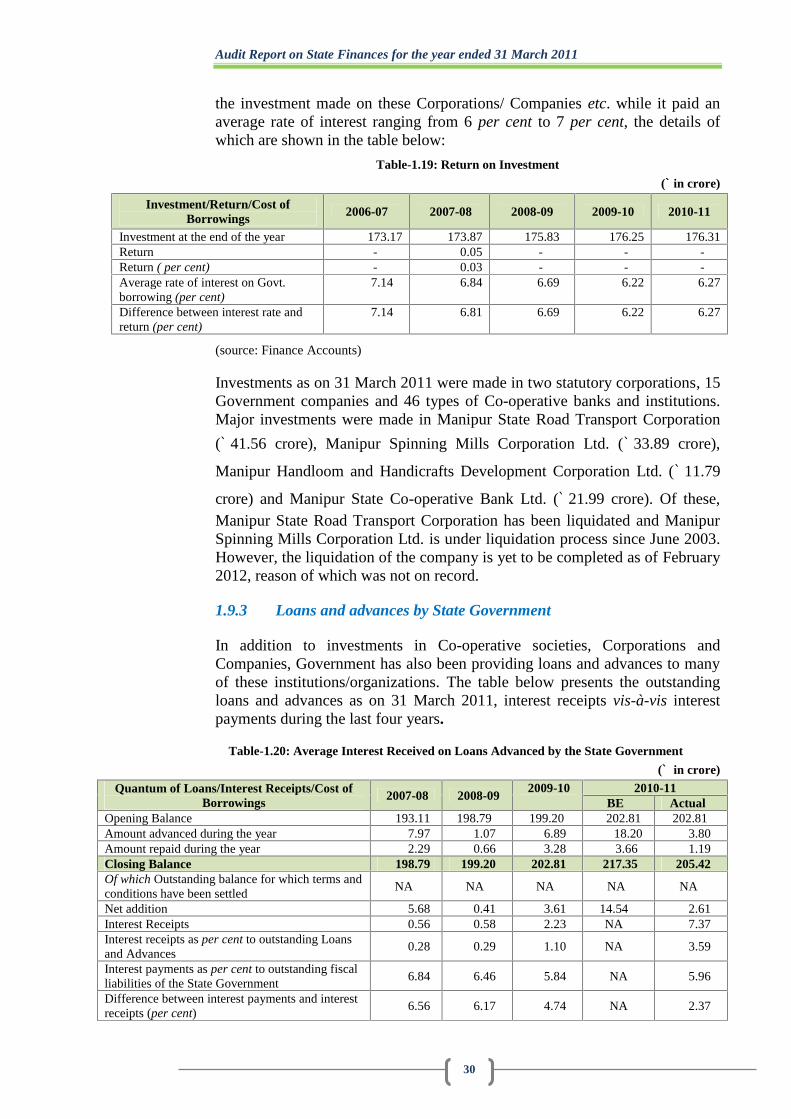
Audit Report on State Finances for the year ended 31 March 2011
30
the investment made on these Corporations/ Companies etc. while it paid anaverage rate of interest ranging from 6 per cent to 7 per cent, the details ofwhich are shown in the table below:
Table-1.19: Return on Investment
(` in crore)
Investment/Return/Cost ofBorrowings 2006-07 2007-08 2008-09 2009-10 2010-11
Investment at the end of the year 173.17 173.87 175.83 176.25 176.31Return - 0.05 - - -Return ( per cent) - 0.03 - - -Average rate of interest on Govt.borrowing (per cent)
7.14 6.84 6.69 6.22 6.27
Difference between interest rate andreturn (per cent)
7.14 6.81 6.69 6.22 6.27
(source: Finance Accounts)
Investments as on 31 March 2011 were made in two statutory corporations, 15Government companies and 46 types of Co-operative banks and institutions.Major investments were made in Manipur State Road Transport Corporation
(` 41.56 crore), Manipur Spinning Mills Corporation Ltd. (` 33.89 crore),
Manipur Handloom and Handicrafts Development Corporation Ltd. (` 11.79
crore) and Manipur State Co-operative Bank Ltd. (` 21.99 crore). Of these,Manipur State Road Transport Corporation has been liquidated and ManipurSpinning Mills Corporation Ltd. is under liquidation process since June 2003.However, the liquidation of the company is yet to be completed as of February2012, reason of which was not on record.
1.9.3 Loans and advances by State Government
In addition to investments in Co-operative societies, Corporations andCompanies, Government has also been providing loans and advances to manyof these institutions/organizations. The table below presents the outstandingloans and advances as on 31 March 2011, interest receipts vis-à-vis interestpayments during the last four years.
Table-1.20: Average Interest Received on Loans Advanced by the State Government
(` in crore)
Quantum of Loans/Interest Receipts/Cost ofBorrowings 2007-08 2008-09
2009-10 2010-11BE Actual
Opening Balance 193.11 198.79 199.20 202.81 202.81Amount advanced during the year 7.97 1.07 6.89 18.20 3.80Amount repaid during the year 2.29 0.66 3.28 3.66 1.19Closing Balance 198.79 199.20 202.81 217.35 205.42Of which Outstanding balance for which terms andconditions have been settled
NA NA NA NA NA
Net addition 5.68 0.41 3.61 14.54 2.61Interest Receipts 0.56 0.58 2.23 NA 7.37Interest receipts as per cent to outstanding Loansand Advances
0.28 0.29 1.10 NA 3.59
Interest payments as per cent to outstanding fiscalliabilities of the State Government
6.84 6.46 5.84 NA 5.96
Difference between interest payments and interestreceipts (per cent)
6.56 6.17 4.74 NA 2.37
Chapter I: Finances of the State Government
31
(source: Budget documents and Finance Accounts)
No budget provision for interest receipts on loans advanced was available inthe Budget documents.
Total amount of outstanding loans and advances as on 31 March 2011 was
` 205.42 crore. Interest received against these loans and advances improved
substantially from ` 2.23 crore in the previous year to ` 7.37 crore in 2010-11.
Against repayment of Loans/Advances of ` 1.19 crore, an amount of ` 3.80crore was advanced during 2010-11. As of March 2011, major recipients of
loans were for Other Social Security and Welfare Programmes (` 129.15
crore), Village and Small Industries (` 22.59 crore), Housing (` 18.13 crore)
and Co-operation (` 14.01 crore).
1.9.4 Cash balances and investment of cash balances
It is generally desirable that State’s flow of resources should match itsexpenditure obligations. However, to take care of any temporary mismatch inthe flow of resources and the expenditure obligations, a mechanism of Waysand Means Advances from RBI has been put in place. The operative limit forNormal Ways and Means Advances is reckoned on the three years average ofrevenue receipts and the operative limit for Special Ways and MeansAdvances is fixed by the RBI from time to time depending on the holding ofGovernment securities. The limit for Normal Ways and Means Advances has
been fixed (April 2006) at ` 60 crore while the limit of Special Ways andMeans Advances is revised by the RBI from time to time.
The State availed of Ways and Means Advance of ` 38.79 crore for seven days
in 2007-08 and paid an interest of ` three lakh. During the last three years(2008-11), the Government did not have to resort to Ways and MeansAdvances and Overdraft indicating a comfortable position of cash balances ofthe State.
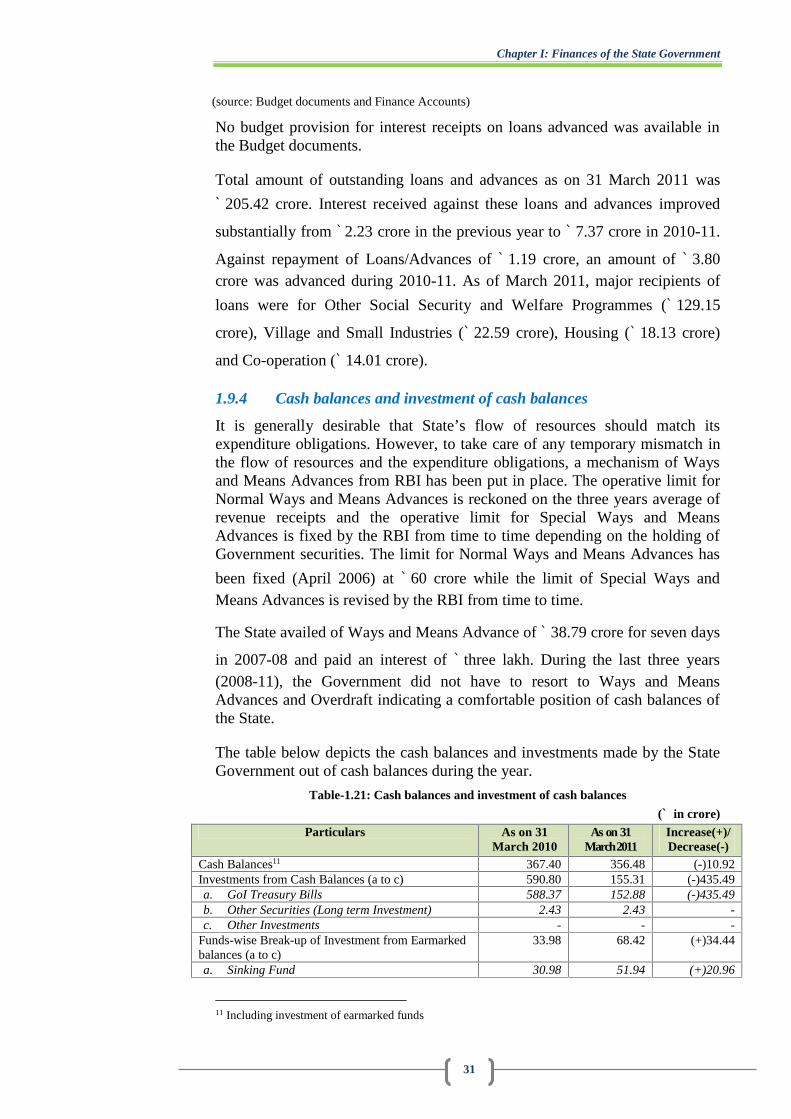
The table below depicts the cash balances and investments made by the StateGovernment out of cash balances during the year.
Table-1.21: Cash balances and investment of cash balances
(` in crore)
Particulars As on 31March 2010
As on 31March 2011
Increase(+)/Decrease(-)
Cash Balances11 367.40 356.48 (-)10.92Investments from Cash Balances (a to c) 590.80 155.31 (-)435.49a. GoI Treasury Bills 588.37 152.88 (-)435.49b. Other Securities (Long term Investment) 2.43 2.43 -c. Other Investments - - -
Funds-wise Break-up of Investment from Earmarkedbalances (a to c)
33.98 68.42 (+)34.44
a. Sinking Fund 30.98 51.94 (+)20.96
11 Including investment of earmarked funds

Audit Report on State Finances for the year ended 31 March 2011
32
b. Guarantee Redemption Fund 3.00 6.30 (+)3.30c. State Disaster Response Fund - 10.18 (+)10.18
Interest Realized on investment of cash balances 30.49 37.28 6.79(source: Finance Accounts)
The cash balances of the State Government at the end of current year
decreased by ` 10.92 crore from ` 367.40 crore in the previous year to ` 356.48crore in 2010-11. As of 31 March 2011, the State Government has invested
` 152.88 crore in GoI treasury bills and ` 2.43 crore in GoI securities (long
term security). During 2010-11, an interest of ` 37.28 crore was earned on
investment of cash balance. Further, the Government invested ` 68.42 crore inSinking fund/Guarantee redemption fund etc. as of March 2011.
1.10 Assets and liabilities
1.10.1 Growth and composition of assets and liabilities
In the existing Government accounting system, comprehensive accounting offixed assets like land and buildings owned by the Government is not done.However, the Government accounts do capture the financial liabilities of theGovernment and the assets created out of the expenditure incurred.Appendix 1.4 gives an abstract of such liabilities and the assets as on 31March 2011, compared with the corresponding position on 31 March 2010.While the liabilities in this Appendix consist mainly of internal borrowings,loans and advances from the GoI, receipts from the Public Account andReserve Funds, the assets comprise mainly the capital outlay and loans andadvances given by the State Government and cash balances.
The FRBM Act of the State has defined the total liabilities as “Total liabilitiesmeans the sum of the liabilities under the Consolidated Fund of the State, andthe Public Account of the State and also include borrowings by the publicsector undertakings and special purpose vehicles and other equivalentinstruments including guarantees where principal and/or interest are to beserviced out of the State budget”.
1.10.2 Fiscal liabilities
The trends in outstanding fiscal liabilities of the State are presented inAppendix 1.5. The composition of fiscal liabilities during the current year vis-à-vis the previous year are presented in Charts 1.9 and 1.10.
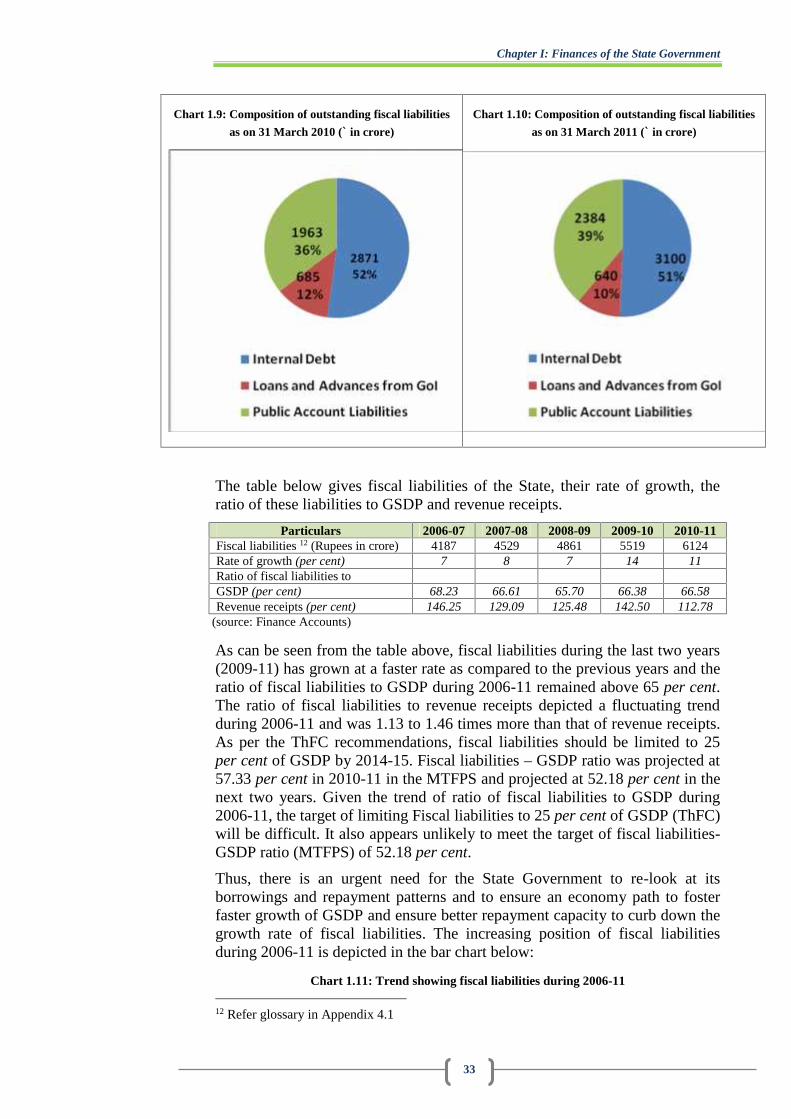
Chapter I: Finances of the State Government
33
Chart 1.9: Composition of outstanding fiscal liabilities
as on 31 March 2010 (` in crore)
Chart 1.10: Composition of outstanding fiscal liabilities
as on 31 March 2011 (` in crore)
The table below gives fiscal liabilities of the State, their rate of growth, theratio of these liabilities to GSDP and revenue receipts.
Particulars 2006-07 2007-08 2008-09 2009-10 2010-11Fiscal liabilities 12 (Rupees in crore) 4187 4529 4861 5519 6124Rate of growth (per cent) 7 8 7 14 11Ratio of fiscal liabilities toGSDP (per cent) 68.23 66.61 65.70 66.38 66.58Revenue receipts (per cent) 146.25 129.09 125.48 142.50 112.78
(source: Finance Accounts)
As can be seen from the table above, fiscal liabilities during the last two years(2009-11) has grown at a faster rate as compared to the previous years and theratio of fiscal liabilities to GSDP during 2006-11 remained above 65 per cent.The ratio of fiscal liabilities to revenue receipts depicted a fluctuating trendduring 2006-11 and was 1.13 to 1.46 times more than that of revenue receipts.As per the ThFC recommendations, fiscal liabilities should be limited to 25per cent of GSDP by 2014-15. Fiscal liabilities – GSDP ratio was projected at57.33 per cent in 2010-11 in the MTFPS and projected at 52.18 per cent in thenext two years. Given the trend of ratio of fiscal liabilities to GSDP during2006-11, the target of limiting Fiscal liabilities to 25 per cent of GSDP (ThFC)will be difficult. It also appears unlikely to meet the target of fiscal liabilities-GSDP ratio (MTFPS) of 52.18 per cent.
Thus, there is an urgent need for the State Government to re-look at itsborrowings and repayment patterns and to ensure an economy path to fosterfaster growth of GSDP and ensure better repayment capacity to curb down thegrowth rate of fiscal liabilities. The increasing position of fiscal liabilitiesduring 2006-11 is depicted in the bar chart below:
Chart 1.11: Trend showing fiscal liabilities during 2006-11
12 Refer glossary in Appendix 4.1
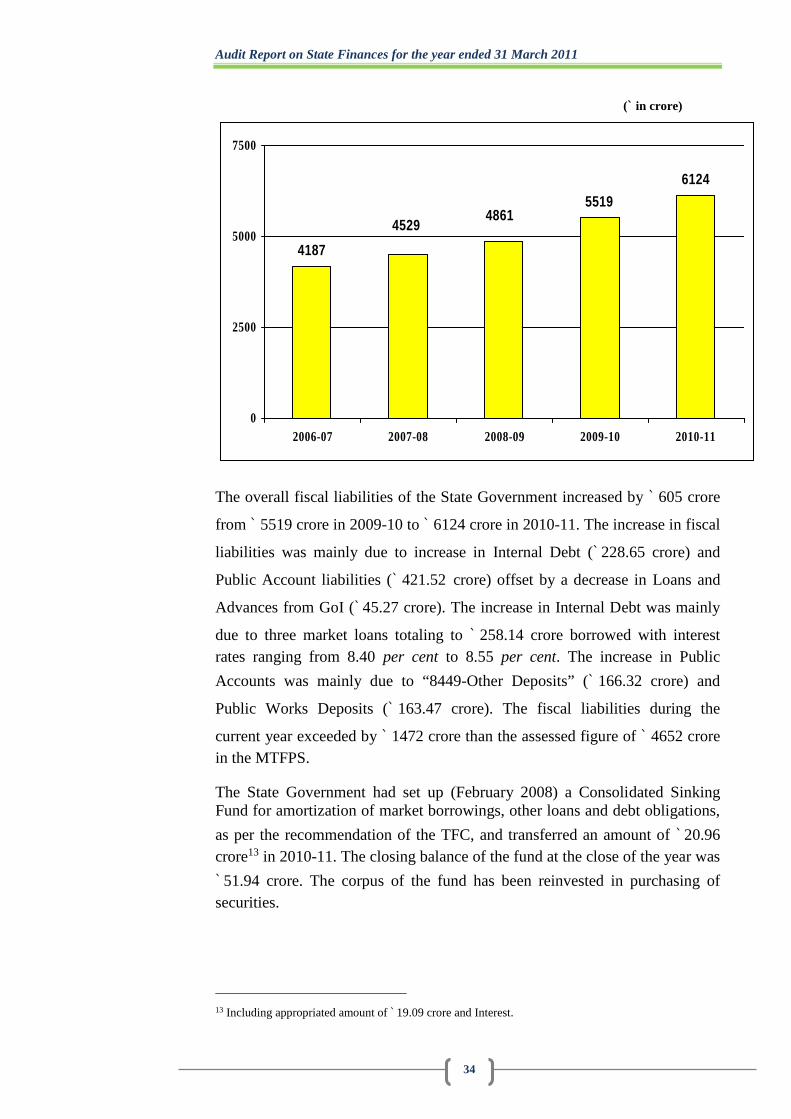
Audit Report on State Finances for the year ended 31 March 2011
34
(` in crore)
4187
55196124
48614529
0
2500
5000
7500
2006-07 2007-08 2008-09 2009-10 2010-11
The overall fiscal liabilities of the State Government increased by ` 605 crore
from ` 5519 crore in 2009-10 to ` 6124 crore in 2010-11. The increase in fiscal
liabilities was mainly due to increase in Internal Debt (` 228.65 crore) and
Public Account liabilities (` 421.52 crore) offset by a decrease in Loans and
Advances from GoI (` 45.27 crore). The increase in Internal Debt was mainly
due to three market loans totaling to ` 258.14 crore borrowed with interestrates ranging from 8.40 per cent to 8.55 per cent. The increase in Public
Accounts was mainly due to “8449-Other Deposits” (` 166.32 crore) and
Public Works Deposits (` 163.47 crore). The fiscal liabilities during the
current year exceeded by ` 1472 crore than the assessed figure of ` 4652 crorein the MTFPS.
The State Government had set up (February 2008) a Consolidated SinkingFund for amortization of market borrowings, other loans and debt obligations,
as per the recommendation of the TFC, and transferred an amount of ` 20.96crore13 in 2010-11. The closing balance of the fund at the close of the year was
` 51.94 crore. The corpus of the fund has been reinvested in purchasing ofsecurities.
13 Including appropriated amount of ` 19.09 crore and Interest.
Chapter I: Finances of the State Government
35
1.10.3 Status of guarantees – Contingent liabilities
Guarantees are liabilities contingent on the Consolidated Fund of the State incase of default by the borrower for whom the guarantee has been extended. Asper FRBM Act and the Manipur Ceiling on State Government Guarantee Act,2004, the total outstanding guarantees as of 1 April of any year shall notexceed thrice the State’s own tax revenue receipts of the second precedingyear.
The maximum amount for which guarantees were given by the State andoutstanding guarantees for the last three years is given in the table below:
Table-1.22: Guarantees given by the Government of Manipur
(` in crore)
Guarantees 2007-08 2008-09 2009-10 2010-11Maximum amount guaranteed 207 197 197 196Outstanding amount of guarantees 211 274 195 233Percentage of maximum amount guaranteed to totalrevenue receipts
5.90 5.09 5.09 3.61
(source: Finance Accounts)
The outstanding guarantee of ` 233 crore was kept within the limit of theFRBM Act ibid. No additional guarantee has been given by the StateGovernment in respect of loans raised by Statutory Corporations, Local bodiesand other institutions during 2010-11. As of 31 March 2011, the interest
amount (` 120.62 crore) has exceeded the principal amount (` 111.98 crore).The principal beneficiaries of outstanding loans were Planning and
Development Authority (` 120.63 crore), Khadi and Village Industries (` 31.48
crore) and Manipur Tribal Development Corporation Limited (` 21.17 crore).
The State Government had set up (February 2008) a guarantee redemptionfund to meet the contingent liabilities arising from such guarantees, as per the
recommendation of the TFC and transferred an amount of ` 3.30 crore14 during
2010-11. The closing balance of the fund at the close of the year was ` 6.30crore, which was reinvested on purchase of securities.
1.10.4 Off - budget borrowings
The State Government has not reported (February 2012) any off-budgetborrowings during 2010-11.
14 Including appropriated amount of ` 3 crore and interest

Audit Report on State Finances for the year ended 31 March 2011
36
1.11 Debt sustainability
Apart from the magnitude of debt of State Government, it is important toanalyze various indicators that determine the debt sustainability15of the State.This section assesses the sustainability of debt of the State Government interms of debt stabilization16; sufficiency of non-debt receipts17; net availabilityof borrowed funds18; burden of interest payments (measured by interestpayments to revenue receipts ratio) and maturity profile of State Governmentsecurities. The table below analyzes the debt sustainability of the Stateaccording to these indicators during 2006-11.
Table 1.23: Debt sustainability: Indicators and trends
(` in crore)
Indicators of debt sustainability 2006-07 2007-08 2008-09 2009-10 2010-11Debt stabilization(Quantum spread + Primary deficit)
(-) 250 397 303 (-) 57 37
Sufficiency of non-debt receipts (Resource gap) (-) 204 (+) 577 (-) 318 (-) 517 (+)164Net availability of borrowed funds (-) 7 42 32 336 241Burden of interest payments (IP/RR Ratio) 10.09 8.49 8.11 8.33 6.72
(source: Finance Accounts)
Despite the increase in the quantum of expenditure in 2010-11, the buoyancyin revenue collection had a positive impact in the debt scenario of theeconomy of the State and to some extent reversed deteriorating debt scenario
experienced in the previous year. As compared to primary deficit of ` 410
crore in 2009-10, the primary deficit in 2010-11 decreased to ` 204 crore,which had resulted in positive indicators that the debt was again beingstabilized in the current year.
The incremental total/aggregate expenditure (` 1391 crore) was also lower than
the incremental non-debt receipt (` 1555 crore). Thus, increment oftotal/aggregate expenditure in the current year did not aggravate the fiscaldeficit and primary deficit position of the State in 2010-11 as it did in theprevious year.
During 2010-11 against debt receipt of ` 1531 crore, debt redemption and
interest payment was ` 1290 crore, leaving borrowed funds of ` 241 crore onlyfor purposes other than debt redemption. Thus, 84 per cent of the borrowedfund was being utilized to service the past liabilities of the State. With theincrease in revenue receipts in the current year, the ratio of interest payment–revenue receipts have declined to 6.72 per cent in 2010-11 from 8.33 per centin the previous year; reducing the burden of interest payment on revenuereceipts by about 2 per cent in the current year.
15 Refer glossary in Appendix 4.116 Refer glossary in Appendix 4.117 Refer glossary in Appendix 4.118 Refer glossary in Appendix 4.1
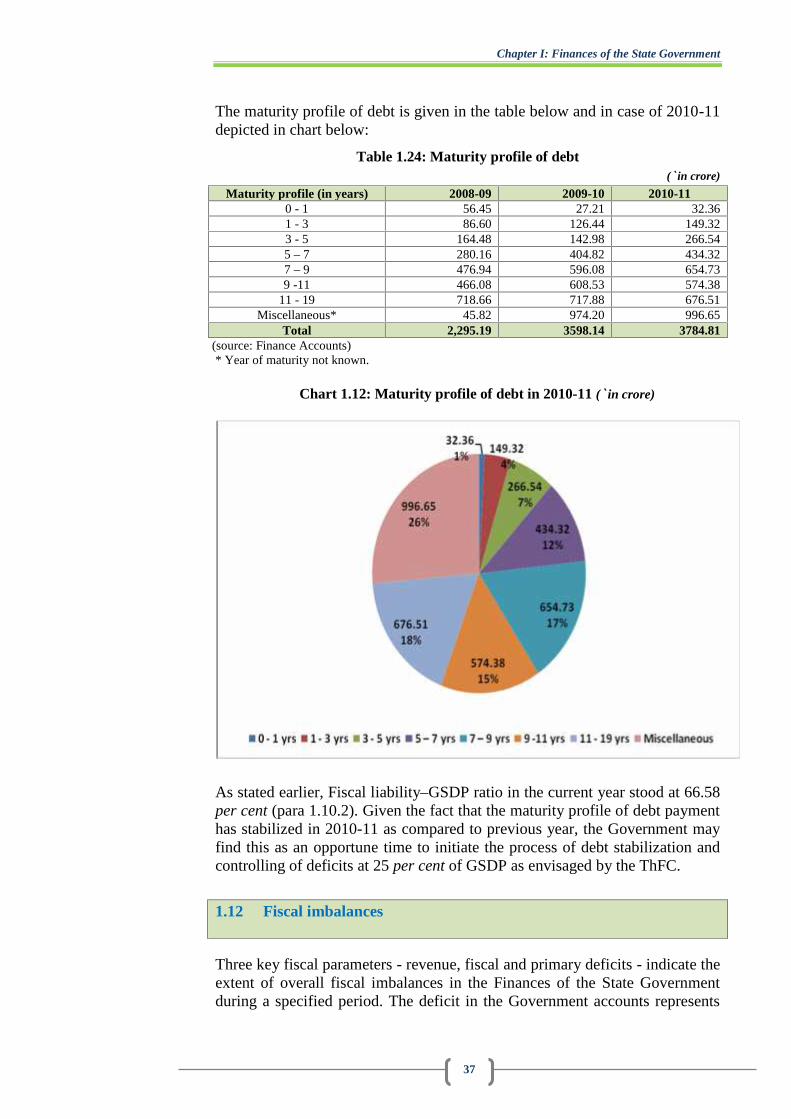
Chapter I: Finances of the State Government
37
The maturity profile of debt is given in the table below and in case of 2010-11depicted in chart below:
Table 1.24: Maturity profile of debt(` in crore)
Maturity profile (in years) 2008-09 2009-10 2010-110 - 1 56.45 27.21 32.361 - 3 86.60 126.44 149.323 - 5 164.48 142.98 266.545 – 7 280.16 404.82 434.327 – 9 476.94 596.08 654.739 -11 466.08 608.53 574.38
11 - 19 718.66 717.88 676.51Miscellaneous* 45.82 974.20 996.65
Total 2,295.19 3598.14 3784.81(source: Finance Accounts)* Year of maturity not known.
Chart 1.12: Maturity profile of debt in 2010-11 (` in crore)
As stated earlier, Fiscal liability–GSDP ratio in the current year stood at 66.58per cent (para 1.10.2). Given the fact that the maturity profile of debt paymenthas stabilized in 2010-11 as compared to previous year, the Government mayfind this as an opportune time to initiate the process of debt stabilization andcontrolling of deficits at 25 per cent of GSDP as envisaged by the ThFC.
1.12 Fiscal imbalances
Three key fiscal parameters - revenue, fiscal and primary deficits - indicate theextent of overall fiscal imbalances in the Finances of the State Governmentduring a specified period. The deficit in the Government accounts represents

Audit Report on State Finances for the year ended 31 March 2011
38
the gap between its receipts and expenditure. The nature of deficit is anindicator of the prudence of fiscal management of the Government. Further,the ways in which the deficit is financed and the resources raised are appliedare important pointers to its fiscal health. This section presents trends, nature,magnitude and the manner of financing these deficits and also the assessmentof actual levels of revenue and Fiscal deficits vis-à-vis targets set under FRBMAct/Rules for the financial year 2010-11.
1.12.1 Trends in deficits
The chart below presents the trends in deficit indicators over the period2006-11:
Chart 1.13: Trends of deficit/surplus indicators(` in crore)
448
1216 1250
-475
102
-217
-733-569
-186
400
98
1352
859
-410 -204
-1000
-500
0
500
1000
1500
2006-07 2007-08 2008-09 2009-10 2010-11
Revenue Deficit Fiscal Deficit Primary Deficit
The significant improvement in revenue surplus by ` 493 crore in 2010-11over the previous year served as harbinger in controlling the harsh financialdeficit situation experienced by the State in the previous year. Despite increase
of ` 1391 crore in total expenditure in 2010-11 over the previous year, bothfiscal deficit and primary deficit were restrained as a result of improvement of
revenue receipts. While fiscal deficit decreased by ` 164 crore, primary deficit
had decreased by ` 206 crore over the previous year. Interest payment (` 365
crore) alone accounted for 64 per cent of the fiscal deficit (` 569 crore) and assuch obligations of past liabilities formed major portion of the fiscal deficit in
the current year. As interest bearing borrowing19 in 2010-11 was ` 298.40
crore as compared to ` 519.89 crore in the previous year, this may easy outinterest burden in coming years; provided such a trend is followed in the
19 Includes only Internal debt and Loans and Advances from Central Government
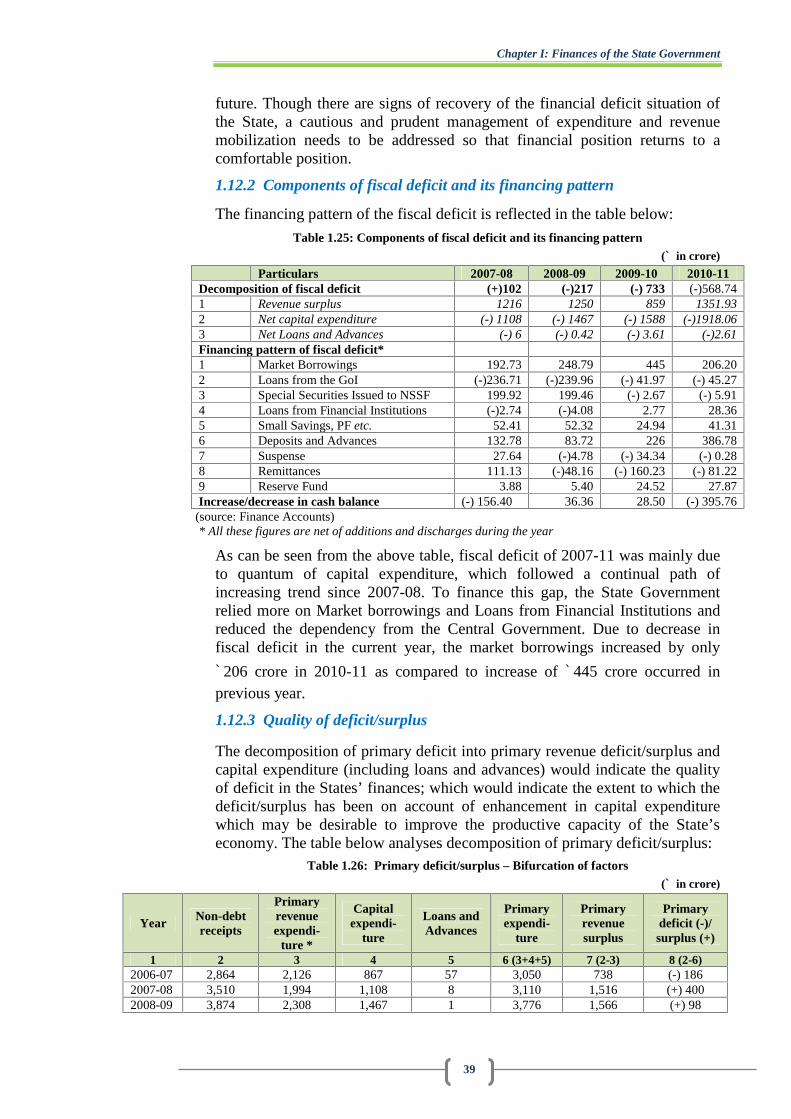
Chapter I: Finances of the State Government
39
future. Though there are signs of recovery of the financial deficit situation ofthe State, a cautious and prudent management of expenditure and revenuemobilization needs to be addressed so that financial position returns to acomfortable position.
1.12.2 Components of fiscal deficit and its financing pattern
The financing pattern of the fiscal deficit is reflected in the table below:
Table 1.25: Components of fiscal deficit and its financing pattern(` in crore)
Particulars 2007-08 2008-09 2009-10 2010-11Decomposition of fiscal deficit (+)102 (-)217 (-) 733 (-)568.741 Revenue surplus 1216 1250 859 1351.932 Net capital expenditure (-) 1108 (-) 1467 (-) 1588 (-)1918.063 Net Loans and Advances (-) 6 (-) 0.42 (-) 3.61 (-)2.61Financing pattern of fiscal deficit*1 Market Borrowings 192.73 248.79 445 206.202 Loans from the GoI (-)236.71 (-)239.96 (-) 41.97 (-) 45.273 Special Securities Issued to NSSF 199.92 199.46 (-) 2.67 (-) 5.914 Loans from Financial Institutions (-)2.74 (-)4.08 2.77 28.365 Small Savings, PF etc. 52.41 52.32 24.94 41.316 Deposits and Advances 132.78 83.72 226 386.787 Suspense 27.64 (-)4.78 (-) 34.34 (-) 0.288 Remittances 111.13 (-)48.16 (-) 160.23 (-) 81.229 Reserve Fund 3.88 5.40 24.52 27.87Increase/decrease in cash balance (-) 156.40 36.36 28.50 (-) 395.76
(source: Finance Accounts)* All these figures are net of additions and discharges during the year
As can be seen from the above table, fiscal deficit of 2007-11 was mainly dueto quantum of capital expenditure, which followed a continual path ofincreasing trend since 2007-08. To finance this gap, the State Governmentrelied more on Market borrowings and Loans from Financial Institutions andreduced the dependency from the Central Government. Due to decrease infiscal deficit in the current year, the market borrowings increased by only
` 206 crore in 2010-11 as compared to increase of ` 445 crore occurred inprevious year.
1.12.3 Quality of deficit/surplus
The decomposition of primary deficit into primary revenue deficit/surplus andcapital expenditure (including loans and advances) would indicate the qualityof deficit in the States’ finances; which would indicate the extent to which thedeficit/surplus has been on account of enhancement in capital expenditurewhich may be desirable to improve the productive capacity of the State’seconomy. The table below analyses decomposition of primary deficit/surplus:
Table 1.26: Primary deficit/surplus – Bifurcation of factors(` in crore)
Year Non-debtreceipts
Primaryrevenueexpendi-
ture *
Capitalexpendi-
ture
Loans andAdvances
Primaryexpendi-
ture
Primaryrevenuesurplus
Primarydeficit (-)/surplus (+)
1 2 3 4 5 6 (3+4+5) 7 (2-3) 8 (2-6)2006-07 2,864 2,126 867 57 3,050 738 (-) 1862007-08 3,510 1,994 1,108 8 3,110 1,516 (+) 4002008-09 3,874 2,308 1,467 1 3,776 1,566 (+) 98
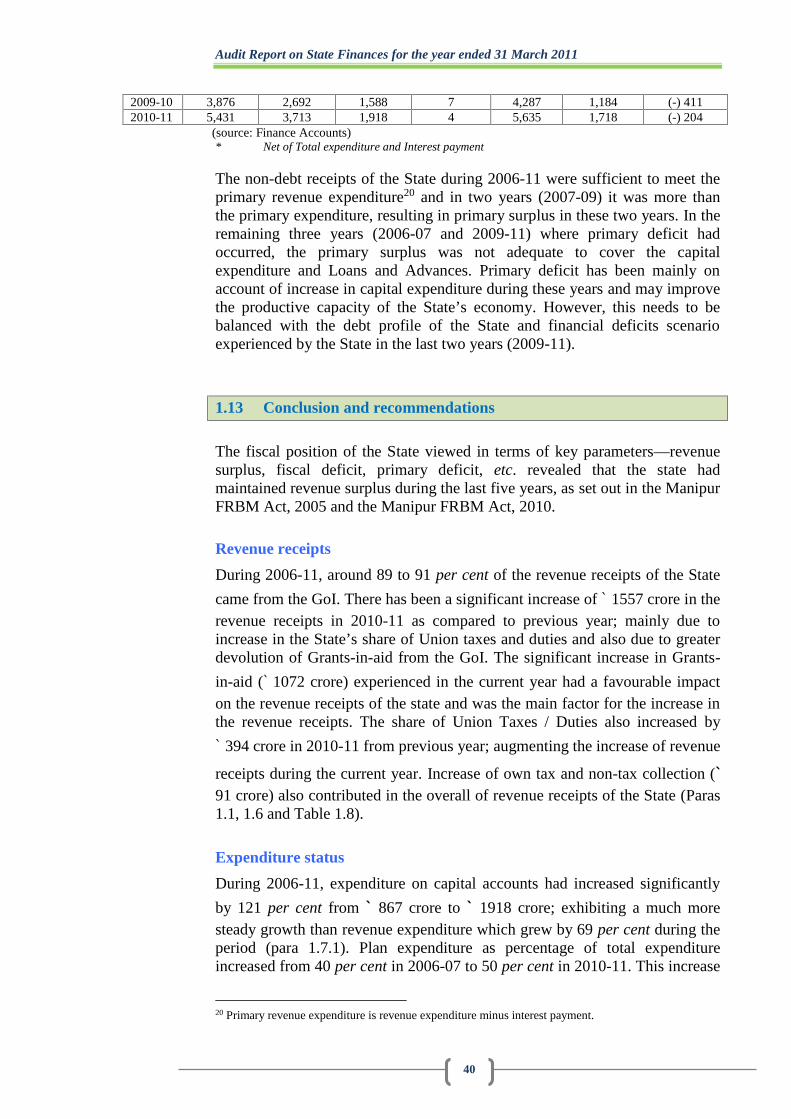
Audit Report on State Finances for the year ended 31 March 2011
40
2009-10 3,876 2,692 1,588 7 4,287 1,184 (-) 4112010-11 5,431 3,713 1,918 4 5,635 1,718 (-) 204
(source: Finance Accounts)* Net of Total expenditure and Interest payment
The non-debt receipts of the State during 2006-11 were sufficient to meet theprimary revenue expenditure20 and in two years (2007-09) it was more thanthe primary expenditure, resulting in primary surplus in these two years. In theremaining three years (2006-07 and 2009-11) where primary deficit hadoccurred, the primary surplus was not adequate to cover the capitalexpenditure and Loans and Advances. Primary deficit has been mainly onaccount of increase in capital expenditure during these years and may improvethe productive capacity of the State’s economy. However, this needs to bebalanced with the debt profile of the State and financial deficits scenarioexperienced by the State in the last two years (2009-11).
1.13 Conclusion and recommendations
The fiscal position of the State viewed in terms of key parameters—revenuesurplus, fiscal deficit, primary deficit, etc. revealed that the state hadmaintained revenue surplus during the last five years, as set out in the ManipurFRBM Act, 2005 and the Manipur FRBM Act, 2010.
Revenue receipts
During 2006-11, around 89 to 91 per cent of the revenue receipts of the State
came from the GoI. There has been a significant increase of ` 1557 crore in therevenue receipts in 2010-11 as compared to previous year; mainly due toincrease in the State’s share of Union taxes and duties and also due to greaterdevolution of Grants-in-aid from the GoI. The significant increase in Grants-
in-aid (` 1072 crore) experienced in the current year had a favourable impacton the revenue receipts of the state and was the main factor for the increase inthe revenue receipts. The share of Union Taxes / Duties also increased by
` 394 crore in 2010-11 from previous year; augmenting the increase of revenue
receipts during the current year. Increase of own tax and non-tax collection (`91 crore) also contributed in the overall of revenue receipts of the State (Paras1.1, 1.6 and Table 1.8).
Expenditure status
During 2006-11, expenditure on capital accounts had increased significantly
by 121 per cent from ` 867 crore to ` 1918 crore; exhibiting a much moresteady growth than revenue expenditure which grew by 69 per cent during theperiod (para 1.7.1). Plan expenditure as percentage of total expenditureincreased from 40 per cent in 2006-07 to 50 per cent in 2010-11. This increase
20 Primary revenue expenditure is revenue expenditure minus interest payment.
Chapter I: Finances of the State Government
41
was at the expense of non-plan expenditure which exhibited a correspondingdecline in trend during 2006-11 (para 1.7.1).
A similar trend was also noticed in terms of expenditure by activities, and wasorienting more towards developmental activities of Social Services andEconomic Services. However, NPRE continued to exceed the limits set inMTFPS/budget/ThFC, and therefore should remain a focal point of attentionof the Government (para 1.7.1).
Salaries expenditure alone accounted for more than 31 per cent of revenuereceipts of the State during the year. The non-plan salary expenditure wasmore than the projection made by the ThFC (para 1.7.2).
Fiscal position, fiscal liabilities and sustainability of debt
During 2010-11, due to an increase in the devolution of Grants-in-aid from theCentral Government and share of taxes and duties, the revenue surplus
increased by ` 493 crore. As a result of the significant increase in revenuesurplus, the State Government was able to restrain both fiscal deficit andprimary deficit, despite increase in total expenditure (para 1.12.1). At 6.18 percent of GSDP, the fiscal deficit is still way off the mark of the ThFC target tolimit the ratio at 3.5 per cent of GSDP by 2012-13 and at 3 per cent thereafter.As such this fiscal parameter would need special focus of the StateGovernment if the target of ThFC is to be achieved (para 1.2).
Fiscal liabilities have been increasing during the last five years, and haveincreased at a faster rate during the last two years (2009-11) as compared tothe previous years. The fiscal liabilities during the current year exceeded by
` 1472 crore than the assessed figure of ` 4652 crore in the MTFPS (Para1.10.2). The incremental total expenditure was also lower than the incrementalnon-debt receipt, and thus did not aggravate the fiscal deficit and primarydeficit position of the State in 2010-11 as it did in the previous year (para1.11). Though there are signs of recovery of the financial deficit situation ofthe State, a cautious and prudent management of expenditure and revenuemobilization needs to be addressed so that financial position returns to acomfortable position (para 1.12.1).

37
CHAPTER IIFINANCIAL MANAGEMENT AND BUDGETARY CONTROL
2.1 Introduction
(A) The chapter outlines the Manipur Government’s financialaccountability and budgetary practices through audit of AppropriationAccounts. Audit of appropriations seeks to ascertain whether the expenditureactually incurred under various Grants is within the authorization given underthe Appropriation Act and that the expenditure required to be charged underthe provisions of the constitution is so charged. It also ascertains whether theexpenditure so incurred is in conformity with the law, relevant rules,regulations and instructions.
(B) Appropriation Accounts are accounts of the expenditure, voted andcharged, of the Government for each financial year compared with theamounts of the voted grants and appropriations charged for different purposesas specified in the schedules appended to the Appropriation Acts. TheseAccounts list the original budget estimates, supplementary grants, surrendersand re-appropriations distinctly and indicate actual capital and revenueexpenditure on various specified services vis-à-vis those authorized by theAppropriation Act in respect of both charged and voted items of budget.Appropriation Accounts thus control document facilitating management offinances and monitoring of budgetary provisions and are thereforecomplementary to Finance Accounts.
2.2 Summary of Appropriation Accounts
The summarized position of actual expenditure during 2010-11 against 53Grants/Appropriations (50 Grants and three Appropriations) is indicated in thetable below:
Table 2.1: Summarized position of Actual Expenditure vis-à-visOriginal/Supplementary provisions
(` in crore)
Nature ofexpenditure
Original grant/Appropriation
Supplementarygrant/
AppropriationTotal
Actualexpenditure
Saving (-)/Excess (+)
Voted I Revenue 3687.86 430.32 4118.18 3715.88 (-) 402.30II Capital 1773.06 396.24 2169.30 1920.08 (-) 249.22III Loans and
Advances18.20 - 18.20 3.80 (-) 14.40
Sub-total Voted 5479.12 826.56 6305.68 5639.76 (-) 665.92Charged IV Revenue 373.86 11.55 385.41 370.12 (-) 15.29
V Capital - - - - -VI Public Debt-
Repayment112.95 - 112.95 115.02 (+) 2.07
Sub-total Charged 486.81 11.55 498.36 485.14 (-) 13.22Appropriation to ContingencyFund
- - - - -
Grand Total 5965.93 838.11 6804.04 6124.90 (-) 679.14
The overall saving of ` 679.14 crore was the result of saving of ` 741.56 crorein 49 Grants and three Appropriations under Revenue Section, 25 Grants
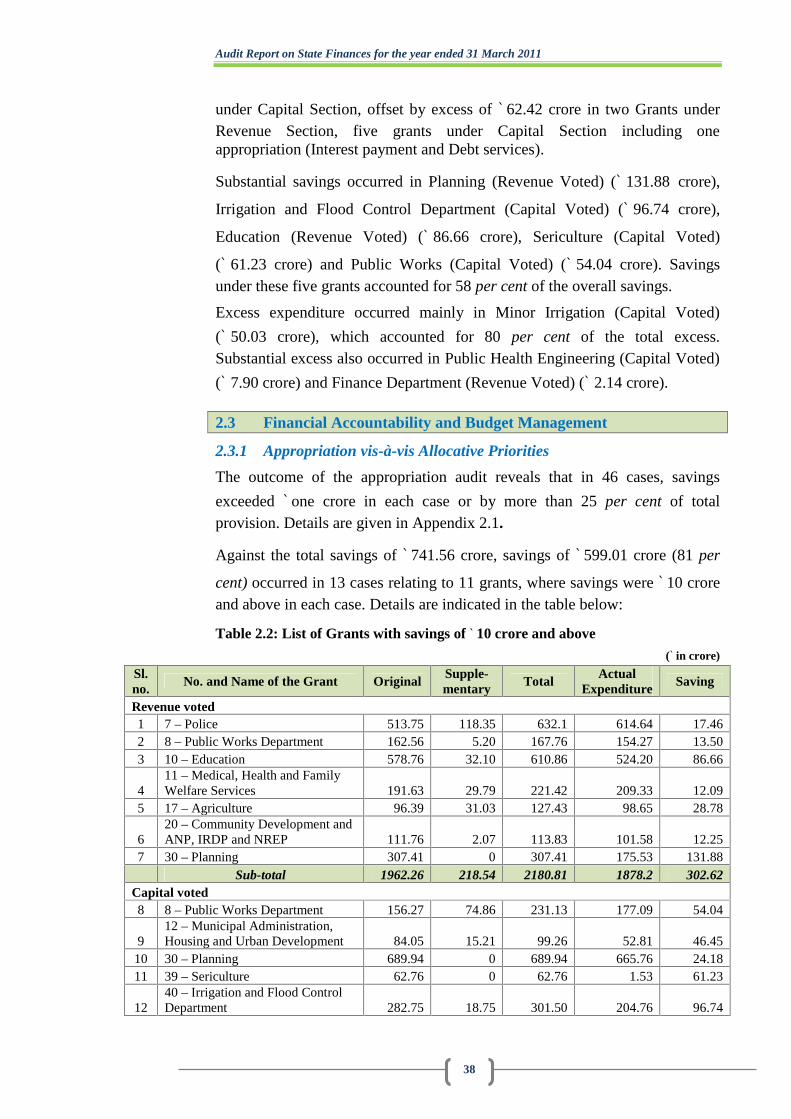
Audit Report on State Finances for the year ended 31 March 2011
38
under Capital Section, offset by excess of ` 62.42 crore in two Grants underRevenue Section, five grants under Capital Section including oneappropriation (Interest payment and Debt services).
Substantial savings occurred in Planning (Revenue Voted) (` 131.88 crore),
Irrigation and Flood Control Department (Capital Voted) (` 96.74 crore),
Education (Revenue Voted) (` 86.66 crore), Sericulture (Capital Voted)
(` 61.23 crore) and Public Works (Capital Voted) (` 54.04 crore). Savingsunder these five grants accounted for 58 per cent of the overall savings.
Excess expenditure occurred mainly in Minor Irrigation (Capital Voted)
(` 50.03 crore), which accounted for 80 per cent of the total excess.Substantial excess also occurred in Public Health Engineering (Capital Voted)
(` 7.90 crore) and Finance Department (Revenue Voted) (` 2.14 crore).
2.3 Financial Accountability and Budget Management
2.3.1 Appropriation vis-à-vis Allocative Priorities
The outcome of the appropriation audit reveals that in 46 cases, savings
exceeded ` one crore in each case or by more than 25 per cent of totalprovision. Details are given in Appendix 2.1.
Against the total savings of ` 741.56 crore, savings of ` 599.01 crore (81 per
cent) occurred in 13 cases relating to 11 grants, where savings were ` 10 croreand above in each case. Details are indicated in the table below:
Table 2.2: List of Grants with savings of ` 10 crore and above
(` in crore)
Sl.no.
No. and Name of the Grant OriginalSupple-mentary
TotalActual
ExpenditureSaving
Revenue voted1 7 – Police 513.75 118.35 632.1 614.64 17.462 8 – Public Works Department 162.56 5.20 167.76 154.27 13.503 10 – Education 578.76 32.10 610.86 524.20 86.66
411 – Medical, Health and FamilyWelfare Services 191.63 29.79 221.42 209.33 12.09
5 17 – Agriculture 96.39 31.03 127.43 98.65 28.78
620 – Community Development andANP, IRDP and NREP 111.76 2.07 113.83 101.58 12.25
7 30 – Planning 307.41 0 307.41 175.53 131.88Sub-total 1962.26 218.54 2180.81 1878.2 302.62
Capital voted8 8 – Public Works Department 156.27 74.86 231.13 177.09 54.04
912 – Municipal Administration,Housing and Urban Development 84.05 15.21 99.26 52.81 46.45
10 30 – Planning 689.94 0 689.94 665.76 24.1811 39 – Sericulture 62.76 0 62.76 1.53 61.23
1240 – Irrigation and Flood ControlDepartment 282.75 18.75 301.50 204.76 96.74
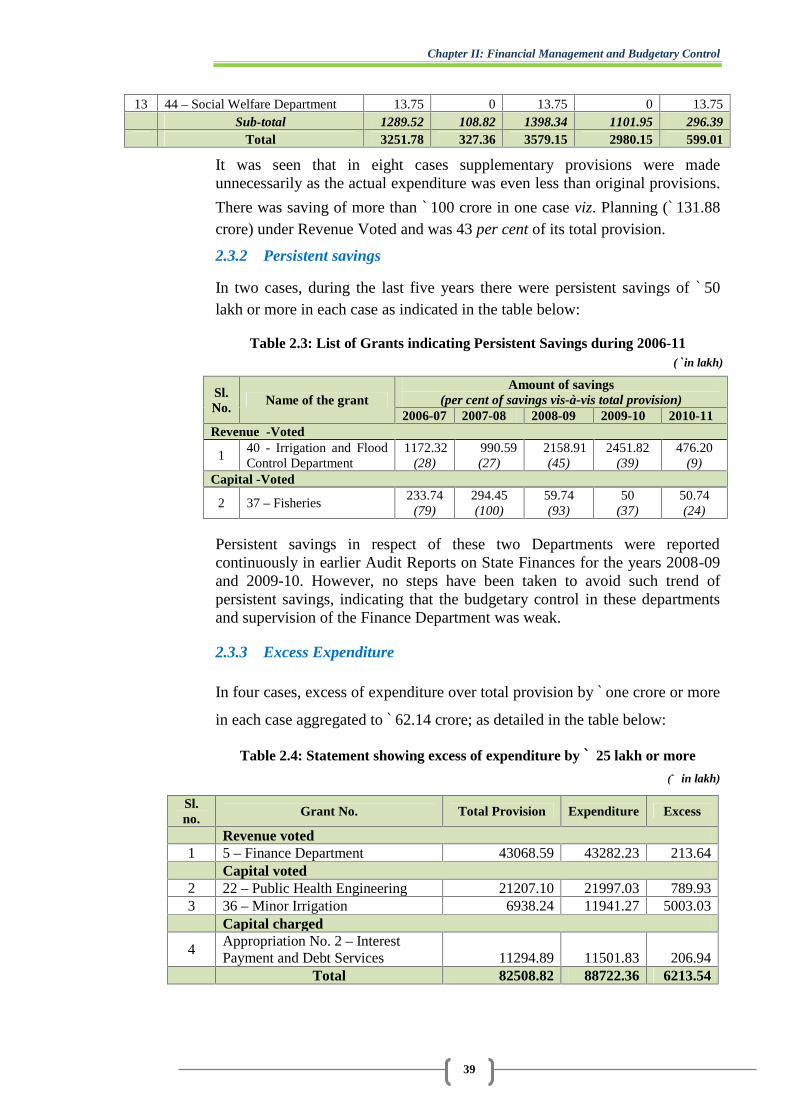
Chapter II: Financial Management and Budgetary Control
39
13 44 – Social Welfare Department 13.75 0 13.75 0 13.75Sub-total 1289.52 108.82 1398.34 1101.95 296.39
Total 3251.78 327.36 3579.15 2980.15 599.01
It was seen that in eight cases supplementary provisions were madeunnecessarily as the actual expenditure was even less than original provisions.
There was saving of more than ` 100 crore in one case viz. Planning (` 131.88crore) under Revenue Voted and was 43 per cent of its total provision.
2.3.2 Persistent savings
In two cases, during the last five years there were persistent savings of ` 50lakh or more in each case as indicated in the table below:
Table 2.3: List of Grants indicating Persistent Savings during 2006-11(` in lakh)
Sl.No.
Name of the grantAmount of savings
(per cent of savings vis-à-vis total provision)2006-07 2007-08 2008-09 2009-10 2010-11
Revenue -Voted
140 - Irrigation and FloodControl Department
1172.32(28)
990.59(27)
2158.91(45)
2451.82(39)
476.20(9)
Capital -Voted
2 37 – Fisheries233.74
(79)294.45(100)
59.74(93)
50(37)
50.74(24)
Persistent savings in respect of these two Departments were reportedcontinuously in earlier Audit Reports on State Finances for the years 2008-09and 2009-10. However, no steps have been taken to avoid such trend ofpersistent savings, indicating that the budgetary control in these departmentsand supervision of the Finance Department was weak.
2.3.3 Excess Expenditure
In four cases, excess of expenditure over total provision by ` one crore or more
in each case aggregated to ` 62.14 crore; as detailed in the table below:
Table 2.4: Statement showing excess of expenditure by ` 25 lakh or more
(` in lakh)
Sl.no.
Grant No. Total Provision Expenditure Excess
Revenue voted1 5 – Finance Department 43068.59 43282.23 213.64
Capital voted2 22 – Public Health Engineering 21207.10 21997.03 789.933 36 – Minor Irrigation 6938.24 11941.27 5003.03
Capital charged
4Appropriation No. 2 – InterestPayment and Debt Services 11294.89 11501.83 206.94
Total 82508.82 88722.36 6213.54
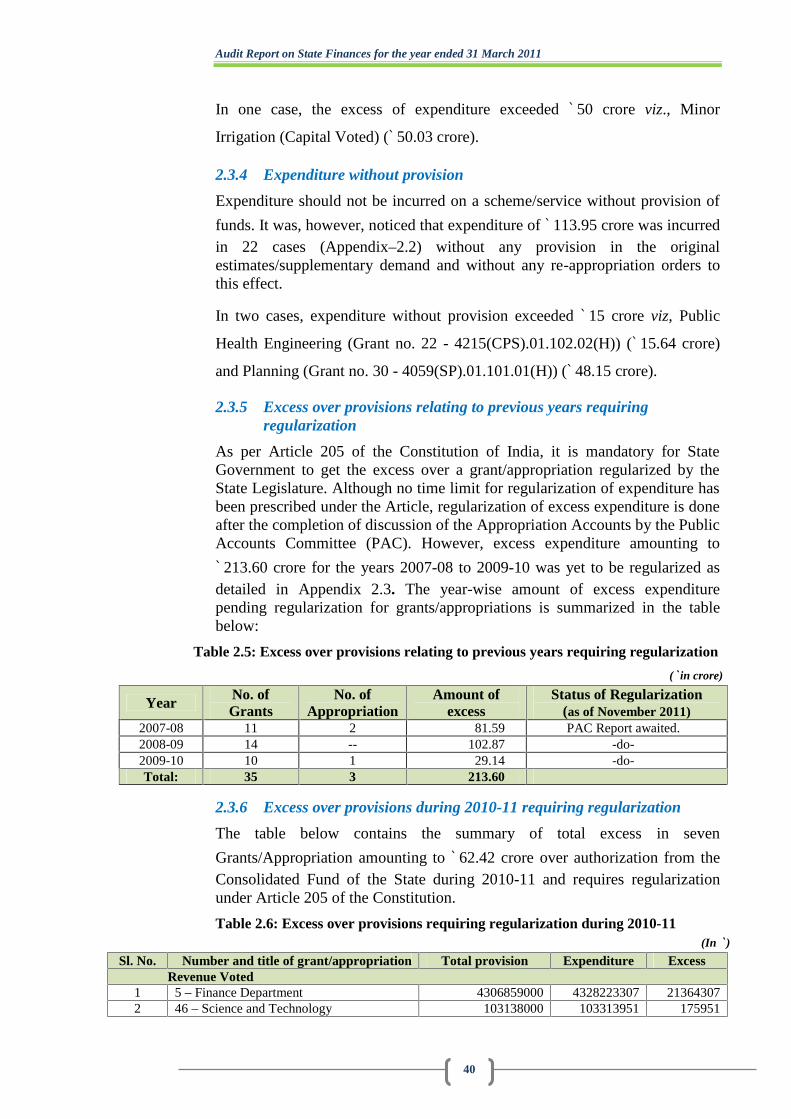
Audit Report on State Finances for the year ended 31 March 2011
40
In one case, the excess of expenditure exceeded ` 50 crore viz., Minor
Irrigation (Capital Voted) (` 50.03 crore).
2.3.4 Expenditure without provision
Expenditure should not be incurred on a scheme/service without provision of
funds. It was, however, noticed that expenditure of ` 113.95 crore was incurredin 22 cases (Appendix–2.2) without any provision in the originalestimates/supplementary demand and without any re-appropriation orders tothis effect.
In two cases, expenditure without provision exceeded ` 15 crore viz, Public
Health Engineering (Grant no. 22 - 4215(CPS).01.102.02(H)) (` 15.64 crore)
and Planning (Grant no. 30 - 4059(SP).01.101.01(H)) (` 48.15 crore).
2.3.5 Excess over provisions relating to previous years requiringregularization
As per Article 205 of the Constitution of India, it is mandatory for StateGovernment to get the excess over a grant/appropriation regularized by theState Legislature. Although no time limit for regularization of expenditure hasbeen prescribed under the Article, regularization of excess expenditure is doneafter the completion of discussion of the Appropriation Accounts by the PublicAccounts Committee (PAC). However, excess expenditure amounting to
` 213.60 crore for the years 2007-08 to 2009-10 was yet to be regularized asdetailed in Appendix 2.3. The year-wise amount of excess expenditurepending regularization for grants/appropriations is summarized in the tablebelow:
Table 2.5: Excess over provisions relating to previous years requiring regularization
(` in crore)
Year No. ofGrants
No. ofAppropriation
Amount ofexcess
Status of Regularization(as of November 2011)
2007-08 11 2 81.59 PAC Report awaited.2008-09 14 -- 102.87 -do-2009-10 10 1 29.14 -do-Total: 35 3 213.60
2.3.6 Excess over provisions during 2010-11 requiring regularization
The table below contains the summary of total excess in seven
Grants/Appropriation amounting to ` 62.42 crore over authorization from theConsolidated Fund of the State during 2010-11 and requires regularizationunder Article 205 of the Constitution.
Table 2.6: Excess over provisions requiring regularization during 2010-11(In ` )
Sl. No. Number and title of grant/appropriation Total provision Expenditure ExcessRevenue Voted
1 5 – Finance Department 4306859000 4328223307 213643072 46 – Science and Technology 103138000 103313951 175951
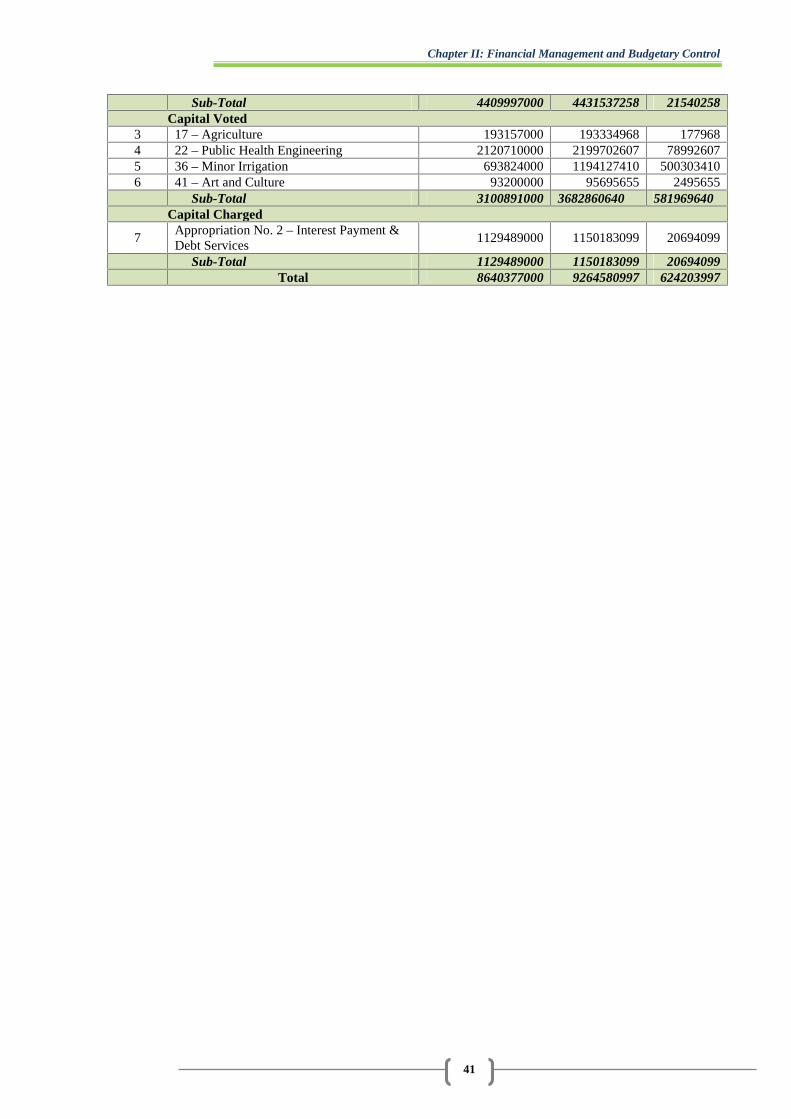
Chapter II: Financial Management and Budgetary Control
41
Sub-Total 4409997000 4431537258 21540258Capital Voted
3 17 – Agriculture 193157000 193334968 1779684 22 – Public Health Engineering 2120710000 2199702607 789926075 36 – Minor Irrigation 693824000 1194127410 5003034106 41 – Art and Culture 93200000 95695655 2495655
Sub-Total 3100891000 3682860640 581969640Capital Charged
7Appropriation No. 2 – Interest Payment &Debt Services
1129489000 1150183099 20694099
Sub-Total 1129489000 1150183099 20694099Total 8640377000 9264580997 624203997
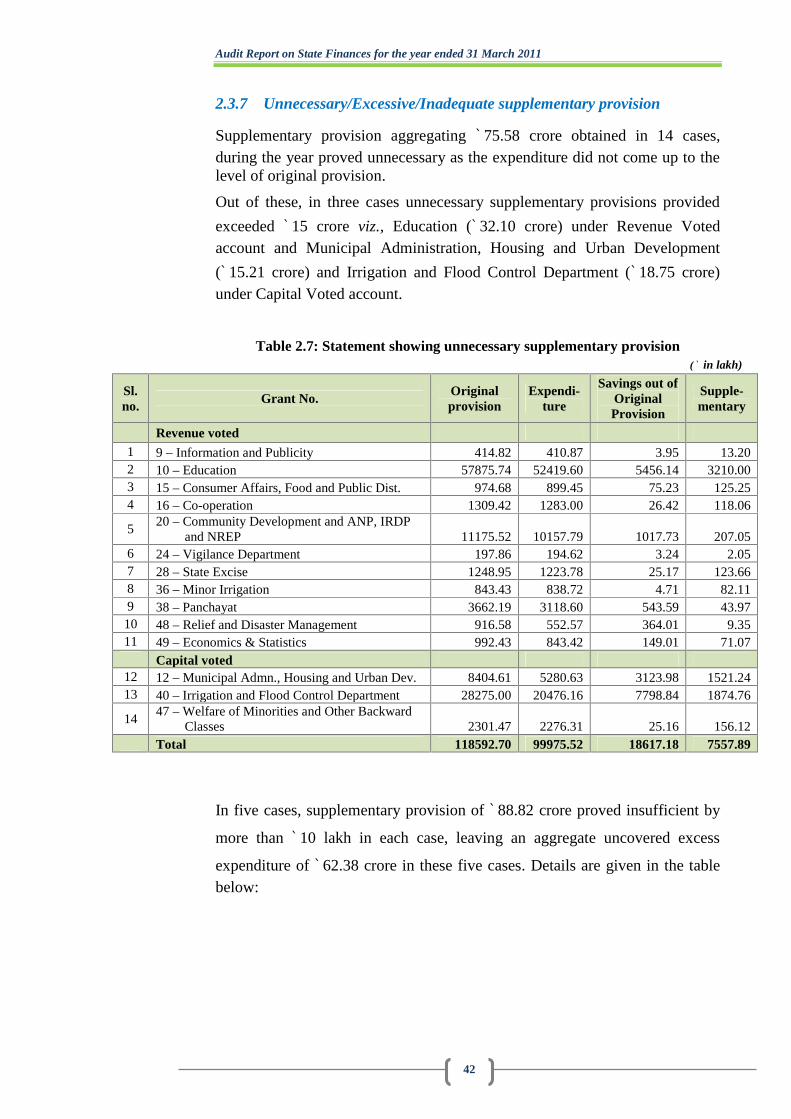
Audit Report on State Finances for the year ended 31 March 2011
42
2.3.7 Unnecessary/Excessive/Inadequate supplementary provision
Supplementary provision aggregating ` 75.58 crore obtained in 14 cases,during the year proved unnecessary as the expenditure did not come up to thelevel of original provision.
Out of these, in three cases unnecessary supplementary provisions provided
exceeded ` 15 crore viz., Education (` 32.10 crore) under Revenue Votedaccount and Municipal Administration, Housing and Urban Development
(` 15.21 crore) and Irrigation and Flood Control Department (` 18.75 crore)under Capital Voted account.
Table 2.7: Statement showing unnecessary supplementary provision(` in lakh)
Sl.no.
Grant No.Originalprovision
Expendi-ture
Savings out ofOriginalProvision
Supple-mentary
Revenue voted1 9 – Information and Publicity 414.82 410.87 3.95 13.202 10 – Education 57875.74 52419.60 5456.14 3210.003 15 – Consumer Affairs, Food and Public Dist. 974.68 899.45 75.23 125.254 16 – Co-operation 1309.42 1283.00 26.42 118.06
520 – Community Development and ANP, IRDP
and NREP 11175.52 10157.79 1017.73 207.056 24 – Vigilance Department 197.86 194.62 3.24 2.057 28 – State Excise 1248.95 1223.78 25.17 123.668 36 – Minor Irrigation 843.43 838.72 4.71 82.119 38 – Panchayat 3662.19 3118.60 543.59 43.9710 48 – Relief and Disaster Management 916.58 552.57 364.01 9.3511 49 – Economics & Statistics 992.43 843.42 149.01 71.07
Capital voted12 12 – Municipal Admn., Housing and Urban Dev. 8404.61 5280.63 3123.98 1521.2413 40 – Irrigation and Flood Control Department 28275.00 20476.16 7798.84 1874.76
1447 – Welfare of Minorities and Other Backward
Classes 2301.47 2276.31 25.16 156.12Total 118592.70 99975.52 18617.18 7557.89
In five cases, supplementary provision of ` 88.82 crore proved insufficient by
more than ` 10 lakh in each case, leaving an aggregate uncovered excess
expenditure of ` 62.38 crore in these five cases. Details are given in the tablebelow:
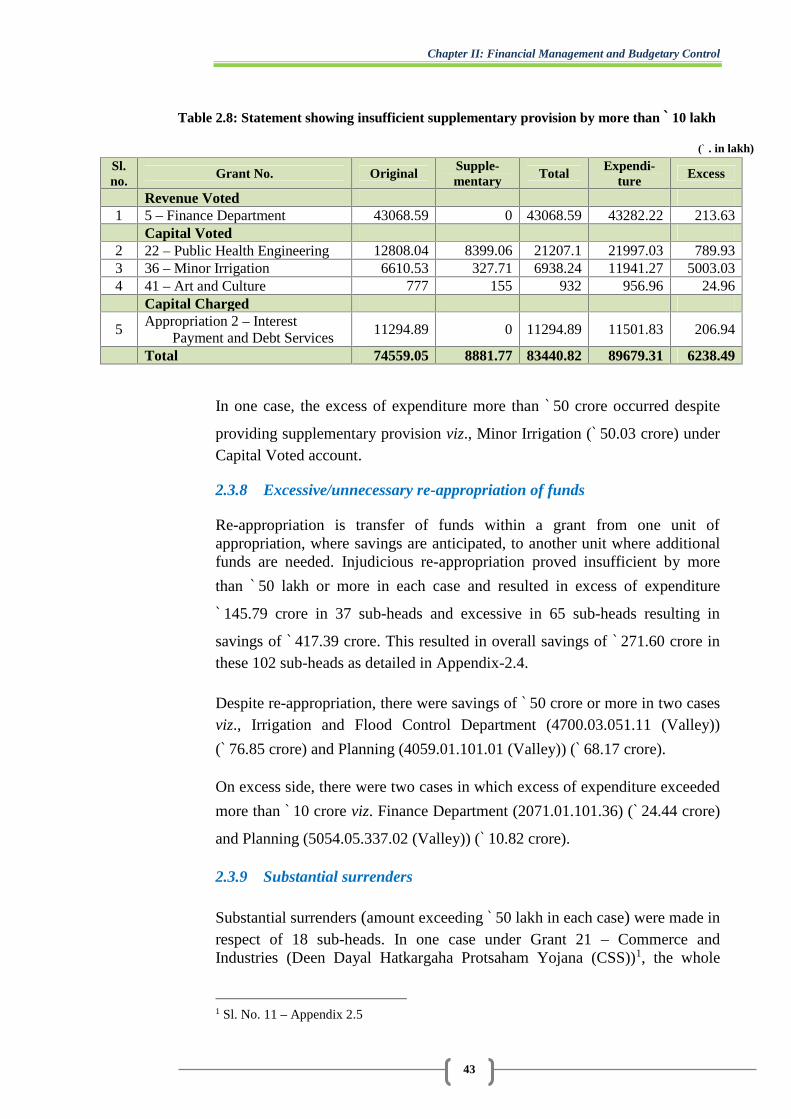
Chapter II: Financial Management and Budgetary Control
43
Table 2.8: Statement showing insufficient supplementary provision by more than ` 10 lakh
(` . in lakh)
Sl.no.
Grant No. OriginalSupple-mentary
TotalExpendi-
tureExcess
Revenue Voted1 5 – Finance Department 43068.59 0 43068.59 43282.22 213.63
Capital Voted2 22 – Public Health Engineering 12808.04 8399.06 21207.1 21997.03 789.933 36 – Minor Irrigation 6610.53 327.71 6938.24 11941.27 5003.034 41 – Art and Culture 777 155 932 956.96 24.96
Capital Charged
5Appropriation 2 – Interest
Payment and Debt Services11294.89 0 11294.89 11501.83 206.94
Total 74559.05 8881.77 83440.82 89679.31 6238.49
In one case, the excess of expenditure more than ` 50 crore occurred despite
providing supplementary provision viz., Minor Irrigation (` 50.03 crore) underCapital Voted account.
2.3.8 Excessive/unnecessary re-appropriation of funds
Re-appropriation is transfer of funds within a grant from one unit ofappropriation, where savings are anticipated, to another unit where additionalfunds are needed. Injudicious re-appropriation proved insufficient by more
than ` 50 lakh or more in each case and resulted in excess of expenditure
` 145.79 crore in 37 sub-heads and excessive in 65 sub-heads resulting in
savings of ` 417.39 crore. This resulted in overall savings of ` 271.60 crore inthese 102 sub-heads as detailed in Appendix-2.4.
Despite re-appropriation, there were savings of ` 50 crore or more in two casesviz., Irrigation and Flood Control Department (4700.03.051.11 (Valley))
(` 76.85 crore) and Planning (4059.01.101.01 (Valley)) (` 68.17 crore).
On excess side, there were two cases in which excess of expenditure exceeded
more than ` 10 crore viz. Finance Department (2071.01.101.36) (` 24.44 crore)
and Planning (5054.05.337.02 (Valley)) (` 10.82 crore).
2.3.9 Substantial surrenders
Substantial surrenders (amount exceeding ` 50 lakh in each case) were made inrespect of 18 sub-heads. In one case under Grant 21 – Commerce andIndustries (Deen Dayal Hatkargaha Protsaham Yojana (CSS))1, the whole
1 Sl. No. 11 – Appendix 2.5
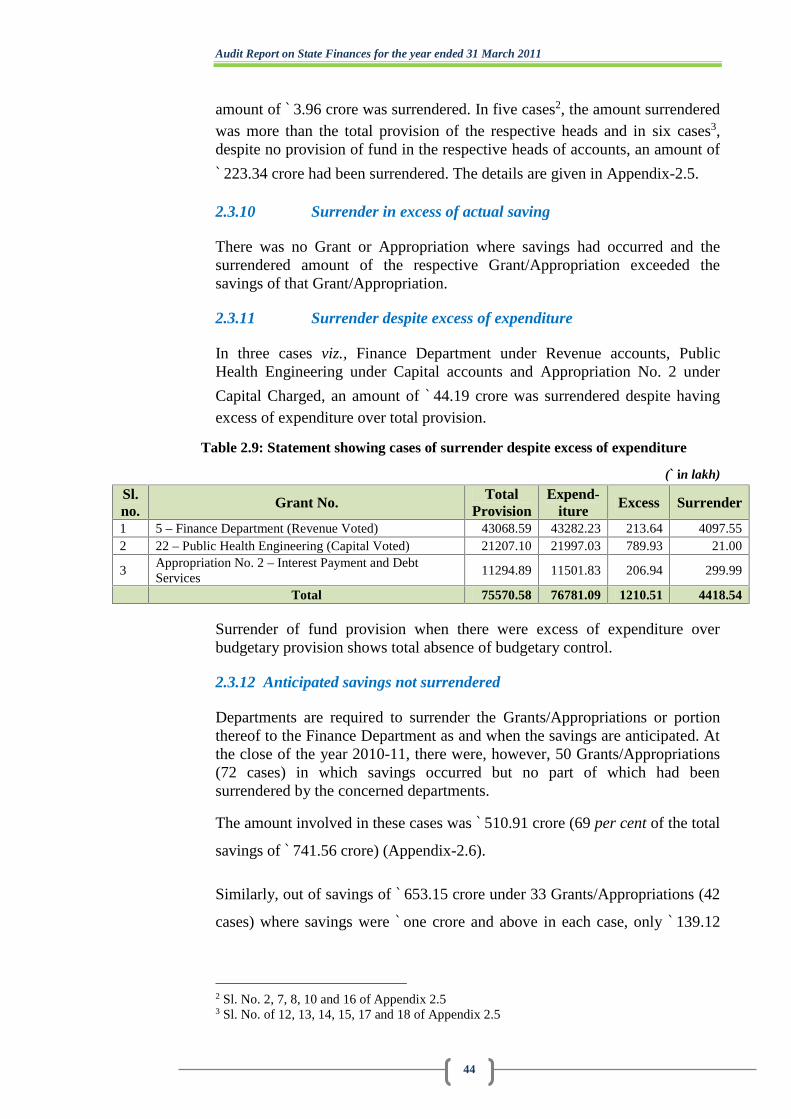
Audit Report on State Finances for the year ended 31 March 2011
44
amount of ` 3.96 crore was surrendered. In five cases2, the amount surrenderedwas more than the total provision of the respective heads and in six cases3,despite no provision of fund in the respective heads of accounts, an amount of
` 223.34 crore had been surrendered. The details are given in Appendix-2.5.
2.3.10 Surrender in excess of actual saving
There was no Grant or Appropriation where savings had occurred and thesurrendered amount of the respective Grant/Appropriation exceeded thesavings of that Grant/Appropriation.
2.3.11 Surrender despite excess of expenditure
In three cases viz., Finance Department under Revenue accounts, PublicHealth Engineering under Capital accounts and Appropriation No. 2 under
Capital Charged, an amount of ` 44.19 crore was surrendered despite havingexcess of expenditure over total provision.
Table 2.9: Statement showing cases of surrender despite excess of expenditure
(` in lakh)
Sl.no. Grant No. Total
ProvisionExpend-
iture Excess Surrender
1 5 – Finance Department (Revenue Voted) 43068.59 43282.23 213.64 4097.552 22 – Public Health Engineering (Capital Voted) 21207.10 21997.03 789.93 21.00
3Appropriation No. 2 – Interest Payment and DebtServices
11294.89 11501.83 206.94 299.99
Total 75570.58 76781.09 1210.51 4418.54
Surrender of fund provision when there were excess of expenditure overbudgetary provision shows total absence of budgetary control.
2.3.12 Anticipated savings not surrendered
Departments are required to surrender the Grants/Appropriations or portionthereof to the Finance Department as and when the savings are anticipated. Atthe close of the year 2010-11, there were, however, 50 Grants/Appropriations(72 cases) in which savings occurred but no part of which had beensurrendered by the concerned departments.
The amount involved in these cases was ` 510.91 crore (69 per cent of the total
savings of ` 741.56 crore) (Appendix-2.6).
Similarly, out of savings of ` 653.15 crore under 33 Grants/Appropriations (42
cases) where savings were ` one crore and above in each case, only ` 139.12
2 Sl. No. 2, 7, 8, 10 and 16 of Appendix 2.53 Sl. No. of 12, 13, 14, 15, 17 and 18 of Appendix 2.5

Chapter II: Financial Management and Budgetary Control
45
crore pertaining to four Grants/Appropriation4 could be surrendered leaving a
balance savings of ` 514.03 crore (79 per cent). Details are given in Appendix-2.7.
Besides, in nine Grants/Appropriation (11 cases), ` 260.98 crore weresurrendered on 31 March 2011 (Appendix-2.8) indicating inadequate financialcontrol and the fact that these funds could not be utilized for otherdevelopment purposes.
2.3.13 Rush of expenditure
As per provisions of the General Financial Rules, rush of expenditure in theclosing month of the financial year should be avoided. Contrary to this, inrespect of 96 major heads of accounts as listed in Appendix 2.9, expendituremore than 25 per cent of the total expenditure for the year was incurred in
March 2011. Of these, in 26 cases involving ` 126.24 crore, the whole amountwas incurred in March, indicating there was no control over the flow ofexpenditure.
2.4 Non-reconciliation of Departmental figures
2.4.1 Pendency in submission of Detailed Countersigned Contingent Billsagainst Abstract Contingent Bills
As per Central Treasury Rules5, Abstract Contingent (AC) bills must beregularized by detailed countersigned contingent (DCC) bills. An AC billshould not be encashed without a certificate to the effect that DCC bills inrespect of earlier AC bills drawn more than a month before the date of that billhave been submitted to the controlling officer. The controlling officers mustsubmit the DCC bills to the Accountant General within one month from thedate of receipt of the DCC bills in his office.
The total amount of DCC bills received during the period 2003-11 was
` 1,366.20 crore against the amount of AC bills of ` 2,019.49 crore leading to
an outstanding balance of DCC bills of ` 653.29 crore as on October 2011.Year wise details are given in the table below:
Table 2.10: Pendency in submission of Detailed Countersigned Contingent Bills againstAbstract Contingent Bills
(` in crore)
YearAmount of
AC billsAmount ofDCC bills
DCC bills as percentageof AC bills
OutstandingDCC bills
2003-04 34.56 13.78 39.90 20.77
2004-05 82.54 76.00 92.08 6.54
4 Grants no. 21 and 30 under Revenue Voted; Appropriation 2 under Revenue Charged and Grant 30under Capital Voted.5 Rule 308, Rule 309 & Note 4 under Rule 312
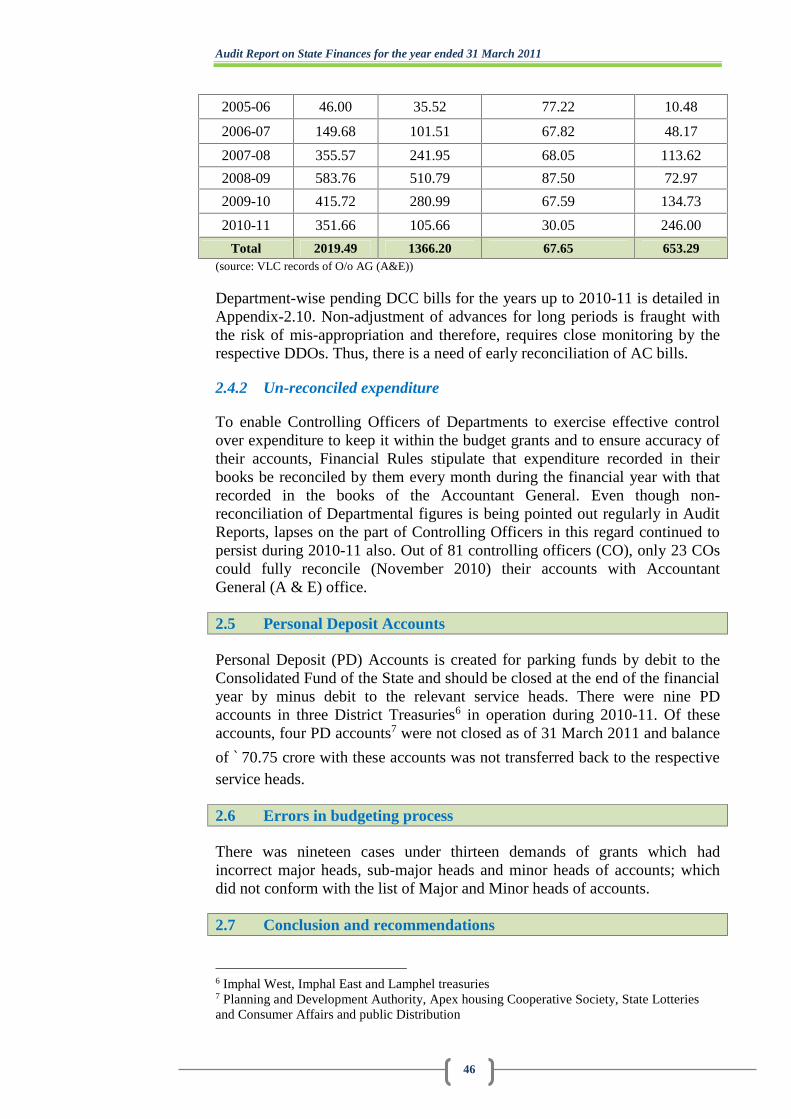
Audit Report on State Finances for the year ended 31 March 2011
46
2005-06 46.00 35.52 77.22 10.48
2006-07 149.68 101.51 67.82 48.17
2007-08 355.57 241.95 68.05 113.62
2008-09 583.76 510.79 87.50 72.97
2009-10 415.72 280.99 67.59 134.73
2010-11 351.66 105.66 30.05 246.00
Total 2019.49 1366.20 67.65 653.29(source: VLC records of O/o AG (A&E))
Department-wise pending DCC bills for the years up to 2010-11 is detailed inAppendix-2.10. Non-adjustment of advances for long periods is fraught withthe risk of mis-appropriation and therefore, requires close monitoring by therespective DDOs. Thus, there is a need of early reconciliation of AC bills.
2.4.2 Un-reconciled expenditure
To enable Controlling Officers of Departments to exercise effective controlover expenditure to keep it within the budget grants and to ensure accuracy oftheir accounts, Financial Rules stipulate that expenditure recorded in theirbooks be reconciled by them every month during the financial year with thatrecorded in the books of the Accountant General. Even though non-reconciliation of Departmental figures is being pointed out regularly in AuditReports, lapses on the part of Controlling Officers in this regard continued topersist during 2010-11 also. Out of 81 controlling officers (CO), only 23 COscould fully reconcile (November 2010) their accounts with AccountantGeneral (A & E) office.
2.5 Personal Deposit Accounts
Personal Deposit (PD) Accounts is created for parking funds by debit to theConsolidated Fund of the State and should be closed at the end of the financialyear by minus debit to the relevant service heads. There were nine PDaccounts in three District Treasuries6 in operation during 2010-11. Of theseaccounts, four PD accounts7 were not closed as of 31 March 2011 and balance
of ` 70.75 crore with these accounts was not transferred back to the respectiveservice heads.
2.6 Errors in budgeting process
There was nineteen cases under thirteen demands of grants which hadincorrect major heads, sub-major heads and minor heads of accounts; whichdid not conform with the list of Major and Minor heads of accounts.
2.7 Conclusion and recommendations
6 Imphal West, Imphal East and Lamphel treasuries7 Planning and Development Authority, Apex housing Cooperative Society, State Lotteriesand Consumer Affairs and public Distribution
Chapter II: Financial Management and Budgetary Control
47
During 2010-11, an expenditure of ` 6,124.90 crore was incurred against a
total budget provision of ` 6,804.04 crore, resulting in an overall saving of
` 679.14 crore. The overall saving was the net result of saving of ` 741.56
crore offset by excess of ` 62.42 crore. The excess of expenditure requiresregularization under Article 205 of the Constitution of India. Excessexpenditure for the period 2007-10 is yet to be regularized, awaitingrecommendation of the Public Accounts Committee (PAC) to regularize theexcess expenditure (Paras 2.2 and 2.3).
An expenditure of ` 113.95 crore was incurred in 22 cases without anyprovision in the original estimates/supplementary demand/re-appropriation.
Supplementary provision aggregating ` 75.58 crore in 14 cases wasunnecessary as the expenditure did not come up to the level of original
provision while in five cases, supplementary provision of ` 88.82 crore proved
insufficient by more than ` 10 lakh in each case. Substantial surrenders
(amount exceeding ` 50 lakh in each case) were made in respect of 18 sub-heads, out of which in one scheme/programme, the whole provision
amounting to ` 3.96 crore was surrendered while in six cases an amount of
` 222.34 crore was surrendered despite having no provision of funds in the
respective heads of accounts (Para 2.3). Out of ` 2,019.49 crore paid throughAbstract Contingent (AC) bills during 2003-11, Detailed Countersigned
Contingent bills for ` 653.29 crore are outstanding as on October 2011 (Para2.4).
Expenditure without provision and surrender of whole amount/ funds withoutprovision of funds indicate that the budgetary process needs to be improved soas to avoid re-occurrence of such irregularities in future. Supplementaryprovisions should be used as an instrument to fine tune the flow of expenditureand should be applied in a judicious manner so that budget provisions andactual expenditure are convergent to each other as nearest as possible. While amarked improvement in settling of outstanding AC bills was visible in thecurrent year, a close and rigorous monitoring mechanism needs to be appliedto adjust AC bills within thirty days from the date of drawal of the amount.
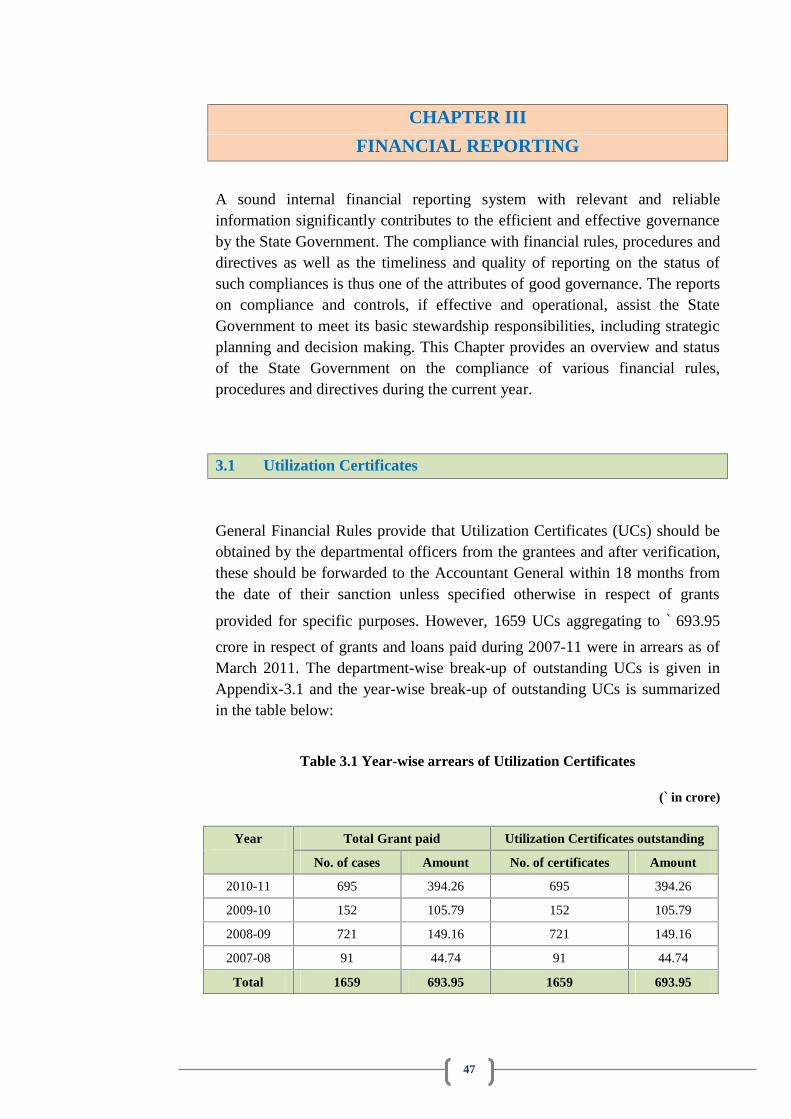
47
CHAPTER III
FINANCIAL REPORTING
A sound internal financial reporting system with relevant and reliableinformation significantly contributes to the efficient and effective governanceby the State Government. The compliance with financial rules, procedures anddirectives as well as the timeliness and quality of reporting on the status ofsuch compliances is thus one of the attributes of good governance. The reportson compliance and controls, if effective and operational, assist the StateGovernment to meet its basic stewardship responsibilities, including strategicplanning and decision making. This Chapter provides an overview and statusof the State Government on the compliance of various financial rules,procedures and directives during the current year.
3.1 Utilization Certificates
General Financial Rules provide that Utilization Certificates (UCs) should beobtained by the departmental officers from the grantees and after verification,these should be forwarded to the Accountant General within 18 months fromthe date of their sanction unless specified otherwise in respect of grants
provided for specific purposes. However, 1659 UCs aggregating to ` 693.95
crore in respect of grants and loans paid during 2007-11 were in arrears as ofMarch 2011. The department-wise break-up of outstanding UCs is given inAppendix-3.1 and the year-wise break-up of outstanding UCs is summarizedin the table below:
Table 3.1 Year-wise arrears of Utilization Certificates
(` in crore)
Year Total Grant paid Utilization Certificates outstanding
No. of cases Amount No. of certificates Amount
2010-11 695 394.26 695 394.26
2009-10 152 105.79 152 105.79
2008-09 721 149.16 721 149.16
2007-08 91 44.74 91 44.74
Total 1659 693.95 1659 693.95
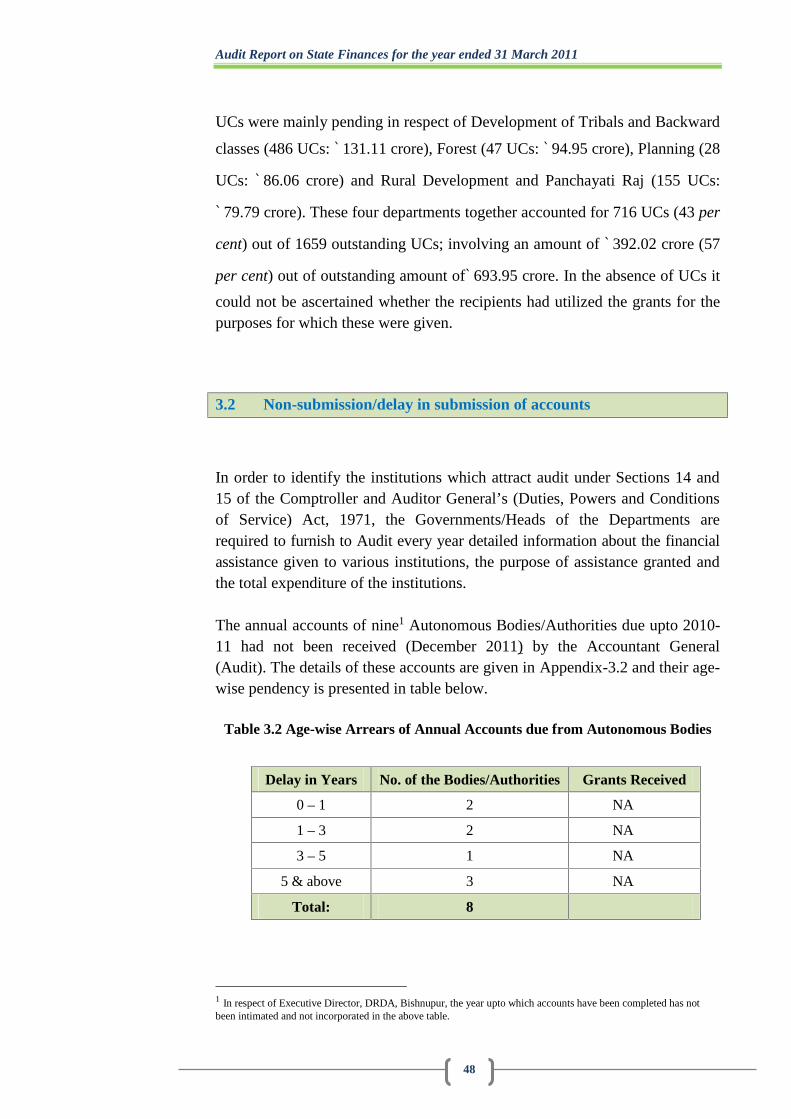
Audit Report on State Finances for the year ended 31 March 2011
48
UCs were mainly pending in respect of Development of Tribals and Backward
classes (486 UCs: ` 131.11 crore), Forest (47 UCs: ` 94.95 crore), Planning (28
UCs: ` 86.06 crore) and Rural Development and Panchayati Raj (155 UCs:
` 79.79 crore). These four departments together accounted for 716 UCs (43 per
cent) out of 1659 outstanding UCs; involving an amount of ` 392.02 crore (57
per cent) out of outstanding amount of` 693.95 crore. In the absence of UCs it
could not be ascertained whether the recipients had utilized the grants for thepurposes for which these were given.
3.2 Non-submission/delay in submission of accounts
In order to identify the institutions which attract audit under Sections 14 and15 of the Comptroller and Auditor General’s (Duties, Powers and Conditionsof Service) Act, 1971, the Governments/Heads of the Departments arerequired to furnish to Audit every year detailed information about the financialassistance given to various institutions, the purpose of assistance granted andthe total expenditure of the institutions.
The annual accounts of nine1 Autonomous Bodies/Authorities due upto 2010-11 had not been received (December 2011) by the Accountant General(Audit). The details of these accounts are given in Appendix-3.2 and their age-wise pendency is presented in table below.
Table 3.2 Age-wise Arrears of Annual Accounts due from Autonomous Bodies
Delay in Years No. of the Bodies/Authorities Grants Received
0 – 1 2 NA
1 – 3 2 NA
3 – 5 1 NA
5 & above 3 NA
Total: 8
1 In respect of Executive Director, DRDA, Bishnupur, the year upto which accounts have been completed has notbeen intimated and not incorporated in the above table.
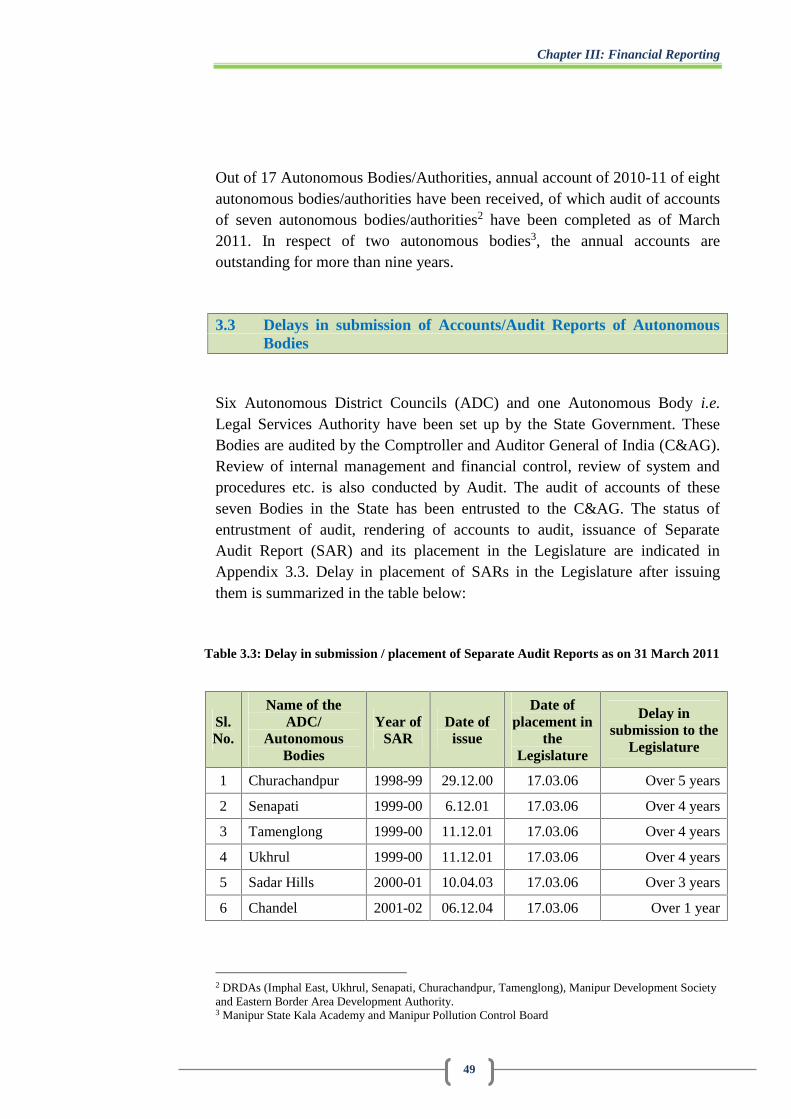
Chapter III: Financial Reporting
49
Out of 17 Autonomous Bodies/Authorities, annual account of 2010-11 of eightautonomous bodies/authorities have been received, of which audit of accountsof seven autonomous bodies/authorities2 have been completed as of March2011. In respect of two autonomous bodies3, the annual accounts areoutstanding for more than nine years.
3.3 Delays in submission of Accounts/Audit Reports of AutonomousBodies
Six Autonomous District Councils (ADC) and one Autonomous Body i.e.Legal Services Authority have been set up by the State Government. TheseBodies are audited by the Comptroller and Auditor General of India (C&AG).Review of internal management and financial control, review of system andprocedures etc. is also conducted by Audit. The audit of accounts of theseseven Bodies in the State has been entrusted to the C&AG. The status ofentrustment of audit, rendering of accounts to audit, issuance of SeparateAudit Report (SAR) and its placement in the Legislature are indicated inAppendix 3.3. Delay in placement of SARs in the Legislature after issuingthem is summarized in the table below:
Table 3.3: Delay in submission / placement of Separate Audit Reports as on 31 March 2011
Sl.No.
Name of theADC/
AutonomousBodies
Year ofSAR
Date ofissue
Date ofplacement in
theLegislature
Delay insubmission to the
Legislature
1 Churachandpur 1998-99 29.12.00 17.03.06 Over 5 years
2 Senapati 1999-00 6.12.01 17.03.06 Over 4 years
3 Tamenglong 1999-00 11.12.01 17.03.06 Over 4 years
4 Ukhrul 1999-00 11.12.01 17.03.06 Over 4 years
5 Sadar Hills 2000-01 10.04.03 17.03.06 Over 3 years
6 Chandel 2001-02 06.12.04 17.03.06 Over 1 year
2 DRDAs (Imphal East, Ukhrul, Senapati, Churachandpur, Tamenglong), Manipur Development Societyand Eastern Border Area Development Authority.3 Manipur State Kala Academy and Manipur Pollution Control Board
Audit Report on State Finances for the year ended 31 March 2011
50
The above table shows that SAR pertaining to the period 1998-99 in respect ofADC, Churachandpur was placed in the Legislature after a lapse of over fiveyears while the SARs for the period 1999-00 in respect of ADCs of Senapati,Tamenglong and Ukhrul was placed after a lapse of over four years from thedate of issue. The SAR in respect of ADC, Sadar Hills for the period 2000-01was placed after a lapse of over three years from the date of issue while inrespect of ADC, Chandel it was placed after a lapse of one year.
The reasons for the delay in submission/placement of the SARs in theLegislature though called for (September and November 2011) have not beenintimated (February 2012).
3.4 Misappropriations, losses, defalcations etc.
Information regarding non-adjustment of temporary advances, reasons fornon-adjustment, delay in furnishing utilization certificates, non-submission/delay in submission of accounts, cases of misappropriation, losses,defalcations, if any, were called for from 51 departments/ autonomous bodies.
However, information in respect of seven departments/ autonomous DistrictCouncil/Corporations viz., Irrigation and Flood Control Department, TaxationDepartment, Transport Department, Science and Technology Department,Manipur Industrial Development Corporation Ltd., Manipur Handloom andHandicrafts Development Corporation Ltd. and Autonomous District Council,Churachandpur were received (December 2011). Non-adjustment of advance
of ` 0.16 crore for less than one year (Science and Technology Department)
and ` 145.37 crore for more than 10 years (Manipur Industrial Development
Corporation Ltd.)(MANIDCO) was reported. While the advance in respect ofScience and Technology Department could not be adjusted as clarification onexpenditure was awaited from the Government, no reason was furnished inrespect of MANIDCO. The Corporation also further reported (September2011) three cases of misappropriation/losses/defalcation etc. amounting to
` 339 lakh; but no reasons were furnished (February 2012).
Chapter III: Financial Reporting
51
3.5 Conclusion and recommendations
Utilization Certificates in respect of 1,659 grants and loans paid during 2007-
11 involving ` 693.95 crore were in arrear as of March 2011. There were also
delays in placement of Separate Audit Reports to Legislature and huge arrearsin finalization of accounts by the ADC/Autonomous Bodies. Out of 51departments/Autonomous bodies, only seven replies were received to ascertainthe status of non-adjustment of temporary advances, misappropriation, lossesetc. (Paras 3.1, 3.2, 3.3 and 3.4).
ImphalThe
(Stephen Hongray)Accountant General (Audit), Manipur
Countersigned
New DelhiThe
(Vinod Rai)Comptroller and Auditor General of India
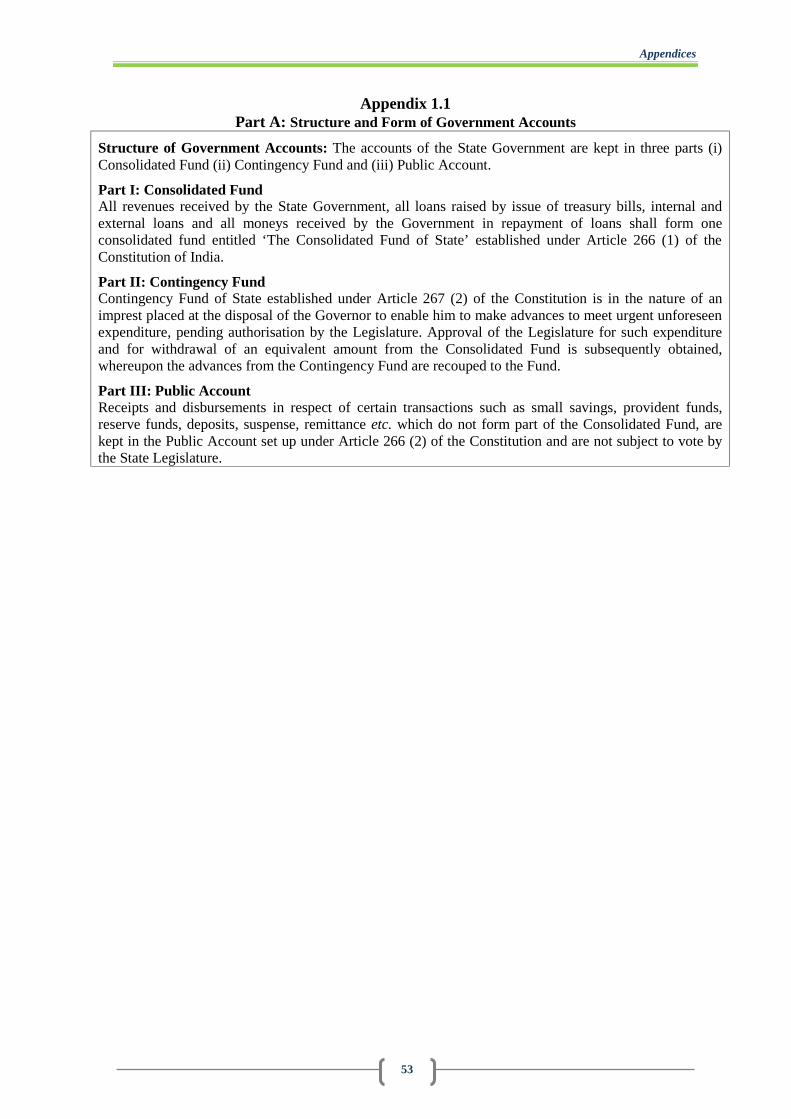
Appendices
53
Appendix 1.1Part A: Structure and Form of Government Accounts
Structure of Government Accounts: The accounts of the State Government are kept in three parts (i)Consolidated Fund (ii) Contingency Fund and (iii) Public Account.
Part I: Consolidated FundAll revenues received by the State Government, all loans raised by issue of treasury bills, internal andexternal loans and all moneys received by the Government in repayment of loans shall form oneconsolidated fund entitled ‘The Consolidated Fund of State’ established under Article 266 (1) of theConstitution of India.
Part II: Contingency FundContingency Fund of State established under Article 267 (2) of the Constitution is in the nature of animprest placed at the disposal of the Governor to enable him to make advances to meet urgent unforeseenexpenditure, pending authorisation by the Legislature. Approval of the Legislature for such expenditureand for withdrawal of an equivalent amount from the Consolidated Fund is subsequently obtained,whereupon the advances from the Contingency Fund are recouped to the Fund.
Part III: Public AccountReceipts and disbursements in respect of certain transactions such as small savings, provident funds,reserve funds, deposits, suspense, remittance etc. which do not form part of the Consolidated Fund, arekept in the Public Account set up under Article 266 (2) of the Constitution and are not subject to vote bythe State Legislature.
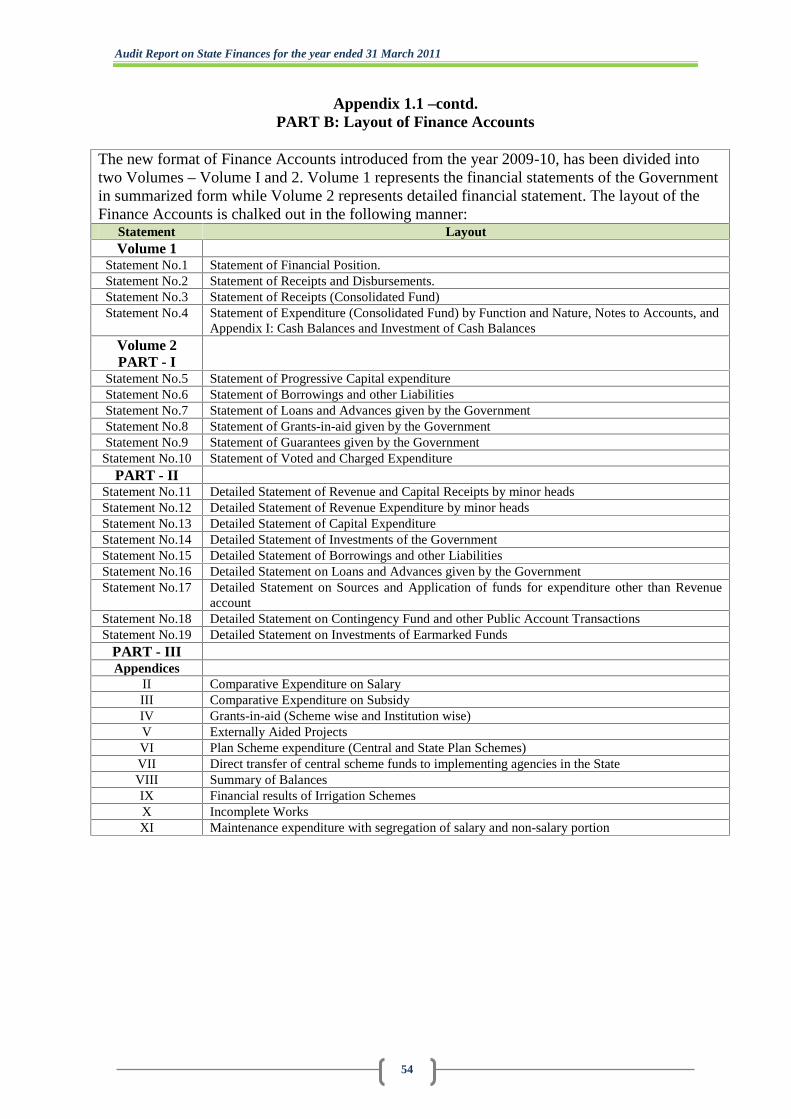
Audit Report on State Finances for the year ended 31 March 2011
54
Appendix 1.1 –contd.PART B: Layout of Finance Accounts
The new format of Finance Accounts introduced from the year 2009-10, has been divided intotwo Volumes – Volume I and 2. Volume 1 represents the financial statements of the Governmentin summarized form while Volume 2 represents detailed financial statement. The layout of theFinance Accounts is chalked out in the following manner:
Statement LayoutVolume 1
Statement No.1 Statement of Financial Position.Statement No.2 Statement of Receipts and Disbursements.Statement No.3 Statement of Receipts (Consolidated Fund)Statement No.4 Statement of Expenditure (Consolidated Fund) by Function and Nature, Notes to Accounts, and
Appendix I: Cash Balances and Investment of Cash BalancesVolume 2PART - I
Statement No.5 Statement of Progressive Capital expenditureStatement No.6 Statement of Borrowings and other LiabilitiesStatement No.7 Statement of Loans and Advances given by the GovernmentStatement No.8 Statement of Grants-in-aid given by the GovernmentStatement No.9 Statement of Guarantees given by the Government
Statement No.10 Statement of Voted and Charged ExpenditurePART - II
Statement No.11 Detailed Statement of Revenue and Capital Receipts by minor headsStatement No.12 Detailed Statement of Revenue Expenditure by minor headsStatement No.13 Detailed Statement of Capital ExpenditureStatement No.14 Detailed Statement of Investments of the GovernmentStatement No.15 Detailed Statement of Borrowings and other LiabilitiesStatement No.16 Detailed Statement on Loans and Advances given by the GovernmentStatement No.17 Detailed Statement on Sources and Application of funds for expenditure other than Revenue
accountStatement No.18 Detailed Statement on Contingency Fund and other Public Account TransactionsStatement No.19 Detailed Statement on Investments of Earmarked Funds
PART - IIIAppendices
II Comparative Expenditure on SalaryIII Comparative Expenditure on SubsidyIV Grants-in-aid (Scheme wise and Institution wise)V Externally Aided ProjectsVI Plan Scheme expenditure (Central and State Plan Schemes)VII Direct transfer of central scheme funds to implementing agencies in the StateVIII Summary of BalancesIX Financial results of Irrigation SchemesX Incomplete WorksXI Maintenance expenditure with segregation of salary and non-salary portion
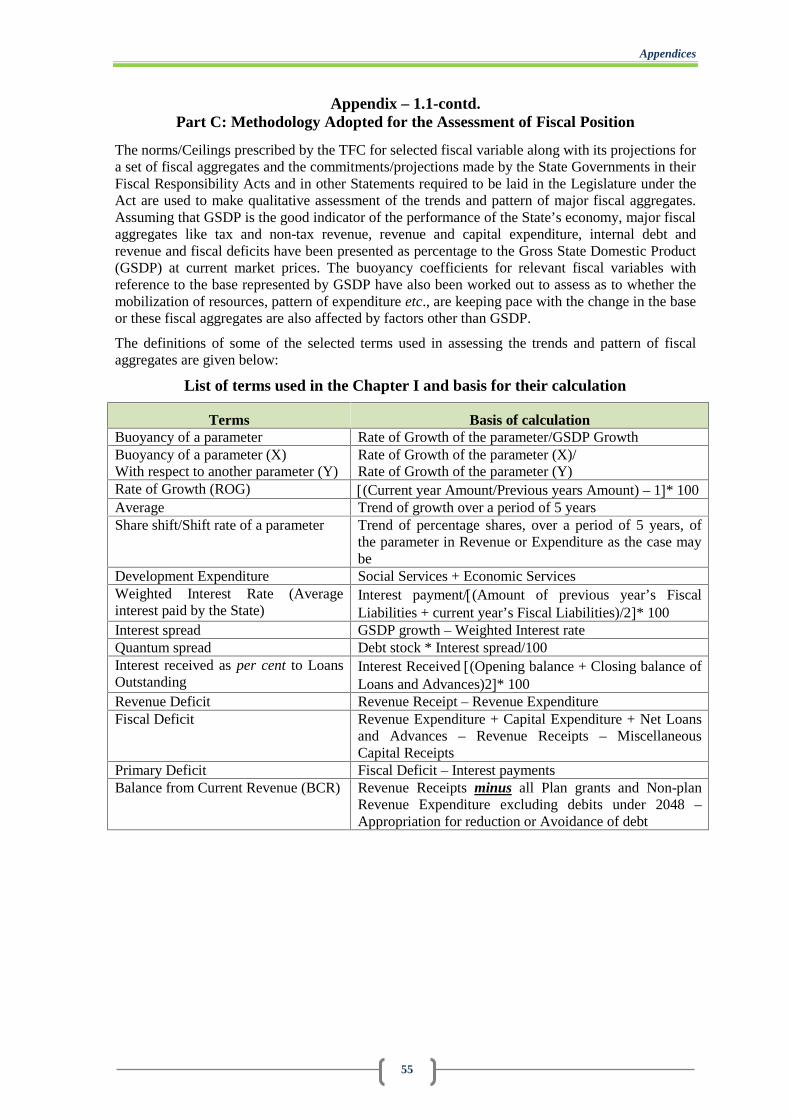
Appendices
55
Appendix – 1.1-contd.Part C: Methodology Adopted for the Assessment of Fiscal Position
The norms/Ceilings prescribed by the TFC for selected fiscal variable along with its projections fora set of fiscal aggregates and the commitments/projections made by the State Governments in theirFiscal Responsibility Acts and in other Statements required to be laid in the Legislature under theAct are used to make qualitative assessment of the trends and pattern of major fiscal aggregates.Assuming that GSDP is the good indicator of the performance of the State’s economy, major fiscalaggregates like tax and non-tax revenue, revenue and capital expenditure, internal debt andrevenue and fiscal deficits have been presented as percentage to the Gross State Domestic Product(GSDP) at current market prices. The buoyancy coefficients for relevant fiscal variables withreference to the base represented by GSDP have also been worked out to assess as to whether themobilization of resources, pattern of expenditure etc., are keeping pace with the change in the baseor these fiscal aggregates are also affected by factors other than GSDP.
The definitions of some of the selected terms used in assessing the trends and pattern of fiscalaggregates are given below:
List of terms used in the Chapter I and basis for their calculation
Terms Basis of calculationBuoyancy of a parameter Rate of Growth of the parameter/GSDP GrowthBuoyancy of a parameter (X)With respect to another parameter (Y)
Rate of Growth of the parameter (X)/Rate of Growth of the parameter (Y)
Rate of Growth (ROG) (Current year Amount/Previous years Amount) – 1* 100Average Trend of growth over a period of 5 yearsShare shift/Shift rate of a parameter Trend of percentage shares, over a period of 5 years, of
the parameter in Revenue or Expenditure as the case maybe
Development Expenditure Social Services + Economic ServicesWeighted Interest Rate (Averageinterest paid by the State)
Interest payment/(Amount of previous year’s FiscalLiabilities + current year’s Fiscal Liabilities)/2* 100
Interest spread GSDP growth – Weighted Interest rateQuantum spread Debt stock * Interest spread/100Interest received as per cent to LoansOutstanding
Interest Received (Opening balance + Closing balance ofLoans and Advances)2* 100
Revenue Deficit Revenue Receipt – Revenue ExpenditureFiscal Deficit Revenue Expenditure + Capital Expenditure + Net Loans
and Advances – Revenue Receipts – MiscellaneousCapital Receipts
Primary Deficit Fiscal Deficit – Interest paymentsBalance from Current Revenue (BCR) Revenue Receipts minus all Plan grants and Non-plan
Revenue Expenditure excluding debits under 2048 –Appropriation for reduction or Avoidance of debt
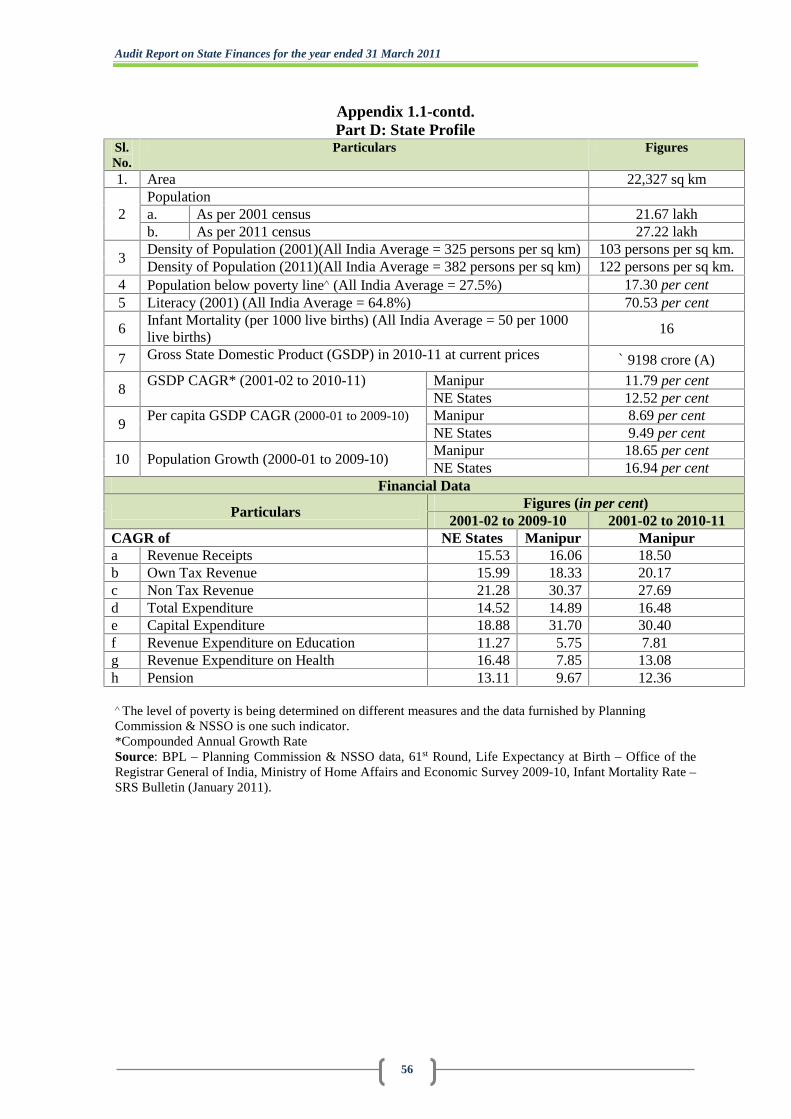
Audit Report on State Finances for the year ended 31 March 2011
56
Appendix 1.1-contd.Part D: State Profile
Sl.No.
Particulars Figures
1. Area 22,327 sq km
2Populationa. As per 2001 census 21.67 lakhb. As per 2011 census 27.22 lakh
3Density of Population (2001)(All India Average = 325 persons per sq km) 103 persons per sq km.Density of Population (2011)(All India Average = 382 persons per sq km) 122 persons per sq km.
4 Population below poverty line (All India Average = 27.5%) 17.30 per cent5 Literacy (2001) (All India Average = 64.8%) 70.53 per cent
6Infant Mortality (per 1000 live births) (All India Average = 50 per 1000live births)
16
7 Gross State Domestic Product (GSDP) in 2010-11 at current prices ` 9198 crore (A)
8GSDP CAGR* (2001-02 to 2010-11) Manipur 11.79 per cent
NE States 12.52 per cent
9Per capita GSDP CAGR (2000-01 to 2009-10) Manipur 8.69 per cent
NE States 9.49 per cent
10 Population Growth (2000-01 to 2009-10)Manipur 18.65 per centNE States 16.94 per cent
Financial Data
ParticularsFigures (in per cent)
2001-02 to 2009-10 2001-02 to 2010-11CAGR of NE States Manipur Manipura Revenue Receipts 15.53 16.06 18.50b Own Tax Revenue 15.99 18.33 20.17c Non Tax Revenue 21.28 30.37 27.69d Total Expenditure 14.52 14.89 16.48e Capital Expenditure 18.88 31.70 30.40f Revenue Expenditure on Education 11.27 5.75 7.81g Revenue Expenditure on Health 16.48 7.85 13.08h Pension 13.11 9.67 12.36
The level of poverty is being determined on different measures and the data furnished by PlanningCommission & NSSO is one such indicator.*Compounded Annual Growth RateSource: BPL – Planning Commission & NSSO data, 61st Round, Life Expectancy at Birth – Office of theRegistrar General of India, Ministry of Home Affairs and Economic Survey 2009-10, Infant Mortality Rate –SRS Bulletin (January 2011).
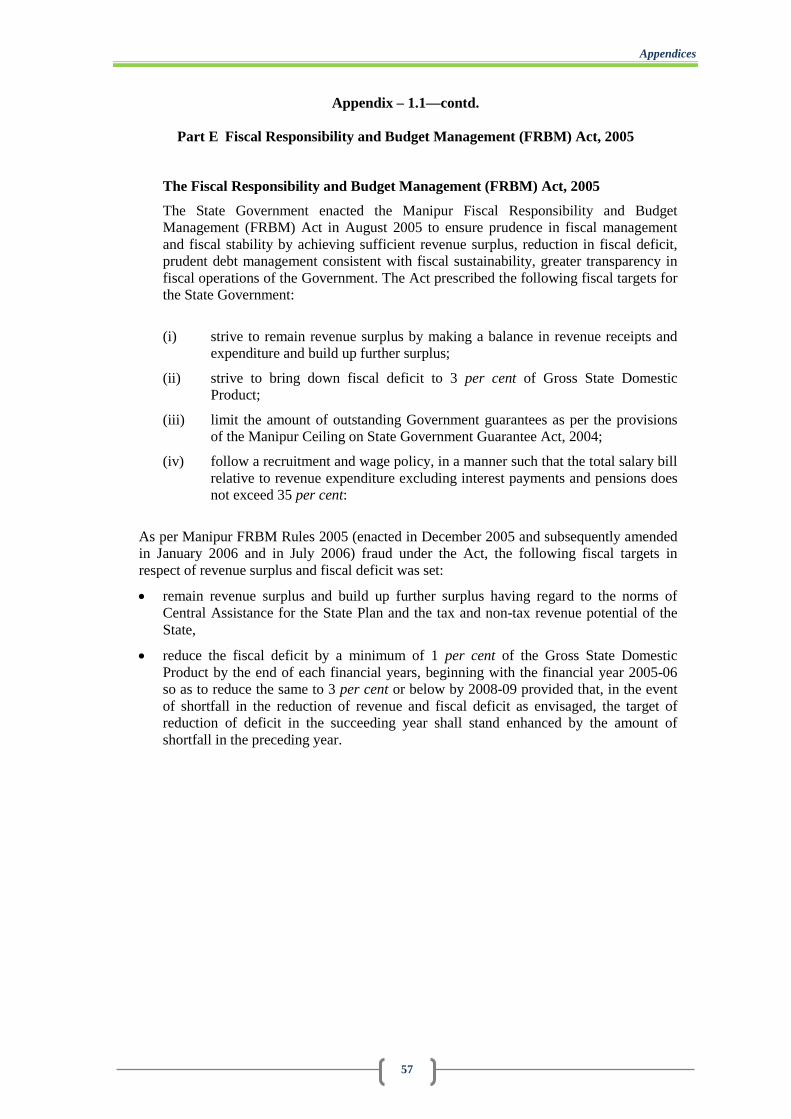
Appendices
57
Appendix – 1.1—contd.
Part E Fiscal Responsibility and Budget Management (FRBM) Act, 2005
The Fiscal Responsibility and Budget Management (FRBM) Act, 2005
The State Government enacted the Manipur Fiscal Responsibility and BudgetManagement (FRBM) Act in August 2005 to ensure prudence in fiscal managementand fiscal stability by achieving sufficient revenue surplus, reduction in fiscal deficit,prudent debt management consistent with fiscal sustainability, greater transparency infiscal operations of the Government. The Act prescribed the following fiscal targets forthe State Government:
(i) strive to remain revenue surplus by making a balance in revenue receipts andexpenditure and build up further surplus;
(ii) strive to bring down fiscal deficit to 3 per cent of Gross State DomesticProduct;
(iii) limit the amount of outstanding Government guarantees as per the provisionsof the Manipur Ceiling on State Government Guarantee Act, 2004;
(iv) follow a recruitment and wage policy, in a manner such that the total salary billrelative to revenue expenditure excluding interest payments and pensions doesnot exceed 35 per cent:
As per Manipur FRBM Rules 2005 (enacted in December 2005 and subsequently amendedin January 2006 and in July 2006) fraud under the Act, the following fiscal targets inrespect of revenue surplus and fiscal deficit was set:
remain revenue surplus and build up further surplus having regard to the norms ofCentral Assistance for the State Plan and the tax and non-tax revenue potential of theState,
reduce the fiscal deficit by a minimum of 1 per cent of the Gross State DomesticProduct by the end of each financial years, beginning with the financial year 2005-06so as to reduce the same to 3 per cent or below by 2008-09 provided that, in the eventof shortfall in the reduction of revenue and fiscal deficit as envisaged, the target ofreduction of deficit in the succeeding year shall stand enhanced by the amount ofshortfall in the preceding year.
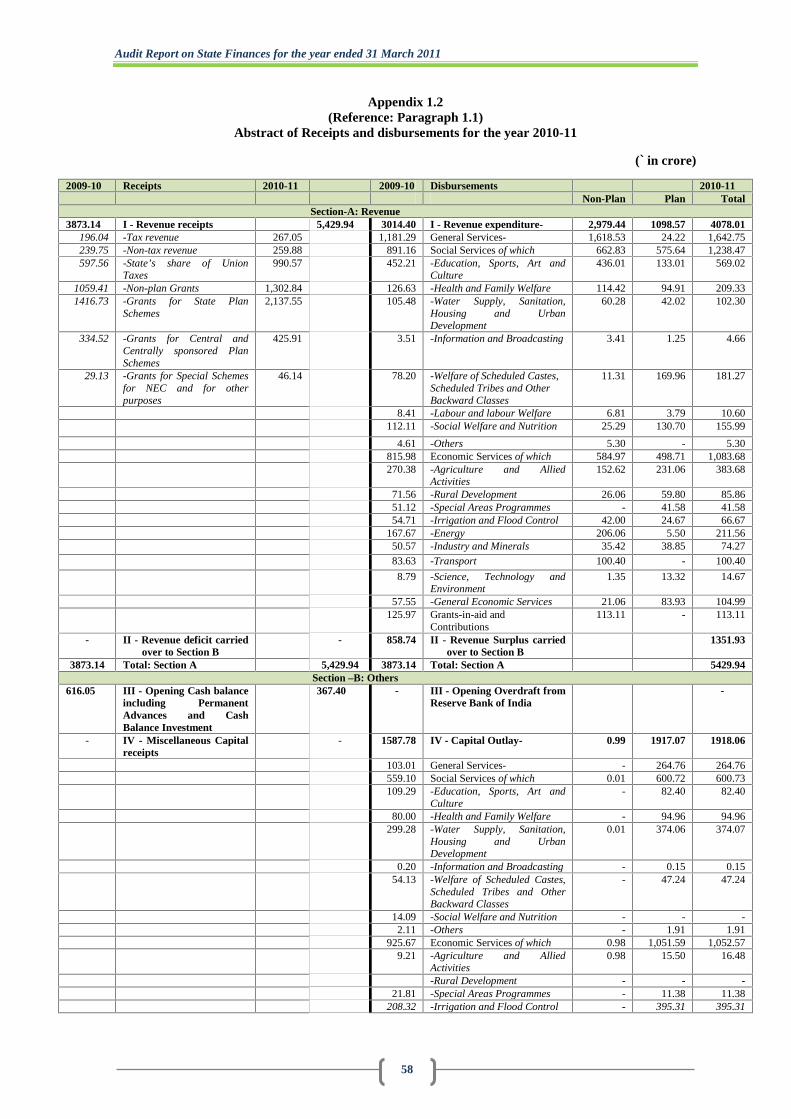
Audit Report on State Finances for the year ended 31 March 2011
58
Appendix 1.2(Reference: Paragraph 1.1)
Abstract of Receipts and disbursements for the year 2010-11
(` in crore)
2009-10 Receipts 2010-11 2009-10 Disbursements 2010-11Non-Plan Plan Total
Section-A: Revenue3873.14 I - Revenue receipts 5,429.94 3014.40 I - Revenue expenditure- 2,979.44 1098.57 4078.01
196.04 -Tax revenue 267.05 1,181.29 General Services- 1,618.53 24.22 1,642.75239.75 -Non-tax revenue 259.88 891.16 Social Services of which 662.83 575.64 1,238.47597.56 -State’s share of Union
Taxes990.57 452.21 -Education, Sports, Art and
Culture436.01 133.01 569.02
1059.41 -Non-plan Grants 1,302.84 126.63 -Health and Family Welfare 114.42 94.91 209.331416.73 -Grants for State Plan
Schemes2,137.55 105.48 -Water Supply, Sanitation,
Housing and UrbanDevelopment
60.28 42.02 102.30
334.52 -Grants for Central andCentrally sponsored PlanSchemes
425.91 3.51 -Information and Broadcasting 3.41 1.25 4.66
29.13 -Grants for Special Schemesfor NEC and for otherpurposes
46.14 78.20 -Welfare of Scheduled Castes,Scheduled Tribes and OtherBackward Classes
11.31 169.96 181.27
8.41 -Labour and labour Welfare 6.81 3.79 10.60112.11 -Social Welfare and Nutrition 25.29 130.70 155.99
4.61 -Others 5.30 - 5.30815.98 Economic Services of which 584.97 498.71 1,083.68270.38 -Agriculture and Allied
Activities152.62 231.06 383.68
71.56 -Rural Development 26.06 59.80 85.8651.12 -Special Areas Programmes - 41.58 41.5854.71 -Irrigation and Flood Control 42.00 24.67 66.67
167.67 -Energy 206.06 5.50 211.5650.57 -Industry and Minerals 35.42 38.85 74.2783.63 -Transport 100.40 - 100.40
8.79 -Science, Technology andEnvironment
1.35 13.32 14.67
57.55 -General Economic Services 21.06 83.93 104.99125.97 Grants-in-aid and
Contributions113.11 - 113.11
- II - Revenue deficit carriedover to Section B
- 858.74 II - Revenue Surplus carriedover to Section B
1351.93
3873.14 Total: Section A 5,429.94 3873.14 Total: Section A 5429.94Section –B: Others
616.05 III - Opening Cash balanceincluding PermanentAdvances and CashBalance Investment
367.40 - III - Opening Overdraft fromReserve Bank of India
-
- IV - Miscellaneous Capitalreceipts
- 1587.78 IV - Capital Outlay- 0.99 1917.07 1918.06
103.01 General Services- - 264.76 264.76559.10 Social Services of which 0.01 600.72 600.73109.29 -Education, Sports, Art and
Culture- 82.40 82.40
80.00 -Health and Family Welfare - 94.96 94.96299.28 -Water Supply, Sanitation,
Housing and UrbanDevelopment
0.01 374.06 374.07
0.20 -Information and Broadcasting - 0.15 0.1554.13 -Welfare of Scheduled Castes,
Scheduled Tribes and OtherBackward Classes
- 47.24 47.24
14.09 -Social Welfare and Nutrition - - -2.11 -Others - 1.91 1.91
925.67 Economic Services of which 0.98 1,051.59 1,052.579.21 -Agriculture and Allied
Activities0.98 15.50 16.48
-Rural Development - - -21.81 -Special Areas Programmes - 11.38 11.38
208.32 -Irrigation and Flood Control - 395.31 395.31
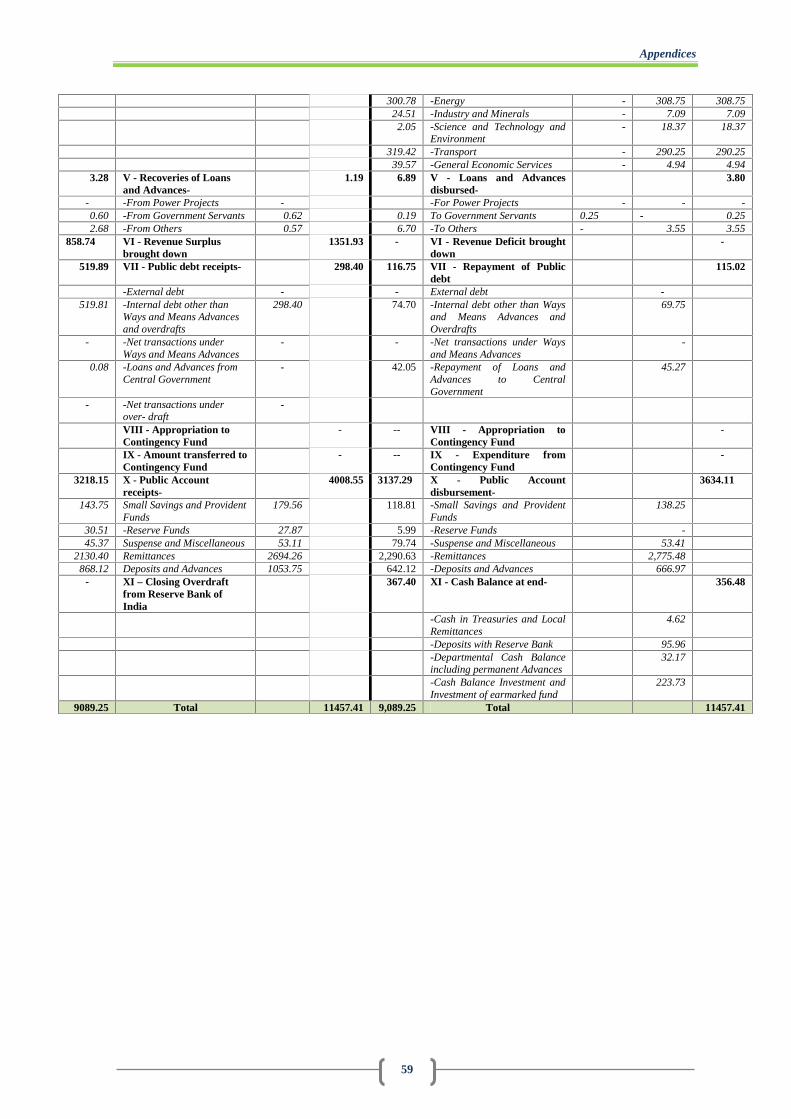
Appendices
59
300.78 -Energy - 308.75 308.7524.51 -Industry and Minerals - 7.09 7.092.05 -Science and Technology and
Environment- 18.37 18.37
319.42 -Transport - 290.25 290.2539.57 -General Economic Services - 4.94 4.94
3.28 V - Recoveries of Loansand Advances-
1.19 6.89 V - Loans and Advancesdisbursed-
3.80
- -From Power Projects - -For Power Projects - - -0.60 -From Government Servants 0.62 0.19 To Government Servants 0.25 - 0.252.68 -From Others 0.57 6.70 -To Others - 3.55 3.55
858.74 VI - Revenue Surplusbrought down
1351.93 - VI - Revenue Deficit broughtdown
-
519.89 VII - Public debt receipts- 298.40 116.75 VII - Repayment of Publicdebt
115.02
-External debt - - External debt -519.81 -Internal debt other than
Ways and Means Advancesand overdrafts
298.40 74.70 -Internal debt other than Waysand Means Advances andOverdrafts
69.75
- -Net transactions underWays and Means Advances
- - -Net transactions under Waysand Means Advances
-
0.08 -Loans and Advances fromCentral Government
- 42.05 -Repayment of Loans andAdvances to CentralGovernment
45.27
- -Net transactions underover- draft
-
VIII - Appropriation toContingency Fund
- -- VIII - Appropriation toContingency Fund
-
IX - Amount transferred toContingency Fund
- -- IX - Expenditure fromContingency Fund
-
3218.15 X - Public Accountreceipts-
4008.55 3137.29 X - Public Accountdisbursement-
3634.11
143.75 Small Savings and ProvidentFunds
179.56 118.81 -Small Savings and ProvidentFunds
138.25
30.51 -Reserve Funds 27.87 5.99 -Reserve Funds -45.37 Suspense and Miscellaneous 53.11 79.74 -Suspense and Miscellaneous 53.41
2130.40 Remittances 2694.26 2,290.63 -Remittances 2,775.48868.12 Deposits and Advances 1053.75 642.12 -Deposits and Advances 666.97
- XI – Closing Overdraftfrom Reserve Bank ofIndia
367.40 XI - Cash Balance at end- 356.48
-Cash in Treasuries and LocalRemittances
4.62
-Deposits with Reserve Bank 95.96-Departmental Cash Balanceincluding permanent Advances
32.17
-Cash Balance Investment andInvestment of earmarked fund
223.73
9089.25 Total 11457.41 9,089.25 Total 11457.41
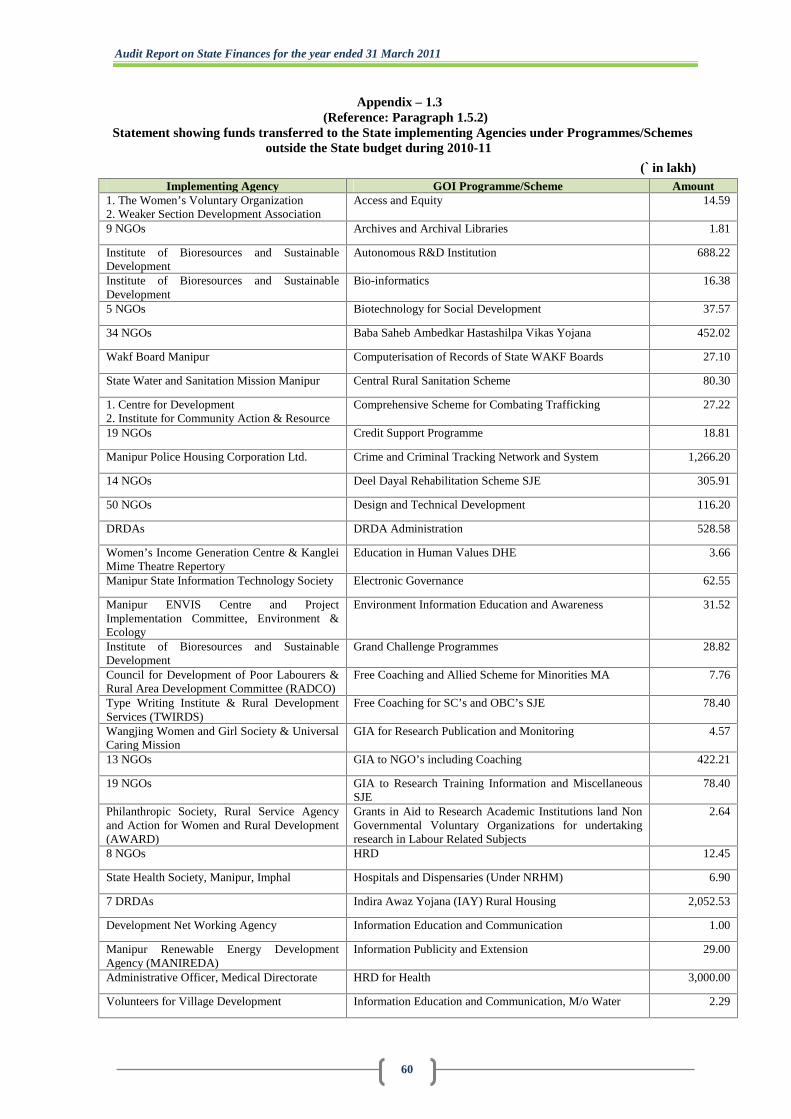
Audit Report on State Finances for the year ended 31 March 2011
60
Appendix – 1.3(Reference: Paragraph 1.5.2)
Statement showing funds transferred to the State implementing Agencies under Programmes/Schemesoutside the State budget during 2010-11
(` in lakh)Implementing Agency GOI Programme/Scheme Amount
1. The Women’s Voluntary Organization2. Weaker Section Development Association
Access and Equity 14.59
9 NGOs Archives and Archival Libraries 1.81
Institute of Bioresources and SustainableDevelopment
Autonomous R&D Institution 688.22
Institute of Bioresources and SustainableDevelopment
Bio-informatics 16.38
5 NGOs Biotechnology for Social Development 37.57
34 NGOs Baba Saheb Ambedkar Hastashilpa Vikas Yojana 452.02
Wakf Board Manipur Computerisation of Records of State WAKF Boards 27.10
State Water and Sanitation Mission Manipur Central Rural Sanitation Scheme 80.30
1. Centre for Development2. Institute for Community Action & Resource
Comprehensive Scheme for Combating Trafficking 27.22
19 NGOs Credit Support Programme 18.81
Manipur Police Housing Corporation Ltd. Crime and Criminal Tracking Network and System 1,266.20
14 NGOs Deel Dayal Rehabilitation Scheme SJE 305.91
50 NGOs Design and Technical Development 116.20
DRDAs DRDA Administration 528.58
Women’s Income Generation Centre & KangleiMime Theatre Repertory
Education in Human Values DHE 3.66
Manipur State Information Technology Society Electronic Governance 62.55
Manipur ENVIS Centre and ProjectImplementation Committee, Environment &Ecology
Environment Information Education and Awareness 31.52
Institute of Bioresources and SustainableDevelopment
Grand Challenge Programmes 28.82
Council for Development of Poor Labourers &Rural Area Development Committee (RADCO)
Free Coaching and Allied Scheme for Minorities MA 7.76
Type Writing Institute & Rural DevelopmentServices (TWIRDS)
Free Coaching for SC’s and OBC’s SJE 78.40
Wangjing Women and Girl Society & UniversalCaring Mission
GIA for Research Publication and Monitoring 4.57
13 NGOs GIA to NGO’s including Coaching 422.21
19 NGOs GIA to Research Training Information and MiscellaneousSJE
78.40
Philanthropic Society, Rural Service Agencyand Action for Women and Rural Development(AWARD)
Grants in Aid to Research Academic Institutions land NonGovernmental Voluntary Organizations for undertakingresearch in Labour Related Subjects
2.64
8 NGOs HRD 12.45
State Health Society, Manipur, Imphal Hospitals and Dispensaries (Under NRHM) 6.90
7 DRDAs Indira Awaz Yojana (IAY) Rural Housing 2,052.53
Development Net Working Agency Information Education and Communication 1.00
Manipur Renewable Energy DevelopmentAgency (MANIREDA)
Information Publicity and Extension 29.00
Administrative Officer, Medical Directorate HRD for Health 3,000.00
Volunteers for Village Development Information Education and Communication, M/o Water 2.29

Appendices
61
Manipur Milk Producer’s Co-operative UnionLtd.
Intensive Dairy Development Programme 200.00
5 DRDAs Integrated Watershed Management Programme (IWMP) 2,670.49
Secretary, MAHUD, Government of Manipur Market Access Initiative 5.52
DOEACC Society, Imphal Centre Manpower Development (including Skill Development inIT)
9.10
9 DRDAs Mahatma Gandhi National Rural Employment NRE 33,945.99
17 NGOs Marketing Support and Services & Export Promotion 240.82
Manipur State Medicinal Plants Board, Manipur Medicinal Plants 7.64
Deputy Commissioner MPs Local Area Development Scheme MPLADS 600.00
Zoom Arts and Cultural Development Museums 54.27
Highland Welfare National Afforestation and Eco-Development Board 3.75
Forest Development Agencies Thoubal, Imphal National Afforestation Programme 1,036.88
Marchang Jims National Overseas Scholarship Scheme 0.02
Manipur State AIDS Control Society, SASO –Social Awareness Service
National AIDS Control Programme including STD Control 2,303.38
State Bamboo Steering Committee (SBSC) National Bamboo Mission 1,307.00
1. 30 NGOs2. Rural Upliftment and DevelopmentOrganisation (RUDO)
National Programme for Youth and AdolescentDevelopment General Component
17.42
Manipur Livestock Development Board Ltd. National Project for Cattle and Buffalo Breeding 361.75
SWSM Manipur, Imphal National Rural Drinking Water Programme 4,020.92
State Health Society, Manipur, Imphal National Rural Health Mission (NRHM) Central Sector 35.00
State Health Society, Manipur, Imphal National Rural Health Mission (NRHM) (including CSP) 5,145.04
Manipur Renewable Energy DevelopmentAgency (MANIREDA)
Off Grid DRPS 289.33
24 NGOs Panchayati Raj Institutions Voluntary Organizations 139.94
Manipur Pollution & Project ImplementationCommittee, Environment & Ecology
Pollution Abatement 36.14
Manipur Rural Roads Development Agency(MSRRDA)
Pradhan Mantri Gram Sadak Yojana (PMGSY) 8,883.00
Manipur Development Society Product/Infrastructure Development for 2,513.52
47 NGOs (Dance and Cultural Organizations) Promotion and Dissemination of Art and Culture 530.80
5 NGOs Promotion of Sports among Disabled 12.00
1. Women’s Worth Organization2. Malem Leima Destitute & BackwardWomen’s Welfare Association
Research & Development (Handicrafts) 4.17
2 NGOs Research & Development Bioresources 169.24
State Implementation Society, SSA, Manipur Rashtriya Madhyamic Shiksha Abhiyan (RMSA) 2,526.00
2 NGOs Research and Development Support (SERC) 322.81
Development Network Agency Research and Development Water Resources 0.28
4 NGOs Research Information and Mass Education – Tribal 1.08
State Implementation Society, SSA, Manipur Sarva Shiksha Abhiyan (SSA) 13,253.77
1. The Centre for Rural Development2. S. Kula Women College
Scheme for Human Resources Development FPI 3.00
Rishang Keishing Foundation for Managementfor Tribal Areas MASTA
Scheme for Infrastructure Development FPI 100.00
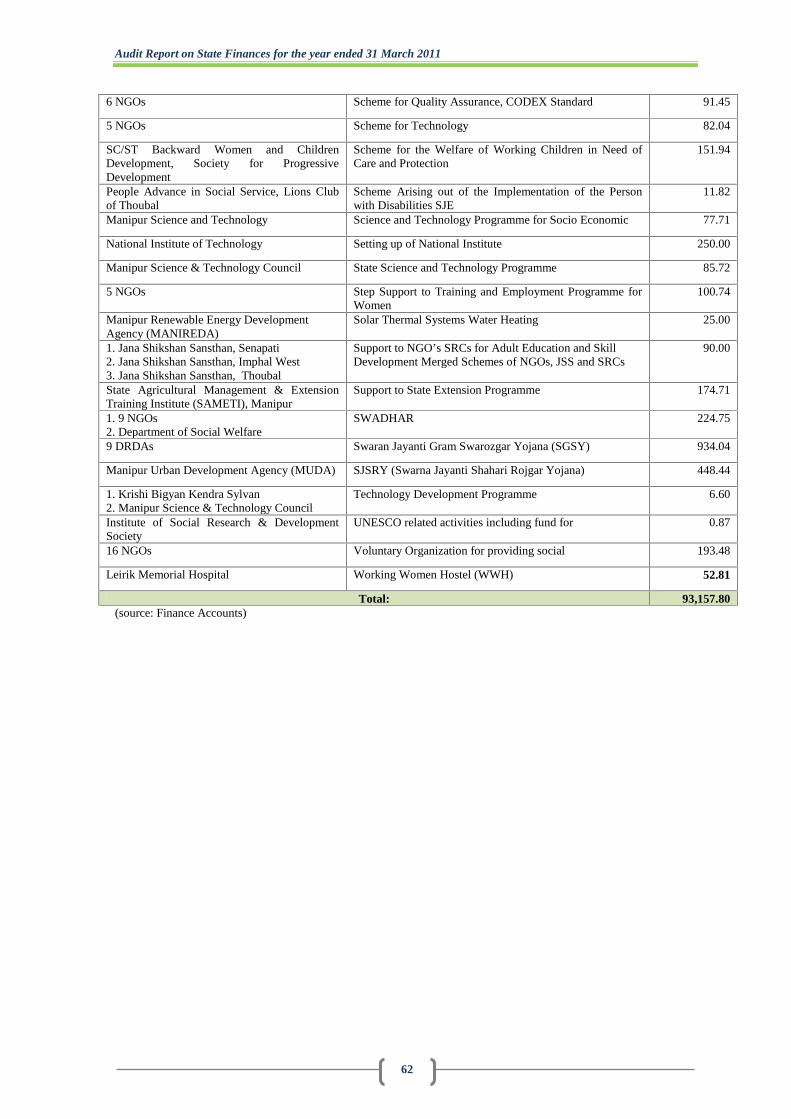
Audit Report on State Finances for the year ended 31 March 2011
62
6 NGOs Scheme for Quality Assurance, CODEX Standard 91.45
5 NGOs Scheme for Technology 82.04
SC/ST Backward Women and ChildrenDevelopment, Society for ProgressiveDevelopment
Scheme for the Welfare of Working Children in Need ofCare and Protection
151.94
People Advance in Social Service, Lions Clubof Thoubal
Scheme Arising out of the Implementation of the Personwith Disabilities SJE
11.82
Manipur Science and Technology Science and Technology Programme for Socio Economic 77.71
National Institute of Technology Setting up of National Institute 250.00
Manipur Science & Technology Council State Science and Technology Programme 85.72
5 NGOs Step Support to Training and Employment Programme forWomen
100.74
Manipur Renewable Energy DevelopmentAgency (MANIREDA)
Solar Thermal Systems Water Heating 25.00
1. Jana Shikshan Sansthan, Senapati2. Jana Shikshan Sansthan, Imphal West3. Jana Shikshan Sansthan, Thoubal
Support to NGO’s SRCs for Adult Education and SkillDevelopment Merged Schemes of NGOs, JSS and SRCs
90.00
State Agricultural Management & ExtensionTraining Institute (SAMETI), Manipur
Support to State Extension Programme 174.71
1. 9 NGOs2. Department of Social Welfare
SWADHAR 224.75
9 DRDAs Swaran Jayanti Gram Swarozgar Yojana (SGSY) 934.04
Manipur Urban Development Agency (MUDA) SJSRY (Swarna Jayanti Shahari Rojgar Yojana) 448.44
1. Krishi Bigyan Kendra Sylvan2. Manipur Science & Technology Council
Technology Development Programme 6.60
Institute of Social Research & DevelopmentSociety
UNESCO related activities including fund for 0.87
16 NGOs Voluntary Organization for providing social 193.48
Leirik Memorial Hospital Working Women Hostel (WWH) 52.81
Total: 93,157.80(source: Finance Accounts)
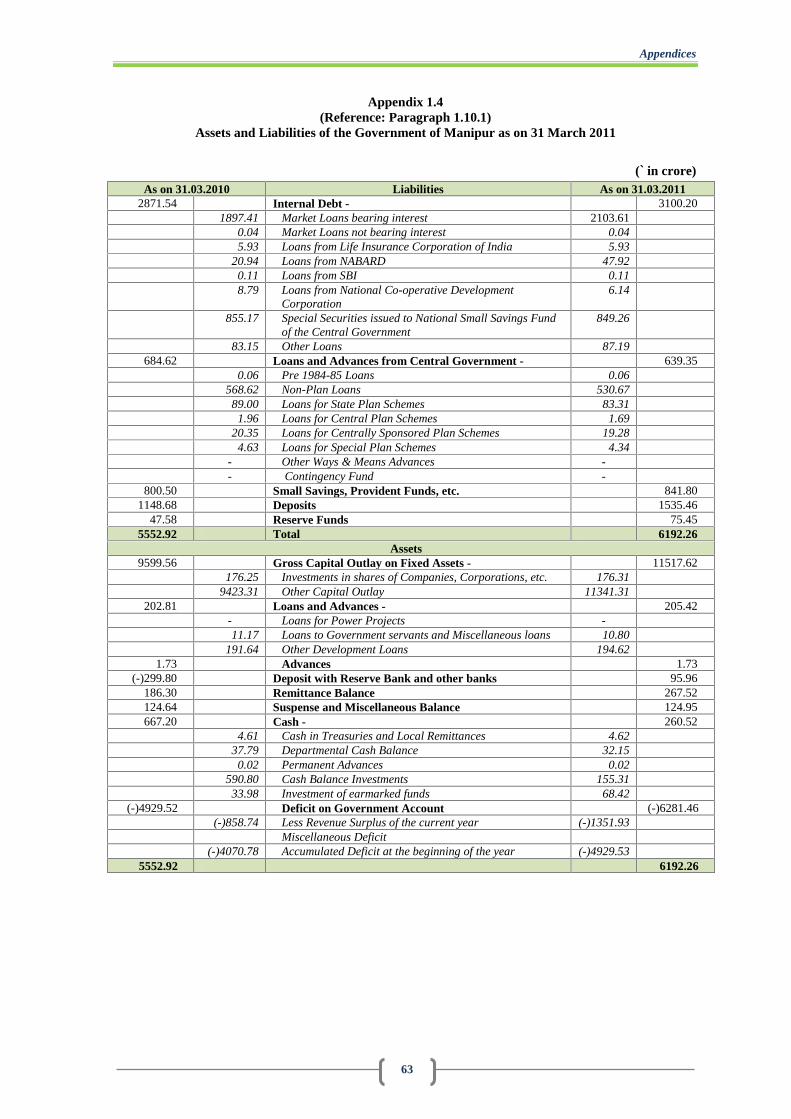
Appendices
63
Appendix 1.4(Reference: Paragraph 1.10.1)
Assets and Liabilities of the Government of Manipur as on 31 March 2011
(` in crore)As on 31.03.2010 Liabilities As on 31.03.2011
2871.54 Internal Debt - 3100.201897.41 Market Loans bearing interest 2103.61
0.04 Market Loans not bearing interest 0.045.93 Loans from Life Insurance Corporation of India 5.93
20.94 Loans from NABARD 47.920.11 Loans from SBI 0.118.79 Loans from National Co-operative Development
Corporation6.14
855.17 Special Securities issued to National Small Savings Fundof the Central Government
849.26
83.15 Other Loans 87.19684.62 Loans and Advances from Central Government - 639.35
0.06 Pre 1984-85 Loans 0.06568.62 Non-Plan Loans 530.6789.00 Loans for State Plan Schemes 83.31
1.96 Loans for Central Plan Schemes 1.6920.35 Loans for Centrally Sponsored Plan Schemes 19.28
4.63 Loans for Special Plan Schemes 4.34- Other Ways & Means Advances -- Contingency Fund -
800.50 Small Savings, Provident Funds, etc. 841.801148.68 Deposits 1535.46
47.58 Reserve Funds 75.455552.92 Total 6192.26
Assets9599.56 Gross Capital Outlay on Fixed Assets - 11517.62
176.25 Investments in shares of Companies, Corporations, etc. 176.319423.31 Other Capital Outlay 11341.31
202.81 Loans and Advances - 205.42- Loans for Power Projects -11.17 Loans to Government servants and Miscellaneous loans 10.80
191.64 Other Development Loans 194.621.73 Advances 1.73
(-)299.80 Deposit with Reserve Bank and other banks 95.96186.30 Remittance Balance 267.52124.64 Suspense and Miscellaneous Balance 124.95667.20 Cash - 260.52
4.61 Cash in Treasuries and Local Remittances 4.6237.79 Departmental Cash Balance 32.15
0.02 Permanent Advances 0.02590.80 Cash Balance Investments 155.3133.98 Investment of earmarked funds 68.42
(-)4929.52 Deficit on Government Account (-)6281.46(-)858.74 Less Revenue Surplus of the current year (-)1351.93
Miscellaneous Deficit(-)4070.78 Accumulated Deficit at the beginning of the year (-)4929.53
5552.92 6192.26
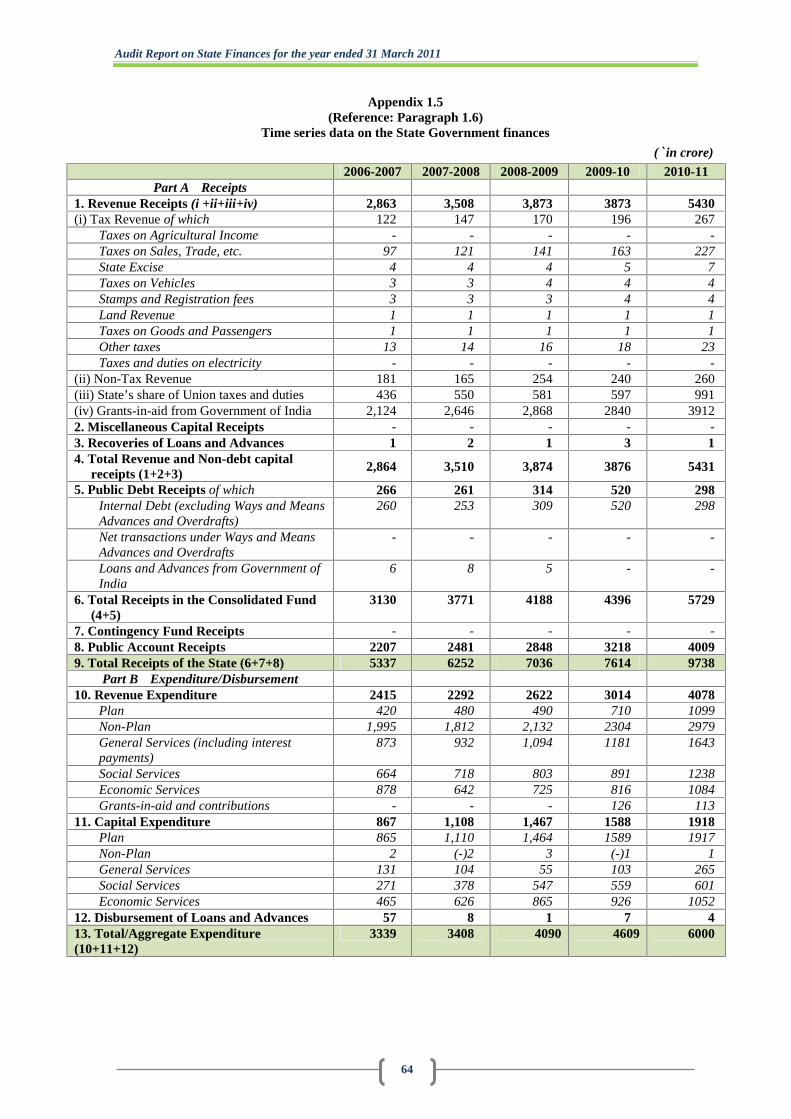
Audit Report on State Finances for the year ended 31 March 2011
64
Appendix 1.5(Reference: Paragraph 1.6)
Time series data on the State Government finances
(` in crore)
2006-2007 2007-2008 2008-2009 2009-10 2010-11Part A Receipts
1. Revenue Receipts (i +ii+iii+iv) 2,863 3,508 3,873 3873 5430(i) Tax Revenue of which 122 147 170 196 267
Taxes on Agricultural Income - - - - -Taxes on Sales, Trade, etc. 97 121 141 163 227State Excise 4 4 4 5 7Taxes on Vehicles 3 3 4 4 4Stamps and Registration fees 3 3 3 4 4Land Revenue 1 1 1 1 1Taxes on Goods and Passengers 1 1 1 1 1Other taxes 13 14 16 18 23Taxes and duties on electricity - - - - -
(ii) Non-Tax Revenue 181 165 254 240 260(iii) State’s share of Union taxes and duties 436 550 581 597 991(iv) Grants-in-aid from Government of India 2,124 2,646 2,868 2840 39122. Miscellaneous Capital Receipts - - - - -3. Recoveries of Loans and Advances 1 2 1 3 14. Total Revenue and Non-debt capital
receipts (1+2+3) 2,864 3,510 3,874 3876 5431
5. Public Debt Receipts of which 266 261 314 520 298Internal Debt (excluding Ways and MeansAdvances and Overdrafts)
260 253 309 520 298
Net transactions under Ways and MeansAdvances and Overdrafts
- - - - -
Loans and Advances from Government ofIndia
6 8 5 - -
6. Total Receipts in the Consolidated Fund(4+5)
3130 3771 4188 4396 5729
7. Contingency Fund Receipts - - - - -8. Public Account Receipts 2207 2481 2848 3218 40099. Total Receipts of the State (6+7+8) 5337 6252 7036 7614 9738
Part B Expenditure/Disbursement10. Revenue Expenditure 2415 2292 2622 3014 4078
Plan 420 480 490 710 1099Non-Plan 1,995 1,812 2,132 2304 2979General Services (including interestpayments)
873 932 1,094 1181 1643
Social Services 664 718 803 891 1238Economic Services 878 642 725 816 1084Grants-in-aid and contributions - - - 126 113
11. Capital Expenditure 867 1,108 1,467 1588 1918Plan 865 1,110 1,464 1589 1917Non-Plan 2 (-)2 3 (-)1 1General Services 131 104 55 103 265Social Services 271 378 547 559 601Economic Services 465 626 865 926 1052
12. Disbursement of Loans and Advances 57 8 1 7 413. Total/Aggregate Expenditure(10+11+12)
3339 3408 4090 4609 6000
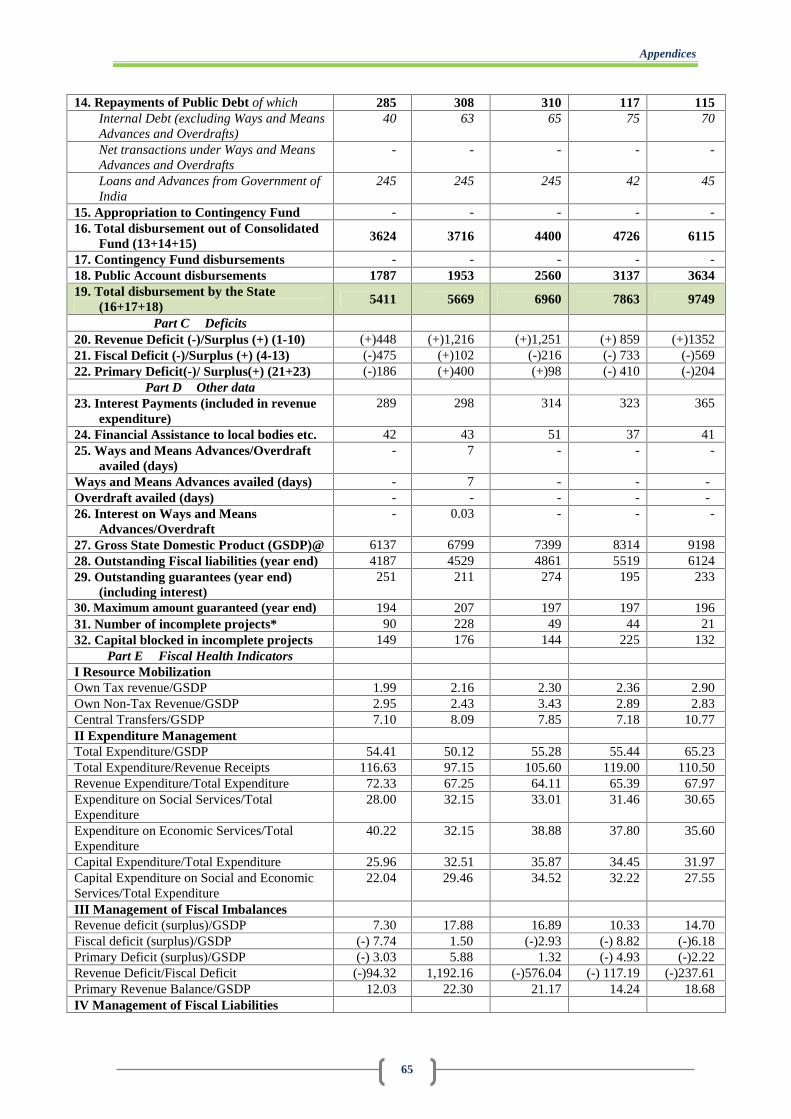
Appendices
65
14. Repayments of Public Debt of which 285 308 310 117 115Internal Debt (excluding Ways and MeansAdvances and Overdrafts)
40 63 65 75 70
Net transactions under Ways and MeansAdvances and Overdrafts
- - - - -
Loans and Advances from Government ofIndia
245 245 245 42 45
15. Appropriation to Contingency Fund - - - - -16. Total disbursement out of Consolidated
Fund (13+14+15) 3624 3716 4400 4726 6115
17. Contingency Fund disbursements - - - - -18. Public Account disbursements 1787 1953 2560 3137 363419. Total disbursement by the State
(16+17+18)5411 5669 6960 7863 9749
Part C Deficits20. Revenue Deficit (-)/Surplus (+) (1-10) (+)448 (+)1,216 (+)1,251 (+) 859 (+)135221. Fiscal Deficit (-)/Surplus (+) (4-13) (-)475 (+)102 (-)216 (-) 733 (-)56922. Primary Deficit(-)/ Surplus(+) (21+23) (-)186 (+)400 (+)98 (-) 410 (-)204
Part D Other data23. Interest Payments (included in revenue
expenditure)289 298 314 323 365
24. Financial Assistance to local bodies etc. 42 43 51 37 4125. Ways and Means Advances/Overdraft
availed (days)- 7 - - -
Ways and Means Advances availed (days) - 7 - - -Overdraft availed (days) - - - - -26. Interest on Ways and Means
Advances/Overdraft- 0.03 - - -
27. Gross State Domestic Product (GSDP)@ 6137 6799 7399 8314 919828. Outstanding Fiscal liabilities (year end) 4187 4529 4861 5519 612429. Outstanding guarantees (year end)
(including interest)251 211 274 195 233
30. Maximum amount guaranteed (year end) 194 207 197 197 19631. Number of incomplete projects* 90 228 49 44 2132. Capital blocked in incomplete projects 149 176 144 225 132
Part E Fiscal Health IndicatorsI Resource MobilizationOwn Tax revenue/GSDP 1.99 2.16 2.30 2.36 2.90Own Non-Tax Revenue/GSDP 2.95 2.43 3.43 2.89 2.83Central Transfers/GSDP 7.10 8.09 7.85 7.18 10.77II Expenditure ManagementTotal Expenditure/GSDP 54.41 50.12 55.28 55.44 65.23Total Expenditure/Revenue Receipts 116.63 97.15 105.60 119.00 110.50Revenue Expenditure/Total Expenditure 72.33 67.25 64.11 65.39 67.97Expenditure on Social Services/TotalExpenditure
28.00 32.15 33.01 31.46 30.65
Expenditure on Economic Services/TotalExpenditure
40.22 32.15 38.88 37.80 35.60
Capital Expenditure/Total Expenditure 25.96 32.51 35.87 34.45 31.97Capital Expenditure on Social and EconomicServices/Total Expenditure
22.04 29.46 34.52 32.22 27.55
III Management of Fiscal ImbalancesRevenue deficit (surplus)/GSDP 7.30 17.88 16.89 10.33 14.70Fiscal deficit (surplus)/GSDP (-) 7.74 1.50 (-)2.93 (-) 8.82 (-)6.18Primary Deficit (surplus)/GSDP (-) 3.03 5.88 1.32 (-) 4.93 (-)2.22Revenue Deficit/Fiscal Deficit (-)94.32 1,192.16 (-)576.04 (-) 117.19 (-)237.61Primary Revenue Balance/GSDP 12.03 22.30 21.17 14.24 18.68IV Management of Fiscal Liabilities
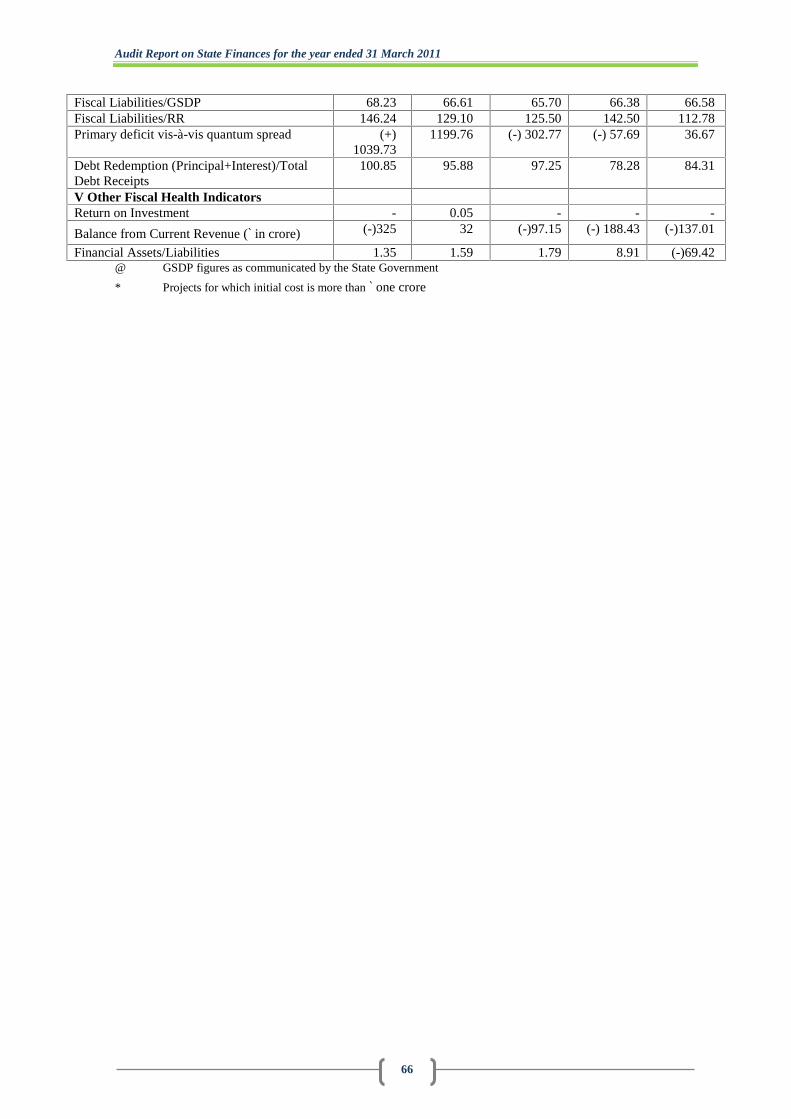
Audit Report on State Finances for the year ended 31 March 2011
66
Fiscal Liabilities/GSDP 68.23 66.61 65.70 66.38 66.58Fiscal Liabilities/RR 146.24 129.10 125.50 142.50 112.78Primary deficit vis-à-vis quantum spread (+)
1039.731199.76 (-) 302.77 (-) 57.69 36.67
Debt Redemption (Principal+Interest)/TotalDebt Receipts
100.85 95.88 97.25 78.28 84.31
V Other Fiscal Health IndicatorsReturn on Investment - 0.05 - - -
Balance from Current Revenue (` in crore) (-)325 32 (-)97.15 (-) 188.43 (-)137.01
Financial Assets/Liabilities 1.35 1.59 1.79 8.91 (-)69.42@ GSDP figures as communicated by the State Government
* Projects for which initial cost is more than ` one crore

Appendices
67
Appendix 2.1(Reference: Paragraph 2.3.1)
Statement of various Grants/Appropriations where savings was more than ` one crore ineach case or more than 25 per cent of the total provision
(` in lakh)
Sl.no. Grant/ Appropriation
Totalprovision Saving
Percentageof savings
(1) (2) (3) (4) (5)
Revenue Voted
1 1 – State Legislature 2795.72 270.94 102 3 – Secretariat 5603.06 563.41 10
34 – Land Revenue, Stamps & Registration and District
Administration 5151.51 619.44 124 7 – Police 63209.89 1746.20 35 8 – Public Works Department 16776.22 1349.63 86 10 – Education 61085.74 8666.14 147 11 – Medical, Health and Family Welfare Services 22141.92 1209.19 5
812 – Municipal Administration, Housing and Urban
Development 6511.83 409.49 6
914 – Development of Scheduled Tribes and Scheduled
Castes Department 24958.68 761.62 310 15 – Consumer Affairs, Food and Public Distribution 1099.93 200.48 1811 16 – Co-operation 1427.48 144.48 1012 17 – Agriculture 12742.66 2877.59 23
1318 – Animal Husbandry and Veterinary including Dairy
Farming 5557.71 549.20 1014 19 – Environment and Forest 8678.95 545.12 6
1520 – Community Development and ANP, IRDP and
NREP 11382.57 1224.78 1116 21 – Commerce & Industries 5708.56 822.87 1417 22 – Public Health Engineering 5314.57 599.80 1118 23 – Power 21041.84 435.53 219 26 – Administration of Justice 1807.98 203.21 1120 28 – State Excise 1372.61 148.83 1121 30 – Planning 30740.84 13187.51 4322 37 – Fisheries 2525.06 138.06 523 38 – Panchayat 3706.16 587.56 1624 40 – Irrigation and Flood Control Department 5121.37 476.20 925 43 – Horticulture and Soil Conservation 5126.92 141.31 326 44 – Social Welfare Department 14735.95 929.13 627 47 - Welfare of Minorities and Other Backward Classes 2503.85 260.39 1028 48 – Relief and Disaster Management 925.93 373.36 4029 49 – Economics & Statistics 1063.50 220.08 2130 50 – Information Technology 513.70 140.11 27
Revenue Charged
31 Appropriation No. 2 37265.65 787.87 232 5 – Finance Department 10.01 9.09 9133 8 – Public Works Department 100.20 65.38 6534 26 – Administration of Justice 609.12 609.12 100
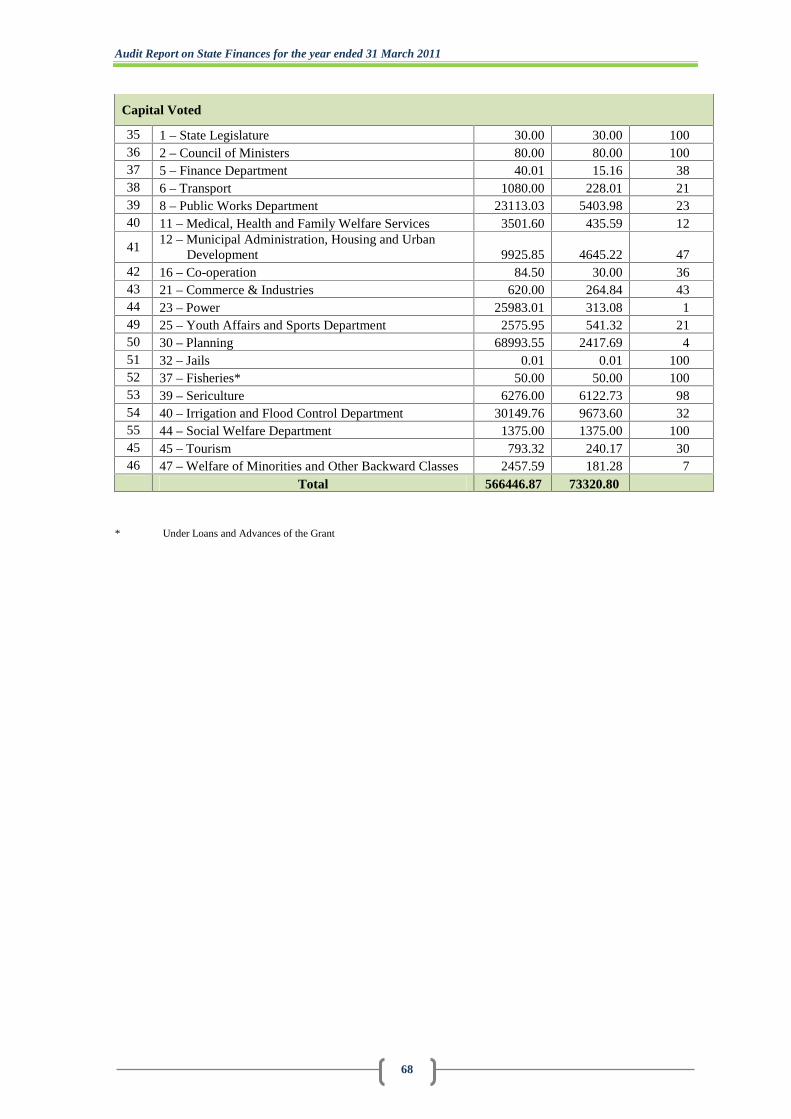
Audit Report on State Finances for the year ended 31 March 2011
68
Capital Voted
35 1 – State Legislature 30.00 30.00 10036 2 – Council of Ministers 80.00 80.00 10037 5 – Finance Department 40.01 15.16 3838 6 – Transport 1080.00 228.01 2139 8 – Public Works Department 23113.03 5403.98 2340 11 – Medical, Health and Family Welfare Services 3501.60 435.59 12
4112 – Municipal Administration, Housing and Urban
Development 9925.85 4645.22 4742 16 – Co-operation 84.50 30.00 3643 21 – Commerce & Industries 620.00 264.84 4344 23 – Power 25983.01 313.08 149 25 – Youth Affairs and Sports Department 2575.95 541.32 2150 30 – Planning 68993.55 2417.69 451 32 – Jails 0.01 0.01 10052 37 – Fisheries* 50.00 50.00 10053 39 – Sericulture 6276.00 6122.73 9854 40 – Irrigation and Flood Control Department 30149.76 9673.60 3255 44 – Social Welfare Department 1375.00 1375.00 10045 45 – Tourism 793.32 240.17 3046 47 – Welfare of Minorities and Other Backward Classes 2457.59 181.28 7
Total 566446.87 73320.80
* Under Loans and Advances of the Grant

Appendices
69
Appendix 2.2(Reference: Paragraph 2.3.4)
Statement showing expenditure incurred without provision during 2010-11
(` in crore)
Sl.No.
No. and Name of Grants(Heads of Accounts)
Amount ofExpenditure
without provision
Reasons/Remarks
Grant No. 7 – Police
1 3454.01.800.21 0.47
Reasons for incurring expenditurewithout provisions had not beenintimated (November 2011) normentioned in the detailedappropriation account
2 4055(SP).207.17(V) 0.85 -do-Grant No. 8 – Public Works Department
3 5054(SP).01.337.45(V) 14.37 -do-Grant No. 11 – Medical, Health and Family Welfare Services
4 2210(SP).01.110.15(H) 3.73 -do-5 2211(CSS).105.04(V) 0.13 -do-
Grant No. 14 – Development of Scheduled Tribes & Scheduled Castes Department6 2225(SP).02.277.06(V) 2.48 -do-7 4225(SP).02.800.31(V) 8.22 -do-8 4225(CSS).02.800.10(V) 13.73 -do-
Grant No. 17 - Agriculture9 2401(SP).104.35(V) 0.03 -do-10 4705(SP).800.01(V) 2.00 -do-
Grant No. 18 – Animal Husbandry and Veterinary including Dairy Farming11 2404(SP).102.25(V) 0.20 -do-
Grant No. 19 – Environment and Forest12 2406(SP).01.101.08(H) 0.11 -do-13 2406(CSS).01.101.04(H) 0.50 -do-
Grant No. 21 – Commerce & Industries14 2851(SP).001.01(H) 0.13 -do-15 2851(SP).102.21(H) 0.02 -do-
Grant No. 22 – Public Health Engineering16 4215(SP).01.102.09.(H) 1.68 -do-17 4215(CPS).01.102.02(H) 15.64 -do-
Grant No. 23 – Power18 4801(SP).05.799.03(H) 0.02 -do-19 4801(SP).05.799.90(H) 0.94 -do-
Grant No. 25 – Youth Affairs and Sports Department20 4202(SP).03.800.12(V) 0.05 -do-21 4202(SP).03.800.13(V) 0.50 -do-
Grant No. 30 – Planning22 4059(SP).01.101.01(H) 48.15 -do-
Total 113.95
‘H’ stands for Hill, ‘V’ for Valley, ‘SP’ for State Plan and ‘CSS’ for Centrally Sponsored Scheme
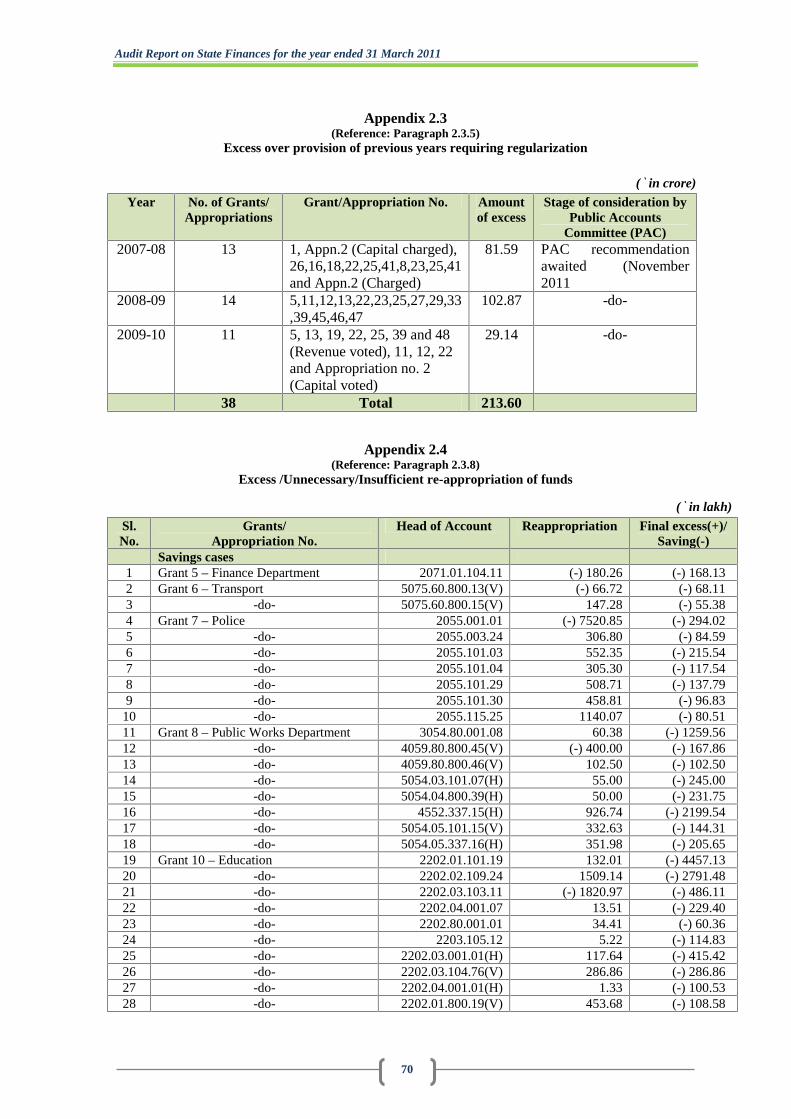
Audit Report on State Finances for the year ended 31 March 2011
70
Appendix 2.3(Reference: Paragraph 2.3.5)
Excess over provision of previous years requiring regularization
(` in crore)
Year No. of Grants/Appropriations
Grant/Appropriation No. Amountof excess
Stage of consideration byPublic Accounts
Committee (PAC)2007-08 13 1, Appn.2 (Capital charged),
26,16,18,22,25,41,8,23,25,41and Appn.2 (Charged)
81.59 PAC recommendationawaited (November2011
2008-09 14 5,11,12,13,22,23,25,27,29,33,39,45,46,47
102.87 -do-
2009-10 11 5, 13, 19, 22, 25, 39 and 48(Revenue voted), 11, 12, 22and Appropriation no. 2(Capital voted)
29.14 -do-
38 Total 213.60
Appendix 2.4(Reference: Paragraph 2.3.8)
Excess /Unnecessary/Insufficient re-appropriation of funds
(` in lakh)
Sl.No.
Grants/Appropriation No.
Head of Account Reappropriation Final excess(+)/Saving(-)
Savings cases1 Grant 5 – Finance Department 2071.01.104.11 (-) 180.26 (-) 168.132 Grant 6 – Transport 5075.60.800.13(V) (-) 66.72 (-) 68.113 -do- 5075.60.800.15(V) 147.28 (-) 55.384 Grant 7 – Police 2055.001.01 (-) 7520.85 (-) 294.025 -do- 2055.003.24 306.80 (-) 84.596 -do- 2055.101.03 552.35 (-) 215.547 -do- 2055.101.04 305.30 (-) 117.548 -do- 2055.101.29 508.71 (-) 137.799 -do- 2055.101.30 458.81 (-) 96.83
10 -do- 2055.115.25 1140.07 (-) 80.5111 Grant 8 – Public Works Department 3054.80.001.08 60.38 (-) 1259.5612 -do- 4059.80.800.45(V) (-) 400.00 (-) 167.8613 -do- 4059.80.800.46(V) 102.50 (-) 102.5014 -do- 5054.03.101.07(H) 55.00 (-) 245.0015 -do- 5054.04.800.39(H) 50.00 (-) 231.7516 -do- 4552.337.15(H) 926.74 (-) 2199.5417 -do- 5054.05.101.15(V) 332.63 (-) 144.3118 -do- 5054.05.337.16(H) 351.98 (-) 205.6519 Grant 10 – Education 2202.01.101.19 132.01 (-) 4457.1320 -do- 2202.02.109.24 1509.14 (-) 2791.4821 -do- 2202.03.103.11 (-) 1820.97 (-) 486.1122 -do- 2202.04.001.07 13.51 (-) 229.4023 -do- 2202.80.001.01 34.41 (-) 60.3624 -do- 2203.105.12 5.22 (-) 114.8325 -do- 2202.03.001.01(H) 117.64 (-) 415.4226 -do- 2202.03.104.76(V) 286.86 (-) 286.8627 -do- 2202.04.001.01(H) 1.33 (-) 100.5328 -do- 2202.01.800.19(V) 453.68 (-) 108.58
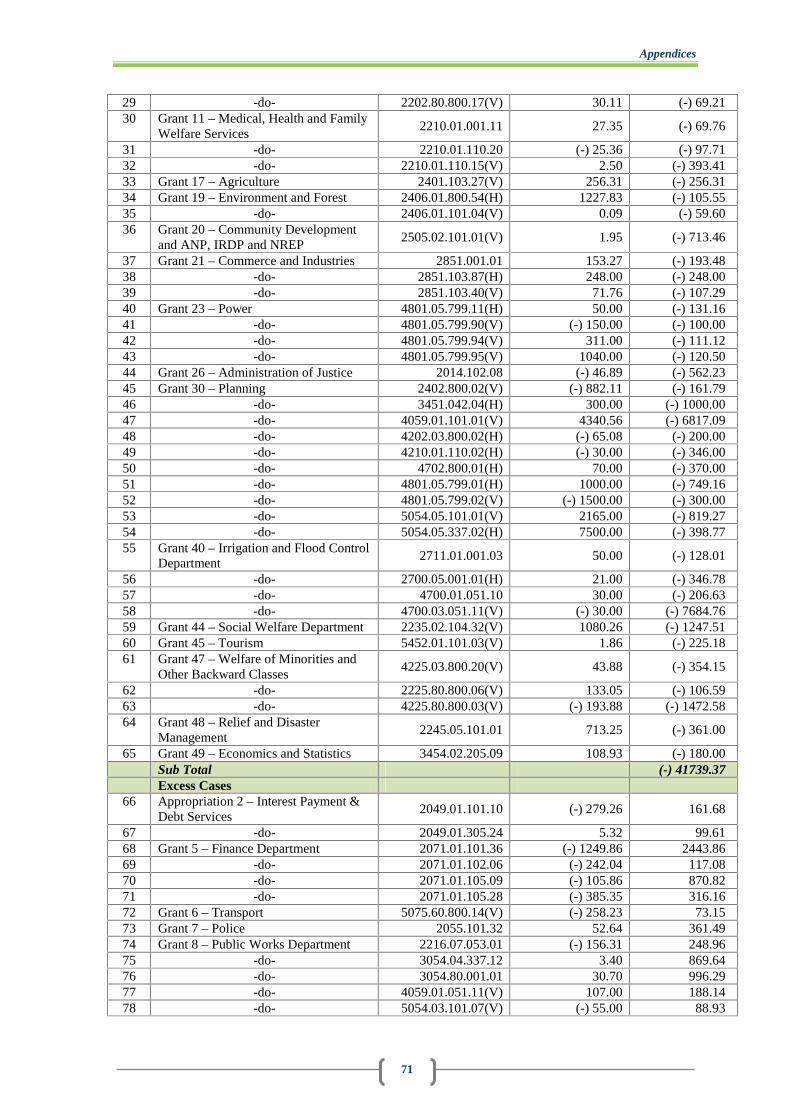
Appendices
71
29 -do- 2202.80.800.17(V) 30.11 (-) 69.2130 Grant 11 – Medical, Health and Family
Welfare Services2210.01.001.11 27.35 (-) 69.76
31 -do- 2210.01.110.20 (-) 25.36 (-) 97.7132 -do- 2210.01.110.15(V) 2.50 (-) 393.4133 Grant 17 – Agriculture 2401.103.27(V) 256.31 (-) 256.3134 Grant 19 – Environment and Forest 2406.01.800.54(H) 1227.83 (-) 105.5535 -do- 2406.01.101.04(V) 0.09 (-) 59.6036 Grant 20 – Community Development
and ANP, IRDP and NREP2505.02.101.01(V) 1.95 (-) 713.46
37 Grant 21 – Commerce and Industries 2851.001.01 153.27 (-) 193.4838 -do- 2851.103.87(H) 248.00 (-) 248.0039 -do- 2851.103.40(V) 71.76 (-) 107.2940 Grant 23 – Power 4801.05.799.11(H) 50.00 (-) 131.1641 -do- 4801.05.799.90(V) (-) 150.00 (-) 100.0042 -do- 4801.05.799.94(V) 311.00 (-) 111.1243 -do- 4801.05.799.95(V) 1040.00 (-) 120.5044 Grant 26 – Administration of Justice 2014.102.08 (-) 46.89 (-) 562.2345 Grant 30 – Planning 2402.800.02(V) (-) 882.11 (-) 161.7946 -do- 3451.042.04(H) 300.00 (-) 1000.0047 -do- 4059.01.101.01(V) 4340.56 (-) 6817.0948 -do- 4202.03.800.02(H) (-) 65.08 (-) 200.0049 -do- 4210.01.110.02(H) (-) 30.00 (-) 346.0050 -do- 4702.800.01(H) 70.00 (-) 370.0051 -do- 4801.05.799.01(H) 1000.00 (-) 749.1652 -do- 4801.05.799.02(V) (-) 1500.00 (-) 300.0053 -do- 5054.05.101.01(V) 2165.00 (-) 819.2754 -do- 5054.05.337.02(H) 7500.00 (-) 398.7755 Grant 40 – Irrigation and Flood Control
Department2711.01.001.03 50.00 (-) 128.01
56 -do- 2700.05.001.01(H) 21.00 (-) 346.7857 -do- 4700.01.051.10 30.00 (-) 206.6358 -do- 4700.03.051.11(V) (-) 30.00 (-) 7684.7659 Grant 44 – Social Welfare Department 2235.02.104.32(V) 1080.26 (-) 1247.5160 Grant 45 – Tourism 5452.01.101.03(V) 1.86 (-) 225.1861 Grant 47 – Welfare of Minorities and
Other Backward Classes4225.03.800.20(V) 43.88 (-) 354.15
62 -do- 2225.80.800.06(V) 133.05 (-) 106.5963 -do- 4225.80.800.03(V) (-) 193.88 (-) 1472.5864 Grant 48 – Relief and Disaster
Management2245.05.101.01 713.25 (-) 361.00
65 Grant 49 – Economics and Statistics 3454.02.205.09 108.93 (-) 180.00Sub Total (-) 41739.37Excess Cases
66 Appropriation 2 – Interest Payment &Debt Services
2049.01.101.10 (-) 279.26 161.68
67 -do- 2049.01.305.24 5.32 99.6168 Grant 5 – Finance Department 2071.01.101.36 (-) 1249.86 2443.8669 -do- 2071.01.102.06 (-) 242.04 117.0870 -do- 2071.01.105.09 (-) 105.86 870.8271 -do- 2071.01.105.28 (-) 385.35 316.1672 Grant 6 – Transport 5075.60.800.14(V) (-) 258.23 73.1573 Grant 7 – Police 2055.101.32 52.64 361.4974 Grant 8 – Public Works Department 2216.07.053.01 (-) 156.31 248.9675 -do- 3054.04.337.12 3.40 869.6476 -do- 3054.80.001.01 30.70 996.2977 -do- 4059.01.051.11(V) 107.00 188.1478 -do- 5054.03.101.07(V) (-) 55.00 88.93

Audit Report on State Finances for the year ended 31 March 2011
72
79 -do- 5054.04.800.37(V) (-) 50.00 888.9080 -do- 5054.05.337.15(V) 70.15 332.6881 Grant 10 – Education 2202.02.101.24 4.53 133.4782 -do- 2202.03.001.01(V) (-) 300.00 410.6283 -do- 2202.03.103.31(V) (-) 128.00 69.7184 -do- 2202.04.001.01(V) (-) 1.33 100.4985 Grant 12 – Municipal Administration,
Housing and Urban Development4217.01.800.06(V) 300.77 99.64
86 Grant 14 – Development of ScheduledTribes & Scheduled Castes Department
2225.02.800.07(V) 88.32 95.89
87 Grant 19 – Environment and Forest 2406.01.800.54(V) (-) 1227.83 105.8088 Grant 20 – Community Development
and ANP, IRDP and NREP2515.102.02 94.87 345.29
89 -do- 2575.02.101.01(V) (-) 209.00 209.0090 Grant 21 – Commerce & Industries 2851.103.87(V) (-) 248.00 248.0091 -do- 2851.103.31(V) (-) 395.75 395.7592 Grant 22 – Public Health Engineering 4059.01.102.18(V) (-) 210.00 210.0093 Grant 30 – Planning 3451.092.04(V) 765.00 1000.0094 -do- 4210.01.110.02(V) (-) 530.00 341.1095 -do- 4217.60.051.04(V) (-) 741.83 100.0096 -do- 4702.800.01(V) 103.78 370.0097 -do- 4801.05.799.01(V) (-) 111.11 424.2798 -do- 5054.05.337.02(V) (-) 1082.50 1082.4699 Grant 36 – Minor Irrigation 4702.800.02(V) (-) 187.05 304.80
100 Grant 39 – Sericulture 4851.107.14(V) (-) 6211.00 88.55101 Grant 40 – Irrigation and Flood Control
Department2700.05.001.01(V) (-) 21.00 288.49
102 46 – Science and Technology 2501.04.105.08(V) 18.00 98.50Sub Total 14579.22Total (-) 27160.15
‘V’ stands for Valley and ‘H’ stands for Hill
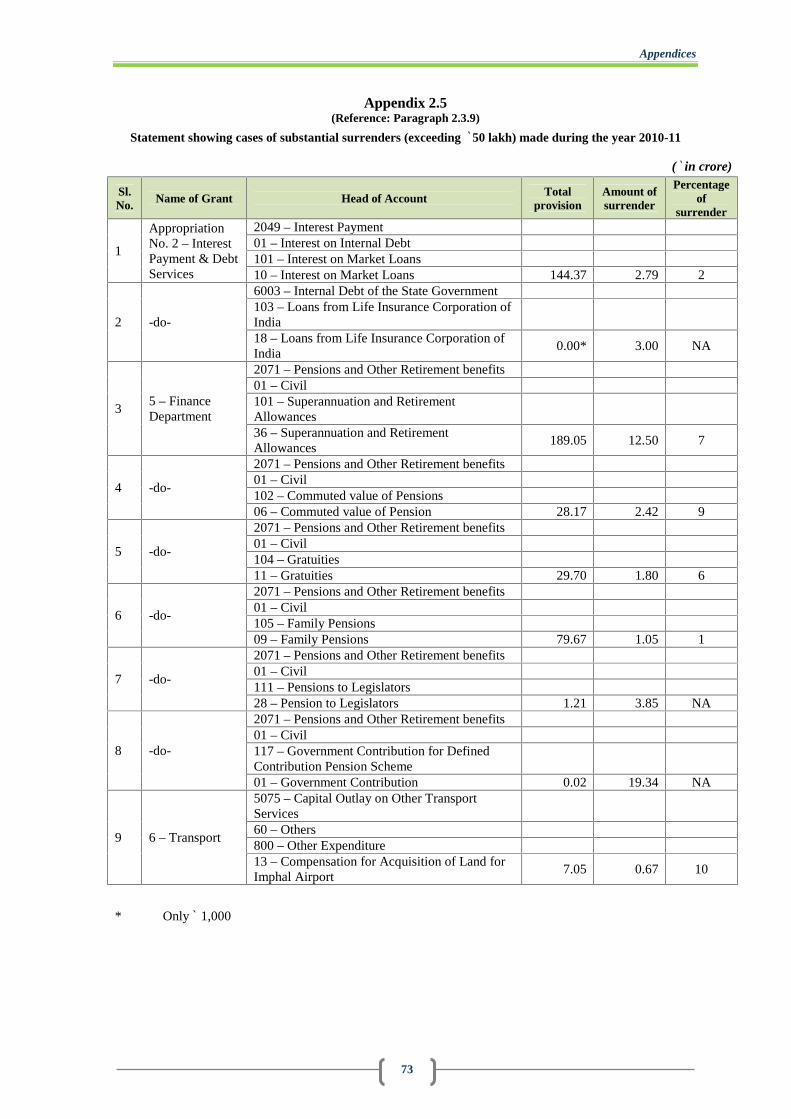
Appendices
73
Appendix 2.5(Reference: Paragraph 2.3.9)
Statement showing cases of substantial surrenders (exceeding ` 50 lakh) made during the year 2010-11
(` in crore)
Sl.No. Name of Grant Head of Account Total
provisionAmount ofsurrender
Percentageof
surrender
1
AppropriationNo. 2 – InterestPayment & DebtServices
2049 – Interest Payment01 – Interest on Internal Debt101 – Interest on Market Loans10 – Interest on Market Loans 144.37 2.79 2
2 -do-
6003 – Internal Debt of the State Government103 – Loans from Life Insurance Corporation ofIndia18 – Loans from Life Insurance Corporation ofIndia
0.00* 3.00 NA
35 – FinanceDepartment
2071 – Pensions and Other Retirement benefits01 – Civil101 – Superannuation and RetirementAllowances36 – Superannuation and RetirementAllowances
189.05 12.50 7
4 -do-
2071 – Pensions and Other Retirement benefits01 – Civil102 – Commuted value of Pensions06 – Commuted value of Pension 28.17 2.42 9
5 -do-
2071 – Pensions and Other Retirement benefits01 – Civil104 – Gratuities11 – Gratuities 29.70 1.80 6
6 -do-
2071 – Pensions and Other Retirement benefits01 – Civil105 – Family Pensions09 – Family Pensions 79.67 1.05 1
7 -do-
2071 – Pensions and Other Retirement benefits01 – Civil111 – Pensions to Legislators28 – Pension to Legislators 1.21 3.85 NA
8 -do-
2071 – Pensions and Other Retirement benefits01 – Civil117 – Government Contribution for DefinedContribution Pension Scheme01 – Government Contribution 0.02 19.34 NA
9 6 – Transport
5075 – Capital Outlay on Other TransportServices60 – Others800 – Other Expenditure13 – Compensation for Acquisition of Land forImphal Airport
7.05 0.67 10
* Only ` 1,000
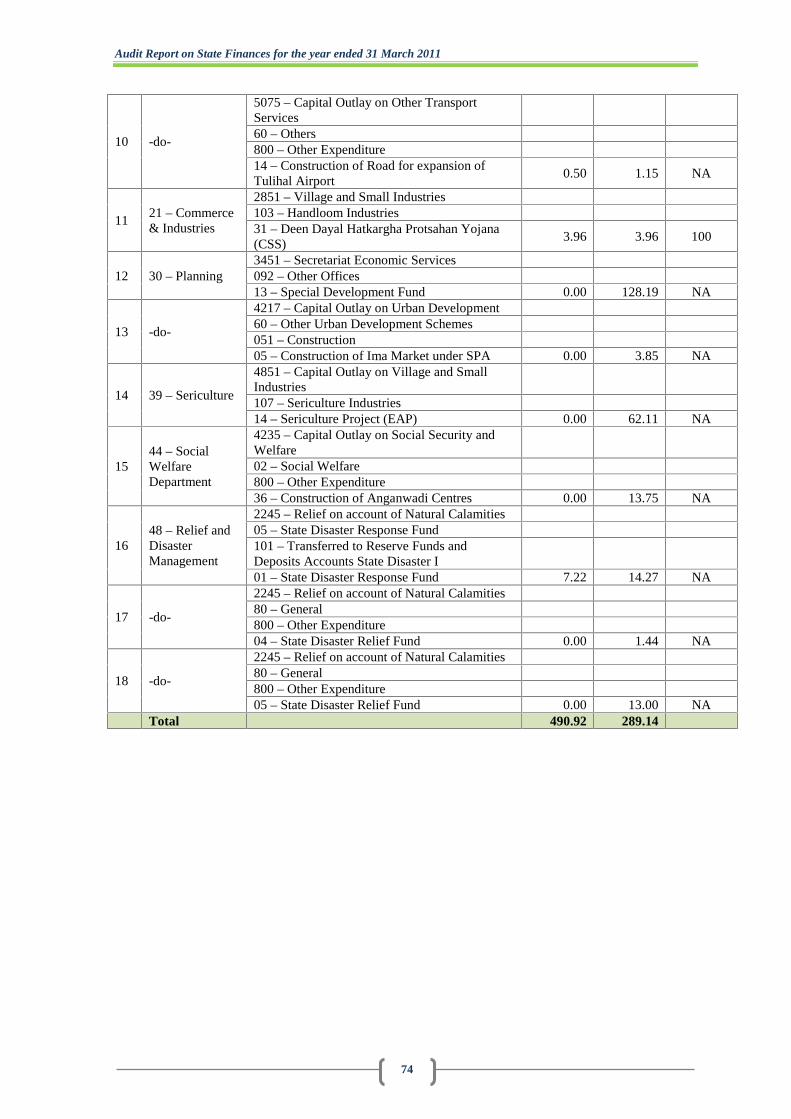
Audit Report on State Finances for the year ended 31 March 2011
74
10 -do-
5075 – Capital Outlay on Other TransportServices60 – Others800 – Other Expenditure14 – Construction of Road for expansion ofTulihal Airport
0.50 1.15 NA
1121 – Commerce& Industries
2851 – Village and Small Industries103 – Handloom Industries31 – Deen Dayal Hatkargha Protsahan Yojana(CSS)
3.96 3.96 100
12 30 – Planning3451 – Secretariat Economic Services092 – Other Offices13 – Special Development Fund 0.00 128.19 NA
13 -do-
4217 – Capital Outlay on Urban Development60 – Other Urban Development Schemes051 – Construction05 – Construction of Ima Market under SPA 0.00 3.85 NA
14 39 – Sericulture
4851 – Capital Outlay on Village and SmallIndustries107 – Sericulture Industries14 – Sericulture Project (EAP) 0.00 62.11 NA
1544 – SocialWelfareDepartment
4235 – Capital Outlay on Social Security andWelfare02 – Social Welfare800 – Other Expenditure36 – Construction of Anganwadi Centres 0.00 13.75 NA
1648 – Relief andDisasterManagement
2245 – Relief on account of Natural Calamities05 – State Disaster Response Fund101 – Transferred to Reserve Funds andDeposits Accounts State Disaster I01 – State Disaster Response Fund 7.22 14.27 NA
17 -do-
2245 – Relief on account of Natural Calamities80 – General800 – Other Expenditure04 – State Disaster Relief Fund 0.00 1.44 NA
18 -do-
2245 – Relief on account of Natural Calamities80 – General800 – Other Expenditure05 – State Disaster Relief Fund 0.00 13.00 NA
Total 490.92 289.14
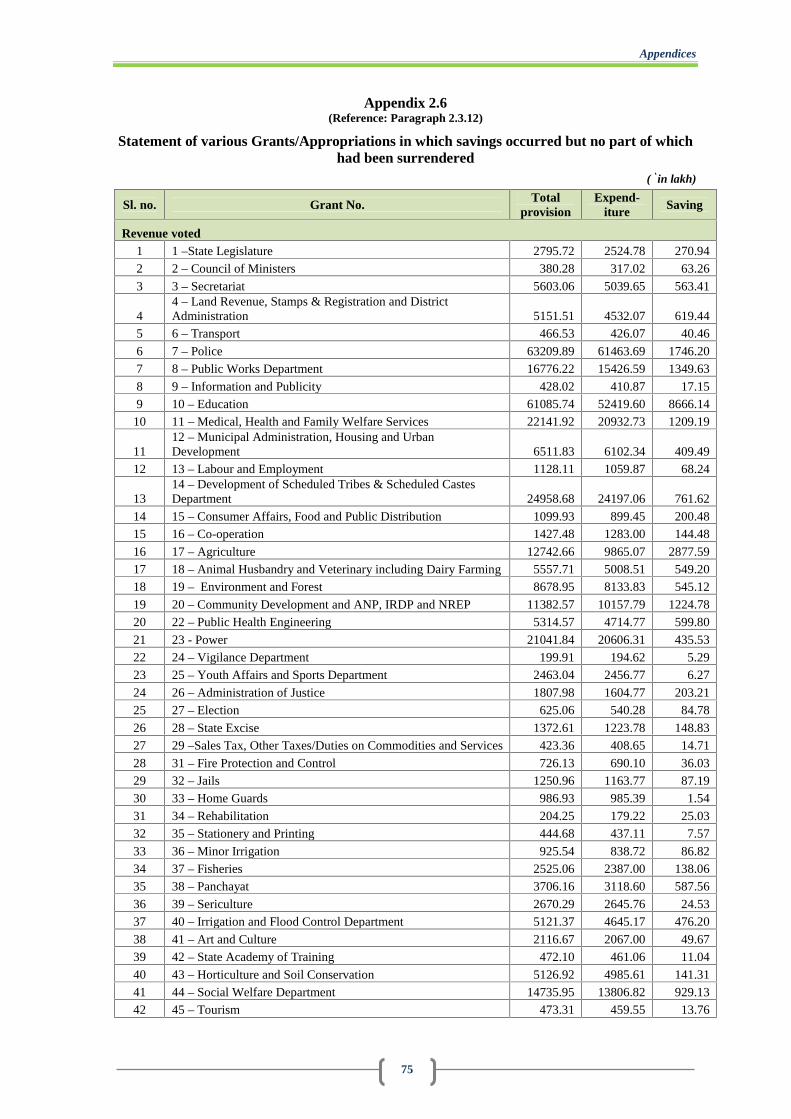
Appendices
75
Appendix 2.6(Reference: Paragraph 2.3.12)
Statement of various Grants/Appropriations in which savings occurred but no part of whichhad been surrendered
(` in lakh)
Sl. no. Grant No.Total
provisionExpend-
iture Saving
Revenue voted1 1 –State Legislature 2795.72 2524.78 270.942 2 – Council of Ministers 380.28 317.02 63.26
3 3 – Secretariat 5603.06 5039.65 563.41
44 – Land Revenue, Stamps & Registration and DistrictAdministration 5151.51 4532.07 619.44
5 6 – Transport 466.53 426.07 40.46
6 7 – Police 63209.89 61463.69 1746.207 8 – Public Works Department 16776.22 15426.59 1349.63
8 9 – Information and Publicity 428.02 410.87 17.159 10 – Education 61085.74 52419.60 8666.14
10 11 – Medical, Health and Family Welfare Services 22141.92 20932.73 1209.19
1112 – Municipal Administration, Housing and UrbanDevelopment 6511.83 6102.34 409.49
12 13 – Labour and Employment 1128.11 1059.87 68.24
1314 – Development of Scheduled Tribes & Scheduled CastesDepartment 24958.68 24197.06 761.62
14 15 – Consumer Affairs, Food and Public Distribution 1099.93 899.45 200.4815 16 – Co-operation 1427.48 1283.00 144.48
16 17 – Agriculture 12742.66 9865.07 2877.5917 18 – Animal Husbandry and Veterinary including Dairy Farming 5557.71 5008.51 549.2018 19 – Environment and Forest 8678.95 8133.83 545.12
19 20 – Community Development and ANP, IRDP and NREP 11382.57 10157.79 1224.7820 22 – Public Health Engineering 5314.57 4714.77 599.80
21 23 - Power 21041.84 20606.31 435.5322 24 – Vigilance Department 199.91 194.62 5.2923 25 – Youth Affairs and Sports Department 2463.04 2456.77 6.27
24 26 – Administration of Justice 1807.98 1604.77 203.2125 27 – Election 625.06 540.28 84.78
26 28 – State Excise 1372.61 1223.78 148.8327 29 –Sales Tax, Other Taxes/Duties on Commodities and Services 423.36 408.65 14.71
28 31 – Fire Protection and Control 726.13 690.10 36.0329 32 – Jails 1250.96 1163.77 87.1930 33 – Home Guards 986.93 985.39 1.54
31 34 – Rehabilitation 204.25 179.22 25.0332 35 – Stationery and Printing 444.68 437.11 7.57
33 36 – Minor Irrigation 925.54 838.72 86.8234 37 – Fisheries 2525.06 2387.00 138.0635 38 – Panchayat 3706.16 3118.60 587.56
36 39 – Sericulture 2670.29 2645.76 24.5337 40 – Irrigation and Flood Control Department 5121.37 4645.17 476.20
38 41 – Art and Culture 2116.67 2067.00 49.6739 42 – State Academy of Training 472.10 461.06 11.04
40 43 – Horticulture and Soil Conservation 5126.92 4985.61 141.3141 44 – Social Welfare Department 14735.95 13806.82 929.1342 45 – Tourism 473.31 459.55 13.76
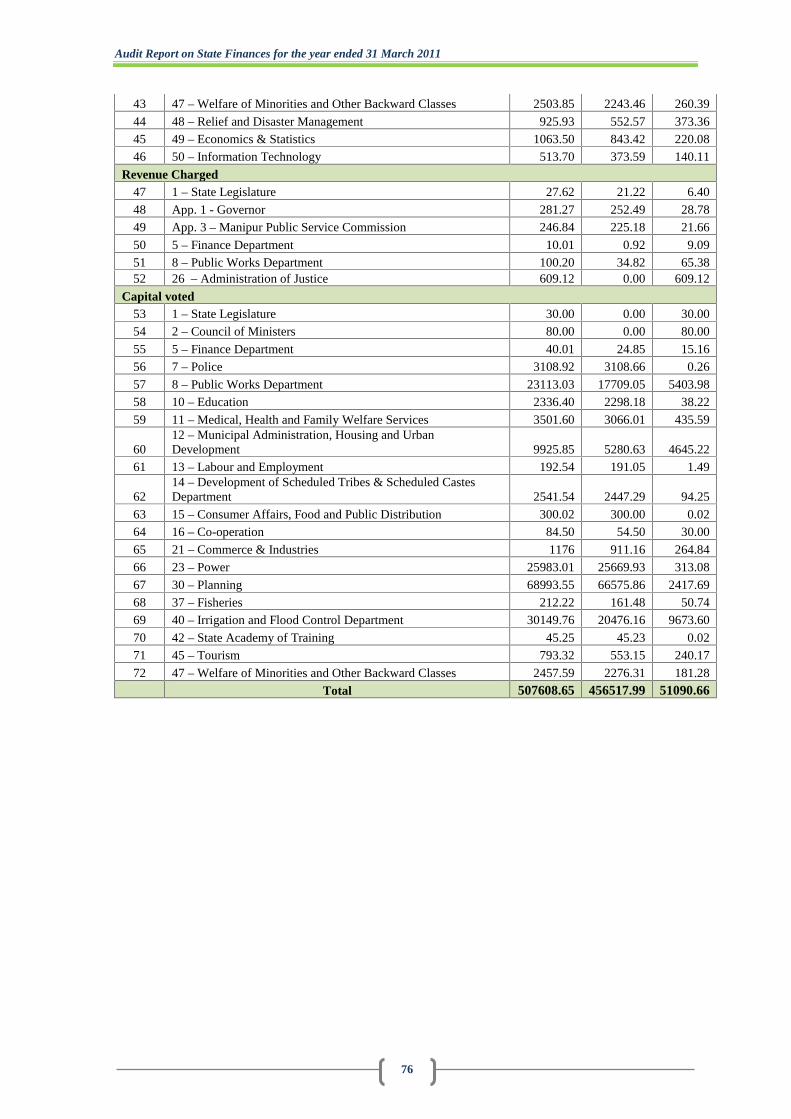
Audit Report on State Finances for the year ended 31 March 2011
76
43 47 – Welfare of Minorities and Other Backward Classes 2503.85 2243.46 260.39
44 48 – Relief and Disaster Management 925.93 552.57 373.3645 49 – Economics & Statistics 1063.50 843.42 220.0846 50 – Information Technology 513.70 373.59 140.11
Revenue Charged47 1 – State Legislature 27.62 21.22 6.40
48 App. 1 - Governor 281.27 252.49 28.7849 App. 3 – Manipur Public Service Commission 246.84 225.18 21.66
50 5 – Finance Department 10.01 0.92 9.0951 8 – Public Works Department 100.20 34.82 65.3852 26 – Administration of Justice 609.12 0.00 609.12
Capital voted53 1 – State Legislature 30.00 0.00 30.0054 2 – Council of Ministers 80.00 0.00 80.00
55 5 – Finance Department 40.01 24.85 15.1656 7 – Police 3108.92 3108.66 0.26
57 8 – Public Works Department 23113.03 17709.05 5403.9858 10 – Education 2336.40 2298.18 38.22
59 11 – Medical, Health and Family Welfare Services 3501.60 3066.01 435.59
6012 – Municipal Administration, Housing and UrbanDevelopment 9925.85 5280.63 4645.22
61 13 – Labour and Employment 192.54 191.05 1.49
6214 – Development of Scheduled Tribes & Scheduled CastesDepartment 2541.54 2447.29 94.25
63 15 – Consumer Affairs, Food and Public Distribution 300.02 300.00 0.0264 16 – Co-operation 84.50 54.50 30.00
65 21 – Commerce & Industries 1176 911.16 264.8466 23 – Power 25983.01 25669.93 313.08
67 30 – Planning 68993.55 66575.86 2417.6968 37 – Fisheries 212.22 161.48 50.7469 40 – Irrigation and Flood Control Department 30149.76 20476.16 9673.60
70 42 – State Academy of Training 45.25 45.23 0.0271 45 – Tourism 793.32 553.15 240.17
72 47 – Welfare of Minorities and Other Backward Classes 2457.59 2276.31 181.28
Total 507608.65 456517.99 51090.66
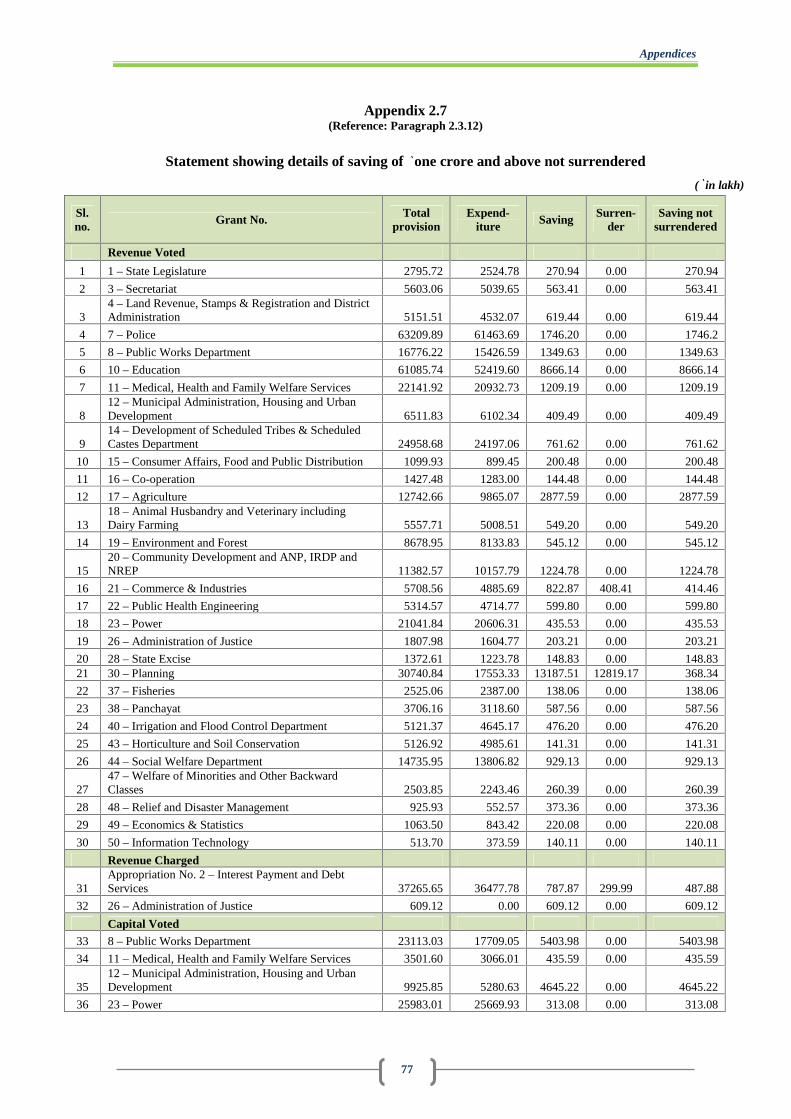
Appendices
77
Appendix 2.7(Reference: Paragraph 2.3.12)
Statement showing details of saving of ` one crore and above not surrendered
(` in lakh)
Sl.no. Grant No. Total
provisionExpend-
iture Saving Surren-der
Saving notsurrendered
Revenue Voted
1 1 – State Legislature 2795.72 2524.78 270.94 0.00 270.94
2 3 – Secretariat 5603.06 5039.65 563.41 0.00 563.41
34 – Land Revenue, Stamps & Registration and DistrictAdministration 5151.51 4532.07 619.44 0.00 619.44
4 7 – Police 63209.89 61463.69 1746.20 0.00 1746.2
5 8 – Public Works Department 16776.22 15426.59 1349.63 0.00 1349.63
6 10 – Education 61085.74 52419.60 8666.14 0.00 8666.14
7 11 – Medical, Health and Family Welfare Services 22141.92 20932.73 1209.19 0.00 1209.19
812 – Municipal Administration, Housing and UrbanDevelopment 6511.83 6102.34 409.49 0.00 409.49
914 – Development of Scheduled Tribes & ScheduledCastes Department 24958.68 24197.06 761.62 0.00 761.62
10 15 – Consumer Affairs, Food and Public Distribution 1099.93 899.45 200.48 0.00 200.48
11 16 – Co-operation 1427.48 1283.00 144.48 0.00 144.48
12 17 – Agriculture 12742.66 9865.07 2877.59 0.00 2877.59
1318 – Animal Husbandry and Veterinary includingDairy Farming 5557.71 5008.51 549.20 0.00 549.20
14 19 – Environment and Forest 8678.95 8133.83 545.12 0.00 545.12
1520 – Community Development and ANP, IRDP andNREP 11382.57 10157.79 1224.78 0.00 1224.78
16 21 – Commerce & Industries 5708.56 4885.69 822.87 408.41 414.46
17 22 – Public Health Engineering 5314.57 4714.77 599.80 0.00 599.80
18 23 – Power 21041.84 20606.31 435.53 0.00 435.53
19 26 – Administration of Justice 1807.98 1604.77 203.21 0.00 203.21
20 28 – State Excise 1372.61 1223.78 148.83 0.00 148.8321 30 – Planning 30740.84 17553.33 13187.51 12819.17 368.34
22 37 – Fisheries 2525.06 2387.00 138.06 0.00 138.06
23 38 – Panchayat 3706.16 3118.60 587.56 0.00 587.56
24 40 – Irrigation and Flood Control Department 5121.37 4645.17 476.20 0.00 476.20
25 43 – Horticulture and Soil Conservation 5126.92 4985.61 141.31 0.00 141.31
26 44 – Social Welfare Department 14735.95 13806.82 929.13 0.00 929.13
2747 – Welfare of Minorities and Other BackwardClasses 2503.85 2243.46 260.39 0.00 260.39
28 48 – Relief and Disaster Management 925.93 552.57 373.36 0.00 373.36
29 49 – Economics & Statistics 1063.50 843.42 220.08 0.00 220.08
30 50 – Information Technology 513.70 373.59 140.11 0.00 140.11
Revenue Charged
31Appropriation No. 2 – Interest Payment and DebtServices 37265.65 36477.78 787.87 299.99 487.88
32 26 – Administration of Justice 609.12 0.00 609.12 0.00 609.12
Capital Voted33 8 – Public Works Department 23113.03 17709.05 5403.98 0.00 5403.98
34 11 – Medical, Health and Family Welfare Services 3501.60 3066.01 435.59 0.00 435.59
3512 – Municipal Administration, Housing and UrbanDevelopment 9925.85 5280.63 4645.22 0.00 4645.22
36 23 – Power 25983.01 25669.93 313.08 0.00 313.08
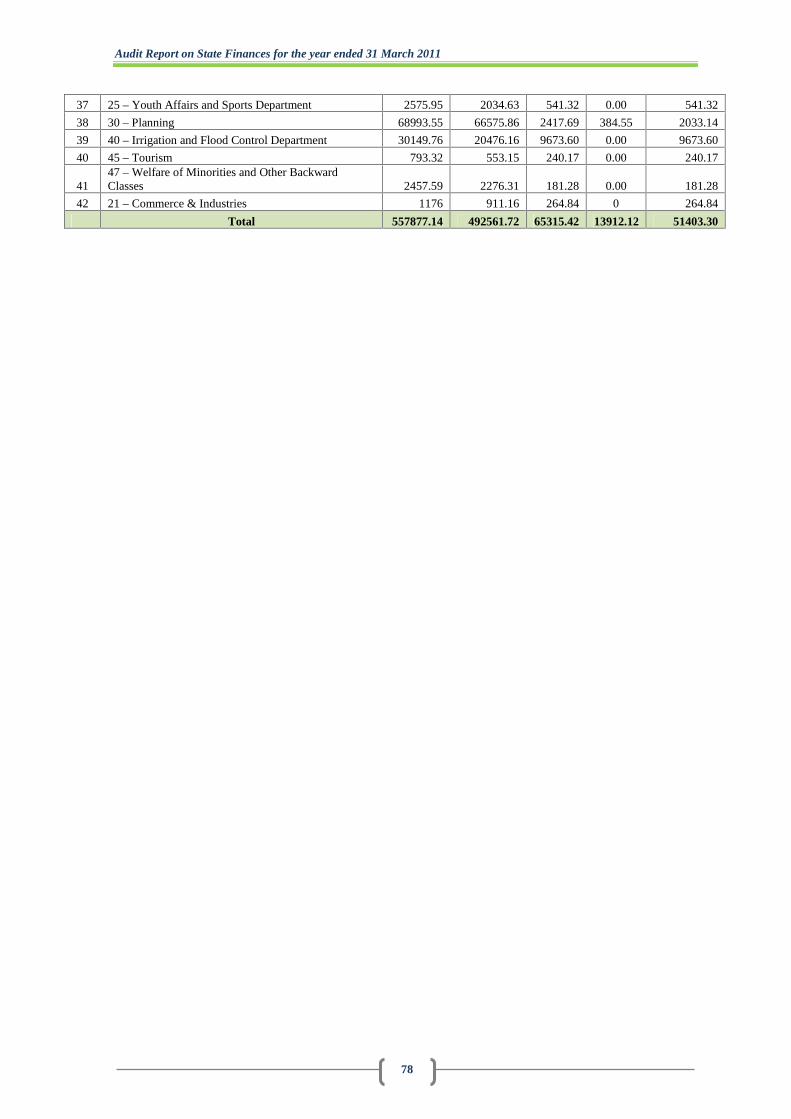
Audit Report on State Finances for the year ended 31 March 2011
78
37 25 – Youth Affairs and Sports Department 2575.95 2034.63 541.32 0.00 541.32
38 30 – Planning 68993.55 66575.86 2417.69 384.55 2033.14
39 40 – Irrigation and Flood Control Department 30149.76 20476.16 9673.60 0.00 9673.60
40 45 – Tourism 793.32 553.15 240.17 0.00 240.17
4147 – Welfare of Minorities and Other BackwardClasses 2457.59 2276.31 181.28 0.00 181.28
42 21 – Commerce & Industries 1176 911.16 264.84 0 264.84
Total 557877.14 492561.72 65315.42 13912.12 51403.30
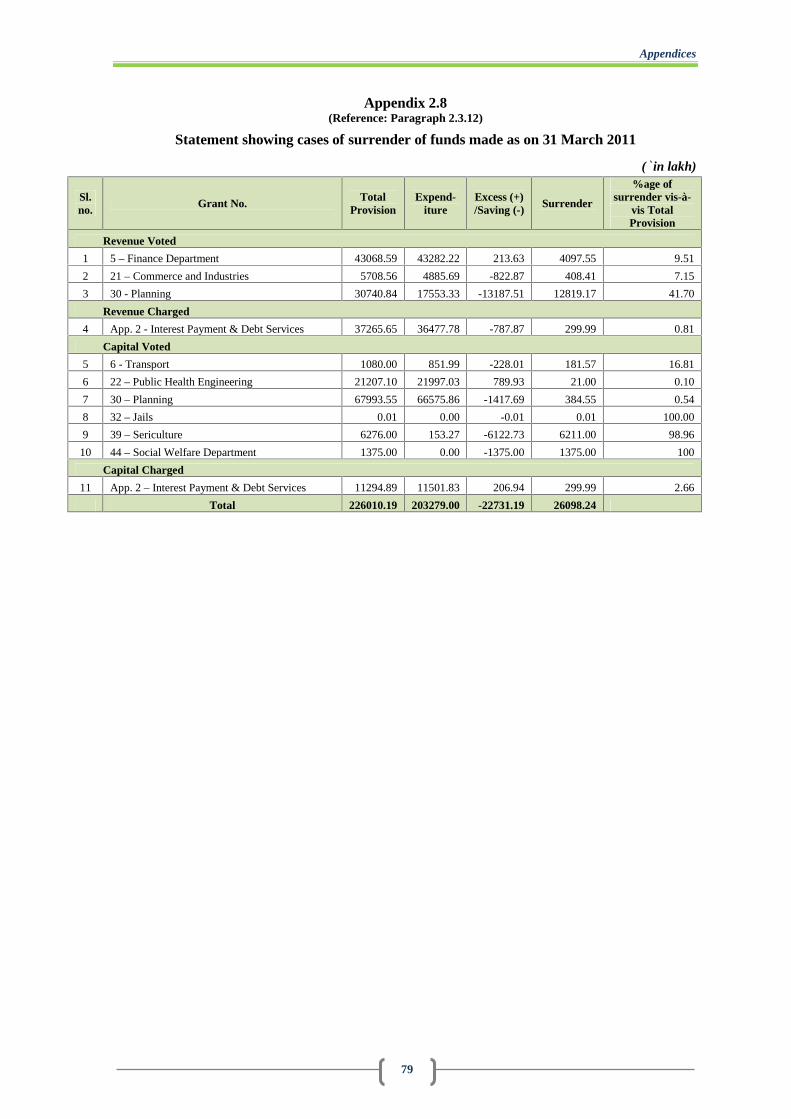
Appendices
79
Appendix 2.8(Reference: Paragraph 2.3.12)
Statement showing cases of surrender of funds made as on 31 March 2011
(` in lakh)
Sl.no.
Grant No.Total
ProvisionExpend-
itureExcess (+)/Saving (-)
Surrender
%age ofsurrender vis-à-
vis TotalProvision
Revenue Voted
1 5 – Finance Department 43068.59 43282.22 213.63 4097.55 9.51
2 21 – Commerce and Industries 5708.56 4885.69 -822.87 408.41 7.15
3 30 - Planning 30740.84 17553.33 -13187.51 12819.17 41.70
Revenue Charged
4 App. 2 - Interest Payment & Debt Services 37265.65 36477.78 -787.87 299.99 0.81
Capital Voted
5 6 - Transport 1080.00 851.99 -228.01 181.57 16.81
6 22 – Public Health Engineering 21207.10 21997.03 789.93 21.00 0.10
7 30 – Planning 67993.55 66575.86 -1417.69 384.55 0.54
8 32 – Jails 0.01 0.00 -0.01 0.01 100.00
9 39 – Sericulture 6276.00 153.27 -6122.73 6211.00 98.96
10 44 – Social Welfare Department 1375.00 0.00 -1375.00 1375.00 100
Capital Charged
11 App. 2 – Interest Payment & Debt Services 11294.89 11501.83 206.94 299.99 2.66
Total 226010.19 203279.00 -22731.19 26098.24
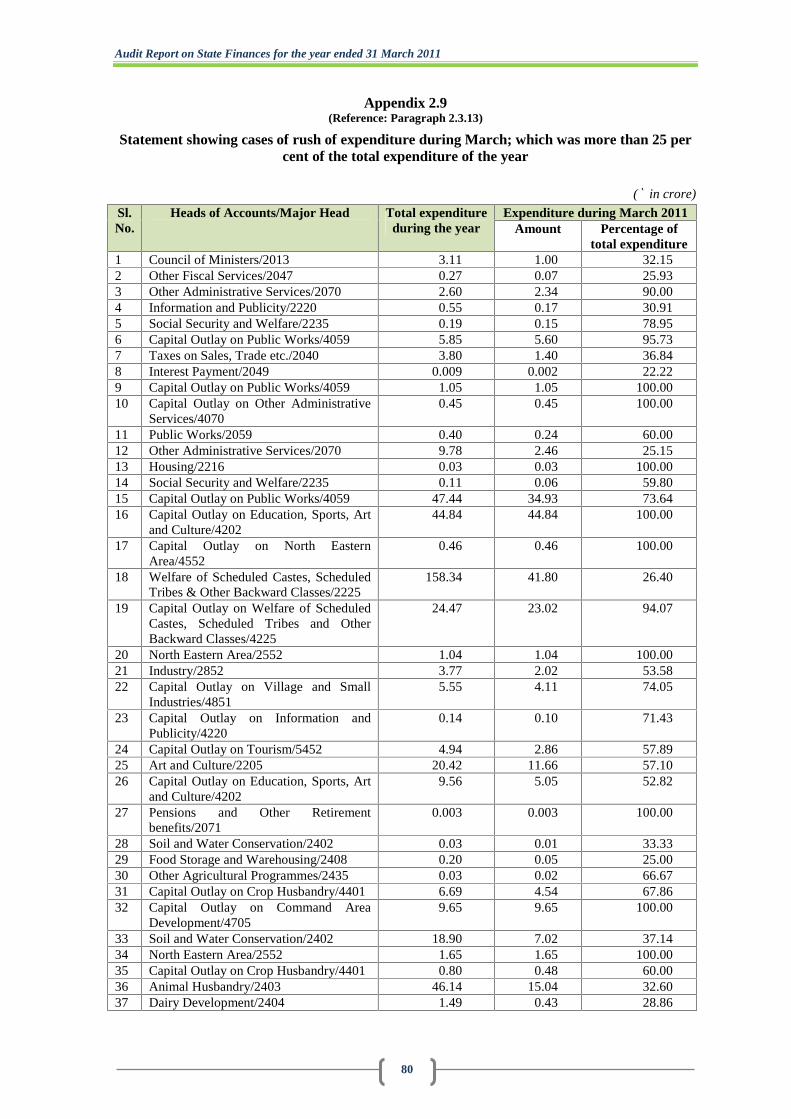
Audit Report on State Finances for the year ended 31 March 2011
80
Appendix 2.9(Reference: Paragraph 2.3.13)
Statement showing cases of rush of expenditure during March; which was more than 25 percent of the total expenditure of the year
(` in crore)
Sl.No.
Heads of Accounts/Major Head Total expenditureduring the year
Expenditure during March 2011Amount Percentage of
total expenditure1 Council of Ministers/2013 3.11 1.00 32.152 Other Fiscal Services/2047 0.27 0.07 25.933 Other Administrative Services/2070 2.60 2.34 90.004 Information and Publicity/2220 0.55 0.17 30.915 Social Security and Welfare/2235 0.19 0.15 78.956 Capital Outlay on Public Works/4059 5.85 5.60 95.737 Taxes on Sales, Trade etc./2040 3.80 1.40 36.848 Interest Payment/2049 0.009 0.002 22.229 Capital Outlay on Public Works/4059 1.05 1.05 100.0010 Capital Outlay on Other Administrative
Services/40700.45 0.45 100.00
11 Public Works/2059 0.40 0.24 60.0012 Other Administrative Services/2070 9.78 2.46 25.1513 Housing/2216 0.03 0.03 100.0014 Social Security and Welfare/2235 0.11 0.06 59.8015 Capital Outlay on Public Works/4059 47.44 34.93 73.6416 Capital Outlay on Education, Sports, Art
and Culture/420244.84 44.84 100.00
17 Capital Outlay on North EasternArea/4552
0.46 0.46 100.00
18 Welfare of Scheduled Castes, ScheduledTribes & Other Backward Classes/2225
158.34 41.80 26.40
19 Capital Outlay on Welfare of ScheduledCastes, Scheduled Tribes and OtherBackward Classes/4225
24.47 23.02 94.07
20 North Eastern Area/2552 1.04 1.04 100.0021 Industry/2852 3.77 2.02 53.5822 Capital Outlay on Village and Small
Industries/48515.55 4.11 74.05
23 Capital Outlay on Information andPublicity/4220
0.14 0.10 71.43
24 Capital Outlay on Tourism/5452 4.94 2.86 57.8925 Art and Culture/2205 20.42 11.66 57.1026 Capital Outlay on Education, Sports, Art
and Culture/42029.56 5.05 52.82
27 Pensions and Other Retirementbenefits/2071
0.003 0.003 100.00
28 Soil and Water Conservation/2402 0.03 0.01 33.3329 Food Storage and Warehousing/2408 0.20 0.05 25.0030 Other Agricultural Programmes/2435 0.03 0.02 66.6731 Capital Outlay on Crop Husbandry/4401 6.69 4.54 67.8632 Capital Outlay on Command Area
Development/47059.65 9.65 100.00
33 Soil and Water Conservation/2402 18.90 7.02 37.1434 North Eastern Area/2552 1.65 1.65 100.0035 Capital Outlay on Crop Husbandry/4401 0.80 0.48 60.0036 Animal Husbandry/2403 46.14 15.04 32.6037 Dairy Development/2404 1.49 0.43 28.86
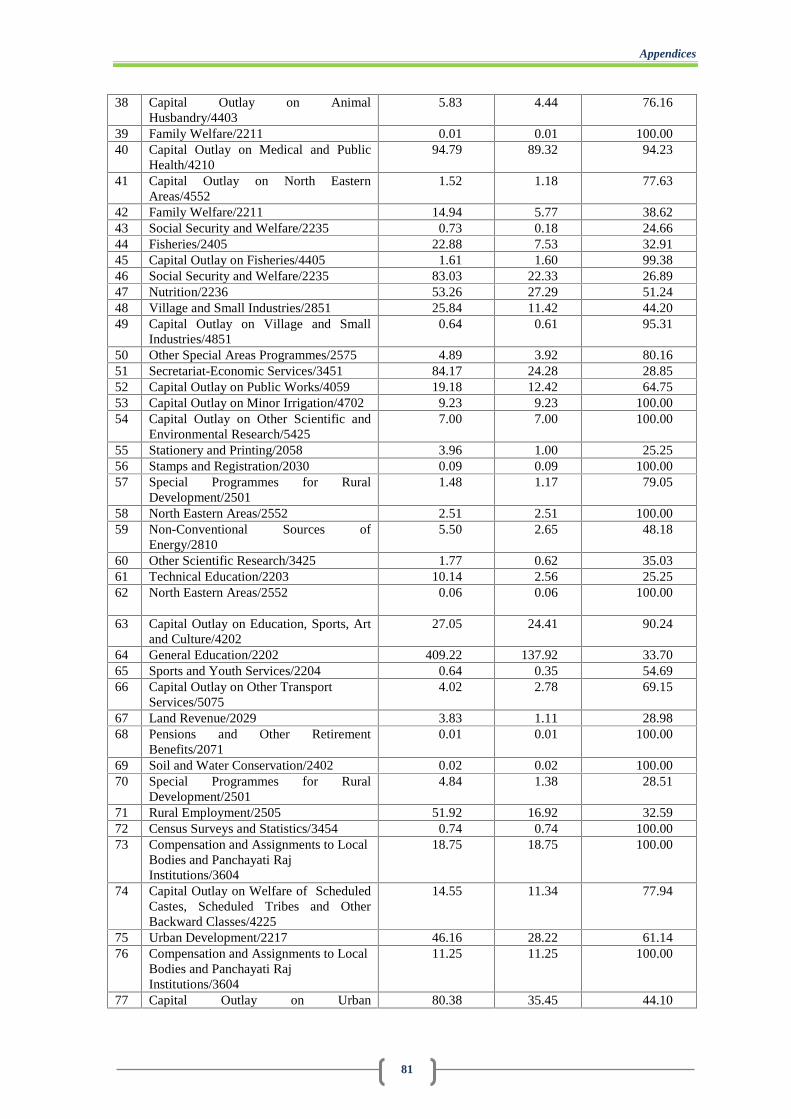
Appendices
81
38 Capital Outlay on AnimalHusbandry/4403
5.83 4.44 76.16
39 Family Welfare/2211 0.01 0.01 100.0040 Capital Outlay on Medical and Public
Health/421094.79 89.32 94.23
41 Capital Outlay on North EasternAreas/4552
1.52 1.18 77.63
42 Family Welfare/2211 14.94 5.77 38.6243 Social Security and Welfare/2235 0.73 0.18 24.6644 Fisheries/2405 22.88 7.53 32.9145 Capital Outlay on Fisheries/4405 1.61 1.60 99.3846 Social Security and Welfare/2235 83.03 22.33 26.8947 Nutrition/2236 53.26 27.29 51.2448 Village and Small Industries/2851 25.84 11.42 44.2049 Capital Outlay on Village and Small
Industries/48510.64 0.61 95.31
50 Other Special Areas Programmes/2575 4.89 3.92 80.1651 Secretariat-Economic Services/3451 84.17 24.28 28.8552 Capital Outlay on Public Works/4059 19.18 12.42 64.7553 Capital Outlay on Minor Irrigation/4702 9.23 9.23 100.0054 Capital Outlay on Other Scientific and
Environmental Research/54257.00 7.00 100.00
55 Stationery and Printing/2058 3.96 1.00 25.2556 Stamps and Registration/2030 0.09 0.09 100.0057 Special Programmes for Rural
Development/25011.48 1.17 79.05
58 North Eastern Areas/2552 2.51 2.51 100.0059 Non-Conventional Sources of
Energy/28105.50 2.65 48.18
60 Other Scientific Research/3425 1.77 0.62 35.0361 Technical Education/2203 10.14 2.56 25.2562 North Eastern Areas/2552 0.06 0.06 100.00
63 Capital Outlay on Education, Sports, Artand Culture/4202
27.05 24.41 90.24
64 General Education/2202 409.22 137.92 33.7065 Sports and Youth Services/2204 0.64 0.35 54.6966 Capital Outlay on Other Transport
Services/50754.02 2.78 69.15
67 Land Revenue/2029 3.83 1.11 28.9868 Pensions and Other Retirement
Benefits/20710.01 0.01 100.00
69 Soil and Water Conservation/2402 0.02 0.02 100.0070 Special Programmes for Rural
Development/25014.84 1.38 28.51
71 Rural Employment/2505 51.92 16.92 32.5972 Census Surveys and Statistics/3454 0.74 0.74 100.0073 Compensation and Assignments to Local
Bodies and Panchayati RajInstitutions/3604
18.75 18.75 100.00
74 Capital Outlay on Welfare of ScheduledCastes, Scheduled Tribes and OtherBackward Classes/4225
14.55 11.34 77.94
75 Urban Development/2217 46.16 28.22 61.1476 Compensation and Assignments to Local
Bodies and Panchayati RajInstitutions/3604
11.25 11.25 100.00
77 Capital Outlay on Urban 80.38 35.45 44.10
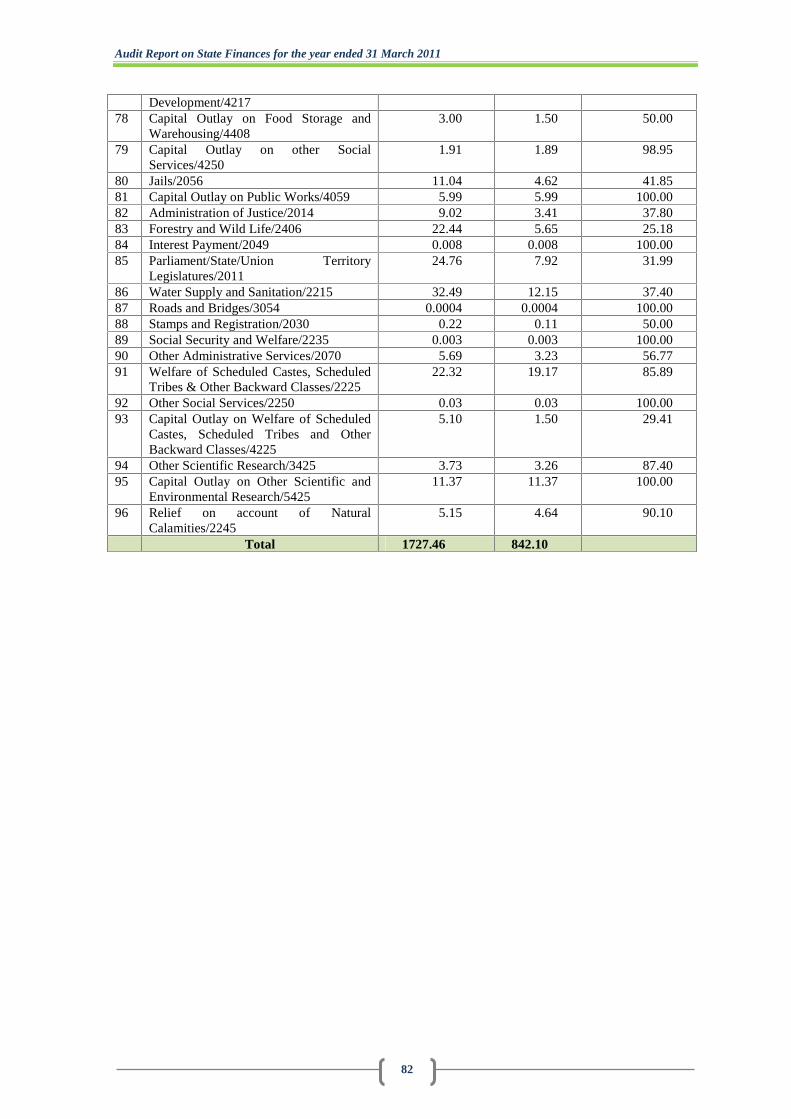
Audit Report on State Finances for the year ended 31 March 2011
82
Development/421778 Capital Outlay on Food Storage and
Warehousing/44083.00 1.50 50.00
79 Capital Outlay on other SocialServices/4250
1.91 1.89 98.95
80 Jails/2056 11.04 4.62 41.8581 Capital Outlay on Public Works/4059 5.99 5.99 100.0082 Administration of Justice/2014 9.02 3.41 37.8083 Forestry and Wild Life/2406 22.44 5.65 25.1884 Interest Payment/2049 0.008 0.008 100.0085 Parliament/State/Union Territory
Legislatures/201124.76 7.92 31.99
86 Water Supply and Sanitation/2215 32.49 12.15 37.4087 Roads and Bridges/3054 0.0004 0.0004 100.0088 Stamps and Registration/2030 0.22 0.11 50.0089 Social Security and Welfare/2235 0.003 0.003 100.0090 Other Administrative Services/2070 5.69 3.23 56.7791 Welfare of Scheduled Castes, Scheduled
Tribes & Other Backward Classes/222522.32 19.17 85.89
92 Other Social Services/2250 0.03 0.03 100.0093 Capital Outlay on Welfare of Scheduled
Castes, Scheduled Tribes and OtherBackward Classes/4225
5.10 1.50 29.41
94 Other Scientific Research/3425 3.73 3.26 87.4095 Capital Outlay on Other Scientific and
Environmental Research/542511.37 11.37 100.00
96 Relief on account of NaturalCalamities/2245
5.15 4.64 90.10
Total 1727.46 842.10

Appendices
83
Appendix 2.10(Reference: Paragraph 2.4.1)
Statement showing department/institute-wise outstanding A.C. Bills as on October 2011
(` in crore)
Sl.No.
Department/Institutes Number of ACbills
Amount
1 Adult Education Department 1 0.152 Agriculture Department 3 0.313 Art & Culture Department 10 6.624 Co-Operation Department 1 0.135 Department of Information & Public Relations 5 0.236 Development of Tribals and Backward Classes 107 61.507 District Administration 6 1.158 Education (S) Department 132 174.799 Education (U) Department 66 40.53
10 Election Department 1 0.0411 Family & Children Welfare Bureau 6 0.9212 Finance Department 2 1.8513 Fisheries Department 2 0.1914 Food & Civil Supply Department 8 7.3015 General Administration Department (GAD) Secretariat 5 0.2216 Horticulture Department 1 1.6517 Industries Department 14 7.9818 Information Technology 4 11.3719 Jail (Prison) Department 4 4.3620 Labour Department 7 1.3621 Manipur Fire Service 1 0.2122 Medical & Health Services Department 298 116.8123 Municipal Administration, Housing & Urban Development 8 7.7124 Planning Department 19 26.5725 Police Department 17 55.1726 Relief and Disaster Management Department 1 0.0627 Rural Development & Panchayati Raj 34 37.6928 Science & Technology Department 4 9.0729 Secretariat Development Department 1 7.5030 Sericulture Department 1 0.3931 Sports & Youth Services Department 37 16.3532 Taxation Department 4 1.5133 Tourism Department 14 27.6434 Transport Department 10 10.6035 Veterinary & Animal Husbandry Department 33 6.4536 Weights & Measures Department 2 0.5037 Welfare of Minorities and Other Backward Classes 14 6.41
Total 883 653.29
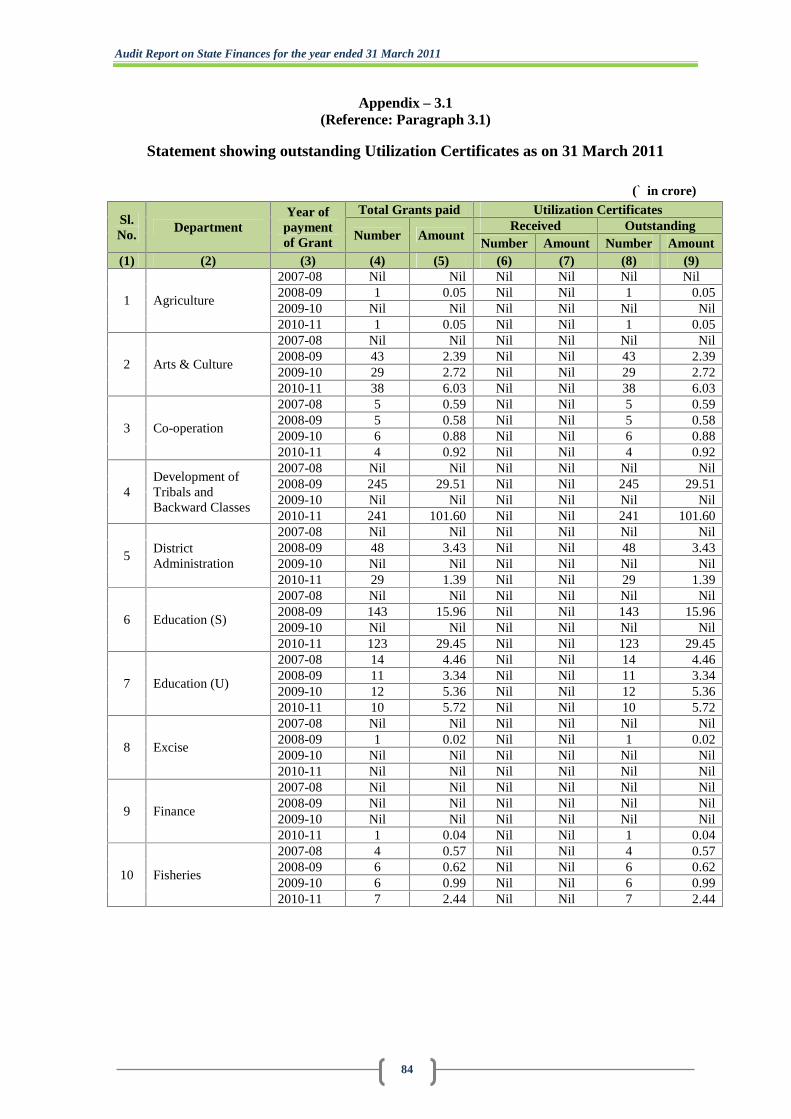
Audit Report on State Finances for the year ended 31 March 2011
84
Appendix – 3.1(Reference: Paragraph 3.1)
Statement showing outstanding Utilization Certificates as on 31 March 2011
(` in crore)
Sl.No.
DepartmentYear of
paymentof Grant
Total Grants paid Utilization Certificates
Number AmountReceived Outstanding
Number Amount Number Amount(1) (2) (3) (4) (5) (6) (7) (8) (9)
1 Agriculture
2007-08 Nil Nil Nil Nil Nil Nil2008-09 1 0.05 Nil Nil 1 0.052009-10 Nil Nil Nil Nil Nil Nil2010-11 1 0.05 Nil Nil 1 0.05
2 Arts & Culture
2007-08 Nil Nil Nil Nil Nil Nil2008-09 43 2.39 Nil Nil 43 2.392009-10 29 2.72 Nil Nil 29 2.722010-11 38 6.03 Nil Nil 38 6.03
3 Co-operation
2007-08 5 0.59 Nil Nil 5 0.592008-09 5 0.58 Nil Nil 5 0.582009-10 6 0.88 Nil Nil 6 0.882010-11 4 0.92 Nil Nil 4 0.92
4Development ofTribals andBackward Classes
2007-08 Nil Nil Nil Nil Nil Nil2008-09 245 29.51 Nil Nil 245 29.512009-10 Nil Nil Nil Nil Nil Nil2010-11 241 101.60 Nil Nil 241 101.60
5DistrictAdministration
2007-08 Nil Nil Nil Nil Nil Nil2008-09 48 3.43 Nil Nil 48 3.432009-10 Nil Nil Nil Nil Nil Nil2010-11 29 1.39 Nil Nil 29 1.39
6 Education (S)
2007-08 Nil Nil Nil Nil Nil Nil2008-09 143 15.96 Nil Nil 143 15.962009-10 Nil Nil Nil Nil Nil Nil2010-11 123 29.45 Nil Nil 123 29.45
7 Education (U)
2007-08 14 4.46 Nil Nil 14 4.462008-09 11 3.34 Nil Nil 11 3.342009-10 12 5.36 Nil Nil 12 5.362010-11 10 5.72 Nil Nil 10 5.72
8 Excise
2007-08 Nil Nil Nil Nil Nil Nil2008-09 1 0.02 Nil Nil 1 0.022009-10 Nil Nil Nil Nil Nil Nil2010-11 Nil Nil Nil Nil Nil Nil
9 Finance
2007-08 Nil Nil Nil Nil Nil Nil2008-09 Nil Nil Nil Nil Nil Nil2009-10 Nil Nil Nil Nil Nil Nil2010-11 1 0.04 Nil Nil 1 0.04
10 Fisheries
2007-08 4 0.57 Nil Nil 4 0.572008-09 6 0.62 Nil Nil 6 0.622009-10 6 0.99 Nil Nil 6 0.992010-11 7 2.44 Nil Nil 7 2.44
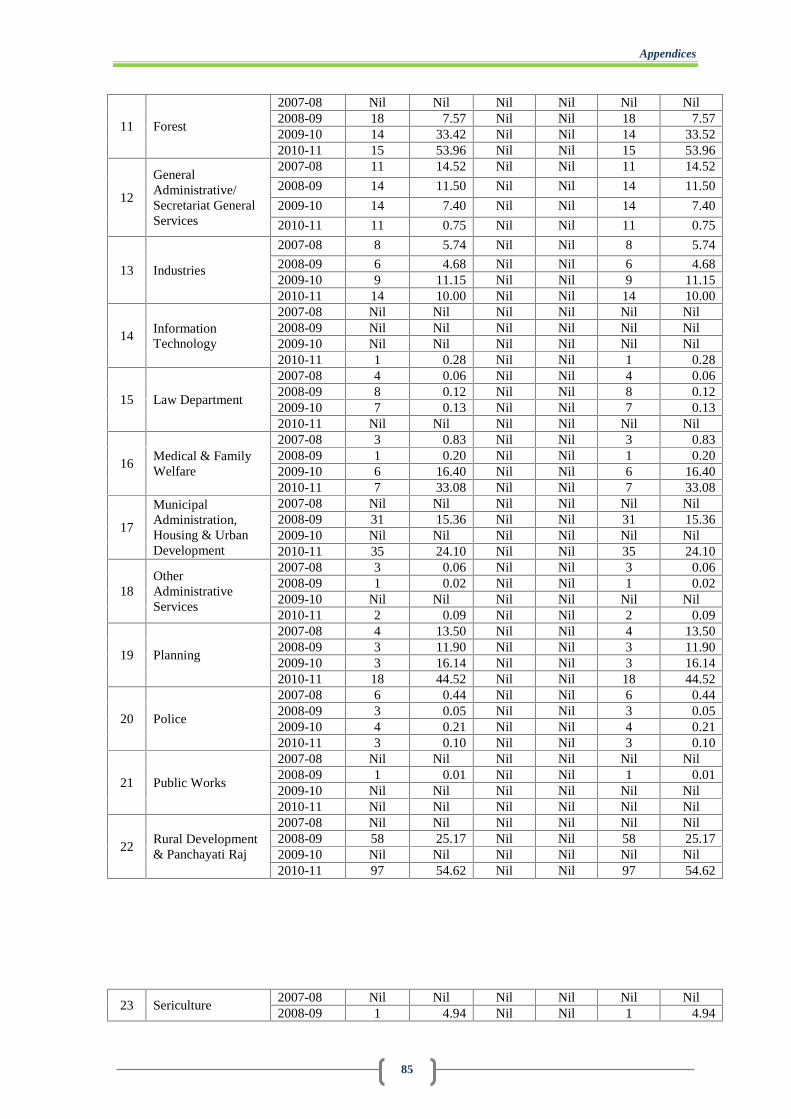
Appendices
85
11 Forest
2007-08 Nil Nil Nil Nil Nil Nil2008-09 18 7.57 Nil Nil 18 7.572009-10 14 33.42 Nil Nil 14 33.522010-11 15 53.96 Nil Nil 15 53.96
12
GeneralAdministrative/Secretariat GeneralServices
2007-08 11 14.52 Nil Nil 11 14.52
2008-09 14 11.50 Nil Nil 14 11.50
2009-10 14 7.40 Nil Nil 14 7.40
2010-11 11 0.75 Nil Nil 11 0.75
13 Industries
2007-08 8 5.74 Nil Nil 8 5.74
2008-09 6 4.68 Nil Nil 6 4.682009-10 9 11.15 Nil Nil 9 11.152010-11 14 10.00 Nil Nil 14 10.00
14InformationTechnology
2007-08 Nil Nil Nil Nil Nil Nil2008-09 Nil Nil Nil Nil Nil Nil2009-10 Nil Nil Nil Nil Nil Nil2010-11 1 0.28 Nil Nil 1 0.28
15 Law Department
2007-08 4 0.06 Nil Nil 4 0.062008-09 8 0.12 Nil Nil 8 0.122009-10 7 0.13 Nil Nil 7 0.132010-11 Nil Nil Nil Nil Nil Nil
16Medical & FamilyWelfare
2007-08 3 0.83 Nil Nil 3 0.832008-09 1 0.20 Nil Nil 1 0.202009-10 6 16.40 Nil Nil 6 16.402010-11 7 33.08 Nil Nil 7 33.08
17
MunicipalAdministration,Housing & UrbanDevelopment
2007-08 Nil Nil Nil Nil Nil Nil2008-09 31 15.36 Nil Nil 31 15.362009-10 Nil Nil Nil Nil Nil Nil2010-11 35 24.10 Nil Nil 35 24.10
18OtherAdministrativeServices
2007-08 3 0.06 Nil Nil 3 0.062008-09 1 0.02 Nil Nil 1 0.022009-10 Nil Nil Nil Nil Nil Nil2010-11 2 0.09 Nil Nil 2 0.09
19 Planning
2007-08 4 13.50 Nil Nil 4 13.502008-09 3 11.90 Nil Nil 3 11.902009-10 3 16.14 Nil Nil 3 16.142010-11 18 44.52 Nil Nil 18 44.52
20 Police
2007-08 6 0.44 Nil Nil 6 0.442008-09 3 0.05 Nil Nil 3 0.052009-10 4 0.21 Nil Nil 4 0.212010-11 3 0.10 Nil Nil 3 0.10
21 Public Works
2007-08 Nil Nil Nil Nil Nil Nil2008-09 1 0.01 Nil Nil 1 0.012009-10 Nil Nil Nil Nil Nil Nil2010-11 Nil Nil Nil Nil Nil Nil
22Rural Development& Panchayati Raj
2007-08 Nil Nil Nil Nil Nil Nil2008-09 58 25.17 Nil Nil 58 25.172009-10 Nil Nil Nil Nil Nil Nil2010-11 97 54.62 Nil Nil 97 54.62
23 Sericulture2007-08 Nil Nil Nil Nil Nil Nil2008-09 1 4.94 Nil Nil 1 4.94

Audit Report on State Finances for the year ended 31 March 2011
86
2009-10 2 0.86 Nil Nil 2 0.862010-11 2 6.22 Nil Nil 2 6.22
24Science &Technology
2007-08 5 2.06 Nil Nil 5 2.062008-09 6 5.65 Nil Nil 6 5.652009-10 5 3.82 Nil Nil 5 3.822010-11 6 8.21 Nil Nil 6 8.21
25 Social Welfare
2007-08 11 0.55 Nil Nil 11 0.552008-09 12 1.25 Nil Nil 12 1.252009-10 17 3.94 Nil Nil 17 3.94
2010-11 12 0.82 Nil Nil 12 0.82
26Sports & YouthServices
2007-08 7 0.85 Nil Nil 7 0.852008-09 7 1.09 Nil Nil 7 1.092009-10 6 0.65 Nil Nil 6 0.652010-11 4 1.46 Nil Nil 4 4.94
27 Town Planning
2007-08 Nil Nil Nil Nil Nil Nil2008-09 Nil Nil Nil Nil Nil Nil2009-10 2 0.13 Nil Nil 2 0.132010-11 4 1.89 Nil Nil 4 1.89
28Veterinary &Animal Husbandry
2007-08 Nil Nil Nil Nil Nil Nil
2008-09 41 2.85 Nil Nil 41 2.85
2009-10 2 0.60 Nil Nil 2 0.60
2010-11 3 1.84 Nil Nil 3 1.84
29
Welfare ofMinorities andOther BackwardClasses
2007-08 6 0.51 Nil Nil 6 0.51
2008-09 7 0.90 Nil Nil 7 0.90
2009-10 8 0.99 Nil Nil 8 0.99
2010-11 7 4.68 Nil Nil 7 4.68
Sub-total
2007-08 91 44.74 Nil Nil 91 44.742008-09 721 149.16 Nil Nil 721 149.162009-10 152 105.79 Nil Nil 152 105.792010-11 695 394.26 Nil Nil 695 394.26
Grand total 1659 693.95 Nil Nil 1659 693.95
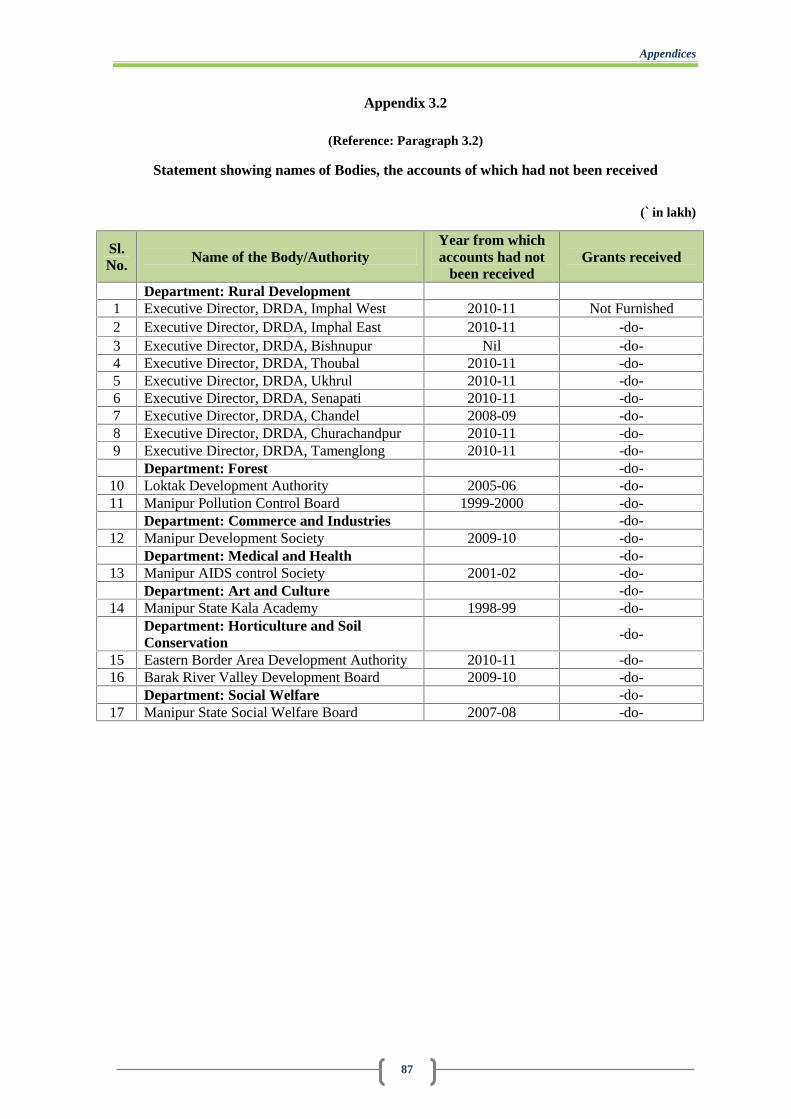
Appendices
87
Appendix 3.2
(Reference: Paragraph 3.2)
Statement showing names of Bodies, the accounts of which had not been received
(` in lakh)
Sl.No. Name of the Body/Authority
Year from whichaccounts had not
been receivedGrants received
Department: Rural Development1 Executive Director, DRDA, Imphal West 2010-11 Not Furnished2 Executive Director, DRDA, Imphal East 2010-11 -do-3 Executive Director, DRDA, Bishnupur Nil -do-4 Executive Director, DRDA, Thoubal 2010-11 -do-5 Executive Director, DRDA, Ukhrul 2010-11 -do-6 Executive Director, DRDA, Senapati 2010-11 -do-7 Executive Director, DRDA, Chandel 2008-09 -do-8 Executive Director, DRDA, Churachandpur 2010-11 -do-9 Executive Director, DRDA, Tamenglong 2010-11 -do-
Department: Forest -do-10 Loktak Development Authority 2005-06 -do-11 Manipur Pollution Control Board 1999-2000 -do-
Department: Commerce and Industries -do-12 Manipur Development Society 2009-10 -do-
Department: Medical and Health -do-13 Manipur AIDS control Society 2001-02 -do-
Department: Art and Culture -do-14 Manipur State Kala Academy 1998-99 -do-
Department: Horticulture and SoilConservation
-do-
15 Eastern Border Area Development Authority 2010-11 -do-16 Barak River Valley Development Board 2009-10 -do-
Department: Social Welfare -do-17 Manipur State Social Welfare Board 2007-08 -do-
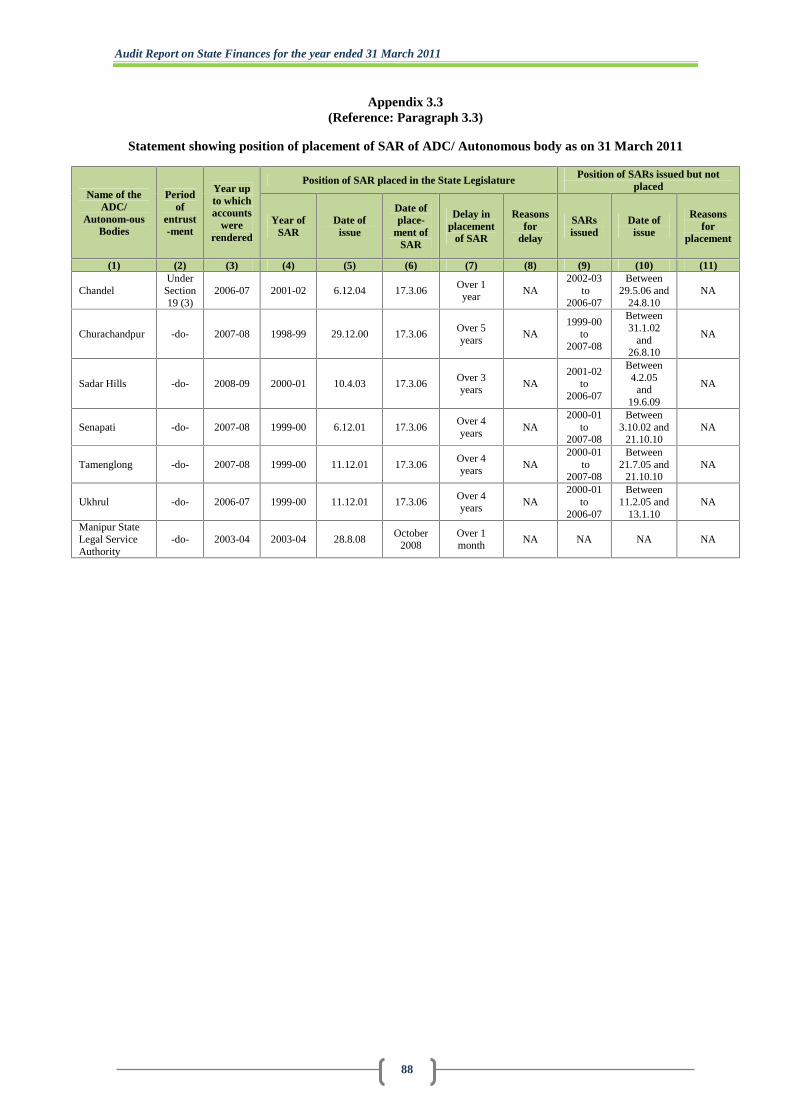
Audit Report on State Finances for the year ended 31 March 2011
88
Appendix 3.3(Reference: Paragraph 3.3)
Statement showing position of placement of SAR of ADC/ Autonomous body as on 31 March 2011
Name of theADC/
Autonom-ousBodies
Periodof
entrust-ment
Year upto whichaccounts
wererendered
Position of SAR placed in the State Legislature Position of SARs issued but notplaced
Year ofSAR
Date ofissue
Date ofplace-
ment ofSAR
Delay inplacement
of SAR
Reasonsfor
delay
SARsissued
Date ofissue
Reasonsfor
placement
(1) (2) (3) (4) (5) (6) (7) (8) (9) (10) (11)
ChandelUnder
Section19 (3)
2006-07 2001-02 6.12.04 17.3.06Over 1
yearNA
2002-03to
2006-07
Between29.5.06 and
24.8.10NA
Churachandpur -do- 2007-08 1998-99 29.12.00 17.3.06Over 5years
NA1999-00
to2007-08
Between31.1.02
and26.8.10
NA
Sadar Hills -do- 2008-09 2000-01 10.4.03 17.3.06Over 3years
NA2001-02
to2006-07
Between4.2.05
and19.6.09
NA
Senapati -do- 2007-08 1999-00 6.12.01 17.3.06Over 4years
NA2000-01
to2007-08
Between3.10.02 and
21.10.10NA
Tamenglong -do- 2007-08 1999-00 11.12.01 17.3.06Over 4years
NA2000-01
to2007-08
Between21.7.05 and
21.10.10NA
Ukhrul -do- 2006-07 1999-00 11.12.01 17.3.06Over 4years
NA2000-01
to2006-07
Between11.2.05 and
13.1.10NA
Manipur StateLegal ServiceAuthority
-do- 2003-04 2003-04 28.8.08October
2008Over 1month
NA NA NA NA

Appendices
89
Appendix 4.1
Glossary of terms
Sl. No. Terms Description1 State Implementing
AgencyState Implementing Agency includes any Organization/Institution including Non-Governmental Organization which is authorized by the State Government toreceive the funds from the Government of India for implementing specificprogrammes in the State, e.g. State Implementation Society for SSA and StateHealth Mission for NRHM etc.
2 GSDP GSDP is defined as total income of the State or market value of goodsand services produced using labour and other factors of production atconstant/current prices.
3 Buoyancy ratio Buoyancy ratio indicates the elasticity or degree of responsiveness of a fiscal variablewith respect to a given change in the base variable. For instance, revenue buoyancy at1.67 implies that revenue receipts tend to increase by 1.67 percentage points, if theGSDP increases by one per cent.
4 Core Public andMerit goods
Core public goods are which all citizens enjoy in common in the sense that eachindividual's consumption of such a good leads to no subtractions from any otherindividual's consumption of that good e.g. enforcement of law and order, securityand protection of our rights; pollution free air and other environmental goods androad infrastructure etc. Merit goods are commodities that the public sectorprovides free or at subsidized rates because an individual or society should havethem on the basis of some concept of need, rather than ability and willingness topay the government and therefore wishes to encourage their consumption.Examples of such goods include the provision of free or subsidized food for thepoor to support nutrition, delivery of health services to improve quality of life andreduce morbidity, providing basic education to all, drinking water and sanitationetc.
5 DevelopmentExpenditure
The analysis of expenditure data is disaggregated into development and non-development expenditure. All expenditure relating to Revenue Account, CapitalOutlay and Loans and Advances is categorized into social services, economicservices and general services. Broadly, the social and economic servicesconstitute development expenditure, while expenditure on general services istreated as non-development expenditure.
6 Fiscal Liabilities Includes Internal Debt, Loans and Advances from GoI, Small Savings, ProvidentFunds, etc., Deposits and other non-interest bearing obligations.
7 Debt sustainability The Debt sustainability is defined as the ability of the State to maintain a constantdebt-GDP ratio over a period of time and also embodies the concern about theability to service its debt. Sustainability of debt therefore also refers to sufficiencyof liquid assets to meet current or committed obligations and the capacity to keepbalance between costs of additional borrowings with returns from suchborrowings. It means that rise in fiscal deficit should match with the increase incapacity to service the debt.
8 Debt Stabilization A necessary condition for stability states that if the rate of growth of economyexceeds the interest rate or cost of public borrowings, the debt-GDP ratio is likelyto be stable provided primary balances are either zero or positive or aremoderately negative. Given the rate spread (GSDP growth rate – interest rate) andquantum spread (Debt*rate spread), debt sustainability condition states that ifquantum spread together with primary deficit is zero, debt-GSDP ratio would beconstant or debt would stabilize eventually. On the other hand, if primary deficittogether with quantum spread turns out to be negative, debt-GSDP ratio would berising and in case it is positive, debt-GSDP ratio would eventually be falling.
9 Sufficiency of Non-debt receipts(Resource gap)
Adequacy of incremental non-debt receipts of the State to cover the incrementalinterest liabilities and incremental primary expenditure. The debt sustainabilitycould be significantly facilitated if the incremental non-debt receipts could meetthe incremental interest burden and the incremental primary expenditure.
10 Net availability ofborrowed funds
Difference between Debt receipt and debt redemption (Principal +Interestpayments)
11 Non debt receipts Adequacy of incremental non-debt receipts of the State to cover theincremental interest liabilities and incremental primary expenditure couldbe significantly facilitated if the incremental non-debt receipts could meetthe incremental interest burden and incremental primary expenditure.