Embed Size (px)
Citation preview

2nd Draft Water Crossing Design Guidelines 11/30/11
1
TABLE OF CONTENTS 1
Preface .......................................................................................................................................................................................... 5 2
Introduction ............................................................................................................................................................................... 6 3
Evolution of Culvert Crossing Design ......................................................................................................................... 6 4
Evolution of Bridge Design ............................................................................................................................................. 7 5
Chapter Guide ....................................................................................................................................................................... 7 6
Chapter 1: Geomorphic Approach to Design .............................................................................................................. 10 7
Summary .............................................................................................................................................................................. 10 8
Introduction ........................................................................................................................................................................ 10 9
Selecting a Crossing Method ........................................................................................................................................ 13 10
Chapter 2: No‐Slope Culvert Design Option ............................................................................................................... 16 11
Summary .............................................................................................................................................................................. 16 12
Introduction ........................................................................................................................................................................ 16 13
No‐Slope Culvert Design ................................................................................................................................................ 17 14
Chapter 3: Stream Simulation Culvert Design Option ............................................................................................ 21 15
Summary .............................................................................................................................................................................. 21 16
Description and Application ......................................................................................................................................... 22 17
Suitability of The Site ...................................................................................................................................................... 24 18
Culvert Type and Size ..................................................................................................................................................... 30 19
Culvert Bed Configuration............................................................................................................................................. 35 20
Culvert Bed Design ........................................................................................................................................................... 38 21
Bed Material Gradation and Specification .............................................................................................................. 44 22
Chapter 4: Bridge Design Guidelines for Habitat Protection ............................................................................... 64 23
Summary .............................................................................................................................................................................. 64 24
Objectives and Scope ....................................................................................................................................................... 65 25
General Considerations .................................................................................................................................................. 65 26
Geomorphic Setting and Reach Analysis ................................................................................................................. 67 27
Selection of Bridge Length ............................................................................................................................................ 77 28
Additional Requirements and Considerations ..................................................................................................... 86 29
Environmental Aspects of Bridge Foundations and Erosion Protection Measures .............................. 89 30
Bridge Clearance ............................................................................................................................................................... 90 31
Bridge Replacements and Channel Modifications ............................................................................................... 90 32

2nd Draft Water Crossing Design Guidelines 11/30/11
2
Bridge Maintenance ......................................................................................................................................................... 90 1
Miscellaneous Design and Construction Considerations ................................................................................. 91 2
Documentation .................................................................................................................................................................. 93 3
Chapter 5: Temporary Culvert and Bridge Design .................................................................................................. 94 4
Chapter 6: Hydraulic Design Option .............................................................................................................................. 98 5
Summary .............................................................................................................................................................................. 98 6
Description and Application ......................................................................................................................................... 99 7
Fish Passage Requirements ....................................................................................................................................... 100 8
Hydrology ......................................................................................................................................................................... 102 9
Velocity and Depth ........................................................................................................................................................ 104 10
Baffles ................................................................................................................................................................................. 106 11
Roughened Channel ...................................................................................................................................................... 116 12
Maintenance and Inspection Plan for Fishways ............................................................................................... 131 13
Chapter 7: Channel Profile Adjustment ..................................................................................................................... 134 14
Summary ........................................................................................................................................................................... 134 15
Introduction ..................................................................................................................................................................... 134 16
Channel Steepening Options ..................................................................................................................................... 137 17
Channel Headcut and Regrade Factors ................................................................................................................. 138 18
Channel Profile Structures ......................................................................................................................................... 142 19
Chapter 8: Culvert and Bridge Removal or Abandonment ................................................................................ 153 20
Chapter 9: Crossing Site Considerations ................................................................................................................... 157 21
Summary ........................................................................................................................................................................... 157 22
Introduction ..................................................................................................................................................................... 157 23
Past Roadway Construction Practices ................................................................................................................... 157 24
Balancing Social, Economic and Environmental Factors in Road Design ............................................... 160 25
Land Use Planning ......................................................................................................................................................... 160 26
New Road and Highway Alignments ..................................................................................................................... 161 27
Existing Roads ................................................................................................................................................................. 162 28
Site Specific Design Considerations ....................................................................................................................... 163 29
Chapter 10: Tide Gates and Flood Gates ................................................................................................................... 168 30
Summary ........................................................................................................................................................................... 168 31
Introduction ..................................................................................................................................................................... 168 32
Gate Types ........................................................................................................................................................................ 169 33

2nd Draft Water Crossing Design Guidelines 11/30/11
3
Fish Passage ..................................................................................................................................................................... 171 1
Tide Gates ......................................................................................................................................................................... 171 2
Flood Gates ....................................................................................................................................................................... 176 3
Chapter 11: Care of Road Runoff .................................................................................................................................. 177 4
Chapter 12: Design Process And Documents .......................................................................................................... 179 5
Summary ........................................................................................................................................................................... 179 6
Introduction ..................................................................................................................................................................... 179 7
Existing Conditions ....................................................................................................................................................... 179 8
Project Feasibility .......................................................................................................................................................... 180 9
Contract Documents ..................................................................................................................................................... 180 10
Specifications ................................................................................................................................................................... 186 11
Chapter 13: Construction Considerations ................................................................................................................ 187 12
Summary ........................................................................................................................................................................... 187 13
Introduction ..................................................................................................................................................................... 187 14
Construction Preparedness ....................................................................................................................................... 188 15
Common Project Considerations ............................................................................................................................. 189 16
Chapter 14: Monitoring .................................................................................................................................................... 197 17
Summary ........................................................................................................................................................................... 197 18
Introduction ..................................................................................................................................................................... 197 19
Compliance Monitoring ............................................................................................................................................... 198 20
Appendix A: Glossary ........................................................................................................................................................ 204 21
Appendix B: Washington Culvert Regulations ....................................................................................................... 204 22
RCW 77.57.030 ............................................................................................................................................................... 204 23
WAC 220‐110‐070 Water crossing structures. ................................................................................................. 204 24
Appendix C: Measuring Channel Width ..................................................................................................................... 204 25
Summary ........................................................................................................................................................................... 204 26
Introduction ..................................................................................................................................................................... 204 27
Bankfull Width ................................................................................................................................................................ 204 28
Watershed Characteristics ......................................................................................................................................... 204 29
Measuring Bankfull Width ......................................................................................................................................... 204 30
Examples of Bankfull Width Measurements ...................................................................................................... 204 31
Appendix D: Tidally Influenced Crossings ............................................................................................................... 204 32
Summary ........................................................................................................................................................................... 204 33

2nd Draft Water Crossing Design Guidelines 11/30/11
4
Introduction ..................................................................................................................................................................... 204 1
Fish Passage ..................................................................................................................................................................... 204 2
Estuarine Opening Geomorphology ‐ Hierarchy of Benefits........................................................................ 204 3
Assessment ....................................................................................................................................................................... 204 4
Washington Harbor: Case Study of alternatives analysis in a Puget Sound Estuary ........................ 204 5
Appendix E: FEMA Policy on Fish Enhancement Structures ............................................................................ 204 6
Appendix F: Road Impounded Wetlands .................................................................................................................. 204 7
Summary ........................................................................................................................................................................... 204 8
Introduction ..................................................................................................................................................................... 204 9
Guiding Principles ......................................................................................................................................................... 204 10
Road Impounded Wetland Scenarios .................................................................................................................... 204 11
Sediment Concerns ....................................................................................................................................................... 204 12
Evaluation Process ........................................................................................................................................................ 204 13
Design Alternatives ....................................................................................................................................................... 204 14
Appendix G: Design Flows for Fish Passage and High Flow ............................................................................. 204 15
Introduction ..................................................................................................................................................................... 204 16
Calculating the Fish Passage Design Flow for Western Washington ....................................................... 204 17
Determining Design Flood Flow .............................................................................................................................. 204 18
Appendix H: Water Crossing Habitat Impacts ........................................................................................................ 204 19
Appendix I: References .................................................................................................................................................... 204 20
21
22

2nd Draft Water Crossing Design Guidelines 11/30/11
5
PREFACE 1
This edition of the WATER CROSSING DESIGN GUIDELINES (previously editions titled DESIGN OF ROAD 2 CULVERTS FOR FISH PASSAGE) has been completely revised, including new chapters on bridge design, 3 tide gates, temporary crossings, culvert abandonment, and project plans. We hope that the guidance 4 relays practical, real‐world knowledge and techniques to improve the overall success of water 5 crossing structures. 6
In 2009 Price et. al.(Price, Quinn et al. 2010) evaluated 77 culverts permitted by WDFW and found 7 that a surprising number failed to provide the most basic fish passage, and an even greater number 8 did not comply with simple design criteria that has been widely available since 1994. Specifically, 9 of the 31 culverts that were designed and permitted according to the no‐slope design method (see 10 Chapter 2), 45% failed the barrier standard (Washington Dept of Fish and Wildlife 2009) and 84% 11 failed to meet the no‐slope design criteria set forth in the Washington Administrative Code (see 12 Appendix B). This is a significant break in the guidance‐design‐permit‐construction chain. As part 13 of the remedy, Price et. al. recommends that training be provided to all parts of the fish passage 14 program. At the heart of any training curriculum is guidance and we hope that these new WATER 15 CROSSING DESIGN GUIDELINES will fill that role. (To be placed on a mailing list for Aquatic Habitat 16 Guideline training session or document announcements please refer to: [email protected].) 17
The cost of a barrier culvert replacement is very high considering the thousands that currently dot 18 the landscape. The average cost of replacing a Washington State Dept. of Transportation culvert is 19 $1,300,000 (Jon Peterson, WSDOT, per. communication) and replacing a Washington Dept. of 20 Natural Resources culvert is $81,000 (U. S. v. State of Washington 2009) If new culverts fail to 21 provide fish passage, then this money has been wasted and the outlay doubled since they must be 22 replaced a second time in order to comply with State law. On the basis of economics alone, it is 23 important to replace culverts right the first time. By following the advice given in this document 24 and by relying on the expertise of knowledgeable designers and biologists, we hope that your water 25 crossing project is successful. 26
These guidelines apply water crossings of all types in Washington State. They do not replace 27 existing regulations addressing water crossings, WAC 220‐110‐070, but help to clarify and set them 28 into engineering practice. These guidelines cover the design of water crossings for the protection of 29 fishlife and their habitat and do not address all of the engineering concerns required for the 30 complete design of a project. These guidelines were written for the benefit of the crossing owner 31 and designer, they are not to be required as regulation. 32
WDFW's standard for reviewing hydraulic project proposals is the protection of fish 33 life. Washington Treaty Tribes have treaty‐reserved rights to harvest a share of the fish resource, 34 and the Tribes understandably take a strong interest in actions that may impact resources subject 35 to treaty‐reserved rights. WDFW strives to engage the Tribes early in meaningful dialogue and 36 consultation when water‐crossing decisions may impact fishing resources. 37

2nd Draft Water Crossing Design Guidelines 11/30/11
6
INTRODUCTION 1
EVOLUTION OF CULVERT CROSSING DESIGN 2 The design of culverts is an emerging field. Culvert design, its practice, and its underlying 3 conceptual framework have evolved over the past century. Washington law has required since the 4 nineteenth century that dams and obstructions in streams be passable to fish (1890). That law was 5 applied to highway culverts in 1950 (Washington State 1950). It was obvious that a culvert 6 “perched” above a streambed could be an obstacle to fish. Less obvious were the barriers caused by 7 velocity and depth, which led to the development of a hydraulic design method based on the 8 swimming abilities of adult salmon and trout, one of the two alternatives for permanent culvert 9 design in Section 220 110 070(3) of the Washington Administrative Code (see Appendix B). 10
The hydraulic method is rather complex and involves detailed engineering calculations. In 11 response to concerns by landowners who needed to replace simple private road culverts without 12 extensive engineering, WDFW developed a second alternative known as the “no‐slope” culvert 13 design method. Instead of relying on complicated hydraulic analysis, it relies on a relatively simple 14 stream width measurement as the design parameter. A natural stream channel develops over time 15 in response to the full range of floods, arranging and adjusting the bed and banks in a way that is 16 most efficient. By measuring the channel width, one takes a measure of the watershed, its area and 17 rainfall, its vegetation and substrate (Dunne and Leopold 1978). Thus the channel width acts as a 18 surrogate for the hydraulic analysis. 19
In the mid‐1990s engineers and biologists in Washington and elsewhere were beginning to 20 recognize some drawbacks to the hydraulic method. The upstream passage of adult salmon and 21 trout is only one part of a complicated life history. Juvenile fish also must move about in the stream 22 year‐round. Other fish live in our streams, too. State law requires that passage must be provided 23 for all species of fish, many of whose migration habits and swimming abilities we know little or 24 nothing about. There are drawbacks to the no‐slope method, as well; it is unsuitable for steep 25 streams since the culvert is installed flat. This can trigger a headcut upstream, releasing sediment 26 which can partially or completely bury the culvert inlet resulting in a loss of culvert capacity. It can 27 also cause flooding and accelerated bank erosion downstream. No‐slope culverts are susceptible to 28 changing bed elevation and may become barriers over time. 29
Beginning with a number of experimental “oversized” culverts, partially filled with streambed 30 material, the concept of stream simulation was developed: If a bed placed in a culvert has similar 31 dimensions and substrate as the adjacent stream channel, then the velocity and passage conditions 32 would be similar to the stream. This approach could, theoretically, be applied to any gradient and 33 any stream, and would provide passage for all fish that would otherwise migrate in the stream. The 34 stream simulation method was formalized in 1999 and described in the previous edition of this 35 guidance titled DESIGN OF ROAD CULVERTS FOR FISH PASSAGE (Bates, Barnard et al. 2003). Hundreds of 36 culverts have been designed according to this method and are now installed throughout 37 Washington in all settings. This method is now the most common culvert design in Washington 38 State. 39

2nd Draft Water Crossing Design Guidelines 11/30/11
7
EVOLUTION OF BRIDGE DESIGN 1 The history of bridge design as a civil engineering discipline is long and well documented. As a 2 result of the advances in structural design and the various codes governing them, modern bridges 3 are notably safe and reliable. In addition to structural considerations, bridges in dynamic stream 4 environments must account for natural processes during design (see Chapter 4 for several recent 5 publications addressing this issue). The area of bridge design which has not been covered by any 6 known guidance documents are the impacts of bridges on the natural environment and design 7 methods to avoid or minimize them. This is the subject of Chapter 4, which is a comprehensive 8 guide developed in cooperation with bridge experts. This chapter was extensively reviewed and 9 approved by the Bridge Subcommittee of the Aquatic Habitat Guidelines Program. 10
Certain types of bridges are similar to culverts, and vice versa. In these cases, it is somewhat 11 confusing which design approach to choose. General guidelines for making this selection are 12 discussed in Chapters 1 and 4. 13
CHAPTER GUIDE 14 A few introductory remarks are offered to guide the reader efficiently through this document. 15 There are basically 5 different water crossing design methods covered in this guideline; 16
Chapter 2, No‐slope Culverts are used for small, simple installations on low gradient streams. 17
Chapter 3, Stream Simulation Culvert designs are for larger, more complex projects on low 18 gradient streams and most projects on high gradient streams. 19
Chapter 4, Bridges are recommended for larger streams. Bridges designed to accommodate 20 natural channel processes provide better in‐stream habitat and ecological connectivity than 21 culverts for all streams. 22
Chapter 5, Temporary Culverts or Bridges are crossings needed only for a short period of 23 time, such as one time resource extraction or construction access. 24
Chapter 6, Hydraulic Design Fishways encompasses several crossing methods that have 25 limited application in specific instances: the design of culvert retrofits, baffle design for 26 exceptionally long culverts or retrofits, and roughened channels for culverts that exceed the 27 maximum stream simulation slope ratio 28
A decision matrix is featured at the end of Chapter 1 to help the designer decide which of these 29 methods is appropriate for their particular situation. Examples of these methods are shown in 30 Figures 1 – 5 . 31

2nd Draft Water Crossing Design Guidelines 11/30/11
8
1
Figure 1: Left photo, Stream Simulation, 2000; Unknown Tributary of Fifteen Mile Ck, DNR. 2 Figure 2: Right photo, Bridge, Boulder Ck, SR 542 3
4
Figure 3: Left photo: Noslope culvert, approx 1996; Duane’s Ck, forest road, Snohomish Co. 5 Figure 4: Right photo, Temporary Bridge, HohClearwater Mainline, DNR. 6
7
8
9
10
11
12
13
Figure 5: Roughened channel under bridge, Buck Ck, 2007 (photo, Paul Tappel). 14
1
3
4
5

2nd Draft Water Crossing Design Guidelines 11/30/11
9
Chapter 7, Channel Profile Adjustment addresses the problems encountered when the upstream 1 and downstream channels are at different elevations or slopes when they meet at the road crossing. 2 In most cases this chapter is necessary reading for new crossing designers. 3
Subsequent chapters describe general design and construction of water crossings and some special 4 topics. The appendices provide background information on a variety of topics. Of particular 5 interest are, 6
• Appendix C, Measuring Channel Width, something every designer must do 7 • Appendix D, Tidally Influenced Crossings, a new approach to this topic 8 • Appendix F, Road Impounded Wetlands, what to do with wetlands formed by an 9
undersized culvert and its associated road embankment. 10
11

2nd Draft Water Crossing Design Guidelines 11/30/11
10
CHAPTER 1: GEOMORPHIC APPROACH TO DESIGN 1
SUMMARY 2 • Crossing design for fish passage and habitat protection is based on channel characteristics. 3 • A full assessment includes various measurements and observations 4
o Bankfull width 5 o Longitudinal profile 6 o Sediment assessment 7 o Channel pattern type 8 o Channel banks 9 o Constraints 10
• Selection of a crossing method is based on this assessment and its suitability. A matrix is 11 used to aid selection. 12
INTRODUCTION 13 These guidelines promote a water crossing selection and design process intended to have the least 14 effect on the natural processes that create and support the stream structure in which fish live and 15 migrate. The geomorphic approach to design is generally based on readily‐measured 16 characteristics of the natural channel in the adjacent reaches. This is in contrast to the once 17 prevalent hydraulic culvert design method (Chapter 6) which uses criteria independent of channel 18 conditions. 19
In order to properly design a crossing based on the geomorphic approach, we need to know 20 something about the stream in which it is situated. This sort of assessment is typically known as a 21 reach assessment, or reaches analysis. Reach analysis is described in detail for bridge design, 22 Chapter 4, and comprehensively for stream simulation culverts in the U. S. Forest Service Stream‐23 Simulation Working Group publication STREAM SIMULATION: AN ECOLOGICAL APPROACH TO PROVIDING 24 PASSAGE FOR AQUATIC ORGANISMS AT ROADSTREAM CROSSINGS (Forest Service Stream‐Simulation 25 Working Group 2008). This chapter describes the basic components of a simple reach analysis for 26 all types of crossings. 27
In order to decide which crossing method to use, it is important to have a basic understanding of 28 the channel in which it will be placed. With this knowledge the designer can make an informed 29 decision about crossing type. Using the information from the analysis described in this chapter the 30 designer can use the selection matrix shown at the end of this chapter to determine an appropriate 31 crossing method. 32
Channel features of importance to the culvert designer are as follows, with a short description: 33
BANKFULL WIDTH 34 The bankfull width is by far the most important parameter in culvert design, therefore accurately 35 measuring it is critical for a successful project. Appendix C describes measuring bankfull width for 36 the purpose of crossing design. The Dept. of Ecology’s DETERMINING THE ORDINARY HIGH WATER 37 MARK ON STREAMS IN WASHINGTON STATE (which can be found at this address 38

2nd Draft Water Crossing Design Guidelines 11/30/11
11
http://www.ecy.wa.gov/biblio/0806001.html) also describes bankfull width and contrasts it 1 to ordinary high water (OHW), which is often associated with it. 2
LONGITUDINAL PROFILE 3 Longitudinal profile, or the long profile, is an important tool for culvert designers. The profile is 4 developed by measuring the elevation of the bed, water surface and banks along the stream reach 5 that includes the culvert. The longitudinal profile is used to determine stream slope, degree of 6 upstream and downstream incision and deposition, the depth of pools, and the presence of 7 discontinuities and nick points. Water surface profiles are to be taken at one flow. The longitudinal 8 profile helps determine the slope and elevation of the culvert and the appropriate strategy for 9 dealing with regrade. This latter issue is the subject of Chapter 7: Channel Profile Adjustment. 10 As an illustration, Figure 1.1, shows how a long profile of the existing stream can predict the 11 extent of channel regrade. The outfall drop and a locally steepened section are hallmarks of 12 channel incision. In order to properly design a culvert, you must determine what elevation and 13 slope to set it at. This profile shows that the culvert invert must be below the expected regrade line 14 with an additional allowance for the necessary countersink. 15
16
Figure 1.1: Existing channel profile with expected regrade line. 17
SEDIMENT 18 Sediment, its gradation, supply and transport, is the third most important piece of the culvert 19 design puzzle. In order to function properly as a segment of the stream channel, the bed of the 20 culvert must be similar to the streambed. The bed gradation can be measured a variety of ways 21 with differing levels of accuracy. The standard method is the pebble count (Wolman 1954; 22 Harrelson, Rawlins et al. 1994), although this is not always necessary. The goal is to have enough 23 information to specify a material that, once installed in the culvert, will be as stable as the adjacent 24 stable channel reaches and provide similar habitat value. A culvert bed that is too fine will mobilize 25 during storm events resulting in no natural streambed material inside the culvert. On the other 26 hand, overly coarse material will cause flow to go subsurface and will not respond to normal stream 27 processes. Both examples would result in a loss to habitat within the culvert as well as upstream 28 and downstream of the culvert. Stream reaches that tend to be sediment supply limited can be 29 challenging to design for. In these reaches the finer fractions are constantly winnowed from the 30 sediment mix and the resulting coarse bed does not adjust to changing conditions and can form fish 31 passage barriers through either subsurface flow or drops without pools. Another difficult case 32 concerns streams with very fine sediment or those with no durable sediment in larger sizes. 33 Materials for culverts in these streams should be sized for the slope and discharge and composed of 34 stable gravel and larger particles. 35
36

2nd Draft Water Crossing Design Guidelines 11/30/11
12
POTENTIAL DEBRIS LOADING 1 The culvert design methods outlined in this guideline are generally sized to account for expected 2 debris loading. Since most wood that is transported down the stream channel is bankfull width or 3 less (Flanagan 2004), culverts designed at least as wide as the channel (no‐slope and stream 4 simulation) should transport expected debris. There are special cases where extreme flood events 5 or an abundance of debris would warrant a larger culvert and should be carefully considered in the 6 reach analysis. Generally, culverts are not designed to pass catastrophic events like debris flows or 7 mud slides. On the other hand, when working in watersheds known for a high frequency of such 8 events the designer may want to consider a vented ford (Clarkin, Keller et al. 2006) or an elevated 9 bridge. 10
CHANNEL PATTERN TYPE 11 Fluvial processes form different channel patterns. Recognizing the type of channel pattern at a 12 culvert crossing is essential for the selection of the appropriate design approach and an important 13 design consideration (channel types are discussed in many publications, including AHG’s 14 INTEGRATED STREAMBANK PROTECTION GUIDELINES 15 http://wdfw.wa.gov/conservation/habitat/planning/ahg/, and briefly in Chapter 4). The most 16 common pattern type associated with culvert crossings are confined, non‐meandering channels. 17 This greatly simplifies the analysis, since these channels, if in equilibrium, experience limited lateral 18 channel migration and have a limited floodplain. More complicated channel types are unconfined, 19 alluvial channels since these channels tend to experience more lateral channel migration and larger 20 floodplains. To determine if a channel is confined or unconfined, a floodplain utilization ratio (also 21 known as the entrenchment ratio and discussed in Chapter 4) is used. The floodplain utilization 22 ratio is the flood prone width divided by the bankfull width. Values less than 3 are considered 23 confined and greater than 3 unconfined, for culvert design purposes. The no‐slope and stream 24 simulation methods can be applied to confined channels without modification of the design criteria. 25 Unconfined channels will require modification to the design criteria as discussed in more detail in 26 Chapter 3, section Culvert type and size. 27
CONDITION OF CHANNEL BANKS 28 The condition of the channel’s banks indicate channel equilibrium. Raw, vertical banks are a sign of 29 recent incision and may be a reason to increase the estimate of channel width to accommodate 30 future channel widening, The channel may also continue to incise, forcing the design to a bridge or 31 more deeply countersunk culvert to accommodate it. Removing the existing culvert, which is likely 32 perched, will result in upstream incision and possible impacts to habitat and stream‐adjacent 33 structures. Some of these considerations are discussed in Chapter 7, Channel Profile Adjustment. 34
Very low banks, or no banks at all, indicate heavy aggradation. The crossing is likely located at a 35 grade break or on an alluvial fan. This is a very challenging condition and the stream, without the 36 road crossing determining the location of the channel, would move laterally to lower ground. 37 Maintaining a static location often leads to designing a larger crossing to accommodate the 38 sediment load, raising the road to allow sediment to build and scour, or the construction of an 39 instream sediment trap (see SALMON HABITAT RESTORATION GUIDELINES, 40 http://wdfw.wa.gov/conservation/habitat/planning/ahg/) to maintain the crossing. 41
CONSTRAINTS 42 Constraints are infrastructure or land ownership issues that interfere with natural stream 43 processes. Many of the principles of crossing design assume natural conditions, which can often be 44 approximated even in highly altered environments. But sometimes constraints are so challenging 45

2nd Draft Water Crossing Design Guidelines 11/30/11
13
that more engineered approaches to fish passage at road crossings must be employed. These 1 situations might include, but are certainly not limited to: 2
• Culvert retrofits, which are the temporary modification of an existing crossing to provide 3 fish passage without replacing the culvert. The constraint consists of; the lack of immediate 4 funds, a sequence of events that precludes replacement at the present time, or other factors 5 that require the owner to seek temporary measures. Full replacement with an appropriate 6 design is assumed to follow in the near future. 7
• Homes or other structures built close to the upstream banks that prevent regrade. If 8 buildings are constructed on the edge of the stream they would be endangered if the 9 streambank was steepened or undercut, which is what occurs when the bed is lowered as a 10 result of regrade. 11
• Shallow pipeline crossing upstream, such as a regional petroleum pipeline or major 12 municipal water supply or sewer line. Smaller lines should be relocated lower to allow a 13 natural channel profile, but major pipelines are exceptionally difficult and expensive to 14 move. 15
• An uncooperative neighbor who will not grant easement or access for construction, channel 16 work or regrade. 17
• Occasionally, habitat considerations force over‐steepening the channel to prevent the loss of 18 a wetland, spawning area or other valuable habitat. 19
Constraints are also discussed in Chapter 4 where they directly affect the design of bridges, such 20 as levees and floodplain management. 21
SELECTING A CROSSING METHOD 22 The matrix in Figure 1.2 combines the measurements and observations compiled in this chapter 23 with the 5 crossing options discussed in these guidelines. Each method is evaluated in the body of 24 the table on a relative scale from 0 to 10. Methods that receive a 10 in a given category are 25 considered most appropriate under the conditions described, 0 means not recommended. 26
The crossing design methods have been abbreviated and are fully explained here: 27
Noslope Culvert, Chapter 2. Small culverts laid on a flat grade used for small, simple 28 installations on low gradient streams. 29
Figure 1.2: Water crossings selection matrix. Each design method is listed on the right. Factors that affect design are listed along the top and explained in the text. The relative appropriateness of each method are shown in the body of the table on a scale of 0 (not recommended, red in color) to 10 (most appropriate, green in color).

2nd Draft Water Crossing Design Guidelines 11/30/11
14
Stream Simulation Culvert, Chapter 3. Culverts placed at the same grade as the stream and 1 appropriate for larger, more complex projects on low gradient streams and most projects on 2 high gradient streams. 3
Bridge, Chapter 4. Bridges are designed to accommodate natural channel processes and 4 provide better in‐stream habitat and ecological connectivity than culverts for all streams. 5
Temporary Culverts or bridges, Chapter 5. Crossings in place for a short period of time, such 6 as one time resource extraction or construction access. 7
Hydraulic Design Fishways, Chapter 6, mostly culvert retrofits, baffle design for exceptionally 8 long culverts or retrofits, and roughened channels for culverts that exceed the maximum stream 9 simulation slope ratio 10
The column headings are described in the paragraphs which preceded this section, and elsewhere 11 in this document, but are briefly repeated here for convenience: 12
Bankfull width is the prevailing width of channel in the reach the crossing is located in (see 13 Appendix C). The width categories shown here are given as general guidelines. Site specific 14 characteristics have a strong influence on crossing design so that a stream simulation culvert 15 would work perfectly well on a 17 ft BFW stream. Likewise, there may be good reason not to 16 use a no‐slope culvert on a 5 ft stream. 17
Slope is the water surface slope outside the influence of the existing crossing. 18
Floodplain utilization is the degree to which the channel relies upon the floodplain for 19 conveyance during peak events. Floodplain utilization ratios less than 3 indicate a confined 20 channel, and those greater than 3 an unconfined channel. 21
Unstable channel is a channel that tends to rapidly or chronically change elevation or lateral 22 location, as discussed in Chapters 1, 4 and 7. 23
Debris prone channels commonly transport large wood and/or abundant sediment. 24
Constraints are infrastructure or land ownership issues that prevent the use of natural 25 processes in crossing design. 26
Generally, bridges are preferred in nearly all categories; they create crossings that have more 27 stream‐like characteristics than culverts. 28
Temporary crossings score very high because they have limited impacts for only a short period of 29 time. Once they are no longer needed, they are removed and the site restored. Temporary culverts 30 have a very limited range of application, especially in urban areas, and are not applicable to sites 31 with permanent constraints. 32
For streams smaller than 15 ft, stream simulation culverts are nearly as effective as bridges. For 33 channels less than 8 ft, no slope culverts can be used, although with fewer benefits. Slope and the 34 degree to which the stream use its floodplain (floodplain utilization ratio, FUR, introduced on page 35 29 and discussed in Chapter 4)) also limit no‐slope use. 36

2nd Draft Water Crossing Design Guidelines 11/30/11
15
Unstable channels severely limit culvert use. Debris prone headwater streams can only be crossed 1 temporarily. Temporary culverts have no application at developed sites with constraints. 2
Hydraulic method crossings have poor ratings in most categories since they are not based on 3 passage for all fish. They are uniquely suited to sites with constraints. 4
There are a number of difficult sites that come up frequently. For channels with no discernable 5 bankfull width, see Appendix C for methods to deal with this. For tidal sites, see Appendix D. For 6 roads that cross deltas or depositional areas, there are several alternatives: 7
• Move crossing upstream of depositional area 8 • Oversize the crossing to accommodate sediment deposition 9 • Raise crossing to allow for deposition 10 • Construct in‐stream sediment trap 11
Roads that cross wetlands don’t easily fit into the two culvert design methods described here for 12 more confined channels, no‐slope and stream simulation. Wetlands have unconfined channels 13 where FUR (see page 29) is often much greater than 3. Nevertheless, culverts can sometimes serve 14 effectively in these locations if designed appropriately. First, check to see if the wetland is 15 artificially impounded by the road embankment, described in Appendix F. This appendix also 16 explains an assessment process and alternatives for various conditions. If the road is built over a 17 natural wetland, then the road crossing should provide both fish passage and ecological continuity, 18 minimizing impacts to the channel and adjacent wetlands. A first step is to estimate channel width 19 based on confined conditions, Appendix C regression Equation C.1. By comparing this estimate 20 with the measured bankfull width in the wetland, one can approximate the relative role of the 21 floodplain wetland in the down‐valley movement of flood water. If the measured width is similar 22 to the estimated, then one would expect that the wetland is flooded but does not play significant 23 part in the movement of water downstream. On the other hand, if the wetland channel is much 24 smaller than the estimated bankfull width, then the wetland floodplain is part of the downstream 25 flow and we should not use the wetland channel width for crossing size calculations. One possible 26 solution to this problem is to use the bridge span method associated with unconfined channels, 27 Chapter 4, Floodplain and Overbank Areas. An example using this strategy follows. 28
The wetland channel shown in Figure C.7 in Appendix C, is 8 ft wide. The FUR 11.9 but the 29 wetland is heavily vegetated with saw grass. The watershed area is 0.34 square miles and the 30 average annual rainfall is 118 inches per year. From Equation C.1 the expected confined channel 31 width would be from 8 to 13 feet. The range includes a 16% standard error. The measured channel 32 width is within the range for a confined channel implying that the channel conveys the majority of 33 the water, not the floodplain (which one would guess based on the dense vegetation). The culvert 34 that crosses this stream was recently replaced with a deeply countersunk 9 ft culvert based on the 35 no‐slope method. This culvert is well‐suited to the situation and maintains a fine gravel bed. Had 36 the measured channel width been much less than the predicted confined width, then the culvert 37 width would have to be increased relative to the measured channel width to accommodate the 38 overbank flow. 39
40
41
42

2nd Draft Water Crossing Design Guidelines 11/30/11
16
CHAPTER 2: NO‐SLOPE CULVERT DESIGN OPTION 1
2
Figure 2.1: Noslope culvert, Johnson Ck, Mosquito Lake Rd. 3
SUMMARY 4 • No‐slope culverts are appropriate for 5
o Small channels <8 ft BFW 6 o Culvert length <75 ft 7
• The no‐slope design option is based on Washington Administrative Code provisions 8 o The culvert is installed at zero gradient 9 o The width of the bed in the culvert is equal to the bankfull width (BFW is preferred 10
to ordinary high water width as explained in Appendix C) 11 o The bottom of the culvert is set below the downstream bed 20% of its rise 12
• An additional criteria limits the inlet countersink to 40% of the rise 13 • A bed should be placed in the culvert that is composed of material similar to the bed of the 14
adjacent stream 15 • As a general rule, the clearance between the bed of the culvert and the crown should be at 16
least 50% of span or a minimum clearance of 4 feet, with exceptions 17
INTRODUCTION 18 Successful fish passage can be expected in certain situations if the culvert is sufficiently large and is 19 installed flat, allowing the natural movement of bedload to maintain a stable bed inside the culvert. 20 If velocities are low enough to allow a bed to deposit in the culvert, it is assumed that a broad range 21 of fish species and sizes will be able to move through the culvert. The no‐slope design option 22 creates just such a scenario and, when correctly applied, has been successful in Washington State 23 since 1994 when it was set into WAC 220‐110‐070(3)b(i) (Figure 2.1). The WAC provisions state 24 that culverts in “small streams” be placed at a flat gradient with the downstream invert 25

2nd Draft Water Crossing Design Guidelines 11/30/11
17
countersunk below the channel bed by a minimum of 20 percent of the culvert diameter or rise and 1 the culvert width at the bed shall be equal to or greater than the average width of the bed of the 2 stream. Some guidance is required to turn this provision into a reliable engineering method, and 3 that is the intent of this chapter. 4
The implied purpose of the WAC was to introduce a culvert design method that required no special 5 design expertise or survey information. This was a method available to the private landowner so 6 that they could provide fish passage at their road crossings in a simple, immediately 7 understandable way at a minimum expense. Over the years since the WAC was written we have 8 found that some additional provisions substantially improve the outcome. 9
To readers not familiar with methods and conventions of crossing design, this chapter does not 10 cover all aspects of culvert design. For proper design at least three other areas should be analyzed. 11 First, civil engineering aspects, such as culvert type and strength, soil compaction, and fill slope 12 angle, are not covered at all in this guidance document since they are not relevant to fish passage or 13 habitat protection. Second, culvert capacity, for both water flow and the transport of wood and 14 sediment, must be checked. Third, the channel profile should be examined, especially in the case of 15 culvert replacements where there is an outfall drop, see Chapter 7. 16
NO‐SLOPE CULVERT DESIGN 17 18
19
Figure 2.2: Noslope culvert schematic diagram showing the 4 principle components of the design. 20
As shown in Figure 2.2, the no‐slope culvert design is based on four criteria: 21
1. The culvert is set at a flat gradient. Typically, this is to a tolerance of plus or minus 0.5% as 22 a matter of compliance. 23

2nd Draft Water Crossing Design Guidelines 11/30/11
18
2. The width of the bed inside the culvert (not the culvert span) is equal to the prevailing 1 bankfull width of the stream in the reach where the culvert is located. The culvert will not 2 constrict the bankfull flow and is expected to hold or replenish the streambed material 3 similar to that found in the upstream channel. 4
3. The invert of the culvert is set a minimum of 20% of the culvert rise below the downstream 5 streambed ensuring that there is bed material in the culvert, or that it returns after a major 6 flood. Greater countersink is recommended when it does not conflict with criteria 4. 7
4. The inlet must not be countersunk more than 40%, restricting the method to lower gradient 8 streams. 9
The no‐slope design option is usually applicable in the following situations: 10
• New and replacement culvert installations, not for retrofits 11 • Simple installations with low road fill and one or two narrow lanes of traffic 12 • Low to moderate natural channel gradient (< 3% slope) 13 • Short culvert length (<75 feet). 14
As the name implies, no‐slope culverts are not appropriate for high gradient channels. The flat 15 culvert over steepens the upstream channel, often leading to head cut that unnecessarily degrades 16 habitat, destabilizes the channel and releases sediment that can fill the culvert. It can also deposit 17 large quantities of sediment downstream forcing channel diversion (i.e. relocation of the flow 18 outside the original bed), bank erosion, and flooding neighbors. If a steep bed is established in the 19 culvert then there is reduced capacity at the inlet. 20
A reasonable upper limit of the no‐slope design option is to use it at sites where the product of the 21 channel slope (ft/ft) and the culvert length (ft) does not exceed 20 percent of the culvert diameter 22 or rise (ft). It should be noted that this limitation can be overcome by understanding and 23 accounting for the implications of constricting the upstream end of the culvert with the more 24 deeply countersunk bed or by installing a larger culvert. Any culvert shape can be used (round, 25 pipe‐arch or elliptical), but it must be countersunk a minimum of 20 percent at the downstream 26 end and a maximum of 40 percent at the upstream end (see Figure 2.1). Round pipes are usually 27 preferred since, for a given crown elevation, they provide greater fill depth for a given vertical 28 clearance. 29
The restriction on culvert length is, obviously, a part of the previous discussion on slope, but is also 30 central to the concept of a simple installation; the implication being that a more complex situation 31 should require a more sophisticated method, such as stream simulation. The length of a culvert is a 32 function of the fill height, number of lanes of travel and the fill slope angle. A culvert longer than 75 33 feet probably has a fill height in excess of 15 feet and/or more than one lane of traffic; an expensive 34 situation that deserves more careful design than provided for in this method. 35
In certain instances, the vertical clearance between the culvert bed surface and the crown can be 36 low enough that debris may be caught between the flood water surface and the top of the culvert. 37 As a general rule, the distance between the bed of the culvert and the crown should be at least 50% 38 of span or a minimum clearance of 4 feet. For round, no‐slope culverts, the former condition is 39

2nd Draft Water Crossing Design Guidelines 11/30/11
19
guaranteed to be the case since the upstream countersink is limited to 40% of the rise. But for 1 culverts less than about 5 feet in diameter, the latter measure may be impossible to meet without 2 increasing culvert size. These recommendations are probably most useful in guiding the design of 3 horizontal ellipse and box culverts where clearance can be arbitrarily reduced. 4
Information needed for the no‐slope design option includes: 5
• The bankfull width as described in Appendix C 6 • The natural channel slope through the reach containing the proposed culvert (discussed in 7
Chapter 7) 8 • The elevation of the natural channel bed at the culvert outlet 9 • The potential for channel regrade and impacts upstream of the culvert (discussed in 10
Chapter 7) 11 • An estimate of the design discharge (the 100‐year recurrence interval flood or design flow 12
described in Appendix G) 13
The most reliable parameter for bankfull width in alluvial channels is the distance between channel 14 bankfull elevations. Channel bankfull elevation is the point where incipient floodplain overbank 15 flow occurs (Dunne and Leopold 1978). For design purposes, use the average of at least three 16 typical widths, both upstream and downstream of the culvert. Measure cross sections that describe 17 normal conditions at straight channel sections between bends and outside the influence of any 18 culvert or other artificial or unique channel constrictions. According to WAC 220‐110‐070, the 19 bankfull width can also be the width between ordinary high water marks. However, ordinary high 20 water marks indicate the difference between the aquatic and terrestrial environments and its 21 location is subject to site‐specific processes affecting vegetation and soil (Olson and Stockdale 22 2008). This may have limited importance for culvert design which is dominated by in‐stream 23 processes. Appendix C, Measuring ChannelBed Width, provides guidance on selecting and 24 measuring channel width for culvert design purposes. 25
For new culverts, the stream slope is simple to determine. But if a culvert is being replaced, the 26 estimate of future channel elevation and slope are critical parameters to the design (see Figure 27 1.1). If the existing culvert is either perched or undersized, it will affect the local channel slope, 28 width, and elevation. The characteristics of the stream profile are discussed in Chapter 7, as well as 29 options for dealing with regrade. A surveyed profile of the channel will be required where there is a 30 significant outfall drop. What “significant” means is dependent on the size of the stream and the 31 cause of the outfall drop; a 1 foot drop is big for a small, low gradient stream prone to incision, but 32 not significant for a larger, higher gradient stream. 33
Adequate culvert countersink is vital for proper performance and fish passage. While 20% is the 34 minimum embedment, it is also not the maximum. When the stream slope is low, the culvert can be 35 countersunk 30% at the outlet and still be within the 40% maximum at the inlet. This creates a 36 deeper depth of fill inside the culvert which is more resistant to erosion and allows for minor 37 changes in streambed elevation without exposing the bottom of the culvert. It is recommended that 38 culverts be filled with streambed material up to the proper countersink elevation at the time of 39 installation. An exception to this is wetland culverts where the streambed is composed of fine‐40

2nd Draft Water Crossing Design Guidelines 11/30/11
20
grained sediment. In this case the culvert can be countersunk without filling and allowed to 1 backwater. 2
The width of the bed of the culvert is measured at the 20% countersink elevation. Increasing the 3 countersink to, say, 30% does not mean that the culvert diameter, in the case of round culverts, can 4 be reduced. Combining the requirements of countersinking the outlet and the culvert width for a 5 circular culvert, the diameter is 1.25 times the channel bed width, regardless of the actual 6 embedment depth. There is an inherent safety factor in this sizing method that compensates for the 7 lack of engineering analysis associated with the other culvert design methods. The culvert width for 8 box culverts is the measured bankfull width. It is recommended that the sediment be carefully 9 specified and mixed to ensure that all size classes are represented and that it’s placed to mimic 10 natural channel profiles, like pool‐riffle or cascade. 11
Even though no extensive survey is normally required for no‐slope culvert design and construction, 12 it is important to set the culvert at the correct elevation relative to the downstream bed. When the 13 trench for the culvert is excavated and the adjacent channel has been blocked off for dewatering, it 14 is very difficult to correctly set the bottom elevation without survey equipment. Since this is such a 15 critical element of the design, a contractor’s level, or other survey equipment, should be used to 16 establish the elevation of the culvert bedding relative to a benchmark set before construction. 17
The standard of practice for culvert design dictates that the structure remains safe and serviceable 18 up to a given design flood. WAC 220‐110‐070(3)d requires that the culvert must maintain 19 structural integrity to the 100‐year peak flow with consideration of debris likely to be encountered. 20 Generally, sizing culverts using the no‐slope method provides adequate conveyance for the 100‐21 year peak flow. This does not absolve the designer of responsibility to determine that this is 22 actually true. Recommendations for determining the design flood are given in Appendix G. 23 Methods for calculating culvert capacity are covered in many documents and computer programs 24 (Chow 1959; Jerome M. Norman and Associates 1985; U.S. Army Corps of Engineers 2006; The 25 Office of Bridge Technology 2009). 26
27

2nd Draft Water Crossing Design Guidelines 11/30/11
21
CHAPTER 3: STREAM SIMULATION CULVERT DESIGN OPTION 1
2 Figure 3.1: Stream simulation culvert, Newberry Ck. 3
SUMMARY 4 • Stream simulation application: 5
o Moderately confined channels 6 o Bankfull width less than 15 ft, with exceptions 7 o Any equilibrium stream slope 8 o Stream simulation culverts with a length‐to‐width ratio > 10 are considered long 9
and need special design consideration and an increase in recommended width 10 • Suitability of the site 11
o Design requires geomorphic assessment of stream reach 12 o Method tolerates little or no lateral channel movement 13 o Method tolerates moderate vertical instability 14 o Culvert bed slope should not be greater than 1.25 x upstream channel slope 15
• Culvert type and size 16 o Any culvert type may be used for stream simulation 17

2nd Draft Water Crossing Design Guidelines 11/30/11
22
o Width of bed inside culvert = 1.2 x BFW + 2 feet 1 • Scenario 1, channel slope less than 4% 2
o Countersunk culvert 30‐50% of its rise 3 o Culvert bed should have a pool‐riffle morphology 4 o Bed may deform, scour, reform as the natural channel does 5 o Coarse bands used to control channel shape, initiate stream structure 6
• Scenario 2, channel slope greater than 4% 7 o Countersunk culvert 30‐50% of its rise 8 o Culvert bed should have a cascade or step‐pool morphology 9 o Bed tends to be stable over time 10 o Bed structure is built‐in at the time of construction 11
• Bed material design and specification 12 o Stream simulation culvert bed material is similar to the natural channel 13 o But, there are several reasons why it should be coarser to increase stability 14 o Sediment distribution should be well‐graded, non‐porous, with 5‐10% fines 15 o Sediment size can be determined by measuring the adjacent channel sediment size 16
and/or using sediment stability analysis 17 o Stream simulation bed materials are generally rounded, but there are exceptions 18 o WDOT streambed sediment specifications are suitable for culverts 19
DESCRIPTION AND APPLICATION 20 Stream simulation is a design method used to create and maintain in a culvert those natural stream 21 processes present in the adjacent channel. Figure 3.1 is an example of a stream simulation 22 culvert. Stream simulation is based on the principle that, if fish can migrate through the natural 23 channel, they can also migrate through a man‐made channel that simulates it. Taking this approach 24 eliminates the need to consider the swimming characteristics of individual species of fish or 25 particular life stages; those fish that are present in the channel are not expected to be challenged by 26 the stream simulation culvert which looks and performs similarly to the stream they were just 27 swimming through. Within limits, these processes and functions are expected to be unconstrained 28 by a properly designed stream simulation culvert: 29
• Flood flow conveyance 30 • Transport of wood 31 • Sediment transport 32 • Fish passage 33 • Low flow continuity 34 • Hydraulic diversity 35 • Margin habitat 36 • Sediment gradation continuity 37
To be successful, stream simulation culverts must be designed and constructed by those familiar 38 with stream geomorphology. The design of culverts has traditionally been done by road engineers. 39 Without additional training they will find that their past experience with culverts will be of little 40 help in the design of this type of structure. Under ideal conditions, the stream simulation culvert is 41

2nd Draft Water Crossing Design Guidelines 11/30/11
23
designed by an interdisciplinary team with knowledge of such specialties as hydrology, 1 geomorphology, biology, civil engineering, and contract administration. This chapter describes the 2 basic design criteria recommended for stream simulation, and some techniques to approach certain 3 aspects of the analysis, but it does not fully prepare a designer for this complicated task. Several 4 years of experience with natural channel assessment or design should be added to the information 5 provided in Chapters 7, 9, 12, and Appendix C. 6
Recent effectiveness monitoring (Barnard, Yokers et al. 2011) has revealed the role of design and 7 construction practice in the performance of stream simulation culverts. This seems obvious, 8 although our approach in the past has been to concentrate on supplying the appropriate materials 9 at the right width and slope, expecting stream structure to develop over time. While the majority of 10 the culverts in the study did have similar sediment distribution as the adjacent reference reach, and 11 were sized correctly, they tended to have flat, featureless beds and did not form banks. It is our 12 hope that this newly revised guidance, along with the excellent wealth of other literature about 13 stream simulation, and the increased experience of the design and construction community, will 14 result in stream simulation culverts that better reflect the form and function of the stream in which 15 they occur. 16
A good reference for the design of stream simulation culverts is the U.S. Dept of Agriculture Forest 17 Service publication STREAM SIMULATION: AN ECOLOGICAL APPROACH TO PROVIDING PASSAGE FOR AQUATIC 18 ORGANISMS AT ROADSTREAM CROSSINGS (Forest Service Stream‐Simulation Working Group 2008). 19 This comprehensive guidance document is available as a free download on the internet. It covers 20 ecological concepts, assessment, geomorphology, culvert design, and construction. It is highly 21 recommended for all designers and contractors working in this field. One note of caution is that the 22 Forest Service guideline is written for a national audience where culvert design, environmental 23 goals, and objectives are varied and often differ from those required in Washington State. The 24 slope, sizing, and bed material gradation criteria recommended in this chapter reflect Washington 25 law and rule, whereas the USFS guidelines are more universal in their application and could lead to 26 a design which does not meet the Washington guidelines. 27
Generally, the stream simulation Design Option is best applied in the following situations: 28
• New and replacement‐culvert installations ‐ this method does not apply to retrofits of 29 existing culverts 30
• Complex installations with moderately dynamic channels 31 • Nearly all natural channel gradients 32 • Channel width less than 15 ft; consider a bridge for larger streams 33 • Culvert lengths less than 15 channel widths long, unless designed as described below 34 • Moderately entrenched channel (floodplain utilization ratio less than about 3, please see 35
page 30), unless designed as described below 36 • Culvert bed slopes that will be no more than 125 percent of the upstream channel slope 37
(this method is not meant to limit work to within the right‐of‐way) 38
Culverts designed to simulate streambeds are sized wider than the channel width and the bed 39 inside the culvert is sloped at a similar gradient to the adjacent stream reach (within limits, as 40

2nd Draft Water Crossing Design Guidelines 11/30/11
24
outlined below). These culverts are filled with a sediment mix that emulates the natural channel, 1 erodes and deforms similar to the natural channel, and is unlikely to change grade unless 2 specifically designed to do so. This fill material is placed in the culvert to mimic a stream channel 3 and is allowed to adjust in minor ways to changing conditions. The most basic stream simulation 4 culvert is a bottomless culvert placed over a natural streambed. Here, the natural streambed 5 remains in place. In practice this is not so easily done considering that the footing must be 6 excavated with additional clearance for construction, but the principle remains the same. 7
The concepts behind the Stream Simulation Design Option can be applied to the design of short 8 reaches of channel outside of culverts as well, particularly in higher‐gradient streams. Design 9 guidance is all but absent from the general literature for how to go about designing steep channels, 10 so the Stream Simulation Design Option provides a simple, effective approach. 11
The width criteria for culverts (outlined below) should not restrict the size of constructed channels. 12 Width should be calculated based on a representative section of the natural stream. Guidance for 13 designing the slope, structure, and bed composition of a constructed channel is discussed in the 14 following section; however, it should be noted that constructed channels longer than about 10 15 channel widths should be designed using a much more rigorous and comprehensive procedure than 16 that described here. Additional information on the design of constructed channels at an arbitrary 17 slope can be found in Chapter 6: Hydraulic Design Option, roughened channel section. 18
SUITABILITY OF THE SITE 19 In the early history of stream simulation design it was thought that there was some inherent risk in 20 culverts used in steep channels and a limit of 6% was applied to the design. Above that slope an 21 experimental design plan was required (page 38, DESIGN OF ROAD CULVERTS FOR FISH PASSAGE, 2003). 22 Our experience has been that culverts can be successfully constructed at any stream gradient, 23 providing that they are properly designed, and culverts above 6% are no longer considered 24 experimental. Considering the fact that most high gradient channels are quite coarse and resist 25 change, culverts on steeper channels are less likely to experience such calamities as catastrophic 26 bed scour. Low gradient culverts are composed of finer bed materials and often have wider 27 floodplains, they are also under wider roads and in urbanized environments, all of which 28 complicate design, affect bed stability, and stream simulation success. 29
Factors that determine the suitability of a site for stream simulation culverts are 30
• Vertical and horizontal stability 31 • Slope ratio and profile continuity 32 • Gradient control 33 • Culvert length 34
These factors are addressed in the paragraphs below. If any of the site criteria suggested here are 35 exceeded, it is best to consider a bridge as a proper alternative (see Chapter 4). 36
Expected changes in the elevation or lateral extent of the channel must be within the culvert’s 37 capacity to accommodate it and still allow natural stream processes. If the channel bed will 38

2nd Draft Water Crossing Design Guidelines 11/30/11
25
degrade as a result of downstream incision, then the culvert must be countersunk enough to 1 prevent the bottom from being exposed. Likewise, channels expected to aggrade must not fill the 2 culvert so as to restrict the movement of water, sediment, and debris. This sort of aggradation can 3 be from an upstream source, such as a landslide, or as a response to stream incision caused either 4 by the culvert replacement itself (see Chapter 7, Channel Profile Adjustment) or from incision 5 initiated by another cause. These are likely transitory and a culvert design by this method may still 6 be an appropriate solution if it is sized correctly and placed at the right elevation. 7
Culverts, by their very nature, are long and narrow and ill‐suited to meandering streams with a 8 migration zone many times the bankfull width. No‐slope and stream simulation culvert sizing 9 methods are based on the bankfull width and are blind to the extent of floodplain and migration 10 zone. This fact limits the applicability of the method and, as noted above, stream simulation 11 culverts are best applied to moderately entrenched channels ‐ channels with limited flood plains 12 that tend not to meander. The recommended maximum floodplain utilization ratio is 3. Floodplain 13 utilization ratio is a measure of the width of the floodplain relative to the channel and defined more 14 clearly below and in Chapter 4. 15
If there is an outfall drop at the existing culvert, then there will likely be some channel response to 16 the replacement culvert. This response, and alternatives for dealing with it, is covered in Chapter 17 7. The pertinent issue here is that all possible alternatives will include one that over‐steepens the 18 culvert to connect the down and upstream channel beds with a slope that is in excess of the 19 prevailing stream gradient. This is an inappropriate application of the stream simulation concept 20 since gradient is one of the more important characteristics of a channel and stream simulation 21 seeks to emulate all those characteristics. Gradient defines channel type, sediment distribution and 22 transport, among other processes. By over‐steepening the culvert you have changed its very nature 23 and it no longer “simulates” the adjacent channel – the basic precept of the method. 24
As a way to limit the slope of stream simulation culverts, the slope ratio, SR, is defined as the ratio 25 of the culvert bed gradient, Sculv and the natural channel gradient, Sch, see Equation 3.1. These 26 slopes are shown in Figure 3.2. One must differentiate between the culvert bed gradient and the 27 slope of the culvert itself as they can be different. 28
SR = Sculv/Sch Equation 3.1 29
30

2nd Draft Water Crossing Design Guidelines 11/30/11
26
1
2
Figure 3.2: Stream profile showing the different gradients needed to determine the slope ratio. 3
For new culverts, the channel slope to be used in Equation 3.1 is the slope that would occur in the 4 absence of the culvert. For replacing an existing culvert, the upstream channel slope is generally 5 used in this equation, since it is the upstream reach that supplies the bedload to the culvert. The 6 channel downstream of an existing culvert is often incised or otherwise modified by the presence of 7 the existing culvert and will not likely reflect natural conditions. Even so, either the upstream or 8 downstream channel can be used; whichever best reflects the natural slope at the culvert site. 9 Undersized culverts can significantly influence the channel slope immediately upstream; therefore, 10 a long profile is necessary to discern the true gradient (see Chapter 7). Stream simulation cannot 11 be used to connect significantly dissimilar upstream and downstream reaches in order to keep the 12 project within the road right‐of‐way. This is shown in Figure 3.3 where the upstream channel is 13 maintained at a higher elevation than it would normally assume should the culvert be replaced with 14 one that is lower. This is an inappropriate application of the design method. 15

2nd Draft Water Crossing Design Guidelines 11/30/11
27
1
Figure 3.3: A stream profile showing a roughened channel culvert used to artificially 2 maintain an upstream bed elevation and the regrade that would occur if a stream simulation 3 culvert were used and the slope ratio criteria maintained at less than 1.25. 4
For a culvert to be designed using the stream simulation approach, the slope ratio must be less than 5 or equal to 1.25. Slope ratios greater than 1.25 require a bridge or the application of the Hydraulic 6 Design Option, Chapter 6, specifically, the roughened channel option. 7
By the same token, a culvert slope that is substantially less than the prevailing gradient creates a 8 dispositional zone, among other possible problems. While no specific minimum slope ratio is 9 suggested, the goal is to place the bed in the culvert at the same gradient as the stream – not to 10 over‐ or under‐steepen it. The assumption in this paragraph is that the culvert is at the same 11 gradient as the bed inside it. 12
There is another scenario where the streambed inside the culvert is initially set at a lower gradient 13 than the culvert so that it can regrade in response to the predicted loss of a downstream control. 14 This is a sophisticated design feature and should be used only after careful consideration. 15
It may be advisable to restrict the slope ratio to values less than 1.25 if, through hydraulic analysis, 16 it is found that the flow regime changes inside or at the outlet of the culvert. Such changes, from 17 subcritical to supercritical flow or the reverse, result in a large release in energy and subsequent 18
Road fill
Right of way
Channel regrade if culvert slope < 1.25 x channel slope
Stream simulation culvert slope < 1.25 x
channel slope
Roughened channel culvert slope > 1.25 x
channel slope

2nd Draft Water Crossing Design Guidelines 11/30/11
28
scour. Turbulent, subcritical flow usually occurs in natural channels; although, during large floods, 1 this may not be the case. If a hydraulic jump is anticipated, then channel geometry should be 2 altered (such as reducing the culvert slope or increasing width) to avoid it. 3
At this stage in the evolution of stream simulation design, “similarity” is defined, in part, by the lack 4 of disparity in the size and distribution of sediment in the culvert relative to the adjacent channel; 5 we look to the stream to tell us what would be appropriate to put in the culvert. But the natural 6 stream gradient can be controlled by either sediment or large wood. For instance, the gradient of a 7 step‐pool stream may be controlled by a boulder step or by a log. Wood control tends to make 8 stream surface sediment finer than it would be if there was only sediment there to control gradient. 9 Since we do not recommend placing large wood in a culvert, we cannot reasonably use the 10 sediment size found in a wood‐forced stream to design a culvert at the prevailing stream slope. On 11 this basis, wood‐forced stream types are not suitable for stream simulation culverts. Fortunately, 12 most streams in Washington are not exclusively wood or sediment controlled and we have many 13 successful stream simulation culverts on steams with abundant wood. This mixing of stream types 14 is found especially in landscapes modified by logging. Designers who find themselves working in 15 truly wood‐forced streams may want to consider a bridge as an alternative, or an alternative 16 method developed to suit the site conditions. 17
ASSESSMENT OF THE ADJACENT STREAM REACH 18 An assessment of the channel will provide the information needed for stream simulation design. 19 The upstream reach adjacent to the culvert site is typically used for the assessment, with the 20 considerations mentioned previously regarding the slope ratio. In the case of replacement culverts, 21 an undersized original culvert will have caused aggradation and fining of the bed material so that 22 one must move upstream to find an appropriate reference site. 23
For new culvert installations, there is no need for a reach assessment if the natural channel is to 24 serve as the stream simulation channel. In the case of a bottomless arch culvert, the natural 25 channel would then remain in place, although somewhat affected by the installation of the culvert 26 over it. 27
The important aspects of channel geomorphology for stream simulation culvert design are: 28
• Channel type 29 • Bankfull width 30 • Flood plain utilization ratio 31 • Prevailing stream gradient 32 • Long profile 33 • Bed material gradation 34
Streams can be subdivided into two general categories for the purposes of stream simulation 35 design. Both are appropriate for stream simulation, but they have different characteristics. The 36 first category contains low‐gradient, alluvial channels. These are generally pool‐riffle streams 37 having a slope of less than four percent (classified by D. L. Rosgen as types C, E or F (Rosgen 1994)). 38 At this slope bed particles are of a size that moves easily during common storms so that stream 39

2nd Draft Water Crossing Design Guidelines 11/30/11
29
simulation in these cases implies a mobile bed and the designer must keep this in mind as they 1 make decisions about culvert type (e.g. bottomless arch vs. full round) and size. Scenario 1 2 culverts (described later in this chapter) are suitable for this category of stream. 3
The use of a four‐percent slope as a threshold is somewhat arbitrary. Current experience has been 4 that streams and their stream simulation culverts having slopes of four percent or less tend to have 5 mobile beds at frequent storm intervals. It is conceivable that a flatter‐sloped channel can have a 6 very stable bed, in which case the culvert design should reflect that. 7
Streams in the second category have a higher‐gradient, step‐pool or cascade‐type channel, with a 8 slope of greater than four percent and with conditions matching Rosgen’s stream classifications of 9 A, B, F or G. The beds of these channels are very stable and adjust only during rare storm events. 10 These are Scenario 2 culverts. 11
Bankfull width (BFW) is the main parameter in stream simulation design and refers to the natural 12 unaltered top width of the stream channel. For confined or non‐alluvial channels there may not be a 13 bankfull channel in the strict sense and one must use channel width indicators to determine this 14 measurement. Techniques to determine the bankfull width are presented in Appendix C. 15
Floodplain Utilization Ratio (FUR) refers to the width of the floodplain relative to the main 16 channel. This can be quantified by the floodplain utilization ratio, which is defined here as the 17 flood‐prone width (FPW) divided by the bankfull width. (The Floodplain Utilization Ratio is 18 referred to as the “entrenchment ratio”, ER, (Rosgen 1996)). As a rule‐of‐thumb, flood‐prone width 19 is defined as the water surface width at a height above the bed of twice the bankfull depth (Rosgen 20 1996). Read more about FUR in Chapter 4. Streams appropriate for stream simulation, and 21 culverts in general, have a FUR less than approximately 3. There are exceptions in low gradient 22 wetlands with limited meander migration and negligible down‐valley movement of water on the 23 floodplain. 24
The prevailing stream gradient is defined by the water surface slope over the reach where the 25 culvert is located. This gradient is measured outside the influence of the existing culvert where the 26 slope is determined by natural alluvial forces. 27
For the most part, new culverts should be installed at the natural channel gradient. Where the 28 stream simulation culvert is to be placed at the same gradient as the channel, the bed composition 29 and pattern of the adjacent channel (outside the influence of structures) will suggest what the bed 30 in the culvert should look like. As discussed above, the exception is where channels are dominated 31 by large pieces of wood. See Chapter 7 for more information on channel profiles. 32
While stream simulation culverts are probably the best culvert alternative for streams with high 33 debris potential, there is still the risk that wood will form a jam inside the pipe and back up flow. 34 Bridges are much better than culverts for allowing the movement of debris where there is a high 35 potential for large‐wood movement or debris flows. See Chapter 4 for bridge design. 36
In situations where the downstream channel has degraded, it is tempting to install a replacement 37 culvert at a steeper gradient than the upstream channel to connect the dissimilar channel 38

2nd Draft Water Crossing Design Guidelines 11/30/11
30
elevations. This is acceptable up to a slope ratio of 1.25 but it is important to recognize that streams 1 tend toward an equilibrium gradient in a powerful and inevitable way: if you put a culvert in at 5% 2 in a 4% stream, there is a strong likelihood that over time the culvert bed will end up at 4%. This 3 steeper gradient can be designed to regrade over time, although this is really governed by the 4 probability of a certain storm event occurring in a given period of time – not a very reliable 5 engineering strategy. 6
The long profile is discussed extensively in Chapter 7. Of particular importance here are 7 significant discontinuities caused by the existing culvert or natural features, such as log jam, and 8 how they will affect the culvert bed, at a given countersink, over time. As discussed earlier, the 9 culvert must have the vertical capacity to accommodate the changes caused by these 10 discontinuities. 11
Bed material gradation is very important for proper stream simulation design since this is what 12 creates the stream bed inside the culvert. The natural channel bed can be assessed a number of 13 ways and how this fits into the design process is discussed below. 14
CULVERT TYPE AND SIZE 15 The exact type of culvert used for stream simulation is largely a matter of preference. All types of 16 corrugated metal pipes (CMP), bottomless culverts, and concrete boxes have been used. Bottomless 17 structures at new crossing sites can be placed over the native bed, allowing it to remain in place, 18 with the understanding that there will be construction impacts to the channel that will need to be 19 repaired. Low profile bottomless arch culverts have the disadvantage of allowing only minor 20 changes in bed elevation before either the footing is exposed or the inlet area is reduced to an 21 unacceptable size. Bottomless arch culverts usually require riprap at the footings to ensure their 22 safety and such materials are not in keeping with stream simulation goals. The use of stemwalls can 23 move the footing down below scour depth so that no armor rock is required. Concrete boxes come 24 in a wide variety of sizes and have a long life span. Two‐piece 4‐sided box culverts can be inverted, 25 with the U shaped piece on the bottom and a lid on top. This allows the bed to be installed inside the 26 culvert from the top before it is backfilled. 27
Single‐piece round corrugated metal pipes are preferred to pipe arches for several reasons. A 28 round pipe of a diameter similar to a given pipe‐arch span will have greater depth of fill of fill inside 29 the culvert for the same bed and crown elevations, allowing more vertical bed change before the 30 pipe bottom is exposed. These two types of pipes will cost roughly the same. Assembly and 31 installation of the round pipe is easier than the corresponding pipe arch, although the excavation is 32 deeper. 33
In larger sizes the horizontal ellipse CMP is preferred to the round culvert because it uses less metal 34 (the circumference of an ellipse is shorter than a round for a given span) and still allows an 35 adequate depth of fill in the culvert to protect the stream simulation structure. 36
The width of a stream simulation culvert can be determined through an analysis of stream 37 geomorphology, as recommended in the USFS stream simulation guide ((Forest Service Stream‐38 Simulation Working Group 2008), or it can be determined by using the method suggested here. The 39

2nd Draft Water Crossing Design Guidelines 11/30/11
31
advantage of using the method described below is its simplicity. The USFS assessment and design 1 process is comprehensive and time consuming. It is likely that the result will be similar. Those 2 using the USFS approach should look carefully at Chapters 4, 5, and 6 in order to comprehensively 3 design the crossing. 4
The minimum width of the bed in any type of culvert, Wculvert bed, in feet, should be determined by 5
Wculvert bed = 1.2Wch + 2 (in feet) Equation 3.2 6
Where: Wch = the width of the bankfull channel, which is further described in Appendix C, 7 Channel Width Measurement. 8
The result, Wculvert bed, is rounded up to the next whole foot. It must be emphasized that Wculvert bed is 9 the width of the bed inside the culvert, not the culvert diameter. The diameter of a round culvert is 10 10 percent greater than the width of the bed occupying the bottom 30 percent of the culvert. At the 11 50 percent countersink the diameter equals the bed width. Equation 3.2 is shown schematically 12 in Figure 3.4 for both a round and a bottomless arch culvert. The relationship is similar for 3‐ and 13 4‐sided box culverts as well. 14
15
Figure 3.4: Stream and culvert cross sections showing the relationship between the channel 16 width and the span of a stream simulation culvert for a bottomless arch culvert and a round 17 culvert that has been countersunk 50%. 18
There are a number of reasons for the relationship in Equation 3.2, and there are some 19 exceptions. It is generally accepted that natural channels need width over and above their active 20 channel to function normally(Dunne and Leopold 1978; Thorne, Hey et al. 1997). The degree to 21 which the culvert sides must extend beyond this width is a matter of debate, although the 22 performance of this equation for the design of culverts has proven to be remarkably successful. This 23 equation creates a bed width between 33 and 7% wider than the bankfull width on 15 and 4 foot 24

2nd Draft Water Crossing Design Guidelines 11/30/11
32
channels, respectively. This compares with the median FUR of 1.6 for the 50 streams studied as part 1 of the stream simulation effectiveness study culverts (Barnard, Yokers et al. 2011): the prescribed 2 width tends not to constrict the channel at high flow, a basic precept of the method. 3
Equation 3.2 was designed to create a minimum size of culvert of 6 feet to allow construction 4 equipment access. Some designers and contractors only start with stream simulation culverts 5 greater than 7 feet to facilitate the use of skid‐steer (Bobcat®) style front end loaders. It may be 6 possible to construct a stream channel in a culvert smaller than 6 feet using other techniques. If a 7 smaller culvert is proposed, then the designer should explain the construction methods and show 8 that the water way area remaining in the culvert is adequate for the stream processes expected in 9 the creek, such as sediment and debris passage, and that it is possible to maintain the culvert 10 should it be required. 11
In 2008, the National Marine Fisheries Service (NOAA Fisheries) published ANADROMOUS SALMONID 12 PASSAGE FACILITY DESIGN(Nordland 2008). It describes three culvert design methods that are almost 13 identical to WDFW's hydraulic, no‐slope and stream simulation methods, and it often references 14 WDFW’s DESIGN OF ROAD CULVERTS FOR FISH PASSAGE. One significant departure is in the stream 15 simulation section, where the width of the culvert must be at least 1.3 times the bankfull width of 16 the stream channel. This is smaller than Equation 3.2 for channels less than 15 ft, where most 17 culverts are built, and does not compensate for small channels, an important design and 18 construction consideration. 19
A casual survey of crossing design standards across the nation found that Equation 3.2 was used 20 by the New Hampshire Fish and Game Department for their Stream Crossing Guidelines, and in the 21 Etowah River Basin, Georgia, Habitat Conservation Plan. In the states of Massachusetts, Vermont, 22 and Connecticut their stream simulation culvert bed width is 1.2 bankfull width of the stream. In 23 the State of New York, the coefficient is 1.25. The CalTrans culvert design guidance uses much the 24 same approach as the USFS stream simulation guidance which relies on an expert design team to 25 determine the proper width on the basis of a geomorphological analysis. On the lower end of the 26 scale, Oregon and British Columbia both recommend a minimum width of structure as the bankfull 27 width of the stream. The relationship between channel width and design culvert bed width is 28 shown in Figure 3.5. The important aspect of this is that the criteria set out here in Equation 29 3.2 makes wider culverts on smaller streams where constructability, access for maintenance, 30 passage of debris and sediment is a major issue for the small cross sectional area remaining above 31 the countersink. For instance, using Equation 3.2, a 6 foot diameter culvert is required on a 3 foot 32 stream. The clear space above a 50% countersink is 3 ft in the center, tapering rapidly to nothing at 33 the edges, allowing no equipment access and little room for flood transported debris and sediment. 34 Contrast this with a 4 foot culvert required under NOAA guidelines and one can see that it is 35 difficult or impossible to design a constructible and reliable stream simulation culvert on smaller 36 streams. 37

2nd Draft Water Crossing Design Guidelines 11/30/11
33
1
Figure 3.5: The relationship between stream bed width and culvert bed width for three 2 different culvert sizing methods. Equation 3.2 is shown is the blue line. NOAA Fisheries' is 3 the red line. The green line indicates the case where the streambed width is equal to the 4 culvert bed width. 5
If the designer can demonstrate that a culvert needs to be wider or narrower than provided by the 6 above equation, then that width may be acceptable. The following paragraphs suggest some 7 aspects of design that should be considered when deviating from Equation 3.2. 8
To be completely general, the criteria for culvert bed with should be tied to channel type and 9 floodplain utilization ratio (FUR). Equation 3.2 prescribes a suitable culvert bed width for the 10 range of channel types it has been applied to, primarily small, steep streams with a FUR < 3. The 11 implication is that FUR significantly larger than 3 would need a wider culvert, and significantly 12 smaller than 3 a narrower culvert. 13
Before deviating from Equation 3.2, several concerns will need to be addressed. For instance, 14 contraction at the inlet is a potentially serious source of bed scour. This scour will occur at greater‐15 than‐bankfull flows and could alter the characteristics of the stream simulation bed and adjacent 16 channel. These effects must be assessed before recommending the use of a pipe that is smaller than 17 what Equation 3.2 suggests. A worst‐case scenario would involve a low‐gradient, unconfined, 18 alluvial channel upstream of the culvert (similar to Figures C.4 and C.7 found in Appendix C ). The 19 active channel width may contain only a fraction of the total flow during a greater‐than‐bankful 20 discharge. Inlet contraction in this case would be severe, and it may be advisable to size the culvert 21 wider than the width given by Equation 3.2. Inlet modifications, such as wing walls, may reduce 22 contraction‐induced turbulence, but velocities can still remain high enough to scour the bed. In 23 severe cases, a bridge is recommended. A simple method to determine the contribution of 24 floodplain to total flow is given in Chapter 1, Selecting a Crossing Method 25
0
2
4
6
8
10
12
14
16
18
20
0 2 4 6 8 10 12 14
Culvert be
d width
Stream bed width
Wculvbed = Wch
Wculvbed = 1.3Wch
Wculvbed = 1.2Wch+ 2 ft

2nd Draft Water Crossing Design Guidelines 11/30/11
34
In a confined valley channel where the stream width does not change substantially with stage, FUR 1 < 1.5 or so, the culvert may not need to be any wider than the channel as long as it is sized to pass 2 flood flows with accompanying wood and sediment. A safely factor should be applied, as is 3 discussed in Chapter 4, bridge span for confined channels. There is a lower limit to this, however. 4 That limitation is where the culvert is just too small to construct a channel in. Depending upon 5 length, a diameter or span of six feet is a minimum for shorter culverts. As a word of caution, 6 incised channels may look narrow early in their development but will widen with age. Stream 7 simulation culverts should be sized to anticipate this future widening. 8
A motivating factor for developing stream simulation culverts is to facilitate juvenile fish passage. 9 These fish use stream margins and a variety of migration pathways where low levels of velocity and 10 turbulence occur. Equation 3.2 allows for some of the channel width to be reserved for margins. 11 In effect, the stream simulation culvert has “banks” inside for the majority of flows that facilitate 12 juvenile fish passage for all but peak events. As discussed below, these banks must be formed at the 13 time of construction. 14
Some vertical and plan form variation can take place in a stream simulation culvert that is wider 15 than the channel width. There will be some meander and/or step‐pool formation inside. In the 16 existing stream simulation installations, low‐flow channels meander within the length of the pipe, 17 and step pools provide energy dissipation at high flow. As discussed below, exceptionally long 18 culverts may require additional width to simulate natural conditions. 19
Wildlife passage under roads can be provided by large stream simulation culverts. The 20 combination of large size, dry bank, natural substrate, adequate illumination and lower stream 21 velocities provide attractive conditions for animals to move through. If vertical clearance is 22 adequate (generally > 8 ft), deer will use them for safe passage under the road. Birds are also 23 known to fly through them. Amphibians and small animals likely can pass using the banks and 24 shallow water areas inside. In one stream simulation culvert, grass grows on the margin a short 25 distance into the pipe, indicating the stability of the stream margin. Coho have spawned in this 26 style of culvert. 27
CULVERT LENGTH 28 When the length of the crossing structure is longer than the longest straight reach in the adjacent 29 channel, then the roughness associated with the planform variation is not replicated and the culvert 30 may not dissipate hydraulic energy at the same rate that the natural channel does, leading to 31 acceleration and scour. The culvert wall is straight and smooth, the bankline is not. In addition, 32 longer culverts are less forgiving when errors have been made in the design or construction of the 33 culvert. See (Forest Service Stream‐Simulation Working Group 2008) Chapter 6.1.1.1. Risks of 34 longer culverts for further discussion. Small failures in a long culvert bed structure during a flood 35 event may cause a headcut within the culvert which may expose the bottom – a critical condition 36 which creates a fish passage barrier and prevents culvert bed recovery. 37
The major concern for long culverts is that the quantity of kinetic energy of flow at the inlet should 38 be the same throughout the culvert – flow should not be allowed to accelerate. The kinetic energy of 39 flow is dissipated largely through turbulence created by roughness. The factors affecting channel 40

2nd Draft Water Crossing Design Guidelines 11/30/11
35
roughness are the surface roughness, vegetation, channel irregularity, channel alignment, silting 1 and scouring, shape and size of a channel, and the stage‐discharge relationship (Chow 1959). We 2 can manipulate only two of these effectively in a culvert – surface roughness and channel size and 3 shape. For longer sections of channel, irregularity and alignment play a larger role and, if we are 4 going to use culverts in longer applications, we must compensate for this loss of roughness. 5
Relatively little is known about the design and performance of long stream simulation culverts. In 6 order to provide a threshold, culverts with a length‐to‐span ratio of greater than 10 are considered 7 long and special consideration should be given to their design. 8
Three alternatives for long culverts are proposed. The first two suggest increasing width and the 9 third a change of crossing type. 10
1. Increase culvert width using geomorphological features as a guide to sizing. For instance, 11 for low gradient, pool‐riffle channels create enough width to accommodate a point bar on 12 one side when length is greater than 15 times BFW (this length is roughly equal to the 13 meander length for a poor‐riffle stream). This point bar should alternate sides, as it would 14 in a meandering channel, and be reinforced to resist erosion. 15
2. Increase culvert roughness by decreasing hydraulic radius. Research work shows that 16 meandering increases manning’s n by 13‐30% (Chow 1959; Khatua, Patra et al. 2010). 17 Using the relationships in the manning’s equation, for a given slope, the hydraulic radius 18 must be decreased 17% to compensate for a 13% increase in n. This corresponds to a 19 roughly 30% increase in width, which would be added to the results given by Equation 3.2. 20 This should be a 30% increase in the width of the area outside the bankfull channel, which 21 would remain the same width. 22
3. Use a bridge instead of a culvert. 23
CULVERT BED CONFIGURATION 24 Two stream simulation scenarios are depicted schematically in Figures 3.6. The scenarios 25 characterize the upstream channel and are based on information gathered from the upstream reach 26 assessment. Each scenario leads to a different approach for designing the streambed. 27
If the channel is in equilibrium (neither aggrading nor degrading) and the slope is maintained by 28 sediment, the composition of the channel should be described by a sample of the bed material or by 29 a surface pebble count. If wood or roots dominate the slope, bed material must be specified using a 30 reference reach method or a sediment stability model. A reference reach in another channel with 31 similar slope and width can be used as an example or design template, although this must be 32 thoroughly tested with hydraulic modeling to show that it remains applicable to the culvert design 33 in question. The sediment gradation is to be designed using natural streambed gradation. 34

2nd Draft Water Crossing Design Guidelines 11/30/11
36
1
Figure 3.6: Stream simulation culvert profiles, Scenarios 1 and 2. 2
The WDFW stream simulation effectiveness study (Barnard, Yokers et al. 2011) found that the 3 majority of studied culverts had flat channel cross sections and very few had banks of any 4 appreciable height and width. While average velocity and shear stress are lower in low hydraulic 5 radius cross sections, they do not look or act like natural channels which have a defined channel 6 and variation in velocity and particle size across the width. This study concluded that channel cross 7 section is largely determined at the time of construction and the shape of the bed must be carefully 8 built as the bed material is loaded into the culvert. In the past, we assumed that if the proper 9 materials were supplied in an appropriately sized culvert at the proper gradient, that the bed shape 10 would form on its own. Evidently, this is not the case and careful attention to cross sectional shape 11 during construction is the only remedy. Figure 3.7 shows a stream‐like cross section in three 12 culvert types. By placing larger sediment sizes at the sides of the culvert this shape can be created 13 and maintained over time. Remember that the size of the sediment and its gradation is a function of 14 slope and discharge and the relative sizes and their placement in Figure 3.7 is for illustration 15 purposes only. 16
Road fill
Road fill
Scenario I<4% slope
Scenario 2>4% slope
Coarse bandsStreambed material
Pool‐riffle profile
Streambed material
Cascade, step‐pool profile

2nd Draft Water Crossing Design Guidelines 11/30/11
37
1
Figure 3.7: Stream simulation culvert cross sections for three culvert types; A, bottomless arch 2 culvert, B, box culvert, and C, circular. 3
SCENARIO 1 4 The culvert bed gradient is less than four percent, and the bed is predominantly native material 5 with bands of coarser particles to control grade and channel cross‐section shape. In lower‐gradient 6 channels, bed forms are fluid, and it may be some time before channel structure is formed. There is 7 also a tendency for the deepest part of the channel to follow a wall of the culvert because of the 8 smoothness of the wall. The bands of coarser sediment help form structure and maintain gradient. 9 The crest of these bands is lower in the middle, encouraging the channel to stay in the central part 10 of the culvert, Figure 3.7. In wider, low‐gradient culverts, the low‐flow channel should meander 11 but still remain in the middle third of the culvert. The bands are composed of well‐graded stream 12 bed sediment that is one to two times D100 (the largest particle found in the bed). 13
There are alternative ways to accomplish the same thing without coarse bands. For instance, in 14 vertically stable streams, coarser material could be placed along the wall of the culvert defining the 15 channel in the center of the culvert. 16
In smaller streams (width of channel less than about eight feet), D100 is adequate for these coarse 17 bands. Wider streams will require larger particles. This is only a general rule and the designer 18 should carefully look at expected discharge and slope to guide the specification of material. Spacing 19 of the bands depends upon slope and channel width. The distance between coarse bands is the 20 lesser of five times the width of the channel or as necessary to provide a vertical difference between 21 crests less than or equal to 0.8 feet. 22

2nd Draft Water Crossing Design Guidelines 11/30/11
38
Coarse bands are not intended to be grade control or rigid structures that do not deform over time. 1 Bands are to be constructed of rounded material graded similarly to the sediment found in the 2 adjacent channel, not from riprap or other quarried stone. 3
Spacing starts at the naturally occurring, or intentionally placed, downstream grade control. These 4 bands should never be closer than one channel width or 15 feet (whichever is less) from the inlet or 5 outlet of the culvert. Partially spanning rock clusters or similar structures may be substituted for 6 the coarse bands. Care must be taken that these do not create undue scour at high flow and force 7 bed material out of the culvert. 8
SCENARIO 2 9 The culvert bed gradient is greater than four percent. Native or engineered bed material is used 10 throughout the fill. No coarse bands are needed since beds at these gradients are very coarse and 11 stable, although the shape of the bed must be established at the time of construction. 12
The bed has a monolithic structure where the largest particles are in contact with each other, 13 forming a network of continuous support along the whole length of the culvert and depth of the fill 14 inside. The concept is that gravel beds “flow” and changes in the bed elevation quickly move 15 through the bed. Coarse cobble and bolder beds, such as we are talking about in Scenario 2 16 culverts, are resistant to change because the largest particles support each other in a more 17 “monolithic” structure and changes in elevation at one point don’t necessarily result in changes to 18 another part. The result is a step‐pool (abrupt change in elevation supporting itself) or cascade 19 type channel. 20
Generally, Scenario 2 culverts are of a step‐pool or cascade channel type. The shape of this channel 21 is defined at the time of construction; the steps are formed of the larger pieces in the mix, the pools 22 are hollows below the average grade line. These stream units should be composed of materials that 23 are not generally mobile at all but the highest expected flows. Equation 3.6 below shows the 24 relationship between the size particle that will be moved at the design flow and the largest particles 25 found in the stream. The profile can be painted on the side of the culvert wall to aid the contractor 26 during construction. Careful staging and delivery of the materials to those working in the culvert 27 makes for efficient work flow and a quality product. 28
CULVERT BED DESIGN 29 The simplest case for using the stream simulation for culverts is where the slope of the bed in the 30 culvert matches the slope of the adjacent reach. In this instance, there will be little, if any, 31 discontinuity in sediment‐transport characteristics. The bedload transported through the 32 upstream reach will continuously supply the bed in the culvert with materials for form adjustments 33 and rebuilding after large floods. If the culvert is sized appropriately, then the bed material placed 34 inside the culvert will be the same as that found in the upstream bed. More challenging cases are 35 where: 36
• The slope ratio approaches 1.25 37 • The FUR is greater than 3 38 • Or in fine‐grained beds, like wetlands 39

2nd Draft Water Crossing Design Guidelines 11/30/11
39
If the culvert is steeper than the upstream channel (slope ratio > 1), the coarser bed material 1 needed to support that slope is not supplied by the upstream channel and, over time, is winnowed 2 out and not replaced, increasing the likelihood of failure over time. It is best to avoid this situation 3 but if it proves to be necessary, special attention should be paid to the sizing and arrangement of 4 materials in the culvert. This can be done by observing the following precautions: 5
• Verify that the sizing of the materials is appropriate for the slope and discharge of the 6 stream (see sections below on sizing) 7
• Carefully select the source and gradation of the materials by visiting the pit and requiring 8 sieve analysis 9
• Have an experienced engineer on site to supervise the construction of the culvert bed 10
A wide upstream floodplain increases the discharge in the main channel when it is confined, 11 increasing the hydraulic stress. The bed material must be sized to accommodate this increase or, as 12 in the case of a high slope ratio, it will winnow out and eventually scour. By far the best method to 13 reduce this stress is to increase the culvert span beyond that required by Equation 3.2. 14
Culverts in wetlands have a unique set of design challenges. The bed is usually fine‐grained silt or 15 clay. It is impossible to simulate this bed inside the culvert since it would be mucky as it is placed 16 and likely to flow out when saturated, causing a water quality violation. So, the culvert must be 17 either filled with a material that is dissimilar to the adjacent channel or left empty to fill over time. 18 Filling is recommended since it removes the possibility of stranding fish in the unfilled pool during 19 low flow periods. A well‐graded mixture of small gravel, sand and fines (such as 9-03.11(1) 20 Streambed Sediment suggested in the section at the end of this chapter) can be used as fill. While 21 we do not recommend stratified fills, the designer could make a case for filling the lower portion of 22 the culvert with on site materials and placing a top course of streambed gravel. However, any 23 change in downstream bed elevation will result in regrade of this top course and the possible 24 exposure of the unsuitable stuff below. 25
The selection and gradation of channel fill material must address bed stability at high flows and 26 must be well‐graded (includes all size classes) to prevent loss of significant surface flow. Where the 27 bed is placed at the gradient of the adjacent channel, native size and gradation may be used as a 28 guide for the fill mix. This is done with the understanding that conditions inside the culvert during 29 peak flows may be more severe than those in the natural channel. The designer should begin with 30 an accurate description of the upstream channel bed material, using a pebble count or some other 31 method. 32
In order to determine with some level of certainty whether the prescribed bed will be appropriate 33 for the given design storm, an engineer must be able to evaluate the stability of the bed on the basis 34 of hydraulic analysis. To be thorough, hydraulic analysis may also be necessary to verify that the 35 native streambed material is not appropriate for the culvert design. There are several established 36 approaches that analyze critical shear stress to evaluate bed stability in gravel bed streams. These 37 approaches should be used in the design of stream simulation culvert beds having a gradient of less 38 than one or two percent. It has been suggested that shear‐stress analysis is unsuitable for slopes 39 that exceed one percent and where relative roughness is high (where the 84th percentile particle is 40

2nd Draft Water Crossing Design Guidelines 11/30/11
40
greater than 1/10 the water depth)(Grant, Swanson et al. 1990). Clearly, conditions in high‐1 gradient, stream simulation culverts are outside the range for shear stress analysis. Several other 2 approaches are available, four of which are outlined here. None of these methods are fool‐proof. 3 They have been applied over the last 10 years or so and, depending on assumptions, have been 4 successful. Over and above their application, they do have a solid theoretical foundation and 5 produce conclusions that are similar to each other. We recommend that the designer approach 6 each stream and crossing as a new case and use all the design aids and sediment‐stability methods 7 available. Considering the huge range of site specific differences at steam crossings, all sorts of 8 outcomes are possible; the best analyzed design may fail as readily as any. Of the 50 culverts 9 analyzed in the stream simulation effectiveness study, only one experienced a bed failure and that 10 was designed outside the standards suggested in this document. 11
REFERENCE REACH APPROACH 12 The reference‐reach approach is preferred for sediment sizing in stream simulation culverts. 13 Maximum particle size and appropriate distribution can be determined by examining reaches 14 directly upstream from the culvert or nearby reaches with similar characteristics (e.g., unit 15 discharge, slope, geometry, relative stability) to the design channel. In situations where the 16 hydraulic conditions and natural bedload movement inside the culvert need to be the same as those 17 in the upstream reach, the native sediment gradation can be duplicated in the culvert fill without 18 modification. Where the hydraulic conditions need to be more severe and transport capacity 19 greater, the native sediments will have to be modified by a factor of safety to ensure that the bed 20 can achieve stability. This factor of safety will be a function of the contraction ratio (the width of 21 flow inside the culvert divided by the average width of flow in the channel upstream), the 22 headwater‐to‐culvert‐rise ratio, and the slope ratio. There are no specific relationships yet defined 23 between these ratios, nor is there a safety factor yet defined to be applied in sizing the bed material. 24
The culvert entrance conditions must be analyzed, particularly when a floodplain is present 25 upstream. An indication of conditions that warrant careful attention would be when the 26 contraction ratio is less than 1:1 at the bed‐changing flow. When there is a significant contraction 27 of flow at the culvert entrance or a high headwater‐to‐culvert‐rise ratio, the culvert bed will 28 experience greater scour and the culvert width should, therefore, contain larger sediment sizes. 29 Where this contraction is pronounced, the culvert width should be increased. Likewise, when the 30 culvert bed is at a significantly greater slope than the upstream channel, the bed material must be 31 heavy enough to resist flow acceleration, given the lack of bedload to replenish scoured materials. 32
As a guide, the larger particles in a natural step‐pool channel are roughly similar in size to the depth 33 of flow at its bankfull condition(Grant, Swanson et al. 1990; Montgomery and Buffington 1998). As 34 one would suspect, the size of the largest mobile particle (D84) would be less than the bankfull 35 depth, as shown in Figure 3.8. On the other hand, the largest immobile particles (D100) have 36 various origins (colluvial or alluvial and transported by exceptional events such as infrequent 37 storms or mass wasting) and have an indeterminate relationship to the bankfull depth. The data 38 provided in Figure 3.8 should be used in combination with the other design approaches described 39 here and in the many references used in this chapter. 40

2nd Draft Water Crossing Design Guidelines 11/30/11
41
1
Figure 3.8: particle size as a function of bankfull depth for 24 streams of the cascade or steppool type 2 with slopes of greater than 2% in Washington; blue diamonds are the 84th percentile particles and 3 the green filled circles are the 100th percentile particle. The thick blue line indicates y = x. 4
Naturally occurring steep channel beds can be composed of material that is not placed or formed by 5 normal stream processes. Comparatively large, glacial sediments or landslide debris may be 6 exposed by erosion but not actually transported under the current hydrologic regime. These 7 under‐fit channels may indicate a much larger sediment size than is necessary to maintain gradient. 8 Using such large sediment sizes inside a culvert is conservative, but too big is also a problem. The 9 largest particle should not exceed one quarter of the culvert bed width in order to avoid 10 constrictions within the culvert. Considering the relatively shallow depths in tributary channels, 11 Figure 3.8, and the largest size of transported particles, Table 3.1, it is rare to see boulders larger 12 than 3.5 ft in alluvial channels. Constrictions may reduce migration‐path opportunities and make 13 the culvert more vulnerable to debris blockages. 14
Riprap‐sizing techniques abound in the literature. Most assume normal flow conditions in larger, 15 low‐gradient rivers where shear stress is the predominant mechanism of failure and relative 16 roughness is small. Most stream simulation applications, where we are concerned with bed 17 stability, are found at higher gradients. Chapter 6, Hydraulic Culvert Design, contains a 18 section on designing roughened channels which includes a review of some of the more relevant 19 riprap‐sizing equations for use in stream channels. 20
21
22
y = 0.6x
y = 1.6x
0
1
2
3
4
0 1 2
Particle size, ft
Bankfull depth, ft
D84D100

2nd Draft Water Crossing Design Guidelines 11/30/11
42
UNITDISCHARGE BED DESIGN 1 J. C. Bathurst (Bathurst 1987) studied the initial motion of sediment in high‐gradient channels and 2 developed an equation for the critical unit discharge for the movement of coarse particles. His 3 equation has been rearranged to predict the size of a D84 particle that would be on the threshold of 4 motion for a given critical unit discharge. This equation reflects conditions in coarse, high‐gradient 5 streams with heterogeneous beds. 6
D84= 3. 54S0.747(1.25qc)2/3/g1/3 Equation 3.3 7
Where: 8
D84 = intermediate axis of the 84th percentile particle in the sediment distribution, 9 expressed in feet 10
S = energy slope of the proposed channel, ft/ft. 11
qc = the critical unit discharge (total design discharge divided by the width of the bankfull 12 channel) at which incipient motion of D84 occurs, in cubic feet per second per foot. 13
G = The acceleration due to gravity, feet/sec2. 14
As a starting point for the development of sediment mixes for high‐gradient, constructed stream 15 channels, it is recommended that the above equation be used. There are two categories of design 16 discharge based on slope. First, in channels with a slope greater than four percent or in underfit 17 channels, the 100‐year storm should be used as the design flow. When used in this way, this 18 equation will closely predict the same size of particle as that found in natural channels with similar 19 Q100 and Wch. This is the goal of the Stream Simulation Design Option. 20
Second, in streams having a gradient of less than four percent, the frequency of bed‐changing flows 21 varies widely. In underfit channels, the bed may not change for hundreds of years. On the other 22 hand, in recently incised channels, the bed may be restructured many times each year. If it is 23 unclear how the bed should be designed, J. E. Costa’s paleohydraulic analysis (Costa 1983)can be 24 used to determine the magnitude of the bed‐changing flow for a given particle size. As shown in the 25 next section, velocity, expressed in feet per second, is given by, 26
V = 9.57D0.487 Equation 3.4 27
Where: D = (expressed in feet) the median dimension of the average of the five largest particle sizes 28 found in a natural channel reach whose slope is determined to be controlled by the bed materials. 29
Depth, read from Table 3.1, is also a function of D. From a cross section of the channel, the area in 30 flow is found at depth. Flow area times velocity gives the discharge required to mobilize the bed. 31
The results of the Bathurst equation and Costa’s paleohydraulic analysis generally agree; however, 32 both should be checked. It is worth re‐emphasizing that these are mobile or nearly mobile particles 33 at these flows. If, for some reason, it is advisable to create a bed that is more stable, then particle 34 sizes should be increased. 35

2nd Draft Water Crossing Design Guidelines 11/30/11
43
BED DESIGN BY PALEOHYDRAULIC ANALYSIS 1 Costa (Costa 1983) developed a relationship between maximum particle size and flood depth. This 2 work was done to determine the discharge of flash floods, but it has been useful in the design of 3 stream channels. He used four different approaches to determine the incipient motion of the 4 largest particles and, in combination with empirical relationships, averaged their results. 5
For determining depth, velocity (expressed in feet per second) is given by, 6
V = 9.57(D84)0.487 Equation 3.5 7
Where: D84 = is arrived at by an iterative procedure and expressed in feet. (Equation 3.5 is the same 8 as Equation 3.4 although used in a different manner.) 9
D84 is first assumed, then velocity is calculated by Equation 3.5. Dividing the design flow by this 10 velocity results in the cross‐sectional area in flow. From the proposed channel cross section, the 11 depth for this area is found, and Table 31 shows the associated particle size, which is then 12 compared to the assumed size, and so on. When the resulting particle size agrees with the initial 13 estimate, the particle size is considered suitable for a design value of D84. 14
It should be noted that the velocities from Equation 3.5 are relatively high, reflecting the severity 15 of the flow associated with restructuring high‐gradient streambeds. The Froude number is 16 frequently greater than 1.0, as predicted by (Grant, Swanson et al. 1990)which indicates confidence 17 in this estimate. 18
Table 3.1. Prediction of water depth for a given maximum particle size that has been moved. Data has 19 been converted to English Units; some values are loginterpolated, adapted from (Costa 1983). 20
Particle Slope (ft/ft) Size 0.005 0.01 0.02 0.03 0.04 0.05 0.06 0.07 0.08 0.09 0.1(ft) Depth (ft) 0.2 1.2 0.9 0.6 0.5 0.5 0.4 0.4 0.4 0.4 0.4 0.40.5 3 2.1 1.5 1.3 1.2 1 1 0.9 0.9 0.9 0.81 6 4.1 2.9 2.5 2.2 1.9 1.8 1.8 1.7 1.6 1.51.5 8.8 5.9 4.1 3.6 3.1 2.7 2.6 2.5 2.4 2.2 2.12 11.3 7.4 5.2 4.5 3.9 3.4 3.2 3.1 2.9 2.8 2.72.5 13.6 8.9 6.2 5.4 4.7 4.1 3.9 3.7 3.5 3.3 3.23 15.6 10.2 7.1 6.1 5.3 4.6 4.4 4.2 4 3.8 3.63.5 17.6 11.4 7.9 6.9 6 5.2 4.9 4.7 4.5 4.3 4.14 19.5 12.6 8.7 7.5 6.6 5.7 5.4 5.2 4.9 4.7 4.54.5 21.3 13.7 9.4 8.2 7.2 6.2 5.9 5.7 5.4 5.1 4.98.1 36.4 23.1 15.6 13.5 11.7 10.1 9.6 9.1 8.6 8.2 7.810.5 45.6 28.9 19.4 16.7 14.4 12.5 11.8 11.2 10.6 10 9.5
21

2nd Draft Water Crossing Design Guidelines 11/30/11
44
Keep in mind that Costa determined the size of the rock that had been moved by the flow at that 1 depth and slope. At higher slopes, the Costa equation consistently indicates smaller particle sizes 2 than the Bathurst equation, all other conditions being equal. 3
At these slopes, there is a much wider range of variables, and their influence on the threshold of 4 movement is indeterminate. 5
BED MATERIAL GRADATION AND SPECIFICATION 6 Knowing the size of the largest material, Dmax, or any other characteristic size, the rest of the bed 7 mixture is to be well‐graded to minimize permeability. In the case of a bottomless culvert, a well‐8 graded bed may already be present. If the bed material must be imported, a suggested method is to 9 use a synthetic streambed mix. Naturally sorted streambed sediments are almost always 10 distributed in the “S” curve, as shown in Figure 3.9. 11
12
Figure 3.9: Cumulative distribution of streambed sediment sizes. Solid blue is a typical natural 13 distribution with a maximum size of 1 foot. Dashed red line is a FullerThompson maximum density 14 curve with the same size D84 particle as the natural distribution. 15
Figure 3.8 represents a smooth curve between some basic relationships found in natural 16 distributions, summarized in the following relationships as a function of D84: 17
D84/D100 = 0.4 Equation 3.6 18
D84/D50 = 2.5 Equation 3.7 19
D84/D16 = 8.0 Equation 3.8 20
In order to create a non‐porous bed there must be a minimum of 5% to a maximum of 10% fines in 21 the mix. 22
0
10
20
30
40
50
60
70
80
90
100
0.01 0.1 1
Per
cent
Fin
er
Grain Size (ft)

2nd Draft Water Crossing Design Guidelines 11/30/11
45
For comparison, a typical ratio for riprap gradations is D84/ D16 < 2.0. This uniform gradation 1 creates a very narrow size distribution that is too porous for use in a stream simulation culvert. 2 This means that, even though the size of materials used in steeper culverts may be similar to the 3 size of riprap, the grading must not be the same as is commonly used for riprap. 4
These ratios in Equations 3.68 are averaged from a wide variety of streambeds in different 5 environments (Judd and Peterson 1969; Limerinos 1970; Jarrett 1984; Mussetter 1989; 6 Ergenzinger 1992). Slopes ranged from about 0.3 to 22 percent. Natural distributions have a very 7 wide range of sizes for various reasons. What is significant for the design of stream simulation 8 culverts is that the largest 15 to 20 percent plays a major role in the stability of higher gradient 9 channels(Costa 1983; Chin 1998). This fraction must be present, and the largest clast is significantly 10 larger than the median size. The lower portion of the gradation fills the interstices and ensures a 11 nonporous bed. 12
The gradation given by these ratios should be considered a starting point for the mixture. It can 13 then be refined as the designer considers available materials. The result is the raw material for the 14 streambed, so it should reflect the composition of a natural channel. 15
Situations arise where the application of one of the stability methods and the relative particle‐size 16 ratios given above lead to unrealistic sediment sizes. On streams less than about 20 feet wide, 17 where stream simulation is applied, the largest particles rarely exceed 3 or 4 feet, as measured 18 along the intermediate axis. If, by applying the suggested ratios, very large boulders are required, 19 then adjustments may be required to create a practical prescription. For instance, if stability 20 analysis indicates that D84 should be 1.8 feet, then, by the ratio above, D100 will be 4.5 feet. This is a 21 very large boulder and not likely to be found in a tributary stream, except as a glacial remnant or a 22 deposit of a landslide or debris flow. Clearly, if this channel is 14 feet wide with an 11‐percent 23 slope, then large material is required. But it may not be clear how large. In case of uncertainty, one 24 should look at the adjacent channel for guidance. The presence of large, stable, moss‐covered 25 boulders should indicate that the size of such boulders is a reasonable dimension for D100. 26
Once again, it should be emphasized that it is the largest particles that create stability in a natural 27 channel, and they need to be of adequate size and quantity to fulfill this role. 28
It is not appropriate to compare sediment size estimates with channel reaches that are controlled 29 by large wood, deeply incised, or not in equilibrium. 30
In the interest of creating designs and specifications that are practical and economical, gradations 31 should not be too restrictive. As long as a broad range of sizes is represented, a suitable bed‐32 material mix should result. 33
There are alternate methods to achieve a well‐graded mix. In the USFS stream simulation guide 34 (Forest Service Stream‐Simulation Working Group 2008) the Fuller‐Thompson method (Fuller and 35 Thompson 1907) is recommended, Equation 3.9. This results in a somewhat narrower range of 36 sediment sizes but is acceptable for this sort of work (shown in comparison with the natural 37 distribution in Figure 3.9). The equation for percent finer using the Fuller‐Thompson method is, 38
2nd Draft Water Crossing Design Guidelines 11/30/11
46
P/100 = (d/Dmax)n Equation 3.9 1
where d is any particle size of interest, P is the percentage of the mixture smaller than d, Dmax is 2 the largest size material in the mix, and n is a parameter that determines how fine or coarse the 3 resulting mix will be. An n value of 0.5 produces a maximum density mix when particles are round. 4
SEDIMENTGRADATION EXAMPLE 5 The following example should help clarify the process of material gradation for stream simulation. 6 Let’s say that, using one of the methods described above, D84 has been determined to be 0.5 feet. 7 Using the relations above, D16 = 0.06 ft, D50 = 0.2 ft, and D100 (the largest particle present) = 1.25 ft. 8 What this means is that 16 percent of the material is less than three quarters of an inch, including 9 roughly equal proportions of small gravel, sand and fines. Sixteen percent is between 0.5 to 1.25 10 feet, which, when viewed from above, will compose 1/6th of the channel surface. The remaining 68 11 percent is basically well‐graded gravel and cobble. If a gravel pit is making up this mixture, then 12 piles of material need to be assembled in proportions that approximate the desired gradation. One 13 approach is to use parts or “scoops” of a given component. For the example mixture here, a very 14 simple recipe could be: four scoops of six‐inch‐minus pit run with fines, plus one scoop of eight‐ to 15 15‐inch rock. 16
Problems have arisen where the engineer does not examine the material at the pit. A specification 17 such as “pit run” can describe materials with very different compositions, which, until someone 18 actually looks at the material, may or may not meet the intent of the designer. The less a project is 19 overseen by a qualified engineer, the more detailed the culvert fill‐material specification must be. 20
Unless the pit supplying the materials can specifically state the composition of a given pile based on 21 a grading test, it is often difficult to determine its composition and, therefore, its role in forming a 22 given gradation. A simple method of doing so is to measure both the largest and smallest particles 23 present, and gauge by eye the distribution of sizes in between. This assessment of distribution is 24 just to determine whether the pile is well‐graded or not. For instance, a pile composed solely of 25 coarse gravel and sand is gap graded, missing the critical, intermediate‐size classes that need to be 26 present in streambed material. 27
The result of this “high/low” size assessment is a bracket that can be fit into the desired 28 distribution. A far more complicated, time‐consuming and probably unnecessary method is to 29 sample the pile and count and measure all the particles in the sample or do a sieve analysis 30 according to a standard method. For the experienced designer, the first method is probably 31 adequate for specifying materials for stream simulation culverts. 32
By far the best method to specify streambed materials is to use the WSDOT Streambed material 33 specifications reproduced at the end of this chapter. 34 35 Rounded material is typically used in stream simulation culverts. If one portion of the gradation is 36 not available in rounded material, fractured rock is acceptable. In many areas gravel and cobble are 37 available, but boulder‐sized rock must be reduced from bedrock. Such a substitution is reasonable. 38 On the other hand, bed material composed exclusively of fractured rock cannot be considered for 39 stream simulation; its jagged edges will interlock, making it nearly impossible for it to settle 40

2nd Draft Water Crossing Design Guidelines 11/30/11
47
properly for a non‐porous matrix. A bed of fractured rock will not respond smoothly to hydraulic 1 forces to form expected bed shapes or respond to changing conditions. The exception to this is in 2 cases where the native bed material is angular, such as basalt bedrock headwater streams. 3
BEDMATERIAL PLACEMENT 4 Culvert fill material is loaded into the pipe with a small skid‐steer “Bobcat® style” front‐end loader, 5 a small bulldozer, a gravel conveyor belt or a rail‐mounted cart, or it is pushed into the culvert with 6 a log manipulated by an excavator. This latter method, “muzzle‐loading,” is effective for small 7 diameter and shorter structures. The 18‐25 foot log is held by an excavator with a bucket thumb 8 and is used to push piles of bed material into the culvert from both ends. Some hand labor is 9 required to finish the appropriate contours. Four‐sided concrete culverts composed of a 3‐sided 10 box with a bottom plate can be inverted so that the U faces up, the streambed can be formed inside 11 and the fourth side placed on top and backfilled. These culvert‐filling alternatives should be 12 evaluated when choosing the culvert type since the level of difficulty and cost can change the 13 cost/benefit computation. 14
In order to achieve stream simulation, fill materials must be arranged to mimic channel conditions. 15 Avoid grid patterns or flat, paved beds made of the largest rocks. A low‐flow channel and a high‐16 flow bench on either side should be created in the culvert, Figure 3.7. A step‐pool profile 17 generally occurs in the 3 to10 percent slope range (Montgomery and Buffington 1998). The spacing 18 of steps is somewhat variable, but one to four channel widths with a maximum 0.8‐foot drop 19 between successive crests is recommended (Heiner 1991). 20
This type of channel ensures that stream energy is dissipated by large scale roughness and pool 21 turbulence, creating better fish passage and more stable channels. Segregating a portion of the 22 coarsest fraction into bands can encourage this pattern. Do not exceed 0.8 feet of drop between 23 successive steps. The steepest channels (greater than 10‐percent grade) are cascades with large 24 roughness elements protruding into the channel, although cascades have been used in lower slope 25 culverts with equal effectiveness. 26
The same material comprises the whole depth of fill. Stratification, such as placing spawning gravel 27 over a boulder fill in a steep channel, is not appropriate. Gradations such as “streambed gravel” and 28 “spawning gravel” in themselves are not recommended culvert fills. Such material is washed and 29 highly permeable. These gradations could, however, be a component in the specification of a well‐30 graded mix when combined with sand and fines. 31
Typically, the bed inside the stream simulation culvert is filled to 30 to 50 percent of the culvert 32 rise. The reasons for so much material are: 33
• To raise the channel to the widest part of the pipe (for round or pipe arches); 34 • To create a deep, monolithic bed structure; and 35 • To allow for significant vertical bed adjustments without encountering the culvert bottom. 36
The following pages show a variety of stream simulation culvert beds for reference. 37
38

2nd Draft Water Crossing Design Guidelines 11/30/11
48
Figure 3.10 1
2
Site ID 3 Stream name Coxit
Date constructed 2006 Culvert span, ft 24 Bed slope, ft/ft 0.10
D50, ft 0.33
D84, ft 0.75
D100, ft 3.6 3
This is a relatively new culvert on an eastern Washington headwater stream. The figure shows a 4 cross section of a cascade type channel in a high slope culvert. The bed material is very coarse and 5 somewhat angular, although it is in keeping with the prevailing channel conditions. During low flow 6 conditions, as shown here, water remains on top of the coarse bed, which must be dense and 7 nonporous. This is often a concern in creeks with very low summer flow. Proper gradation is 8 necessary to prevent subsurface flow and avoid the fish passage barrier than can result. 9

2nd Draft Water Crossing Design Guidelines 11/30/11
49
Figure 3.11 1
2
Site ID 5 Stream name Chopaka Date constructed 2006 Culvert span, ft 12 Bed slope, ft/ft 0.09
D50, ft 0.13
D84, ft 0.52
D100, ft 2 3
This 2 year old culvert has a good, stream‐like, cross sectional shape. This shape was clearly built at 4 the time of construction. The bed is a steep cascade that has remained stable since construction. 5 The bed material is well graded and this lower summer flow remains on the surface. 6
7
8

2nd Draft Water Crossing Design Guidelines 11/30/11
50
Figure 3.12 1
2
Site ID 6 Stream name xtrib Woods Ck
Date constructed 2004 Culvert span, ft 14 Bed slope, ft/ft 0.05
D50, ft 0.38
D84, ft 0.79
D100, ft 2.1 3
Flow hugs the right wall (as seen in the photograph) for most of this 4 year old culvert’s length. It 4 spreads and crosses near the outlet. This is very common in culverts, where there are more defined 5 bank or banks upstream and a more depositional, flatter, condition at the outlet. While not ideal, 6 channels oriented along one culvert wall are acceptable, and in some ways preferable to uniformly 7 flat cross sections. Bed materials are stream‐like in character, rounded and well‐graded. 8
9

2nd Draft Water Crossing Design Guidelines 11/30/11
51
Figure 3.13 1
2
Site ID 12 Stream name Queets
Date constructed 2006 Culvert span, ft 9 Bed slope, ft/ft 0.05
D50, ft 0.21
D84, ft 0.83
D100, ft 1.7 In this culvert the bed is composed of a combination of rounded, naturally‐occurring materials 3 in the smaller size classes, and angular quarry rock in the largest size classes. In sufficient 4 quantity, the rounded materials allow the bed to settle and react to changing conditions in a 5 more natural way. The cross section is stream‐like. 6
7
8

2nd Draft Water Crossing Design Guidelines 11/30/11
52
Figure 3.14 1
2
Site ID 15 Stream name xtrib Nolan
Date constructed 2004 Culvert span, ft 12 Bed slope, ft/ft 0.05
D50, ft 0.26
D84, ft 0.67
D100, ft 2 The width of the culvert bed exactly conforms to Equation 3.2 and it is countersunk 45% of its 3 rise at the inlet, shown here. The bed material size and distribution closely conforms to that 4 found in the adjacent channel. Culvert cross section is flatter than the previous figures. There is 5 a defined low flow channel, but at higher flows it is shallow and wide. 6
7

2nd Draft Water Crossing Design Guidelines 11/30/11
53
Figure 3.15 1
2
Site ID 13 Stream name Braden
Date constructed 2005 Culvert span, ft 12 Bed slope, ft/ft 0.02
D50, ft 0.23
D84, ft 0.55
D100, ft 1.4 3
This culvert is very similar to Figure 3.14. They are both 12 foot culverts and have similar bed 4 material to the stream channel. The bed is flat and oriented strongly to the left culvert wall. 5 More careful attention to the placement of materials at the time of construction would have 6 prevented this result. 7
8
9
11

2nd Draft Water Crossing Design Guidelines 11/30/11
54
Figure 3.16 1
2
Site ID 31 Stream name Taylor Ck u/s
Date constructed 1999 Culvert span, ft 14 Bed slope, ft/ft 0.02
D50, ft 0.15
D84, ft 0.33
D100, ft 2.2 3
This is also an older culvert (9 years old in this photograph) and the bed has developed into this 4 shape over that time. It runs along one wall of the culvert due to a skew at the inlet. The right 5 bank acts more as a point bar and remains depositional. While flow along the side of the culvert 6 is not desirable, it does provide a variety of hydraulic conditions across the width, ranging from 7 high velocity and sediment transport to shallow, low velocity and turbulence along the right 8 bank. This creek has an urbanized watershed and flashy flows. 9

2nd Draft Water Crossing Design Guidelines 11/30/11
55
Figure 3.17 1
2
Site ID 33 Stream name Xtrib Puget Sound
Date constructed 1998 Culvert span, ft 12.3 Bed slope, ft/ft 0.03
D50, ft 0.14
D84, ft 0.56
D100, ft 1.7 3
This culvert is similar to Figure 3.17, although in a rural watershed. This also an older culvert (10 4 years old in this photograph) with a well developed bed. The low flow channel meanders through 5 the culvert probably due to changes in the density of coarser sediment, see inset sketch from the 6 field notes. This is either because flow has moved the larger particles into three distinct clumps or 7 those clumps were placed during construction. This culvert has survived many high flow events 8 and reflects prevailing channel conditions. 9

2nd Draft Water Crossing Design Guidelines 11/30/11
56
Figure 3.18 1
2
Site ID 41 Stream name Dead Man Flat
Date constructed 1998 Culvert span, ft 14 Bed slope, ft/ft 0.06
D50, ft 0.27
D84, ft 0.67
D100, ft 2.9 3
This is another older culvert but the cross section has remained flat because it was constructed that 4 way. The large sediment size and the way it was embedded have formed a very erosion‐resistant 5 bed. Fish passage is good and it is stable, but it is not very stream‐like in character. 6
7
8

2nd Draft Water Crossing Design Guidelines 11/30/11
57
Figure 3.19 1
2
Site ID 47 Stream name SF Dogfish
Date constructed 2007 Culvert span, ft 10 Bed slope, ft/ft 0.03
D50, ft 0.13
D84, ft 0.38
D100, ft 1.9 3
This is a recently constructed (1 year old) culvert. The bed has scoured down to expose the largest 4 fraction. The bed has not had the time to organize into a more developed structure. Generally the 5 cross section is flat and banks were not formed at the time of construction. 6
7
8

2nd Draft Water Crossing Design Guidelines 11/30/11
58
Figure 3.20 1
2
Site ID 48 Stream name Parker Ck
Date constructed 1995 Culvert span, ft 24 Bed slope, ft/ft 0.04
D50, ft 0.27
D84, ft 0.73
D100, ft 3.5 3
This is the oldest culvert in this group (13 years old). It has been through many floods and vast 4 quantity of bedload has passed through (the channel upstream has incised several feet). In terms of 5 complexity and channel development, this is as much as can be expected in a stream simulation 6 culvert. The bed is still somewhat flat, a condition that was undoubtedly determined during 7 construction. 8
9

2nd Draft Water Crossing Design Guidelines 11/30/11
59
WSDOT STREAMBED MATERIAL SPECIFICATIONS 1 In cooperation with WDFW, WSDOT has developed a set of specifications for aggregate materials to 2 be used in stream and culvert projects. These specifications meet the recommendations in this 3 chapter and are printed here for convenient reference. 9‐03.11 streambed aggregates are rounded 4 materials. This requirement is for this specification only and is not required for all stream 5 simulation culverts. Rounded rock does not occur in all streams and is not available in all regions of 6 the state in every size class. 7 These specifications are used in combination to achieve a given size distribution. Low gradient 8 channels of the pool‐riffle type are generally composed of materials in the gravel size range. Such a 9 channel may require a 2.5 inch minus well‐graded gravel, described by 9‐03.11(1) streambed 10 sediment. This spec contains all the size classes in the proper proportion to create a dense mix and 11 can be used alone. If larger sediment is required, the streambed sediment spec must be combined 12 with cobbles or boulders in proportions that result in a dense mix, similar to either the synthetic 13 ratios (Equations 3.68) or the Fuller‐Thompson Equation 3.10. One rule‐of‐thumb is that the 14 void space of granular materials is about 30‐40% of its volume. This means that you need to add 30 15 to 40% streambed sediment for every unit volume of cobbles. Similarly, the void space in a given 16 volume of boulders is about one third and cobbles and streambed sediment must be added to fill 17 those voids. 18 19
9-03.11 Streambed Aggregates 20 Streambed Aggregates shall be naturally occurring water rounded aggregates. 21 Aggregates from quarries, ledge rock, and talus slopes are not acceptable for these applications. 22 Streambed aggregates shall meet the following test requirements for quality: 23
Aggregate Property Test Method Requirement
Degradation Factor WSDOT T 113 15 min.
Los Angeles Wear,
500 Rev. AASHTO T 96 50% max.
Bulk Specific Gravity AASHTO T 85 2.55 min.
24
25
26
27
28
29
30
31

2nd Draft Water Crossing Design Guidelines 11/30/11
60
1
9-03.11(1) Streambed Sediment 2
Streambed sediment shall meet the following requirements for grading when placed in 3 hauling vehicles for delivery to the project or during manufacture and placement into temporary 4 stockpile. The exact point of acceptance will be determined by the Engineer. 5
Sieve Size Percent Passing
2 1/2" square 100
2" square 65 – 100
1" square 50 – 85
U.S. No. 4 26 – 44
U.S. No. 40 16 max.
U.S. No. 200 5.0 – 9.0
7
All percentages are by mass. 8
The portion of sediment retained on U.S. No. 4 sieve shall not contain more than 0.2 9 percent wood waste. 10
11
12
13
14
15
16
17
18
19
20
21

2nd Draft Water Crossing Design Guidelines 11/30/11
61
1
9-03.11(2) Streambed Cobbles 2
Streambed cobbles shall be clean, naturally occurring water rounded gravel material. 3 Streambed cobbles shall have a well graded distribution of cobble sizes and conform to one 4 or more of the following gradings as shown in the Plans: 5
6 Percent Passing
Approximate Size Note 1
4″ Cobbles
6″ Cobbles
8″ Cobbles
10″ Cobbles
12″ Cobbles
12″ 100 10″ 100 70-90
8″ 100 70-90
6″ 100 70-90
5″ 70-90 30-60.
4″ 100 30-60.
3″
70-90 30-60.
2″ 30-60.
1½″ 20-50
¾″ 10 max. 10 max. 10 max. 10 max. 10 max. 7
The grading of the cobbles shall be determined by the Engineer by visual inspection 8 of the load before it is dumped into place, or, if so ordered by the Engineer, by dumping 9 individual loads on a flat surface and sorting and measuring the individual rocks contained 10 in the load. 11
12
13
14
15
16
17
18

2nd Draft Water Crossing Design Guidelines 11/30/11
62
1
9-03.11(3) Habitat Boulders 2
Habitat boulders shall be hard, sound and durable material, free from seams, cracks, and 3 other defects tending to destroy its resistance to weather. Habitat boulder sizes are approximately 4 as follows, see contract provision for sizes specified: 5
Rock Size Approximate Size Note 1
One Man 12" - 18"
Two Man 18" - 28"
Three Man 28" - 36"
Four Man 36" - 48"
Five Man 48" - 54"
Six Man 54" - 60"
Note 1: Approximate size can be determined by taking the average dimension of the three axes of 6 the rock; length, width, and thickness by use of the following calculation: 7
Equation 3.11 8
By using the average dimension calculated in Equation 3.11, exceptionally thin or narrow boulders 9 meet the specification but would weigh less, not perform in the stream channel in the same fashion 10 as a more compact shape, and would be difficult to place. For instance, 36x36x12 meets the 11 average dimension spec (28”) for the largest 2‐man rock, but it is a pancake with approximately 12 88% of the volume of a spheroid shape. 13
An alternative method for specifying habitat boulders would be to state the boulder size by the b 14 axis (the intermediate dimension) as is commonly done when doing a pebble count or what is 15 determined by sieve analysis. In addition, specify a minimum dimension which would exclude thin 16 or narrow boulders (pancakes or pencils). An example would be: Three Man rock with an 17 intermediate dimension of 28‐36” with no dimension less than 20.” 18
19
BEDRETENTION SILLS 20 Bed‐retention sills are steel or concrete walls placed in the bottom of stream simulation culverts 21 with the intended purpose of holding the bed material inside the pipe. In the early days of stream 22 simulation culvert design, sills were thought to be necessary to interrupt the shear plane created 23 between the bottom of the culvert and the fill material. Experience has shown that bed failure 24 occurs not as a result of the fill “sliding” out of the culvert, but by the erosion of bed materials 25
Size eApproximat3
Thickness Width Length =
++

2nd Draft Water Crossing Design Guidelines 11/30/11
63
inappropriately sized for the slope and design discharge of the culvert. Sills are not a desirable 1 option since they provide a false security and, should the bed wash out of the culvert, create a 2 “baffled” culvert filled with coarse sediment that would pose as much of a barrier as a bare culvert. 3 In addition, the resulting structure would be difficult to rebuild. We strongly discourage the use 4 of sills and encourage the correct sizing of culvert fill materials using the methods outlined 5 in this chapter and in other reliable engineering texts. 6
7

2nd Draft Water Crossing Design Guidelines 11/30/11
64
CHAPTER 4: BRIDGE DESIGN GUIDELINES FOR HABITAT 1
PROTECTION 2 This chapter was developed separately and at a different time from the rest of the WATER CROSSING 3 DESIGN GUIDELINES. The Aquatic Habitat Guidelines would like to thank the many Washington State 4 Departments of Fish and Wildlife, Ecology, Natural Resources, and Transportation staff, County 5 Public Works staff, the timber industry, and others, for their honest and often critical feedback. 6
The Aquatic Habitat Guidelines would like to express gratitude to Mr. Jeff Johnson, Watershed 7 Science and Engineering (then with Northwest Hydraulic Consultants, NHC) and Mr. Peter Brooks 8 of NHC for volunteering time to help edit this chapter and for recommending modifications based 9 upon their years of conducting hydraulic investigations for new and replacement bridge crossings 10 within the state of Washington. 11
SUMMARY 12 • Reach analysis is recommended for design and habitat protection 13
o Reach analysis; describes the geomorphic setting for bridge design 14 o Can be phased to suit design and funding process 15 o Is scalable with 3 levels of analysis to suit the complexity and size of project 16
• Selection of bridge length is a stepwise process 17
o Existing bridges with a good performance rating can be replaced in kind. 18
o For confined channels, the distance between bridge abutments should be 1.2 x BFW. 19
o For unconfined channels with floodplain and overbank flow, the velocity in the main 20 channel under the bridge should be less than 1.1 times the prevailing velocity in the 21 main channel of the unencumbered natural river. 22
o Bridges should account for lateral channel movement (meandering) that will occur 23 in their design life. 24
o The bridge design must comply with legislation governing development within 25 floodplains. 26
o Existing flood control levees often determine the lateral limits of the 100‐year 27 floodplain and therefore bridges may only need to span between levees. But, levees 28 are sometimes set back to restore river processes. 29
o Other forms of non‐project infrastructure that may affect location or design of the 30 bridge design include adjacent roads and railroads, road intersections, driveways, 31 houses and businesses, and utility lines. 32
o Intermediate piers within OHW may be acceptable to increase overall span and 33 reduce bridge girder depth. 34
o Tidally influenced bridge crossings are covered in Appendix D. 35

2nd Draft Water Crossing Design Guidelines 11/30/11
65
• “Backwater is the increase in water surface elevation relative to the elevation occurring 1 under natural1 channel and floodplain conditions. It is induced by a bridge or other 2 structure that obstructs the free flow of water in a channel." 3
• General guidance for bridge clearance is that the bottom of the superstructure should be 3 4 feet above the 100 year flood water surface. 5
OBJECTIVES AND SCOPE 6 The purpose of this document is to make bridge designers aware of reach assessment methods and 7 bridge design alternatives that recognize fluvial processes important for the preservation of fish 8 life. Bridges pose a unique engineering and environmental challenge beyond those presented by 9 most transportation projects. Each project will have multiple objectives and constraints; the key is 10 to strike an appropriate balance between them. This document presents an approach that, if 11 followed, will minimize impacts to fish habitat and lead to an enduring bridge design. 12
These guidelines apply both to new bridges at virgin sites and to the replacement of existing 13 crossings. They apply specifically to bridge projects, and are intended as a supplement to the 14 general Aquatic Habitat Guidelines. They do not replace existing regulations addressing water 15 crossings (WAC 220‐110‐070 and 220‐110‐080). These guidelines were written for the benefit of 16 the bridge owner and designer, they are not to be required as regulation. For the purpose of these 17 guidelines, a bridge is any crossing that has separate structural elements for the superstructure, 18 piers and abutments, and foundations. In current design practice, the bridge normally has sloping 19 "open‐face" abutments that preserve a natural bank profile at high flows, but older bridges may 20 have solid abutments. Some agencies treat certain 3‐sided and bottomless structures as bridges, but 21 for purposes of this document they are considered to be culverts. 22
GENERAL CONSIDERATIONS 23 Appropriately designed bridges should protect natural geomorphic and fluvial processes to 24 preserve the environmental productive capacity of the stream. Specific goals of the design and 25 construction process are to: 26
1. Prevent excessive backwater rise during floods that might lead to scour of the stream bed 27 within the waterway or deposition of sediment upstream which may increase lateral 28 shifting of the river channel and therefore require future bank armoring. 29
2. Prevent or limit local scour and coarsening of the stream substrate. 30
3. Allow free passage of woody debris expected to be encountered in order to reduce 31 maintenance and distribute wood throughout the river. 32
4. To the extent compatible with safety of the bridge, its approach roads, and adjacent private 33 property, allow natural evolution of the channel planform and longitudinal profile. 34
1 “Natural” includes manmade features in floodplain that are out of control of the owner and unlikely to change.

2nd Draft Water Crossing Design Guidelines 11/30/11
66
Opportunity for reasonable and expected modifications to existing infrastructure, such as 1 levee setbacks, should not be precluded. 2
5. Allow continued down‐valley flow of water on the floodplain, thereby reducing flood 3 height, providing flood refugia, and permitting side channel development and other 4 riparian processes. 5
6. Reduce the risk from catastrophic floods: bridge failure affects habitat both when it occurs 6 and in the various construction activities associated with replacement. 7
It is not expected that all items in this list can be applied to every bridge crossing. In many cases 8 existing site constraints have reduced the natural level of productivity, as a result of man‐made 9 features not associated with the bridge project and not under the control of the owner of the 10 crossing. However, acquisition of additional right‐of‐way is sometimes appropriate for long term 11 infrastructure and resource protection. 12
Considering the site specific variability of bridges and their effects, there will never be 100% 13 conclusive, causal connection between a given bridge design and its effects on fish and the 14 environment. In addition, we cannot expect the full recovery of fish habitat in a given reach 15 through bridge design alone. These guidelines are presented as a method to avoid or minimize 16 bridge impacts in the design process. 17
The stream channel created or restored near and beneath the bridge should have a gradient, cross‐18 section, and general configuration similar to the existing natural channel upstream and 19 downstream of the crossing. Floodplains adjacent to the channel also provide critical habitat for 20 fish, therefore, impacts must be minimized. Spanning the entire width of the channel plus the 21 floodplain is typically impractical, however, preserving natural function of the floodplain is 22 important, therefore, the question of floodplain areas blocked or impeded by road approach 23 embankments should be thoroughly considered. This is discussed in detail in Section 4. 24
In the case of bridge replacements, the existing approach embankments, piers, abutments and 25 foundations may be considered as components of the new crossing. However, if these components 26 have had adverse effects on the natural productive capacity of the watercourse, they should be 27 either removed or modified to mitigate their effects. Nevertheless, at some sites there will be 28 features that must be retained where there is no feasible alternative. At these sites, mitigation 29 measures may be required to compensate for impacts. 30
Although culverts can sometimes offer a high level of stream connectivity or continuity similar to 31 that provided by a bridge, a bridge is generally preferred where the length exceeds 20 feet or the 32 bankfull stream width exceeds 15 ft. Sometimes bridges are appropriate for even smaller streams 33 if there is frequent transport of woody debris, anchor ice, or ice jams. For lengths exceeding 20 feet, 34 the burden of proof is on the designer to show that a culvert can maintain stream processes, protect 35 habitat and provide adequate fish passage. Also, in some cases road geometry may influence the 36 decision to prefer a culvert, for reasons of safety or traffic flow. 37
38

2nd Draft Water Crossing Design Guidelines 11/30/11
67
GEOMORPHIC SETTING AND REACH ANALYSIS 1
GENERAL 2 Current guidelines on bridge hydraulics recommend that a design study should start with an 3 analysis of river conditions in the vicinity of the site (Hamill 1999; Lagasse, Schall et al. 2001; 4 Richardson, Simons et al. 2001; Lagasse, Spitz et al. 2004; Transportation Association of Canada 5 2004). The environmental requirements for fish passage and habitat protection stated herein can 6 be adequately achieved only if the geomorphic context is understood. A detailed description of 7 relevant design considerations is given in FHWA’s RIVER ENGINEERING FOR HIGHWAY ENCROACHMENTS, 8 HIGHWAYS IN THE RIVER ENVIRONMENT, Chapter 9 (Richardson, Simons et al. 2001). In many cases the 9 method outlined therein can be substituted for the one proposed below, provided that the analysis 10 maintains a focus on environmental issues. 11
An investigation into the geomorphic setting of the bridge is referred to in this document as a 12 “reach analysis” – a term currently understood in various ways, and applied to many types of 13 projects. This section aims to outline the scope and nature of the reach analysis recommended to 14 protect fish and wildlife resources. Because reach analysis is an evolving field, different approaches 15 are acceptable providing they demonstrate the potential impacts of the proposed project at an 16 appropriate scale. Early communication between agencies, designers and owners is critical in the 17 development of the reach analysis. In this way everyone knows what assessment is needed for 18 environmental bridge design and misunderstandings are minimized. 19
Existing Aquatic Habitat Guidelines for project planning and implementation indicate that 20 compensatory mitigation should offset immediate and future impacts on fish life and habitat (WAC 21 220‐110‐020(28)) (Cramer, Bates et al. 2002; Saldi‐Caromile, Bates et al. 2003). If done correctly, a 22 reach analysis should lead to a project that minimizes impacts to habitat and thereby reduces the 23 need for off‐site compensatory mitigation. 24
The process of reach analysis is adjustable to the size and complexity of the project. For example, a 25 private forest landowner proposing to span a small entrenched stream that does not have an active 26 floodplain may choose simply to use a professional expert to complete a qualitative analysis to 27 describe the geomorphic setting and habitat impacts or lack thereof. On the other hand, a major 28 crossing of large lowland river will likely require a sophisticated reach analysis, which may 29 necessitate an iterative process between the bridge designer and the river specialist to develop an 30 acceptable design. A reach analysis can be phased to suit the applicant’s design process. For 31 example, when first trying to site a crossing maybe a simple review of aerial photographs and a site 32 visit is all that is needed to identify the most favorable crossing location. A scope can then be 33 developed for a reach analysis that is suitable for that particular site. Several levels of reach 34 analysis are discussed below. 35
Adding a geomorphic reach analysis to the bridge design process may increase upfront study costs; 36 however, it is a necessary step that has generally been overlooked. In the long run, the benefits will 37 outweigh the cost. Both the crossing owner and the native habitat will benefit by avoiding 38 environmental deficiencies and infrastructure failures that may threaten habitat productivity or 39 cost large sums to repair or maintain. By elevating environmental conservation to a primary 40

2nd Draft Water Crossing Design Guidelines 11/30/11
68
objective in the bridge design process, the complexity of the crossing may increase which may add 1 to construction costs. It is understood that bridge owners have limited budgets. Therefore, all 2 stakeholders should work together to agree to a design that strikes a reasonable balance between 3 often competing objectives. Nevertheless, designers must recognize the environmental 4 conservation now is a critical element of design. 5
The reach analysis procedure should also include a historical perspective: the previous bridges, 6 levees, development, logging, agriculture and other activities that have occurred at the site make up 7 what it is, and how it fits into the environment and the final design. Over time managers have made 8 decisions on how to deal with a crossing; those decisions have repercussions for the environment 9 and the new bridge. 10
LEVELS OF REACH ANALYSIS 11 FHWA suggests a three‐tiered approach to reach assessment: qualitative analysis, advanced 12 quantitative analysis, and mathematical studies (Lagasse, Schall et al. 2001; Richardson, Simons et 13 al. 2001). An alternative approach is suggested below in Table 1 wherein each level of analysis is 14 based on a few readily measured attributes of the project. Each column describes an attribute 15 independent of the others. Final determination of the required level of analysis for a particular 16 project should be based on joint consideration of all categories. 17
18
Table 1. Suggested levels of reach analysis for different attributes 19
Level Analysis Type Bankfull Width, ft
Floodplain Utilization
Ratio Stream Type *Bridge
Performance Meander Migration
1 Limited local assessment <15 <3 Transport Excellent Stable
2 Qualitative reach assess. <15 <3 Transport Good Stable
3 Quantitative reach assess. >15 >3 Response Good to Poor Migrating
* This column applies only to bridge replacement projects and does not apply to culverts. 20
The column headings are explained as follows: 21
Bankfull Width refers to the natural unaltered top width of the stream channel. 22 Techniques to determine the top width are presented in Appendix C. A width of 15 feet has 23 been selected to distinguish the different analysis types because smaller channels often 24 meander less as they have lower shear stress, stream power, carry smaller debris loads and 25 therefore may be simpler to evaluate (Richardson, Simons et al. 2001). 26
Floodplain Utilization Ratio (FUR) refers to the width of the floodplain relative to the 27 main channel. This can quantified by the floodplain utilization ratio, which is defined here 28 as the flood‐prone (FPW) width divided by the bankfull width (BFW) . (The Floodplain 29

2nd Draft Water Crossing Design Guidelines 11/30/11
69
Utilization Ratio is referred to as the “entrenchment ratio”, ER, in several publications). As a 1 rule‐of‐thumb, flood‐prone width is defined here as the water surface width at a height 2 above the bed of twice the bankfull depth(Rosgen 1996). However, if a hydraulic model has 3 been developed for the project, the flood‐prone width should be obtained from the model 4 output for a 50‐year to 100‐year flood. Figure 1 below illustrates two different floodplain 5 utilization ratios. High floodplain utilization ratios are associated with streams that tend to 6 be shallow and have alluvial valleys that allow streams to meander. Streams with low 7 floodplain utilization ratios are associated with relatively narrow floodplains and channels 8 that are incised and are slow to migrate (Rosgen 1994). A floodplain utilization ratio of 1 9 indicates that the stream channel is deeply incised such that major floods are typically 10 contained within the channel. 11
12 Figure 4.1 Flood‐prone width and Bank‐full widths for a broad floodplain and a narrow floodplain. 13
Stream Type refers to the Montgomery‐Buffington (Montgomery and Buffington 1998) 14 classification where the designation transport refers to morphologically resilient, supply‐15 limited reaches, and response refers to transport‐limited reaches where channels adjust 16 frequently to changes in sediment supply. A transport reach typically has a higher gradient, 17 a fairly resilient cross section shape, and relatively stable planform alignment. Examples 18 would include a boulder cascade or bedrock lined reach. A response reach typically has a 19 lower gradient and the cross section shape and planform alignment are less stable. 20 Examples would include a pool‐riffle system or braided channel. In these systems stream 21 banks tend to erode, bars scour and build, channels avulse, log jams form and break up 22

2nd Draft Water Crossing Design Guidelines 11/30/11
70
during large floods. Less effort is required to complete a reach analysis in transport reach 1 than in a response reach. 2
Bridge performance, in the case of replacement projects, refers to the history of the 3 previous bridge and its effect on, or interaction with, the channel (scour, bank erosion, 4 frequency of maintenance, bridge failure, etc.). See Section 4.1 below for further details. 5
Meander migration refers to the intensity of either lateral or translational channel 6 migration. The classification system of Lagasse et al. is simplified here to separate channels 7 into: (1) stable – those with banks sufficiently stable to generally resist peak stream power 8 over the life of the bridge; (2) migrating ‐ those subject to noticeable meandering or 9 shifting under relatively frequent flows; and (3) avulsion risk – those prone to avulsions 10 and chute cutoffs with major changes in channel geometry (Lagasse, Spitz et al. 2004). 11
The simplest case for use of Table 1 is where all site attributes point to the same level of 12 assessment. For instance, in the case of a small, entrenched, stable channel in a transport reach 13 where an existing bridge has had no scour problems and no significant effect on the channel, only a 14 limited local assessment (Level 1) may be required. Cases with mixed attributes are more difficult 15 to interpret: a full reach analysis (Level 3) is probably advisable for a large, non‐entrenched 16 meandering stream even if the existing bridge has a good performance history. For sites with 17 mixed attributes, the recommended approach is to apply the higher level of analysis. 18
Sites where bridges are to replace culverts often have serious sediment and profile adjustment 19 problems and should be analyzed in a more comprehensive manner using Level 2 or 3, even 20 though they otherwise qualify for this Level 1. Typically, the channel downstream of undersized 21 culverts has lowered (due to incision or scour) and the culvert now acts as a nick point in the 22 profile. Sediment often accumulates above these culverts as well. Removing the culvert removes 23 the grade control and causes stream regrade and the complex series of events that creates. 24
The three levels of assessment in Table 1 are described in greater detail below. 25
Level 1, Limited local assessment can be used where the performance of an existing bridge 26 has been excellent (see Section 4.1 Bridge condition and history) and all parties agree that 27 replacement of the bridge with a similar structure would not adversely impact the stream. 28 Level 1 is not to be applied to new crossings at virgin sites 29
A Level 1 assessment should at least include a pre‐ and post‐project description and drawings 30 of the site to indicate the proposed changes for planning, design and permitting purposes. 31 Relevant natural and infrastructure features should be included. As understood, the proposed 32 bridge will have minor interaction with the stream and extensive topography and assessment is 33 unnecessary. 34
Level 2, Qualitative reach assessment relies on the technical expertise and judgment of the 35 design team but considers the crossing in a reach context. The project is low risk and the reach 36 is easily understood. All the reach characteristics listed in Section 3.2 below should be 37 considered, but field measurements are limited to simple instruments and relatively few data 38

2nd Draft Water Crossing Design Guidelines 11/30/11
71
points. If a numerical model is developed to assist with the hydraulic design of the bridge, the 1 results should be utilized to aid in the assessment. . A typical Level 2 assessment would include 2 a basic description of the reach which includes the bridge and the factors that will influence its 3 design and the impacts on stream morphology and habitat. 4
An abbreviated example of this level of assessment is given here. 5
The channel pattern of Noname Creek is relatively straight with little lateral migration due to 6 old and heavy vegetation on the banks; the longitudinal profile has a moderate gradient, 2%, 7 with no significant grade breaks or nick points; the elevation of the high water marks are 4 8 feet above the bed and the width of the channel at this water surface is about 29 feet. 9 Bankfull width is 18 feet. Sediment supply appears to be limited and the channel is in 10 equilibrium under current conditions. Potential debris loading is moderate to high due to the 11 mature riparian and bank erosion further upstream. This channel is incised and expected flood 12 flows will remain within the banks. Bridge design should begin by spanning the channel from 13 bank to bank to maintain adequate flood capacity and clearance. Considering the lateral 14 stability little toe or abutment armor will be necessary. 15
Level 3, Quantitative reach assessment implies sufficient data collection and analysis to 16 define the geomorphic and habitat character of the reach. All the reach characteristics listed in 17 Section 3.2 below should be considered and detailed data collection is required. This should 18 include a comprehensive field inspection and survey, including cross sections and a longitudinal 19 profile, analysis of surficial geology, aerial photos, satellite imagery and/or topographic ground 20 surface mapping. It should also consider flood frequency and magnitude and should include 21 detailed one‐ or two‐dimensional numerical hydraulic modeling. 22
The approach and results of the geomorphic investigation should be included in the final bridge 23 hydraulic report (see Section 6. Documentation). 24
REACH CHARACTERISTICS 25 Reach characteristics and features that should normally be considered during the geomorphic 26 investigation are listed below and described in the paragraphs to follow. Each site will be unique so 27 that the designer will have to decide which features need to be considered. In the past, designers 28 have focused mainly on the performance of the main stream channel and its ability to convey flood 29 flows; however, floodplain function is critical and cannot be ignored. Therefore, the list is divided 30 into two parts. 31
Channel Features 32
• Channel pattern type; straight, regular meandering, anabranch, braided, etc. 33
• Channel planform migration; lateral and translational 34
• Longitudinal profile; the elevation of the bed, water surface and banks 35
• Types of channel bank and bed material 36

2nd Draft Water Crossing Design Guidelines 11/30/11
72
• Sediment supply and transport 1
• Potential debris loading 2
• Bankfull width 3
Floodplain Features 4
• Floodplain width 5
• Floodplain down‐valley flow conveyance 6
• Remnant Slough and Side Channel Presence and Conductivity 7
• Avulsion potential 8
• Extent and types of vegetation 9
• Presence of flood control levees and transverse embankments 10
• Extent and nature of floodplain use and development 11
12
13
14
15
16
17
18
19
20
21
22
23
24
25

2nd Draft Water Crossing Design Guidelines 11/30/11
73
1
CHANNEL FEATURE DESCRIPTIONS 2 Channel Pattern Type 3 Common channel types, associated features, and typical stability problems are listed in Table 2. 4
Table 2: Some Stream Channel Types and Their Characteristic Stability Problems (modified from (U. S. Army Corps of Engineers 1994))
Channel Type Typical Features Stability Problems
Mountain torrents Steep slopes Boulders Drops and chutes
Bed scour and degradation Potential for debris flows
Alluvial fans Multiple channels Coarse deposits
Sudden channel shifts Deposition Degradation
Braided rivers Interlacing channels Coarse sediments (usually) High bedload
Frequent shifts of main channel Scour and deposition
Meandering rivers Alternating bends Flat slopes Wide floodplains
Bank erosion Meander migration Scour and deposition
Modified streams Previously channelized Altered base levels
Meander development Degradation and aggradation Bank erosion
Regulated rivers Upstream reservoirs Irrigation diversions
Reduced activity Degradation below dams Lowered base level for tributaries Aggradation at tributary mouths
Deltas
Multiple channels Fine deposits
Channel shifts Deposition and extension
Underfit streams Sinuous planform Low slope or glacial remnants
Meander migration Stable channels
Cohesive channels Irregular or unusual planform
Variable
6 Channel Planform Migration 7

2nd Draft Water Crossing Design Guidelines 11/30/11
74
Migrating channels pose one of the most challenging engineering problems for bridge designers. 1 Providing adequate width to allow channel migration can increase initial construction costs 2 dramatically. However, installing a bridge that is too short may require future erosion protection 3 or flow guidance structures that may not only be expensive but also have unacceptable impacts on 4 habitat. Investigation of meander migration and associated lateral channel shifting at the site 5 requires consideration of a reach extending for a distance of 10 or more channel widths upstream 6 and downstream of the crossing site. It usually involves examining a historical sequence of aerial 7 photographs and topographic terrain data, or satellite imagery in the case of larger rivers (Lagasse, 8 Spitz et al. 2004). Migration rates are loosely correlated with drainage basin size, so this issue 9 frequently is more of a concern on larger rivers than smaller streams (Lawler, Thorne et al. 1997). 10
Longitudinal Profile 11 The longitudinal profile reveals important aspects of the river’s current and future stability. A 12 figure should be created that shows the elevation and slope of the river bed and current water 13 surface. Preferably this would represent average bed elevations, but may show the river thalweg 14 (locus of deepest points along the channel). It may also include top‐of‐bank profiles to show 15 changing levels of incision. These should extend a sufficient distance upstream and downstream to 16 define the channel slope and to reveal features that may indicate instability such as natural 17 migrating nick points, or stability such as bedrock weirs. The bed profiles should also be compared 18 to historical profiles to determine if it is stable or is/has adjusted to natural or external influences. 19
Channel Bank and Bed Material Type 20 The soils that compose the bed and banks of channel strongly influence its size, shape, and 21 behavior. For instance, non‐cohesive unvegetated fine grained soils are typically highly erodible 22 and often promote rapid and significant planform changes, while a stream flowing through 23 consolidated glacial till may be slow to change (Lawler, Thorne et al. 1997). At a minimum, bed and 24 bank soil properties should be examined to determine if they present unique characteristics that 25 will influence the long‐term stability of the channel. 26
Sediment Supply and Transport 27 Some understanding of channel equilibrium and of sediment supply and transport is important. A 28 channel in equilibrium or "regime" is one which all or most of the bed sediment supplied to the 29 reach is transported through; it is neither aggrading or degrading over the long term, although 30 there may be cyclical changes in bed elevations related to the sequencing of bed‐mobilizing 31 discharges. Long‐term disequilibrium, on the other hand, is a progressive condition where bed and 32 water‐surface elevations are rising or falling due to externally imposed changes in sediment supply, 33 downstream water‐level controls, or geologic and climatic factors. 34
When a new bridge replaces an undersized bridge or culvert, the upstream channel has often 35 aggraded and will then scour down to a new equilibrium slope. The duration of and response to 36 such a temporary disequilibrium may be difficult to predict. This is discussed briefly below and 37 covered more completely in Chapter 7: Profile Adjustment. 38
39 40

2nd Draft Water Crossing Design Guidelines 11/30/11
75
Potential Debris Loading 1 There are two levels of debris expected at a given site. First is the loading from standard recurrence 2 interval storms that produce the debris associated with regular maintenance activities. Second are 3 the occasional external disturbances such as debris flows, fires, landslides, earthquakes and 4 extreme floods can have a powerful effect on channel morphology and evolution. The general 5 standard of designing for a statistically derived 100‐year flood estimate covers the first category, 6 but does not inform designs that accommodate the second. The channel valley often shows 7 evidence of both types of events and its response to them. The longer the expected life of the 8 structure, the more likely it is to experience a disturbance event. 9
The most common practice used is a visual assessment of existing large woody material that was 10 transported by the stream in previous flood events. Often, a site assessment up and downstream 11 from the project site reveals wrack and debris mobilized during past flood events. Photos, permits 12 for past debris removal, and maintenance records from past flood events are valuable in assessing 13 the size and type of large woody material or ice likely to be encountered at a project site. 14
Crossing sites with notable higher risk to debris flows or landslides need special consideration. 15 Feasible alternatives to bridges in such situations include engineered fords, temporary 16 bridges, bridges with high clearance, and/or re‐location of the crossing. 17
FLOODPLAIN FEATURE DESCRIPTIONS 18
The floodplain can be defined in a variety of ways. Generally, it is a relatively flat length of land 19 adjacent to the stream that is flooded during high water (Leopold, Wolman et al. 1964). Floodplain 20 features can provide valuable habitat for fish and therefore, the impact a crossing may have on the 21 floodplain should be carefully considered. Floodplain characteristics and features that should be 22 considered when designing a crossing are described below. 23
These characteristics should be examined along a reach that extends 10 to 20 channel widths 24 upstream and 10 to 20 channel widths downstream of the bridge, but not all of this length need be 25 examined with equal intensity. A length within 5 to 10 channel widths of the site should normally 26 examined in more detail. In large dynamic rivers longer lengths may be required to investigate 27 avulsion risk, meander migration rates, large‐scale planform systems, and longitudinal profile 28 discontinuities. 29
Floodplain Width 30 The lateral extent of the floodplain is often defined by the valley walls, but the active floodplain may 31 or may not extend across an entire valley. For example, the active floodplain may be narrower due 32 to the prior construction of dikes or elevated fills to support transportation features such as 33 railroads; or the magnitude and frequency of channel forming flows may have been reduced by the 34 construction of flood control reservoirs in the upper watershed (Dunne and Leopold 1978). For 35 bridge design, a good starting point to is to estimate floodplain width by determining the flooding 36 extent of a 50‐ or 100‐year recurrence interval flood. Topographic maps, aerial photographs, 37 vegetation surveys, etc. should then be reviewed to make sure the floodplain includes all functional 38 habitat features such as remnant sloughs, back channels, and swales. 39

2nd Draft Water Crossing Design Guidelines 11/30/11
76
Floodplain DownValley Flow Conveyance 1 During floods, floodplains often convey a significant portion of the total flow. If road fills extend 2 into a floodplain they may intercept or block the down‐valley flow of water. This may alter flow 3 patterns and change hydraulic conditions which may lead to scour and erosion within the bridge 4 waterway, or to loss of function in remnant sloughs or swales. Sometimes it can be difficult to 5 determine whether certain areas of the floodplain carry flow. In these areas field indicators can 6 sometimes help. For example following a flood look for laid down grass, scarred trees, sediment 7 embedded in tree moss,leaf litter and debris against fences or lodged in standing vegetation, or 8 evidence of scour or sediment deposition in fields or swales. 9
Remnant Slough and Side Channel Presence and Conductivity 10 Remnant sloughs and side channels are valuable for many species of fish and other wildlife, as well 11 as important hydraulic features in the floodplain. Identifying and mapping these, along with their 12 connection at both ends to the river, is important. Every effort should be made to avoid impacting 13 the surface or hyporheic continuity of flow into and through these features by the crossing project. 14
Avulsion Potential 15 The floodplain and channel should be examined to determine if an avulsion may occur during the 16 life of the crossings. Avulsions can occur abruptly and are often initiated by the blockage of one 17 channel by debris or sediment which redirects flow into a historical swale or slough, or the cutting 18 through an exaggerated meander. This can activate floodplain areas formerly dormant, creating 19 new hydraulic conditions at a bridge site. See INTEGRATED STREAMBANK PROTECTION GUIDELINES ( 20 ISPG) for a more in‐depth discussion of avulsion (Cramer, Bates et al. 2002) 21
Flood Refuge 22 When river flow rises during a flood, fish move out of the main channel and into lower velocity 23 areas (Schwartz and Herricks 2005). Refuge areas are important for maintaining healthy fish 24 populations (Benda, Miller et al. 2001). Floodplains provide important refuge areas, especially in 25 areas of slow moving water such as within stands of timber or fallen woody debris, weedy sloughs, 26 behind historical log jams, etc. It is very important to maintain easy access to these areas by fish. 27
Vegetation Extent and Types 28 Riparian vegetation is very important for both fish health and channel stability. Vegetation is a 29 main source of primary production in a stream ecosystem, it slows water which creates refuge 30 areas, and it strongly influences bank stability and therefore rates of meander migration. 31 Vegetation communities should be identified by examining aerial photographs and conducting a 32 field inspection. Every effort should be made to preserve and/or minimize impacts to productive 33 existing vegetation. 34
Once the geomorphic characteristics of the reach are fully understood, the bridge design team can 35 make informed decisions on alternative crossing configurations and their potential impacts or 36 benefit on fish habitat protection and conservation. Bridge design considerations are discussed in 37 the next chapter. 38
39

2nd Draft Water Crossing Design Guidelines 11/30/11
77
SELECTION OF BRIDGE LENGTH 1 Bridge length refers here to the total distance spanned by the bridge superstructure at right angles 2 to the watercourse. (Where the crossing is significantly skewed, the bridge length is necessarily 3 greater.) 4
Bridge length should be selected considering the bridge in its landscape context, which may vary 5 from a natural rural valley to a highly developed urban setting. Hydrotechnical factors affecting the 6 selection of bridge span or length are outlined in several excellent publications cited in the 7 References (Hamill 1999; Richardson, Simons et al. 2001; Transportation Association of Canada 8 2004) and are not repeated here. This section is meant to complement these publications and 9 discusses bridge length in the context of factors that need to be considered to preserve the 10 environmental productive capacity of the stream and floodplain. This should be done by 11 considering the items listed below and discussed in the sub‐sections that follow: 12
1. Existing bridge condition and history (in case of replacement projects) 13
2. Confined channels 14
3. Floodplain and overbank flow 15
4. Lateral Channel Movement 16
5. Floodplain management 17
6. Flood Control Features 18
7. Infrastructure 19
8. Approach road elevation 20
9. Tidal influences: this topic is covered in Appendix D: Tidally Influenced Crossings 21
EXISTING BRIDGE CONDITION AND HISTORY 22 Bridges being replaced for reasons of structural or traffic‐capacity deficiencies, but which have a 23 satisfactory performance history with respect to the river, may require little change in length or 24 other design parameters to protect natural processes. On the other hand, re‐assessment is required 25 where a bridge is being replaced because of performance and/or environmental problems. 26
A bridge located elsewhere on the same river, with a good performance history and in a similar 27 physical environment, may sometimes be used to indicate a suitable span for the proposed 28 crossing. Although such a comparison is sometimes listed as a first consideration for design (Hamill 29 1999; Transportation Association of Canada 2004; McEnroe 2009), identical bridges may perform 30 differently at different locations on the same stream because of significantly different geomorphic 31 and hydraulic conditions (Hamill 1999). 32
For the purposes of these guidelines, bridge sites with the following performance characteristics 33 are considered to be acceptable and will preserve the environmental productive capacity of the 34 stream and floodplain: 35

2nd Draft Water Crossing Design Guidelines 11/30/11
78
1. The bridge has not received regular or annual maintenance for debris removal, ice removal, 1 or sediment accumulation. 2
2. Countermeasures have not been required for approach, abutment or pier scour. 3 3. The channel in the vicinity of the bridge has not scoured below prevailing pool depth or the 4
sediment coarsened relative to undisturbed natural conditions. 5 4. Channel migration has not been interrupted as identified in a time series of aerial 6
photographs. 7 8
Many of these characteristics can be easily identified during an inspection of the site or through the 9 comparison of historical maps and aerial photographs. In addition, bridge maintenance inspection 10 reports often provide valuable insight into the long‐term performance history of a site. For 11 example the Washington State Dept. of Transportation bridge inspection checklist includes 12 categories on scour and erosion, waterway adequacy, debris and sediment accumulation, and 13 countermeasure presence (Washington (State) Dept of Transportation 2009). 14
CONFINED CHANNELS 15 Where there is a confined or deeply entrenched single‐thread channel without significant overbank 16 areas, the minimum bridge span is the natural bankfull width. At these sites most flood flows are 17 contained within the banks, and restricting the span to the bankfull width has no significant 18 adverse effect on the stream. However, the dimensions of alluvial channels may evolve within the 19 life span of the crossing in response to changes in channel forming flows, sediment transport and 20 deposition, large woody debris loading, and other factors (Werritty 1997; Montgomery and 21 Buffington 1998). A channel may narrow or widen during the life of the crossing. For example it 22 may gradually narrow during long periods of relatively low flood discharges as vegetation grows 23 and restricts the channel (Anderson, Bledsoe et al. 2004). However, it may widen again during 24 periods of larger and more frequent floods. A second example that may cause an entrenched 25 channel to widen is down cutting of the stream’s longitudinal profile. If the bed of the stream is 26 degrading, the toe of the banks will gradually erode and in‐turn the banks will collapse and the top 27 width to expand (Schumm, Harvey et al. 1984). This second example highlights the importance of 28 conducting at least a minimal geomorphic analysis to ensure that potential future channel changes 29 are considered and appropriately accounted for in the selection of the bridge length. Due to such 30 uncertainties, it is suggested that the bridge span in such streams should be at least 20% greater 31 than the observed bankfull width. This is a safety factor to compensate for changing 32 geomorphology, chance events, error in measurements and error in modeling hydraulics and 33 hydrology. The safety factor is set at 1.2 to provide at least some margin for error while allowing 34 the designer to economize. In certain instances, it might be reasonable to increase this factor. 35
Figure 4.2 illustrates the relationship between bankfull width and the bridge structure for 36 confined channels. This figure shows a bridge founded on spread footings and the abutment 37 protection required to protect them. Other foundation and abutment protection methods are 38 possible, and preferred, but the width required between them remains the same. 39

2nd Draft Water Crossing Design Guidelines 11/30/11
79
1 Figure 4.2: Bridge cross section over a confined channel showing the relationship between the 2 bankfull width and the minimum recommended width between abutment protection. The bridge may 3 also be founded on piling or drilled shafts and the scour risk would be eliminated. 4
FLOODPLAIN AND OVERBANK AREAS 5 For streams where floodplain areas provide significant flow capacity and habitat, overbank flow 6 should be taken into account in the hydraulic design of the bridge (Transportation Association of 7 Canada 2004). From an environmental point of view, ideally the entire floodplain width would be 8 bridged, but this is seldom feasible for economic reasons. A careful analysis is then required to 9 select an acceptable main bridge length, possibly supplemented with relief bridges or culverts 10 through the approach embankments, to ensure fish passage and habitat protection. 11
Key hydraulic and environmental functions of floodplains are as follows: 12
1. They provide cross‐sectional area over and above the bankfull channel to absorb excess 13 flood flows, sediment, ice and large woody debris (Benda, Miller et al. 2001). 14
2. They provide a wide area within which channel shifting and meander migration take place. 15 Evidence of past shifts is often seen in the form of oxbows, meander scrolls, and sloughs 16 that indicate past channel locations (Leopold, Wolman et al. 1964). 17
3. Features such as side channels, meander scroll depressions, and backwater deposits create 18 complexity and habitat for fish and wildlife (Beechie and Sibley 1997). 19
4. Riparian and wetland vegetation often depend on the floodplain and floodplain processes 20 (Naiman, Fetherston et al. 1998). 21
5. Floodplains provide shelter areas where fish and wildlife can seek refuge to avoid high 22 velocities during flood events (Cederholm and Scarlett 1981; Schwartz and Herricks 2005). 23

2nd Draft Water Crossing Design Guidelines 11/30/11
80
Selection of a bridge span or spans must balance the engineering and environmental requirements 1 of the crossing in order to avoid or reduce impacts to these floodplain functions. 2
Some floodplains may not be active in down‐valley transport of water, debris and sediment, and 3 may not exhibit features created by channel shifting. Such inactive floodplains often serve as 4 important storage areas that are inundated seasonally. Encroachment into floodplains of this type 5 may not have significant effects on the hydraulics and morphology of the river, provided that lateral 6 channel movement over the life of the bridge does not significantly cut into the floodplain. On the 7 other hand, blockage of such floodplains by bridge approach embankments may still affect riparian 8 vegetation, wetlands, or other habitats. 9
Whenever blockage of floodplain areas is contemplated, it should be demonstrated that this will not 10 impact on backwater rise, stream morphology and processes, and fish habitat. Considering the 11 permanent nature of such impacts, avoidance rather than mitigation is the preferred option. In 12 practice, however, some degree of floodplain blockage or encroachment may be acceptable if the 13 impacts can be shown to be minor and easily mitigated. Several steps and considerations relevant 14 to determining acceptable encroachment are as follows: 15
1. Using information from the reach analysis, the river corridor in the vicinity of the bridge 16 should be examined to determine the presence and continuity of floodplain flow over a 17 range of overbank discharge conditions. If major channel‐like features, such as oxbows, 18 sloughs, or tributary streams are present they should be spanned either by the main bridge 19 or by additional relief spans, road dips, and/or culverts. (Caution is advised however, as 20 isolated floodplain relief bridges are often susceptible to deep scour because floodplain 21 soils are typically fine grained and inflows from the floodplain are devoid of bed sediment 22 and often such relief structures are prone to debris occlusion.) 23
2. Where significant floodplain flow is prevented because of blockage by natural features such 24 as bedrock outcrops or other topographic features, even major floodplain encroachments 25 may not impact significantly on flood discharge capacity and environmental functions. As in 26 the case of confined channels (Section 4.2 above), however, the bridge span should be 27 made at least 20% greater than the current bankfull width to allow for future morphologic 28 changes. Where floodplain flow is prevented by manmade features such as nearby 29 crossings, dikes or other infrastructure, special consideration is required. This is discussed 30 in the Floodplain Management and Infrastructure section below. 31
3. In cases where the floodplain does transport water down the valley, relatively simple 32 velocity calculations can be used to estimate the size of the bridge span required to 33 minimize impacts to habitat. One of the primary engines of change in a river channel is 34 velocity. If the velocity increases significantly, scour and erosion may occur which can 35 adversely impact habitat in multiple ways. For example it may coarsen the bed substrate 36 which could harm spawning beds and erode the stream banks requiring the installation of 37 future bank protection countermeasures. By comparing the velocity in the main channel 38 under the proposed bridge with the velocity in the channel under natural conditions, one 39 can gain insight into whether the proposed crossing is likely to cause scour and/or erosion. 40

2nd Draft Water Crossing Design Guidelines 11/30/11
81
The goal is to achieve a velocity ratio, VB/VN, less than or equal to 1.1, where VB in the 1 average velocity in the main channel of the proposed bridge waterway and VN is average 2 velocity within the “natural” unobstructed river channel. Velocity should be calculated for a 3 major flood such as a 100‐year event, but can be computed based upon the elevation of 4 clearly defined high water marks so long as they represent a justifiable design event. 5 Velocity ratios less than 1.1 typically will likely have minimal impacts to fish habitat. 6 Velocity ratios greater than 1.1 should be reevaluated and may require increasing the 7 bridge span length, adding relief spans, or making other changes to reduce impacts. A 8 velocity ratio greater than 1.1 does not necessarily mean the proposed bridge is 9 unacceptable, but rather there is cause for concern and additional analysis are needed. 10
Figure 4.3 below is presented to help illustrate how to compute VN and VB. The top 11 figure, A, shows the unobstructed natural cross section broken into the overbank areas and 12 the main channel. The bottom figure, B, is the bridge cross section, also broken into 13 overbank and channel areas. The velocity ratio is the average velocity in Section 5, VB, 14 divided by the average velocity in Section 2, VN . 15
The velocity computation can be done using simple Manning’s equation methods, so long as 16 relatively simple gradually varied flow conditions are maintained (see OPEN CHANNEL 17 HYDRAULICS (Chow 1959)). Manning’s “n” values which are used in the equation to 18 represent headloss due to friction can be determined from a variety of resources including 19 Chow, or ROUGHNESS CHARACTERISTICS OF NATURAL CHANNELS (BARNES 1967), or ROUGHNESS 20 CHARACTERISTICS OF NEW ZEALAND RIVERS (Hicks and Mason 1998). 21
The preferred method, however, is to use a one‐ or two‐dimensional model because these 22 will adjust the velocity to reflect changes in discharge distribution across the bridge 23 waterway and also will account for any rise in the upstream water surface elevation caused 24 by the crossing. The more sophisticated the model, generally speaking, the closer it can 25 approach real conditions. The most common model used today for bridge projects is the 26 U.S. Army Corps of Engineers one‐dimensional HEC‐RAS water surface profile code (U.S. 27 Army Corps of Engineers 2006). Two‐dimensional models should be considered for sites 28 with relatively complex hydraulic characteristics. Two‐dimensional codes are becoming 29 more common and easier to use, but just as with one‐dimensional models should only be 30 applied by those with considerable experience in their application. 31
This velocity ration method is presented because it provides a means to estimate a bridge 32 span or habitat protection that is relatively simple. However, it is NOT a substitute for a 33 thorough hydrotechnical engineering evaluation to satisfy concerns about safety and to 34 properly design bridge elements. 35

2nd Draft Water Crossing Design Guidelines 11/30/11
82
1
Figure 4.3: Cross sections of a typical floodplain river, A, divided into sections with differing 2 roughness and hydraulic radius in the main channel and overbank areas, Section 2 is the main 3 channel where VN is calculated; and a cross section of a bridge, B, which spans the same river shown in 4 A, similarly subdivided. Section 5 is where VB is calculated. 5
4. If the designer finds that the velocity method above unsatisfactory, they can compute the 6 span length required to satisfy the requirements of WAC 220‐110‐070(1)h. This requires 7 the designer to demonstrate that the backwater caused by the bridge and all its components 8 will not exceed 0.2 ft (see Section5.1 Hydraulic Requirements of WAC 2201109 070(1)(h)). Special Note ‐ Bridges that cross a stream that flows in supercritical mode 10 during the design event may not show backwater rise, but still can cause significant scour 11 and therefore adversely impact habitat (Hamill 1999). In these situations the design team 12 should complete the appropriate hydraulic analyses to demonstrate that the crossing will 13 not adversely impact habitat. 14
5. The use of floodplain relief bridges separated from the main bridge may raise difficult 15 problems of hydraulics and scour, depending on the topography of the floodplain, the extent 16

2nd Draft Water Crossing Design Guidelines 11/30/11
83
of floodplain flows under design flood conditions, and the nature of the floodplain soils and 1 vegetation. Their design should be done only by persons suitably qualified and experienced 2 in open channel hydraulics and scour. Their use is recommended where there are defined 3 channels within the floodplain that should be maintained for environmental reasons. In 4 other cases they may be contemplated as a means of reducing backwater or assisting 5 drainage of ponded floodplain areas after overbank flow events. 6
6. Multiple spans are acceptable to decrease structure depth, approach fill height, and to 7 create a more economical design. When possible, place piers outside of the main channel to 8 reduce maintenance and scour issues. 9
LATERAL CHANNEL MOVEMENT 10 Bank erosion at a crossing often is a consequence of past and continuing channel shifting that 11 involves erosion of one bank combined with deposition of sediment on or near the opposite bank. 12 A common geomorphic process contributing to the latter effects is systematic migration of 13 meanders either down‐valley or across the floodplain. Switching of channels in multi‐channel or 14 braided streams produces similar effects. 15
The preferred approach is to span the entire width of the geomorphically active floodplain or, as it 16 is often referred, the active channel migration zone. This may not be practical for economic 17 reasons, but encroaching into this zone can have significant impacts not only on the future health of 18 the ecosystem, but also may lead to the installation of expensive and undesirable bank protection or 19 channel stabilization features. Determining the width of this zone should be done only by persons 20 suitably qualified and experienced in river processes and morphology. The Washington State 21 Department of Ecology has published a useful guide titled A FRAMEWORK FOR DELINEATING CHANNEL 22 MIGRATION ZONES (Rapp and Abbe 2003). Also the HANDBOOK FOR PREDICTING STREAM MEANDER 23 MIGRATION is good resource (Lagasse, Spitz et al. 2004). 24
Allowing a stream or river the freedom to adjust within its migration zone is important to 25 environmental productivity. Tangible benefits for fish include: 26
1. The continuity of floodplain processes: interrupting meander migration has many off‐site 27 implications that jeopardize fish habitat; often leading to bank protection measures and an 28 increased risk of avulsion, among other complications that require countermeasures. 29
2. Sediment recruitment to preserve natural channel stability through maintaining sediment 30 transport and deposition equilibrium. Gravel recruitment is also key to maintaining 31 productive downstream spawning. Recruitment of fine sediment which is deposited on and 32 maintains the health of downstream floodplains 33
3. Riparian vegetation succession and LWD recruitment. These have many documented 34 benefits such as increased channel complexity, refugia, and invertebrate populations 35 (Florsheim, Mount et al. 2008) 36
At certain sites erosion countermeasures may be unavoidable. Every effort should be made to 37 reduce their local impacts on fish life and habitat. This is best achieved through consultation and 38

2nd Draft Water Crossing Design Guidelines 11/30/11
84
cooperation between bridge designers and environmental agencies at the design and construction 1 stages of the project, and whenever post‐construction maintenance is required. Where the works 2 cause local loss of habitat, provision of compensation habitat elsewhere may be required. The 3 designer should utilize the ISPG (Cramer, Bates et al. 2002) to identify acceptable bank protection 4 alternatives. 5
Failure of any bank protection or channel control work is likely to have significant impacts on 6 habitat from emergency work or more aggressive countermeasures. It is therefore important for 7 works to be designed and constructed to a high standard to work with fluvial processes at the site 8 and avoid challenging hydraulic conditions expected during design flood conditions. This applies to 9 both conventional treatments such as rock revetments as well as softer bio‐engineered features 10 that may include anchored LWD and vegetative treatments. 11
FLOODPLAIN MANAGEMENT REGULATIONS 12 The bridge project must comply with legislation governing development within floodplains. Each 13 jurisdiction will have its own set of unique requirements, but in Washington most must uphold 14 minimum standards set by the Federal Emergency Management Agency’s (FEMA) Flood Insurance 15 Program, the State’s Shoreline Management Act and Growth Management Act and local shoreline 16 master programs and critical areas ordinances. 17
FEMA Region X, which monitors floodplain development activities within Washington, recently 18 released a document entitled POLICY ON FISH ENHANCEMENT STRUCTURES IN THE FLOODWAY (FEMA 19 2009). FEMA regulations require local communities to prohibit encroachments in a regulated 20 floodway unless the proponent can demonstrate that structure will cause “No‐Rise” in base flood 21 elevations. FEMA recognizes that placing fish habitat structures within a floodway, or modifying 22 existing structures to enhance habitat can result in a rise in base flood elevations. Therefore, they 23 have crafted the said policy which will allow a rise under certain circumstances (see Appendix E). 24
25
FLOOD CONTROL FEATURES 26 Existing flood control levees often determine the lateral limits of the 100‐year floodplain and 27 therefore bridges may only need to span between levees. 28
The potential for levee setbacks should be considered in the design of a replacement or new 29 crossing if the local floodplain jurisdictional authority has an active levee setback program included 30 in its Comprehensive Flood Hazard Management Plan (CFHMP) or Floodplain Ordinance. 31
Existing levees and road embankments can have a strong influence on a stream system and 32 therefore environmental productivity. Unfortunately, sometimes a bridge designer or owner may 33 have no authority to modify these features and therefore it may not be possible to size the bridge 34 span using recommendations outlined in this guidance. However, acquisition of additional right‐of‐35 way may be justified to ensure that the bridge design meets expected performance standards. 36 Several examples of such scenarios are discussed below. 37

2nd Draft Water Crossing Design Guidelines 11/30/11
85
a. Levees have been built on both sides of the stream and floodplain development extends to the 1 landward toe of the levees. Since homes and businesses are dependent on the levees for flood 2 protection, it reasonable to assume that they are permanent and that it will be impossible to set 3 the levees back from the river’s edge in the future. For this case the bridge need only span 4 between levee crests. 5
b. Levees have constricted the stream, creating a scour condition that requires repeated bank 6 protection measures and associated loss of habitat. In this case levee setback should be 7 considered by the responsible agencies. The bridge should be designed to span the increased 8 width. Levees may also lead to bed aggredation, which may be remedied by levee setback and 9 briges should be designed to accommodate this condition as well. 10
c. A levee with dependent infrastructure exists on only one side of the stream, with a non‐leveed 11 floodplain bench on the other side. The bridge should span the main channel and the bench. 12
OTHER INFRASTRUCTURE 13 Other forms of non‐project infrastructure that may affect location or design of the bridge project 14 include adjacent roads and railroads, road intersections, driveways, houses and businesses, and 15 utility lines. These are not owned or controlled by the bridge owner and therefore, it may or may 16 not be possible to modify them as part of the bridge project. Modifications to these facilities should 17 not be dismissed out‐of‐hand, but rather, early in the design process, such facilities should be 18 discussed with regulatory agencies and owners to consider their influence on the design 19 alternatives. An alternative can then be chosen that includes modifications to these facilities as part 20 of the crossing project or at a minimum provides allowances for modification that may occur in the 21 future. 22
It is common to find undersized road or railroad crossings upstream or downstream of the project 23 site. Ideally, the new crossing should be designed as if these undersized structures were not there, 24 since they may be widened during the expected project life. In these cases the design must be 25 evaluated by persons suitably qualified and experienced in river processes to ensure that the new 26 crossing will not endanger the adjacent structure. 27
It is also common to find that channel has been “locked” in place or its lateral movement severely 28 restricted by a series of independent bank armor revetments; often placed over a period of many 29 years to halt lateral erosion. The new crossing should be designed with the consideration that 30 some or all of these revetments may fail or be removed during the life of the crossing. This would 31 allow the river freedom to migrate, a desired action with regard to habitat. Within reason, the 32 crossing should either be made wide enough to accommodate these potential future lateral 33 movements, or at a minimum the abutments be designed to accommodate additional future spans. 34 The abutments and floodplain piers should be designed to be safe from scour should the river 35 channel eventually migrate and flow around them. 36
If reach assessment or hydraulic modeling shows impact to downstream land owners and 37 infrastructure by following the recommendations in Section 4, the crossing owner may propose a 38 replacement structure that reduces this liability. 39

2nd Draft Water Crossing Design Guidelines 11/30/11
86
HEIGHT OF BRIDGE, APPROACH ROADS AND INTERMEDIATE PIERS 1 Bridge designers should avoid placing piers within the river channel; however, in some situations it 2 may be acceptable. For example, spanning an entire channel may require deep structural girders. 3 Add to this freeboard requirements for floating debris, ice, or navigation, and the bridge deck may 4 have to be elevated high above the floodplain. The bridge span may avoid impacts, but the 5 approach fills at each end may cause significant damage to sensitive riparian and wetland habitats 6 or the fills may extend laterally beyond the limits of the owners right‐of‐way. In this case multiple 7 spans supported by intermediate piers should be considered to reduce bridge deck depth and 8 therefore the height and extent of the approach fills. Every attempt should be made to place the 9 intermediate piers landward of the OHW and out of the thalweg. If this cannot be avoided, the 10 bridge owner should consult regulatory agencies and stakeholders to determine the best course of 11 action. 12
ADDITIONAL REQUIREMENTS AND CONSIDERATIONS 13
HYDRAULIC REQUIREMENTS OF WAC 220110070 14 WAC 220‐110‐070(1)(h) states that 15
“abutments, piers, piling, sills, approach fills, etc., shall not constrict the flow so as to cause 16 any appreciable increase (not to exceed 0.2 feet) in backwater elevation (calculated at the 17 100‐ year flood) or channel wide scour and shall be aligned to cause the least effect on the 18 hydraulics of the water course.” 19
“Backwater” is defined in the nationally recognized and often‐cited FHWA documents HEC 20 18(Richardson and Davis 2001) and HEC 20(Lagasse, Schall et al. 2001) as 21
"the increase in water surface elevation relative to the elevation occurring under natural2 22 channel and floodplain conditions. It is induced by a bridge or other structure that 23 obstructs the free flow of water in a channel." 24
The purpose of the quoted WAC 220‐110‐070(1)(h) clause is to avoid or at least limit any 25 disturbing effect of the bridge on the hydraulics and morphology of the channel and therefore fish 26 habitat. The apparent value of the 0.2‐foot rise requirement in WAC rule is because it is a 27 quantifiable measure, but it alone is insufficient to demonstrate that the crossing will not harm fish 28 habitat. The preferred approach is to conduct a thorough analysis using the principals described in 29 the preceding sections of this document, combined with demonstration of compliance with WAC 30 220‐110‐070. 31
WAC 220‐110‐070 also requires that the bridge project “achieve no‐net‐loss of productive capacity 32 of fish and shellfish habitat”, implying that any such loss must be compensated by creating 33 equivalent habitat elsewhere. 34
2 “Natural” includes manmade features in floodplain that are out of control of the owner and unlikely to change.

2nd Draft Water Crossing Design Guidelines 11/30/11
87
The backwater rise due to a proposed new bridge or bridge replacement is usually estimated by 1 numerical modeling of the water surface profile corresponding to the design flood, over a distance 2 equivalent to 10 channel widths or more both upstream and downstream of the site. The computed 3 profile with the project – which includes the bridge structures and any associated river training and 4 erosion protection works – is compared to the natural profile without the project (Figure 3). In a 5 bridge replacement case, existing works associated with the bridge should not be included in the 6 without‐project analysis. 7
Specific site conditions can be complex with features that affect hydraulic conditions yet are not 8 part of “the bridge” (see Sections 4.6 and 4.7 above). In these situations judgment must be used 9 and it is recommended that the modeler contact the WDFW permitting biologist early to agree on 10 which existing man‐made features should be included in the model. It may be best to show 11 hydraulic profiles for four different conditions: 1) the “natural” river valley; 2) the “natural” valley 12 plus significant man‐made features not associated with the crossing: 3) the “natural” river valley 13 with just the proposed crossing included; 4) the “natural” valley with other man‐made features, 14 plus the proposed crossing. In this way, the design team, those involved in the permitting process, 15 as well as other stakeholders, can objectively assess the hydraulic impact of the proposed crossings 16 on the reach. This will allow the team to make a reasoned decision on a crossing configuration that 17 will minimize impacts to environmental productivity over the life of the bridge. 18
The numerical model generally must be calibrated for the hydraulic roughness of the channel 19 boundaries, by matching it to a known or observed water surface profile corresponding to a known 20 high flow. If the estimated backwater rise exceeds the specified 0.2 ft maximum, some modification 21 of the bridge span and / or waterway may be required. 22
23

2nd Draft Water Crossing Design Guidelines 11/30/11
88
Backwater Profile
Bridge
Backwater Rise
Zone of separation
Bridge
Width of channeland floodplain
a: profile view
b: plan view
1
Figure 4.4: Illustration of bridge backwater, after (Hamill 1999). (a) Diagrammatic longitudinal 2 profile of uniform flow at normal depth in the absence of the bridge structure with a superimposed 3 surface profile that results from the bridge structure. (b) Plan view showing the contraction of the 4 flow lines into the bridge opening and the formation of a zone of separation where water is of a lower 5 velocity and often flowing counter to the main body of water. 6
The number of surveyed cross‐sections required to establish a reliable numerical model of the 7 channel and floodplain through the bridge reach depends on the nature of the stream and the 8 variability of its geometry. An example layout for a fairly regular situation is shown in Figure 4.5. 9 Cross‐sections should encompass the width of floodplain judged to carry significant overbank 10 flows. 11

2nd Draft Water Crossing Design Guidelines 11/30/11
89
1
2
Figure 4.5: A suggested arrangement of channel cross sections to determine bridge backwater effects. 3
Various modeling programs or codes available for backwater analysis include the popular one‐4 dimensional HEC‐RAS by the US Army Corps of Engineers (Bonner and et. al. 2006), and other one‐5 dimensional programs by USGS (Matthai 1967) and USBPR(Bradley 1978). Two‐dimensional 6 models are more common for difficult cases, and can provide greater accuracy if adequately 7 designed and calibrated. Use of all computational models requires appropriate training and 8 experience. Estimating water surface elevations using hand calculations is acceptable, but the use 9 of computational models is preferred. 10
Note – the method described above is only intended to address impacts to fish habitat, it does not 11 address bridge safety and performance. This will require a thorough hydraulic analysis such as is 12 described in the GUIDE TO BRIDGE HYDRAULICS (Transportation Association of Canada 2004). 13
ENVIRONMENTAL ASPECTS OF BRIDGE FOUNDATIONS AND EROSION PROTECTION 14
MEASURES 15 The type of bridge foundation selected depends on a number of structural, geotechnical, 16 constructional and environmental considerations. Other things being equal, the type chosen should 17 have the least impacts to habitat and involve the least construction‐related disruption of the 18 stream. For example, pile foundations or drilled shafts do not require scour protection are 19 preferred over spread footings requiring heavy riprap protection. In‐channel piers should be 20
Cross sections required for bridge analysis
Upstream cross sections required to establish
channel baseline conditions
Downstream cross sections required to establish channel
baseline conditions
2-7 channel widths

2nd Draft Water Crossing Design Guidelines 11/30/11
90
avoided, but if they cannot, they should be designed to reduce scour and limit debris accumulation. 1 Bank protection should not be extended farther than necessary to satisfy expected erosional attack, 2 and bioengineering techniques should be considered where possible in the light of the stream 3 hydraulics. Encroachment of abutments or embankment end slopes into the bankfull channel is 4 unacceptable. 5
BRIDGE CLEARANCE 6 General guidance for bridge clearance is that the bottom of the superstructure should be 3 feet 7 above the 100 year flood water surface. This is a widely used criterion and allows for uncertainty 8 predicting water surface and the presence of floating debris and ice that may hang up on the 9 bridge. This criterion should be used with caution since the size of the river influences the size of 10 the debris carried. Generally, major rivers will need greater clearance and smaller rivers less. In 11 some instances, the designer may increase the clearance or decrease the clearance as acceptable to 12 the local or state roadway bridge design authority. 13
BRIDGE REPLACEMENTS AND CHANNEL MODIFICATIONS 14 When an old structure is replaced by a new one, the channel plan and profile are often modified. 15 The old bridge may have had adverse effects on the natural channel or been protected with rock 16 riprap placed in the channel. The new bridge should address such a legacy and be designed to 17 reduce and/or mitigate adverse impacts on habitat. Rock or artificial materials used for past 18 remedial measures should generally be removed and replaced by natural channel materials if 19 hydraulic conditions allow. 20
When an undersized bridge or culvert is replaced with a bridge sized to accommodate fluvial 21 processes important for fish life, some upstream channel instability may occur due to re‐22 mobilization of sediment stored above the old structure or to channel incision that has occurred 23 below it. Consideration should be given to the likelihood of channel headcutting and regrading 24 upstream and the impact it may have on existing in‐stream structures, channel banks, and 25 floodplain facilities. 26
When a new bridge is installed, all the components of the old bridge should be removed from the 27 stream channel and floodplain. The practice of leaving old abutments and pier foundations in the 28 channel is generally harmful and unnecessary, since even when cut off at the bed line, old footings 29 can often be exposed to cause scour and catch debris. Old footings should be removed unless it can 30 be shown that there are important safety, engineering, or ecological reasons for not doing so. 31
BRIDGE MAINTENANCE 32 Owners of older bridges are often confronted with a decision either to maintain a failing structure 33 or replace it. This decision is relatively easy to make when the bridge is, for whatever reason, 34 obsolete and replacement is a clear choice. It becomes more difficult when the repairs are relatively 35 inexpensive but they maintain a facility that may have serious environmental impacts. This latter 36 scenario often leads to conflicts between natural resource agencies and bridge owners. 37
Bridge maintenance should be evaluated as one alternative in a comprehensive planning document 38 which addresses 39
2nd Draft Water Crossing Design Guidelines 11/30/11
91
1. safety, 1
2. traffic flow and road geometry, 2
3. sight distance, 3
4. expected bridge life considering structural deficiencies and channel dynamics, 4
5. one‐time maintenance activities, 5
6. chronic maintenance activities (evaluated over the remaining expected bridge life), and 6
7. environmental impacts. 7
When evaluated over this broad range of factors, decisions concerning an older bridge can be made 8 in a rational atmosphere and readily explained to funding and natural resource agencies. It benefits 9 all parties if the bridge owner presents a comprehensive assessment rather than simply proposing 10 the repairs. 11
Generally speaking, maintenance costs that amount to greater than 50% of the cost of a new bridge 12 should trigger planning for a new bridge. Likewise, bridges with observable impacts (categorized 13 by the 6 goals in Section 2) should also be evaluated before proposing repairs that increase their 14 lifespan. 15
MISCELLANEOUS DESIGN AND CONSTRUCTION CONSIDERATIONS 16 In most cases, a suitably designed bridge crossing should not require massive bank and abutment 17 protection. Where possible, the use of heavy rock should be minimized, possibly with the use of 18 geotechnical and bioengineering methods of slope stabilization. Figure 4.6 shows a plan view of a 19 hypothetical site that incorporates this approach with riprap toe protection, riprap abutment 20 protection in the shadow of the bridge where vegetation‐based techniques would not work for lack 21 of sunlight, and geotechnical slope stabilization on the rest of the embankment. This said, every 22 crossing may experience unique hydraulic conditions which will require erosion and scour 23 protection countermeasures tailored to the site. Riprap placed above Q100 (or a suitable design 24 flow) elevation does not require mitigation for in‐stream functions unless the bridge span is 25 inadequate to allow meander migration or the rock significantly affects riparian vegetation. The 26 design of these features should be carried out by experienced engineering professionals. 27

2nd Draft Water Crossing Design Guidelines 11/30/11
92
Figure 4.6: A plan view of a bridge showing reinforcements to the road embankment. 1
All major bridge construction work must be isolated from flowing water. Proper practices should 2 be followed for flow bypassing, sediment containment and fish removal. Contaminated water 3 should be pumped out and filtered or disposed of without impacting on downstream habitat. 4
Sediment delivery from unpaved roads deteriorates stream water quality. References and 5 standards for sediment handling are available from the forest industry, the U.S. Forest Service and 6 Washington Department of Natural Resources. As general guidance, the bridge should be elevated 7 above common flood flows, and curbs should be installed to prevent fine sediment from running off 8 the deck into the stream. Ditches and frequent cross drains can prevent direct delivery of runoff to 9 the channel. Ditchwater should be filtered before it enters the stream. 10
Bars may form in alluvial channels under some bridges. These do not necessarily reduce flow 11 capacity since they are composed of mobile bedload and tend to wash out in large floods, so 12 normally they need not be removed. Sometimes they become heavily vegetated with perennial 13 plants like willows and become resistant to erosion. Such vegetated bars constitute important fish 14

2nd Draft Water Crossing Design Guidelines 11/30/11
93
habitat for fish and wildlife. Therefore, to preserve the productive capacity of the stream, the 1 bridge owner should balance the need to restore flow capacity against the requirement to preserve 2 habitat. 3
Potential habitat impacts of a project can occur throughout the life of the structure, which could be 4 many decades. Regular monitoring and maintenance is generally necessary to ensure proper 5 performance over time. Various maintenance issues should be addressed in the design, permitting 6 and long‐term care of the crossing. For any work that affects fish and fish habitat in or above 7 waters of the State, a Hydraulic Permit Application (HPA) must be submitted to and approved by 8 WDFW. 9
DOCUMENTATION 10 A hydraulic design report is typically prepared at the end of an investigation to document the 11 methods used and results determined. The level of reporting will vary with the size and 12 complexity of the project and the needs of the client or bridge owner. Reports for simple sites may 13 only require a short technical memorandum, while complex sites may require a detailed 14 comprehensive report. A typical report will include the following: 15
• Documentation of existing site conditions observed during field inspection. This would 16 include information on the performance of the existing crossing (replacement projects 17 only), channel planform stability, scour, bed and bank material, debris, ice loading, size and 18 volume of large woody material previously removed, existing revetments, highwater 19 marks, adjacent man‐made features, etc. 20
• Historical stream flows and flood discharge estimates 21
• Interpretation of historical aerial photographs and maps to document channel migration 22 or other historic channel planform adjustments 23
• Historic bridge performance based upon a review of maintenance records (replacement 24 projects only) 25
• Existing Hydraulic characteristics in the vicinity of the proposed crossing site (typically 26 based upon computer modeling) 27
• Bridge dimensions and features – length, height, pier and abutment configuration etc. 28
• Hydraulic impacts of the proposed crossing and documentation it will meet the 29 requirements of WAC 220‐110‐070(1)(h). 30
• Erosion and scour countermeasure recommendations 31
We now recommend that this report be expanded to include a section or chapter that describes the 32 type of reach analysis that was completed, the conclusions that were drawn from the analysis, and 33 how these conclusions have been addressed in the crossing design to enhance or preserve fish 34 habitat. 35
36
2nd Draft Water Crossing Design Guidelines 11/30/11
94
CHAPTER 5: TEMPORARY CULVERT AND BRIDGE DESIGN 1 Crossings needed for only a short period of time are considered temporary culverts and bridges. 2 They are typically used for one time resource extraction or construction access and remain in place 3 for a season or two, generally less than one year. 4 5 Temporary crossings, when assessed over the long‐term, have the least effect on stream processes 6 and fish habitat. There are short‐term impacts associated with their construction and removal, but 7 this can be minor when compared to the potential disruption caused by a permanent structure and 8 associated maintenance. In this context, temporary crossings are preferred to permanent ones 9 whenever possible because they do not result in long‐term impacts to the stream. 10
As with permanent crossings, temporary crossing are generally divided between bridges and 11 culverts by stream size. The line is somewhat fuzzier in that the domain of culverts may be 12 extended to larger streams when they are installed for a short period of time. 13
Generally, temporary crossings are used during the low flow period of the year, although they can 14 be used over a number of seasons to extract timber or provide temporary access. If a crossing is to 15 remain in place for longer than a year, it is no longer considered “temporary,” and should be 16 designed as a permanent crossing according to Chapters 2, 3, and 4. 17
Temporary culverts should be designed and installed to: 18
• Minimize the disturbance to the bed and bank of the stream 19 • Safely pass the flows and debris expected during the time they will be in place 20 • Provide passage for fish migrating in the stream at that time 21
The simplest way to approach the design of a temporary culvert is to use the permanent crossing 22 design recommendations as a starting point since these recommendations account for all the 23 relevant design parameters; fish passage, high flow capacity, debris passage, etc. For smaller 24 streams, say a three or four foot bankfull width, a no‐slope design is all that’s necessary. This size 25 pipe is inexpensive and can be removed and reused easily. Larger streams can be efficiently 26 crossed with much smaller pipes than would be required for permanent crossings and it is these 27 that will benefit from a more detailed engineering analysis. 28
In fish bearing waters the temporary crossing must provide adequate fish passage. In low gradient 29 streams this can easily be accomplished by placing the culvert at zero gradient and countersinking 30 a minimum of 1 foot (this offered as a nominal value). The reason for countersinking is to prevent 31 an outfall drop should the bed downstream of the culvert lower due to scour from the temporary 32 pipe. When culverts must be placed on a grade, the average velocity should not exceed 4 feet per 33 second at the 10% exceedence flow (WAC 220‐110‐070, Table 1). A bare pipe must also maintain a 34 minimum water depth of 0.8 ft, whereas a countersunk culvert with bed material inside does not 35 need to meet this requirement. 36
The first design step is to determine expected flow conditions for the period the crossing is 37 installed. 38

2nd Draft Water Crossing Design Guidelines 11/30/11
95
Design hydrology for fish passage can be developed from gage data for the months of installation, or 1 estimated from Appendix G for ungaged streams. For culverts installed during the summer, the 2 May fish passage design flow can be used. If values are considered too high for the situation, the 3 designer can develop a more specific regression to determine the 10% exceedence flow using local 4 gaged streams for the month(s) of installation. 5
For high‐flow capacity, it has generally been found that complying with fish passage design (e.g. the 6 no‐slope method) usually yields a culvert size that accommodates the design flood (e.g. the 100 7 year recurrence interval event). If a temporary culvert is designed using the hydraulic method, then 8 the design flood from available gage data for the months of installation needs to be determined and 9 checked to see whether the proposed culvert will safely pass this flow. 10
The site chosen for the temporary crossing should have a low approach elevation, narrow channel 11 and riparian width and located to minimize impacts to sensitive or valuable habitats. 12
The project should be designed and constructed to minimize disturbance to the bed and banks 13 using native materials wherever possible. This includes rounded streambed aggregates similar in 14 size and distribution to that found in the adjacent channel (see Chapter 3 for a discussion of 15 culvert‐bed design and sediment specification). A recommended technique is to place a layer of 16 geotextile fabric under the fill materials to easily restore the original ground surface after removal. 17 The culvert should be installed in the dry, or in isolation from stream flow, and fish excluded from 18 the work area (see Chapter 12). 19
If the temporary crossing is only permitted for a brief period, under certain circumstances it may be 20 possible to forego both the 100‐year capacity and fish passage requirements. This can result in a 21 smaller pipe size and significantly less channel disturbance. If the pipe is laid on top of mesh or 22 fabric and covered with clean fill, then it can be removed with very little disturbance to the channel. 23 The overall success of the project is increased if the proper location is chosen to limit impacts. 24 Temporary culverts are best cited in straight reaches with low banks. 25
Examples of temporary crossings are shown in the following figures. 26

2nd Draft Water Crossing Design Guidelines 11/30/11
96
1
Figure 8.1: Temporary culvert. Nonmerchantable logs are used as fill around the culvert to make it 2 easier to remove and to protect the culvert. Road fill is kept to a minimum and native soils are used. 3
4
Figure 8.2: Temporary culvert site after removal. All traces of the temporary fill are removed and 5 straw is placed on the banks to decrease erosion. Wood and slash are added to improve habitat. 6
7

2nd Draft Water Crossing Design Guidelines 11/30/11
97
1
2
Figure 8.3: Cross section of temporary bridge used on a forest road (Greg Jones, Forest Pro, Inc). Components are sized to suit the loading requirements and bridge span.

2nd Draft Water Crossing Design Guidelines 11/30/11
98
CHAPTER 6: HYDRAULIC DESIGN OPTION 1
SUMMARY 2 • Hydraulic design option culverts have limited application in exceptional circumstances 3
where constraints prevent the use of bridges, no‐slope and stream simulation culverts. 4 Hydraulic design techniques include: 5
o Temporary culvert retrofits 6 o Baffled culverts 7 o Roughened channels 8
• Primary design criteria for hydraulic design option culverts is found in Washington 9 Administrative Code 220‐110‐070: 10
o Size and species of fish: passage of a 6 inch trout is the adult standard, juvenile 11 passage may also be required 12
o Velocity criteria is based on species, size and culvert length, as shown in Table 1 13 based on the 10% exceedance flow for the months of migration 14
Assume January for adult salmon 15 Assume May for trout 16
o Minimum depth for culvert without sediment is 0.8 ft. at the 2‐year 7‐day low flow 17 or the no flow condition 18
o No minimum depth requirement for culverts with a bed 19 o Maximum hydraulic drop 0.8 ft 20
• Energy Dissipation Factor (EDF) is an additional criteria applied to artificially roughened 21 culverts using baffles or roughened channel techniques. 22
o EDF is calculated at the 10% exceedance flow for months of migration 23 o Maximum EDF for baffles is 5.0 ft‐lb/ft3/sec 24 o Maximum EDF for roughened channel based on water surface slope, EDF < 250 x 25
slope 26 • Baffles are used for exceptionally long or steep culverts, retrofits or when constraints limit 27
culvert size 28 o Maximum recommended slope for a baffled culvert is 3.5% 29 o Headroom for maintenance minimum 5 feet, 6 feet for culverts in excess of 200 feet. 30
• Roughened channel design is based on 31 o Average velocity at the 10% exceedance flow not to exceed Table 1 32 o Bed stability during the 100‐year recurrence interval flow event 33 o Limiting turbulence to the EDF stated above 34 o Bed porosity; in order for low flows to remain on the surface of the culvert bed and 35
not percolate through a course permeable substrate, bed porosity must be 36 minimized through the use of well‐graded sediment mixes 37
• Hydraulic design option culverts are considered fishways that should be inspected on a 38 regular basis and maintained when they are no longer within design criteria 39
40

2nd Draft Water Crossing Design Guidelines 11/30/11
99
DESCRIPTION AND APPLICATION 1 The second culvert design option provided in WAC 220‐110‐070 (see Appendix B: Washington 2 Culvert Regulation) is based on the swimming abilities of a target fish species and age class. As 3 mentioned in the Introduction, the Hydraulic Design Option has largely been superseded by 4 culvert design based on geomorphology (Chapters 1, 2 and 3). Very early in the history of culvert 5 design for fish passage we realized the shortcomings of a method tied to a single life stage of a 6 specific species and the hydraulic performance of the structure, rather than the continuity of stream 7 processes. The hydraulic design method now can be used in rare instances for the temporary 8 retrofit of existing culverts (using baffles or backwater) as well as the design of replacement baffled 9 or roughened channel culverts when the situation requires it and impacts are mitigated. Any of 10 these applications require a working knowledge of open‐channel flow and sediment transport, as 11 well as a familiarity with the fish passage literature and practice. These are very sophisticated 12 designs best left to an engineer thoroughly trained in fish passage. 13
It is now common to categorize Hydraulic Design Option culverts as “fishways” – specifically 14 designed to pass fish. This specificity implies that other stream functions may be constrained and, 15 in fact, most often are. The transport of large in‐stream wood and normal sediment transport 16 depend on a geomorphologically appropriate channel cross section, roughness and slope, and it is 17 these aspects of the channel that the Hydraulic Design Option manipulates to provide fish passage 18 under anomalous conditions. Contrary to expectations, the most difficult design criterion to 19 accommodate in this type of culvert is the passage, not of fish, but of water‐borne debris and 20 sediment. As a result, fishways require inspection and maintenance to function properly and the 21 owner must assume the responsibility to maintain them under State law (RCW 77.57.030). The 22 requirements of an inspection and maintenance plan are discussed at the end of this chapter. 23
Proper culvert design must simultaneously consider the hydraulic effects of culvert size, slope, 24 material and elevation to create depths, velocities, and a hydraulic profile suitable for fish 25 swimming abilities. It must be understood that there are consequences to every assumption; 26 adequate information allows optimum design. The following sequence of steps is suggested for the 27 Hydraulic Design Option for fish passage through culverts: 28
1. Length of Culvert: Find the culvert length based on geometry of the road fill. 29 2. Fish‐Passage Requirements: Determine target species, sizes, and swimming capabilities 30
of fish requiring passage. Species and size of fish determine velocity criteria. Allowable 31 maximum velocity depends upon species and length of culvert. 32
3. Hydrology: Determine the fish‐passage design flows at which the fish‐passage criteria 33 must be satisfied. 34
4. Velocity, Depth and Turbulence: Find size, shape, roughness, and slope of culvert to 35 satisfy velocity criteria. Verify that the flow is subcritical throughout the range of fish‐36 passage flows, that is provides adequate depth and that the energy dissipation criteria is 37 met. 38
5. Channel‐Backwater Depth: Determine the backwater elevation at the culvert outlet for 39 fish passage at both low and high fish‐passage design‐flow conditions. 40

2nd Draft Water Crossing Design Guidelines 11/30/11
100
6. Culvert Elevation: Set the culvert elevation so the low and high flows for channel 1 backwater are at least as high as the water surface in the culvert. 2
7. Flood Capacity: Verify that the culvert span and rise are adequate to pass flood flow and 3 associated large wood and sediment. 4
8. Channel Profile: If necessary, adjust the upstream and/or downstream channel profiles 5 to match the culvert elevation. 6
Several iterations of Steps 4 through 8 may be required to achieve the optimum design. The 7 following sections describe each of the design steps in more detail. 8
The Hydraulic Design Option is based on the maximum water velocity that target fish species are 9 able to swim against as they negotiate the full length of the culvert. The longer the culvert, the 10 lower the maximum allowable velocity. Determine the overall length of the culvert. The length can 11 be minimized by adding headwalls to each end of the culvert, by narrowing the road or by 12 steepening the fill embankments. 13
FISH PASSAGE REQUIREMENTS 14 SPECIES AND SIZE OF FISH 15 The Hydraulic Design Option creates hydraulic conditions through the culvert that accommodate 16 the swimming ability and migration timing of target species and sizes of fish. Fish‐passage design is 17 based on the weakest species or size of fish requiring passage and is intended to accommodate the 18 weakest individuals within that group. The types of species that are potentially present and the 19 time of year when they are present can be obtained by contacting the Washington Department of 20 Fish and Wildlife Area Habitat Biologist or Regional Fish Biologist. 21
The passage of adult trout as small as six inches in fork length (150 mm) is a design requirement in 22 most areas of Washington State. It is assumed to be a requirement at each site unless it can be 23 shown that, by distribution of species or habitat, it is not justified. Upstream migration of juvenile 24 salmonids (50‐ to 120‐mm salmon and steelhead) and the myriad of non‐game fish is also 25 important. These fish are small and weak; therefore they require a very low passage velocity and a 26 low level of turbulence. Generally, the Hydraulic Design Option cannot usually satisfy the 27 limitations of very low velocity and turbulence. The exceptions are baffles and the roughened 28 channel methods when they are carefully designed and constructed. It has been shown that 29 juvenile coho (94‐104 mm) can swim upstream in a baffled culvert with reasonable success (up to 30 70% in a narrow range of discharge). These tests were limited to a culvert at a low slope (1.1%) 31 and the passage characteristics of higher gradient baffles is unknown (Pearson et al 2006). 32
Passage requirements are also unknown for the many resident fresh water species in Washington 33 streams. With this in mind, it is not practical to use the Hydraulic Design Option for all‐species fish 34 passage for the general case. Instead, either the no‐slope or stream simulation design option, or a 35 bridge, may be more appropriate where the crossing must pass all fish. All‐fish passage may not be 36 necessary in every situation; the biological needs at the site should be clearly stipulated by qualified 37 biological experts before a design is attempted. 38
In the past we believed that a culvert specifically designed by the Hydraulic Design Option for six‐39 inch trout would also provide passage for juvenile salmonids during lower flow conditions. If the 40

2nd Draft Water Crossing Design Guidelines 11/30/11
101
hydraulic characteristics necessary for adult trout passage are achieved during peak flows, it was 1 thought that adequate juvenile passage is provided at lesser flows. It is also believed that juvenile 2 fish can tolerate some delay; and, because of their normal migration timing, they will be subjected 3 to less severe hydraulic conditions than adult migrants. This assumption provided a background to 4 justify the use of the hydraulic method when it became obvious that simply adult passage was not 5 good enough for species recovery and maintenance. But it does not satisfy the requirement for 6 “fish” passage (RCW 77.57.030), as previously explained. 7
Much of this chapter is focused on the passage of salmonid fishes because they are culturally and 8 economically valuable. However, there are tremendous ecological benefits to providing 9 connectivity between upstream and downstream reaches for other biota and physical processes. In 10 addition to salmon and steelhead, there are at least 15 species of migrating fish in Washington State 11 for which there is little or no information regarding migration timing, migration motivation, or 12 swimming ability. Ecological health of both upstream and downstream reaches depends on 13 connectivity of physical processes such as sediment and debris transport, channel patterns and 14 cycles, and patterns of disturbance and recovery, as well as biological connectivity(Ward and 15 Stanford 1995; Jackson 2003). Stationary culverts at a fixed elevation may not be able to 16 communicate these processes and may, therefore, affect overall ecosystem health. 17
SPECIES AND SIZE OF FISH DETERMINE VELOCITY CRITERIA 18 The allowable velocity and depth of flow for adult fish depend upon the target species and length of 19 culvert as prescribed in WAC 220‐110‐070. Analysis for both velocity and depth should be 20 performed using a factor of safety. These criteria (see Table 6.1) are intended to provide passage 21 conditions for the weakest and smallest individuals of each species. 22
Table 61. Fishpassage design criteria for culvert installations. 23
Fish Passage Design Criteria for Culvert Installation 24
Criteria
Trout > 6 in.
(150mm)
Adult Pink
Salmon
Adult Chinook,
Coho, Sockeye, Steelhead
1. Velocity, Maximum (fps) Culvert Length (ft)
a. 10 – 60 4.0 5.0 6.0 b. 60 – 100 4.0 4.0 5.0 c. 100 – 200 3.0 3.0 4.0 d. > 20 0 2.0 2.0 3.0
2. Flow Depth Minimum (ft) 0.8 0.8 1.0 3. Hydraulic Drop, Maximum (ft) 0.8 0.8 1.0
25
2nd Draft Water Crossing Design Guidelines 11/30/11
102
Based on an evaluation of juvenile passage through culverts conducted by P. D. Powers (Powers and 1 Bates 1997), the recommended design velocities for fry and fingerlings are 1.1 and 1.3 fps 2 respectively. Fry are spring‐migrating juveniles generally less than 60 mm in fork length. 3 Fingerlings are fall‐migrating fish, generally greater than 60 mm in fork length. Powers noted that 4 allowable velocities for these fish depend upon the type of corrugation of the pipe. These velocities 5 are average cross‐section velocities and would apply to any length of culvert. He observed that the 6 fish swimming in waters flowing at these velocities could continue at that rate for an extended 7 period of time. These velocities might be achieved at some low‐gradient sites with large culverts or 8 at spring‐fed streams with low peak flows. 9
From work done by the Muckleshoot Indian Tribe Fisheries Division on the swimming ability of 10 juvenile salmon, a maximum velocity for passage was found to be 1.0 fps with a range of 0.5 to 2 fps. 11 This is based on 10 references (Kerr 1953; Wightman and Taylor 1976; Aaserude and Orsborn 1985; 12 Smith and Carpenter 1987; Bell 1991; Barber and Downs 1996; Rajaratnam and Katapodis 2002; 13 Lang 2008; Nordland 2008) 14
The complexity and diversity of natural channels are better suited to providing passage 15 opportunities for small fish. The natural channel design is the recommended option in this case; it 16 is described in the Chapter 3: Stream Simulation Design Option. 17
The Hydraulic Design Option uses the average velocity in the cross section of the flow (without bed 18 material) and assumes normal, open, channel flow throughout the culvert. In reality, flow is seldom 19 at normal depth throughout a culvert, particularly in a culvert that is on a relatively flat slope. 20 Backwater‐profile programs can be used to further refine the design. Keep in mind, however, that 21 errors from hydrologic calculations may far outweigh differences between velocity calculation 22 methods (see below and Appendix G: Design Flows). This design method also does not account 23 for the boundary‐layer velocities that fish will use in moving through a culvert. Boundary‐layer 24 velocities cannot be used because they are difficult to predict; turbulence can become a barrier, and 25 continuity of a boundary layer through a culvert is difficult to create. 26
MIGRATION TIMING 27 The Hydraulic Design Option criteria must be satisfied 90 percent of the time during the migration 28 season for the target species and age class. Since migration timings vary among species and 29 watersheds, knowledge of the specific migration timings is necessary for development of hydrology. 30 Different species or age classes at a site may migrate at different times of the year; multiple 31 hydrologic analyses may be needed to determine the controlling hydraulic requirements. 32 Generally, adult salmon and steelhead migrations occur during the fall and winter months. Juvenile 33 salmon migrations occur in the spring as fry and in the fall as fingerlings. 34
HYDROLOGY 35 Again, the hydraulic‐design criteria must be satisfied 90 percent of the time during the passage 36 season for the target species. The 10‐percent exceedance flow for each target species is then 37 considered the high fish‐passage design flow. Passage criteria must be met for all flows from zero 38 to the fish‐passage design flow. There is a growing body of evidence that adult salmon and 39 steelhead move at flows in excess of the 10 percent exceedance flow (Lang, Love et al. 2004). In fact, 40

2nd Draft Water Crossing Design Guidelines 11/30/11
103
it may be just these elevated flows that create the appropriate conditions for species such as coho 1 to penetrate deeply into the watershed. When applying the Hydraulic Method, it is prudent to look 2 at the performance of the design at the 2‐year recurrence interval flood flow. Transitions to and 3 from supercritical flow or high inlet losses at these flows could block migrating fish at a critical time 4 in their migration. 5
HIGH FISHPASSAGE DESIGN FLOW 6 In designing culverts for fish passage, the high‐flow hydrology of the stream must be understood to 7 make sure fish can get through the culvert during high flows. This requires a hydrologic analysis to 8 determine the high fish‐passage design flow. The mean daily flow is the parameter used for fish‐9 passage design flow analysis. There are four types of hydraulic analysis that are acceptable for 10 determining a range of fish‐passage designs that correctly address flow. The scale and importance 11 of the project and availability of data will dictate which level is applied to a specific project. They 12 are, in order of preference: 13
1. Stream gauging 14 2. Continuous‐flow simulation model 15 3. Local‐regression model 16 4. Regional‐regression model 17
Another option is to use data obtained from one of the above methods to calibrate a basin‐to‐basin 18 correlation between recorded flows in a nearby system and spot flows measured in the stream 19 system where design flows need to be determined. Extreme care should be used when creating this 20 correlation; the probability of induced errors increases. 21
There are errors associated with each of these methods and, considering the limited operational 22 range of some hydraulic options, these errors must be used in determining an appropriate design 23 flow. As shown in Appendix G, there are substantial errors in predicting flood flows even with a 24 long gauging record. 25
Interpretation of historic stream gauging data for a specific stream is the most preferred type of 26 analysis, but adequate data for specific sites are rare. For complex, high risk, and expensive 27 projects, a stream gage should be set up at the site for at least 2 years to accumulate baseline data. 28 This data can be used to determine flow duration with simple frequency analysis and compared to 29 longer records on gauged streams in the same region to determine if recent weather conditions are 30 anomalous. 31
To improve accuracy, a regional flow model can be verified and calibrated with a few flow data 32 points. Calibration data should be within 25 percent of the fish‐passage design flow to be valid. 33 Continuous‐flow simulation models are acceptable, though they are not normally justified solely for 34 a fish‐passage design. Single‐event models are generally not acceptable since the fish‐passage 35 design flow is based on a flow‐duration model rather than a peak flow. 36
For western Washington an acceptable, regional‐regression model is the Powers‐Saunders model, 37 which is included in Appendix G. It is based specifically on the hydrology of western Washington 38

2nd Draft Water Crossing Design Guidelines 11/30/11
104
streams and, therefore, cannot be used in other regions, nor for sites that do not fit within the range 1 of watershed sizes and climate parameters used in the regression analysis. 2
For eastern Washington, the Washington Dept. of Transportation (Rowland, Hotchkiss et al. 2002) 3 developed a model that defines a fish‐passage design flow per unit drainage area. Geographical 4 Information Systems were used to evaluate spatial data corresponding to the sixth field Hydrologic 5 Unit Code (HUC6), with the key parameters of mean annual precipitation, mean water stress index 6 and mean elevation. 7
These approaches produce reasonable estimates in most cases. However, consideration should also 8 be given to the specific hydrology of the basin, target species for fish passage and future watershed 9 conditions. It is recommended that, as a default, at least one standard deviation be added to the 10 estimated flows derived from the estimated mean that was found using these formulas, unless a 11 lower value can be justified by current and future watershed conditions. Lower values are justified 12 for streams that have a slow response to rainfall events, such as spring‐fed streams and basins with 13 a lot of storage available. Higher estimates for QHP should be applied to steeper and urbanized or 14 urbanizing watersheds, where land use and basin hydrology may change during the life of the 15 project, thereby affecting the maximum and minimum flows. 16
Whatever model is used, future watershed conditions should be considered when choosing the fish‐17 passage design flow. Continuous‐flow simulation models and calibrated regional models most 18 likely provide the best estimate of future conditions. Structural design of the culvert will depend on 19 an accurate analysis of flows higher than the high fish‐passage design flow. 20
LOW FISHPASSAGE DESIGN FLOW 21 The low design flow is calculated to determine the minimum water depth within the culvert. One 22 way of determining low design flow is to use the two‐year, seven‐day, low flow as described in WAC 23 220‐110‐070. A simpler option is to use the zero‐flow condition as described below. 24
The WAC 220‐110‐070 low flow requirement applies only to culverts without sediment inside. 25 Culvert backwatering and baffles are the techniques recommended in this chapter that do not 26 require sediment to be present. In these cases the minimum depth is maintained by rigid control 27 structures in the no flow condition. The remaining technique, roughened channel, uses bed material 28 to create roughness and is therefore exempt from this requirement. 29
CULVERTS IN TIDAL AREAS 30 The hydrology of culverts in tidal areas is a special case. The hydraulic conditions in the culvert and 31 downstream of the culvert change as the tide elevation changes. A complete discussion of this topic 32 can be found in Appendix D. 33
VELOCITY AND DEPTH 34 To keep the average cross‐section velocity inside the culvert at or below the velocity criteria, select 35 the appropriate combination of culvert size, roughness and slope. Several types of hydraulic 36 analyses are acceptable for determining the right combination; they vary in their complexity, 37

2nd Draft Water Crossing Design Guidelines 11/30/11
105
resulting factor of safety and cost for the final design. Stage‐discharge relationships can be 1 developed by simple calculations or complex water‐surface profiles. 2
The most simple analysis is the calculation of depth and velocity, assuming uniform flow; that is, 3 with no backwater influence. This is the depth and velocity generally derived from a calculation of 4 Manning’s roughness coefficient or from a chart of culvert‐hydraulic characteristics. 5
Calculate the depth and velocity. The depth will be matched to the hydraulic profile of the 6 downstream channel, as described later in the section addressing Baffles. 7
Computer backwater programs such as HEC‐RAS (U.S. Army Corps of Engineers 2006), HY8 (The 8 Office of Bridge Technology 2009), CULVERT MASTER®, FishXing (Furniss, Love et al. 2006), and 9 others, can assist in the design process. The minimum amount of information needed for these 10 programs varies with the program and complexity of the project. A backwater analysis allows the 11 designer to optimize the design by using the lower velocities created by the backwatered condition. 12 Without a backwater calculation, the culvert velocities are less accurate but more conservative. 13 HEC RAS is commonly used to do backwater analysis on culverts in the stream context. 14
BACKWATER 15 The backwater retrofit technique uses a downstream control structure to increase water depth in 16 the culvert thereby increasing cross sectional area in flow and a lower average velocity for a given 17 discharge. This technique was commonly practiced in the 1990s but has fallen out of favor for 18 several reasons: 19
• Grade control structures are rigid in dynamic stream systems and are prone to failure 20 • Grade control requires inspection and maintenance 21 • Certain grade control structures are impassible to some species and life stages of fish 22 • Culverts that are backwatered usually cannot adequately pass debris and sediment 23 • Land acquisition or an easement to construct grade control is expensive and not reliably 24
available 25
Grade control structures are discussed in detail in Chapter 7, Channel Profile Adjustment. 26
A culvert is backwatered for fish passage by following these steps: 27
1. Verify that the technique is approved for the site by contacting the Area Habitat Biologist at 28 your regional WDFW office. 29
2. Determine that the technique is applicable to the site. One simple way to do this is to 30 determine the fish passage design flow and divide it by the cross sectional area of the culver 31 half full. The result, in English units, should be less than 4 fps. If the culvert must be 32 backwatered more than half its rise, it is considered a high risk project, since the culvert will 33 tend to accumulate bedload when deeply backwatered. This accumulation of sediment 34 reduces the cross sectional area, requiring chronic maintenance, and is likely to be fouled 35 with debris and at risk of failure. 36
3. If culvert backwater is appropriate, then set the downstream control surface such that the 37 depth at the culvert inlet is greater than 0.8 ft at the 2‐year 7‐day low flow, or the zero flow 38

2nd Draft Water Crossing Design Guidelines 11/30/11
106
condition. Provided that the culvert has a positive downstream slope, this establishes the 1 minimum depth required by WAC 220‐110‐070, Table 1. If the outlet water surface is 2 greater than one half the culvert rise, the technique is not applicable for the reasons cited in 3 (2) above. 4
4. Next, calculate the maximum average velocity in the pipe at the fish passage design flow 5 (10% exceedance flow). This must be less than 4 fps. 6
5. Finally, the profile must be adjusted downstream of the culvert, as described in Chapter 7. 7
BAFFLES 8 Baffles are a series of features that, when added to a culvert, increase the hydraulic roughness of 9 the culvert. Unlike hydraulic‐control structures that work separately, such as weirs, baffles work 10 together to reduce the average cross‐section velocity inside the culvert. Flow passing over a series 11 of baffles during high‐water conditions creates a streaming pattern rather than, in the case of weirs, 12 a plunging pattern. To create streaming flow, the baffles have to be relatively close together and 13 short in length compared to the flow depth. Where baffles are applied, detailed stream gauging 14 needs to be used to assess stream hydrology. The quantitative design of baffle hydraulics includes 15 size and spacing, as described below. 16
At low flows, typical baffles do act as weirs, but they transition to roughness elements as the flow 17 deepens. Baffles have often been designed inappropriately to function as weirs. Weirs are discrete, 18 hydraulic elements that cause the flow energy to dissipate in the pools between them; this concept 19 is very different from constructing a series of baffles that act together to create roughness. When 20 baffles are designed to function as weirs, the fishway pool volume criteria must be complied with 21 (see DESIGN OF FISHWAYS FOR WASHINGTON STATE, 22 http://wdfw.wa.gov/publications/pub.php?id=00048). 23
Generally, baffles installed inside a culvert as a temporary retrofit to dissipate flow energy until a 24 permanent solution can be found. They are, under rare circumstances, appropriate for new or 25 replacement culverts when all other alternatives have been exhausted. Many culverts currently 26 undergoing retrofit to accommodate fish passage were designed only for hydraulic capacity. 27 Adding baffles reduces this capacity and may cause upstream flooding and unsafe headwater 28 elevations. The tendency for baffles to catch woody debris exacerbates the culvert capacity 29 problem, potentially creates a fish barrier and may eventually plug the culvert, leading to a road fill 30 failure. Because of the requirement for maintenance access, baffles should not be installed in 31 culverts with less than 5 feet of headroom, 6 feet for culverts in excess of 200 feet. The designer 32 should consider worker safety regulations when designing extremely long culverts since 33 maintenance will be required on at least an annual basis. 34
The need for frequent inspection and maintenance of baffled culverts is widely acknowledged, but 35 few maintenance programs establish the protocol or budget for adequate maintenance. Safe 36 passage through culverts is most critical for many salmonid species during freshets in the winter 37 months. This is the also the time of greatest risk of floods and the most voluminous presence of 38 debris. Maintenance is usually impossible during high‐flow fish‐passage seasons; so, if culverts fail 39 or plug, fish‐passage capability is lost when it is most needed. Baffles increase the likelihood of 40

2nd Draft Water Crossing Design Guidelines 11/30/11
107
culvert plugging or failure. And, since the baffles and the potential barriers are deep inside the 1 culvert where they can’t be seen easily, they are often not inspected at all. Please see Maintenance 2 and inspection plan for fishways, at the end of this chapter. 3
WSDOT CULVERT TEST BED JUVENILE SALMON BAFFLE STUDY 4 The Washington Dept of Transportation conducted tests on fish passage through a full scale baffled 5 culvert under test conditions in 2005 and 2006 (Pearson, Southard et al. 2006). Juvenile coho 6 salmon (94‐104 mm fork length) were allowed to volitionally move through a 40 foot long 6 foot 7 diameter baffled culvert set at a 1.1% slope. Various discharges were tested with batches of 100 8 fish. 9
While 34 separate test runs were performed, only 5 of them were with baffled culverts that were 10 properly backwatered. In the other 29 tests the most downstream baffle was not backwatered by 11 the water surface in the tailwater tank, and flow plunged off this baffle onto the floor of the culvert 12 creating a low depth, high velocity jet that shot into the tailwater tank, flushing many fish back as 13 they attempted to enter. Pearson et al calculated that this condition decreased passage 24%. As 14 discussed below, the downstream baffle is always backwatered so that no plunge occurs, clearly 15 improving passage. 16
The study was analyzed with parameters that are not the same as those used to design baffled 17 culverts as they are in these guidelines. The following table uses approximate values for the more 18 familiar parameters on the 5 runs using proper backwater. The energy dissipation factor (EDF) is 19 calculated as described below. 20
Table 6.2: Fish passage efficiency for two different discharges in the Culvert Test Bed study, (Pearson, 21 Southard et al. 2006). 22
Q Approx. normal depth
Approx. average velocity
EDF
Percent passage with baffles
Cfs ft fps ft‐lbs/ft3/s
3 0.85 1.7 1.2 70% 8 1.01 2.4 1.7 45%
23
A couple of observations can be made about these results relative to juvenile passage through 24 baffled culverts. 25
The slope of the test culvert was low and the baffles, since they were so widely spaced (15 ft), acted 26 somewhat independently. At higher slopes they act together and the passage characteristics are 27 likely different. 28
The results tell us that baffled culverts at this low slope do pass juvenile coho salmon. As shown in 29 Table 6.2, there is a fairly big difference in passage success for a relatively small change in velocity 30 and turbulence. This may be because fish are as sensitive to unmeasured environmental and 31

2nd Draft Water Crossing Design Guidelines 11/30/11
108
behavioral factors, such as tailwater tank conditions or migration cues, as they are to average 1 velocity. We may never know these things. When one looks at the bulk of the data from this study, 2 it shows that the best passage occurs over only a narrow range of discharge. Unfortunately, culverts 3 are placed on streams with highly variable discharge, therefore passage is poor most of the time 4 and good only occasionally, which may or may not coincide with the fish’s need to migrate. 5
It is a matter of debate whether the 70% success rate is good enough to satisfy the needs of a 6 healthy fish population. WAC 220‐110‐070 implies that passage for the weakest swimming fish 7 should occur 90% of the time during the migration period. But if the test culvert were to be used in 8 a real situation and designed using the 10% exceedance flow of 3 cfs, then not every fish that 9 attempted to pass upstream would be able to since only 70% can at 3 cfs. This baffled culvert 10 would then act as a filter for the fish populations upstream of the culvert, keeping back weaker fish 11 and passing the stronger upstream, reducing genetic diversity and resilience (Wofford, Gresswell et 12 al. 2005). 13
BAFFLE STYLES 14 In those situations where baffles are unavoidable, two basic styles of baffle are suggested; one for 15 round culverts and one for box culverts as shown in Figure 6.1. They are each designed with a 16 continuous alignment of the low flow point along one wall rather than alternating from one wall to 17 the other. This allows less resistance to high flows and an uninterrupted line of fish passage along 18 one or both sides. This is particularly important for weak fish, which would be forced to cross the 19 high‐velocity zone at every baffle in an alternating‐baffle design. The detail of angled baffles is 20 shown for box culverts; the continuously sloped baffle is generally used for juvenile fish passage 21 and in culverts six feet wide and less. 22

2nd Draft Water Crossing Design Guidelines 11/30/11
109
1
Figure 6.1: Recommended baffle styles for circular and box culverts showing dimensions used in 2 calculations. 3
Baffled culverts are generally limited to slopes equal to or less than 3.5 percent. This is based on 4 direct observation of existing baffle systems. Steeper slopes require either a stream simulation or a 5 fishway weir design. 6
Baffles installed in the area of the culvert inlet contraction may significantly reduce the culvert 7 capacity when it is in inlet‐control condition. The upstream baffle should be placed the distance of 8 at least one culvert‐diameter downstream of the inlet and should be high enough to ensure 9 subcritical flow at the inlet at the high design flow. In addition, the culvert bottom must remain 10 backwatered by the baffle to prevent supercritical thin flow over the invert. 11
BAFFLE HYDRAULICS 12 Baffles are added to culverts as roughness elements to reduce the internal water velocity to a level 13 acceptable for fish passage. There are three aspects of hydraulic analysis discussed here: velocity 14 and turbulence analyses for fish passage, and culvert capacity with baffles. Details of baffle 15 installation are also discussed. 16
The velocity of flow associated with culvert baffle systems can be derived from hydraulic laboratory 17 work conducted by several groups. N. Rajaratnam and C. Katopodis (Ead, Rajaratnam et al. 2002) 18 studied various combinations of baffle geometries, heights, spacings, slopes and flows in models of 19
Z
Z1
Z2
Circular Culvert Box Culvert
LL

2nd Draft Water Crossing Design Guidelines 11/30/11
110
circular culverts. Hydraulic‐model studies for weir baffles in box culverts were studied by R. 1 Shoemaker (Shoemaker 1956). These models can be used for both the fish‐passage velocity and 2 culvert‐capacity analyses. Rajaratnam and Katopodis developed flow equations for all the styles 3 they tested. Those equations are simplified here to the form of Equation 6.1. 4
Q = C(yo/D)a (gSoD5)1/2 Equation 6.1 5
Where: C = the coefficient that depends on the baffle configuration 6
D = the diameter of the culvert 7
a = the exponent that depends on the baffle configuration 8
Q = the discharge in cfs 9
yo = the depth of water 10
g = the gravitational acceleration in ft/sec/sec 11
So = the nondimensional slope of the culvert 12
Z = the height of the baffle (as shown in Figure 6.1) 13
The dimensions and their respective coefficients and exponents for Equation 6.1 are shown in 14 Table 6.2. The first column contains the labels of experimental baffles that were provided by the 15 authors; data for those without labels have been extrapolated. The difference in styles are 16 represented by the dimensions in the next two columns; Z is the average height of the baffle, L is the 17 spacing between baffles and D is the diameter of the culvert. The limits shown in the table are the 18 limits of experimental data or valid correlation for the coefficients and exponents. 19
Table 6.3: Baffle hydraulics. 20
Z L C a Limits WB‐2 0.15D 0.6D 5.4 2.43 0.25 y0/D < 0.8 WB‐1 0.15D 1.2D 6.6 2.62 0.35 y0/D < 0.8
0.15D 2.4D 8.5 3 WB‐3 0.10D 0.6D 8.6 2.53 0.35 y0/D < 0.8 WB‐4 0.10D 1.2D 9 2.36 0.20 y0/D < 0.8
0.10D 2.4D 9.6 2.5 Using Equation 1, calculate the depth of flow. The resulting velocity is the flow divided by the 21 cross‐section flow area between the baffles. 22
The weir baffles studied by Rajaratnam and Katopodis (Ead, Rajaratnam et al. 2002) were actually 23 horizontal weirs, rather than sloping baffles as shown in Figure 6.1. This is the most reliable 24 information available for predicting the roughness of baffles recommended in this guideline and 25 must be used with sound judgement. Box culverts were not included in this study. The models 26 presented below for culvert capacity with baffles can be used for fish‐passage analysis in box 27 culverts. 28

2nd Draft Water Crossing Design Guidelines 11/30/11
111
Hydraulic model studies for weir baffles in square box culverts were studied by Shoemaker 1 (Shoemaker 1956) Internal‐culvert friction loss and entrance losses were calculated from hydraulic 2 model studies. Shoemaker used the Darcy‐Weisbach friction equation (Equation 8.2) as a 3 hypothetical model for culverts with baffles: 4
HW = (Ke + Ce + f Lc/D)V2/2g +P ‐ SoLc Equation 6.2 5
Where: f = the friction coefficient 6
Lc = the length of the culvert 7
D = the diameter of pipe (four times the hydraulic radius 8
of noncircular pipes) 9
V2/2g= the gross section velocity head in the culvert where V is the average velocity in 10 ft/sec 11
P = the outlet water‐surface elevation 12
So = the slope of the culvert 13
Ke = culvert entrance head‐loss coefficient 14
Ce = culvert exit head‐loss coefficient 15
The baffles tested were full‐width, level baffles with rounded leading edges at a radius equal to one 16 tenth of the culvert height. Baffle heights of 0.10, 0.20 and 0.30 times the culvert height and 17 spacings of 1.0, 2.0 and 4.0 times the culvert height were studied. 18
Shoemaker’s variation of the Darcy‐Weisbach friction factor is depicted in Figure 6.2, where Z is 19 the baffle depth and L is the baffle spacing. 20

2nd Draft Water Crossing Design Guidelines 11/30/11
112
1
Figure 6.2: Variation of Darcy Weisback friction factor with baffle spacing. 2
Friction factors for short baffle spacings should be used cautiously. As would be expected, as the 3 baffle spacing approaches zero, the baffle roughness actually decreases and the effective cross‐4 sectional area of the culvert becomes the area of the culvert remaining above the baffles. 5 Shoemaker, in his calculation of velocity head, used the gross culvert area. 6
A second analysis by Shoemaker is intended specifically for estimating culvert capacity. It provides 7 a means for evaluating other energy components making up the hydraulic grade line through a 8 culvert. Shoemaker made the assumption that entrance, outlet and friction losses are proportional 9 to the velocity head. With these assumptions, the energy equation for flow through the culvert can 10 be written using Equation 2, where HW is the headwater elevation above the invert at the culvert 11 entrance. Other parameters are as previously defined. Shoemaker describes a reasonable 12 approximation of P as the distance from the culvert invert to the center of the flow in the opening 13 above a baffle. 14
Shoemaker derived the combined values of the head loss coefficients Ke and Ce as a single 15 coefficient, Ca, which is shown in Figure D‐3 as a function of baffle spacing and height. In 16 Shoemaker's model, the culvert entrance and exit had aprons extending 2.5 times the culvert width, 17 with wing walls flaring at 34 degrees from the culvert line, mitered at a 2:1 slope. The baffle that 18 was furthest upstream was consistently placed one culvert height downstream from the culvert 19 entrance and the downstream‐most baffle was placed at the edge of the apron. 20
Energy Dissipation Factor 21
0
0.05
0.1
0.15
0.2
0 0.5 1 1.5 2 2.5 3 3.5 4
L/D
Frictio
n Factor Z/D = 0.3
Z/D = 0.2
Z/D = 0.1
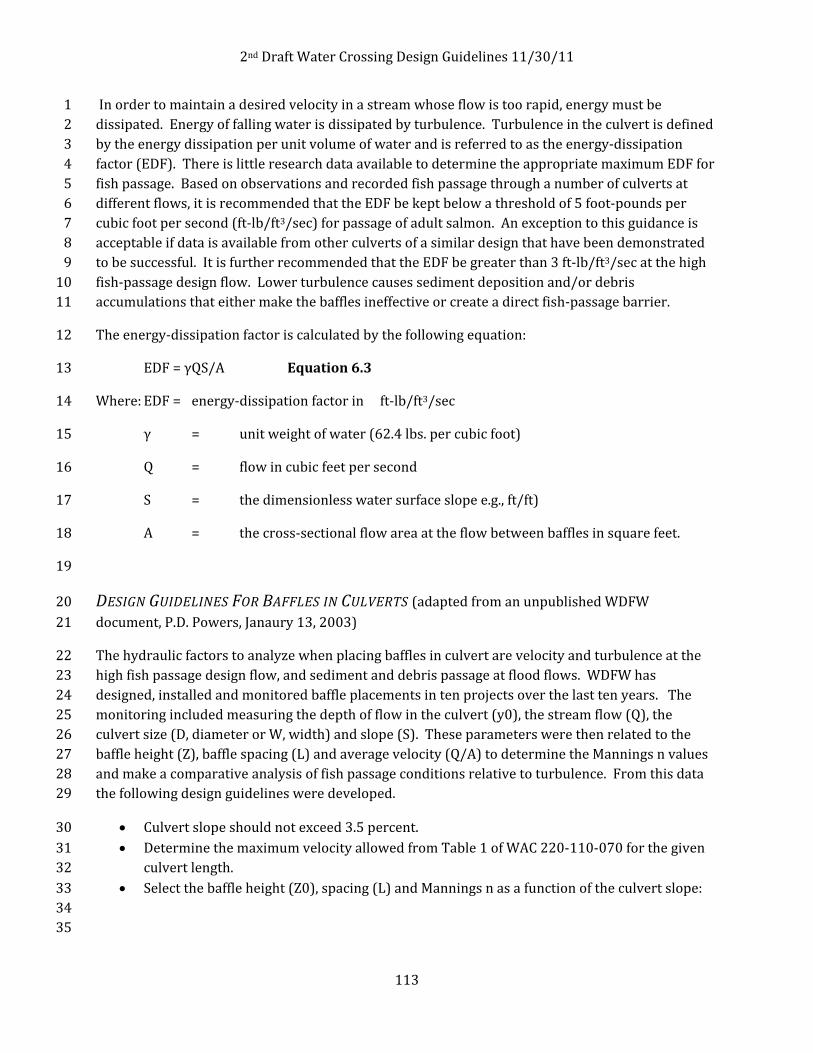
2nd Draft Water Crossing Design Guidelines 11/30/11
113
In order to maintain a desired velocity in a stream whose flow is too rapid, energy must be 1 dissipated. Energy of falling water is dissipated by turbulence. Turbulence in the culvert is defined 2 by the energy dissipation per unit volume of water and is referred to as the energy‐dissipation 3 factor (EDF). There is little research data available to determine the appropriate maximum EDF for 4 fish passage. Based on observations and recorded fish passage through a number of culverts at 5 different flows, it is recommended that the EDF be kept below a threshold of 5 foot‐pounds per 6 cubic foot per second (ft‐lb/ft3/sec) for passage of adult salmon. An exception to this guidance is 7 acceptable if data is available from other culverts of a similar design that have been demonstrated 8 to be successful. It is further recommended that the EDF be greater than 3 ft‐lb/ft3/sec at the high 9 fish‐passage design flow. Lower turbulence causes sediment deposition and/or debris 10 accumulations that either make the baffles ineffective or create a direct fish‐passage barrier. 11
The energy‐dissipation factor is calculated by the following equation: 12
EDF = γQS/A Equation 6.3 13
Where: EDF = energy‐dissipation factor in ft‐lb/ft3/sec 14
γ = unit weight of water (62.4 lbs. per cubic foot) 15
Q = flow in cubic feet per second 16
S = the dimensionless water surface slope e.g., ft/ft) 17
A = the cross‐sectional flow area at the flow between baffles in square feet. 18
19
DESIGN GUIDELINES FOR BAFFLES IN CULVERTS (adapted from an unpublished WDFW 20 document, P.D. Powers, Janaury 13, 2003) 21
The hydraulic factors to analyze when placing baffles in culvert are velocity and turbulence at the 22 high fish passage design flow, and sediment and debris passage at flood flows. WDFW has 23 designed, installed and monitored baffle placements in ten projects over the last ten years. The 24 monitoring included measuring the depth of flow in the culvert (y0), the stream flow (Q), the 25 culvert size (D, diameter or W, width) and slope (S). These parameters were then related to the 26 baffle height (Z), baffle spacing (L) and average velocity (Q/A) to determine the Mannings n values 27 and make a comparative analysis of fish passage conditions relative to turbulence. From this data 28 the following design guidelines were developed. 29
• Culvert slope should not exceed 3.5 percent. 30 • Determine the maximum velocity allowed from Table 1 of WAC 220‐110‐070 for the given 31
culvert length. 32 • Select the baffle height (Z0), spacing (L) and Mannings n as a function of the culvert slope: 33
34 35

2nd Draft Water Crossing Design Guidelines 11/30/11
114
Culvert Slope (ft/ft)
Baffles Height (Z)
Baffle Spacing (L)
Mannings n
0.005 to 0.009 6 to 8 inches 0.10/slope 0.04 ‐ 0.05 0.010 to 0.024 8 to 10 inches 0.15/slope 0.06 ‐ 0.07 0.025 to 0.035 10 to 12 inches 0.20/slope 0.08 ‐ 0.09
1 • Calculate the high fish passage design flow 2 • Using Mannings equation, calculate the normal flow depth (y0) and the velocity (V). 3 • If the baffle height (Z) divided by the flow depth (y0) is in the range of 0.4 to 0.6, calculate 4
the velocity (V) and compare it to maximum allowable velocity in Table 1 of WAC 220‐110‐5 070. If the calculated velocity is less than or equal to the allowable velocity the next step is 6 to check the energy dissipation factor. 7
Note: If (Z0/y0) is less than 0.4, the flow depth over the baffle is significantly more than the baffle 8 height and the flow will begin to short circuit and reach supercritical conditions. Fish passage 9 velocities will likely be exceeded at this point. If (Z0/y0) is greater than 0.6, the baffle may be too 10 high and will increase the risk of capturing bedload and woody debris. The baffle height can be 11 increased to a maximum of 12 inches, to make the Z0/y0 ratio reach 0.4. Mannings n varies slightly 12 as the height of the baffle increases. Baffle heights greater that 12 inches become weirs and need 13 to be analyzed as a pool and weir fishway considering energy dissipation. 14
The energy dissipation factor (EDF) should be in the range of 3 and 5. Too low of an EDF may cause 15 problems with sediment buildup within the culvert and too high of an EDF will likely create 16 turbulent conditions inside the culvert which may reduce passage success. Turbulence and the 17 effect on fish passage through culverts is not well understood at this time, but until more 18 information is gathered the 3 to 5 range is recommended. 19
By adding baffles to the culvert, the roughness is increased. If the culvert is flowing under outlet 20 control, the increased roughness will increase headwater elevation. The 100 year peak flood flow 21 should be analyzed for potential impacts. The friction loss through the barrel of the culvert should 22 be analyzed using a Mannings n from 0.02 to 0.03 if the culvert is flowing near full. 23
Passage of juvenile fish using these design guidelines at the high fish passage design flow for adult 24 fish is not practical (velocities and turbulence). Most often though the pools between the baffles 25 provide twice as much pool volume as is needed when looking at the pool volume criteria (See 26 Design of Fishways for Washington State) 27
28
BAFFLE INSTALLATION 29 Nearly all baffle installations are damaged at one time or another over their life spans. During 30 floods large wood and bedload pummel the baffles and sooner or later they are abraded, dented, or 31 dislodged. Even the best installations deteriorate over time. In addition, all baffles are prone to 32 accumulating debris and cobble and must be cleaned out; their design should facilitate this 33 maintenance. 34

2nd Draft Water Crossing Design Guidelines 11/30/11
115
In concrete culverts the best design is a cast in place baffle. Rebar dowels are placed in drilled holes 1 in the culvert wall and tied into the baffle reinforcement and the baffle is formed around the 2 reinforcement. This is a relatively uncommon technique. More often in retrofits, bent steel plates 3 are used, with one leg bolted to the floor and pointing downstream. Gussets are added to stiffen and 4 strengthen baffles. Bolt anchor systems for existing culverts are difficult to install and, 5 consequently, often fail. The anchoring systems should be carefully designed and installed by 6 experienced crews. 7
In new corrugated metal culverts a steel plate baffle is let into a slot cut in the culvert bottom and 8 welded in place. In the smooth steel pipe used in trenchless installations (jacking, boring, or other 9 techniques), the baffle is cut from steel plate and welded with a continuous bead directly inside the 10 culvert after the pipe is installed. 11
Generally, ¼ inch steel plate is used for conservative design and long baffle life. Thicker plate 12 should be used in areas with corrosive water or high bed‐load movement. 13
Expansion‐ring anchors have been used in round pipes and can be installed without diverting flow 14 from the work area. These baffles are prone to failure in larger streams and culverts and should be 15 used only for short term fish passage, with the understanding that the culvert will be replaced 16 within a year or two. With this type of installation, the rings are expanded out against the entire 17 pipe circumference. A rod is rolled to the shape of the culvert interior and attached to an anchor 18 plate. The rod and anchor plate are attached to the culvert by expanding the rod into the recess of a 19 corrugation. This is done by tightening a nut on one end of the rod against a sleeve attached to the 20 other end of the rod. Once the rod and anchor plate are secured, the baffle is bolted to the anchor 21 plate. 22
23
24
25
26
27
28
29
30
31
32
33

2nd Draft Water Crossing Design Guidelines 11/30/11
116
ROUGHENED CHANNEL 1
2
Figure 6.3: Roughened channel inside a culvert (photo Paul Tappel). 3
Roughened channels have been defined, designed and constructed in a wide variety of ways both in 4 Washington and in Canada, Europe and Australia, Figure 6.3. They are used inside culverts, in the 5 main channel, and in partially spanning installations. The basic, unifying concept is an artificial 6 channel constructed to increase prevailing stream gradient. This is done for various purposes, 7 chiefly for: 8
• Habitat restoration (create spawning habitat, increase dissolved oxygen, etc) 9 • Channel restoration (restore complexity, reconnect floodplain) 10 • Grade control (irrigation diversions, pipline crossings) 11 • Fish passage retrofits 12 • Culvert design 13
Several recent papers have been written concerning the design of roughened channels, which are 14 cited in the references below, and further described in two recent papers (Bates and Aadland 2006; 15 Bates and Love 2011). 16
For our purposes, roughened channels consist of a graded mix of sediment built into a culvert to 17 create enough roughness and hydraulic diversity to achieve fish passage. Increased roughness 18 creates diversity in flow velocities and patterns, which, in turn, provides migration paths and 19 resting areas for a variety of fish sizes (Thorncraft and Harris 1996). 20

2nd Draft Water Crossing Design Guidelines 11/30/11
117
The stream simulation design option (see Chapter 6) is a much more conservative culvert design 1 method and does not require the level of analysis necessary for roughened channels. Stream 2 simulation is the preferred design method, since it addresses many of the geomorphological 3 considerations mentioned in the beginning of this guideline, whereas roughened channels only 4 consider adult salmonid passage and grade control as the design criteria. Generally, the bed 5 material in a roughened channel is not intended to be mobile; the bed may shift slightly as a 6 stability adjustment, it is not meant to scour and wash away. In contrast, the stream simulation 7 design option accommodates channel shifts as they occur in the natural stream. This rigidity causes 8 problems in a stream which may adjust vertically over time; an abrupt drop will develop at the 9 outlet if the downstream channel degrades. 10
This design technique can be used for the creation of channels outside of culverts too, although this 11 should be approached cautiously. Reasons for using them outside of a culvert include: controlling 12 gradient, restoring an incised channel, habitat for certain fish species and culvert backwater. Some 13 of these applications are discussed in Chapter 7, Channel Profile Adjustment. If roughened 14 channels are located downstream of a fixed structure, such as a culvert, any degradation will cause 15 the culvert depth or velocity criteria to be exceeded. 16
17
Figure 6.4: Crazy Ck roughened channel, constructed 1994. 18
19

2nd Draft Water Crossing Design Guidelines 11/30/11
118
Installations of this technique inside of culverts have had mixed results with regard to fish passage 1 and stability. This is mostly due to the evolving nature of the design method over the years, but 2 because of this, culverts designed as roughened channels should be approached cautiously. Each 3 situation is different and what has worked in one context will not necessarily work in another. 4
Large‐scale roughness is used to control velocity within the culvert. Ideally, channels are 5 roughened to the point where the potential energy available at the upstream end is dissipated in 6 turbulence through the pipe, and no excess kinetic energy of flow is present at the downstream end. 7 It should be recognized that culverts designed as roughened channels will have greater slope and 8 flow per unit width than the adjacent upstream channel and, therefore, higher bed stress, 9 turbulence and velocity. As a result, roughened‐channel culverts have higher sediment‐transport 10 rates than the natural stream and tend to become scoured and, unless carefully designed, fail 11 prematurely. This situation is less likely where roughened channels are built without the 12 confinement of culvert walls. 13
DESIGN OF ROUGHENED CHANNELS 14 The design process described here is complex and requires substantial knowledge of hydraulic 15 modeling, sediment transport, sediment gradation specifications, channel construction techniques 16 and geomorphology. 17
The most important aspects to consider in the design of roughened channels are: 18
• Average velocity at flows up to the fish‐passage design flow. Maximum average velocity 19 is a basic criteria of the Hydraulic Design Option. 20
• Bed stability during the 100‐year recurrence interval flow event. The bed materials 21 inside the culvert create the fish‐passage structure. Their stability is fundamental to the 22 permanence of that structure. 23
• Turbulence; the effect of turbulence on fish passage can be approximated by limiting the 24 energy dissipation factor (EDF). 25
• Bed porosity; in order for low flows to remain on the surface of the culvert bed and not 26 percolate through a course permeable substrate, bed porosity must be minimized. 27
The following is an outline of a suggested procedure for designing roughened channels. These steps 28 are iterative; several trials may have to be calculated to determine a final acceptable design. 29 (Additional details of these steps are provided in subsequent sections.) 30
1. Assume a culvert span. Begin with a culvert bed width equal to the stream channel 31 width (Appendix C). When the width of the bed in roughened channel culverts is less 32 than the bed width of the stream, hydraulic conditions are more extreme and the 33 channel inside the culvert is more likely to scour. As gradient and unit discharge 34 increase, the best way to achieve stability and passability is to increase the culvert 35 width. In addition, debris, sediment transport and the passage of non‐target fish and 36 wildlife should be considered, all of which benefit from increased structure width. 37
2. Size the bed material for stability on the basis of unit discharge for the 100‐year event 38 (Q100), as outlined below. 39

2nd Draft Water Crossing Design Guidelines 11/30/11
119
3. Check to see that the largest bed‐particle size, as determined by stability, is less than 1 one quarter the culvert span. If not, increase the culvert width, which decreases the unit 2 discharge and, in turn, the particle size. 3
4. Create a bed‐material gradation to control porosity (see section on well‐graded mixes in 4 Chapter 3). 5
5. Calculate the average velocity and EDF at the fish‐passage design flow on the basis of 6 culvert width and the bed D84 from gradation in Step 4 above. If the velocity or EDF 7 exceed the criteria, increase the culvert span. 8
6. Check the culvert capacity for extreme flood events. This step is not detailed here, but it 9 is required, just as it is for any new culvert or retrofit culvert design that affects the 10 culvert’s capacity. 11
BED STABILITY 12 In order for the roughened channel to be reliable as a fish‐passage facility, it is essential that the 13 bed material remain in the channel more or less as placed. It is expected that the bed material will 14 shift slightly but not move any appreciable distance or leave the culvert. Bed stability is essential 15 because these channels are not alluvial. Since they are often steeper and more confined than the 16 natural, upstream channel, recruitment of larger material cannot be expected. Any channel bed 17 elements lost will not be replaced, and the entire channel will degrade over time. The 100‐year 18 flood is suggested as a high structural‐design flow, although other design flows can be substituted 19 as required. 20
Bed‐stability considerations, rather than fish‐passage velocities, usually dominate the design of the 21 bed‐material composition. It is, therefore, recommended that bed‐stability analysis be performed 22 before calculating the fish‐passage velocity. At this time, there are no procedures that can 23 determine the specific size of bed material needed to meet the slope and discharge for steep, 24 roughened channels. In the case of the stream simulation design option we can use natural analogs 25 or models of natural systems to reliably estimate bed‐material size (see Chapter 3). Roughened 26 channels, on the other hand, increase hydraulic forces due to constriction and increased slope. 27 Unfortunately we do not have a factor to relate the two and must resort to other methods. Two 28 general methods are reviewed here: 29
• the U.S. Army Corps of Engineers steep slope riprap design, 30
• the critical‐shear‐stress method, 31
U.S. ARMY CORPS OF ENGINEERS RIPRAP DESIGN 32
U.S. Army Corps of Engineers reference, EM 1110‐2‐1601, Section e., steep slope riprap 33 design(Corps of Engineers. 1994), gives this equation (Equation 6.4) for cases where slopes range 34 from two to 20 percent, and unit discharge is low. 35
D30 = 1.95S0.555(1.25q)2/3/g1/3 Equation 6.4 36
37

2nd Draft Water Crossing Design Guidelines 11/30/11
120
Where: 1
D30 = the dimension of the intermediate axis of the 30th percentile particle 2
S = the bed slope 3
q = the unit discharge 4
g = acceleration due to gravity. 5
The recommended value of 1.25 as a safety factor may be increased. The study from which this 6 equation was derived cautions against using it for rock sizes greater that 6 inches (Abt, Wittler et al. 7 1988). The equation predicts sizes reasonably in hypothetical situations above this, but it has not 8 been specifically tested in real applications. 9
The U.S. Army Corps of Engineers recommends angular rock with a uniform gradation (D85/D15 = 10 2). This material is not preferred for use in a fish‐passage structure (see the section on bed 11 porosity, below). An approximate factor to scale D30 of a uniform riprap gradation for one that is 12 appropriate for stream channels is 1.5, so that, D84 = 1.5 D30, where D84 is the dimension of the 13 intermediate axis of the 84th percentile particle, and similarly for the 30th percentile. 14
CRITICAL‐SHEAR‐STRESS METHOD 15
Critical shear stress is a time‐honored method to estimate the initial movement of particles. Several 16 researchers have said that critical shear stress should not be applied to steep channel (Bathurst 17 1978; Olsen, Whitaker et al. 1997), although others (Mussetter 1989; Wittler and Abt 1995)have 18 used it. The Federal Highway Administration, developed a channel‐lining design method based on 19 critical shear stress, with data from flume and field studies(Norman 1975). The data is largely from 20 low‐gradient situations, but the design charts show slopes up to 10 percent and particle sizes up to 21 1.9 feet, which places it in the range of designed roughened channels. 22
The condition of stability is defined as the point at which the critical shear stress, τc, equals the 23 maximum shear stress, τ max, experienced by the channel. 24
The critical shear stress is the shear stress required to cause the movement of a particle of a given 25 size and is equal to four times D50, where D50 is the 50th percentile particle, in feet. This 26 relationship implies a critical, dimensionless shear stress of about 0.039. (Mussetter 1989) and 27 (Wittler and Abt 1995) used 0.047. J. M Buffington and D. R. Montgomery (Buffington and 28 Montgomery 1999) discuss the range of τc. The maximum shear stress is 1.5 times γRS, where γ is 29 the unit weight of water, R the hydraulic radius and S the slope. 30
As the width of the roughened channel culvert decreases relative to the width of the channel, flow 31 intensity increases, and inlet contraction plays a role in stability. The bed‐material design 32 techniques account for increases in intensity, but they do not include inlet contraction as a factor. 33 Small increases in head loss at the inlet can result in changes in velocity large enough to 34 significantly change bed‐material size estimates. Head loss of 0.1 foot represents an approximate 35

2nd Draft Water Crossing Design Guidelines 11/30/11
121
1.8 feet/sec velocity increase (h = KV2/2g, K = 0.5) at the inlet, possibly forcing supercritical flow 1 (see next paragraph). 2
The movement of bed material in natural, steep channels is thought to coincide with supercritical 3 flow (Grant, Swanson et al. 1990). If, by decreasing the width of a culvert, the Froude number is 4 caused to approach 1.0 at flows below those used to size the particles, then it is likely that the bed 5 may fail prematurely. Unfortunately, most of the roughness‐factor models were specifically 6 developed for subcritical flow; it is, as a result, difficult to determine how flow velocity approaches 7 supercritical flow. K. J. Tinkler (Tinkler 1997) used an approach that calculates a specific Manning’s 8 n for the critical case, as a function of slope and depth. The Limerinos equation (Limerinos 1970) 9 (shown below in the section on velocity) follows this closely when it is determined that the bed 10 roughness approximates a natural channel. 11
In cases where inlet contraction is minimal and flow inside the culvert is not expected to go 12 supercritical prematurely, it is recommended that the U.S. Army Corps of Engineers’ Equation 6.4 13 for steep channels be used to size bed material for roughened channels. This recommendation is 14 made even though the equation was not considered applicable for particles over six inches in 15 diameter. It still gives results in line with what we might expect to find in steep channels. 16
In addition to the methods mentioned here, theoretical work has been done by a number of 17 researchers on the initial movement and general bedload discharge in steep, rough natural 18 channels. Citations are shown in the references section at the end of this chapter (Nelson, Emmett 19 et al. ; Wiberg and Smith 1987; Grant, Swanson et al. 1990; Wiberg and Smith 1991) 20
It is not recommended that culverts with bed material inside be designed to operate in a 21 pressurized condition under any predicted flow. The riprap design methods suggested here 22 assume open channel flow. They were not developed for high velocity and turbulence under 23 pressure. Under most scenarios, it is assumed that minimum width requirements and fish‐passage 24 velocity criteria will be the limiting factors in design, not high flow capacity. But there may be cases 25 where an unusual combination of events creates a situation where headwater depth exceeds the 26 crown of the culvert. In such a case a conservative stability analysis would model the culvert using 27 a complete culvert analysis program and/or a backwater model. The hydraulic results could then 28 used to estimate shear stress conditions and determine a stable rock size. 29
FISHPASSAGE VELOCITY 30 The point of roughening the channel is to create an average cross‐sectional velocity within the 31 limits of the fish‐passage criteria and the Hydraulic Design Option. The average velocity of a 32 roughened channel culvert is essentially a function of 33
• Stream flow, 34
• Culvert bed width, and 35
• Bed roughness. 36

2nd Draft Water Crossing Design Guidelines 11/30/11
122
The flow used to determine the fish‐passage velocity is the fish‐passage design flow as described in 1 the Hydrology section above. As a design starting point, the width of the culvert bed should be at 2 least the width of the natural stream‐channel bed. 3
Steep and rough conditions present a unique challenge for hydraulic modeling. Traditional 4 approaches to modeling open‐channel flow assume normal flow over a bed having low relative 5 roughness. In roughened channels, the height of the larger bed materials are comparable with the 6 flow depth and complex turbulence dominates the flow(Wiberg and Smith 1987). A number of 7 equations are available for an analysis of these conditions, but they are crude and generate widely 8 varying results. Research to date has centered on estimating flow in natural, cobble/boulder 9 streams and is not intended for use in engineering artificial channels. 10
Three researchers have used bed‐material characterization and/or channel geometry to create 11 empirical equations predicting roughness: (Jarrett 1984), (Limerinos 1970) and (Mussetter 1989). 12 Generally, the conclusion one can draw from these studies is that friction factors in steep, rough 13 channels are much larger than those found in lower‐gradient streams. This conclusion is not 14 surprising but it is notable just how high the roughness factors are. For instance, in Mussetter’s 15 field data on steep channels, 75 percent of the Manning’s n values exceed 0.075, the highest n 16 featured in H. H. Barnes’ Roughness Characteristics of Natural Channels, (Barnes 1967) which 17 covers larger, lower‐gradient streams. It remains unclear as to how natural channels compare to 18 constructed, roughened channels. 19
In general, the relationship between velocity and roughness is given by, 20
V/(gRS)1/2 = R1/6/(ng)1/2 = (8/f)1/2 Equation 6.5 21
Where: V = the average velocity 22
g = the acceleration due to gravity 23
R = the hydraulic radius 24
n = Manning’s roughness factor 25
f = the Darcy‐Weisbach friction factor. 26
S = the friction slope of the channel 27
The use of n or f depends upon convention, but the Darcy‐Weisbach equation accounts for the 28 reduction in roughness with increasing depth, whereas Manning’s equation does not. 29
Below is Limerinos’ equation (Limerinos 1970) 30
n = (0.0926R1/6)/(1.16 + 2log(R/D84)) Equation 6.6 31
Where: D84 = the dimension of the intermediate axis of the 84th percentile particle. 32

2nd Draft Water Crossing Design Guidelines 11/30/11
123
This equation is based on data where 0.9<R/D84 <69 and 0.02<n<0.107. The error range for n/R1/6 1 is +42.9 percent to ‐33.7 percent. Limerinos’ equation seems to produce a more accurate prediction 2 in higher‐velocity situations. It is likely to give smaller roughness values in lower‐flow situations 3 than Mussetter’s equation, derived from data collected in California Rivers. 4
Below is Jarrette’s equation, (Jarrett 1984) 5
n = .039Sf0.38R‐0.16 Equation 6.7 6
Where: Sf = the friction slope of the channel. 7
This is based on data where the slope is between 0.002 and 0.04, although predictions may extend 8 to 0.0825 and where 0.4<R/D84<11 and 0.03<n<0.142. Jarrette’s equation does not include 9 sediment size as a variable. It is implied that, as slope increases, sediment size increases and so 10 does roughness. Because sediment size is not included, the error range of n on the test data is wide, 11 +44 percent to +123 percent. In constructed channels, there is no such relationship between slope 12 and particle size. Jarrette is included here as a comparison with the other methods where the 13 average velocity is less than three fps. 14
Below is Mussetter’s equation, (Mussetter 1989) 15
(8/f)1/2 = 1.11(dm/D84)0.46 (D84/D50)‐0.85 Sf‐0.39 Equation 6.8 16
Where: dm is the mean depth. 17
It is derived from data where 0.0054<S<0.168, 0.25<R/D84<3.72, 0.001<f<7.06 (0.036<n<4.2). 18 Since a relatively large amount of information is included in this equation, the error range on the 19 test data is small, +3.8 percent to +12 percent. The equation is derived from data collected in 20 Colorado mountain streams. Sediment distributions in these streams were very similar to those 21 found in Washington, and they were similar to the distributions recommended in this guideline. 22 Accuracy decreases where velocity is greater than about 3 fps so that this equation should only be 23 used for calculating fish‐passage velocity, not flood level flows. 24
These equations include all the roughness characteristics of natural channels, not just boundary 25 roughness due to grain resistance. This means that, as the design channel differs from the diversity 26 of natural channels, roughness estimates must be decreased. For instance, culvert walls offer little 27 real resistance since they are very smooth and straight. 28
The design and construction of roughened channels must be done in such a way that roughness is 29 maximized and natural channel planform and profile are emulated. Otherwise resistance equations 30 based on natural channels will under predict the true velocity, and fish passage may not be 31 successful. 32
A convincing argument states that channels, left to their own devices, form boundaries that create 33 maximum resistance to flow(Davies 1980; Davies and Sutherland. 1980; Davies and Sutherland. 34 1980). There is an implied relationship between the measured resistance to flow and the natural 35 tendency to maximize resistance. 36

2nd Draft Water Crossing Design Guidelines 11/30/11
124
In artificial channels, we may or may not create maximum roughness during the design and 1 construction process. This leaves our velocity estimates subject to considerable doubt when they 2 are based on roughness values tied to natural conditions. 3
A riprap surface pounded into place without any steps and pools is hydraulically very smooth and 4 certainly nothing like a natural channel. Yet, based on a characteristic particle size of the 5 riprap material used, say D84, flow velocity estimates using Mussetter’s resistance equation would 6 be only a fraction of those that would occur in this channel. 7
It is important to obtain a copy of the relevant articles cited in this chapter to make sure that the 8 basis and limitations of these equations are fully understood prior to design. It is also important to 9 note that even though many roughened channels have been constructed here in Washington State 10 and elsewhere, they have not been systematically monitored and these equations field‐verified. 11
BED CONFIGURATION 12 The structure of roughened channel beds has evolved over the years of practice. Initially, the profile 13 of higher gradient channels was designed like natural step‐pool channels. It is now obvious that 14 steps formed from a single row of larger stones are relatively fragile. In a natural channel, if a step 15 fails and is reformed at a lower elevation, or precipitates the failure of a series of steps, there are no 16 lasting consequences. But if this were to happen inside a culvert with no similar sized material 17 available from upstream, the culvert bed may not recover and the fishway may shift out of 18 compliance with criteria and upstream habitat or infrastructure may be affected. 19
A series of cascades is a much more robust profile configuration. The cascades form a redundant 20 grade control structure where the movement of an individual rock does not affect the overall 21 gradient. This type of grade control is discussed in more detail in Chapter 7. 22
Figures 6.5 – 6.8 are examples of roughened channels. They are generally of the cascade type 23 where the bed is uniformly covered with large rock creating high relative roughness ‐ depth is 24 shallow with respect to the characteristic bed material size (Bathurst 1978). Notes about these 25 sites are contained in the captions. 26

2nd Draft Water Crossing Design Guidelines 11/30/11
125
1
Figure 6.5: Fulton irrigation diversion with roughened channel. Irrigation intake is to the left in the 2 photo. This type of roughened channel is often referred to as a rock ramp and its design has been 3 described by Aadland (Bates and Aadland 2006) and Newberry (Newbury and Gadoury 1994). 4
5
Figure 6.6: Roughened channel culvert in California, photo Michael Love and Associates. Bed is 6 composed of angular material, which is the least preferred, and stream banks could have been 7 reinforced with biotechnical methods rather than rock. 8

2nd Draft Water Crossing Design Guidelines 11/30/11
126
1
Figure 6.7: Taenum Ck. Bruton irrigation diversion. This roughened channel is shown at high flow. 2 The design must consider flow conditions like this to ensure that the channel does not degrade. Photo 3 Paul Tappel. 4

2nd Draft Water Crossing Design Guidelines 11/30/11
127
1
Figure 6.8: Roughened channel culvert. Shown at low flow. Bed material is rounded, but the bed 2 should be countersunk deeper to be more robust. 3
The bed material is placed so that a low‐flow channel meanders down the center of the culvert, if 4 enough width is available. Channel side slopes above the low flow channel should be 5 approximately 6:1. Various alternate channel cross sections have been successful and the designer 6 should use their own experience as a guide. 7
BED POROSITY 8
The gradation of the mix used for the bed inside roughened‐channel culverts should have enough 9 fine materials to seal the bed and provide the variety of particle sizes that are present in natural 10 channels. The standard riprap gradation recommended by the U.S. Army Corps of Engineers (EM 11 1110‐2‐1601) is D85/D15 < 2 (riprap, or quarried stone, is not recommended for roughened 12 channels, but this type of gradation is common with coarse materials of this size range). This is 13 very permeable. It leads to subsurface flow during low‐flow periods and does not create a very 14 stream‐like character. Even after years of seasoning, culverts constructed with coarse mixes lose 15 surface flow into the bed. Specifying a well‐graded mix reduces permeability but may reduce 16 stability if the voids are overfilled and rock‐to‐rock contact is lost. The mix must be designed to 17 limit the reduction of stability and the risk of failure. 18
Washington Dept. of Transportation specification 9‐13.4 Rock for Erosion and Scour 19 Protection creates a gradation that is well graded, although not necessarily non‐porous. If angular 20 materials (quarry stone) are acceptable, then this specification may be helpful. An additional 21 provision would need to be added that specified the gradation of the smallest 15%. 22

2nd Draft Water Crossing Design Guidelines 11/30/11
128
There is an extensive discussion regarding well‐graded sediment mixtures in Chapter 3. Refer to 1 that chapter for the design of culvert fills for roughened channels. The WSDOT specification for 2 streambed materials is also included in Chapter 3 and should be used for roughened channels 3 whenever possible. 4
TURBULENCE 5 In order to maintain a desired velocity, energy must be dissipated. The energy of water “falling” 6 down the channel is dissipated by turbulence. For an arbitrary width, the culvert slope and 7 roughness could be continually increased so that the average velocity would meet fish‐passage 8 criteria; but, in that process, the intensity of the turbulence increases and becomes a barrier to fish 9 passage. Turbulence in the culvert is characterized by the energy dissipation‐per‐unit volume of 10 water and is referred to as the energy‐dissipation factor (EDF) wich is calculated using Equation 6‐11 3. 12
There has always been some technical uncertainty concerning the maximum numerical value of 13 EDF for fish passage in roughened channels. Paul Tappel, biologist and engineer responsible for the 14 design and construction of about 40 roughened channels in Washington has suggested that 15 maximum EDF criteria stated in the 2003 DESIGN OF ROAD CULVERTS FOR FISH PASSAGE is too low 16 (Tappel 2010). Based on a visual examination of existing roughened channel culverts, WDFW 17 recommended that EDF be equal or less than 7.0 foot‐pounds per cubic foot per second (ft‐18 lb/ft3/sec). This recommended maximum EDF for roughened channel culverts is significantly 19 greater than that recommended for baffled culverts (EDF 3 to 5) and fishways (EDF 4.0, pool 20 volume criteria). This is because the diversity of the turbulence scale and flow patterns in a 21 roughened channel provides more opportunities for low‐turbulence zones for resting and passage. 22
We admitted at the time that the value of 7.0 ft‐lb/ft3/sec was based on very little data and thought 23 that it would allow practical design of roughened channel culverts under reasonable circumstances. 24 Further, we speculated that as research and experience broaden, this value may be modified. We 25 have reached that point. 26
Tappel calculated the EDF for a number of roughened channel projects built between 1998 and 27 2009, using the formula presented above at the estimated high fish passage flow for each completed 28 project. This data appears in Figure 6.9 shown as a function of channel slope. The strong 29 correlation of channel slope to EDF is due to the fact that slope is a factor in EDF. Limiting EDF to 30 7.0 ft‐lb/ft3/s would have created a design limitation for the application of this method, and would 31 have excluded many of the successful roughened channel projects he has designed. Tappel has 32 observed good fish passage characteristics in these channels and feels that even those with an EDF 33 well above 7 ft‐lb/ft3/sec are passable. 34

2nd Draft Water Crossing Design Guidelines 11/30/11
129
1
Figure 6.9: Energy dissipation factor for selected roughened channels (Tappel 2010). 2
As a way to approach this complex problem, it was hypothesized that the EDF generated in natural 3 channels could form a limit to what should be expected in artificial channels. Data from the stream 4 simulation culvert effectiveness study (Barnard, Yokers et al. 2011) was used to determine EDF in 5 natural fish bearing streams. Velocity at the high fish passage design flow (10% exceedance flow) 6 and the water surface slope from 50 Washington streams was used to determine EDF. This data is 7 shown in Figure 6.10. The EDF of stream simulation culverts on these study streams is also 8 shown. 9

2nd Draft Water Crossing Design Guidelines 11/30/11
130
1
Figure 6.10: Energy dissipation factor at the fish passage design flow as a function of water surface 2 slope for a selection of channels and stream simulation culverts in Washington (Barnard, Yokers et al. 3 2011). 4
The dashed line above most of the data (y = 250x) forms an envelope that encloses what is 5 considered to be a safe limit to the EDF generated in roughened channels. Five points in Figure 6 6.10, and a few of Tappel’s channels in Figure 6.9, lie above this line and are probably only 7 passable during relatively narrow ranges of creek flow; the designs of these aggressive channels 8 would be considered on a case‐by‐case basis. The dashed line on Figure 6.10 should be used to 9 restrict the design of roughened channels to situations where turbulence would be no greater than 10 the majority of natural channels of the same or similar slope (at the high fish passage design flow). 11 For convenience, the maximum EDF for a given slope is in tabular form for representative water 12 surface slopes. It is recommended that roughened channel EDF not exceed the values in Table 6.4. 13
Table 6.4: Recommended relationship between roughened channel slope and maximum EDF. 14
Slope Max EDF ft/ft ftlb/ft3/sec
0.02 5
0.04 10
0.06 15
0.08 20
0.12 30
0.16 40
0.20 50 15
0
5
10
15
20
25
30
35
40
45
50
0 0.02 0.04 0.06 0.08 0.1 0.12 0.14 0.16 0.18
EDF, ft‐lb
/ft^3/sec
Water surface slope, ft/ft
Natural channels
y=250x
Stream sim culverts

2nd Draft Water Crossing Design Guidelines 11/30/11
131
In lower‐gradient situations, the roughened channel design method assumes that the bed material 1 creates the dominant form of roughness, and the boulders placed on the bed act only to enhance the 2 fish passage. It is clear that these boulders have some role in general resistance to flow, but it is not 3 clear how to quantify this. Though we know that they act as constrictions or obstructions to flow, it 4 will take additional studies to know whether bed roughness or constriction losses are the dominant 5 roughness factor. To design conservatively for fish passage, we do not recommend including the 6 boulders in the velocity calculation. 7
Using the synthetic streambed distributions recommended in Chapter 3 for higher‐gradient 8 situations, the maximum‐sized particles prescribed will act as boulders. In such cases, there may be 9 no difference between the roughness boulders and the largest bed element. 10
MAINTENANCE AND INSPECTION PLAN FOR FISHWAYS 11 As described at the beginning of this chapter, Hydraulic Design Option culverts are fishways, 12 structures that are specifically designed to pass fish. As a result, they often limit other stream 13 functions, such as the transport of large in‐stream wood and sediment, and require inspection and 14 maintenance to function properly. The owner must inspect and maintain them so that they continue 15 to pass fish as required under State law. What follows is an inspection and maintenance plan for 16 fishways. 17
First, the responsible party should be identified. State law designates the owner of the obstruction 18 to fish passage as the one responsible for maintaining it. This is somewhat ambiguous when the 19 largest “owners” of crossings in Washington are the State, Counties and Municipalities. The one 20 responsible for inspecting and maintaining must be clearly identified both by division, name and 21 title. One way to ensure that the owner remembers their obligation for the life of the structure is to 22 place the inspection and maintenance functions in an established department, such as road 23 maintenance. In the case of a new culvert this may be 50 years, spanning multiple careers and even 24 the life span of whole agencies. This is another important reason why the stream simulation is such 25 a desirable design method – it is nearly maintenance‐free and does not need this step. 26
The inspection interval depends on the type of structure and watershed conditions. Sensitive 27 structures include 28
• Formal fishways: pool and weir, pool and chute. 29 • Baffled culverts 30 • Backwatered culverts 31 • Grade control structures. 32
The extreme case would be a sensitive structure, say a baffled culvert, in a channel with a large 33 watershed with abundant large sediment and woody debris. These fishways should be inspected 34 after every large storm and once at the end of the rainy season to ensure that they are always 35 passable. 36
At the opposite end of the inspection interval spectrum would be that same baffled culvert but in a 37 groundwater fed stream with virtually no sediment or debris transport. This culvert would only 38

2nd Draft Water Crossing Design Guidelines 11/30/11
132
need to be inspected once a year, but never less than once a year so that the regularity of 1 inspections establishes a reliable pattern. 2
The most robust fishways are roughened channels. After an initial annual inspection period, say 5 3 years, without repairs, the interval between roughened channel inspections might be increased. 4
INSPECTION METHODS AND CRITICAL CRITERIA 5 The inspector must physically walk the entire length of the culvert or fishway. Inspectors should 6 work in pairs. They should be provided with the proper gear for comfort and safety. Water depths 7 in a culvert fishway may exceed 3 feet and some culverts are hundreds of feet long – these are 8 dangerous situations requiring training and close attention to safety. 9
The inspector is looking for situations where the fishway is either forced out of fish passage criteria 10 or threatened structurally. Design and as‐built drawings must be available to the inspector and on‐ 11 site during inspection. Without these drawings, there is no way to tell what is in compliance and 12 what is not. If parts must be repaired or replaced, these drawings are essential. Specific criteria 13 should be applied to each component of the fishway so that the inspector knows when maintenance 14 is required. Whenever any work is done that may affect fishlife, such as the repairs and 15 maintenance suggested here, the owner must obtain a Hydraulic Project Approval from the 16 Washington Dept. of Fish and Wildlife. Some common situations and contingencies are outlined 17 below: 18
• Debris hung up on baffles or weirs, or at the entrance of culverts. Debris includes sticks, 19 leaves and other woody material. 20
o Remove debris from fishway and dispose of out of reach of high water and above 21 steep slopes that may reintroduce it upstream of the fishway. For improved stream 22 ecology, debris should be reintroduced downstream of the fishway, unless there are 23 culverts downstream that may be impacted. 24
• Accumulations of non‐erodible sediment in baffles or weir pools that displace pool volume 25 or force flow into impassible high velocity jets. Commonly, cobbles fill fishway pools and 26 are not eroded out by normal high flows, or pile up in baffled culverts forming a smooth 27 high velocity surface. This is different from normal bedload of the gravel and smaller size 28 classes that fill and scour regularly. Accumulations of gravel in the corners of pools and 29 baffles do not significantly affect their performance. 30
o Remove non‐erodible sediment from pools and baffles. Often heavy machinery is 31 required for this. 32
• Missing or damaged weirs or baffles. Logs or boulders transported by big storms commonly 33 destroy or damage these rigid structures. 34
o Replace or repair weirs or baffles to their original shape and elevation. 35 • Adjustable components, such as stop logs or weirs, must be within the design criteria for 36
cross sectional shape and water surface drop. 37 o Adjust or replace components out of compliance according to the original plans or 38
plans that have been officially modified for better performance. These inspection 39 and maintenance activities and procedures should be set down in a manual with the 40

2nd Draft Water Crossing Design Guidelines 11/30/11
133
design report and drawings to make a complete package for any inspector who 1 takes on the job. 2
3
4

2nd Draft Water Crossing Design Guidelines 11/30/11
134
CHAPTER 7: CHANNEL PROFILE ADJUSTMENT 1
SUMMARY 2 • Channel profile adjustment occurs when a culvert is replaced and there is an abrupt change 3
in the channel slope or elevation at the water crossing. 4 • Channel regrade is the most common result (the lowering of the upstream channel). 5 • Regrade is preferred since it allows natural processes to prevail but the impacts must be 6
understood and managed. 7 • Controlling the gradient and maintaining the upstream bed elevation to its existing level 8
should only be done when necessary since artificial control structures are prone to failure, 9 require maintenance and interfere with the evolution of the streambed. 10
• The use of grade control structures to maintain a specific stream slope for fish passage and 11 habitat protection constitutes a “fishway.” In order to maintain fish passage as required by 12 law, fishways should be inspected and maintained as described in Maintenance and 13 inspection plan for fishways, Chapter 6. 14
• Channel profile adjustment can be controlled using channel‐steepening options, which are 15 described in detail (the first 3 are preferred for reasons of stability, fish passage and habitat 16 quality, the last 3 are discouraged): 17
o Constructed cascade 18 o Constructed riffle 19 o Boulder control 20 o Rigid sill 21 o Fishway 22 o Baffles 23
INTRODUCTION 24 As discussed in Chapters 1, 3 and 7, some level of stream profile adjustment occurs when a 25 culvert is removed or replaced. Such an adjustment may also occur when a bridge is replaced, 26 although this is rare unless the channel beneath the bridge has been rocked to control grade. 27 Regardless of the design option used, the crossing bed elevation must match the future channel 28 profile and elevation. The elevation of the culvert in the no‐slope and stream simulation design 29 options depends upon the countersink criteria for each option and the natural channel elevation, 30 including alluvial pools that may migrate through the culvert. 31
Surveying a profile is briefly described in Chapter 1. A more detailed discussion can be found in a 32 variety of publications, notably STREAM CHANNEL REFERENCE SITES (Harrelson, Rawlins et al. 1994) A 33 rigorous discussion of channel profile, its measurement, assessment and its interaction with a given 34 crossing design can be found in the U. S. Forest Service’s: AN ECOLOGICAL APPROACH TO PROVIDING 35 PASSAGE FOR AQUATIC ORGANISMS AT ROADSTREAM CROSSINGS (Forest Service Stream‐Simulation 36 Working Group 2008). Designers with complicated projects should refer to this document rather 37 than relying on the light discussion found here. The USFS document stratifies profiles into 7 38 categories and discusses their impacts on crossing design, as shown in Figure 7.1. 39

2nd Draft Water Crossing Design Guidelines 11/30/11
135
1
Figure 7.1: Road crossing profiles (Forest Service StreamSimulation Working Group 2008) 2
The uniform profile presents no particularly difficult challenges to the designer since the old 3 crossing can be removed and the new one placed without any profile adjustment. The uniform with 4 sediment wedge at inlet of undersized culvert is also quite simple because the only adjustment 5 necessary concerns a local accumulation of sediment which can either be mechanically removed or 6 allowed to erode as a natural process, resupplying the downstream channel with bedload. 7
Concave profiles often occur when the road is placed at the valley wall where a higher gradient 8 stream flattens out onto the floodplain. These culverts are prone to sediment accumulation and are 9 best designed wider than what is recommended in Chapters 2 and 3 to accommodate the 10 transport, staging, and storage of deposited sediment. This is discussed in more detail in Chapter 11 9. Increases of 1.5 to 2 times the recommended span may be required to accommodate these 12 processes. The cost implications of this may make changing the road alignment to a better crossing 13 site more attractive. 14
Convex and complex profiles are more often found on mid‐slope roads. If the bed is relatively stable, 15 they should not present any difficulties in crossing design. On the other hand, if these are 16 transitional shapes, formed from mobile sediments or accumulations of instream wood, then the 17

2nd Draft Water Crossing Design Guidelines 11/30/11
136
designer should consider a bridge or deeply embedded structure to anticipate episodic changes in 1 bed elevations. 2
Incised channel downstream of culvert is an all too common and problematic form in Washington 3 State and is of primary interest in this chapter. It is readily identified by a culvert outlet drop 4 greater than approximately 2 feet. It should be distinguished from outlet scour, which is caused by 5 an undersized culvert that scours a pool at the outlet which locally lowers the bed and creates a 6 small drop, usually less than 1 foot, but occasionally more. 7
Roadimpounded wetlands are covered in Appendix F. 8
Solutions to these various profile adjustments should be in keeping with the natural process 9 approach to crossing design advocated in this document. The stream should adjust itself as it would 10 to any natural disturbance using the materials and forces commonly understood in fluvial 11 geomorphology. In the case of F in Figure 7.1, one would lower the replacement culvert and allow 12 the upstream channel to regrade. There is often a complex channel response (both upstream and 13 downstream) to this, which is discussed in the following paragraphs. Controlling the gradient and 14 maintaining the upstream bed elevation to its existing level should only be done when necessary 15 since artificial control structures are prone to failure, require maintenance and interfere with the 16 evolution of the streambed. 17
The characteristics of the adjacent stream reach determine the size, slope and degree of 18 countersink of the pipe. A long, surveyed profile is essential for determining both the 19 characteristics of the channel and the appropriate degree of countersink for the new culvert. Long 20 profiles (20 channel widths or a minimum of 200 feet upstream and downstream from the culvert) 21 reveal true channel slope and the expected extent of scour. The depth of pools within the reach 22 indicates the depth of scour and, in turn, the appropriate elevation for the invert of culverts 23 designed by the no‐slope and stream simulation design options. Pools that are a result of alluvial 24 processes that occur within the natural channel should be taken into account in design. 25
Consider also the potential variance in overall channel elevation during the life of the project. The 26 natural elevation of an alluvial channel may change over time and is often affected by human‐27 caused changes in sediment, debris and flow. Determine whether the channel is in equilibrium or 28 disequilibrium (aggrading or degrading) or whether localized disequilibrium will be caused by the 29 project. Estimate the potential variance in elevation of the bed and design the culvert for that 30 range. This is important for all design options and most critical for designs that have rigid bed 31 elements, including bed controls and culverts without natural streambeds. 32
Satisfying the countersink and velocity criteria for culvert retrofits, or preserving upstream habitat 33 or infrastructure often requires steepening the downstream and/or upstream channel gradients. 34 This can be done by installing grade‐control structures; a steeper, roughened channel; excavating 35 bed material; allowing the channel to regrade without controls or a combination of these 36 approaches . 37
38

2nd Draft Water Crossing Design Guidelines 11/30/11
137
CHANNEL STEEPENING OPTIONS 1 The use of grade control structures to maintain a specific stream slope for fish passage and habitat 2 protection constitutes a “fishway.” In order to maintain fish passage as required by law, fishways 3 should be inspected and maintained as described in Maintenance and inspection plan for fishways, 4 Chapter 6. 5
No single grade control solution is the best answer for all situations. Often, choices among these 6 options will be influenced by issues other than fish passage, such as property lines, habitat 7 considerations, risk to infrastructure, or issues about flooding or erosion. These factors are 8 described in this section. Grade control alternatives should start with naturally robust designs like 9 constructed riffles or cascades. 10
The retrofit of an existing culvert will often require a steepened channel downstream. Other 11 situations that lead to this need include the protection of an upstream wetland or other upstream 12 habitat features or floodplain function, protection of structures or buried utilities, and the 13 constructability of a deep excavation for a culvert installation. 14
A culvert can provide a beneficial function as a nick point to prevent a degrading downstream 15 channel from progressing upstream. Placing downstream grade controls and maintaining the 16 culvert elevation as a nick point can be, in some cases, valuable for upstream habitat protection. 17 Any grade‐control structures must, of course, anticipate future degraded channel conditions. A 18 simple way to prepare for continuing degradation is to bury additional control structures into the 19 bed downstream at the same gradient as the upstream controls. These controls would become 20 exposed and effective only as the downstream channel degrades, which it inevitably does. 21
If grade‐control structures are built in the channel downstream of the culvert, they should be long‐22 lasting and stable at the design elevation. This is required because the culvert is a long‐term 23 feature (25‐ to 50‐year life) with a fixed elevation. Any loss or lowering of the downstream controls 24 could result in another barrier at the culvert or structural risk to the culvert. 25
The upstream channel grade may be adjusted to fit a new or replacement culvert with an upstream 26 invert lower than the existing streambed. Control structures upstream may either have rigid 27 elevations or they may be expected to gradually adjust over time. This will depend upon the factors 28 described in the next section. All or part of the upstream regrade may, in some cases, be allowed to 29 occur naturally with no controls. 30
The addition of channel‐regrade structures or channel modifications to increase the channel slope 31 extends the length of channel affected by the culvert installation. Habitat impacts may also have to 32 be mitigated in the modified channel reach and may affect the design of the steepened reach. 33
34
35
36

2nd Draft Water Crossing Design Guidelines 11/30/11
138
CHANNEL HEADCUT AND REGRADE FACTORS 1 A channel degrades when its bed scours and lowers over time either by natural process, hydrologic 2 changes in the watershed and/or the lowering or removal of a control point in the channel. 3
Channel headcut occurs when the upstream channel has been lowered locally by scour in response 4 to a replacement culvert that has been enlarged and/or set at a lower elevation, Figure 7.2. The 5 headcut itself is a steep section of channel that, as it erodes, migrates upstream and eventually 6 lowers the entire channel for some distance. The same situation occurs if an undersized culvert is 7 replaced with a larger one, since the flood hydraulic profile is lowered by the reduction of the 8 culvert constriction. Habitat impacts of channel degradation can be extensive but short‐lived as the 9 channel adjusts to the new elevation. In cases where the impacts are unacceptable and prolonged, 10 they can be managed by reconstruction of the upstream channel either into a natural grade or 11 steepened with hydraulic controls. 12
13
14
A reach degrades when there is a net lowering of the bed elevation. During the initial stages of 15 degradation, a channel will become deeper and narrower, the relative height of the banks increases 16 and the banks steepen. Loss of floodplain connection and concentration of flows within the channel 17 exacerbate the degrading process. Reinforcement of root structure is decreased. As a result of 18 erosion, banks fail, and the channel then widens over a period of time until the channel re‐19 establishes its natural slope, floodplain, bankfull width and depth at the lower elevation. This 20 process is shown graphically in Figure 7.3. 21
Figure 7.2: Regrade resulting from culvert replacement.

2nd Draft Water Crossing Design Guidelines 11/30/11
139
1
Figure 7.3: Incised channel sequence shown in profile, lower figure, and a sequence of channel cross 2 sections, upper figures I, II and III, located at intervals along the profile (Schumm, Harvey et al. 1984). 3 Figure is not to scale. 4
A few important details are shown in Figure 7.3. Incision is confirmed by a progressive increase 5 in the distance between the top of bank and the thalweg of the channel. What was once a floodplain 6 (stage I) becomes a terrace which is never again inundated (stage III). The primary nickpoint in this 7 figure has progressed to the road crossing where it is stopped by the non‐erodible steel or concrete 8 culvert. This primary nickpoint is often, although not always, followed by a secondary nickpoint or 9 several smaller ones. In the design of a crossing the engineer must be aware that this secondary 10 nickpoint may be approaching the crossing within the lifespan of the proposed structure. The 11 profile must be long enough to recognize this feature and the planned culvert set deep enough to 12 accommodate its passage. 13
Incision is episodic; periods of incision are followed by periods of sediment storage and then by 14 further incision (Schumm, Harvey et al. 1984). Since incision is a transitional phase, the 15 characteristics and dimensions of the channel at the time of a given survey may be significantly 16 different at some later date. It is important to place the channel in this incision sequence to 17 anticipate future conditions. 18
Rd. Fill
Primary nickpoint
Secondary nickpoint(if present)
IIIIII
FloodplainTerrace Valley wall
Deposited sediments

2nd Draft Water Crossing Design Guidelines 11/30/11
140
Incision is also complex; as shown in stage III, Figure 7.3, the channel has incised, rebuilt with 1 deposited sediments, then cut back down again (Schumm, Harvey et al. 1984). This process can 2 repeat as the primary and secondary nickpoints encounter more or less erodible bed and bank 3 materials, experience higher and lower storm events, as well as pass through channel configuration 4 states that are in and out of equilibrium. 5
A variety of habitat impacts may occur during the incision process. The most obvious is the erosion 6 of the bed and habitat associated with it. The remaining bed is narrow, confined and usually 7 consists of a steep run with little diversity because the channel has no floodplain for relief from 8 high flows. Bed and bank erosion introduces additional sediment. A degrading channel may lower 9 the ground water table to below the root zone, dewatering the bank and adjacent wetlands or side 10 channels and affecting the survival of vegetation. This, in turn, may trigger secondary causes of 11 erosion such as reduced vegetative structure. 12
Channels that are most vulnerable to the habitat impacts of a degrading channel are those that have 13 functional floodplains, habitat diversity, and/or adjacent side channels or wetlands and channels 14 with banks that are already over‐steepened and on the verge of failure. 15
The following aspects should be part of the consideration for channel regrade. Detailed information 16 on some of these issues may be required if the expected headcut is greater than about a foot in a 17 gravel‐bedded stream, less in a sand‐bedded stream. 18
Such information should include: 19
• Extent of regrade 20 • Condition of upstream channel and banks 21 • Habitat impacts of upstream channel incision 22 • Habitat impacts to downstream channel from sediment release 23 • The value of the culvert as a fixed nick point 24 • Decrease in culvert and channel capacity due to an initial slug of bed material 25 • Risk to upstream utilities and structures 26 • Potential for fish‐passage barriers created within the degraded channel, and 27 • Equipment access 28
29 Extent of Regrade 30 The extent of regrade depends upon the upstream bed slope and composition, the sediment supply 31 to and through the reach, and the presence of debris in the channel. The length of regrade in 32 cobble‐bedded streams may be less than in shallow‐gradient, sand‐bedded streams. Sandy beds 33 often regrade uniformly without increasing slope until they hit the next nick point of debris or 34 larger bed material (several feet of regrade can headcut thousands of feet upstream). 35
A channel with high bed‐load transport will be affected less by regrade and will reach an 36 equilibrium condition more rapidly than channels with low bed‐load transport. Structures and 37 utilities must be identified in the upstream bed that might be exposed or affected by the 38

2nd Draft Water Crossing Design Guidelines 11/30/11
141
degradation. Culverts should be designed to transport sediment at the same rate as the adjacent 1 channel. 2
The upstream channel slope and bed composition influences sediment supply and the ability to 3 maintain the bed inside the culvert. This is especially important in culverts that are dependent on 4 the recruitment of material. 5
Condition of Upstream Channel and Banks 6 Two extremes of upstream bed condition are an incised channel and an aggraded channel created 7 by the backwater of an undersized culvert. Any floodplain function will be further reduced in an 8 incised channel and instream habitat will be subjected to increased velocities and less diversity. 9 Banks will become less stable as the incised channel undermines them, possibly initiating 10 landslides in narrow valleys. An aggraded channel, on the other hand, can be stabilized and 11 returned to its natural condition by allowing some degradation through it. 12
Habitat Impacts of Upstream Channel Incision 13 An incised channel is narrow and confined, with little diversity and reduced stability because the 14 channel has limited floodplain for relief from high flows. Eventually, the channel will evolve into an 15 equlibrium configuration, but substantial bank erosion and habitat instability may persist for some 16 time, possibly decades. 17
Wetlands form upstream of many undersized or perched culverts. These wetlands perform 18 important functions in the riparian ecology and their fate should be carefully considered when 19 replacing culverts. State and federal resource agencies have prepared Appendix F: Road 20 Impounded Wetland guidelines. 21
Habitat Impacts to the Downstream Channel from Sediment Release 22 Aquatic habitats downstream may be affected by the increased sediment deposition resulting from 23 the upstream incision. If the downstream channel is incised, it may benefit from the release of 24 sediment. However, equilibrium channels may be negatively affected by depositing sediment, 25 forcing channel widening, obscuring spawning and rearing habitat and similar effects. In addition 26 to the volume of material released, sediment will be delivered at lower flows than expected, 27 increasing turbidity for long periods until the upstream channel and banks have stabilized. The 28 designer should consider mechanically removing some of the bed material upstream of the culvert 29 if this can limit impacts. 30
Decrease in Culvert and Channel Capacity Due to Initial Slug of Bed Material 31 Allowing an uncontrolled headcut upstream of a culvert may result in a slug of material mobilized 32 during a single flow event. As this material moves through the culvert and the downstream 33 channel, it can reduce the flood capacity of both. Either the culvert size should be increased to 34 anticipate this, or less degradation should be allowed where the culvert has significant risk (even if 35 it is a short‐term risk) of plugging by bed material and debris. Similar limitations should be 36 considered where structures downstream are at risk from a loss of channel capacity or where 37 banks are at risk of erosion. Without further technical analysis of degradation implications and 38 culvert flood capacity, a culvert inlet should be countersunk no more than 50 percent of its rise or 39

2nd Draft Water Crossing Design Guidelines 11/30/11
142
diameter. Relevant factors to consider include design‐flow probabilities, bank height, culvert 1 dimensions, substrate material, fill height and allowable headwater depth. 2
Proximity of Upstream Utilities and Structures 3 If a regrade is allowed to continue upstream, it can jeopardize structures in the channel or on the 4 banks. Be aware of buried utilities under the channel and the risk of increased bank erosion. 5 Clearly, a balance must be made between restoring natural processes and protecting infrastructure 6 set too shallow in the bed or too close to the bank. This balance should consider the long term 7 maintenance of both the protected infrastructure and the culvert/grade control system. 8
Potential for FishPassage Barriers Created Within the Degraded Channel 9 Another headcut consideration is the potential for fish‐passage barriers to be created within the 10 degraded channel. Upstream culverts, buried logs, and sills of rock, durable till or clay are 11 commonly exposed by channel headcuts. As the channel headcuts to these features, they become 12 the new nick point and fish‐passage barriers. Adding to the difficulty, these problems may occur 13 where they are not visible from the project site, and they may occur on other properties, making 14 them more difficult to address. The first task of the designer who must lower the invert of a 15 replacement culvert is to walk upstream and try to identify potential nickpoints. The long stream 16 profile should be extended at least to the first of these features and the mobility of the bed material 17 carefully assessed. Many of the natural nickpoints (buried logs, and sills of rock, durable till or clay) 18 would be exposed through natural processes anyway, but upstream culverts are particularly 19 durable and often total barriers to fish passage. 20
Equipment Access 21 Impacts to the channel, riparian structure or infrastructure caused by equipment access for 22 upstream or downstream channel construction should be considered in the selection and extent of 23 upstream and downstream channel control structures. Most channel work requires equipment 24 access, generally a track excavator, but often trucks that travel on roads. The trees and brush are 25 cleared, gravel roadways built, banks cut back, the channel ripped up and regraded – all impacts to 26 the productive capacity of the stream that must be mitigated. Healing time can be improved by not 27 removing brush but cutting it short to moving equipment over it. That way the vegetation will grow 28 back sooner. If the grade control is truly needed, then these are temporary impacts that time will 29 heal. But these impacts must be weighed when alternatives for channel profile adjustments are 30 analyzed. 31
CHANNEL PROFILE STRUCTURES 32 Descriptions of several grade‐control designs are provided in Table 7.1. These techniques, and any 33 combination of them (with a few exceptions), can be used to control channel grade either upstream 34 or downstream of a culvert. When used downstream of a culvert, they are intended to backwater 35 the culvert and stabilize a steepened channel reach. The distance between the culvert outlet and 36 downstream grade control should be a minimum of 20 feet. Culverts are linear, hydraulically 37 smooth structures that tend to increase stream velocity and concentrate it into a jet. The erosive 38 potential of this jet is, in part, a function of the relative width of the culvert. A properly designed 39 culvert should not increase downstream velocity, but an undersized culvert – one that might be a 40

2nd Draft Water Crossing Design Guidelines 11/30/11
143
candidate for backwater by grade controls – will increase downstream velocity and erode the back 1 of a grade control if it is placed too close to the outlet. This minimum of 20 feet should be increased 2 for situations where higher velocity is anticipated. 3
When grade control is used upstream of a culvert, they are intended to stabilize a steepened reach 4 to prevent or control a headcut and channel incision. Upstream grade control can have a strong 5 effect on bed stability inside the culvert. Turbulence created by the drop tends to scour out the 6 inlet and occasionally the entire bed inside the culvert. A minimum clearance of 35 feet (where 7 possible, 50 feet) should be allowed between the inlet and the structure. 8
A more detailed discussion of such channel profile structures for habitat enhancement can be found 9 in the STREAM HABITAT RESTORATION GUIDELINES (Saldi‐Caromile, C., K. Bates, et al. (2003). 10
The purpose of these channel profile structures is to increase stream gradient, for one reason or 11 another, and this locally increases sediment transport capacity and increases downstream velocity. 12 They create a sediment supply‐limited reach which is always “hungry;” transporting bedload that 13 normally supports natural channel structure; winnowing out all the particle fractions smaller than a 14 critical size; deepening scour holes and widening banks. For these reasons, grade control requires 15 monitoring and maintenance without which it will fail. 16
Each technique has advantages and disadvantages as summarized in Table 7.1. 17
18

2nd Draft Water Crossing Design Guidelines 11/30/11
144
Table 7.1: Comparison of grade control methods. 1
Grade control methods
Advantages Disadvantages Limitations
Constructed cascade
Can be designed to replicate natural channel structure.
Provide passage for all fish.
Robust, redundant structure – less likely to degrade.
Technical design and construction expertise required.
Large and expensive engineering projects.
Applicable to higher channel gradient.
Constructed riffle
Can be designed to replicate natural channel structure.
Provide passage for all fish.
Robust, redundant structure – less likely to degrade.
Technical design and construction expertise required.
Will not maintain specific water surface elevation.
Applicable to lower channel gradient.
Boulder Control
Can be designed to replicate natural channel structure.
Good fish passage for most species.
Not redundant – simple adjustments may result in failure. Will degrade over time.
Technical design and construction expertise required.
Maximum water surface drop of 9” between structures.
Rigid Sill
Extensive design history.
Exact control of water surface elevation
Poor fish passage for many species.
Rigid structure in dynamic stream profile.
Not redundant – small adjustments may result in failure. Will degrade over time.
Precast structures are not aesthetic
Minimum spacing of 15 feet.
Limited to < 5% gradient.
Allowable drop depends upon fish requiring passage.
Cost can be high for precast structures.
Fishway
Provides durable fish passage for design species.
Highest slope passage available for grade controls.
Extensive design history.
Expensive.
Technical expertise and site‐specific, flow‐regime data required.
Debris and bedload may damage or clog structure.
Precludes most natural stream processes.
Narrow range of operating flow ‐ difficult to provide passage for all fish, all of the time.
Requires ongoing maintenance
Baffles Increases hydraulic roughness.
Turbulence, hydraulic profile raised, debris problems.
Suspected barrier to non‐salmonids.
Slope less than or equal to 3.5% (see Chapter 6).
2

2nd Draft Water Crossing Design Guidelines 11/30/11
145
CONSTRUCTED RIFFLE AND CASCADE 1 Constructed riffles and cascades are modeled after their natural analogs, although placed out of 2 context, with the intention of creating a specific habitat type or to increase gradient, as they are 3 referred to here. 4
A constructed cascade is a graded mix of larger rock and smaller sediment, designed to remain 5 stable up to the design flow, to create enough roughness and hydraulic diversity to steepen the 6 channel and provide fish passage, Figure 7.5. The roughness controls the velocity, and the flow 7 diversity provides migration paths and resting areas for a variety of fish sizes through local higher‐8 velocity and turbulence areas. 9
10
Figure 7.5: Constructed cascade used to backwater an existing culvert, Chico Ck. 11
The principles of roughened channels are described in Chapter 6 and can be used to design open 12 channels outside of culverts. The design should be very conservative for steepening channels 13 downstream of culverts or other fixed structures where any degradation of the channel will result 14 in the culvert countersink or velocity criteria to be exceeded. The culvert should be countersunk 15 deeper than normally required with the expectation of some degradation can occur at the top of the 16 roughened channel. The roughened channel is acceptable upstream of culverts to control channel 17 headcutting. 18
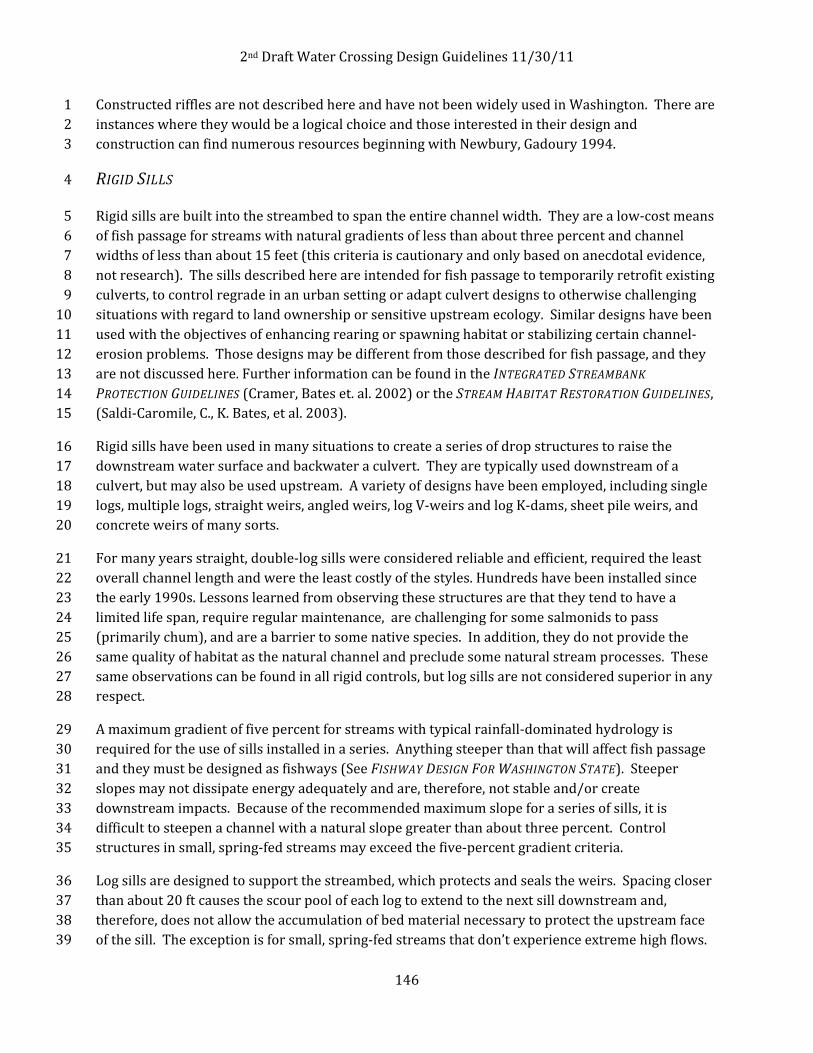
2nd Draft Water Crossing Design Guidelines 11/30/11
146
Constructed riffles are not described here and have not been widely used in Washington. There are 1 instances where they would be a logical choice and those interested in their design and 2 construction can find numerous resources beginning with Newbury, Gadoury 1994. 3
RIGID SILLS 4
Rigid sills are built into the streambed to span the entire channel width. They are a low‐cost means 5 of fish passage for streams with natural gradients of less than about three percent and channel 6 widths of less than about 15 feet (this criteria is cautionary and only based on anecdotal evidence, 7 not research). The sills described here are intended for fish passage to temporarily retrofit existing 8 culverts, to control regrade in an urban setting or adapt culvert designs to otherwise challenging 9 situations with regard to land ownership or sensitive upstream ecology. Similar designs have been 10 used with the objectives of enhancing rearing or spawning habitat or stabilizing certain channel‐11 erosion problems. Those designs may be different from those described for fish passage, and they 12 are not discussed here. Further information can be found in the INTEGRATED STREAMBANK 13 PROTECTION GUIDELINES (Cramer, Bates et. al. 2002) or the STREAM HABITAT RESTORATION GUIDELINES, 14 (Saldi‐Caromile, C., K. Bates, et al. 2003). 15
Rigid sills have been used in many situations to create a series of drop structures to raise the 16 downstream water surface and backwater a culvert. They are typically used downstream of a 17 culvert, but may also be used upstream. A variety of designs have been employed, including single 18 logs, multiple logs, straight weirs, angled weirs, log V‐weirs and log K‐dams, sheet pile weirs, and 19 concrete weirs of many sorts. 20
For many years straight, double‐log sills were considered reliable and efficient, required the least 21 overall channel length and were the least costly of the styles. Hundreds have been installed since 22 the early 1990s. Lessons learned from observing these structures are that they tend to have a 23 limited life span, require regular maintenance, are challenging for some salmonids to pass 24 (primarily chum), and are a barrier to some native species. In addition, they do not provide the 25 same quality of habitat as the natural channel and preclude some natural stream processes. These 26 same observations can be found in all rigid controls, but log sills are not considered superior in any 27 respect. 28
A maximum gradient of five percent for streams with typical rainfall‐dominated hydrology is 29 required for the use of sills installed in a series. Anything steeper than that will affect fish passage 30 and they must be designed as fishways (See FISHWAY DESIGN FOR WASHINGTON STATE). Steeper 31 slopes may not dissipate energy adequately and are, therefore, not stable and/or create 32 downstream impacts. Because of the recommended maximum slope for a series of sills, it is 33 difficult to steepen a channel with a natural slope greater than about three percent. Control 34 structures in small, spring‐fed streams may exceed the five‐percent gradient criteria. 35
Log sills are designed to support the streambed, which protects and seals the weirs. Spacing closer 36 than about 20 ft causes the scour pool of each log to extend to the next sill downstream and, 37 therefore, does not allow the accumulation of bed material necessary to protect the upstream face 38 of the sill. The exception is for small, spring‐fed streams that don’t experience extreme high flows. 39

2nd Draft Water Crossing Design Guidelines 11/30/11
147
WAC 220‐110‐070 limits the hydraulic drop at any point in the culvert to 0.8 feet or one foot 1 depending upon the species present. Sills are typically installed in a series, with spacing about 2 equal to that of the channel width and a minimum spacing of 15 feet. 3
Concrete or SheetPile Weirs 4 Using precast concrete weirs is an option for rigid controls with the advantages that concrete is 5 self‐ballasting, durable, and can be formed into a crest with a stream‐like cross section. One type of 6 design uses precast concrete panels which are lowered into trenches cut in the channel. Another 7 design includes a weir, stilling basin, and wing walls in a single precast unit. Potential 8 disadvantages are cost, aesthetics and the equipment and excavation required to place heavy, 9 precast units. 10
11
Figure 7.6: Soldier pile and cast concrete grade control structures at a dam removal site on 12 Goldsborough Ck. This site has now become thickly vegetated and has a more streamlike appearance. 13
Concrete highway median barriers and ecology blocks are not acceptable materials for fish‐passage 14 weirs. 15
Sheet pile has been successfully used to control gradient and provide fish passage for most fish. The 16 crest can be cut to mimic the stream cross section but must be capped with a steel shape or 17 concrete to soften the sharp edge. 18

2nd Draft Water Crossing Design Guidelines 11/30/11
148
Sheet pile and concrete weirs, if adequately embedded, can be spaced more closely and at a steeper 1 slope than other weir designs, but the downstream effects must be accounted for with additional 2 bed control structures. 3
Log Sill Design Details 4 Log sills are built from a pair of logs, each with a minimum diameter of one foot, placed into the 5 streambed, Figure 7.7. It is recommended that the sum of the diameters at any point along the 6 structure be at least 2.5 feet. The pool below each sill will scour to a depth greater than two feet 7 below the downstream control elevation. A good rule of thumb to control deflection of the top log 8 is to use a log with a diameter 1/25th of the log length. 9
10
Figure 7.7: Log control used to control grade at the outlet of a culvert. 11
Double logs are used to prevent the scour pool from undermining the structure. The ends are 12 buried into trenches excavated into the streambanks a minimum of five feet. The logs are normally 13 Douglas fir due to its availability, straightness and resistance to decay. Their longevity is enhanced 14 by being installed level so they are permanently submerged. 15
The bottom log is offset upstream on a line about 45 degrees from vertical to allow the scour to 16 undercut the upper log. The top log is strapped to precast concrete blocks buried below each end of 17 the sill and sized adequately to anchor the logs. Careful anchorage or ballasting of the logs is critical 18 to their stability. The structural integrity of the log sill depends entirely on the ballast blocks. Well‐19 graded rock placed on the ends of the structure serves as closure for the installation trench and 20 protection for the backfill; it is not used for anchorage. 21

2nd Draft Water Crossing Design Guidelines 11/30/11
149
A seal is attached to the upstream face of the top log, and buried two feet below the streambed, 1 extending upstream at least six feet. Geotextile fabric is recommended with a tensile strength of at 2 least 600 lbs. and a burst strength of at least 1,200 lbs. Geotextile fabric has the advantages of 3 longevity, availability and flexibility for ease of construction. It is easier to install than impermeable 4 material, which tends to billow in the stream current during installation. The fabric must be 5 extended into the trenches to completely seal the structure. 6
Well‐graded riprap or riprap mixed with soil is packed over the ends of the logs within the trenches 7 and on the banks, extending to six feet downstream of the sills. The riprap serves as bank 8 protection, not ballast. 9
The well‐graded rock mix prevents flow from plunging into the voids and promoting piping around 10 the structure. 11
A pool is excavated two feet deep by six feet long in the channel downstream of each log sill in 12 preparation for the natural formation of a scour pool. If a pool is not initially constructed, there is a 13 risk that the first high flow will stream over the sills and energy will not be adequately dissipated, 14 resulting in downstream channel erosion. 15
The bank rock must extend to the floor of the pool. For installations where bed material does not 16 pass into and through the fishway, the floor of the pool should also be lined with riprap rock. 17
Knowledge gained through observation indicates that the maximum fish‐passage design flow is 18 limited to about 9.5 cfs per foot of length of the log sill. The maximum, safe, high design flow has 19 not been quantified. The highest known flow safely experienced by a series of log sill structures is 20 15 cfs per foot of length. The weir coefficient for a log weir submerged to 50 percent of its depth is 21 approximately 2.7, based on field measurements. In laboratory experiments, Heiner (Heiner 22 1991)found that a weir coefficient of about 3.8 for full‐scale, un‐submerged nape, smooth (PVC) 23 pipe. 24
Sills should be located in straight sections and at the entrance and exits of channel bends; they 25 should not be installed in the bends themselves. There is a risk that if a lower sill of a series fails, 26 those above it will be undermined and also fail in a chain reaction. If a number of bed sills are 27 placed in a series, deeper sills should be placed at intervals (every fifth sill). The deeper sills should 28 be designed as independent dams capable of controlling the full drop, assuming the downstream 29 controls do not maintain a backwater. Their purpose is to prevent the chain reaction and the 30 failure of the entire series. 31
When used for fish passage, sills within a series should be constructed with equal lengths for 32 uniform hydraulic conditions at high flows. Energy is often not dissipated over log controls during 33 peak floods. The downstream channel is, therefore, scoured and lowered in the vicinity of the logs. 34 To prevent a barrier from occurring below the downstream sill, additional downstream sills should 35 be constructed at or below the channel grade. 36
A notch is cut in the crest of the sill after it is installed to assist with fish passage. The shape and 37 size of the notch depends upon the fish species requiring passage and the low flow expected at the 38

2nd Draft Water Crossing Design Guidelines 11/30/11
150
time of passage. The notch generally slopes down to form a plume that fish can swim through 1 rather than having to leap through a free nappe. Be careful to not make the notch so large that the 2 top of the log is dewatered at low flow. 3
BOULDER CONTROLS 4 Boulder controls have been built for many years with mixed reviews (Rosgen 1997; Combs and al. 5 1998). Most have deteriorated over time due to poor design or construction, but they also have an 6 inherent weakness; a minor change in the position of any boulder in the structure fundamentally 7 changes its performance and ultimately shortens its useful life. There is no redundancy in the 8 structure, which is why constructed cascades have supplanted them. They are, therefore, not 9 generally a desirable bed‐control option where a precise control elevation has to be preserved for 10 the life of a culvert. They may have an application where the culvert upstream will be replaced 11 within a few years. 12
13
Figure 7.8: Boulder controls to maintain grade at a culvert replacment site, NP Ck. These controls are 14 13 years old. 15
A common, acceptable application of this technique is to control channel regrade upstream of a 16 culvert that has been enlarged and/or lowered. Since the rock controls tend to fall apart over time, 17

2nd Draft Water Crossing Design Guidelines 11/30/11
151
they gradually change from a drop structure to a low cascade and eventually to a short, roughened 1 channel. Gradual, channel‐regrade processes may be less impacting than a sudden change, 2 especially in terms of sediment release. The problem with this strategy is that it is very difficult to 3 design something to fail since a designer can predict the probability of a design flood being 4 exceeded but cannot predict the exact time when a flood will occur. 5
Size, shape and placement of the boulders are essential to the longevity of the structure, Figure 6 7.8. A minimum of two rows of rocks form the weir. One row creates the crest over which the flow 7 drops; the other row is below and slightly in front of the crest and prevents scour beneath the top 8 row. Boulders used for weir and foundation rocks should be sized on the basis of the stream design 9 discharge and slope. Small, lower‐gradient streams should use a minimum two‐foot mean‐10 dimension rock. Larger, high‐gradient streams require rock as large as four to six feet mean 11 dimension. 12
FISHWAYS 13 Formal fishways, or fish ladders, are structures specifically designed for the passage of fish, usually 14 for the strong swimming, more vigorous salmonids. These structures present a barrier to many 15 native non‐salmonids (Mongillo and Hallock 1997) and require frequent inspection and 16 maintenance (see Chapter 6 for inspection methods and critical criteria). For these reasons 17 fishways are not recommended as grade control unless other alternatives are not feasible. 18
19
Figure 7.9 Fishway at the outlet of a baffled culvert, Dickerson Ck. This fishway is composed of precast 20 concrete weirs formed to a pool and chute configuration. 21 22

2nd Draft Water Crossing Design Guidelines 11/30/11
152
The most common application of fishways is to rapidly raise the water surface elevation so that an 1 existing culvert can be brought into compliance with passage criteria or for the design of a new culvert in 2 challenging situations. A rare instance of a replacement culvert requiring a fishway is shown in Figure 3 7.9. Due to unusual circumstances, the culvert in this photo had to be jacked through the road fill and 4 baffled. As described in Chapter 5, baffled culverts must be installed at a grade less than 3.5%. In order 5 to meet this criteria the downstream end of the pipe had to be raised 5 feet in a short distance. This was 6 accomplished with a pool and chute fishway (see FISHWAY GUIDELINES FOR WASHINGTON STATE 7 http://wdfw.wa.gov/hab/ahg/fishguid.pdf). 8 9 At one time, fishways were used to provide passage at existing culverts with large outfall drops but still 10 within fish passage criteria on other counts. Due to the inspection and maintenance requirements 11 mentioned above most of these culverts are being replaced rather than retrofitted. In the long run, this is 12 the best alternative for all fish. 13
14

2nd Draft Water Crossing Design Guidelines 11/30/11
153
CHAPTER 8: CULVERT AND BRIDGE REMOVAL OR ABANDONMENT 1
2
Figure 8.1: Culvert abandonment site showing full floodplain excavation and placement of large wood 3 in excavation. 4
Road abandonment is the complete removal of the crossing, its associated fill and the obliteration 5 or water barring of the connecting roadways. The word “abandonment” has specific meaning for 6 those working in private forestlands and state lands as found in the FOREST PRACTICES BOARD 7 MANUAL Section 3, Guidelines for Forest Roads (Washington Dept. of Natural Resources 2000). 8 Removal means that the crossing is taken out with the intention of replacing it at a later time. Both 9 methods will reestablish fish passage, although the intended purpose of abandonment is to re-10 establish the natural drainage with no additional maintenance required. Figure 8.1 is an example 11 of a properly abandoned road crossing. 12
The FOREST PRACTICES BOARD MANUAL provides these recommendations: 13
• Re‐establish the natural streambed as close to the original location as possible so it matches 14 the up and downstream width and gradient characteristics. 15
• Place all excavated material in stable locations. 16 • Leave stream channels and side slopes at a stable angle. 17
Improperly applied, these provisions could leave a site with lasting impacts to the stream and the 18 fish life that inhabits it. One of the objectives of crossing abandonment should be the 19 reestablishment of channel connectivity and the passage of fish. 20

2nd Draft Water Crossing Design Guidelines 11/30/11
154
1
Figure 8.2: Plan view of road crossing abandonment showing excavation of road fill and placement of 2 large wood when it is available on site and nonmerchantable. 3
It is recommended that the road fill be excavated back to the flood prone width or the original 4 valley width, Figure 8.2. This allows the stream to use its floodplain and reestablish the full 5 riparian zone. In cases where the channel occupies a valley formed by glacial or fluvial processes far 6 in excess of those present today (an underfit channel), it is recommended that the fill be pulled back 7 to the flood prone width (the horizontal extent at a height of twice the bankfull depth). The side 8 slopes should be no steeper than 2:1 unless the natural contours would assume a steeper slope. 9 Exposed soil should be covered with straw to reduce erosion until vegetation is established. 10
11
Flood prone width or natural valley wall
Bankfull width
Cut slope max 2:1, Toe to match greater of flooprone width or natural valley toe.
Road fill Road fill
Abandoned road surfaceAbandoned road surface
Add wood to help stage and store sediment
Cut slope 2:1 or natural valley slope; toe width to match greater of floodprone width or natural valley toe.

2nd Draft Water Crossing Design Guidelines 11/30/11
155
1
2
Figure 8.3: Profile view of road crossing abandonment showing the overall drop in water surface. 3
When planning an abandonment, the overall drop through the culvert should be measured. The 4 overall drop is the outfall height plus the vertical drop through the culvert (slope times length) 5 Figure 8.3. When the culvert is removed, this overall drop will be expressed as a single vertical 6 face at the inlet end of the excavation. This face will either regrade, as discussed in Chapter 7, or 7 remain, depending on the height and the materials it’s made of. When the outfall drop is moderate 8 and the bed material mobile, the crossing can be abandoned and the regrade expected to resolve 9 itself over time without repercussions. The concern is that if the bed materials or the underlying 10 soil or rock does not readily erode, there will be a distinct drop that can be a barrier to fish passage 11 for a long time. The following guidelines are recommended: 12
• If the overall drop is greater than 1 foot and the channel bed is composed of, or underlain 13 by, soft or weathered bedrock, cemented glacial till or hard clay, then the upstream bed 14 should be excavated to form a continuous profile of a similar slope as the adjacent channel. 15 A hard bedrock sill was probably present before the culvert was installed and will be the 16 same challenge to fish passage as it was before. Adding wood from the fill slope and gravel 17 from the fill to the excavation will improve channel recovery in this latter instance (shown 18 in the upper profile in Figure 8.4). 19
• If the overall drop is less than 2 feet and the bed is gravel, then the culvert can be removed 20 without further work done to the channel. If the drop is in excess of 3 feet, then the 21 upstream channel should be regraded to form a continuous profile through the worksite 22 and into the upstream channel. (shown in the lower profile in Figure 8.4) 23

2nd Draft Water Crossing Design Guidelines 11/30/11
156
1
Figure 8.4: Stream profiles at road crossing abandonment sites showing 2 regrade treatments. 2
3
Mechanically remove part of the expected regrade when bed is composed of materials not expected to move in the near future.
Add wood to help stage and store sediment
Add wood to help stage and store sediment
Mobile bed materials expected to rapidly regrade

2nd Draft Water Crossing Design Guidelines 11/30/11
157
CHAPTER 9: CROSSING SITE CONSIDERATIONS 1
SUMMARY 2 • Cumulative impacts of road crossings can be minimized by proper planning. 3 • Past road construction practices have left a legacy of crossings affecting fish passage and 4
natural processes at the mouth of many streams and down river valleys. 5 • Environmental factors should be considered in road design and land use planning to 6
minimize the number and location of crossings. 7 • Site specific considerations that should be considered in design include: 8
o Channel profile (covered in Chapter 7) 9 o Culvert alignment relative to the road and the stream 10
Skewed crossings, where the stream crosses the road at an acute angle 11 Culverts on meander bends 12
o Transitions that often occur between the existing stream channel and the new 13 culvert 14
o Balancing culvert length with habitat impacts, fish passage, constructability and cost 15
INTRODUCTION 16 Fish passage barriers and the cumulative habitat loss caused by water crossings can be reduced in 17 part by properly siting the culvert and by minimizing the number of road crossings. Both the 18 location of culverts and the land‐use planning that create the need for the culverts are important. 19 Transportation networks are imbedded in a complex array of laws, agreements with landowners, 20 expectations of business and travelers, and geography. Rarely can we significantly alter these 21 networks (except in timber or range lands) but we should strive to minimize their impacts. This 22 chapter discusses some ways to do this. 23 24 There are many resources available for the designer to thoroughly study the design of 25 transportation systems. Many of the references cited in this document have sections on crossing 26 site considerations. Of particular interest are HIGHWAYS IN THE RIVER ENVIRONMENT (Richardson 27 2001), STREAM SIMULATION: AN ECOLOGICAL APPROACH TO PROVIDING PASSAGE FOR AQUATIC ORGANISMS 28 AT ROADSTREAM CROSSINGS,(Forest Service Stream‐Simulation Working Group 2008) and the 29 resources at the U. S. Dept of Transportation Federal Highways Administration website 30 http://www.fhwa.dot.gov/hep/. 31 32
PAST ROADWAY CONSTRUCTION PRACTICES 33 For ease of construction roads and highways have been built along historic transportation routes in 34 the flats along river valleys or adjacent to large bodies of water. This practice led to roadways not 35 only impacting the floodplains and shorelines of these water features, but also every tributary that 36 enters the valley along the roadway alignment. Often, major transportation routes were 37 constructed on both sides of major water features and river valleys to avoid complications with 38 spanning the larger bodies of water. This led to habitat impacts of multiple fish bearing tributaries 39 in many drainage basins and in some cases all fish bearing tributaries, Figure 9.1. 40 41

2nd Draft Water Crossing Design Guidelines 11/30/11
158
1 Figure 9.1. River segment showing multiple road crossings of tributaries along both banks. 2 3 When transportation routes are located along valley walls they affect these tributaries in many 4 ways. The roadway is often at the transition from higher gradient entrenched streams into lower 5 gradient meandering streams as they enter the flats along the flood plain or shoreline where 6 depositional features, such as an alluvial fan, are located. Alluvial fans are, by nature, evolving 7 things where there are any number of distributaries that move in response to the episodic influx of 8 sediment. In the past, the road crossing was placed at the current channel location and elevation 9 without understanding the nature of the alluvial fan’s behavior. Over time these crossings create a 10 geomorphic constriction in the natural system and eventually become maintenance problems or 11 cause structural failures. 12 13 Another frequently used method for constructing roads was to follow the stream valleys of 14 tributaries from the highlands down to the valley bottom. The road is run down the middle of the 15 valley, forcing the stream between the road fill and the valley wall, often with multiple crossings, 16 Figure 9.2. The stream is channelized and steepened, interfering with natural dynamics and 17

2nd Draft Water Crossing Design Guidelines 11/30/11
159
ultimately changing its whole character. The valley wall and road embankment are subject to scour 1 and require frequent and costly maintenance. The channel bed scours and fills in response to 2 confinement and sediment pulses. Undersized bridges or culverts become perched or buried as the 3 channel convulses though storm events. Despite these chronic impacts and continual maintenance, 4 these roads are rarely abandoned. 5 6
7 Figure 9.2. Roadway following stream valley. Note multiple crossings, orphaned channels and 8 modified stream alignments. 9 10 11 New road and highway alignments can be planned to entirely avoid and/or minimize these impacts 12 and reduce long term impacts to the stream. 13 14
15
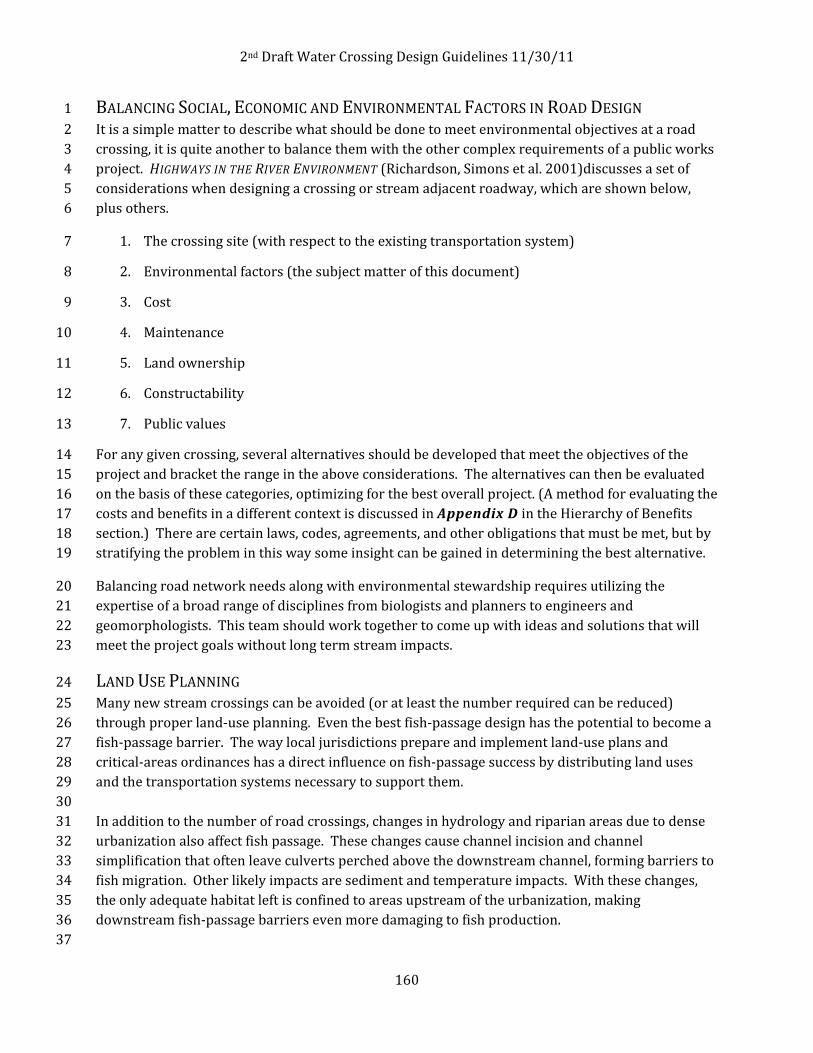
2nd Draft Water Crossing Design Guidelines 11/30/11
160
BALANCING SOCIAL, ECONOMIC AND ENVIRONMENTAL FACTORS IN ROAD DESIGN 1 It is a simple matter to describe what should be done to meet environmental objectives at a road 2 crossing, it is quite another to balance them with the other complex requirements of a public works 3 project. HIGHWAYS IN THE RIVER ENVIRONMENT (Richardson, Simons et al. 2001)discusses a set of 4 considerations when designing a crossing or stream adjacent roadway, which are shown below, 5 plus others. 6
1. The crossing site (with respect to the existing transportation system) 7
2. Environmental factors (the subject matter of this document) 8
3. Cost 9
4. Maintenance 10
5. Land ownership 11
6. Constructability 12
7. Public values 13
For any given crossing, several alternatives should be developed that meet the objectives of the 14 project and bracket the range in the above considerations. The alternatives can then be evaluated 15 on the basis of these categories, optimizing for the best overall project. (A method for evaluating the 16 costs and benefits in a different context is discussed in Appendix D in the Hierarchy of Benefits 17 section.) There are certain laws, codes, agreements, and other obligations that must be met, but by 18 stratifying the problem in this way some insight can be gained in determining the best alternative. 19
Balancing road network needs along with environmental stewardship requires utilizing the 20 expertise of a broad range of disciplines from biologists and planners to engineers and 21 geomorphologists. This team should work together to come up with ideas and solutions that will 22 meet the project goals without long term stream impacts. 23
LAND USE PLANNING 24 Many new stream crossings can be avoided (or at least the number required can be reduced) 25 through proper land‐use planning. Even the best fish‐passage design has the potential to become a 26 fish‐passage barrier. The way local jurisdictions prepare and implement land‐use plans and 27 critical‐areas ordinances has a direct influence on fish‐passage success by distributing land uses 28 and the transportation systems necessary to support them. 29 30 In addition to the number of road crossings, changes in hydrology and riparian areas due to dense 31 urbanization also affect fish passage. These changes cause channel incision and channel 32 simplification that often leave culverts perched above the downstream channel, forming barriers to 33 fish migration. Other likely impacts are sediment and temperature impacts. With these changes, 34 the only adequate habitat left is confined to areas upstream of the urbanization, making 35 downstream fish‐passage barriers even more damaging to fish production. 36 37

2nd Draft Water Crossing Design Guidelines 11/30/11
161
Roadways also have a tendency to isolate habitats at road crossings. These crossings can create 1 fragmentation and can eliminate entire historic species from an ecosystem without the necessary 2 habitat connectivity (Jackson 2003). 3
NEW ROAD AND HIGHWAY ALIGNMENTS 4 All stream crossings can result in some form of impact to the stream. Viable options for the location 5 of new roadway alignments away from the direct impact to streams should be evaluated and 6 considered, including an option that has no direct impact to the stream. Instances where roadways 7 must impact or cross streams should be kept to a minimum. In forestry situations, strict application 8 of these recommendations may unintentionally result in more road construction than is truly 9 necessary to access forest stands, with financial and other ecological implications. A shorter but 10 well‐designed and constructed road system with an appropriately designed stream crossing could 11 be more efficient and still protect fish life. 12 13 Habitat impacts from crossings on new roadway alignments should be considered. Culverts should 14 not be placed in critical areas that are imperative to the fish health of the stream. For instance a 15 highway crossing should not be placed over the only suitable low gradient chum spawning habitat 16 within a stream system. When possible, wetlands and floodplains should be avoided to minimize 17 impacts from road fill and side slopes within these critical areas. 18 19 Inappropriately designed crossings located closer to the larger bodies of water, rivers, lakes and 20 bays, will generally affect more aquatic species than crossings located nearer to the streams 21 headwaters. In order to reduce the number of stream crossings, it may be necessary to place 22 crossings lower in the watershed and follow the ridgelines between tributaries for the road 23 network. This can create its own set of problems and issues such as roadway runoff and 24 stormwater management but is an option to consider to reduce the numbers of stream crossings. 25 26 Often when new highway alignments are planned the existing alignments are left in place and used 27 as local roads. Consideration should be given to whether or not the existing alignment will be 28 abandoned or left in place and continue to cause stream impacts. If it is left in place then any 29 barriers along the old alignment could be fixed as part of the new proposal. 30
Guiding principles for new road and highway alignment crossings: 31
• Use interdisciplinary teams to evaluate and plan new roadway alignments 32 • Cross streams only when absolutely necessary 33 • Keep the number of stream crossings to a minimum 34 • Cross streams by the most direct route where the stream is straight and uniform and at 35
right angles to the natural flow of the stream 36 • Locate road crossings where there will be minimal disturbance to the existing topography 37 • Locate crossings away from tributaries and drainage ditches 38 • Avoid critical areas such as wetlands and spawning habitat 39 • Avoid reaches showing signs of channel instability 40 • Avoid areas that require constraining, re‐aligning, or altering the natural channel 41
42
43

2nd Draft Water Crossing Design Guidelines 11/30/11
162
EXISTING ROADS 1
Before doing any improvements to an existing road it should be evaluated for stream impacts. 2 Roads that are adjacent to and run parallel along streams often create many impacts to streams and 3 usually have many stream crossings and should be considered for relocation or abandonment 4 (Washington Dept of Natural Resources 1999). Although it can be costly, relocating roads that are 5 chronically impacting the stream to a more favorable alignment, or better yet, complete 6 abandonment if the road is no longer necessary or if alternate access is available, will likely reduce 7 long term maintenance issues. 8
The design team should review the current roadway alignment and maintenance history. If the 9 roadway is located in a geologically sensitive area such as steep, high unstable slopes, wet areas 10 such as seeps, or in areas where active erosion is occurring, it should be considered for removal or 11 relocation. 12 13 Habitat impacts from the existing crossing should be considered. Roads that have crossings located 14 in areas with re‐aligned or constrained channels or in critical areas such as spawning reaches, flood 15 plains, and wetlands should be removed or mitigated for. 16 17 Existing crossings located lower in the watershed will impact the entire stream upstream of the 18 crossing and generally affect more aquatic species, which result in greater habitat impacts. 19 Improperly designed crossings located in headwaters of the watershed can have downstream 20 effects from flow attenuation, erosion, and sediment transport limitations. 21 22 Because of the physical and socioeconomic concerns at an existing road crossing it is difficult or 23 impossible to design and construct stream crossings that provide natural stream function. Other 24 alternatives may need to be explored that may include relocating the roadway or higher risk design 25 options. If the current crossing site is the only reasonable option for replacement, then site specific 26 design considerations must be utilized to minimize risk. 27
Guiding principles for crossing replacement at existing crossings: 28
• Use interdisciplinary teams to evaluate and plan crossing replacement projects 29 • Abandon existing roadways when possible, especially those that are stream parallel, cross 30
wetlands, or occur at grade breaks. 31 • Consider roadway relocation 32 • Consider local roadway alignment changes to: 33
o Cross streams by the most direct route where the stream is straight and uniform 34 and at right angles to the natural flow of the stream 35
o Locate crossings where the stream has low but stable banks 36 o Locate road crossings where there will be minimal disturbance to the existing 37
topography 38 o Locate crossings away from adjacent tributaries 39 o Avoid critical areas such as wetlands and spawning habitat 40 o Avoid reaches showing signs of channel instability 41 o Avoid areas that require constraining, re‐aligning, or altering the natural channel 42
• Design crossings to allow for natural stream function 43

2nd Draft Water Crossing Design Guidelines 11/30/11
163
SITE SPECIFIC DESIGN CONSIDERATIONS 1 2 When a roadway crosses a stream a crossing structure is necessary. These structures should be 3 laid out to match the horizontal and vertical alignment of the natural stream. Structure length 4 should be kept as short as possible by crossing streams where the roadway alignment is 5 perpendicular to the natural stream. On the other hand, where the stream is skewed to the road, a 6 longer culvert may be necessary to keep it aligned as closely as possible to the stream. 7 8 Once a suitable crossing site location is determined, either through the planning process for the 9 alignment of new roadway construction or by the limitations at an existing road crossing, site 10 specific design can begin. 11 12 Road crossing design and location should not fragment natural habitats and allow the same level of 13 aquatic organism passage as the natural stream. It should be designed to fit the stream and its 14 natural processes. Consider the how the channel alignment / profile and the roadway alignment / 15 profile impact each other. Road crossings should not be located in areas where the stream is 16 exhibiting signs of unstable channels. Lateral migration and vertical channel stability should be 17 considered in culvert location and design. These topics are discussed in more detail in other 18 chapters: Chapter 1: Geomorphic Design, Chapter 4: Bridge Design, Chapter 7: Channel 19 Profile adjustment. 20 21 Performing a geomorphic site and reach assessment on the stream at the potential crossing site will 22 give insight as to the suitability of the crossing structure and location. For new crossings, this 23 analysis will inform the designer of many factors that may be occurring at the site and assist in 24 determining design options. Take for example a transport or depositional reach, are there other 25 factors man‐made or naturally occurring that are creating or have the potential to promote 26 geomorphic changes in the reach that should be accounted for? 27 28 For replacement road crossings, assessing the existing channel condition is somewhat more 29 complicated than on unaltered natural streams. It often requires forensically assessing the impacts 30 from past culvert installations, stream modifications and changes to the watershed to determine 31 which of these impacts are occurring as a result of the existing crossing and/or channel 32 modifications or would have occurred naturally. This type of analysis will give the designer much 33 insight as to the appropriateness of the crossing location and design type. 34 35 Important design elements that will impact the hydraulics of road crossings: 36 37
• Channel Slope 38 • Rate of change in channel slope 39 • Channel vertical adjustment 40 • Stream approach angle 41 • Roadway skew 42 • Stream transitions to and from road crossing 43 • Radius of curvature of stream approach 44 • Channel modifications that shorten or lengthen the stream 45 • Streambed material composition 46 • Sediment transport 47 • Road crossing (culvert) length 48 • Length of road approach 49

2nd Draft Water Crossing Design Guidelines 11/30/11
164
• Debris and ice loading 1 • Maintenance history 2
3
CHANNEL PROFILE 4 Channel profile and slope are one of the most important considerations that must be given when 5 looking at a crossing site. The rate of change in channel slope will give an idea of how much the 6 channel slope is transitioning or will show potential impacts of the existing crossing structure in 7 this reach. Use the amount of anticipated vertical channel adjustment to determine how deep to set 8 the footing of the structure. If the reach through the crossing site cannot mimic the conditions of the 9 natural reaches both up and downstream, then it may be entirely unsuitable for a fish passage 10 structure that provides natural stream function. For more information on channel profile see 11 Chapter 7: Channel profile adjustment. 12 13
CULVERT ALIGNMENT 14 Culvert alignment refers to the relationship between the orientation of the roadway to the stream. 15 In simple cases the stream would cross the road in an area of stable banks and profile 16 perpendicular to the roadway alignments. This is rarely the case and crossing alignment becomes a 17 very important factor in the long term functionality of the stream crossing. 18 19 Skewed crossing alignments 20 Skew angle is the angle represented by overlaying the stream and roadway alignments. Skew angle 21 plays an important factor in determining the overall effectiveness of a road crossing to provide 22 natural stream function. Past practices have typically modified the stream channel to provide a 23 shorter crossing that is normal to the roadway alignment. In most cases this was done to decrease 24 the cost of the structure and to stay within allocated ROW, but will always have some impact on the 25 natural stream. In the past, when culverts were designed for hydraulic conveyance alone, skewed 26 inlets reduced the efficiency of the culvert inlet and increase the risk of debris loading and sediment 27 deposition. Skew affects modern culverts designed according to Chapters 2 and 3, by directing flow 28 down one wall or another and by causing scour at an inlet corner or wing wall. These are not 29 desirable consequences, but they can be managed with the placement of wood or rock. 30
New culvert installations should avoid designing around excessive skew and consider other 31 options. Replacement of existing crossings should be done to optimize the skew angle relative to 32 the historic channel up and downstream. Risk of future crossing failure increases with skew angle 33 and therefore extreme skew should be avoided in all cases. Aligning a new structure with the 34 stream channel may require a longer crossing structure, which can present its own set of problems. 35 Figure 9.3 shows three potential alignment options for culverts on a skew. 36

2nd Draft Water Crossing Design Guidelines 11/30/11
165
1
Figure 9.3: culvert skew options, see text for an explination. (Forest Service StreamSimulation 2 Working Group 2008) 3
Option A. shows the use of a longer culvert placed on the natural alignment of the stream. This 4 option will increase culvert length but is aligned with the steam and will function better over time 5 than a skewed inlet. The added culvert length does decrease the open channel area, but modern 6 culverts provide some level of habitat inside, not the direct loss that occurred when bare pipes 7 replaced stream channels and we sought to minimize length. 8
Option B. shows a stream realignment to shorten the culvert length. This results in a skewed inlet 9 and outlet which, unless carefully designed and constructed, will have long term impacts from 10 sediment aggredation, debris buildup, erosion and scour. The culvert is shorter and therefore less 11 expensive, but the impacts to the channel and maintenance costs may outweigh the savings. 12
Option C. uses headwalls and wingwalls to decrease culvert length. When combined with 13 increased culvert width it results in a crossing that minimizes the impact to the stream. The added 14 cost of the retaining walls would have to be weighed against the cost of increased culvert length. 15
Stream simulation culverts using option A are increasingly common. As mentioned below and in 16 Chapter 3, culverts longer than about 10 times their span may need to be wider to compensate for 17 the channel confinement that this creates. This added concern may make option C more attractive. 18 Option B is not preferred, but may be used if the channel transitions are properly designed and 19 habitat impacts are avoided or minimized. 20
Road crossings on stream bends 21 In some instances a designer will need to consider crossing a stream on a natural bend. These 22 situations should be avoided for new roadway alignments when possible. This situation is more 23 likely to present itself when considering a replacement at an existing crossing that is scheduled to 24 be replaced for structural, maintenance or habitat restoration reasons. An assessment of the lateral 25

2nd Draft Water Crossing Design Guidelines 11/30/11
166
stability in the bend is very important when considering a crossing at these locations. Instream 1 structures may need to be utilized to improve and maintain the approach condition to and from the 2 culvert. 3
As in the case with skewed alignments, past roadway construction practices have led to cutting off 4 bends to make the stream fit the road. In most cases this was done to decrease the cost of the 5 structure and to stay within allocated ROW, but will always have some impact on the natural 6 stream. When meander bends are cut off the channel is shortened resulting in increased slope at 7 the road crossing and disconnection from available habitat. When replacement crossings are being 8 considered the designer should evaluate the feasibility to put the stream back in its historic channel 9 to regain lost habitat. 10
Three potential culvert alignments on stream bends are represented in Figure 9.4. 11
12
Figure 9.4: Options for locating a culvert on a bend, see text. (Forest Service StreamSimulation 13 Working Group 2008) 14
Option A. shows a crossing on the existing stream alignment. Without additional provisions this 15 crossing may experience erosion along the outside bend and similar problems associated with skew 16 angle. 17
Option B. shows a crossing placed by constructing a new channel and cutting off the existing 18 channel bend. This will result in a shorter channel length and increased slope at the crossing. This 19 option disconnects much of the existing habitat. Existing crossings that have been already 20 constructed using this option and are having maintenance or fish passage issues should consider 21 reconnecting to historic habitat by replacing the crossing with a bridge or something similar to 22 option c. 23

2nd Draft Water Crossing Design Guidelines 11/30/11
167
Option C. utilizes headwalls and wingwalls to decrease culvert length along with increased culvert 1 width to result in a crossing that minimizes the impact to the stream. 2
STREAM TRANSITIONS 3 It is often necessary to work well off of existing ROW to provide a natural stream transition from 4 the stream to the new structure. A well thought out transition will alleviate many future 5 maintenance problems such as debris and sediment loading by creating a gradual hydraulic 6 morphing into the crossing. The natural channel cross‐section and the cross‐section constructed 7 through the crossing should be the same (at least up to bank full) so that material that is moving in 8 the natural channel will also pass through the constructed channel in the crossing. 9
The USFS (Forest Service Stream‐Simulation Working Group 2008) recommends that the radius of 10 curvature of the stream at the transition to the crossing be at least 5 times the bankfull width. 11
CULVERT LENGTH 12 As culverts become longer, for instance, crossing multiple lanes of an interstate highway, the risks 13 and impacts of poorly designed crossings becomes more severe. Meander belt width begin to 14 become constrained when the culvert is 8 to 10 channel widths in length and the stream simulation 15 equation is applied (See Chapter 3, Equation 3.2). The additional length can also affect the 16 longitudinal profile by entirely spanning a transitional reach of the stream with the crossing. This 17 indicates a need to consider additional alternatives in the design process such as bridges and 18 increasing the structure opening width or height to accommodate the natural processes. 19 Decreasing the culvert length is a priority in these cases and can be accomplished by lowering the 20 road grade, steepening and/or narrowing the road prism, and utilizing headwalls and wingwalls. 21 See Chapter 3: Stream Simulation for additional discussion on culvert length. 22
MAINTENANCE 23 24 Maintenance activities are usually initiated after large storms or unique events that plug the 25 culverts inlet and threaten the roadway structurally. Smaller events are often forgotten until a 26 bigger maintenance need arises. These smaller events can lead to debris or sediment loading on a 27 smaller scale that does not threaten the roadway but can provide barriers to fish passage. 28 29 When a culvert has a history of scour or maintenance problems it is very important to assess the 30 applicability of a replacement at the current location and alignment. A history of chronic 31 maintenance could indicate that the existing crossing site is not suitable for a fish passage crossing 32 and other options should be explored. 33 34
35
36

2nd Draft Water Crossing Design Guidelines 11/30/11
168
CHAPTER 10: TIDE GATES AND FLOOD GATES 1
2
Figure 10.1: Cast iron tophinged tide gates prevent nearly all upstream fish migration. 3
SUMMARY 4 • Tide gates and flood gates block fish passage and degrade habitat 5 • Fish passage at tide gates can be improved by using (in order of increasing benefit) 6
o Light weight gate material 7 o Side‐hinged gates 8 o Automatic gates (Automatic tide gates are not a universal remedy; to a varying 9
degree fish passage and habitat are still adversely affected) 10 o Orifice control 11
• Providing partial fish passage at a tide gate does not restore full tidal inundation, the basic 12 requirement of estuary restoration. 13
• Most flood gates block fish passage year‐round but are only needed for flood control for 14 brief periods. Automated flood gates may benefit fishlife but important concerns remain. 15
INTRODUCTION 16 This chapter addresses fish‐passage and habitat issues associated with tide gates and flood gates. 17 These devices are, in principle, check valves that allow water to flow through in only one direction. 18 Tide and flood gates are intended to control tidal or floodwater fluctuations, respectively. The 19 actual device used to meet this objective might be a flap gate, a slide gate, a swing gate, a pinch 20

2nd Draft Water Crossing Design Guidelines 11/30/11
169
valve, or some variation or combination of these types. All tide and flood gates are considered 1 barriers to fish passage, Figure 10.1. Attempts have been made to design “fish friendly” gates, 2 although all gates that control water flow limit the unimpeded active or passive movement of fish 3 and other organisms that fish depend upon for feeding. In addition, the tide or flood gate, and its 4 attendant dike or road fill, constrain natural processes that create and sustain the habitat on which 5 fish depend. By their very nature, these gates cause impacts that are probably impossible to 6 mitigate for in their design. If one can accept these impacts to fish passage, habitat and habitat 7 forming functions, then modern gates can provide some lost functions. 8
GATE TYPES 9 Flap gates, swing gates, slide gates and pinch valves are styles of devices used as passive tide and 10 flood gates. The flap gate usually consists of a flat plate that is hinged horizontally at the top of a 11 culvert outfall, Figure 10.1 . The plate falls into a near vertical position over the face of the culvert 12 to close it. A positive head differential against the downstream side of the plate face forces the plate 13 against the rim of the culvert to seal it. A positive head differential against the upstream side of the 14 gate will force it open to release water. A swing gate is essentially the same as a flap gate except the 15 hinge is on the side and oriented vertically. Since the swing gate is mounted vertically like a door, 16 its weight is born by the hinge. A much smaller hydraulic head is required to open it, and it swings 17 open wider than a top hinged gate. 18
A pinch valve is a flexible pipe extension that is an alternative to flap gates but does not provide fish 19 passage. A pinch valve, such as a Tideflex®, can eliminate operational and maintenance problems 20 associated with flap gates, including corrosion of mechanical parts, warping that causes in‐flow 21 leakage and clogging due to trapped debris. (Tideflex® is provided as an example of what is 22 available; its mention is not intended as a product endorsement.) Pinch valves have no moving or 23 mechanical parts, can operate at extremely low head loss and are silent. Pinch valves are only 24 acceptable in cases where upstream fish passage is not required or in cases where fish are 25 intentionally excluded, such as a stormwater treatment facility or similar outfall. 26
Conventional tide and flood gates are fish passage barriers due to the head differential across the 27 gate causing too high a velocity or by the narrow opening available for passage when the gate is 28 only slightly open. Tide gates and flood gates may also be a barrier, like any other culvert, if they 29 are perched above the downstream channel or water surface by more than 0.8 feet. The elevation 30 at which the gate becomes a barrier is likely something less than 0.8 feet when it is in combination 31 with a narrow opening. There are several ways to design tide and flood gates to maximize fish 32 passage through the gates. These include gate orientation, gate material, gate operators and 33 latches, orifice gates, hydrology considerations, multiple installations in parallel. 34
Historically, tide and flood gates were constructed of cast iron or wood. Plastic, fiberglass and 35 aluminum gates are also available and are preferred because the lighter gates open easier for better 36 fish passage and for drainage. Today’s designs include float‐operated gates, such as self regulating 37 tide gates (SRT®), automatic electric‐ or hydraulically‐powered gates, and other mechanical 38 systems that allow a specific and variable operating range of upstream water surface elevation. This 39

2nd Draft Water Crossing Design Guidelines 11/30/11
170
class is collectively called automatic gates as opposed to passive gates that simply rely on the 1 direction of flow to either close or open. 2
3
4
5
6
7
8
9
Figure 10.2: Above, hydraulicallycontrolled automatic tide gate, and (right) a float controlled 10 automatic tide gate, both at Julia Butler Hansen Wildlife Refuge. Wooden barn door, side hinged, tide 11 gate, below. 12
13
14
15
16
17
18
19
20

2nd Draft Water Crossing Design Guidelines 11/30/11
171
Automatic gates don’t necessarily provide optimal fish passage. However, they do allow precise 1 control of the tide gate closure so fish blockage occurs only at specific water levels; and fish passage 2 is, therefore, better than it might be otherwise. 3
An alternative to installing fish‐friendly gates on the culvert in tidal situations is to place a smaller 4 culvert without a tide gate either alone or next to the main culvert. The orifice controls the amount 5 of seawater passing upstream at every tidal cycle. These designs can control the volume of water 6 that flows upstream during an extreme tide so that it will not exceed the allowable storage volume 7 and flood elevation above the culvert. This method was used in Brown Slough near the mouth of 8 the Skagit River (Skagit County, WA), where a 4 ft diameter culvert was specifically sized to allow 9 partial tidal inundation. Researchers (Beamer and LaRock 1998) found an equal density of zero‐10 age chinook upstream and downstream of the culvert within the first rearing season following 11 construction. It’s important to note that the orifice design applies only to tide gates; flood‐gate 12 installations normally have too long a closure period for the orifice to be useful. There are also 13 several designs for tide gates that use an orifice in the gate itself, sometimes with an automatic 14 door. The small size of the orifice make it a much less desirable alternative for “durable and 15 efficient” fish passage, RCW 77.57.030. 16
FISH PASSAGE 17 As explained earlier in this guideline, the Washington Department of Fish and Wildlife’s fish‐18 passage criteria must be satisfied 90 percent of the time during the migration season (Chapter 5, 19 Appendix B). In tidally controlled situations, a combined analysis of tidal influence and 20 stream flow is necessary to evaluate whether this criterion is satisfied. This may require the 21 analysis of tidal data in time increments and a continuous hydrologic‐simulation model. Any gate 22 that is closed an average of just a few hours a day cannot meet the state’s fish‐passage criteria 90 23 percent of the time. See the discussion Appendix D: Tidally Influenced Crossings for more 24 details. Considering the difficulty in achieving the standard fish‐passage criteria, new tide‐gate 25 installations are not generally permitted, and tide‐gate removal is a preferred action for restoration. 26 Where removal is not possible but there is a need to achieve the best possible fish‐passage 27 restoration, objectives that are different from the standard fish‐passage criteria might be 28 acceptable. Defining alternative objectives should be done in conjunction with a careful and 29 thorough review of allowable upstream water levels and timing. Passage goals have been 30 developed for specific projects to provide fish passage. As an example, tide‐gate retrofits have been 31 constructed such that the fish‐passage hydraulic criteria are exceeded no more than four 32 continuous hours at any time during the fish‐migration season. In that case, the tide gate remains 33 effective most hours of all days. Temporary fish blockages would occur for several hours at the 34 slack period of the highest tides. The hydraulics of tide gates must be modeled to evaluate 35 upstream water‐level fluctuations, water quality and fish passage. 36
TIDE GATES 37 The objective of a tide gate is to eliminate tidal inundation yet allow passive drainage of the land at 38 low tide. Tide gates have been used for over a hundred years in western Washington to convert 39 tidal wetlands into agricultural land. Huge agricultural areas have been created by the use of tide 40 gates and they received special attention when the Washington Legislature exempted them from 41

2nd Draft Water Crossing Design Guidelines 11/30/11
172
the law which requires fish passage when they are connected to an agricultural drainage system. 1 RCW 77.57.030(3) states that “tide gates, flood gates, and associated man‐made agricultural 2 drainage facilities that were originally installed as part of an agricultural drainage system on or 3 before May 20, 2003, or the repair, replacement, or improvement of such tide gates or flood gates” 4 need not provide fish passage. 5
Tide gates are typically attached to culverts that are placed through dikes at slough entrances 6 where there is a tidal influence. It is the dikes that protect the upland from tidal inundation; tide 7 gates simply provide the drainage. 8
When partially or completely closed, tide gates are barriers to all upstream fish migration. Even 9 when specifically designed for fish passage, most are also a barrier to migration because they don’t 10 open far enough, frequently enough, or in sync with the migration patterns of fish. Small fish move 11 with the main water mass, moving upstream with the flood, downstream with the ebb. Generally 12 speaking, tide gates close on rising tides, blocking upstream movement. Larger fish can move 13 volitionally and are capable of moving upstream on falling tides. But, the greatest area of 14 habitat occurs at high tide, which has been reduced or eliminated by the tide gate. 15
16
Figure 10.3: Longitudinal profile of a typical tide gate installation showing the major impediments to 17 upstream fish passage. 18
Figure 103 is a longitudinal profile of a typical tide gate and culvert installation showing the 19 major impediments to fish passage. A fish or other organism experiences the tide gate from the salt 20 to the freshwater side. Regardless of the type, the elevation of the tide gate in the water column 21 influences fish passage. At lower tidal elevations, adult upstream migrants move up the channel and 22 if they encounter a culvert elevated above the channel bed, perched, they are prevented from 23 moving into the culvert. Juvenile fish move in the nearshore in the top part of the water column. If 24 the tide gate and culvert are small compared to the tidal range, then fish are not likely to find it as 25 they move along the shore during higher tide elevations, being predisposed to remain in the upper 26 few feet of water. As mentioned earlier, the tide gate material and operation influence it’s 27 “passability,” but it is never considered 100% passable. The velocity and depth in the barrel of the 28 culvert may exceed the swimming ability of the fish that make it past the gate. There is often an 29 increase in velocity at the inlet of the culvert as flow contracts into the smaller culvert. Head loss in 30

2nd Draft Water Crossing Design Guidelines 11/30/11
173
excess of 0.5 feet (greater than 5 feet per second) is likely to be a barrier to juvenile and weak 1 swimming fish. For automatic tide gates and open tidally influenced culverts, the barrel velocity 2 and head loss is a function of not only the freshwater design flow (10% exceedance flow for 3 migration period), but also the discharge associated with the ebb of the tidal prism stored above the 4 tide gate. 5
NOAA Fisheries Science Center and the Skagit River Systems Cooperative are engaged in an on‐6 going study of the effects of “fish friendly” tide gates on fish abundance and migration. They have 7 preliminary results that indicate that automatic‐type tide gates on tidal sloughs, which remain open 8 for part of the flood tide, negatively affect the abundance and movement of juvenile Chinook salmon 9 when compared to similar but un‐gated sloughs. Some specific preliminary findings: 10
• Juvenile Chinook are present in lower numbers upstream of automatic tide gated sloughs 11 than where found in un‐gated sloughs 12
• These fish tended to spend less time behind the tide gate 13 • Tagged fish were shown to move less frequently across the gate and, in the case of larger 14
fish released above the gate, to move only once downstream and out of the slough. 15 • Indications are that the muted tidal cycle created by the automatic tide gate results in 16
reduced habitat quality which may be reflected in lower abundance with fewer repeated 17 visits by juvenile Chinook. 18
These preliminary results suggest that tide gates designed to better accommodate fish passage may 19 have only limited benefits for fish populations. More results should be available in the next few 20 years. The importance of these preliminary findings is that the impacts of dikes and tide gates 21 cannot be completely compensated for in design. 22

2nd Draft Water Crossing Design Guidelines 11/30/11
174
1
Figure 10.4: Edison Slough Water Surface Elevation, dashed line is the water surface downstream of 2 the SRT tide gate (tidal side) and the solid line is the water surface elevation upstream of the tide gate. 3
4
Figure 10.5: Edison Slough selfregulating tide gate. 5
The Edison Slough self‐regulating tide gate is shown in Figure 10.5. A set of floats control the 6 opening and closing of the tide gate based on the water surface elevation on the outside of the gate 7 controlling the time the gate is open during the tidal cycle. The performance of this gate is shown in 8 Figure 10.4 where the downstream tidal elevation (dashed line) is compared to the upstream 9 water surface elevation (solid line). The tide gate allows an approximately 1 to 1.5 feet of tidal 10 variation upstream of the gate, where the natural range is 5 feet in this particular tidal series. While 11
-1.00
0.00
1.00
2.00
3.00
4.00
5.00
6.00
750 800 850 900 950 1000
Elev
atio
n, ft
NG
VD a
ssum
ed
15 min interval

2nd Draft Water Crossing Design Guidelines 11/30/11
175
this gate will stay open part of the time during rising tide allowing fish passage, it does not create a 1 very significant tidal flow into and out of the slough, limiting the variation to the narrowest part of 2 the channel and failing to make a very meaningful difference in tidal circulation, scour, or the 3 movement of pelagic organisms. This gate has since been replaced with one similar to that shown 4 in Figure 10.2, top right. 5
The ecological impact of tide and flood gates in estuaries goes beyond being fish‐migration 6 barriers. Research has found (Simonstad and Thom 1992; Giannico and Souder 2005)that a 7 number of environmental factors are affected by tide gates. They modify hydrology, vegetation and 8 the general ecosystem functioning of coastal wetlands. Among these factors are surface‐water and 9 groundwater elevation, sedimentation, salinity, soil texture and creek morphology. Their influence 10 on water quality may be substantial. A saline marsh can be converted to a freshwater marsh when 11 it is located upstream of a tide gate. When saltwater estuarine habitats are lost or degraded, so are 12 the important and unique functions they provide, such as shoreline stability, water quality, trophic 13 energy (food web) support, fish and wildlife habitat for different species, recreation, promotion of 14 biodiversity, and the maintenance of microclimate characteristics. The importance of hydrological 15 connection has been repeatedly emphasized by other researchers (Zedler 1984; Kusler and Kentula 16 1989). These environmental impacts drastically alter the basic chemistry, tidal characteristics and 17 ecology of the upstream area. Such changes likely work cumulatively and in concert with the 18 migration‐barrier impact to further affect fish production. To make tide and flood gate projects a 19 success, the surface‐water hydrology of the upstream contributing basin must be well understood; 20 pre‐restoration surface water elevation must be determined, and salinities and soil texture should 21 be known. The ground may have subsided as a result of tidal action being excluded from the site. 22 Estuarine processes must be understood within the context of the current ground elevations. 23
Since tide gates block upstream inflow for estuaries, they block the movement of saltwater 24 upstream and the mixing with fresh water, causing a natural estuary with a salinity gradient to be 25 converted to a freshwater marsh. Meanwhile, on the downstream side of the tide gate, an 26 instantaneous change to high salinity occurs at the outfall. This requires migrating salmonids to 27 adapt themselves immediately to the saltwater environment because there is no longer a gradual 28 mixing of saltwater and fresh. The same action of blocking inflow also prevents temperature 29 mixing in the estuary. If the stream is a different temperature from the saltwater, the transition 30 point becomes sudden, rather than gradual, occurring at the tide‐gate outlet instead of being 31 dispersed throughout the estuary. When such a situation occurs, when salinity and temperature 32 impacts are concentrated at the tide gate itself, migrating fish cannot willfully select their preferred 33 temperature and salinity conditions. Once fish pass through the tide gate, they are instantly 34 dropped into a radically new water‐quality environment with no opportunity to move out of 35 it. Additionally, salinity and soil texture control the presence of certain types of salt‐marsh plant 36 species. Changes in salinity results in change in vegetation. Experience from Colony Creek in Skagit 37 County, WA showed that cattails, growing in an area that used to be too saline for them, trapped 38 sediment and caused increased flooding. A remedy to the flooding was to restore the salinity of the 39 estuary with the objective of eventually killing off the cattails. 40

2nd Draft Water Crossing Design Guidelines 11/30/11
176
Because of their hydraulic control, tide gates are usually installed to minimize the upstream water‐1 level fluctuation. When used on a stream that empties into Puget Sound, the upstream water 2 surface would be regulated to within just a few feet instead of the normal fluctuation, which 3 typically ranges between five and 18 feet. Surface‐water elevation and ground elevation are the 4 principal controls of marsh hydrology and vegetation. The height of the land elevation in relation to 5 the depth of water affects tidal flooding. The presence of groundwater and the bottom elevation, in 6 turn, determines the type of emergent salt‐marsh vegetation. 7
A natural estuary is characterized by tidal surge channels created by the rush of tidewaters in and 8 out. Conditions upstream of a tide/flap gate are altered by the change in hydraulic conditions of the 9 tide gate impoundment. A tide gate essentially eliminates the surging tidal flow. As a result, the 10 upstream channels tend to fill with sediment and modify channel geometry. 11
FLOOD GATES 12 Flood gates are placed where there is a temporary elevated water surface, such as a river during 13 flood stage, that must be excluded from developed land. Flood gates allow a stream channel or 14 drainage ditch to drain into a mainstem river, but prevent river floods from backing water into low‐15 lying property. Flood gates are almost always associated with a levee system. These gates are only 16 needed a few times a year, or as little as once every several years, but typically remain closed all the 17 time. This situation is particularly harmful to fishlife which is denied access to tributary systems 18 for spawning and rearing. Recently, flood gates have been designed with hydraulic or electric 19 control systems that bring the gate into action only when flood stage reaches a certain critical 20 elevation. While these systems appear to have benefits that outweigh the impacts, there remain 21 some major concerns that include: 22
• Juvenile fish seek off channel refuge during floods and flood gates exclude them from this 23 type of habitat. 24
• Adult salmonids often move upstream into tributary systems during flood events. They are 25 motivated to move on these freshets because the extra water depth created by floods allow 26 them to penetrate deeply into a watershed. 27
• Some rivers flood for sustained periods, precisely at a time when fish are seeking access to 28 off channel areas. If the gate was closed for several weeks during the fish passage season it 29 would have a significant effect on the population. 30
Providing that the size of the flood gate and the culvert it is attached to meet the criteria set forth in 31 this guidance under Chapters 2, 3, or in rare instances, chapter 6, the automatic flood gate just 32 described could be considered “partially passable” after careful review of its expected performance 33 with respect to the bullets just discussed above. Whether this meets all the requirements of 34 Washington fish passage law depends on the specific circumstances and must be evaluated on a 35 case by case basis. 36
37
38
39

2nd Draft Water Crossing Design Guidelines 11/30/11
177
CHAPTER 11: CARE OF ROAD RUNOFF 1
The Water Crossing Design Guidelines are primarily concerned with the effect of crossing design 2 and construction on fish and their habitat. In this chapter we will discuss runoff from roads and 3 development that enters the stream at the crossing. Generally, crossings are located in a valley and 4 the road approaches are sloped into the crossing carrying rain or snowmelt down to the channel. 5 This sort of runoff is a significant source of pollutants to our state's waters (Puget Sound 6 Partnership 2008). It carries dirt and dust, rubber and metal deposits from tire wear, antifreeze 7 and engine oil that has dripped onto the pavement, pesticides and fertilizers and other substances 8 (Maurer 2010). The treatment of this runoff could be part of crossing design since the construction 9 activity usually requires a new ditch and outfall facility, but the requirement to do so is complex 10 and governed by rules and guidance from the Dept. of Ecology and local governments with 11 jurisdiction over these activities. 12
Only the construction of the outlet is covered by the WDFW Hydraulic Project Approval. It should 13 be designed in such a way so as to dissipate energy and resist erosion to avoid or minimizes 14 impacts to the bed of banks of the stream. Outfalls should be installed above ordinary high water. 15 Energy should be dissipated through the use of naturally‐occurring materials and biotechnical 16 techniques using native plant species. Techniques that minimize impacts include the use of Tee 17 diffusers on vegetated pads and gravel swales. 18
There are many resources that describe the mechanisms of runoff, the pollution it causes and best 19 management practices that eliminate or mitigate its effects. For stormwater runoff from roads and 20 bridges these documents are recommended: 21
WSDOT HIGHWAY RUNOFF MANUAL (Maurer 2010). Chapter 5 covers best management 22 practices in detail. 23
The STORMWATER MANAGEMENT MANUAL FOR WESTERN WASHINGTON (Washington Dept. of 24 Ecology 2005) and the STORMWATER MANAGEMENT MANUAL FOR EASTERN WASHINGTON 25 (Washington Dept. of Ecology 2004) cover the management and treatment of stormwater 26 for the State of Washington. 27
For low‐volume or forest roads; 28
LOWVOLUME ROADS ENGINEERING (Keller and Sherar 2003) 29
FOREST ROAD ENGINEERING GUIDEBOOK (B. C. Ministry of Forests 2002) 30
FOREST PRACTICES ILLUSTRATED (Washington Dept. of Natural Resources 2009) also Forest 31 Practices Rules Chapter 222‐24 Road Construction and Maintenance and Forest Practices Board 32 Manual ‐‐ Guidelines for Forest Roads, Section 3. 33

2nd Draft Water Crossing Design Guidelines 11/30/11
178
GRAVEL ROADS MAINTENANCE AND DESIGN (Skorseth and Selim 2000) 1
The Washington State Forest Practice Rules have been written so that compliance with them will 2 achieve compliance with the water quality laws. 3
Basically, stormwater runoff should be routed away from the stream or treated before it makes it to 4 the water crossing. On forest roads, ditch water is spread out onto the forest floor at regular 5 intervals through cross drains. On public roads in developed areas, ditch water should be treated 6 (to varying standards) and allowed to enter the stream in ways that do not affect the bed or banks, 7 and at flow rates that do not contribute to habitat degradation. 8
Most of the urban and suburban areas of western Washington are covered under the municipal 9 stormwater permits. When water crossings that can be considered new or re‐development, they 10 may be regulated by the municipal stormwater permits. The municipalities with those permits 11 should be enforcing requirements to provide treatment, flow control (in most cases), energy 12 dissipation at the outfall site, and erosion control during construction if the project exceeds certain 13 sizes. Projects exceeding 5,000 ft2 of pollution‐generating impervious area generally trigger 14 treatment requirements. Projects exceeding 10,000 ft2 impervious area generally trigger flow 15 control requirements. Projects over 2,000 ft2 of impervious area, or 7,000 ft2 of disturbed area 16 trigger energy dissipation (if they have a discharge). All projects, regardless of size, are supposed 17 to employ erosion control during construction (Ed O’Brian, Ecology, pers. Comm.). 18
The Dept. of Ecology has provided guidance indicating that flow control is not necessary for runoff 19 from bridge decking and approaches that are within the 2‐yr stream cross‐section. This is based on 20 the concept that most of the precipitation would have been part of the flow order anyway if the 21 bridge or culvert were not there, so it shouldn’t be necessary to dissipate the stormwater from 22 those areas. 23
Key management measures for roads, highways, and bridges include the following: 24
• Place bridge structures outside stream channels and floodplains to the fullest extent 25 possible so that sensitive and valuable aquatic ecosystems are protected. 26
• Limit disturbance of natural drainage features and vegetation. 27 • Protect areas that provide important water quality benefits or are particularly 28
susceptible to erosion or sediment loss. 29 • Limit land disturbance such as clearing and grading and cut fill to reduce erosion 30
and sediment loss. 31 • Prepare and implement an approved erosion control plan. 32 • Incorporate pollution prevention into operation and maintenance procedures to 33
reduce pollutant loadings to surface runoff. 34 • Design, construct, and maintain treatment and flow control facilities for existing 35
road systems to reduce pollutant concentrations, runoff volumes, and runoff 36 volumetric flow rates. 37
38

2nd Draft Water Crossing Design Guidelines 11/30/11
179
CHAPTER 12: DESIGN PROCESS AND DOCUMENTS 1
SUMMARY 2 • Project quality and effectiveness can be improved through good planning 3 • Construction documents are particularly important for water crossings since each site is 4
unique, the materials are highly variable, and stream channel designs are difficult to show 5 and explain. 6
• Off‐site watershed conditions can have an important affect on design and project success. 7 • Feasibility and alternative analysis are key steps in design. 8 • Principle drawing elements are listed in detail. 9 • Several example drawings are shown 10
INTRODUCTION 11 Water crossing projects are particularly difficult to design since they attempt to recreate a subtle 12 and complex stream system as it interfaces with a rigid, highly engineered road system. The level of 13 understanding of these two systems by the design team determines the quality of the design. 14 Accurately capturing this design concept on paper is another key step. The designer has the very 15 important responsibility to convey the design concepts effectively to the contractor by developing 16 detailed construction drawings and specifications. Those documents are the communication tools 17 that ensure the contractor fully understands the owner’s wishes. The more interpretation left to 18 the contractor, the less likely the project is to turn out as intended. 19
20
WDFW supports the use of interdisciplinary teams during all phases of stream projects, because the 21 team approach draws on the expertise of individual stakeholders with a variety of backgrounds, 22 such as fish biologists, wildlife biologists, land owners, regulatory agencies, tribal representatives, 23 engineers, hydrologists, planners, and construction staff. 24
25
It sounds like a rather obvious step to define primary objectives, however, as site conditions are 26 evaluated and alternatives analyzed by a team of stakeholders, having stated objectives helps to 27 ensure the end product is focused on the real issue. Stakeholders view projects from a variety of 28 perspectives, usually strengthening the design, but it is rare that everyone gets all aspects of the 29 project done in the manner they would prefer. So it is necessary to separate the primary objectives 30 from the lesser important ones. For example, when a fish passage barrier culvert is replaced to 31 provide fish passage, the land owner may wish to add safety features to the section of road 32 impacted by the culvert work. 33
EXISTING CONDITIONS 34 A good design is based on a thorough assessment of the existing conditions not just at the project 35 site, but throughout the entire watershed. It makes the most sense to begin by looking at 36

2nd Draft Water Crossing Design Guidelines 11/30/11
180
conditions at a broad watershed level, and then narrow the focus to look more closely at the site 1 conditions. Experienced designers recognize the importance of considering how the characteristics 2 of a watershed and the land use practices away from a project site can influence the project site 3 over time (see also Chapter 9, Crossing Site Considerations). As changes to hydrology, 4 geomorphology, sediment transport and debris movement occur, projects designed to 5 accommodate those changes continue to provide fish passage, have stable banks and support fish 6 habitat. 7
8
An evaluation of the existing conditions typically includes a topographic survey of the project site, 9 in which a team of engineering technicians measure and record information such as existing ground 10 elevations, topographic features, roads, parking areas, buildings, miscellaneous structures, 11 significant vegetation and of course water bodies. Then information gathered at the site is used to 12 create a site plan or base map. When design begins, the designer uses the site plan to evaluate 13 feasible alternatives that are well matched to the site conditions. In many cases, property 14 boundaries and land ownership information gathered from the local jurisdiction is also included on 15 site plans to aid the designer. 16
17
PROJECT FEASIBILITY 18 When the design team has gathered and analyzed the watershed and site data, an investigation to 19 identify feasible project alternatives may begin. The overall feasibility of a project is determined by 20 several factors, including: constructability, cost, scheduling, land ownership, site access, permitting, 21 existing infrastructure and how well a concept meets the project objectives. 22
23
The first step in feasibility is to identify the alternatives that will meet the primary project 24 objectives, and then the list of alternatives can be narrowed down and ranked according to other 25 factors such as cost, schedule, land‐ownership. Some factors are all or nothing. If for example, a 26 land owner will not grant construction access across his land to build a project, then any alternative 27 involving access to the site on that land would be a waste of time. On the other hand, some 28 alternatives require more consideration. For example, perhaps a land owner is willing to grant a 29 temporary access easement in exchange for cash or work performed by the contractor. Evaluating 30 such an arrangement can only be done by comparing it to other options, and consideration of the 31 project budget, schedule, etc. It is a good idea to create a matrix to compare numerous alternatives 32 and the various relevant project specific factors. 33
CONTRACT DOCUMENTS 34 Most traditional bid‐build contracts include not only a basic agreement, but also other attachments, 35 such as the design drawings and project specifications. In other words, the drawings and 36 specifications are part of the agreement made between the owner and the builder, so they must be 37 complete and accurate to ensure the intended outcome and to avoid costly disagreements. 38

2nd Draft Water Crossing Design Guidelines 11/30/11
181
1
CONSTRUCTION DRAWINGS 2 The primary form of communication between the designer and the builder are the construction 3 drawings. Misunderstandings often arise when construction drawings lack detail or contain 4 inaccurate information, and misunderstandings almost always result in delays and cost overruns. 5
A drawing set should include both existing and proposed features of a site so the builder knows 6 what is to be built and in what setting. Complete plans help the builder plan the work efficiently to 7 minimize construction time and cost. Components of a complete set of construction drawings 8 include site plans, design details, profile (elevations) drawings, cross sections and notes. 9
A good site plan shows all of the existing topographic features, roads, parking areas, buildings, 10 other structures, and of course water bodies. It should also include all of the proposed features, 11 including temporary items such as access roads and staging areas. Ideally, the entire project site 12 can be shown on one page and then portions of the site can be shown at a reduced scale on 13 subsequent pages. Profile and section drawings show the channel slope and shape, materials to be 14 used, bank slopes, depth of bed materials, and excavation and fill lines. Longitudinal sections or 15 profile views, are a useful method of showing the gradient of the channel and features such as 16 pools, riffles, weirs, and other types of grade controls. Cross section drawings are useful for 17 showing the shape of the channel, bank slopes, the depth of excavation, the depth of fill materials, as 18 well as the elevations for proposed weirs and large wood features. 19
Detail drawings flesh out the details of specifically how and where certain features are to be 20 constructed. Details should show the types of materials to be used and should explain in a step 21 wise manner how features will be built. Some contracts do not have separate written 22 specifications, in this case the plans need to include very specific notes and call outs to explain how 23 things are to be done. 24
Channel profiles need to show both the existing and proposed ground elevations to demonstrate 25 how the proposed features fit the site. Undersized culverts often have an accumulation of sediment 26 upstream of the pipe and a scoured channel section downstream of the pipe. The profile needs to 27 extend far enough upstream and downstream to clearly show such impacts of the existing crossing 28 and all work proposed in the project reach. 29
PRINCIPLE DRAWING ELEMENTS 30 What follows is a comprehensive list of the principle elements that should be included in the water 31 crossing design. Not all of these elements are necessary for every project. Clearly, a culvert 32 replacement on a low volume forest road will not need to show many of these things. But a bridge 33 in an urban environment will need all, and more, to satisfy all requirements. These elements are 34 part of a complete design, but they are not necessarily part of construction drawings and some may 35 occur in specifications rather than drawings when the contract is written. What the contractor 36 needs to know and what the designer and permit writer need to know are at time different. 37 38
1. Site plan: 39

2nd Draft Water Crossing Design Guidelines 11/30/11
182
a. Property lines and easements 1 b. Project limits 2 c. Clearing limits and areas not to be disturbed 3 d. Significant vegetation 4 e. Existing and proposed elevations (contour lines) 5 f. Existing and proposed roads, parking areas, buildings, etc. 6 g. Existing utilities 7 h. Road drainage details, such as cross drains, sedimentation ponds and outfalls 8
into the channel 9 i. Existing and proposed stream channel alignment (thalweg and channel width) 10 j. Important geomorhphic features such as slope failures, bedrock outcrops, log 11
jams 12 2. Long profile of the stream thalweg showing the reach‐level behavior of the stream. 13
Always show existing and proposed changes on the same drawing. 14 a. A minimum of 20 channel widths upstream and 20 channel widths downstream 15
of the culvert, or 150 ft, whichever is larger. This may not be long enough in 16 some instances, where culverts have a high outfall drop or culverts elevated 17 above the natural. 18
b. Thalweg, water surface (at the time of survey) and bank top on profile. 19 c. Relevant channel features such as riffles, steps, pools, rock outcrops, nearby 20
culverts, etc. Water surface profile should be taken at one flow. 21 d. Any proposed changes in channel elevation on the same drawing as the existing 22
channel profile. These include, regrade upstream, grade control structures or 23 other profile adjustments. Attach elevations to all of these features. 24
e. Features of new channel alignments, such as pools, riffles, steps, woody debris 25 placement, etc. 26
3. Short profile in the vicinity of the culvert (may be included in the same drawing as the 27 long profile if it is still readable at that scale). Always show existing and proposed 28 changes on the same drawing. Show, 29
a. Proposed culvert type, dimensions and slope. 30 b. Inlet and outlet invert elevations. 31 c. Proposed slope and elevation of the bed inside the culvert. 32 d. Size gradation of culvert bed directly on the plans 33 e. Elevation and spacing of channel features inside and adjacent to the culvert 34 f. Depth of riprap end treatments or bank protection. 35 g. The filling of the existing plunge pool, if applicable. 36
4. Plan view. Always show existing and proposed changes on the same drawing. Show, 37 a. Alignment of stream, culvert and road. 38 b. Skew of stream to culvert. 39 c. Features of new channel alignments, such as pools, riffles, steps, woody debris 40
placement, etc. 41 5. Cross section inside the culvert or under the bridge to show the relationship between 42
the constructed channel and the crossing structure. 43

2nd Draft Water Crossing Design Guidelines 11/30/11
183
6. Cross section of a representative reach of natural channel upstream, but out of the 1 influence of, the culvert. Indicate channel width and bed composition. 2
a. Channel width 3 b. Existing and proposed side slopes 4 c. Location of composition of bed matierals 5 d. Location of habitat and channel morphology features 6
7. Diversion plan, may be included in plan and profile above. 7 8. Construction erosion control plan, may be included in plan and profile above. 8 9. Long term erosion control plan; 9
a. Vegetation plan. 10 b. Maintenance plan, if necessary. 11 c. Inspection plan, if necessary. 12
10. Bed material specifications; it is vitally important that these specs be on the plans for 13 the contractor and inspector to plainly see. 14
11. Other Design Details 15 a. Large wood dimensions, orientation, burial depth and anchorage 16 b. Boulder dimensions and burial depth 17 c. Planting specifications 18 d. Slope stabilization and restoration details 19
EXAMPLE DRAWINGS 20 Several example drawings are reproduced in this section to help the designer decide what to 21 include in their drawings to help permit writers and contractors understand their intensions. As 22 discussed throughout this section, good drawings make good projects. 23
Figure 12.1 is a simplified drawing which shows, schematically, the main elements discussed in 24 this chapter and in the previous section’s list. 25
Figure 12.2 is a more complex, and realistic, site plan. Such a plan includes principle channel and 26 infrastructure features in sufficient detail to so that their structure and interrelation are 27 obvious.This is more likely what a site plan for a public road would look like and includes more 28 detail than would be typically seen on a forest road plan. 29
Figure 12.3 is a channel profile showing existing and proposed crossing, proposed excavation and 30 placed bed materials as one would find in a more complex project. The basic elements should be 31 present on any profile. 32
The cross section shown in Figure 12.4 shouldn’t be used as a template since the particularities of 33 this project determined the way the cross section is designed. 34
35
36
37

2nd Draft Water Crossing Design Guidelines 11/30/11
184
Figure 12.1: A simplified sample drawing showing the principle elements of a complete culvert plan. 1

2nd Draft Water Crossing Design Guidelines 11/30/11
185
1 2 Figure 12.2: A more complex example site plan showing principle channel and infrastructure features 3 (WDFW project files). 4 5

2nd Draft Water Crossing Design Guidelines 11/30/11
186
Figure 12.3: Channel profile showing existing and proposed crossing, proposed excavation and placed 1 bed materials (WDFW project files). 2 3
4 Figure 12.4: Channel cross section which includes the main channel and a vegetated floodplain, buried 5 scour protection at the margins and the depth of placed gravel (WDFW project files). 6
SPECIFICATIONS 7 Specifications are technical descriptions of materials to be used on a project, as well as the methods 8 to be employed to complete the work. Specifications also often include timing restrictions, permit 9 conditions, material requirements and various other construction details. Along with the design 10 drawings, specifications supplement the written contract between the owner and the contractor. 11 As far as the stream channel is concerned, there are relatively few specific specifications, although 12 they are vitally important; the materials that make up the bed, banks, and habitat features must be 13 carefully specified in order to ensure the success of the project. 14
15

2nd Draft Water Crossing Design Guidelines 11/30/11
187
CHAPTER 13: CONSTRUCTION CONSIDERATIONS 1
SUMMARY 2 • Stream channel work is somewhat unique in the construction world. 3 • The success of the project is improved through construction preparedness which involves: 4
o Determining that the project is constructible 5 o Contractor’s experience with stream projects 6 o Construction oversight of critical elevations, channel forms and materials 7
• Project considerations are 8 o Site access, which requires a sequencing plan for work in sensitive areas with large 9
amounts of material. 10 o Construction timing for impacts to fishlife and water quality 11 o Best management practices to reduce impacts 12
• Stream bypasses are often left to the contractor to implement, but careful planning can 13 reduce impacts to fishlife 14
o Gravity bypasses are preferred 15 o Pump bypasses require screening and near‐constant attention 16 o Working in the water is sometimes feasible 17
• Fish exclusion and removal is described 18 • The site should be restored through stabilizing, removing invasive plants and replanting 19
with native vegetation. 20
INTRODUCTION 21 This chapter is intended to provide a broad overview of construction considerations. Because site‐22 specific conditions and project‐specific criteria influence construction approaches significantly, a 23 comprehensive discussion of construction techniques is beyond the scope of this section. However, 24 careful consideration of the topics listed here should assist stream project proponents to develop a 25 comprehensive work plan for accomplishing project goals with respect to construction issues. 26 27 During the construction phase, when the design is finally implemented, the success of a project is 28 determined by several factors, including constructability, the contractor’s experience, and 29 construction oversight. The first part of this chapter covers those three construction subjects. 30 31 The construction preparedness factors determine the relative ease or difficulty of addressing 32 common issues on a stream project, such as: site access, construction timing, use of best 33 management practices, protection of fish life, stream diversion, isolation of the work area, fish 34 exclusion and site restoration. The second part of this chapter covers issues common to most 35 stream construction projects. 36
37
38

2nd Draft Water Crossing Design Guidelines 11/30/11
188
CONSTRUCTION PREPAREDNESS 1
CONSTRUCTABILITY 2 A number of factors influence the constructability of a project, including: difficulty of the project, 3 suitability of the site, land ownership, utility locations, available access, contractor experience, fish 4 use, sensitive habitat, site topography and weather conditions. One way to improve 5 constructability is to seek input from construction experts during design that can help identify both 6 potential difficulties and more efficient ways to complete the project. 7 8 Constructability should be considered well before a contractor begins work. However, additional 9 constructability issues, although hopefully not major ones, often arise after construction begins, 10 forcing the project team to respond quickly to manage the schedule and budget impacts of the 11 problem in an efficient manner. 12
CONTRACTOR EXPERIENCE 13 Construction projects in and around streams require unique experience, which not all general 14 contractors possess. The level of relevant experience the construction team has affects the amount 15 of oversight the project manager must provide to interpret the design, and it can greatly influence 16 both the project the schedule and budget. Project proponents should take great care to select a 17 highly qualified contractor with relevant work experience related to the project at hand. We 18 understand that public works projects must select the lowest responsive, responsible bidder and 19 that selection of the contractor on the basis of qualifications is restricted to minimum qualifications. 20 Overall, the greater the potential for having to use an inexperienced contractor, the greater detail is 21 needed in contract drawings and specifications. 22
CONSTRUCTION OVERSIGHT 23 Having an experienced inspector provides a great advantage to a project proponent. A good 24 inspector becomes very familiar with the site and studies the design to anticipate constructability 25 issues. A good inspector communicates effectively with the contractor to convey the project 26 proponent’s wishes. Perhaps most importantly, a good inspector ensures the project construction 27 satisfies the project objectives and protects the financial interest of the project proponent. Project 28 objectives should be defined in the contract and construction documents so that the contractor and 29 inspector understand why the project is being built the way it is. Unfortunately, stream projects are 30 often subtle and complex and it is probably the norm that without specialized training inspectors 31 will not understand the project objectives and are often not qualified to ensure that criteria are met. 32 Only an on‐site construction engineer can do this. 33 34 It is recommended that the project proponent meet with the construction engineer or manager and 35 the inspector before construction begins. Important topics to discuss might include: 36
• Channel profile and cross sections: the grade and shape of the channel are what recreate 37 natural channel morphology, and in tern, create habitat and result in a persistent, 38 maintenance free project. 39
• Critical elevations: when the project area is isolated from the adjacent streambed, 40 equipment operators can’t “eyeball” things in. Survey equipment must be used to make 41 sure that culverts, grade control, footings, log placements, and other height‐sensitive project 42 components are installed correctly. It may be advisable to have the contract written where 43 the designer verifies elevations and key locations prior to the contractor moving forward. 44
• Streambed materials: the proper size and distribution of streambed sediments is critical 45 for successful project. Even when the plans carefully specify these materials, the pit source 46

2nd Draft Water Crossing Design Guidelines 11/30/11
189
may not correctly fill it and these materials are then delivered to the site. The construction 1 manager and inspector must be able to determine whether they are acceptable by 2 measuring a representative sample. 3
COMMON PROJECT CONSIDERATIONS 4
SITE ACCESS 5 Site access is often one of the most involved issues on a construction project. Crews need access to 6 the work site, staging areas, stockpile areas, as well as to refueling, maintenance and parking areas. 7 Site limitations such as terrain, location of utilities, land ownership, existing infrastructure, 8 sensitive landscapes, and critical habitats are constructability issues that may influence how access 9 is provided. 10 11 For this reason, site limitations should be considered during all phases of design and construction, 12 and addressed by preparing a construction sequencing plan, an outline of the major tasks and their 13 sequential order of construction. Developing a conceptual construction sequencing plan early in 14 the design process will help identify and resolve many aspects of constructability that are dictated 15 by site limitations. In developing the plan, the designer should consider the benefits and drawbacks 16 to all possible access options to determine the most cost effective, practical and least impacting 17 option. The preferred access alternative may involve using adjoining properties, when impacts can 18 be reduced, the length of travel can be shortened or cost savings can be had. 19 20 Some land owners may be willing to allow construction access on a temporary basis, and others 21 may decline. To minimize misunderstandings, written land owner access agreements need to be 22 established during the planning phase of the project, prior to final design and permitting, and well 23 before construction begins. It can be helpful when making such a request to provide the land 24 owner with a drawing or sketch on an aerial photo to show specifically what is needed. It is also 25 wise to spell out in an access agreement what will be done to restore the land owners’ property, 26 such as removing temporary rock, regrading, revegetation, etc. 27 28 Construction of most stream projects will require some degree of heavy‐equipment mobility along 29 and near the bank. Construction can be conducted from the bank, from a temporary platform, or 30 from the channel. Highest consideration should be given to working outside the channel, from the 31 banks. When it is not feasible to complete the work from the banks, construction of a temporary 32 platform should then be considered. A typical temporary platform is constructed of large rocks as 33 the base with smaller rock on the working surface, or an array of temporary pilings. An alternative 34 is to operate equipment positioned on a barge within the channel. Unique site characteristics 35 usually determine where construction is conducted. 36 37 While some types of stream projects can be constructed solely with hand labor, the construction of 38 most projects will require heavy equipment at the project site. Consider the types of equipment 39 necessary to build the project, where the equipment will operate, refueling locations, parking and 40 stockpile site locations. Temporary access roads may need to be constructed to transport materials 41 and equipment to the site. 42 43 Access roads must be designed and built according to the needs of the equipment, taking into 44 account road grade, equipment size and weight distribution, and also vegetation, habitat impacts 45 and stormwater runoff. In particular, the need for equipment to maintain traction will drive 46 important design decisions if ground conditions at the site are slippery, steep or soft. Street‐legal 47 dump trucks in particular are limited in their ability to travel on unpaved roads. Many types of 48

2nd Draft Water Crossing Design Guidelines 11/30/11
190
equipment are able to travel on softer roads, causing less damage to soils because their weight is 1 better distributed. Excavators, tracked dump trucks and other vehicles can be outfitted with extra 2 wide tracks to reduce weight impacts and soil compaction. Specialized equipment, such as spider 3 excavators and helicopters should be considered to improve efficiency of building the project. 4 5 In relatively non‐sensitive areas (e.g., meadows, pastures, woody riparian areas), access roads can 6 be constructed by placing road gravel on geotextile materials laid directly on the ground surface. 7 Some of the plastic products on the market (PVC, PVE, etc.) can be used to reinforce low‐load‐8 bearing soils. This approach is appropriate when access roads will be used frequently for hauling 9 materials or equipment or for refueling operations. 10 11 Access can also be achieved using temporary mats (e.g., linked tires, cabled ties, landing mats) to 12 “walk” equipment across sensitive areas on a limited interval basis. This assumes little or no 13 materials will be transported in or out of the site for the duration of the project, and whatever 14 equipment is needed can be housed and maintained at the site. 15 16 Access through a riparian area should be carefully marked to minimize impacts and to aid in the 17 subsequent restoration efforts. Use existing access points when available and construct new access 18 points in a manner that minimizes riparian impacts. When there are habitat impacts from 19 construction activity, mitigation may be required to compensate for lost functions. 20 21 Any significant movement of materials on‐site, off‐site or within the site will require a stockpile 22 area for temporary storage of construction or waste materials. Stockpiling of construction 23 materials (e.g., gravel, rock, soil, fabric, wood materials) and disposal of waste materials (e.g., 24 excavated bank materials, vegetation, trash) should be considered during the construction 25 sequencing. Careful consideration of stockpile size and location will facilitate construction, reduce 26 cost and limit damage to sensitive areas. The location of stockpiles can significantly increase or 27 decrease cost if it increases or decreases cycle time for construction operations. 28 29 Existing utilities are commonly found within a project site or along access routes to the site. Careful 30 review of the site will reveal most utilities present, including power lines, railroad tracks, pipelines, 31 buried cables, sewers and other common utilities. All utilities owners must be contacted to evaluate 32 hidden utilities and to identify or establish protocols for working near or within utilities’ rights‐of‐33 way. Urban project locations with many site limitations may require the temporary or permanent 34 relocation of utilities to accomplish project objectives. 35 36 Impacts due to adverse weather conditions need to be factored into the access plan. It may be 37 necessary to construct a longer access route to avoid seasonally wet areas, for example. Scheduling 38 construction for times when the ground is either dry or frozen can also reduce impacts associated 39 with access roads. Snow‐covered, frozen soils can often be traveled with wide‐track equipment 40 with reduced impact to underlying vegetation or soils. Special care should be taken to avoid 41 construction during potential snowmelt conditions. Similarly, dry conditions reduce many impacts 42 associated with soil compaction and soft soils. 43 44 In summary, the following circumstances should be considered in designing and timing 45 construction access to a site: 46 47
• Evaluate all access options (various routes, equipment types, etc.) 48 • Develop a construction sequencing plan 49 • Obtain necessary written agreements early 50

2nd Draft Water Crossing Design Guidelines 11/30/11
191
• Work from stream banks, platforms or gravel bars when possible 1 • Consider the types equipment necessary and specific access needs 2 • Consider how and where equipment will be used 3 • Design access road to suit the use and setting 4 • Employ specialized equipment to minimize impacts when practical 5 • Working in deep and/or turbid water tends to reduce quality control of the construction. 6 • Avoid sensitive soils and vegetation when possible 7 • Use existing access points 8 • Construct temporary access points with minimal impacts 9 • Stockpile locations 10 • Identify constraints due to utilities 11 • Consider seasonal weather and ground conditions 12
13
CONSTRUCTION TIMING 14 The timing of construction will often be determined by regulatory mandates intended to reduce 15 water‐quality impacts to critical fish life cycles such as migration and spawning. The timing for 16 construction projects that affect state waters varies throughout the state, depending upon the 17 species present in the watercourse. Contact the Washington Department of Fish and Wildlife’s Area 18 Habitat Biologist for information on work windows. Habitat biologist geographical coverage areas 19 can be found for the project area at the following website: 20 http://wdfw.wa.gov/conservation/habitat/ahb/. Once the allowable construction window has 21 been identified for your project, additional factors such as hydrologic, precipitation and 22 revegetation considerations will assist in determining the most appropriate time to operate within 23 the established work window. 24 25 Hydrologic analyses that can be helpful in determining an appropriate time for construction include 26 analyses of seasonal variations in average and peak flows. From the standpoint of feasibility and 27 cost‐effectiveness, construction should occur when average seasonal flows are low and the 28 likelihood of high‐flow events is at its lowest. This will vary geographically, depending upon the 29 dominant hydrologic character of a watershed. Further information on methods for determining 30 hydrologic character and approaches to hydrologic analyses are available in the STREAM HABITAT 31 RESTORATION GUIDELINES (to be published by WDFW in 2011) Appendix D, Hydrology. 32 33
BEST MANAGEMENT PRACTICES 34 Best Management Practices (BMPs) encompass a wide range of activities intended to reduce 35 adverse impacts to all aspects of the environment. BMPs can generally be divided into one of two 36 categories, preventative or treatment. Perhaps the most common BMP on virtually all construction 37 sites is erosion control. Erosion control includes all measures to check the mobilization of soil 38 materials from a construction area into areas where moving water can carry them away. Erosion 39 control is referred to as a preventative or ‘source control’ BMP, which means when properly used 40 an erosion control BMP prevents a problem from developing at the source 41 42 Sediment control, although commonly associated with erosion control, is a treatment BMP, 43 intended to clean up a problem. Sediment control includes all measures to reduce turbidity 44 associated with construction activities. Silt fencing is an example of a treatment BMP. Silt fences 45 are intended to filter out and retain mobile sediment from runoff water while allowing clean water 46 to move down slope in a watershed. 47

2nd Draft Water Crossing Design Guidelines 11/30/11
192
1 Sediment and erosion control are discussed in more detail in the next section. Other common 2 preventative BMPs include stabilized construction entrances, tire washes, slope terracing, proper 3 concrete handling, covering stockpiles, sweeping, and dust control. Common treatment BMPs 4 include oil water separators, fuel spill containment, grass lined channels, water bars, check dams, 5 outfall protection, straw bale barriers, and sediment traps. 6 7
EROSION AND SEDIMENT CONTROL 8 The success of erosion and sediment control methods greatly depends upon weather patterns 9 during the season of construction, dewatering methods applied and the character of the 10 hydrograph at the project site. The period of construction will determine the method of erosion and 11 sediment control required. Careful consideration should be given to inundation levels and flow 12 durations derived from hydrologic statistics. 13 14 Erosion‐control mechanisms must be effective during precipitation events and/or during 15 inundation by stream flow. In areas that are above anticipated inundation levels, the potential for 16 soil loss through erosion can be reduced by applying mulch (e.g., straw, wood chips and other 17 organic materials), hydroseeding, or adding biodegradable, chemical or synthetic soil stabilizers. 18 Areas that may become inundated by flowing water during high‐flow events should be protected by 19 geotextile fabric. The Washington State Department of Ecology has guidance on erosion‐control 20 techniques in the Stormwater Management Manual for Western Washington (Washington Dept. of 21 Ecology 2005). 22 23 In addition to preventing soil loss, eroded soils must be trapped before reaching the stream. This is 24 best accomplished using standard silt‐barrier approaches, such as straw bales or a silt fence. The 25 design and specification of sediment barriers must include inspection and maintenance schedules, 26 as well as a schedule for removal. Silt barriers require cleaning when they reach 50 percent of 27 capacity. 28 29 Sediment control is intended to minimize the input of sediment associated with constructing bank 30 treatments. However, it is unrealistic in most circumstances to expect complete control of sediment 31 inputs, because the installation process for most sediment‐control systems itself generates some 32 turbidity. While there are a variety of sediment filters available that are advertised as having 33 moving‐water applications, these are impractical and ineffective for controlling sediment except on 34 very small streams. Dewatering the site or isolating the construction area from moving water can 35 largely control sediment input. In many cases construction of a stream project can be done in a 36 dewatered area which can aide in collection and removal of sediment from construction practices. 37 Dirty construction water collected from sumps needs to be handled appropriately by infiltrating in 38 a well vegetated swale or treating it in an approved manner to remove contaminants prior to 39 discharge to the stream. 40
COFFERDAMS 41 Cofferdams vary in size from just a few sand bags to sheet piling. The materials used to construct 42 them can be just about any clean and durable items. Some of the most common items used to build 43 small cofferdams are sandbags, plastic sheeting, rocks, and concrete blocks. 44 45 For projects in large rivers, rows of concrete blocks weighing several thousand pounds each and 46 high capacity sand filled bulk bags (25 cubic feet or more) may be used in place of ordinary sand 47

2nd Draft Water Crossing Design Guidelines 11/30/11
193
bags. Commercially available cofferdam systems can be applied on larger river systems. These 1 systems can often withstand overtopping during large events. 2 3 In lakes or tidally influenced areas, sheet piling may be necessary to construct a barrier capable of 4 withstanding the forces exposed to it. Water filled inflatable dams, up to 12 feet or so in height, are 5 a relatively new technology. Inflatable dams are tubes of geotextile and polypropylene, which are 6 come in rolls up to 100 feet in length. Longer dam lengths can easily be achieved by overlapping 7 multiple tubes. Inflatable dams are most effective on relatively smooth substrate such as sand or 8 small gravels. As a note of caution, unlike concrete blocks, rock etc, these dams are neutrally 9 buoyant and are thus easier to dislodge in deep swift water unless anchored properly. 10 11 Installing and removing cofferdams requires planning to ensure water quality is maintained, 12 particularly in water bodies with a substantially fine grained substrate. Sometimes the impact of 13 installing a cofferdam exceeds the impacts of working without one, in which case a project may be 14 built in the water, if allowed by the permitting agencies. 15 16 The use of a cofferdam may confine the channel, raising water‐surface elevations. Application of 17 cofferdams will, therefore, require careful modeling of the impact on water‐surface elevations 18 during all anticipated flows. With discretion and the approval of the Habitat Biologist, short term 19 cofferdams on low flow streams may not need to be modeled. 20 21 Design of coffer‐dam dewatering systems should consider the infiltration rate of seepage flow from 22 the riverbed and from banks and will require additional and constant pumping systems to address 23 the infiltration flow. In‐flow will likely be extremely turbid due to construction activities. Water 24 collected from sumps needs to be handled appropriately by infiltrating in a well vegetated or 25 treating it in an approved manner to remove contaminant prior to discharge to the stream. 26 27
TEMPORARY CROSSINGS 28 Often equipment must cross a stream during construction. Temporary crossings are installed for 29 this purpose and are covered in Chapter 5. 30
STREAM BYPASSES 31 Protection of fish life must include both isolation of fish from harmful conditions at the construction 32 site and prevention of offsite impacts due to degraded water quality. Provisions must be made to 33 ensure fish are not harmed due to the project while attempting to migrate upstream or 34 downstream. Upstream fish passage through temporary stream bypasses is often not required for 35 short duration projects conducted within approved annual in‐stream work windows. Isolating fish 36 from the work area can be accomplished by using either a total bypass to reroute the entire stream 37 through a temporary channel or pipe, or partial bypass to exclude fish from a certain area, such as 38 along one stream bank. 39 40 Flows can be diverted with pumps or passive systems such as side channels, canals or tubes. Flow 41 diversion requires careful consideration of the backwater effects on diversions; pump capacities, 42 diversion‐channel capacities and outfall protection. Gravity bypass systems require less monitoring 43 that than gas or diesel pumps, which require someone on site or other special consideration if left 44 running overnight. Diversion outfalls require temporary erosion‐protection measures to prevent 45 scour at the point of return flow from the diversion channel or pipe. Additionally, pumps require 46 screens designed to Washington State & National Marine Fisheries Service specifications to prevent 47

2nd Draft Water Crossing Design Guidelines 11/30/11
194
harm to fish (see DRAFT FISH PROTECTION SCREEN GUIDELINES FOR WASHINGTON STATE, WDFW 2000, 1 http://wdfw.wa.gov/publications/pub.php?id=00050). 2 3 All types of stream bypasses must include a recovery plan to ensure safe capture and relocation of 4 fish trapped in the work zone when the stream flow has been diverted. Fish can be recovered 5 manually from remnant pools and transferred by bucket to downstream reaches. 6 7 The design and implementation of dewatering systems is often underemphasized. Hydrologic 8 analyses should be conducted to determine the appropriate design criteria for a stream bypass. At 9 a minimum, dewatering systems must be able to divert two‐year peak flow during the period of 10 construction. A two‐year peak flow is the flow that has a 50‐percent chance of occurring each year 11 during the construction period. This magnitude of return flow will need some qualification based 12 on the period of construction. For instance, during the summer period, the two‐year flow may be 13 appropriate; but, during the winter, preparation for a greater‐magnitude flow event will likely be 14 required. 15 16 The probability of a dewatering system being overwhelmed by storm flows can be determined 17 using standard hydrologic analyses. In scenarios where it is impractical or impossible to design a 18 dewatering system that can handle storm flows, it is important to determine the extent to which the 19 dewatering systems will be inundated during such flow events and for how long. Before proceeding 20 with construction of a stream project, the potential consequences of inundation due to high 21 seasonal flows should be estimated and the risk of such occurrences calculated. 22 23 When available, the analyses should be based on data sets derived from peak flows covering the 24 construction window for the period of record. The risk of inundation, based on a probability of 25 occurrence for a particular flow level, can then be used to gauge the relative costs associated with 26 inundation. The cost of inundation may include lost work, lost time, damage to equipment and 27 sediment influx in the stream. 28 29
COMPLETE BYPASSES 30 The most common arrangement utilized in small streams is a total bypass, usually formed by 31 construction of a coffer dam upstream and downstream of the work area, and running the entire 32 stream flow through a temporary plastic pipe. Assembling the bypass needs to be done in a 33 thoughtful manner to ensure fish are not harmed in the process. The process typically begins with 34 placing block nets up‐ and downstream of the project area and biologists capture and safely 35 relocate fish trapped in the work zone. Then a plastic bypass pipe or plastic lined channel is 36 installed. Next a small cofferdam is slowly built upstream of the work area, and the stream is 37 diverted through the pipe. Then a cofferdam is built at the downstream end to isolate the work 38 area completely. Biologist make a final pass through the work area to remove any remaining fish. 39 Finally, when the work area is free of both flowing water and fish, construction may begin. 40 41 Upon completion of the construction activity in the channel, stream flow should then be gradually 42 reintroduced to the work area, which will likely produce sediment upon initial rewatering. Prior to 43 introducing stream flow, a system should be implemented to capture sediment and turbid water, 44 and to handled it appropriately by infiltrating in a well vegetated area or treating it in an approved 45 manner to remove contaminants prior to discharge to the stream. 46 47
48

2nd Draft Water Crossing Design Guidelines 11/30/11
195
PARTIAL BYPASSES 1 For work along a stream bank or shoreline, an alternative to diverting an entire channel is to install 2 a cofferdam along the bank line, parallel to the flow of the channel, to isolate the project site from 3 the water in the channel. With such a cofferdam in place, water on the landward side of the 4 structure can be pumped out, leaving the area contained by the structure free of water. 5 6
WORKING IN THE WATER – WITHOUT A BYPASS 7 It is sometimes feasible and practical to work in the water without a bypass, when installing a 8 containment system would cause greater impacts than it would prevent, when working in deep or 9 swiftly flowing water, when turbidity is not a concern, when fish can be excluded by nets or screens, 10 or when fish are not present. 11 12 As discussed in the cofferdam section, installing and removing certain types of cofferdams in 13 certain settings may generate significant impacts to water quality. For example, installing a sheet 14 pile cofferdam in an estuary with predominantly fine sediment would be expected to generate high 15 levels of turbidity. It may be much more suitable to employ a floating boom and/or silt curtain to 16 partially isolate turbidity from the work. 17 18 Partial isolation minimizes the continued release of sediments that would occur with flowing water. 19 For this reason, work can occur in standing (versus flowing) water behind a barrier. Sediment will 20 be released, but in smaller quantities. When the barrier is removed, sediment will be released. 21 However, it will be distributed as a single pulse rather than a continuous stream and will result in 22 substantially less sediment input than would otherwise occur under flowing water conditions. 23 Water‐quality impacts will need to be carefully considered before applying this approach; they may 24 even prevent the use of this approach. 25 26
FISH EXCLUSION 27 Excluding fish from a work area is the key to protecting fish life from harm related to stream 28 construction projects. Stream projects in fish bearing waters with any type of stream bypass must 29 have an exclusion and recovery plan to ensure safe capture and relocation of fish trapped in the 30 work zone when stream flow has been diverted. Fish exclusion is generally accomplished by 31 installing screens or nets to isolate an area, then fish trapped in the work zone can be captured and 32 relocated. Capturing fish is usually accomplished with large seine nets, dip nets and sometimes 33 using electro fishing equipment. 34 35 Metal screen panels or mesh nets are typically used to form physical barriers to exclude fish. Care 36 must be taken to install the barriers in a manner that prevents undue risk of harm to fish. Screen 37 panels placed perpendicular to swift flowing water pose an impingement risk to fish for example. 38 The ideal exclusion barrier is located in a low velocity area, so that fish may approach the net or 39 screen and swim away from it at will. Debris must be removed from barriers regularly to prevent 40 water from going over or around the barrier and allowing fish into the work zone. 41 42
RESTORATION 43 Restoration includes re‐establishing areas disturbed by a project to conditions equal to, or better 44 than, those which existed prior to the project. A typical restoration plan involves eradicating 45

2nd Draft Water Crossing Design Guidelines 11/30/11
196
invasive plant species, revegetating by planting native trees and shrubs, and stabilizing slopes 1 against erosion by seeding with an acceptable grass species or applying mulch. 2 3 Successful revegetation is largely determined by the timing of planting efforts. Ideally, revegetation 4 components of riparian areas will be conducted to maximize the potential for survival of the plant 5 materials installed and to enhance their ability to grow quickly. Furthermore, the success of many 6 bioengineered techniques will require that vegetative cover be maximized in the least amount of 7 time possible following construction. This requires minimizing the period of dormancy of installed 8 materials between installation and the following growing season and ensuring ideal moisture 9 conditions, which are often specific to species and plant forms installed, following construction. 10 Detrimental moisture conditions may include either drought or inundation. 11 12 Some plant materials must be installed during construction, while others may be installed months 13 after construction to enhance survival and success. For instance, seed must be placed under 14 geotextile fabrics during construction. Similarly, some techniques that incorporate cuttings or other 15 dormant materials may be integral to the structure of the protection measure. However, many plant 16 materials, such as cuttings, tubelings and rooted stock can be planted following construction, 17 during ideal soil‐moisture conditions to improve survival rates. 18 19 20 21
22

2nd Draft Water Crossing Design Guidelines 11/30/11
197
CHAPTER 14: MONITORING 1
SUMMARY 2 • Monitoring tells us what works, what doesn’t, and when maintenance is needed. All 3
crossing owners should monitor, but not everyone can or will. 4 • Monitoring data must be analyzed and reported for it to be useful. 5 • Compliance with design standards means, by implication, that fish passage and habitat 6
protection is occurring. 7 • Monitoring tasks and contingencies are listed for the 3 major crossing types 8
o No‐slope culverts 9 o Stream simulation culverts 10 o Bridges 11
INTRODUCTION 12 Monitoring has many benefits, although they are often unrealized. Among other things, monitoring 13 tells us whether the project was correctly designed and constructed, about what works and what 14 doesn’t, and how to improve our design criteria and recommendations. 15
Ideally, every water crossing would be assessed in some way after construction. The degree to 16 which they will be monitored is dependent on requirements, funding, and interest. 17
By State law crossings must pass fish and it is the responsibility of the owner to maintain them 18 (RCW 77.57.030 and Washington State (1950)). WAC 220‐110‐070 states that “culverts shall be 19 designed and installed so as not to impede fish passage.” The only way to know if crossings are 20 functioning properly is to examine them after construction, to see if they comply with criteria, and 21 over time, to see that they do not block fish over their life span. This is monitoring of one kind or 22 another. Everyone should do this, but not everyone will. 23
Monitoring requires effort which costs money. Various programs require and institutionalize the 24 inspection of crossings. Inspection is discussed below but it is not designed to detect impacts to 25 fishlife. WDFW does compliance inspections when possible. Grant organizations that fund crossing 26 corrections sometimes fund monitoring. Some state and federal programs interested in fish 27 passage and design effectiveness and have funded monitoring studies. Regional fish enhancement 28 groups monitor, educational institutions and their students monitor, as well as other similar 29 groups, mostly funded by grant programs. 30
If the owner of a crossing, or a grant program that funded the crossing, would like to know that the 31 money that they have invested to provide fish passage and protect habitat has been well spent, then 32 they should monitor. 33
There are three steps to realizing monitoring benefits: assess and measure the project, analyze the 34 collected data, and then put it into a report. These are essential steps and without all three the 35 effort has very little value. 36

2nd Draft Water Crossing Design Guidelines 11/30/11
198
Much has been written about monitoring. Fish passage monitoring has been described by several 1 (Furniss, Love et al. 2006; Crawford 2009) and attempted with varying success ((Stockard and 2 Harris 2005; Benton, Ensign et al. 2008; Middel, Hardman et al. 2009) among others. This type of 3 monitoring is not discussed here and the reader is encouraged to read these articles and the many 4 others that are available. 5
What is more relevant to a design manual is compliance with a given design standard or a 6 particular plan, and the effectiveness of the finished project in realizing the objectives of the 7 method. 8
Simple monitoring was done by Price (Price, Quinn et al. 2010) to great effect showing the 9 compliance with a standard (fish passage criteria) and with a method (no‐slope culvert design, 10 Chapter 2). The findings were discussed briefly in the Preface. 11
Inter‐Fluve looked at stream simulation culvert performance (Inter‐Fluve 2008). Barnard (Barnard 12 2003) studied the effectiveness of stream simulation culverts in a preliminary report. The study 13 was expanded to 50 culverts in 2008, in preparation(Barnard, Yokers et al. 2011). In a 14 comprehensive report on improving stream crossings for fish passage, Lang looked at many 15 crossings using unique monitoring methods (Lang, Love et al. 2004). 16
Bridges are regularly inspected through the National Bridge Inspection Standards (White, Minor et 17 al. 1992; Washington (State) Dept of Transportation 2009). Inspection is a form of monitoring, 18 although the purpose is oriented more toward public safety and protecting infrastructure, rather 19 than habitat protection. Much can be gleaned from the bridge inspection process and it can be used 20 to evaluate older bridges for what they can tell us about replacements, and the performance of 21 more recent bridges. 22
COMPLIANCE MONITORING 23 We expect that water crossings should provide some basic functions. 24
1. Water crossing structures should pass all fish at all life stages that would be expected in the 25 reach where the project is found. In degraded habitat, upstream of man‐made barriers, or 26 in streams where fish have been extirpated, passage must be provided for fish that would be 27 expected if these impediments were removed. 28
2. Water crossing structures should maintain the functions and values of fish and wildlife 29 habitat in the stream reach where the crossing is found. In addition, the project should 30 protect the productive capacity and opportunities reasonably expected of a site in the 31 future. 32
Water crossings designed according to the principles and methods found in these WATER CROSSING 33 DESIGN GUIDELINES are assumed to fulfill these functions. The task of monitoring becomes one of 34 compliance to ensure that the design methods have been interpreted and implemented correctly. 35 Coupled with compliance should be contingencies so that these functions are not lost if the project 36 fails to measure up to expectations. For instance, monitoring determines that a culvert has been set 37 too low. How low is too low? Should it be ripped up and reinstalled? Simply observing and 38

2nd Draft Water Crossing Design Guidelines 11/30/11
199
measuring does not lead to a remedy. The following are a set of monitoring tasks with 1 contingencies grouped according to crossing design. The contingencies can be used by grant 2 organizations, land managers, crossing owners, and regulators to ensure that the project actually 3 supplies the benefits the sponsor or contractor claim. 4
The monitoring program described here is an example of what a program or agency could develop 5 to track the performance of their crossing projects. It can be used to confirm that the 6 recommendations in these guidelines are followed. We recommend that you adapt this program to 7 meet your goals. The contingencies suggested here are recommendations only. Those designing a 8 monitoring program would prescribe contingencies appropriate for the situation. 9
NOSLOPE CULVERTS 10 There are six aspects of a no‐slope culvert that contribute to its success. Please see Chapter 2 for a 11 complete description of this method and an explanation of the terms used in this section. 12
1. Culvert bed width; the width of the bed inside the culvert should be at least the bankfull 13 width of the stream. The culvert span and rise should be sufficient to create and maintain 14 such a bed over time. Many errors occur in the assessment, design, and specification of the 15 proper culvert size so this is one of the most fundamental monitoring measurements. The 16 measurement is done with a fiberglass tape from the point where the bed meets the culvert 17 wall on one side to a similar point on the other. This measurement would be taken at the 18 inlet and the outlet. Culverts that are less than 80% of the required size should be assessed 19 with respect to items 2, 5, 6, 7 below. If it fails to fulfill these functions, it should be replaced 20 with a new culvert of the correct size. Obviously, the size of the culvert and its elevation, 21 which determine the bed width, should have been determined when it was designed. It this 22 is the case, then the remedy should be the responsibility of the designer. Unexpected 23 changes in the bed elevation will change the countersink and the bed width and can be 24 fixed, to a certain extent, with profile adjustment, Chapter 7. 25
2. Culvert bed fill; In Chapter 2 it is recommended that no‐slope culverts should be filled 26 during construction and meet the criteria in sections 3, 4, and 5, below. Culverts not filled 27 during construction should be monitored over time to determine if they comply with the 28 criteria below. If they do not, they should be filled with appropriate streambed material to 29 the proper elevation. 30
3. Culvert slope; the absolute difference between the inlet and outlet crown elevation divided 31 by the length should be no greater than 1%. In most cases, this measurement must be done 32 with survey grade equipment in order to have the accuracy required to determine such a 33 low slope. Culverts installed at greater than 2% should be considered noncompliant and 34 reset at zero grade, unless it can be shown that culvert slope is not affecting performance 35 with respect to the other aspects of design discussed here (items 1, 2, 5, 6, and 7) As 36 discussed in (4) below, corrugated metal pipes are flexible and often deform during 37 installation. This means that the crown of the pipe will be higher or lower than expected for 38 the true shape. One way to determine whether the pipe has been deformed is to measure 39 the span and compare it to the specified span. Deviations from the nominal span will 40

2nd Draft Water Crossing Design Guidelines 11/30/11
200
indicate a deformed pipe. If the slope of the no‐slope pipe is greater than 2% based on the 1 crown elevations, then, to possibly avoid having to replace the pipe, the owner should 2 determine is any part of this slope is due to deformation. A more reliable way to determine 3 slope in a deformed pipe is to use the average elevation of the invert and crown at the inlet 4 and outlet. 5
4. Culvert elevation; where specified by plan, culvert invert elevation should be within ± 5% 6 of the culvert rise from plan elevation. For example, a 6 ft rise culvert should be set within ± 7 0.3 ft of the specified elevation. The controlling surface is the culvert invert. For embedded 8 culverts the invert is beneath several feet of bed material and difficult to measure 9 accurately. In the case of 4‐sided concrete box culverts, the invert can be found by 10 subtracting the culvert rise from the crown elevation. CMP culverts, because they are often 11 deformed during installation, have an installed rise which may or may not equal the 12 nominal culvert rise as stated on the plans. For cases where this measurement in a CMP is 13 of critical importance, the bed material must be shoveled away from the invert and directly 14 compared with an established benchmark. Culvert elevations that are greater than 10% of 15 the nominal rise from the plan elevation must be reset at the proper elevation. If such a 16 culvert results in a countersink within the no‐slope design criteria, particularly with respect 17 to bed width, it does not have to be reset. 18
5. Culvert bed slope; culvert bed slope must be less than or equal to 0.2 times the 19 rise/length(S<0.2R/L), or less than 3%. The bed slope is determined with the greatest 20 accuracy by measuring the difference between the inlet and outlet water surface divided by 21 the culvert length. If the culvert is dry, you must estimate an elevation along the prevailing 22 gradient. This criteria is intended to limit the application of no‐slope; if the culvert bed 23 slope is greater than 3% and the culvert is functioning in accordance with the other criteria 24 stated here, it does not need to be replaced. What is far more likely to be the case is that the 25 culvert bed was installed at >3% and has lowered since construction and initiated a headcut 26 upstream. By the time that monitoring detects this regrade, the damage has been done and 27 what remains is to see that the rest of the system is functioning correctly. 28
6. Culvert countersink; outlet countersink should be greater than or equal to 20% of the rise. 29 This is simply determined by subtracting the nominal culvert rise divided by measured bed‐30 to‐crown distance from 1. As mentioned in (4), this is a reliable method for concrete 31 culverts, but less accurate for CMPs. The culvert must be reset, or replaced with a properly 32 sized one, if the outlet countersink is less than 20% after construction. Changes in 33 countersink over time can either be the result of improper design or an unanticipated 34 change in the elevation of the downstream bed due to incision or the loss of a bed control. It 35 then becomes hard to assign responsibility for the repair. Excessive inlet countersink is 36 similar in that the culvert could be either too small, set too low, or subject to unexpected 37 aggredation. If inlet countersink exceeds 50% after construction, then changes should be 38 made by the owner. But if over time the inlet fills beyond 50%, then the cause should be 39 determined and a remedy sought. 40

2nd Draft Water Crossing Design Guidelines 11/30/11
201
7. Regrade; if the gradient of the bed of a no‐slope culvert is less than 0.75 times the upstream 1 channel gradient, and causes more than 3 ft of uncontrolled regrade, then it should be 2 replaced with a properly designed stream simulation culvert. Compensatory mitigation can 3 offset lost stream and riparian function. 4
STREAM SIMULATION CULVERTS 5 Please see Chapter 3 for a complete description of this method and an explanation of the terms 6 used in this section. 7
1. Culvert span; the culvert bed width should be equal to or greater than 1.2Wch + 2ft, unless 8 the culvert is located in an unconfined channel and the width has been increased to 9 accommodate overbank flow. Many errors occur in the assessment, design, and 10 specification of the proper culvert size so that this is one of the most fundamental 11 monitoring measurements. The measurement is done with a fiberglass tape from the point 12 where the bed meets the culvert wall on one side to a similar point on the other. This 13 measurement is taken at the inlet and outlet of the culvert. Culverts that are less than 80% 14 of the required size should be assessedd with respect to items 2, 3, 4, and 6 below. If it fails 15 to fulfill these functions, it should be replaced with the correct size. Culverts that fail to 16 simulate the natural adjacent channel should be replaced with the correct size. 17
2. Slope ratio; the culvert bed slope should be less than 1.25 times average upstream channel 18 slope. For this measurement, the water surface slope of the culvert is compared with the 19 prevailing slope upstream of the culvert. Often the area within a 100 ft or more of a 20 recently replaced culvert will be in transition, adjusting to the new culvert and its hydraulic 21 and sediment transport control. One must go sufficiently upstream of this affected zone to 22 accurately measure true slope. Bed slope evolves over time, responding to sediment inputs 23 and scour. In this way the slope ratio can also evolve and the monitoring study must be 24 designed to account for this process. In some instances, the bed is installed at a slightly 25 higher slope to slow the progress of regrade for a time. A natural grade break in a vicinity of 26 the culvert may affect the slope ratio and compliance for these cases must be handled 27 individually. 28
3. Bed material; Verify that culvert bed material is the same as material specified on the 29 plans, and that is it similar to that found in the adjacent channel. There may be reasons why 30 the culvert fill may differ from the channel bed, as described in Chapter 3. To account for 31 this difference, the plans and any reports must be available to the monitoring team so that 32 they can determine whether it complies. As a general rule, the median particle size in the 33 culvert should be within 18% of median particle size in the natural stream. More 34 accurately, the median particle size in the culvert should be within the one standard error of 35 the median stream particle size (Bunte and Abt 2001). This criteria derives from the fact 36 that one cannot know the size of stream sediment any more accurately than the standard 37 error associated with the assessment method, in this case, the Wolman pebble count of 100 38 particles (Wolman 1954). This standard error forms the basis of our expectations for a 39 properly constructed stream simulation bed and allows the owner and their contractor 40

2nd Draft Water Crossing Design Guidelines 11/30/11
202
some leeway in filling a bed specification, but still holds them to the basic premise of the 1 method – to “simulate” the natural streambed. 2
4. Countersink: the stream simulation criteria for countersink at the culvert inlet and outlet 3 countersink is greater than 30% and less than 50% of culvert rise. This is simply determined by 4 subtracting the nominal culvert rise divided by measured bed‐to‐crown distance from 1. As 5 mentioned in the no‐slope section (4), this is a reliable method for concrete culverts, but 6 less accurate for CMPs. Since many stream simulation culverts are deeply countersunk, 7 often over 3 ft, it is not practical to dig the bed up to find the invert and the nominal method 8 is all that is left to us. Countersink less than 30% is below the criteria and can result in a 9 decrease in bed width in round, arch, and squash culverts; it can also result in a dangerously thin 10 layer of sediment in the culvert that will be prone to washing out during storm events. Since many 11 stream simulation culverts are large, expensive and probably impossible to reset, countermeasures 12 might worth exploring. These might include the placement of large wood in the downstream 13 channel to cause some backwater to encourage sediment deposition in the culvert, provided it is 14 the correct size and not prone to scour. 15
5. Cross section; culvert bed cross section should be similar to the natural stream cross section. Of 16 particular importance is the presence of banks inside the culvert. It is common that the culvert bed 17 is constructed flat and remains so indefinitely. This reduces habitat complexity and available 18 passage pathways. One simple way to determine similarity is to compare the bankfull depth of an 19 appropriate cross section in the natural channel to the difference between the minimum and 20 maximum elevation in several culvert cross sections. This is shown in Figure 14.1. 21
22
Figure 14.1: Culvert cross section, above, and the natural channel cross section, below, showing a 23 comparison of depth to evaluate cross sectional similarity. 24
94
95
96
97
98
99
100
0 2 4 6 8 10 12 14 16 18 20 22 24 26 28 30
86
87
88
0 2 4 6 8 10 12 14 16
Depth = 0.2 ft
BF Depth = 1 ft

2nd Draft Water Crossing Design Guidelines 11/30/11
203
Culverts with maximum depth less than 50% of the bankfull depth should be considered for 1 retrofit. This could range from rearranging the bed material to form a more natural channel cross 2 section, to placing some larger rock along the culvert wall to help center the flow and increase 3 depth. 4
6. Regrade; channel regrade is the degradation of the upstream channel as a result of lowering the 5 culvert. Regrade is often beneficial and an expected part of crossing replacement. Regrade can 6 only be measured by comparing monumented cross sections, but it is not really necessary to 7 measure it unless one is required to do so. For monitoring purposes, what should be measured are 8 conditions that lead to fish passage barriers, particularly at upstream culverts, and the exposure of 9 bedrock. 10
BRIDGES 11 Chapter 4 describes the latest recommendations for designing bridges to protect habitat. Bridge 12 designs that result from these recommendations are site specific and more complicated to verify, as 13 opposed to no‐slope culverts. Bridge monitoring can only compare what is shown in plans and 14 written in reports to what has been built. Several channel effects can be measured and those are 15 noted below. 16
Considering the cost and disruption to traffic, it is unlikely that bridges which fail to meet 17 expectations will be replaced before their service life is over. Chapter 4 includes a section on 18 bridge maintenance which addresses the replacement vs. repair. This section should form the basis of 19 contingency actions for the following monitoring categories. 20
Monitoring should take place 4 years after construction in order to allow time for these effects to become 21 obvious (likelihood of a 100 year event taking place is 4%, likelihood of a 10 year event 34%). 22
1. Bridge span: span is the most fundamental parameter in bridge design for habitat protection. 23 When combined with the elevation of the bridge above the channel, span determines the amount 24 of width provided for the stream, flood flow, meander migration, sediment and debris passage. 25 What should be monitored is the width between abutments or abutment protection; usually 26 the width between riprap protection. In all instances this should be greater than the 27 ordinary high water width (OHW, see WAC 220‐110‐070(1)a). In wide, floodplain channels, 28 this width should be enough to accommodate peak flow without causing channel wide scour 29 (see below) and to have the least effect on the watercourse (WAC 220‐110‐070(1)h). 30 Bridges that fail to meet these requirements should be monitored using the remaining 5 31 criteria. 32
2. Bed scour: bed scour must be differentiated from normal scour that form channel pools. 33 Bed scour from an undersized or inappropriately designed bridge will be located at bridge 34 piers or abutments and to depths in excess of average channel pool depth. In addition, the 35 bed will be coarsened by high shear stress and constriction scour. 36
3. Sediment transport: another hallmark of an undersized or inappropriately designed 37 bridge excessive sediment deposited upstream of crossing. These deposits are often in 38 excess of normal bar height and usually cause lateral channel movement. 39

2nd Draft Water Crossing Design Guidelines 11/30/11
204
4. Bank scour: banks scour is a normal stream process to be expected in meandering streams 1 or after a big flood. Bank scour is indicated by unvegetated cut slopes. Poorly sited or 2 undersized bridges may cause bank scour in excess of prevailing rates immediately 3 downstream, at the upstream fill slope, or adjacent bank. Scour can be documented from 4 aerial and close up photographs, as well as surveyed cross sections and bank pins. 5
5. Bridge armor: armored banks outside the bridge shadow indicate the need to reinforce the 6 area around a span that constricts the channel. The fact that they are not scoured does not 7 validate the sizing. Fill slope stabilization is exempted from this consideration. 8
6. Debris racked against the bridge components indicates that the bridge has not been 9 designed to accommodate normal debris transport. The cross section has been constricted 10 or the clearance is too small. The bottom cord of bridge must be above a calculated 100 year 11 flood elevation with consideration for debris likely to be encountered (this is required by 12 WAC 220‐110‐070 (1)e) or 3 ft above the 100 year flood elevation. 13
39