Embed Size (px)
Citation preview

Table of Contents
2011 Commission Summary
2011 Opinions of the Property Tax Administrator
Residential Reports
Residential Assessment Actions
Residential Assessment Survey
R&O Statistics
Residential Correlation
Residential Real Property
I. Correlation
II. Analysis of Sales Verification
III. Measure of Central Tendency
IV. Analysis of Quality of Assessment
Commercial Reports Commercial Assessment Actions
Commercial Assessment Survey
R&O Statistics
Commercial Correlation
Commercial Real Property
I. Correlation
II. Analysis of Sales Verification
III. Measure of Central Tendency
IV. Analysis of Quality of Assessment
Agricultural or Special Valuation Reports Agricultural Assessment Actions
Agricultural Assessment Survey
Agricultural Base Analysis Statistics
Agricultural Random Inclusion Analysis Statistics
Agricultural Random Exclusion Analysis Statistics
Special Valuation Statistics
Special Valuation Methodology
Special Valuation Base Analysis Statistics
Special Valuation Random Inclusion Analysis Statistics
Special Valuation Random Exclusion Analysis Statistics
Agricultural or Special Valuation Correlation
Agricultural or Special Valuation Land
I. Correlation
II. Analysis of Sales Verification
III. Measure of Central Tendency
County 42 - Page 1

IV. Analysis of Quality of Assessment
County Reports
2011 County Abstract of Assessment for Real Property, Form 45
2011 County Agricultural Land Detail
2011 County Abstract of Assessment for Real Property Compared with the 2009
Certificate of Taxes Levied (CTL)
County Assessor’s Three Year Plan of Assessment
Assessment Survey – General Information
Certification
Maps
Market Areas
Registered Wells > 500 GPM
Geo Codes
Soil Classes
Valuation History Charts
County 42 - Page 2

Su
mm
ary
County 42 - Page 3

2011 Commission Summary
for Harlan County
Residential Real Property - Current
Number of Sales
Total Sales Price
Total Adj. Sales Price
Total Assessed Value
Avg. Adj. Sales Price Avg. Assessed Value
Median
Wgt. Mean
Mean
95% Median C.I
95% Wgt. Mean C.I
95% Mean C.I
90.10 to 95.02
86.70 to 94.63
89.56 to 112.86
% of Value of the Class of all Real Property Value in the County
% of Records Sold in the Study Period
% of Value Sold in the Study Period
Average Assessed Value of the Base
22.26
5.18
6.15
$41,281
Residential Real Property - History
Year
2008
2007
2009
Number of Sales LOV
127
145
Confidenence Interval - Current
98
97
Median
134 97 97
97
98
2010 124 96 96
121
101.21
92.89
90.67
$6,535,228
$6,550,528
$5,939,080
$54,137 $49,083
County 42 - Page 4

2011 Commission Summary
for Harlan County
Commercial Real Property - Current
Number of Sales
Total Sales Price
Total Adj. Sales Price
Total Assessed Value
Avg. Adj. Sales Price Avg. Assessed Value
Median
Wgt. Mean
Mean
95% Median C.I
95% Wgt. Mean C.I
95% Mean C.I
% of Value of the Class of all Real Property Value in the County
% of Records Sold in the Study Period
% of Value Sold in the Study Period
Average Assessed Value of the Base
Commercial Real Property - History
Year
2008
2007
Number of Sales LOV
17
69.56 to 134.85
27.17 to 85.23
82.39 to 141.49
5.30
5.76
9.49
$77,867
28
27
Confidenence Interval - Current
Median
100
100
2009 28 98 98
100
100
2010 96 100 22
$3,880,100
$3,880,100
$2,180,555
$228,241 $128,268
111.94
101.80
56.20
County 42 - Page 5

Op
inio
ns
County 42 - Page 6

2011 Opinions of the Property Tax Administrator
for Harlan County
My opinions and recommendations are stated as a conclusion based on all of the factors known to me
regarding the assessment practices and statistical analysis for this county. See, Neb. Rev. Stat. §77-5027
(R. S. Supp., 2005). While the median assessment sales ratio from the Qualified Statistical Reports for
each class of real property is considered, my opinion of the level of value for a class of real property may
be determined from other evidence contained within this Reports and Opinions of the Property Tax
Administrator. My opinion of quality of assessment for a class of real property may be influenced by the
assessment practices of the county assessor.
Residential Real
Property
Commercial Real
Property
Agricultural Land
Class Level of Value Quality of Assessment
*NEI
71
93
The qualitative measures calculated in the random
exclude sample best reflect the dispersion of the assessed
values within the population. The quality of assessment
meets generally accepted mass appraisal practices.
Meets generally accepted mass appraisal practices.
Meets generally accepted mass appraisal practices.
No recommendation.
No recommendation.
No recommendation.
Non-binding
recommendation
**A level of value displayed as NEI, not enough information, represents a class of property with insufficient
information to determine a level of value.
Dated this 11th day of April, 2011.
Ruth A. Sorensen
Property Tax Administrator
County 42 - Page 7

Resid
entia
l Rep
orts
County 42 - Page 8

2011 Assessment Actions for Harlan County
taken to address the following property classes/subclasses:
Residential
A physical inspection of the rural residential parcels in 12 townships was completed; as was a
review of parcels in the North Shore Cabin Area at Harlan County Reservoir. A physical
inspection includes an exterior review of the property. New photographs are taken and
measurements are checked where necessary. The quality and condition of the parcel are
reviewed. Door hangers are left when additional information is required.
A sales study was completed, and supported the continued use of the existing appraisal tables.
Only routine maintenance occurred within the rest of the residential class. The pickup work was
completed timely.
County 42 - Page 9

2011 Residential Assessment Survey for Harlan County
1. Valuation data collection done by:
The appraisal staff and the assessment staff as needed.
2. List the valuation groupings used by the County and describe the unique
characteristics that effect value:
Valuation
Grouping
Description of unique characteristics
01 Alma – the largest community in the county. Alma offers the most
businesses and amenities and is influenced by its proximity to Harlan
County Reservoir. The market is fairly active in Alma and is stronger
than other parts of the county.
02 Acreages – all residential parcels not located in the political
boundaries of a Village with the exception of the properties located at
Harlan County Reservoir. There continues to be strong demand for
rural homes in Harlan County.
03 Lake Homes: Hunters Hill, N Shore Cabin, and Hanchetts – these
properties are located at Harlan County Reservoir. Properties at the
lake continue to sell well due to the recreational influence provided
by the lake.
04 Lake Trailers: Taylor Manor, Republican City – these properties are
lake influenced, but the majority of properties in these areas are
mobile homes, making the area less desirable to buyers.
05 Oxford & Orleans – small communities within Harlan County. These
communities have some main street businesses and a few amenities.
The market is generally softer here than it is in groups 1-4.
06 Huntley, Ragan & Stamford – these are very small communities
(populations less than 100). There is very little activity within these
communities each year, and the market is not organized.
3. List and describe the approach(es) used to estimate the market value of
residential properties.
Only the cost approach is used.
4. When was the last lot value study completed?
Lot values were last established for 2002; however, a sales study of lot values is
completed yearly to monitor values.
5. Describe the methodology used to determine the residential lot values.
For the towns and villages a market study is completed and the square foot method
is used. Lots at Harlan County Reservoir are established differently. Values are
determined by location at the lake and are not based on lot size.
6. What costing year for the cost approach is being used for each valuation
grouping?
June, 2002 is used for the entire class.
7. If the cost approach is used, does the County develop the depreciation
study(ies) based on local market information or does the county use the tables
provided by the CAMA vendor?
County 42 - Page 10

Depreciation tables are established using local market information.
8. Are individual depreciation tables developed for each valuation grouping?
Depreciation tables are established by location.
9. How often does the County update the depreciation tables?
Annually, if the sales study indicates a need.
10. Is the valuation process (cost date and depreciation schedule or market
comparison) used for the pickup work the same as was used for the general
population of the class/valuation grouping?
Yes
11. Describe the method used to determine whether a sold parcel is substantially
changed.
Generally, a parcel is considered substantially changed when an improvement is
either added to or removed from a parcel. However, major additions/remodels may
also warrant a sale being coded substantially changed.
12. Please provide any documents related to the policies or procedures used for the
residential class of property.
The office does not have any documents specific to the residential class, but does
have a procedure manual in use.
County 42 - Page 11

Number of Sales :
Total Sales Price :
Total Adj. Sales Price :
Total Assessed Value :
Avg. Adj. Sales Price :
Avg. Assessed Value :
MEDIAN :
WGT. MEAN :
MEAN :
COD :
PRD :
COV :
STD :
Avg. Abs. Dev :
MAX Sales Ratio :
MIN Sales Ratio :
95% Median C.I. :
95% Wgt. Mean C.I. :
95% Mean C.I. :
121
6,535,228
6,550,528
5,939,080
54,137
49,083
22.88
111.62
64.61
65.39
21.25
760.33
49.42
90.10 to 95.02
86.70 to 94.63
89.56 to 112.86
Printed:3/24/2011 3:38:57PM
Qualified
PAD 2011 R&O Statistics (Using 2011 Values)Harlan42
Date Range: 7/1/2008 To 6/30/2010 Posted on: 2/17/2011
93
91
101
RESIDENTIAL
Page 1 of 2
Avg. Adj.
RANGE Assd. ValSale Price95%_Median_C.I.MAXMINPRDCODWGT.MEANMEANMEDIANCOUNT
Avg.DATE OF SALE *
_____Qrtrs_____
01-JUL-08 To 30-SEP-08 16 100.36 100.12 94.58 17.98 105.86 62.00 204.79 78.64 to 103.98 38,163 36,093
01-OCT-08 To 31-DEC-08 12 93.16 96.51 95.81 07.44 100.73 81.00 132.30 90.85 to 101.30 44,638 42,769
01-JAN-09 To 31-MAR-09 12 100.73 98.92 85.79 19.06 115.30 58.25 168.54 81.89 to 107.24 67,833 58,196
01-APR-09 To 30-JUN-09 17 91.32 91.32 91.71 06.71 99.57 73.16 105.53 86.83 to 96.77 82,376 75,543
01-JUL-09 To 30-SEP-09 17 94.47 91.39 85.54 18.94 106.84 49.42 138.19 65.80 to 107.67 70,474 60,282
01-OCT-09 To 31-DEC-09 10 90.41 89.34 93.57 10.37 95.48 71.98 104.16 77.20 to 98.28 46,020 43,062
01-JAN-10 To 31-MAR-10 9 102.00 103.91 94.19 13.67 110.32 85.97 151.65 86.68 to 116.67 57,822 54,462
01-APR-10 To 30-JUN-10 28 89.00 120.18 91.00 51.04 132.07 56.64 760.33 78.51 to 94.27 36,115 32,864
_____Study Yrs_____
01-JUL-08 To 30-JUN-09 57 93.43 96.48 91.45 13.89 105.50 58.25 204.79 90.85 to 99.85 58,959 53,918
01-JUL-09 To 30-JUN-10 64 91.18 105.43 89.84 31.31 117.35 49.42 760.33 85.97 to 98.13 49,842 44,778
_____Calendar Yrs_____
01-JAN-09 To 31-DEC-09 56 92.81 92.62 88.78 14.49 104.33 49.42 168.54 89.07 to 98.13 69,154 61,393
_____ALL_____ 121 92.89 101.21 90.67 22.88 111.62 49.42 760.33 90.10 to 95.02 54,137 49,083
Avg. Adj.
RANGE Assd. ValSale Price95%_Median_C.I.MAXMINPRDCODWGT.MEANMEANMEDIANCOUNT
Avg.VALUATION GROUPING
01 40 92.18 95.89 90.53 20.07 105.92 49.42 204.79 82.63 to 99.85 63,365 57,365
02 16 92.58 92.67 87.87 14.97 105.46 58.25 132.30 81.89 to 101.62 93,553 82,206
03 6 86.68 84.13 80.84 10.60 104.07 58.33 96.77 58.33 to 96.77 148,500 120,051
04 28 93.92 101.88 101.18 18.92 100.69 68.13 194.50 88.78 to 103.98 30,587 30,946
05 22 95.62 125.44 96.31 41.45 130.25 71.98 760.33 88.79 to 102.83 27,211 26,207
06 9 91.60 90.16 95.86 21.02 94.05 62.00 138.19 64.90 to 104.85 19,222 18,427
_____ALL_____ 121 92.89 101.21 90.67 22.88 111.62 49.42 760.33 90.10 to 95.02 54,137 49,083
Avg. Adj.
RANGE Assd. ValSale Price95%_Median_C.I.MAXMINPRDCODWGT.MEANMEANMEDIANCOUNT
Avg.PROPERTY TYPE *
01 113 92.38 101.34 90.56 23.48 111.90 49.42 760.33 89.76 to 95.08 56,387 51,064
06 0 00.00 00.00 00.00 00.00 00.00 00.00 00.00 N/A 0 0
07 8 94.50 99.48 94.42 15.49 105.36 68.13 151.65 68.13 to 151.65 22,350 21,104
_____ALL_____ 121 92.89 101.21 90.67 22.88 111.62 49.42 760.33 90.10 to 95.02 54,137 49,083
County 42 - Page 12

Number of Sales :
Total Sales Price :
Total Adj. Sales Price :
Total Assessed Value :
Avg. Adj. Sales Price :
Avg. Assessed Value :
MEDIAN :
WGT. MEAN :
MEAN :
COD :
PRD :
COV :
STD :
Avg. Abs. Dev :
MAX Sales Ratio :
MIN Sales Ratio :
95% Median C.I. :
95% Wgt. Mean C.I. :
95% Mean C.I. :
121
6,535,228
6,550,528
5,939,080
54,137
49,083
22.88
111.62
64.61
65.39
21.25
760.33
49.42
90.10 to 95.02
86.70 to 94.63
89.56 to 112.86
Printed:3/24/2011 3:38:57PM
Qualified
PAD 2011 R&O Statistics (Using 2011 Values)Harlan42
Date Range: 7/1/2008 To 6/30/2010 Posted on: 2/17/2011
93
91
101
RESIDENTIAL
Page 2 of 2
Avg. Adj.
RANGE Assd. ValSale Price95%_Median_C.I.MAXMINPRDCODWGT.MEANMEANMEDIANCOUNT
Avg.SALE PRICE *
______Low $______
1 TO 4999 5 87.00 217.35 182.67 162.70 118.99 62.00 760.33 N/A 2,100 3,836
5000 TO 9999 14 95.18 101.95 101.02 22.95 100.92 64.90 204.79 72.88 to 116.67 8,600 8,688
_____Total $_____
1 TO 9999 19 92.22 132.32 107.57 58.14 123.01 62.00 760.33 81.00 to 108.00 6,889 7,411
10000 TO 29999 28 98.92 107.91 105.43 24.36 102.35 65.39 194.50 91.05 to 103.98 19,583 20,647
30000 TO 59999 43 93.49 91.51 90.70 14.01 100.89 49.42 132.30 85.79 to 98.28 44,873 40,701
60000 TO 99999 12 96.99 97.16 96.92 06.39 100.25 86.83 107.24 88.79 to 105.51 77,188 74,814
100000 TO 149999 10 86.08 80.71 80.38 11.72 100.41 58.25 92.38 59.53 to 91.04 114,150 91,756
150000 TO 249999 6 93.27 92.93 92.82 08.67 100.12 81.89 104.16 81.89 to 104.16 179,833 166,916
250000 TO 499999 3 86.68 81.90 82.17 16.29 99.67 58.33 100.68 N/A 265,000 217,742
500000 + 0 00.00 00.00 00.00 00.00 00.00 00.00 00.00 N/A 0 0
_____ALL_____ 121 92.89 101.21 90.67 22.88 111.62 49.42 760.33 90.10 to 95.02 54,137 49,083
County 42 - Page 13

Resid
entia
l Co
rrelatio
n
County 42 - Page 14

2011 Correlation Section
for Harlan County
The residential statistics are a reliable representation of residential parcels within the county,
and can be considered for measurement purposes. Only the median is within the acceptable
range. When low dollar sales are removed, there is very little difference in the calculated
median or weighted mean, however, the mean improves to 94% and the COD and PRD
improve to 14.97% and 104.14% respectively. All subclasses with a sufficient number of
sales are within the acceptable range.
The county employs a thorough sales verification process. The appraisal staff reviews sales
information, and will interview the buyer and/or seller regarding sale terms whenever possible.
A review of the qualified and non-qualified sales rosters revealed no bias in qualification
determinations.
The county is complying with the six year inspection requirement. So far, three-fourths of the
rural areas have been completed, as have most of the neighborhoods around Harlan County
Reservoir, and the communities of Alma and Oxford. The physical review work is very
thorough and includes interviews or questionnaires to property owners when additional
information is needed. Both the assessment manager and the appraisal staff are
knowledgeable of the market within the county, and annually review the appraisal models to
determine whether adjustments are necessary.
When the low dollar sales were removed, the coefficient of dispersion is within the acceptable
range, and the PRD is only slightly above the range recommended by IAAO. Because the
county has demonstrated consistency in the appraisal process, it is believed that assessments
are uniform and proportionate within the county.
Based on all available information, it has been determined that the level of value of the
residential class in Harlan County is 93%; all subclasses are within the acceptable range.
A. Residential Real Property
County 42 - Page 15

2011 Correlation Section
for Harlan County
B. Analysis of Sales Verification
Neb. Rev. Stat. 77-1327(2) provides that all sales are deemed to be arms length transactions
unless determined to be otherwise under professionally accepted mass appraisal techniques .
The county assessor is responsible for the qualification of the sales included in the state sales
file.
The Standard on Ratio Studies, International Association of Assessing Officials (2007),
indicates that excessive trimming (the arbitrary exclusion or adjustment of arms length
transactions) may indicate an attempt to inappropriately exclude arms length transactions to
create the appearance of a higher level of value and quality of assessment. The sales file, in a
case of excess trimming, will fail to properly represent the level of value and quality of
assessment of the population of real property.
The Division frequently reviews the procedures used by the county assessor to qualify sales to
ensure bias does not exist in judgments made. Arms length transactions should only be
excluded when they compromise the reliability of the resulting statistics. In cases where a
county assessor has disqualified sales without substantiation, the Division may include such
sales in the ratio study.
County 42 - Page 16

2011 Correlation Section
for Harlan County
C. Measures of Central Tendency
There are three measures of central tendency calculated by the Division: median ratio,
weighted mean ratio, and mean ratio. Since each measure of central tendency has strengths
and weaknesses, the use of any statistic for equalization should be reconciled with the other
two, as in an appraisal, based on the appropriateness in the use of the statistic for a defined
purpose, the quantity of the information from which it was drawn, and the reliability of the
data that was used in its calculation. An examination of the three measures can serve to
illustrate important trends in the data if the measures do not closely correlate to each other.
The IAAO considers the median ratio the most appropriate statistical measure for use in
determining level of value for direct equalization; the process of adjusting the values of
classes or subclasses of property in response to the determination of level of value at a point
above or below a particular range. Since the median ratio is considered neutral in relationship
to either assessed value or selling price, its use in adjusting the class or subclass of properties
will not change the relationships between assessed value and level of value already present
within the class or subclass of properties, thus rendering an adjustment neutral in its impact on
the relative tax burden to an individual property. Additionally, the median ratio is less
influenced by the presence of extreme ratios, commonly called outliers. One outlier in a small
sample size of sales can have controlling influence over the other measures of central
tendency. The median ratio limits the distortion potential of an outlier.
The weighted mean ratio is viewed by the IAAO as the most appropriate statistical measure
for indirect equalization. The weighted mean, because it is a value weighted ratio, best reflects
a comparison of the assessed and market value of property in the political subdivision. If the
distribution of aid to political subdivisions must relate to the market value available for
assessment in the political subdivision, the measurement of central tendency used to analyze
level of value should reflect the dollars of value available to be assessed. The weighted mean
ratio does that more than either of the other measures of central tendency.
If the weighted mean ratio, because of its dollar-weighting feature, is significantly different
from the median ratio, it may be an indication of other problems with assessment
proportionality. When this occurs, an evaluation of the county's assessment practices and
procedures is appropriate to discover remedies to the situation.
The mean ratio is used as a basis for other statistical calculations, such as the price related
differential and coefficient of variation. However, the mean ratio has limited application in
the analysis of level of value because it assumes a normal distribution of the data set around
the mean ratio with each ratio having the same impact on the calculation regardless of the
assessed value or the selling price.
County 42 - Page 17

2011 Correlation Section
for Harlan County
D. Analysis of Quality of Assessment
In analyzing the statistical data of assessment quality, there are two measures upon which
assessment officials will primarily rely: the Coefficient of Dispersion (COD), and the Price
Related Differential (PRD). Whether such statistics can be relied upon as meaningful for the
population depends on whether the sample is representative.
The COD is commonly referred to as the index of assessment inequality. It is used to measure
how closely the individual ratios are clustered around the median ratio and suggests the degree
of uniformity or inaccuracy resulting in the assessments. The COD is computed by dividing
the average deviation by the median ratio. For example, a COD of 20 means half of the ratios
are 20 percent above or below the median. The closer the ratios are grouped around the
median, the more equitable the assessment of property tends to be. Conversely, if the
dispersion is quite large, there is a large spread in the ratios typically indicating a large spread
around the median in the assessment of property, which results in an inequity in assessment
and taxes. There is no range of acceptability stated in the Nebraska statutes for the COD
measure. The International Association of Assessing Officers recommended ratio study
performance standards are as follows:
Single-family residences: a COD of 15 percent or less.
For newer and fairly homogeneous areas: a COD of 10 or less.
Income-producing property: a COD of 20 or less, or in larger urban jurisdictions, 15 or less.
Vacant land and other unimproved property, such as agricultural land: a COD of 20 or less.
Rural residential and seasonal properties: a COD of 20 or less.
Mass Appraisal of Real Property, International Association of Assessing Officers, (1999), p.
246.
In unusually homogeneous types of property low CODs can be anticipated; however, in all
other cases CODs less than 5 percent may be indicative of non-representative samples or the
selective reappraisal of sold parcels.
The PRD, also known as the index of regression, is a measurement of the relationship between
the ratios of high-value and low-value properties to determine if the value of property has any
influence on the assessment ratio. It is calculated by dividing the arithmetic mean ratio by the
weighted mean ratio. The PRD provides an indicator of the degree to which high-value
properties are over-assessed or under-assessed in relation to low-value properties. A PRD of
100 indicates there is no bias in the assessment of high-value properties in comparison to
low-value properties. A PRD greater than 100 indicates the assessments are regressive, which
means low-value properties tend to have a higher assessment ratio than high-value properties.
The result is the owner of a low-value property pays a greater amount of tax in relation to
value than the owner of a high-value property. Conversely, a PRD less than 100 indicates that
high-value properties are over assessed in relation to low-value properties.
There is no range of acceptability stated in the Nebraska statutes for the PRD measure. The
Standard of Ratio Studies, adopted by the International Association of Assessing Officers,
County 42 - Page 18

2011 Correlation Section
for Harlan County
July, 2007, recommends that the PRD should lie between 98 and 103. This range is centered
slightly above 100 to allow for a slightly upward measurement bias inherent in the PRD.
The PRD is calculated based on the selling price/assessed value in the sales file. This measure
can be misleading if the dollar value of the records in the sales file is not proportionate to the
dollar value of records in the population.
Mass Appraisal of Real Property, International Association of Assessing Officers, (1999), p.
247.
County 42 - Page 19

Co
mm
ercial R
epo
rts
County 42 - Page 20

2011 Assessment Actions for Harlan County
taken to address the following property classes/subclasses:
Commercial
A physical inspection of the commercial parcels in the Marinas Valuation Grouping was
completed. A physical inspection includes an exterior review of the property. New photographs
are taken and new measurements are taken where necessary. The quality and condition of the
parcel are reviewed.
A sales study was completed, and supported the continued use of the current appraisal tables.
The pickup work was completed timely.
County 42 - Page 21

2011 Commercial Assessment Survey for Harlan County
1. Valuation data collection done by:
The appraisal staff and the assessment staff as needed.
2. List the valuation groupings used by the County and describe the unique
characteristics that effect value:
Valuation
Grouping
Description of unique characteristics
01 Alma – the largest community in the county. Alma offers the most
businesses and is influenced by its proximity to Harlan County
Reservoir. The market is fairly active in Alma and is stronger than
other parts of the county.
02 Rural – contains all parcels that occur outside the City limits, except
for those located in the Marinas at Harlan County Reservoir. Most of
the businesses in the rural area are agricultural based and are
generally not comparable to the properties found within the
communities.
03 Marinas – includes all commercial parcels located at Harlan County
Reservoir. This area is influenced by the recreational activities that
take place at the lake and are not comparable to the communities
within the county.
04 Republican City – its proximity to the lake gives it more traffic in its
commercial businesses, making the market somewhat stronger than
the other small communities in the county. However, the market here
is not as strong as it is in Alma.
05 Oxford & Orleans –are small communities. The market here is softer
than it is in the other communities as these towns are not close to the
lake nor are they located along major highways. Each of these
communities does have a business district and some commercial sales
activity each year.
06 Huntley, Ragan & Stamford – these are very small communities.
There is no organized market within these towns. The commercial
parcels that occasionally sell are generally vacant buildings.
3. List and describe the approach(es) used to estimate the market value of
commercial properties.
The cost approach is primarily used. The income approach is used when the
income/expense and rent information is available and applicable. There are
generally not enough sales to develop the market or sales comparison approach in
Harlan County.
4. When was the last lot value study completed?
Lot values were last established in 2002; however, a sales study is completed yearly
to monitor the values.
5. Describe the methodology used to determine the commercial lot values.
For the towns and villages a market study is completed using the square foot
method. Lots at Harlan County Reservoir are established by location and are not
County 42 - Page 22

based on lot size.
6.
What costing year for the cost approach is being used for each valuation
grouping?
June, 2002 is used for the entire class.
7. If the cost approach is used, does the County develop the depreciation
study(ies) based on local market information or does the county use the tables
provided by the CAMA vendor?
Depreciation tables are developed using local market information.
8. Are individual depreciation tables developed for each valuation grouping?
Deprecation tables are established by location.
9. How often does the County update the depreciation tables?
Annually, if the sales study indicates a need.
10. Is the valuation process (cost date and depreciation schedule or market
comparison) used for the pickup work the same as was used for the general
population of the class/valuation grouping?
Yes
11. Describe the method used to determine whether a sold parcel is substantially
changed.
Generally, a parcel is considered substantially changed when an improvement is
either added to or removed from a parcel. However, major additions/remodels may
also warrant a sale being coded substantially changed.
12. Please provide any documents related to the policies or procedures used for the
commercial class of property.
The office does not have any documents specific to the commercial class, but does
have a procedure manual in use.
County 42 - Page 23

Number of Sales :
Total Sales Price :
Total Adj. Sales Price :
Total Assessed Value :
Avg. Adj. Sales Price :
Avg. Assessed Value :
MEDIAN :
WGT. MEAN :
MEAN :
COD :
PRD :
COV :
STD :
Avg. Abs. Dev :
MAX Sales Ratio :
MIN Sales Ratio :
95% Median C.I. :
95% Wgt. Mean C.I. :
95% Mean C.I. :
17
3,880,100
3,880,100
2,180,555
228,241
128,268
41.42
199.18
51.35
57.48
42.17
245.67
32.26
69.56 to 134.85
27.17 to 85.23
82.39 to 141.49
Printed:3/24/2011 3:39:00PM
Qualified
PAD 2011 R&O Statistics (Using 2011 Values)Harlan42
Date Range: 7/1/2007 To 6/30/2010 Posted on: 2/17/2011
102
56
112
COMMERCIAL
Page 1 of 2
Avg. Adj.
RANGE Assd. ValSale Price95%_Median_C.I.MAXMINPRDCODWGT.MEANMEANMEDIANCOUNT
Avg.DATE OF SALE *
_____Qrtrs_____
01-JUL-07 To 30-SEP-07 1 105.14 105.14 105.14 00.00 100.00 105.14 105.14 N/A 45,000 47,315
01-OCT-07 To 31-DEC-07 1 91.83 91.83 91.83 00.00 100.00 91.83 91.83 N/A 163,350 150,000
01-JAN-08 To 31-MAR-08 2 81.94 81.94 68.64 17.77 119.38 67.38 96.50 N/A 23,000 15,788
01-APR-08 To 30-JUN-08 2 116.34 116.34 108.03 12.50 107.69 101.80 130.88 N/A 70,000 75,620
01-JUL-08 To 30-SEP-08 2 52.95 52.95 33.95 39.07 155.96 32.26 73.63 N/A 1,042,500 353,883
01-OCT-08 To 31-DEC-08 1 134.85 134.85 134.85 00.00 100.00 134.85 134.85 N/A 87,750 118,330
01-JAN-09 To 31-MAR-09 1 69.56 69.56 69.56 00.00 100.00 69.56 69.56 N/A 1,085,500 755,035
01-APR-09 To 30-JUN-09 2 164.67 164.67 206.13 25.91 79.89 122.00 207.33 N/A 17,750 36,588
01-JUL-09 To 30-SEP-09 1 127.82 127.82 127.82 00.00 100.00 127.82 127.82 N/A 5,500 7,030
01-OCT-09 To 31-DEC-09 0 00.00 00.00 00.00 00.00 00.00 00.00 00.00 N/A 0 0
01-JAN-10 To 31-MAR-10 1 71.30 71.30 71.30 00.00 100.00 71.30 71.30 N/A 150,000 106,950
01-APR-10 To 30-JUN-10 3 185.35 156.90 88.05 37.04 178.19 39.68 245.67 N/A 12,167 10,713
_____Study Yrs_____
01-JUL-07 To 30-JUN-08 6 99.15 98.92 96.39 13.81 102.62 67.38 130.88 67.38 to 130.88 65,725 63,355
01-JUL-08 To 30-JUN-09 6 97.82 106.61 50.23 49.19 212.24 32.26 207.33 32.26 to 207.33 548,958 275,718
01-JUL-09 To 30-JUN-10 5 127.82 133.96 76.10 50.08 176.03 39.68 245.67 N/A 38,400 29,224
_____Calendar Yrs_____
01-JAN-08 To 31-DEC-08 7 96.50 91.04 42.77 28.76 212.86 32.26 134.85 32.26 to 134.85 336,964 144,130
01-JAN-09 To 31-DEC-09 4 124.91 131.68 74.14 28.74 177.61 69.56 207.33 N/A 281,625 208,810
_____ALL_____ 17 101.80 111.94 56.20 41.42 199.18 32.26 245.67 69.56 to 134.85 228,241 128,268
Avg. Adj.
RANGE Assd. ValSale Price95%_Median_C.I.MAXMINPRDCODWGT.MEANMEANMEDIANCOUNT
Avg.VALUATION GROUPING
01 6 89.39 92.07 88.42 34.15 104.13 39.68 134.85 39.68 to 134.85 66,375 58,688
02 1 32.26 32.26 32.26 00.00 100.00 32.26 32.26 N/A 2,000,000 645,180
03 2 80.70 80.70 72.47 13.80 111.36 69.56 91.83 N/A 624,425 452,518
04 3 185.35 164.83 131.02 18.98 125.81 101.80 207.33 N/A 51,667 67,692
05 4 126.44 148.76 133.79 31.25 111.19 96.50 245.67 N/A 8,500 11,373
06 1 67.38 67.38 67.38 00.00 100.00 67.38 67.38 N/A 44,000 29,645
_____ALL_____ 17 101.80 111.94 56.20 41.42 199.18 32.26 245.67 69.56 to 134.85 228,241 128,268
County 42 - Page 24

Number of Sales :
Total Sales Price :
Total Adj. Sales Price :
Total Assessed Value :
Avg. Adj. Sales Price :
Avg. Assessed Value :
MEDIAN :
WGT. MEAN :
MEAN :
COD :
PRD :
COV :
STD :
Avg. Abs. Dev :
MAX Sales Ratio :
MIN Sales Ratio :
95% Median C.I. :
95% Wgt. Mean C.I. :
95% Mean C.I. :
17
3,880,100
3,880,100
2,180,555
228,241
128,268
41.42
199.18
51.35
57.48
42.17
245.67
32.26
69.56 to 134.85
27.17 to 85.23
82.39 to 141.49
Printed:3/24/2011 3:39:00PM
Qualified
PAD 2011 R&O Statistics (Using 2011 Values)Harlan42
Date Range: 7/1/2007 To 6/30/2010 Posted on: 2/17/2011
102
56
112
COMMERCIAL
Page 2 of 2
Avg. Adj.
RANGE Assd. ValSale Price95%_Median_C.I.MAXMINPRDCODWGT.MEANMEANMEDIANCOUNT
Avg.PROPERTY TYPE *
02 0 00.00 00.00 00.00 00.00 00.00 00.00 00.00 N/A 0 0
03 17 101.80 111.94 56.20 41.42 199.18 32.26 245.67 69.56 to 134.85 228,241 128,268
04 0 00.00 00.00 00.00 00.00 00.00 00.00 00.00 N/A 0 0
_____ALL_____ 17 101.80 111.94 56.20 41.42 199.18 32.26 245.67 69.56 to 134.85 228,241 128,268
Avg. Adj.
RANGE Assd. ValSale Price95%_Median_C.I.MAXMINPRDCODWGT.MEANMEANMEDIANCOUNT
Avg.SALE PRICE *
______Low $______
1 TO 4999 3 122.00 154.72 155.63 40.75 99.42 96.50 245.67 N/A 1,333 2,075
5000 TO 9999 1 127.82 127.82 127.82 00.00 100.00 127.82 127.82 N/A 5,500 7,030
_____Total $_____
1 TO 9999 4 124.91 148.00 139.53 31.02 106.07 96.50 245.67 N/A 2,375 3,314
10000 TO 29999 2 112.52 112.52 81.30 64.74 138.40 39.68 185.35 N/A 17,500 14,228
30000 TO 59999 4 118.01 127.68 122.59 35.10 104.15 67.38 207.33 N/A 38,500 47,198
60000 TO 99999 2 104.24 104.24 104.73 29.36 99.53 73.63 134.85 N/A 86,375 90,458
100000 TO 149999 1 101.80 101.80 101.80 00.00 100.00 101.80 101.80 N/A 110,000 111,975
150000 TO 249999 2 81.57 81.57 82.00 12.59 99.48 71.30 91.83 N/A 156,675 128,475
250000 TO 499999 0 00.00 00.00 00.00 00.00 00.00 00.00 00.00 N/A 0 0
500000 + 2 50.91 50.91 45.38 36.63 112.19 32.26 69.56 N/A 1,542,750 700,108
_____ALL_____ 17 101.80 111.94 56.20 41.42 199.18 32.26 245.67 69.56 to 134.85 228,241 128,268
Avg. Adj.
RANGE Assd. ValSale Price95%_Median_C.I.MAXMINPRDCODWGT.MEANMEANMEDIANCOUNT
Avg.OCCUPANCY CODE
Blank 1 96.50 96.50 96.50 00.00 100.00 96.50 96.50 N/A 2,000 1,930
340 1 130.88 130.88 130.88 00.00 100.00 130.88 130.88 N/A 30,000 39,265
343 2 81.57 81.57 82.00 12.59 99.48 71.30 91.83 N/A 156,675 128,475
344 1 245.67 245.67 245.67 00.00 100.00 245.67 245.67 N/A 1,500 3,685
346 1 207.33 207.33 207.33 00.00 100.00 207.33 207.33 N/A 35,000 72,565
353 2 156.59 156.59 164.94 18.37 94.94 127.82 185.35 N/A 7,750 12,783
406 4 89.39 85.11 77.45 31.84 109.89 39.68 122.00 N/A 38,875 30,108
419 1 69.56 69.56 69.56 00.00 100.00 69.56 69.56 N/A 1,085,500 755,035
467 1 101.80 101.80 101.80 00.00 100.00 101.80 101.80 N/A 110,000 111,975
494 1 134.85 134.85 134.85 00.00 100.00 134.85 134.85 N/A 87,750 118,330
528 1 67.38 67.38 67.38 00.00 100.00 67.38 67.38 N/A 44,000 29,645
899 1 32.26 32.26 32.26 00.00 100.00 32.26 32.26 N/A 2,000,000 645,180
_____ALL_____ 17 101.80 111.94 56.20 41.42 199.18 32.26 245.67 69.56 to 134.85 228,241 128,268
County 42 - Page 25

Co
mm
ercial C
orrela
tion
County 42 - Page 26

2011 Correlation Section
for Harlan County
The sales in the commercial sample are not representative of commercial parcels within
Harlan County. The COD shows significant dispersion in the assessment to sale ratios. The
seventeen sales in the file include four extremely low dollar sales, as well as two sales with
selling prices exceeding one million dollars. A review of the occupancy code substrata
indicates that only warehouses (406) occur with any frequency in the sales file. Since
commercial parcels within the county consist of a much broader mix of occupancies, the
calculated median should not be used as an indication of the level of value.
The county employs a thorough sales verification process. The appraisal staff reviews sales
information, and will interview the buyer and/or seller regarding sale terms whenever possible.
A review of the qualified and non-qualified sales rosters revealed no bias in qualification
determinations.
Since there was no reliable market information with which to base valuation adjustments, the
county did not make adjustments to the appraisal tables this year. The majority of commercial
parcels within the county have not been physically inspected within this review cycle; the
three year plan indicates that this work will be completed for 2012. Based on the process
employed by the county in past assessment years, it is believed that assessments are as uniform
and proportionate as possible within the class.
There is no reliable information available to determine the level of value of the commercial
class in Harlan County.
A. Commerical Real Property
County 42 - Page 27
2011 Correlation Section
for Harlan County
B. Analysis of Sales Verification
Neb. Rev. Stat. 77-1327(2) provides that all sales are deemed to be arms length transactions
unless determined to be otherwise under professionally accepted mass appraisal techniques .
The county assessor is responsible for the qualification of the sales included in the state sales
file.
The Standard on Ratio Studies, International Association of Assessing Officials (2007),
indicates that excessive trimming (the arbitrary exclusion or adjustment of arms length
transactions) may indicate an attempt to inappropriately exclude arms length transactions to
create the appearance of a higher level of value and quality of assessment. The sales file, in a
case of excess trimming, will fail to properly represent the level of value and quality of
assessment of the population of real property.
The Division frequently reviews the procedures used by the county assessor to qualify sales to
ensure bias does not exist in judgments made. Arms length transactions should only be
excluded when they compromise the reliability of the resulting statistics. In cases where a
county assessor has disqualified sales without substantiation, the Division may include such
sales in the ratio study.
County 42 - Page 28

2011 Correlation Section
for Harlan County
C. Measures of Central Tendency
There are three measures of central tendency calculated by the Division: median ratio,
weighted mean ratio, and mean ratio. Since each measure of central tendency has strengths
and weaknesses, the use of any statistic for equalization should be reconciled with the other
two, as in an appraisal, based on the appropriateness in the use of the statistic for a defined
purpose, the quantity of the information from which it was drawn, and the reliability of the
data that was used in its calculation. An examination of the three measures can serve to
illustrate important trends in the data if the measures do not closely correlate to each other.
The IAAO considers the median ratio the most appropriate statistical measure for use in
determining level of value for direct equalization; the process of adjusting the values of
classes or subclasses of property in response to the determination of level of value at a point
above or below a particular range. Since the median ratio is considered neutral in relationship
to either assessed value or selling price, its use in adjusting the class or subclass of properties
will not change the relationships between assessed value and level of value already present
within the class or subclass of properties, thus rendering an adjustment neutral in its impact on
the relative tax burden to an individual property. Additionally, the median ratio is less
influenced by the presence of extreme ratios, commonly called outliers. One outlier in a small
sample size of sales can have controlling influence over the other measures of central
tendency. The median ratio limits the distortion potential of an outlier.
The weighted mean ratio is viewed by the IAAO as the most appropriate statistical measure
for indirect equalization. The weighted mean, because it is a value weighted ratio, best reflects
a comparison of the assessed and market value of property in the political subdivision. If the
distribution of aid to political subdivisions must relate to the market value available for
assessment in the political subdivision, the measurement of central tendency used to analyze
level of value should reflect the dollars of value available to be assessed. The weighted mean
ratio does that more than either of the other measures of central tendency.
If the weighted mean ratio, because of its dollar-weighting feature, is significantly different
from the median ratio, it may be an indication of other problems with assessment
proportionality. When this occurs, an evaluation of the county's assessment practices and
procedures is appropriate to discover remedies to the situation.
The mean ratio is used as a basis for other statistical calculations, such as the price related
differential and coefficient of variation. However, the mean ratio has limited application in
the analysis of level of value because it assumes a normal distribution of the data set around
the mean ratio with each ratio having the same impact on the calculation regardless of the
assessed value or the selling price.
County 42 - Page 29

2011 Correlation Section
for Harlan County
D. Analysis of Quality of Assessment
In analyzing the statistical data of assessment quality, there are two measures upon which
assessment officials will primarily rely: the Coefficient of Dispersion (COD), and the Price
Related Differential (PRD). Whether such statistics can be relied upon as meaningful for the
population depends on whether the sample is representative.
The COD is commonly referred to as the index of assessment inequality. It is used to measure
how closely the individual ratios are clustered around the median ratio and suggests the degree
of uniformity or inaccuracy resulting in the assessments. The COD is computed by dividing
the average deviation by the median ratio. For example, a COD of 20 means half of the ratios
are 20 percent above or below the median. The closer the ratios are grouped around the
median, the more equitable the assessment of property tends to be. Conversely, if the
dispersion is quite large, there is a large spread in the ratios typically indicating a large spread
around the median in the assessment of property, which results in an inequity in assessment
and taxes. There is no range of acceptability stated in the Nebraska statutes for the COD
measure. The International Association of Assessing Officers recommended ratio study
performance standards are as follows:
Single-family residences: a COD of 15 percent or less.
For newer and fairly homogeneous areas: a COD of 10 or less.
Income-producing property: a COD of 20 or less, or in larger urban jurisdictions, 15 or less.
Vacant land and other unimproved property, such as agricultural land: a COD of 20 or less.
Rural residential and seasonal properties: a COD of 20 or less.
Mass Appraisal of Real Property, International Association of Assessing Officers, (1999), p.
246.
In unusually homogeneous types of property low CODs can be anticipated; however, in all
other cases CODs less than 5 percent may be indicative of non-representative samples or the
selective reappraisal of sold parcels.
The PRD, also known as the index of regression, is a measurement of the relationship between
the ratios of high-value and low-value properties to determine if the value of property has any
influence on the assessment ratio. It is calculated by dividing the arithmetic mean ratio by the
weighted mean ratio. The PRD provides an indicator of the degree to which high-value
properties are over-assessed or under-assessed in relation to low-value properties. A PRD of
100 indicates there is no bias in the assessment of high-value properties in comparison to
low-value properties. A PRD greater than 100 indicates the assessments are regressive, which
means low-value properties tend to have a higher assessment ratio than high-value properties.
The result is the owner of a low-value property pays a greater amount of tax in relation to
value than the owner of a high-value property. Conversely, a PRD less than 100 indicates that
high-value properties are over assessed in relation to low-value properties.
There is no range of acceptability stated in the Nebraska statutes for the PRD measure. The
Standard of Ratio Studies, adopted by the International Association of Assessing Officers,
County 42 - Page 30
2011 Correlation Section
for Harlan County
July, 2007, recommends that the PRD should lie between 98 and 103. This range is centered
slightly above 100 to allow for a slightly upward measurement bias inherent in the PRD.
The PRD is calculated based on the selling price/assessed value in the sales file. This measure
can be misleading if the dollar value of the records in the sales file is not proportionate to the
dollar value of records in the population.
Mass Appraisal of Real Property, International Association of Assessing Officers, (1999), p.
247.
County 42 - Page 31
2011 Assessment Actions for Harlan County
taken to address the following property classes/subclasses:
Agricultural
A physical inspection of the improved parcels in 12 townships was completed. A physical
inspection includes an exterior review of the property. New photographs are taken and
measurements are checked where necessary. The quality and condition of the parcel is reviewed.
Door hangers are left when additional information is required.
A sales study was completed, and supported the continued use of the existing appraisal tables.
A new classification of agricultural land was identified. Parcels that were enrolled in the AWEP
program have been classified as such for 2011; AWEP pays landowners to not use their
irrigation allocations.
A review of the market areas and a study of agricultural land sales was completed. The study
indicated that the market value of dry and grass land in market areas 2 and 3 was very similar.
After considering the characteristics of the market areas, the county staff determined that the
main difference between areas 2 and 3 was the irrigation potential. Therefore, it was determined
that dry and grassland in areas 2 and 3 would be valued using the same schedule of values. Area
1 has superior soils and flatter topography, therefore, the dry land in area 1 will carry a different
value. There is very little grassland in area 1 so it is valued the same as areas 2 and 3 also. After
completing the sales study, the following adjustments to value were made.
Market Area 1: Irrigated and dry lands were increased about 10%; grass land received a
2% increase.
Market Area 2: Irrigated land increased about 20%, dry land increased approximately
10%, and grass land increased 2%.
Market Area 3: Irrigated and dry land increased about 20% and grassland increased
about 5%. The dry and grass land increases were slightly higher in this area to equalize
the value with area 2.
County 42 - Page 32

2011 Agricultural Assessment Survey for Harlan County
1. Valuation data collection done by:
The appraisal staff and the assessment staff as needed.
2. List each market area, and describe the location and the specific characteristics
that make each unique.
Market Area Description of unique characteristics
01 Area 1 is located in the Northeast part of the county. This area
contains the best farmland with high concentrations of 1A
classifications. Irrigation is plentiful in this portion of the county
and well depths are generally shallow.
02 Area 2 is in the middle of the county, and is the largest market area.
This area contains some irrigation; however, the land type varies
between good level farm ground and areas where the ground is
rougher. Well depths also vary in this area.
03 Area 3 is South of the Harlan County Reservoir and the Republican
River. The terrain in this market area is rough, with little irrigation
and deep wells. The primary activity in this market area is pasture
land; however, there are some places with less slope and good
productive farm land.
3. Describe the process that is used to determine and monitor market areas.
The market areas were developed using geographic information and unique market
characteristics. A sales study is completed annually to monitor the market areas.
4. Describe the process used to identify and value rural residential land and
recreational land in the county.
Land is classified annually based on the findings of the land use study. Valuations
are based on local market information.
5. Do farm home sites carry the same value as rural residential home sites or are
market differences recognized? If differences, what are the recognized market
differences?
Yes, farm homes sites and rural residential home sites carry the same value
countywide.
6. What land characteristics are used to assign differences in assessed values?
For irrigated and dry land, values are assigned by lcg and/or by soil. Grass land is
valued by use, with one value for all acres countywide.
7. What process is used to annually update land use? (Physical inspection, FSA
maps, etc.)
AgriData Software, information from NRD’s, FSA maps, taxpayers and some
physical inspection.
8. Describe the process used to identify and monitor the influence of non-
agricultural characteristics.
Sales are plotted annually to monitor non-agricultural influences. The sales
verification process also helps monitor the influence of non-ag characteristics. The
county has had a few sales that were recreational influenced, however they have not
yet been able to identify a common characteristic (water access, tree cover, etc.)
County 42 - Page 33

among the sales.
9. Have special valuations applications been filed in the county? If yes, is there a
value difference for the special valuation parcels.
No
10. Is the valuation process (cost date and depreciation schedule or market
comparison) used for the pickup work on the rural improvements the same as
was used for the general population of the class?
Yes
11. Describe the method used to determine whether a sold parcel is substantially
changed.
Generally, a parcel is considered substantially changed when an improvement is
either added to or removed from a parcel. However, major additions/remodels may
also warrant a sale being coded substantially changed. Within the agricultural class,
land use changes will also constitute a parcel being coded substantially changed.
12. Please provide any documents related to the policies or procedures used for the
agricultural class of property.
The office does not have any documents specific to the agricultural class, but does
have a procedure manual in use.
County 42 - Page 34

Number of Sales :
Total Sales Price :
Total Adj. Sales Price :
Total Assessed Value :
Avg. Adj. Sales Price :
Avg. Assessed Value :
MEDIAN :
WGT. MEAN :
MEAN :
COD :
PRD :
COV :
STD :
Avg. Abs. Dev :
MAX Sales Ratio :
MIN Sales Ratio :
95% Median C.I. :
95% Wgt. Mean C.I. :
95% Mean C.I. :
49
13,094,065
13,435,884
9,650,175
274,202
196,942
17.99
103.72
24.82
18.49
13.04
131.30
39.73
68.55 to 75.48
66.41 to 77.24
69.31 to 79.67
Printed:3/24/2011 3:39:03PM
Qualified
PAD 2011 R&O Statistics (Using 2011 Values)Harlan42
Date Range: 7/1/2007 To 6/30/2010 Posted on: 2/17/2011
72
72
74
AGRICULTURAL - BASE STAT
Page 1 of 2
Avg. Adj.
RANGE Assd. ValSale Price95%_Median_C.I.MAXMINPRDCODWGT.MEANMEANMEDIANCOUNT
Avg.DATE OF SALE *
_____Qrtrs_____
01-JUL-07 To 30-SEP-07 3 72.49 73.49 74.35 03.55 98.84 70.13 77.84 N/A 292,167 217,213
01-OCT-07 To 31-DEC-07 2 87.97 87.97 92.04 16.13 95.58 73.78 102.16 N/A 404,000 371,858
01-JAN-08 To 31-MAR-08 10 76.71 88.20 80.28 22.76 109.87 64.64 131.30 67.67 to 125.32 288,492 231,605
01-APR-08 To 30-JUN-08 6 63.57 71.99 69.50 26.65 103.58 53.08 107.82 53.08 to 107.82 375,000 260,613
01-JUL-08 To 30-SEP-08 4 74.75 77.36 77.57 05.77 99.73 71.45 88.50 N/A 106,625 82,713
01-OCT-08 To 31-DEC-08 8 69.13 70.55 69.86 14.13 100.99 54.57 92.71 54.57 to 92.71 241,683 168,844
01-JAN-09 To 31-MAR-09 3 69.70 71.41 75.56 13.52 94.51 58.13 86.40 N/A 224,333 169,515
01-APR-09 To 30-JUN-09 4 73.42 73.19 71.23 07.25 102.75 67.19 78.72 N/A 323,875 230,689
01-JUL-09 To 30-SEP-09 1 55.16 55.16 55.16 00.00 100.00 55.16 55.16 N/A 542,000 298,950
01-OCT-09 To 31-DEC-09 4 44.53 55.63 44.68 31.44 124.51 39.73 93.73 N/A 243,250 108,678
01-JAN-10 To 31-MAR-10 2 77.40 77.40 74.89 05.89 103.35 72.84 81.96 N/A 187,000 140,040
01-APR-10 To 30-JUN-10 2 63.10 63.10 62.27 03.71 101.33 60.76 65.44 N/A 199,500 124,228
_____Study Yrs_____
01-JUL-07 To 30-JUN-08 21 73.86 81.45 77.35 20.96 105.30 53.08 131.30 69.75 to 92.55 324,734 251,194
01-JUL-08 To 30-JUN-09 19 71.49 72.67 71.92 11.26 101.04 54.57 92.71 66.76 to 78.72 227,814 163,837
01-JUL-09 To 30-JUN-10 9 60.76 62.07 55.17 23.78 112.51 39.73 93.73 43.53 to 81.96 254,222 140,244
_____Calendar Yrs_____
01-JAN-08 To 31-DEC-08 28 73.47 78.14 74.20 19.00 105.31 53.08 131.30 67.67 to 83.98 267,674 198,619
01-JAN-09 To 31-DEC-09 12 67.87 65.39 62.15 20.39 105.21 39.73 93.73 45.52 to 78.72 290,292 180,413
_____ALL_____ 49 72.49 74.49 71.82 17.99 103.72 39.73 131.30 68.55 to 75.48 274,202 196,942
Avg. Adj.
RANGE Assd. ValSale Price95%_Median_C.I.MAXMINPRDCODWGT.MEANMEANMEDIANCOUNT
Avg.AREA (MARKET)
1 5 73.86 73.35 73.20 05.05 100.20 64.64 77.94 N/A 470,100 344,135
2 34 71.79 72.93 70.90 18.60 102.86 39.73 131.30 65.44 to 78.28 243,573 172,700
3 10 72.81 80.33 73.39 22.55 109.46 54.68 125.32 57.38 to 101.18 280,392 205,770
_____ALL_____ 49 72.49 74.49 71.82 17.99 103.72 39.73 131.30 68.55 to 75.48 274,202 196,942
County 42 - Page 35

Number of Sales :
Total Sales Price :
Total Adj. Sales Price :
Total Assessed Value :
Avg. Adj. Sales Price :
Avg. Assessed Value :
MEDIAN :
WGT. MEAN :
MEAN :
COD :
PRD :
COV :
STD :
Avg. Abs. Dev :
MAX Sales Ratio :
MIN Sales Ratio :
95% Median C.I. :
95% Wgt. Mean C.I. :
95% Mean C.I. :
49
13,094,065
13,435,884
9,650,175
274,202
196,942
17.99
103.72
24.82
18.49
13.04
131.30
39.73
68.55 to 75.48
66.41 to 77.24
69.31 to 79.67
Printed:3/24/2011 3:39:03PM
Qualified
PAD 2011 R&O Statistics (Using 2011 Values)Harlan42
Date Range: 7/1/2007 To 6/30/2010 Posted on: 2/17/2011
72
72
74
AGRICULTURAL - BASE STAT
Page 2 of 2
Avg. Adj.
RANGE Assd. ValSale Price95%_Median_C.I.MAXMINPRDCODWGT.MEANMEANMEDIANCOUNT
Avg.95%MLU By Market Area
_____Irrigated_____
County 7 72.84 69.37 66.62 16.91 104.13 45.52 93.73 45.52 to 93.73 318,429 212,134
1 3 77.84 73.47 73.00 05.69 100.64 64.64 77.94 N/A 411,333 300,293
2 4 62.96 66.29 58.70 26.99 112.93 45.52 93.73 N/A 248,750 146,015
_____Dry_____
County 1 78.28 78.28 78.28 00.00 100.00 78.28 78.28 N/A 64,000 50,100
2 1 78.28 78.28 78.28 00.00 100.00 78.28 78.28 N/A 64,000 50,100
_____Grass_____
County 7 74.84 74.20 69.70 09.03 106.46 57.38 88.50 57.38 to 88.50 147,671 102,921
2 5 74.84 77.31 78.31 07.80 98.72 69.75 88.50 N/A 89,300 69,930
3 2 66.43 66.43 63.15 13.62 105.19 57.38 75.48 N/A 293,600 185,400
_____ALL_____ 49 72.49 74.49 71.82 17.99 103.72 39.73 131.30 68.55 to 75.48 274,202 196,942
Avg. Adj.
RANGE Assd. ValSale Price95%_Median_C.I.MAXMINPRDCODWGT.MEANMEANMEDIANCOUNT
Avg.80%MLU By Market Area
_____Irrigated_____
County 14 70.70 68.06 66.37 21.47 102.55 39.73 107.82 45.52 to 78.72 369,179 245,041
1 3 77.84 73.47 73.00 05.69 100.64 64.64 77.94 N/A 411,333 300,293
2 11 68.55 66.59 64.30 25.18 103.56 39.73 107.82 43.53 to 93.73 357,682 229,973
_____Dry_____
County 4 71.11 72.04 70.14 04.42 102.71 67.67 78.28 N/A 139,200 97,633
2 2 75.19 75.19 74.96 04.12 100.31 72.09 78.28 N/A 69,000 51,725
3 2 68.90 68.90 68.55 01.79 100.51 67.67 70.13 N/A 209,400 143,540
_____Grass_____
County 9 73.08 71.89 68.74 10.28 104.58 54.57 88.50 57.38 to 81.96 153,856 105,754
2 7 73.08 73.46 72.85 09.67 100.84 54.57 88.50 54.57 to 88.50 113,929 82,999
3 2 66.43 66.43 63.15 13.62 105.19 57.38 75.48 N/A 293,600 185,400
_____ALL_____ 49 72.49 74.49 71.82 17.99 103.72 39.73 131.30 68.55 to 75.48 274,202 196,942
County 42 - Page 36

Number of Sales :
Total Sales Price :
Total Adj. Sales Price :
Total Assessed Value :
Avg. Adj. Sales Price :
Avg. Assessed Value :
MEDIAN :
WGT. MEAN :
MEAN :
COD :
PRD :
COV :
STD :
Avg. Abs. Dev :
MAX Sales Ratio :
MIN Sales Ratio :
95% Median C.I. :
95% Wgt. Mean C.I. :
95% Mean C.I. :
70
20,339,580
20,757,899
14,420,420
296,541
206,006
22.49
105.30
31.36
22.94
15.92
162.35
26.16
67.19 to 73.86
63.66 to 75.28
67.78 to 78.52
Printed:3/24/2011 3:39:06PM
Qualified
PAD 2011 R&O Statistics (Using 2011 Values)Harlan42
Date Range: 7/1/2007 To 6/30/2010 Posted on: 2/17/2011
71
69
73
AGRICULTURAL - RANDOM INCLUDE
Page 1 of 2
Avg. Adj.
RANGE Assd. ValSale Price95%_Median_C.I.MAXMINPRDCODWGT.MEANMEANMEDIANCOUNT
Avg.DATE OF SALE *
_____Qrtrs_____
01-JUL-07 To 30-SEP-07 4 75.17 76.21 76.93 06.52 99.06 70.13 84.37 N/A 295,375 227,245
01-OCT-07 To 31-DEC-07 5 73.78 78.06 80.80 13.00 96.61 65.66 102.16 N/A 393,876 318,269
01-JAN-08 To 31-MAR-08 15 77.94 92.71 90.05 27.65 102.95 64.64 162.35 72.09 to 123.19 263,767 237,524
01-APR-08 To 30-JUN-08 8 64.51 70.12 68.39 21.72 102.53 53.08 107.82 53.08 to 107.82 508,556 347,807
01-JUL-08 To 30-SEP-08 3 88.50 83.55 82.09 07.24 101.78 71.45 90.69 N/A 109,437 89,842
01-OCT-08 To 31-DEC-08 10 63.39 63.12 63.59 22.84 99.26 34.94 92.71 44.90 to 83.98 238,352 151,573
01-JAN-09 To 31-MAR-09 3 69.70 71.41 75.56 13.52 94.51 58.13 86.40 N/A 224,333 169,515
01-APR-09 To 30-JUN-09 5 68.55 70.64 70.36 08.56 100.40 60.44 78.72 N/A 281,700 198,210
01-JUL-09 To 30-SEP-09 1 55.16 55.16 55.16 00.00 100.00 55.16 55.16 N/A 542,000 298,950
01-OCT-09 To 31-DEC-09 7 51.19 61.92 48.69 34.79 127.17 39.73 100.27 39.73 to 100.27 185,200 90,168
01-JAN-10 To 31-MAR-10 5 69.23 60.52 45.12 22.03 134.13 26.16 81.96 N/A 336,860 151,986
01-APR-10 To 30-JUN-10 4 63.10 58.40 47.38 17.37 123.26 34.12 73.28 N/A 316,510 149,968
_____Study Yrs_____
01-JUL-07 To 30-JUN-08 32 74.58 82.71 79.15 22.19 104.50 53.08 162.35 69.72 to 84.37 349,245 276,426
01-JUL-08 To 30-JUN-09 21 69.70 69.01 68.53 17.14 100.70 34.94 92.71 60.02 to 78.72 228,254 156,422
01-JUL-09 To 30-JUN-10 17 59.48 60.28 47.82 26.66 126.06 26.16 100.27 43.53 to 73.28 281,690 134,702
_____Calendar Yrs_____
01-JAN-08 To 31-DEC-08 36 72.59 78.71 75.73 25.24 103.94 34.94 162.35 66.76 to 83.98 298,244 225,849
01-JAN-09 To 31-DEC-09 16 63.82 66.00 61.98 22.49 106.49 39.73 100.27 51.19 to 78.72 244,994 151,858
_____ALL_____ 70 70.79 73.15 69.47 22.49 105.30 26.16 162.35 67.19 to 73.86 296,541 206,006
Avg. Adj.
RANGE Assd. ValSale Price95%_Median_C.I.MAXMINPRDCODWGT.MEANMEANMEDIANCOUNT
Avg.AREA (MARKET)
1 11 73.86 74.48 70.93 17.90 105.00 34.12 123.19 59.48 to 84.37 381,349 270,477
2 41 71.49 75.34 73.04 20.46 103.15 39.73 162.35 66.76 to 78.28 286,308 209,116
3 18 64.06 67.38 59.52 30.44 113.21 26.16 125.32 51.19 to 89.23 268,024 159,522
_____ALL_____ 70 70.79 73.15 69.47 22.49 105.30 26.16 162.35 67.19 to 73.86 296,541 206,006
County 42 - Page 37

Number of Sales :
Total Sales Price :
Total Adj. Sales Price :
Total Assessed Value :
Avg. Adj. Sales Price :
Avg. Assessed Value :
MEDIAN :
WGT. MEAN :
MEAN :
COD :
PRD :
COV :
STD :
Avg. Abs. Dev :
MAX Sales Ratio :
MIN Sales Ratio :
95% Median C.I. :
95% Wgt. Mean C.I. :
95% Mean C.I. :
70
20,339,580
20,757,899
14,420,420
296,541
206,006
22.49
105.30
31.36
22.94
15.92
162.35
26.16
67.19 to 73.86
63.66 to 75.28
67.78 to 78.52
Printed:3/24/2011 3:39:06PM
Qualified
PAD 2011 R&O Statistics (Using 2011 Values)Harlan42
Date Range: 7/1/2007 To 6/30/2010 Posted on: 2/17/2011
71
69
73
AGRICULTURAL - RANDOM INCLUDE
Page 2 of 2
Avg. Adj.
RANGE Assd. ValSale Price95%_Median_C.I.MAXMINPRDCODWGT.MEANMEANMEDIANCOUNT
Avg.95%MLU By Market Area
_____Irrigated_____
County 8 68.74 68.11 65.34 18.16 104.24 45.52 93.73 45.52 to 93.73 337,425 220,487
1 3 77.84 73.47 73.00 05.69 100.64 64.64 77.94 N/A 411,333 300,293
2 5 59.30 64.89 58.89 22.92 110.19 45.52 93.73 N/A 293,080 172,603
_____Dry_____
County 2 68.88 68.88 63.15 13.65 109.07 59.48 78.28 N/A 164,000 103,563
1 1 59.48 59.48 59.48 00.00 100.00 59.48 59.48 N/A 264,000 157,026
2 1 78.28 78.28 78.28 00.00 100.00 78.28 78.28 N/A 64,000 50,100
_____Grass_____
County 14 70.62 73.29 69.40 14.30 105.61 51.19 100.27 60.44 to 88.50 138,646 96,217
1 1 69.23 69.23 69.23 00.00 100.00 69.23 69.23 N/A 104,299 72,207
2 8 73.40 77.70 73.16 12.00 106.21 65.70 100.27 65.70 to 100.27 127,529 93,305
3 5 60.44 67.04 64.71 19.06 103.60 51.19 90.69 N/A 163,302 105,676
_____ALL_____ 70 70.79 73.15 69.47 22.49 105.30 26.16 162.35 67.19 to 73.86 296,541 206,006
Avg. Adj.
RANGE Assd. ValSale Price95%_Median_C.I.MAXMINPRDCODWGT.MEANMEANMEDIANCOUNT
Avg.80%MLU By Market Area
_____Irrigated_____
County 18 69.14 66.25 62.97 22.59 105.21 26.16 107.82 53.08 to 77.94 452,608 285,021
1 4 77.89 76.20 75.26 06.37 101.25 64.64 84.37 N/A 384,750 289,555
2 13 68.55 66.27 65.16 22.48 101.70 39.73 107.82 45.52 to 78.72 442,535 288,345
3 1 26.16 26.16 26.16 00.00 100.00 26.16 26.16 N/A 855,000 223,685
_____Dry_____
County 6 68.90 66.07 62.97 10.78 104.92 48.77 78.28 48.77 to 78.28 172,800 108,816
1 1 59.48 59.48 59.48 00.00 100.00 59.48 59.48 N/A 264,000 157,026
2 2 75.19 75.19 74.96 04.12 100.31 72.09 78.28 N/A 69,000 51,725
3 3 67.67 62.19 61.82 10.52 100.60 48.77 70.13 N/A 211,600 130,807
_____Grass_____
County 17 69.75 71.72 68.45 13.84 104.78 51.19 100.27 60.44 to 81.96 154,678 105,881
1 1 69.23 69.23 69.23 00.00 100.00 69.23 69.23 N/A 104,299 72,207
2 11 71.49 74.08 70.19 12.06 105.54 54.57 100.27 65.66 to 88.50 155,338 109,035
3 5 60.44 67.04 64.71 19.06 103.60 51.19 90.69 N/A 163,302 105,676
_____ALL_____ 70 70.79 73.15 69.47 22.49 105.30 26.16 162.35 67.19 to 73.86 296,541 206,006
County 42 - Page 38
Number of Sales :
Total Sales Price :
Total Adj. Sales Price :
Total Assessed Value :
Avg. Adj. Sales Price :
Avg. Assessed Value :
MEDIAN :
WGT. MEAN :
MEAN :
COD :
PRD :
COV :
STD :
Avg. Abs. Dev :
MAX Sales Ratio :
MIN Sales Ratio :
95% Median C.I. :
95% Wgt. Mean C.I. :
95% Mean C.I. :
70
19,541,980
19,960,299
13,875,707
285,147
198,224
22.40
105.32
31.38
22.98
16.01
162.35
26.16
67.67 to 74.66
63.48 to 75.56
67.84 to 78.60
Printed:3/24/2011 3:39:09PM
Qualified
PAD 2011 R&O Statistics (Using 2011 Values)Harlan42
Date Range: 7/1/2007 To 6/30/2010 Posted on: 2/17/2011
71
70
73
AGRICULTURAL - RANDOM EXCLUDE
Page 1 of 2
Avg. Adj.
RANGE Assd. ValSale Price95%_Median_C.I.MAXMINPRDCODWGT.MEANMEANMEDIANCOUNT
Avg.DATE OF SALE *
_____Qrtrs_____
01-JUL-07 To 30-SEP-07 4 75.17 76.21 76.93 06.52 99.06 70.13 84.37 N/A 295,375 227,245
01-OCT-07 To 31-DEC-07 5 73.78 78.06 80.80 13.00 96.61 65.66 102.16 N/A 393,876 318,269
01-JAN-08 To 31-MAR-08 14 80.01 93.95 90.42 28.62 103.90 64.64 162.35 67.67 to 125.32 275,750 249,327
01-APR-08 To 30-JUN-08 9 69.72 71.91 68.82 20.50 104.49 53.08 107.82 54.68 to 89.23 463,272 318,839
01-JUL-08 To 30-SEP-08 5 74.84 80.03 79.54 08.85 100.62 71.45 90.69 N/A 100,362 79,829
01-OCT-08 To 31-DEC-08 9 60.02 60.25 59.55 21.46 101.18 34.94 92.71 44.90 to 73.08 173,046 103,041
01-JAN-09 To 31-MAR-09 3 69.70 71.41 75.56 13.52 94.51 58.13 86.40 N/A 224,333 169,515
01-APR-09 To 30-JUN-09 4 73.42 71.50 70.74 09.53 101.07 60.44 78.72 N/A 314,625 222,568
01-JUL-09 To 30-SEP-09 1 55.16 55.16 55.16 00.00 100.00 55.16 55.16 N/A 542,000 298,950
01-OCT-09 To 31-DEC-09 7 51.19 61.92 48.69 34.79 127.17 39.73 100.27 39.73 to 100.27 185,200 90,168
01-JAN-10 To 31-MAR-10 5 69.23 60.52 45.12 22.03 134.13 26.16 81.96 N/A 336,860 151,986
01-APR-10 To 30-JUN-10 4 63.10 58.40 47.38 17.37 123.26 34.12 73.28 N/A 316,510 149,968
_____Study Yrs_____
01-JUL-07 To 30-JUN-08 32 74.67 83.05 79.25 22.62 104.79 53.08 162.35 69.72 to 86.23 349,401 276,889
01-JUL-08 To 30-JUN-09 21 71.45 68.70 68.29 16.50 100.60 34.94 92.71 60.02 to 78.28 190,035 129,778
01-JUL-09 To 30-JUN-10 17 59.48 60.28 47.82 26.66 126.06 26.16 100.27 43.53 to 73.28 281,690 134,702
_____Calendar Yrs_____
01-JAN-08 To 31-DEC-08 37 73.08 78.51 76.19 24.70 103.05 34.94 162.35 67.67 to 82.08 272,681 207,747
01-JAN-09 To 31-DEC-09 15 60.44 65.92 61.78 24.59 106.70 39.73 100.27 51.19 to 78.72 251,327 155,263
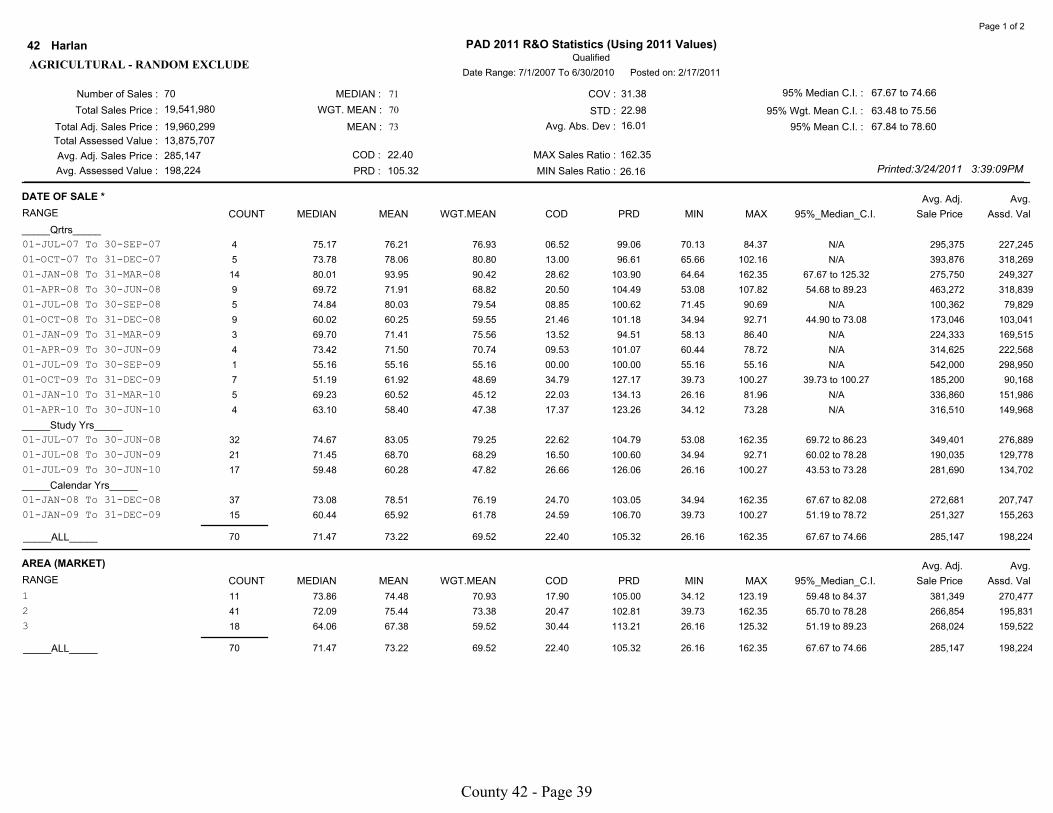
_____ALL_____ 70 71.47 73.22 69.52 22.40 105.32 26.16 162.35 67.67 to 74.66 285,147 198,224
Avg. Adj.
RANGE Assd. ValSale Price95%_Median_C.I.MAXMINPRDCODWGT.MEANMEANMEDIANCOUNT
Avg.AREA (MARKET)
1 11 73.86 74.48 70.93 17.90 105.00 34.12 123.19 59.48 to 84.37 381,349 270,477
2 41 72.09 75.44 73.38 20.47 102.81 39.73 162.35 65.70 to 78.28 266,854 195,831
3 18 64.06 67.38 59.52 30.44 113.21 26.16 125.32 51.19 to 89.23 268,024 159,522
_____ALL_____ 70 71.47 73.22 69.52 22.40 105.32 26.16 162.35 67.67 to 74.66 285,147 198,224
County 42 - Page 39

Number of Sales :
Total Sales Price :
Total Adj. Sales Price :
Total Assessed Value :
Avg. Adj. Sales Price :
Avg. Assessed Value :
MEDIAN :
WGT. MEAN :
MEAN :
COD :
PRD :
COV :
STD :
Avg. Abs. Dev :
MAX Sales Ratio :
MIN Sales Ratio :
95% Median C.I. :
95% Wgt. Mean C.I. :
95% Mean C.I. :
70
19,541,980
19,960,299
13,875,707
285,147
198,224
22.40
105.32
31.38
22.98
16.01
162.35
26.16
67.67 to 74.66
63.48 to 75.56
67.84 to 78.60
Printed:3/24/2011 3:39:09PM
Qualified
PAD 2011 R&O Statistics (Using 2011 Values)Harlan42
Date Range: 7/1/2007 To 6/30/2010 Posted on: 2/17/2011
71
70
73
AGRICULTURAL - RANDOM EXCLUDE
Page 2 of 2
Avg. Adj.
RANGE Assd. ValSale Price95%_Median_C.I.MAXMINPRDCODWGT.MEANMEANMEDIANCOUNT
Avg.95%MLU By Market Area
_____Irrigated_____
County 8 68.74 68.11 65.34 18.16 104.24 45.52 93.73 45.52 to 93.73 337,425 220,487
1 3 77.84 73.47 73.00 05.69 100.64 64.64 77.94 N/A 411,333 300,293
2 5 59.30 64.89 58.89 22.92 110.19 45.52 93.73 N/A 293,080 172,603
_____Dry_____
County 3 78.28 74.66 68.58 11.39 108.87 59.48 86.23 N/A 143,000 98,074
1 1 59.48 59.48 59.48 00.00 100.00 59.48 59.48 N/A 264,000 157,026
2 2 82.26 82.26 83.15 04.84 98.93 78.28 86.23 N/A 82,500 68,598
_____Grass_____
County 14 70.62 73.25 69.23 14.26 105.81 51.19 100.27 60.44 to 88.50 135,182 93,592
1 1 69.23 69.23 69.23 00.00 100.00 69.23 69.23 N/A 104,299 72,207
2 8 73.17 77.64 73.03 11.96 106.31 65.70 100.27 65.70 to 100.27 121,467 88,713
3 5 60.44 67.04 64.71 19.06 103.60 51.19 90.69 N/A 163,302 105,676
_____ALL_____ 70 71.47 73.22 69.52 22.40 105.32 26.16 162.35 67.67 to 74.66 285,147 198,224
Avg. Adj.
RANGE Assd. ValSale Price95%_Median_C.I.MAXMINPRDCODWGT.MEANMEANMEDIANCOUNT
Avg.80%MLU By Market Area
_____Irrigated_____
County 18 69.14 66.25 62.97 22.59 105.21 26.16 107.82 53.08 to 77.94 452,608 285,021
1 4 77.89 76.20 75.26 06.37 101.25 64.64 84.37 N/A 384,750 289,555
2 13 68.55 66.27 65.16 22.48 101.70 39.73 107.82 45.52 to 78.72 442,535 288,345
3 1 26.16 26.16 26.16 00.00 100.00 26.16 26.16 N/A 855,000 223,685
_____Dry_____
County 7 70.13 68.95 65.04 12.36 106.01 48.77 86.23 48.77 to 86.23 162,543 105,713
1 1 59.48 59.48 59.48 00.00 100.00 59.48 59.48 N/A 264,000 157,026
2 3 78.28 78.87 79.73 06.02 98.92 72.09 86.23 N/A 79,667 63,515
3 3 67.67 62.19 61.82 10.52 100.60 48.77 70.13 N/A 211,600 130,807
_____Grass_____
County 17 69.75 71.70 68.32 13.79 104.95 51.19 100.27 60.44 to 81.96 151,825 103,720
1 1 69.23 69.23 69.23 00.00 100.00 69.23 69.23 N/A 104,299 72,207
2 11 71.49 74.04 70.03 12.00 105.73 54.57 100.27 65.66 to 88.50 150,929 105,696
3 5 60.44 67.04 64.71 19.06 103.60 51.19 90.69 N/A 163,302 105,676
_____ALL_____ 70 71.47 73.22 69.52 22.40 105.32 26.16 162.35 67.67 to 74.66 285,147 198,224
County 42 - Page 40

Agricu
ltura
l or S
pecia
l
Valu
atio
n C
orrela
tion
County 42 - Page 41

2011 Correlation Section
for Harlan County
Harlan County is in the center of the Republican River Basin. The county is split into three
different market areas, however, grass land is valued the same throughout the county. Dry
land is also valued using the same schedule in market areas 2 and 3. Area 1 contains superior
soils and flatter topography and carries a separate value for both irrigated and dry land. The
county is primarily rolling plains. Harlan County is comparable to Furnas and Franklin
Counties. All three of these counties are in the same natural resource district and are affected
by similar irrigation restrictions. The southwest corner of Gosper County is also comparable.
Phelps and Kearney County are not comparable for topography or soil type and also are not
impacted by the water restrictions in the Republican Basin.
Three statistical samples were analyzed in determining the level of value of agricultural land.
The base sample was not proportionately distributed in any market area. The area 1 sample
was not representative of the land use in the population. The samples in areas 1 and 3 were
also too small to be statistically adequate as were all of the subclass samples.
Sales from the comparable areas outside of the county were used to expand the base sample .
In market area 1, the expanded samples were representative of the population. However; after
expanding the perimeter 12 miles into the comparable area, sales were still not proportionately
distributed. Since the sample is small and disproportionate the reliability of any statistics
produced for market area 1 are suspect. When reliable statistical data is not available, an
analysis of surrounding county values and the actions of the assessor are considered. In
market area 1, dry land values were increased at the same percentage as areas 2 and 3; grass
land is valued the same county wide. Irrigated land increased 10% to equalize values with
surrounding counties.
In market area 2, a proportionate distribution was achieved in both samples. In all three
methods, the statistics of the market area and the irrigated and grass land subclasses support
that assessments are acceptable.
For area 3, the comparable perimeter was also expanded to 12 miles, but because very few
sales from the newest year of the study period were available, the sample is not
proportionately distributed. Typically, after exhausting all efforts to expand the sample, sales
would be randomly removed from the subject county to meet the threshold. In these samples ,
doing so would have stripped the market area of a sufficient number of sales. Market area 3
is 95% dry and grass land; because the county values grass land the same throughout the
county and dry land the same in areas 2 and 3, dry and grass land sales from these market
areas can be combined for measurement purposes. These sales were combined, and samples
of 27-41 sales were analyzed. The calculated medians were within the acceptable range for
both the substrata and the overall sample; all medians ranged from 70-72%. All indications
support that the dry and grass land values in Harlan County are acceptable, therefore, there is
no recommended adjustment to market area 3.
A comparison of Harlan and surrounding county values was made. Harlan County 's values are
generally higher than Furnas County and lower than Franklin County. Since the agricultural
A. Agricultural Land
County 42 - Page 42

2011 Correlation Section
for Harlan County
market typically increases moving east in Nebraska, these results are typical and support that
the values are equalized across county lines.
When analyzing assessment quality and intra-county equalization, both the statistical measures
and the assessment actions are considered. The coefficient of dispersion in each of the three
statistical profiles supports that the statistics are reliable for measurement purposes. Where
sufficient sales exist, the subclass samples support that all land uses have been valued
proportionately. As described, similar adjustments were made to the subclasses of land within
the three market areas, further supporting that assessments are uniform and proportionate.
Based on the analysis of all available information, the level of value of agricultural land in
Harlan County is determined to be 71%; all subclasses are within the required range.
County 42 - Page 43

2011 Correlation Section
for Harlan County
B. Analysis of Sales Verification
Neb. Rev. Stat. 77-1327(2) provides that all sales are deemed to be arms length transactions
unless determined to be otherwise under professionally accepted mass appraisal techniques .
The county assessor is responsible for the qualification of the sales included in the state sales
file.
The Standard on Ratio Studies, International Association of Assessing Officials (2007),
indicates that excessive trimming (the arbitrary exclusion or adjustment of arms length
transactions) may indicate an attempt to inappropriately exclude arms length transactions to
create the appearance of a higher level of value and quality of assessment. The sales file, in a
case of excess trimming, will fail to properly represent the level of value and quality of
assessment of the population of real property.
The Division frequently reviews the procedures used by the county assessor to qualify sales to
ensure bias does not exist in judgments made. Arms length transactions should only be
excluded when they compromise the reliability of the resulting statistics. In cases where a
county assessor has disqualified sales without substantiation, the Division may include such
sales in the ratio study.
County 42 - Page 44

2011 Correlation Section
for Harlan County
C. Measures of Central Tendency
There are three measures of central tendency calculated by the Division: median ratio,
weighted mean ratio, and mean ratio. Since each measure of central tendency has strengths
and weaknesses, the use of any statistic for equalization should be reconciled with the other
two, as in an appraisal, based on the appropriateness in the use of the statistic for a defined
purpose, the quantity of the information from which it was drawn, and the reliability of the
data that was used in its calculation. An examination of the three measures can serve to
illustrate important trends in the data if the measures do not closely correlate to each other.
The IAAO considers the median ratio the most appropriate statistical measure for use in
determining level of value for direct equalization; the process of adjusting the values of
classes or subclasses of property in response to the determination of level of value at a point
above or below a particular range. Since the median ratio is considered neutral in relationship
to either assessed value or selling price, its use in adjusting the class or subclass of properties
will not change the relationships between assessed value and level of value already present
within the class or subclass of properties, thus rendering an adjustment neutral in its impact on
the relative tax burden to an individual property. Additionally, the median ratio is less
influenced by the presence of extreme ratios, commonly called outliers. One outlier in a small
sample size of sales can have controlling influence over the other measures of central
tendency. The median ratio limits the distortion potential of an outlier.
The weighted mean ratio is viewed by the IAAO as the most appropriate statistical measure
for indirect equalization. The weighted mean, because it is a value weighted ratio, best reflects
a comparison of the assessed and market value of property in the political subdivision. If the
distribution of aid to political subdivisions must relate to the market value available for
assessment in the political subdivision, the measurement of central tendency used to analyze
level of value should reflect the dollars of value available to be assessed. The weighted mean
ratio does that more than either of the other measures of central tendency.
If the weighted mean ratio, because of its dollar-weighting feature, is significantly different
from the median ratio, it may be an indication of other problems with assessment
proportionality. When this occurs, an evaluation of the county's assessment practices and
procedures is appropriate to discover remedies to the situation.
The mean ratio is used as a basis for other statistical calculations, such as the price related
differential and coefficient of variation. However, the mean ratio has limited application in
the analysis of level of value because it assumes a normal distribution of the data set around
the mean ratio with each ratio having the same impact on the calculation regardless of the
assessed value or the selling price.
County 42 - Page 45

2011 Correlation Section
for Harlan County
D. Analysis of Quality of Assessment
In analyzing the statistical data of assessment quality, there are two measures upon which
assessment officials will primarily rely: the Coefficient of Dispersion (COD), and the Price
Related Differential (PRD). Whether such statistics can be relied upon as meaningful for the
population depends on whether the sample is representative.
The COD is commonly referred to as the index of assessment inequality. It is used to measure
how closely the individual ratios are clustered around the median ratio and suggests the degree
of uniformity or inaccuracy resulting in the assessments. The COD is computed by dividing
the average deviation by the median ratio. For example, a COD of 20 means half of the ratios
are 20 percent above or below the median. The closer the ratios are grouped around the
median, the more equitable the assessment of property tends to be. Conversely, if the
dispersion is quite large, there is a large spread in the ratios typically indicating a large spread
around the median in the assessment of property, which results in an inequity in assessment
and taxes. There is no range of acceptability stated in the Nebraska statutes for the COD
measure. The International Association of Assessing Officers recommended ratio study
performance standards are as follows:
Single-family residences: a COD of 15 percent or less.
For newer and fairly homogeneous areas: a COD of 10 or less.
Income-producing property: a COD of 20 or less, or in larger urban jurisdictions, 15 or less.
Vacant land and other unimproved property, such as agricultural land: a COD of 20 or less.
Rural residential and seasonal properties: a COD of 20 or less.
Mass Appraisal of Real Property, International Association of Assessing Officers, (1999), p.
246.
In unusually homogeneous types of property low CODs can be anticipated; however, in all
other cases CODs less than 5 percent may be indicative of non-representative samples or the
selective reappraisal of sold parcels.
The PRD, also known as the index of regression, is a measurement of the relationship between
the ratios of high-value and low-value properties to determine if the value of property has any
influence on the assessment ratio. It is calculated by dividing the arithmetic mean ratio by the
weighted mean ratio. The PRD provides an indicator of the degree to which high-value
properties are over-assessed or under-assessed in relation to low-value properties. A PRD of
100 indicates there is no bias in the assessment of high-value properties in comparison to
low-value properties. A PRD greater than 100 indicates the assessments are regressive, which
means low-value properties tend to have a higher assessment ratio than high-value properties.
The result is the owner of a low-value property pays a greater amount of tax in relation to
value than the owner of a high-value property. Conversely, a PRD less than 100 indicates that
high-value properties are over assessed in relation to low-value properties.
There is no range of acceptability stated in the Nebraska statutes for the PRD measure. The
Standard of Ratio Studies, adopted by the International Association of Assessing Officers,
County 42 - Page 46

2011 Correlation Section
for Harlan County
July, 2007, recommends that the PRD should lie between 98 and 103. This range is centered
slightly above 100 to allow for a slightly upward measurement bias inherent in the PRD.
The PRD is calculated based on the selling price/assessed value in the sales file. This measure
can be misleading if the dollar value of the records in the sales file is not proportionate to the
dollar value of records in the population.
Mass Appraisal of Real Property, International Association of Assessing Officers, (1999), p.
247.
County 42 - Page 47

Co
un
ty R
eports
County 42 - Page 48

HarlanCounty 42 2011 County Abstract of Assessment for Real Property, Form 45
01. Res UnImp Land
02. Res Improve Land
241 630,025 45 361,040 20 111,520 306 1,102,585
1,261 5,577,240 168 4,509,570 205 4,513,465 1,634 14,600,275
1,273 44,372,945 171 13,029,000 216 15,374,455 1,660 72,776,400
1,966 88,479,260 484,010
204,455 49 32,170 3 1,500 1 170,785 45
218 1,391,750 2 14,020 5 224,180 225 1,629,950
21,136,350 246 3,466,575 11 1,140,540 4 16,529,235 231
295 22,970,755 1,017,650
03. Res Improvements
04. Res Total
05. Com UnImp Land
06. Com Improve Land
07. Com Improvements
08. Com Total
4,881 433,590,455 2,072,575 Total Real Property
Growth Value : Records : Sum Lines 17, 25, & 30 Sum Lines 17, 25, & 41
09. Ind UnImp Land
10. Ind Improve Land
11. Ind Improvements
12. Ind Total
13. Rec UnImp Land
14. Rec Improve Land
15. Rec Improvements
16. Rec Total
17. Taxable Total
0 0 0 0 0 0 0 0
0 0 0 0 0 0 0 0
0 0 0 0 0 0 0 0
0 0 0
0 0 2 7,900 0 0 2 7,900
0 0 264 2,382,110 1 12,180 265 2,394,290
13 127,865 356 5,505,055 1 750 370 5,633,670
372 8,035,860 176,125
2,633 119,485,875 1,677,785
Urban SubUrban Rural Total GrowthRecords Value Records Value Records Value Records Value
Schedule I : Non-Agricultural Records
% of Res Total
% of Com Total
% of Ind Total
% of Rec Total
% of Taxable Total
% of Res & Rec Total
Res & Rec Total
% of Com & Ind Total
Com & Ind Total
77.01 57.17 10.99 20.23 12.00 22.60 40.28 20.41
9.53 19.86 53.94 27.56
276 18,091,770 5 1,156,060 14 3,722,925 295 22,970,755
2,338 96,515,120 1,527 50,708,075 237 20,012,370 574 25,794,675
52.54 65.31 22.26 47.90 26.73 24.55 20.73 10.14
1.59 3.49 1.85 7.62 98.25 96.24 0.16 0.27
78.76 93.56 5.30 6.04 5.03 1.69 16.21 4.75
0.00 0.00 0.00 0.00 0.00 0.00 0.00 0.00
78.76 93.56 5.30 6.04 5.03 1.69 16.21 4.75
22.56 21.99 57.58 68.48
236 19,999,440 216 17,899,610 1,514 50,580,210
14 3,722,925 5 1,156,060 276 18,091,770
0 0 0 0 0 0
1 12,930 358 7,895,065 13 127,865
1,803 68,799,845 579 26,950,735 251 23,735,295
49.10
0.00
8.50
23.35
80.95
49.10
31.85
1,017,650
660,135
County 42 - Page 49

HarlanCounty 42 2011 County Abstract of Assessment for Real Property, Form 45
18. Residential
Records
TotalRural
SubUrban Urban
Schedule II : Tax Increment Financing (TIF)
Value Base Value Excess Value ExcessValue BaseRecords
0 0 0 0 0 0
19. Commercial
20. Industrial
21. Other
22. Total Sch II
4 197,065 2,316,405
0 0 0
0 0 0 0 0 0
0 0 0
0 0 0
Value ExcessValue BaseRecordsValue ExcessValue BaseRecords
21. Other
20. Industrial
19. Commercial
18. Residential 0 0 0 0 0 0
0 0 0 4 197,065 2,316,405
0 0 0 0 0 0
0 0 0 0 0 0
4 197,065 2,316,405
23. Producing
GrowthValueRecords
TotalValueRecords
RuralValueRecords
SubUrbanValueRecords
UrbanSchedule III : Mineral Interest Records
0 0 0 0 5 1,279,600 5 1,279,600 0
0 0 0 0 0 0 0 0 0
0 0 0 0 5 1,279,600 5 1,279,600 0
Mineral Interest
24. Non-Producing
25. Total
Schedule IV : Exempt Records : Non-Agricultural
Schedule V : Agricultural Records
Records Records Records RecordsTotalRural SubUrban Urban
26. Exempt 108 0 83 191
30. Ag Total
29. Ag Improvements
28. Ag-Improved Land
ValueRecordsTotal
ValueRecordsRural
Records Value SubUrban
ValueRecords
27. Ag-Vacant Land
Urban
5 80,230 10 67,280 1,774 219,960,580 1,789 220,108,090
0 0 1 15,500 431 72,087,350 432 72,102,850
0 0 1 13,855 453 20,600,185 454 20,614,040
2,243 312,824,980
County 42 - Page 50

HarlanCounty 42 2011 County Abstract of Assessment for Real Property, Form 45
31. HomeSite UnImp Land
Records
TotalRural
SubUrban UrbanSchedule VI : Agricultural Records :Non-Agricultural Detail
Acres Value ValueAcresRecords
32. HomeSite Improv Land
33. HomeSite Improvements
34. HomeSite Total
ValueAcresRecordsValueAcres
34. HomeSite Total
33. HomeSite Improvements
32. HomeSite Improv Land
31. HomeSite UnImp Land
35. FarmSite UnImp Land
36. FarmSite Improv Land
37. FarmSite Improvements
38. FarmSite Total
37. FarmSite Improvements
36. FarmSite Improv Land
35. FarmSite UnImp Land
39. Road & Ditches
38. FarmSite Total
39. Road & Ditches
Records
40. Other- Non Ag Use
40. Other- Non Ag Use
41. Total Section VI
0 0.00 0 0 0.00 0
0 0.00 0
0 0.00 0 0
1 4.00 4,000 8
0 0.00 0 1
0 0.00 0 1
0 0.00 0 0
0 0.00 0 0 0.00 0
0 0.00
13,855 0.00
15,500 2.00
15.00 7,500
0 0.00
0 0.00 0
20 70,000 20.00 20 20.00 70,000
233 249.00 3,309,000 233 249.00 3,309,000
274 217.00 13,790,255 274 217.00 13,790,255
294 269.00 17,169,255
142.60 70 105,300 79 161.60 116,800
379 1,013.03 1,587,640 380 1,015.03 1,603,140
415 0.00 6,809,930 416 0.00 6,823,785
495 1,176.63 8,543,725
0 6,406.52 0 0 6,406.52 0
0 0.00 0 0 0.00 0
789 7,852.15 25,712,980
Growth
0
394,790
394,790
County 42 - Page 51

HarlanCounty 42 2011 County Abstract of Assessment for Real Property, Form 45
42. Game & Parks
ValueAcresRecords
SubUrban
ValueAcresRecords
Urban
0 0.00 0 0 0.00 0
42. Game & Parks
ValueAcresRecordsTotal
ValueAcresRecordsRural
Schedule VII : Agricultural Records :Ag Land Detail - Game & Parks
0 0.00 0 0 0.00 0
Schedule VIII : Agricultural Records : Special Value
43. Special Value
ValueAcresRecords SubUrban
ValueAcresRecords Urban
43. Special Value
ValueAcresRecordsTotal
ValueAcresRecordsRural
44. Recapture Value N/A
44. Market Value
0 0.00 0 0 0.00 0
0 0.00 0 0 0.00 0
0 0.00 0 0 0.00 0
* LB 968 (2006) for tax year 2009 and forward there will be no Recapture value.
0 0 0 0 0 0
County 42 - Page 52

1Market AreaSchedule IX : Agricultural Records : Ag Land Market Area Detail
2011 County Abstract of Assessment for Real Property, Form 45Harlan42County
45. 1A1
ValueAcres
46. 1A
47. 2A1
48. 2A
49. 3A1
50. 3A
51. 4A1
52. 4A
53. Total
54. 1D1
55. 1D
56. 2D1
57. 2D
58. 3D1
59. 3D
60. 4D1
61. 4D
62. Total
63. 1G1
64. 1G
65. 2G1
66. 2G
67. 3G1
68. 3G
69. 4G1
70. 4G
71. Total
Waste
Other
Exempt
Irrigated
Dry
Grass
Market Area Total 55,676,195 39,037.20
0 44.04
150 3.00
7,450 149.00
2,543,400 5,652.00
1,825,650 4,057.00
185,850 413.00
0 0.00
0 0.00
31,500 70.00
98,550 219.00
401,850 893.00
0 0.00
8,936,105 9,647.00
547,040 912.00
612.00 367,200
0 0.00
0 0.00
23,625 27.00
370,815 419.00
7,627,425 7,677.00
0 0.00
44,189,090 23,586.20
2,153,650 2,267.00
1,163,465 1,224.70
0 0.00
0 0.00
122,980 86.00
1,268,850 770.00
39,480,145 19,238.50
0 0.00
% of Acres* % of Value*
0.00%
81.57%
79.58%
0.00%
0.00%
15.80%
0.36%
3.26%
0.28%
4.34%
1.24%
3.87%
0.00%
0.00%
0.00%
0.00%
0.00%
0.00%
9.61%
5.19%
6.34%
9.45%
71.78%
7.31%
100.00%
100.00%
100.00%
Grass Total
Dry Total
Irrigated Total 23,586.20
9,647.00
5,652.00
44,189,090
8,936,105
2,543,400
60.42%
24.71%
14.48%
0.38%
0.11%
0.01%
100.00%
Average Assessed Value*
89.34%
0.00%
0.28%
2.87%
0.00%
0.00%
2.63%
4.87%
100.00%
0.00%
85.36%
15.80%
0.00%
4.15%
0.26%
3.87%
1.24%
0.00%
0.00%
0.00%
0.00%
4.11%
6.12%
7.31%
71.78%
100.00%
100.00%
0.00
2,052.14
993.54
0.00
0.00
450.00
1,430.00
1,647.86
885.00
875.00
450.00
450.00
0.00
0.00
0.00
0.00
0.00
0.00
950.00
950.00
600.00
599.82
450.00
450.00
1,873.51
926.31
450.00
0.00% 0.00
0.00% 50.00
100.00% 1,426.23
926.31 16.05%
450.00 4.57%
1,873.51 79.37%
50.00 0.01%72.
73.
74.
75.
County 42 - Page 53

2Market AreaSchedule IX : Agricultural Records : Ag Land Market Area Detail
2011 County Abstract of Assessment for Real Property, Form 45Harlan42County
45. 1A1
ValueAcres
46. 1A
47. 2A1
48. 2A
49. 3A1
50. 3A
51. 4A1
52. 4A
53. Total
54. 1D1
55. 1D
56. 2D1
57. 2D
58. 3D1
59. 3D
60. 4D1
61. 4D
62. Total
63. 1G1
64. 1G
65. 2G1
66. 2G
67. 3G1
68. 3G
69. 4G1
70. 4G
71. Total
Waste
Other
Exempt
Irrigated
Dry
Grass
Market Area Total 191,649,395 211,191.17
0 14,332.76
0 0.00
204,190 4,075.00
33,160,270 73,521.83
26,707,745 59,218.83
2,027,225 4,496.00
46,350 103.00
27,900 62.00
217,075 482.00
413,150 915.00
3,720,825 8,245.00
0 0.00
39,845,155 57,520.11
4,184,985 8,045.36
4,397.00 2,291,240
73,260 141.00
81,620 154.00
150,060 246.00
830,160 1,320.00
32,233,830 43,216.75
0 0.00
118,439,780 76,074.23
13,318,050 14,019.00
3,812,920 4,018.00
1,070,600 1,082.00
664,400 614.00
1,006,200 774.00
8,596,500 5,742.00
89,971,110 49,825.23
0 0.00
% of Acres* % of Value*
0.00%
65.50%
75.13%
0.00%
0.00%
11.21%
1.02%
7.55%
0.43%
2.29%
0.66%
1.24%
0.81%
1.42%
0.25%
0.27%
0.08%
0.14%
18.43%
5.28%
7.64%
13.99%
80.55%
6.12%
100.00%
100.00%
100.00%
Grass Total
Dry Total
Irrigated Total 76,074.23
57,520.11
73,521.83
118,439,780
39,845,155
33,160,270
36.02%
27.24%
34.81%
1.93%
6.79%
0.00%
100.00%
Average Assessed Value*
75.96%
0.00%
0.85%
7.26%
0.56%
0.90%
3.22%
11.24%
100.00%
0.00%
80.90%
11.22%
0.00%
2.08%
0.38%
1.25%
0.65%
0.20%
0.18%
0.08%
0.14%
5.75%
10.50%
6.11%
80.54%
100.00%
100.00%
0.00
1,805.73
745.86
0.00
0.00
451.28
1,300.00
1,497.13
628.91
610.00
450.36
451.53
1,082.08
989.46
530.00
519.57
450.00
450.00
948.96
950.00
521.09
520.17
451.00
450.90
1,556.90
692.72
451.03
0.00% 0.00
0.00% 0.00
100.00% 907.47
692.72 20.79%
451.03 17.30%
1,556.90 61.80%
50.11 0.11%72.
73.
74.
75.
County 42 - Page 54

3Market AreaSchedule IX : Agricultural Records : Ag Land Market Area Detail
2011 County Abstract of Assessment for Real Property, Form 45Harlan42County
45. 1A1
ValueAcres
46. 1A
47. 2A1
48. 2A
49. 3A1
50. 3A
51. 4A1
52. 4A
53. Total
54. 1D1
55. 1D
56. 2D1
57. 2D
58. 3D1
59. 3D
60. 4D1
61. 4D
62. Total
63. 1G1
64. 1G
65. 2G1
66. 2G
67. 3G1
68. 3G
69. 4G1
70. 4G
71. Total
Waste
Other
Exempt
Irrigated
Dry
Grass
Market Area Total 39,786,410 70,248.80
0 0.00
0 0.00
29,150 583.00
16,790,195 37,257.60
14,196,770 31,502.60
819,000 1,820.00
0 0.00
0 0.00
39,600 88.00
18,450 41.00
1,716,375 3,806.00
0 0.00
19,763,495 28,591.00
2,838,200 5,455.00
1,638.00 851,760
0 0.00
0 0.00
23,180 38.00
135,450 215.00
15,914,905 21,245.00
0 0.00
3,203,570 3,817.20
509,850 927.00
91,300 166.00
0 0.00
1,800 3.00
4,550 7.00
177,060 227.00
2,419,010 2,487.20
0 0.00
% of Acres* % of Value*
0.00%
65.16%
74.31%
0.00%
0.00%
10.22%
0.18%
5.95%
0.13%
0.75%
0.24%
0.11%
0.08%
0.00%
0.00%
0.00%
0.00%
0.00%
24.28%
4.35%
5.73%
19.08%
84.55%
4.88%
100.00%
100.00%
100.00%
Grass Total
Dry Total
Irrigated Total 3,817.20
28,591.00
37,257.60
3,203,570
19,763,495
16,790,195
5.43%
40.70%
53.04%
0.83%
0.00%
0.00%
100.00%
Average Assessed Value*
75.51%
0.00%
0.14%
5.53%
0.06%
0.00%
2.85%
15.92%
100.00%
0.00%
80.53%
10.22%
0.00%
0.69%
0.12%
0.11%
0.24%
0.00%
0.00%
0.00%
0.00%
4.31%
14.36%
4.88%
84.55%
100.00%
100.00%
0.00
972.58
749.11
0.00
0.00
450.97
650.00
780.00
630.00
610.00
450.00
450.00
600.00
0.00
0.00
0.00
0.00
0.00
550.00
550.00
520.00
520.29
450.65
450.00
839.25
691.25
450.65
0.00% 0.00
0.00% 0.00
100.00% 566.36
691.25 49.67%
450.65 42.20%
839.25 8.05%
50.00 0.07%72.
73.
74.
75.
County 42 - Page 55

County 2011 County Abstract of Assessment for Real Property, Form 45Harlan42
Schedule X : Agricultural Records :Ag Land Total
76. Irrigated
TotalValueAcresAcres Value
RuralAcres Value ValueAcres
SubUrban Urban
77. Dry Land
78. Grass
79. Waste
80. Other
81. Exempt
82. Total
41.79 76,230 0.00 0 103,435.84 165,756,210 103,477.63 165,832,440
0.00 0 90.00 59,780 95,668.11 68,484,975 95,758.11 68,544,755
0.00 0 0.00 0 116,431.43 52,493,865 116,431.43 52,493,865
0.00 0 0.00 0 4,807.00 240,790 4,807.00 240,790
0.00 0 0.00 0 3.00 150 3.00 150
0.00 0
41.79 76,230 90.00 59,780
0.00 0 14,376.80 0 14,376.80 0
320,345.38 286,975,990 320,477.17 287,112,000
Irrigated
Dry Land
Grass
Waste
Other
Exempt
Total 287,112,000 320,477.17
0 14,376.80
150 3.00
240,790 4,807.00
52,493,865 116,431.43
68,544,755 95,758.11
165,832,440 103,477.63
% of Acres*Acres Value % of Value* Average Assessed Value*
715.81 29.88% 23.87%
0.00 4.49% 0.00%
450.86 36.33% 18.28%
1,602.59 32.29% 57.76%
50.00 0.00% 0.00%
895.89 100.00% 100.00%
50.09 1.50% 0.08%
County 42 - Page 56

2011 County Abstract of Assessment for Real Property, Form 45 Compared with the 2010 Certificate
of Taxes Levied (CTL)42 Harlan
2010 CTL
County Total
2011 Form 45
County Total
Value Difference Percent
Change
2011 Growth Percent Change
excl. Growth
87,724,895
7,467,580
01. Residential
02. Recreational
03. Ag-Homesite Land, Ag-Res Dwelling
04. Total Residential (sum lines 1-3)
05. Commercial
06. Industrial
07. Ag-Farmsite Land, Outbuildings
08. Minerals
09. Total Commercial (sum lines 5-8)
10. Total Non-Agland Real Property
11. Irrigated
12. Dryland
13. Grassland
14. Wasteland
15. Other Agland
16. Total Agricultural Land
17. Total Value of all Real Property
(Locally Assessed)
(2011 form 45 - 2010 CTL) (New Construction Value)
17,147,110
112,339,585
21,615,250
0
8,107,540
572,770
30,295,560
142,635,145
137,980,695
61,992,690
50,882,310
240,890
0
251,096,585
393,731,730
88,479,260
8,035,860
17,169,255
113,684,375
22,970,755
0
8,543,725
1,279,600
32,794,080
146,478,455
165,832,440
68,544,755
52,493,865
240,790
150
287,112,000
433,590,455
754,365
568,280
22,145
1,344,790
1,355,505
0
436,185
706,830
2,498,520
3,843,310
27,851,745
6,552,065
1,611,555
-100
150
36,015,415
39,858,725
0.86%
7.61%
0.13%
1.20%
6.27%
5.38%
123.41
8.25%
2.69%
20.19%
10.57%
3.17%
-0.04%
14.34%
10.12%
484,010
176,125
1,054,925
1,017,650
0
0
0
1,017,650
2,072,575
2,072,575
5.25%
0.31%
-2.17%
0.26%
1.56%
5.38%
123.41
4.89%
1.24%
9.60%
394,790
County 42 - Page 57

2010 PLAN OF ASSESSMENT
FOR
HARLAN COUNTY
By Pam Meisenbach and Tara Drain
Plan of Assessment Requirements:
Pursuant to Neb. Rev. Stat. §77-1311.02 (2007), on or before June 15 each year, the assessor
shall prepare a plan of assessment, (herein after referred to as the “plan”), which describes the
assessment actions planned for the next assessment year and two years thereafter. The plan shall
indicate the classes or subclasses of real property that the county assessor plans to examine
during the years contained in the plan of assessment. The plan shall describe all the assessment
actions necessary to achieve the levels of value and quality of assessment practices required by
law, and the resources necessary to complete those actions. On or before July 31 each year, the
assessor shall present the plan to the county board of equalization and the assessor may amend
the plan, if necessary, after the budget is approved by the county board. A copy of the plan and
any amendments thereto shall be mailed to the Department of Revenue, Property Assessment
Division on or before October 31 each year.
Real Property Assessment Requirements:
All property in the State of Nebraska is subject to property tax unless expressly exempt by
Nebraska Constitution, Article VIII, or permitted by the constitution and enabling legislation
adopted by the legislature. The uniform standard for the assessed value of real property for tax
purposes is actual value, which is defined by law as “the market value of real property in the
ordinary course of trade.” Neb. Rev. Stat. §77-112 (2003).
Assessment levels required for real property are as follows:
1) 100% of actual value for all classes of real property excluding agricultural and
horticultural land;
2) 75% of actual value for agricultural land and horticultural land; and
3) 75% of special value for agricultural and horticultural land which meets the qualifications
for special valuation under §77-1344.
See Neb. Rev. Stat. §77-201 (2009).
General Description of Real Property in Harlan County:
Per the 2010 County Abstract, Harlan County consists of the following real property types:
Parcels % of Total Parcels % of Taxable Value Base
Residential 1970 40% 22%
Commercial 293 6% 5%
Recreational 372 8% 2%
Agricultural 2238 46% 70%
Mineral 5 0 0
Exempt 191 0 0
County 42 - Page 58

Agricultural land - taxable acres 320,499.17
Other pertinent facts: For agland 36% of county is grass, 32% is irrigated, 30% is dry, and 2% is
other.
For more information see 2010 Reports & Opinion, Abstract and Assessor Survey.
Current Resources:
A. Staff/Budget/Training
1 Assessment Manager (shared with Hitchcock County), 1 Assessment Clerk,
1 Appraiser (shared with Hitchcock County)
Appraiser Assistant-Vacant (due to hiring freeze by Governor & LB 121).
The assessor is required to obtain 60 hours of continuing education every 4 years. The
assessor has met all the educational hours required. The assessor also attends other
workshops and meetings to further her knowledge of the assessment field.
The assessment staff at this time does not have continuing education requirements. The
staff has voluntarily taken classes such as Windows, TerraScan user education, as well as
IAAO classes.
The Appraiser is licensed, and has taken the continued education required to retain the
appraiser license.
B. Cadastral Maps
The Harlan County cadastral maps were purchased in 1982. The assessment staff
maintains the maps. All new subdivisions and parcel splits are kept up to date, as well as
ownership transfers. At the present time, the cadastral maps are in dire need of updating
and repair work as the 28 years of use have taken its toll. We are still anxiously awaiting
the new GIS program and hope to have it in place for 2011 so that we might be in line
with the neighboring County counties that already have a GIS program.
C. Property Record Cards
We utilize the property record cards available from the Terra Scan system. We also have
aerial photos of rural parcels from a 1984 flight. The information from our re-appraisal
of 1995-6 is on the computer as reference. We add new information as we gather it in
review and pick-up work to further enhance our records. These records are in good
condition. The Terra Scan system implemented a working and historical appraisal file
that at the present needs design changes. We are waiting patiently for installation of the
new CAMA/GIS system by Tyler Technologies.
D. Software for CAMA, Assessment Administration, GIS
Harlan County became a State assumed county in July 1998. We had in place the same
CAMA package (Terra Scan) that is now used by the State assumed counties. At this time
all data is entered in the ATR file and also the appraisal file. This data is from our re-
appraisal of Harlan County in 1996 and also new improvements and review of the sales
for each period. Alma, Oxford and Taylor Manor residential were all reviewed in 2008-
2009. In 2010 3/4 of the rural res was reviewed on site. At this time we have all sketches
County 42 - Page 59

and digital pictures in the CAMA system. We do not have a GIS system.
E. Web based – property record information access provided by Marcus Tooze
Gisworkshop web site: http://harlan.pat.gisworkshop.com
Current Assessment Procedures for Real Property:
A. Discover, List & Inventory all property.
B. Data Collection.
C. Review assessment sales ratio studies before assessment actions.
D. Approaches to Value;
1) Market Approach; sales comparisons,
2) Cost Approach; cost manual used & date of manual and latest depreciation study,
3) Income Approach; income and expense data collection/analysis from the market,
4) Land valuation studies, establish market areas, special value for agricultural land
E. Reconciliation of Final Value and documentation
F. Review assessment sales ratio studies after assessment actions.
G. Notices and Public Relations
Level of Value, Quality, and Uniformity for assessment year 2010:
Property Class Median COD* PRD*
Residential .96 14.05 102.75
Commercial N/A 34.83 N/A
Agricultural Land .71 18.64 101.91
Special Value Agland N/A N/A N/A
*COD means coefficient of dispersion and PRD means price related differential.
For more information regarding statistical measures see 2010 Reports & Opinions.
Assessment Actions Planned for Assessment Year 2011:
Continue with the new CAMA/GIS system with Tyler Technologies that was implemented in
2010. We will complete our rural res review of the last 4 townships. We will review statistics
from previous year to find any hot spots to be corrected. Continue to track acres enrolled in
CREP & EQIP. Update ag land acre values with new sales data. Research sales of agland
properties for recreational use such as hunting, which may show a need for special valuation in
Harlan County. Do normal pick-up work and sales reviews. Review areas starting with Orleans
and Republican City. Our expectations of review work being completed has diminished with the
hiring freeze and the absence of appraisal assistants. With the passage of LB121 in 2009, the
county could take over the budget for the assessment of Harlan County.
County 42 - Page 60

Assessment Actions Planned for Assessment Year 2012:
Review areas starting with Patterson Harbor, North Shore Marina and B & R Mobile Home Park.
We would like to update Marshall & Swift tables to 06/08 and do a complete review of
commercials. Review statistics to determine if any major or minor adjustments need to be made.
Review market areas and any new TIF projects that develop. Do regular pick-up work and sale
reviews. Verify accuracy of depreciation tables and site improvements tables with information
from the market data. Implement our new GIS program. Continue to do county review as set
up by the Property Assessment Division.
Assessment Actions Planned for Assessment Year 2013:
We will review another ¼ of the townships. Review statistics to see if any new data has appeared
that would change any of our tables that are developed from the market. Review market areas
for accuracy from the sales that have occurred. Do regular pick-up work based on building
permits and information from the zoning director. Continue use of GIS. Continue to do county
review as set up by the Property Assessment Division.
Other functions performed by the assessor’s office, but not limited to:
1. Record Maintenance, Mapping updates, & Ownership changes
2. Annually prepare and file Assessor Administrative Reports required by law/regulation:
a. Abstracts (Real & Personal Property)
b. Assessor Survey
c. Sales information to PAD rosters & annual Assessed Value Update w/Abstract
d. Certification of Value to Political Subdivisions
e. School District Taxable Value Report
f. Homestead Exemption Tax Loss Report (in conjunction with Treasurer)
g. Certificate of Taxes Levied Report
h. Report of current values for properties owned by Board of Education Lands &
Funds
i. Report of all Exempt Property and Taxable Government Owned Property
j. Annual Plan of Assessment Report
3. Personal Property; administer annual filing of 617 schedules; prepare subsequent notices
for incomplete filings or failure to file and penalties applied, as required.
4. Permissive Exemptions: administer annual filings of applications for new or continued
exempt use, review and make recommendations to county board.
5. Taxable Government Owned Property – annual review of government owned property
not used for public purpose, send notices of intent to tax, etc.
6. Homestead Exemptions; administer 173 annual filings of applications, approval/denial
process, taxpayer notifications, and taxpayer assistance.
County 42 - Page 61
7. Centrally Assessed – review of valuations as certified by PAD for railroads and public
service entities, establish assessment records and tax billing for tax list.
8. Tax Increment Financing – management of record/valuation information for properties in
community redevelopment projects for proper reporting on administrative reports and
allocation of ad valorem tax.
9. Tax Districts and Tax Rates – management of school district and other tax entity
boundary changes necessary for correct assessment and tax information; input/review of
tax rates used for tax billing process.
10. Tax Lists; prepare and certify tax lists to county treasurer for real property, personal
property, and centrally assessed.
11. Tax List Corrections – prepare tax list correction documents for county board approval.
12. County Board of Equalization - attend county board of equalization meetings for
valuation protests – assemble and provide information
13. TERC Appeals - prepare information and attend taxpayer appeal hearings before TERC,
defend valuation.
14. TERC Statewide Equalization – attend hearings if applicable to county, defend values,
and/or implement orders of the TERC.
15. Education: Assessor and/or Appraisal Education – attend meetings, workshops, and
educational classes to obtain required hours of continuing education to maintain assessor
certification and/or appraiser license, etc.
Conclusion:
With all the entities of county government that utilize the assessor records in their operation, it is
paramount for this office to constantly work toward perfection in record keeping.
With the continual review of all properties, records will become more accurate, and values will
be assessed more equally and fairly across the county. With a well-developed plan in place, this
process can flow more smoothly. Sales review will continue to be important in order to adjust for
market areas in the county.
Respectfully submitted:
Pam Meisenbach, Assessment Manager 10/28/2010
Tara Drain, Appraiser 10/28/2010
County 42 - Page 62

2011 Assessment Survey for Harlan County
A. Staffing and Funding Information
1. Deputy(ies) on staff:
0
2. Appraiser(s) on staff:
1 appraiser, 1 appraisal assistance
3. Other full-time employees:
The administrative assessment manager
4. Other part-time employees:
0
5. Number of shared employees:
The assessment manager and the appraiser are shared between Harlan and
Hitchcock Counties
6. Assessor’s requested budget for current fiscal year:
n/a
7. Adopted budget, or granted budget if different from above:
The expenditures for assessment functions in Harlan County during the 2009-2010
fiscal years were $88,925.84.
8. Amount of the total budget set aside for appraisal work:
n/a
9. Appraisal/Reappraisal budget, if not part of the total budget:
The expenditures for appraisal functions in Harlan County during the 2009-2010
fiscal years were $60,310.55.
10. Part of the budget that is dedicated to the computer system:
$6,731.62
11. Amount of the total budget set aside for education/workshops:
n/a
12. Other miscellaneous funds:
None
13. Amount of last year’s budget not used:
n/a
B. Computer, Automation Information and GIS
1. Administrative software:
TerraScan
2. CAMA software:
TerraScan
3. Are cadastral maps currently being used?
Yes, but they are in poor condition after many years of use.
4. If so, who maintains the Cadastral Maps?
County 42 - Page 63

The office staff.
5. Does the county have GIS software?
No
6. Who maintains the GIS software and maps?
n/a
7. Personal Property software:
TerraScan
C. Zoning Information
1. Does the county have zoning?
Yes
2. If so, is the zoning countywide?
Yes
3. What municipalities in the county are zoned?
Alma
4. When was zoning implemented?
2002
D. Contracted Services
1. Appraisal Services:
Pritchard and Abbott are contracted with yearly to do the oil and gas mineral
appraisals.
2. Other services:
None
County 42 - Page 64

Certifica
tion
County 42 - Page 65

2011 Certification for Harlan County
This is to certify that the 2011 Reports and Opinions of the Property Tax Administrator
have been sent to the following:
One copy by electronic transmission to the Tax Equalization and Review Commission.
One copy by electronic transmission to the Harlan County Assessor.
Dated this 11th day of April, 2011.
Ruth A. SorensenProperty Tax Administrator
County 42 - Page 66

Ma
p S
ection
County 42 - Page 67

Valu
atio
n H
istory
County 42 - Page 68