Embed Size (px)
Citation preview

1
Table of Contents
IS 5 x Main Components: .......................................................................................................................... 2
UDERSTAND THE BUSINESS! ..................................................................................................................... 3
What information do users need… ........................................................................................................... 5
SYSTEM DEVELOPMENT TOOLS ................................................................................................................ 5
System Development Methods ................................................................................................................ 6
STRUCTURED ANALYSIS ............................................................................................................................ 7
OBJECT-ORIENTED ANALYSIS .................................................................................................................... 8
AGILE METHODS ....................................................................................................................................... 8
OTHER DEVELOPMENT METHODS ............................................................................................................ 8
SYSTEM DEV GUIDELINES .......................................................................................................................... 9
INFORMATION TECHNOLOGY DEPARTMENT ........................................................................................... 9
SYSTEM ANALYST .................................................................................................................................... 10
GLOSSARY................................................................................................................................................ 11

2
PHASE 1 – SYSTEM PLANNING
3 Methods:
- Structured analysis (based on concept of SDLC Systems development life cycle)
- Object – orientated analysis
- Agile methods
IT combination of hardware, software and services people use to manage, communicate and share info.
Information system combines information technology, people and data to support business
requirements.
System analysts plan, develop and maintain information systems
Information systems developed by company itself = in-house applications, or purchased = software
packages.
Mission-critical system is one that is vital to a company’s operations.
IS 5 x Main Components:
Hardware – everything in physical layer
Software – programs that control the hardware and produce the desired info or results.
- System Software = manage hardware components (OS, drivers…) Controls flow of data and provide
system security and manage network operations.
- Application Software = support day-to-day business functions and provide users with required info.
Company-wide apps is called enterprise apps and include order processing systems, payroll…
Incl both horizontal and vertical systems:
horizontal – can be adapted for use in many different types of companies
vertical – meet unique requirements of a specific business or industry
Data – raw material, saved in tables.
Processes – tasks and business functions that users, managers and IT staff members perform to achieve
specific results. Represent actual day-to-day business operations.
People – People with interest in IS are called stakeholders. Include management group, users and IT
staff members.
When planning an IS system a company must consider how a new system will interface with older
systems which are called legacy systems.

3
UDERSTAND THE BUSINESS!
System analysts use a process called business process modeling to represent company operations and
info needs and requires a business profile and a series of models that document business processes.
Business Profile is an overview of a company’s mission, functions, organization, products, services,
customers, suppliers, competitors, constraints and future direction. Starting point of modeling process.
Business Process is specific set of transactions, events, and results that can be described and
documented.
(BPM) Business Process Model graphically displays one or more business process. For complex
operations computer-based modeling tools that use standard language (BPMN) Business process
modeling notation is used (include various shapes and symbols)
Internet-dependent firm – Amazon
Brick-and-mortar – physical locations
e-Commerce (electronic commerce) or I-Commerce (Internet commerce), 2 x Main Sectors:
B2C (Business-to-Consumer)
B2B (Business-to-Business) – used EDI (Electronic data interchange), enabling computer-to-computer
data transfer, plan production etc based on another companies data. XML (Extensible markup language)
offer std protocols, universal availability and low communication costs… allowing web-based
communication between different hardware and software environments.
Popular form of B2B interaction is called (SCM) Supply Chain Management or (SRM) Supplier
relationship management.
Enterprise Computing
IS that support company-wide operations and data management requirements, referred to as (ERP)
Enterprise resource planning.
Transaction Processing (TP)
Process data generated by day-to-day business operations.
Series of tasks performed by processing a sales order: (processed as one group)
- Verify Cus Data
- Check Credit status
- Post to AR
- Check stock availability
- Adjust Invent Data
- Update Sales Activity File

4
Business Support
Business Support Systems provide job-related info support to users at all levels of a company. Analyze
transactional data, generate info needed to manage and control business processes and provide info
that leads to better decision-making. Calles (MIS) Management information systems.
RFID (radio frequency identification) – Newest development in data acquisition, uses high-frequency
radio waves to track physical objects and can track parcels constantly.
Knowledge Management
Also called expert systems because they stimulate human reasoning by combining a knowledge base
and inference rules that determine how the knowledge is applied.
Knowledge base consist of large database allowing users to find info by entering keywords or question
in normal English phrases.
Knowledge management system uses inference rules which are logical rules that identify data patterns
and relationships. Do not use strict logical rules but a technique called Fuzzy logic that allow inferences
to be drawn from imprecise relationships. Not black and white like binary logic but shades of gray…
Results from fuzzy logic search will display in priority order.
User Productivity
User productivity systems include e-mail, fax, word processing etc. and include Groupware (programs
run on a company intranet and enable users to share data, collaborate on projects and work in teams.)
Information Systems Integration
Most companies require systems that combine TP, Business Support, Knowledge management and user
productivity features.

5
What information do users need…
Organizational Levels:
- Top Managers (develop long-range plans, strategic plans, defining company’s overall mission and
goals.)
- Middle Managers and knowledge workers (Provide direction, necessary resources and performance
feedback to supervisors and team leaders. Focus is shorter time frame and need more detailed info
than top managers.)
Knowledge workers include professional staff members such as system analysts, programmers,
accountants, researchers etc.
- Supervisors and Team Leaders (oversee operational employees and carry out day-to-day functions,
they coordinate operational tasks and people.)
- Operational Employees (include users who rely on TP systems to enter and receive data they need to
perform their jobs.
SYSTEM DEVELOPMENT TOOLS consist out of:
Modeling Prototyping Computer-Aided System Engineering (CASE)
Modeling
Graphical representation of a concept or process that systems developers can analyze, test and modify.
Business model, or Requirements model describes info system must provide.
Data model describes data structures and design
Object model describes object which combine data and processes
Network model describes the design and protocols of telecommunications links
Process model describes the logic that programmers use to write code modules
Prototyping
Test system concepts and provides an opportunity to examine input, output and user interfaces before
final decisions are made. Prototype is an early working version of an information system.
CASE
Uses powerful software, called case tools to help systems analyst develop and maintain IS. Provide
overall framework for systems development and support wide variety of design methodologies incl
structured analysis and object-oriented analysis.

6
System Development Methods Structured Analysis Object-Oriented Analysis Agile/Adaptive Methods
System in terms of data and the pro-cesses that act upon that data. Dev is organized into phases with deliverables and milestones to measure progress. SDLC waterfall model (with phases) Data flow diagrams (DFDs) & process descriptions & Business Process modeling
Views system in terms of objects that combine data and processes. Objects represent actual people, things, transactions and events. More interactive, use waterfall or model with more iteration Various object-orientated diagrams, actors, methods and messages & Business modeling
Intense team-based effort. Dev cycle broken into cycles or iterations that add functionality. Each iteration is designed, built and tested in ongoing process. Spiral model Tools that enhance communications, collaborative software, brainstorming & white boards & Business modeling.
Iteration (repetition) possible between 5 phases: 1 Systems Planning (Preliminary Investigation) 2 Systems Analysis (Sys requirement doc) 3 Systems Design (Sys Design Specification) 4 Systems Implementation (Complete Functioning IS) 5 Systems Support and Security (Operational IS)
Usually follows series of analysis and design phases similar to the SDLC. Phases tend to be more interactive. Interactive model that can accurately depict real-world business processes.
Phases and Tasks (spiral) Planning (Define objectives, constraints and deliverables) Risk Analysis (Identify risks and develop acceptable resolutions) Engineering (Develop prototype that incl all deliverables Education (Perform assessment and testing to develop objectives for next iteration)
PRO: Traditional method. Relies on written documentation. Frequent phase iteration can provide flexibility compared to other methods. Well-suited to project management tools.
PRO: Integrates easily with O-O programming languages. Code is modular and reusable reducing cost and development time. Easy to maintain and expand as new objects can be cloned using inherited properties
PRO: Flexible and efficient in dealing with change. Stresses team interaction and reflects a set of community-based values. Frequent deliverables constantly validate the project and reduce risk.
CON: Changes can be costly. Requirement defined early and can change during development. Users might only be able to describe their needs until they see examples of features and functions.
CON: newer so less familiar to Dev team members. Interaction of objects and class can be complex in larger systems.
CON: Team members need high level of tech and communication skills. Lack of structure and documentation can introduce risk factors. Overall project might be subject to scope changes as user requirements change.
Project Management is process of planning, scheduling, monitoring, controlling and reporting upon the
Dev of an IS.

7
STRUCTURED ANALYSIS Based on overall plan similar to a blueprint for constructing a building, called the predictive approach. Technique = process-centered Process model shows data that flows in and out of system processes. Inside each process, input data is transformed by business rules that generate the output. (DFD) Data flow diagram uses various symbols and shapes to represent data flow, processing and storage. In the waterfall model the result of each phase is called a deliverable or end product flowing into next phase.
1 Sys Planning Usually begins with formal request to the IT department, called a system request, describing problems or desired changes in an IS or business process. Purpose of this phase is to perform a preliminary investigation to evaluate an IT-related business opportunity or problem. Key part of preliminary investigation is a feasibility study that reviews anticipated costs and benefits and recommends a course of actions based on operational, technical, economic and time factors.
2 Sys Analysis Purpose is to build a logical model of the new system. Step 1 is requirement modeling where you investigate business processes and document what the new system must do to satisfy users. Perform fact-finding using techniques such as interviews, surveys, doc review, observation and sampling. Results are used to build business models, data and process models, and object models. Deliverable = system requirements document (describes management and user requirements, costs and benefits and outlines alternative Dev strategies.
3 Sys Design Purpose is to create a physical model that will satisfy all documented requirements for the system. Design user interface and identify necessary outputs, inputs and processes. Also design internal and external controls, incl computer-based and manual features guaranteeing reliable, accurate, maintainable and secure sys. Deliverable = system design specification
4 Sys Implementation
New sys is constructed. Programs are written, tested and documented and system is installed. Objective = Deliver complete functioning and documented IS. Final Preparation = converting data to new system’s files, training and performing actual transition to new sys. Includes assessment called systems evaluation (determine whether sys operates properly and if costs and benefits are within expectations.
5 Sys Support & Security
IT staff maintains, enhances and protects the system. Maintenance changes correct errors and adapt to changes in the environment. Enhancements provide new features and benefits. Objective = maximize ROI Well-designed sys must be secure, reliable, maintainable and scalable. Scalable = design can expand to meet new business requirements and volumes.

8
OBJECT-ORIENTED ANALYSIS
Combines data and the processes that act on data into things called objects. (Real-world business
processes and operations.
And object is a member of a class (collection of similar objects).
Objects possess characteristics called properties which is inherited from the class or possesses on it’s
own.
Instructor and Student fall under person class.
Person has property called “address” which is inherited by the instructor and student.
Student has property called “major” which is not shared.
Built-in processes (methods) can change object’s properties. (an ORDER may have property called
“status” that can change.
One object can send info to another object using a message (request specific behavior or info from
another object). ORDER requests address from CUSTOMER.
AGILE METHODS
Attempt to develop system incrementally by building series of prototypes and constantly adjusting them
to user requirements.
Emphasizes continuous feedback and each incremental step is affected by what was learned in prior
steps.
Iterative DEV boost productivity by using flexible manufacturing system where team-based effort and
short-term milestones helped quality up and costs down
OTHER DEVELOPMENT METHODS
2 Popular Methodologies:
JAD (Joint application development) team-based fact-finding which is only one phase of the Dev
process.
RAD (Rapid application development) compressed version of entire process.

9
SYSTEM DEV GUIDELINES
5 Basic systems Dev Guidelines
Develop a Plan Prepare plan and stick to it, logical sequence
Involve Users and carefully listen to them Users must be involved in Dev process, especially when identifying and modeling system requirements
Use Project Management Tools and Techniques Keep on track, avoid surprises. Reasonable nr of checkpoints
Develop Accurate Cost and Benefit Information Managers need to be informed
Remain Flexible Ability to react quickly
INFORMATION TECHNOLOGY DEPARTMENT
6 main Functions:
Application Development
Provides leadership and overall guidance but systems themselves are developed by teams
consisting of users, managers and IT staff members. Popular model is a project-oriented team
using RAD or JAD with IT professionals providing overall coordination, guidance and technical
support.
Systems Support and Security
vital protection and maintenance services for hardware and software, incl enterprise computing
systems, networks, TP systems & corporate IT infrastructure. Technical support to other groups
in IT department, often includes deployment team (installs and configure workstations)
User Support
Provide users with technical info, training and productivity support (help desk or info center)
Database Administration
data design, management, security, backup and access.
Network Administration
hardware and software maintenance, support and security. Install, configure, manage, monitor
and maintain network apps.
Web Support
design and construct Web pages, monitor traffic, manage hardware and software and link Web-
based apps to company’s info systems, important for companies engaged in e-commerce.
Quality Assurance (QA)
reviews and test all apps and system changes to verify specs and software quality standards.

10
SYSTEM ANALYST
Investigates, analyzes, designs, develops, installs, evaluates and maintains a company’s IS.
Responsibilities = help translate business requirements into IT projects. Help document business
profiles, review business processes, select hardware and software packages, design info systems, train
users and plan e-commerce Web sites.
Plans projects, develops schedules, estimate costs, conducts meetings, delivers presentations and writes
memos, reports and documentation.
KNOWLEDGE, SKILLS AND EDUCATION
Technical Knowledge: State-of-the-art knowledge (internet good resource) learn about technical
developments, exchange experiences… attending training courses, on-site and online, Networking with
colleagues.
Communication Skills: Strong oral and written and ability to interact with people at all levels.
Business skills: work closely with managers, supervisors and operational employees, must understand
operations and processes. Curious, comfortable with financial tools and able to see the big picture.
Critical thinking Skills: include ability to compare, classify, evaluate, recognize patterns, analyze cause-
and-effect and apply logic. Often use a what-if approach.
Education: College degree in IS, computer science or business and some IT experience.
Certification: verifies an individual demonstrated a certain level of knowledge and skill on standardized
test.

11
GLOSSARY
brick-and-mortar Companies conducting business primarily from physical locations
business process A specific set of transactions, events, tasks, and results that can be described and documented
business process model Graphically displays one or more business processes
business process modeling Process used to represent company operations and information needs
business profile Company overview; the starting point for the modeling process
business support systems Provide job-related information support to users at all levels of a company
business-to-business Business sector focused on selling to businesses
business-to-consumer Business sector focused on selling to consumers
CASE tools Powerful software used to help develop and maintain information systems
computer-aided systems
engineering Technique that uses CASE tools to help systems analysts develop and maintain information systems
data Basic facts that are a system's raw material
data model Describes data structures and design
deliverable The result of each phase in the waterfall model
empowerment Trend to give employees more responsibility and accountability
end product Another term for deliverable
enterprise applications Company-wide applications
enterprise computing Information systems that support company-wide operations and date management requirements
expert systems Systems that simulate human reasoning by combining a knowledge base and inference rules
extensible markup language Language that allowed company-to-company traffic to migrate to the Internet
feasibility study Reviews anticipated costs and benefits and recommends a course of action
horizontal system System that can be adapted for use in many different types of companies
in-house applications Information systems developed within a company
inference rules Logical rules that identify data patterns and relationships
knowledge base Large database that allows users to find information by entering keywords in normal English phrases
knowledge workers Professional staff members who provide support for the organization's basic functions
mission-critical system A system vital to a company's operations
modeling Produces a graphical representation of a concept or process
Moore's Law Prediction of Gordon Moore that the number of transistors in an integrated circuit would double about every 24
months
predictive Approach based on an overall plan
process model Describes the logic that programmers use to write code modules
product-oriented Companies that manufacture and sell products
prototype Early working version of an information system

12
radio frequency identification High-frequency radio waves used to track physical objects
requirements model Describes information that a system must provide
software Programs that control the hardware and produce the desired information or results
software packages Information systems purchased from outside vendors
strategic plans Long-range plans that define the company's overall mission and goals
structured analysis Traditional method of developing information systems that is still widely used
system requirements
document Deliverable of systems analysis phase
system software Programs that manage system hardware components
systems analysis and design Step-by-step process for developing high-quality information systems
systems design phase Phase used to create a physical model that will satisfy all documented requirements for the system
systems evaluation Assessment to determine whether the system operates properly and if costs and benefits are within
expectations
systems planning phase Beginning phase starting with a systems request
systems request Describes problems or desired changes in an information system or a business process
systems support and security Provides vital protection and maintenance services for system hardware and software
systems support and security
phase Phase during which IT staff maintain, enhance, and protect the system
user support Provides users with technical information, training, and productivity support
Web support Support function for a company's Internet operations

13
Table of Contents
OVERVIEW ................................................................................................................................................... 14
Strategic planning overview.................................................................................................................... 14
Business Case .......................................................................................................................................... 14
Information system projects ................................................................................................................... 15
Evaluation of systems requests .................................................................................................................. 15
Feasibility .................................................................................................................................................... 16
Operational feasibility ............................................................................................................................. 16
Technical feasibility ................................................................................................................................. 16
Economic feasibility ................................................................................................................................ 17
Schedule feasibility ................................................................................................................................. 17
Setting priority ........................................................................................................................................ 18
Discretionary and nondiscretionary projects .......................................................................................... 18
Preliminary Investigation overview ........................................................................................................ 19
Planning Preliminary Investigation – STEPS: ....................................................................................... 19
Glossary: .................................................................................................................................................. 22
14
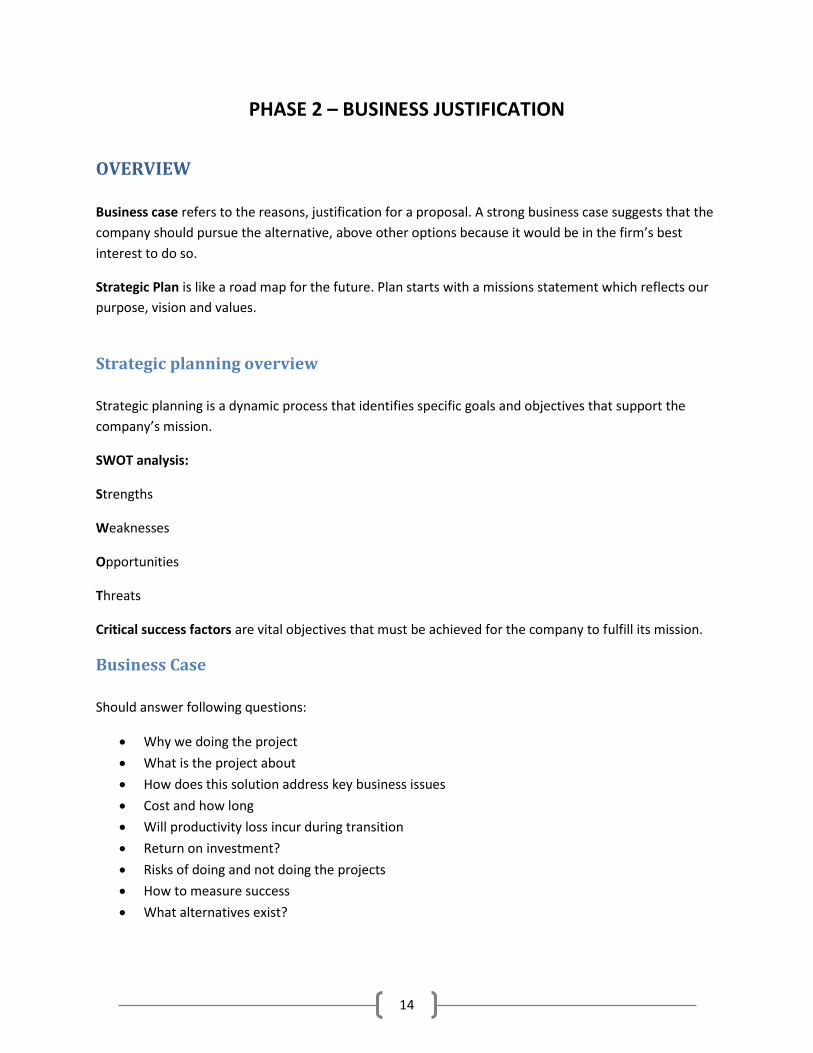
PHASE 2 – BUSINESS JUSTIFICATION
OVERVIEW
Business case refers to the reasons, justification for a proposal. A strong business case suggests that the
company should pursue the alternative, above other options because it would be in the firm’s best
interest to do so.
Strategic Plan is like a road map for the future. Plan starts with a missions statement which reflects our
purpose, vision and values.
Strategic planning overview
Strategic planning is a dynamic process that identifies specific goals and objectives that support the
company’s mission.
SWOT analysis:
Strengths
Weaknesses
Opportunities
Threats
Critical success factors are vital objectives that must be achieved for the company to fulfill its mission.
Business Case
Should answer following questions:
Why we doing the project
What is the project about
How does this solution address key business issues
Cost and how long
Will productivity loss incur during transition
Return on investment?
Risks of doing and not doing the projects
How to measure success
What alternatives exist?

15
Information system projects
Systems request is starting point for most projects – formal way of asking for IT support.
Main reasons for Systems Projects:
Improved service
Better performance
Support for new products and services
More info
Stronger controls
Reduced cost
Factors affecting system Projects:
Internal
External
Economy
Governments
Existing systems and data
IT Department
User requests
Top managers
Strategic plan
Technology
Suppliers
Customers
Competitors
Evaluation of systems requests
Companies use systems review committees or a computer resources committee to evaluate systems
projects.
Systems request forms are used by some companies to streamline request process and ensures
consistency.

16
Feasibility
Feasibility tests:
Operational feasibility
Technical feasibility
Economic feasibility
Schedule feasibility
Operational feasibility
Proposed system will be used effectively after it has been developed.
Questions:
Does management, users support the project and see the need for change?
Will workforce be reduced?
Training needed, resources available?
Will users be involved in planning right from the start?
Will new demands be placed on users, operating changes?
Will customers experience adverse effects and for how long?
Risk to company’s image or goodwill?
Does development schedule conflict with other company priorities?
Legal or ethical issues?
Technical feasibility
Technical resources needed to develop, purchase, install or operate the system.
Questions:
Does company have necessary hardware, software and network resources, can it be acquired?
Needed technical expertise?
Does proposed platform have sufficient capacity for future needs, or can it be expanded?
Prototype required?
Hardware and software environment reliable, will it integrate with other company IS?

17
Economic feasibility
Projected benefits of proposed system outweigh the estimated costs TCO (Total cost of ownership),
which include ongoing support and maintenance as well as acquisition costs?
TCO’s estimated by:
People, IT staff and users
Hardware
Software, including in-house development as well as purchases
Formal and informal training
Licenses and fees
Consulting expenses
Facility costs
Estimated cost of not developing the system or postponing the project.
Tangible benefits
measured in monetary value… result from decrease in expenses, increase in revenue or both:
New system reducing overtime
Online package tracking system improving service and decreases the need for clerical staff
Sophisticated inventory control system cutting excess invent and eliminates production delays.
Intangible benefits
Advantages that are difficult to measure in dollars but important:
User-friendly system improving employee job satisfaction
Sales tracking system, better info
New Web site enhancing company’s image.
Schedule feasibility
Project can be implemented in an acceptable time frame. Interaction between time and costs to be
considered.
Can company or IT control factors affection schedule feasibility
Management established firm timetable for project?
Conditions to be satisfied during the development of the system.
Does accelerated schedule pose any risks and are the risks acceptable
Project management techniques available to coordinate and control project
Project manager appointed?

18
Evaluating Feasibility
First Step: Identify and weed out system requests that are not feasible. Ongoing task that must be
performed throughout systems development process.
Setting priority
Highest priority goes to projects providing greatest benefit at lowest cost in shortest period of time. But
influenced by many factors.
Factors affecting priority:
Reducing costs? Where, when, how, how much?
Revenue increase? Where, when, how, how much?
More information, results measurable?
System serve customer better?
Serve organization better?
Implantation in reasonable time period? How long results last?
Necessary resources available?
Discretionary and nondiscretionary projects
Discretionary = project where management has a choice in implementing them.
Nondiscretionary = no choice exists.

19
Preliminary Investigation overview
Analyst to conduct study of systems request and recommend specific action. End result of preliminary
investigation is a report to management.
Planning Preliminary Investigation – STEPS:
STEP 1
Understand problem or opportunity.
STEP 2
Define project scope and constraints
STEP 3
Perform fact-finding
- Analyze organizational charts
- Conduct interviews
- Review documentation
- Observe operations
- Conduct user survey
STEP 4
Analyze project usability, cost, benefit and schedule data.
STEP 5
Evaluate feasibility
- Operational
- Technical
- Economic
- Schedule
STEP 6
Present results and recommendations to management.

20
STEP 1 (Understanding problem):
Getting to real cause and not just symptom, popular technique is called fishbone diagram or Ishikawa
diagram.
Main bone is problem with sub-bones representing possible cause of problem. And then ask questions
around these.
STEP 2 (Define the project Scope and constraints)
Determining project scope means defining the specific boundaries or extent of the project. Projects with
a very general (not specific) scope are at risk of expanding gradually without specific authorization, this
is called project creep. To avoid this the project scope must be as clearly as possible. Also need to
identify constraints (a requirement of condition that system must satisfy or an outcome that the system
must achieve – can be hardware, software, time, policy, law or cost.)
When examining constraints the following characteristics must be identified:
Present versus Future
now or at future time
Internal versus External
due to requirement within organization or external force such as government regulation.
Mandatory versus Desirable
Absolutely essential or merely desirable?
STEP 3 (Fact Finding)
Gather data about project usability, costs, benefits and schedules. Involves various techniques.
Analyze organization charts
layout of people and position, try and acquire from HR.
Conduct interviews
Steps:
1. Determine people to interview
2. Establish objectives
3. Develop interview questions
4. Prepare
5. Conduct interview
6. Document interview
7. Evaluate

21
Review Documentation
current system documentation, make sure accurate and up to date.
Observe operations
Follow and trace actual paths taken by input source documents or output reports. Observe
outputs and inputs.
Conduct a user survey
Design form… larger group, quicker than interviews.
Analyze the data
Pareto chart widely used tool for visualizing issues needing attention. Drawn as a vertical bar
graph… representing various causes of problem.
XY chart also called the scatter diagram is another problem-solving tool.
STEP 4 (Analyze Project usability, cost, benefit and Schedule Data).
What info you must obtain and how you will gather and analyze it
Will you conduct interviews, how many people and how much time
Conduct a survey, who, time?
How much it will cost to analyze info and prepare report with findings and recommendations?
STEP 5 (Evaluate feasibility)
Analyzed problem/opportunity, now evaluating Projects feasibility.
Operational = included review of user needs, requirements and expectation
Technical = hardware, software and network resources needed.
Economic = Financial analysis tools to assess, cost-benefit data and cost estimate.
Schedule = stakeholder expectations regarding acceptable timing and completion dates.

22
STEP 6 (Present results and recommendations to management)
Report might consist out of following sections:
Introduction (overview)
Systems Request Summary (basis of systems request)
Findings (results and description of scope, constraints and feasibility)
Case for Action (summary of case and recommendation.)
Projects Roles (people who will participate and their roles)
Time and Cost Estimates (cost acquiring and installing system, and TCO)
Expected Benefits (tangible and intangible)
Appendix (supporting info)
Glossary:
biometric devices Can identify a person by a retina scan or by mapping a facial pattern
business case Reasons, or justifications, for a proposal
case for action Summary of project request and a specific recommendation
computer resources committee
Key managers and users that evaluate systems requests
constraint Requirement or condition that the system must satisfy or an outcome that it must achieve
critical success factors Vital objectives that must be achieved for a company to fulfill its mission
customer relationship management
Systems that integrate customer-related events and transactions
discretionary projects Projects where management has a choice in implementing them
economic feasibility Means the projected benefits outweigh estimated costs
electronic product code Technology that uses RFID tags to identify and monitor the movement of each individual product
electronic proof of delivery
Customer scans incoming products against a digital shipping list
encryption Coding of data to keep it safe from unauthorized users
fishbone diagram An analysis tool that represents the possible causes of a problem as a graphical outline
intangible benefits Advantages that are difficult to measure in dollars but are important to the company
Ishikawa diagram Another term for a fishbone diagram
just-in-time inventory systems
Rely on computer-to-computer data exchange to minimize unnecessary inventory
mission statement Reflects a company's purpose, vision, and values
nondiscretionary projects
Projects where no choice exists
operational feasibility Means a proposed system will be used effectively after it has been developed
Pareto chart Vertical bar graph used for visualizing issues that need attention

23
preliminary investigation
Investigation done to study the systems request and recommend specific action
project creep Process where scope expands gradually without specific authorization
project scope Specific boundaries, or extent, of the project
scatter diagram Another term for an XY chart
schedule feasibility Means that a project can be implemented in an acceptable time frame
strategic planning The process of identifying long-term organizational goals, strategies, and resources
SWOT analysis A management review that looks at strengths, weaknesses, opportunities, and threats
systems request Formal way of asking for IT support
systems review committee
Another term for computer resources committee
tangible benefits Benefits that can be measured in dollars
technical feasibility Refers to technical resources needed to develop, purchase, install, or operate the system
total cost of ownership Costs of the system, including ongoing support and maintenance costs
XY chart Shows correlation between two variables

24
Table of Contents
OVERVIEW ................................................................................................................................................... 25
System analysis Activities........................................................................................................................ 25
System analysis skills ............................................................................................................................... 25
Team-Based techniques = JAD, RAD, Agile Methods. ................................................................................. 26
JAD – Joint Application Development ..................................................................................................... 26
Participants and roles: ........................................................................................................................ 26
RAD – Rapid Application Development .................................................................................................. 26
RAD phases and Activities: .................................................................................................................. 27
Objectives: .............................................................................................................................................. 27
Agile Methods ......................................................................................................................................... 28
Modeling Tools and Techniques ............................................................................................................. 28
System Requirements checklist .............................................................................................................. 29
Future Growth, Costs and benefits ......................................................................................................... 30
Fact-Finding ............................................................................................................................................. 30
Zachman International ........................................................................................................................ 30
Interviews................................................................................................................................................ 31
Other Fact-Finding Techniques ............................................................................................................... 32
Documentation ....................................................................................................................................... 33
Glossary ....................................................................................................................................................... 34

25
CHAPTER 4 – DETERMINING REQUIREMENTS
OVERVIEW
Overall objective is to understand proposed project, ensure that it will support business requirements
and build solid foundation for system development.
System analysis Activities
Interaction between 3 x modeling.
Requirements modeling
Fact-finding to describe current system and requirement for new… outputs, inputs, processes,
performance and security.
Data and process modeling
presentations graphical system data and structured analysis, data flowing into a process,
business rules and output data flow.
Object modeling
combines data and processes into objects, represent actual people, things, transactions and
events that affect the system.
Development strategies
Consider various Dev options and prepare for transition to systems design phase. Deliverable =
system requirements document.
System analysis skills
Analytical skills enable to identify problem, evaluate elements and develop solution.
Interpersonal skills working with people at all organizational levels.

26
Team-Based techniques = JAD, RAD, Agile Methods.
JAD – Joint Application Development
Users have vital stake in IS and participate fully in Dev process. Users meet at off-site location for period
of time to be insulated from the distraction of day-to-day operations. Analyse existing system, obtain
user input and expectations and document user requirements. Normally have project leader.
Participants and roles:
JAD Participant Role
JAD project leader Develop agenda, facilitator and leads
Top Management Provides enterprise-level auth and support for project
Managers Provide department-level support for project and understanding of how project must support business functions and requirements
Users Operational-level input on current operations, desired changes, input and output requirements, user interface issues
Systems analysts and other IT staff members
Provide technical assistance, security, backup, HW, SW and network capacity.
Recorder Documents results and work to build system models and develop CASE tool documentation.
Advantages:
Key-users participate effectively and then feel greater sense of ownership in results and support for new
system. Accurate statement of requirements and better understanding of goals.
Disadvantages:
Expensive and cumbersome if group is too large.
RAD – Rapid Application Development
Team-based technique, end product is new info system. Rad is complete methodology with 4-phase life
cycle. Used to reduce cost and dev time. Relies on prototyping and user involvement.

27
RAD phases and Activities:
Requirement Planning
Users, managers and IT staff discuss and agree on needs/scope/constraints and requirements,
obtains management auth and continue.
User design
Build models and prototypes
Conduct intensive JAD-type sessions.
Construction
Program and app dev
Coding
Unit, integration and system testing
Cutover
Data conversion
Full-scale testing
System changeover
User training
Objectives:
Cut dev time and expense. Continuous process.
Advantages:
Quickly with cost saving
Disadvantages:
Stresses mechanics of system itself and doesn’t emphasize company’s strategic business needs.
Accelerated time cycle allow less time for quality, consistency and design standards.

28
Agile Methods
Incremental development by building series of prototypes and constantly adjusting them to user
requirements.
Scrum is another agile approach. (team members to lunge at each other to achieve their objectives).
Mental intense interaction. Scrum sessions have specific guidelines that emphasize time blocks,
interaction and team-based activities (pic and chicken (ham and egg restaurant)).
Advantages:
Flexible and efficient in dealing with change. Reflect a set of community-based values. Frequent
deliverable constantly validate project and reduce risk.
Disadvantages:
Team member require high level of technical and interpersonal skills. Lack of structure and
documentation can introduce risk factors. Subject to significant change in scope as user requirements
continue to evolve during the project.
Modeling Tools and Techniques
Help understand design of a system. www.cengagebrain.com navigate to Video Learning Sessions and
look at FDD modelling.
Following is used by analysts building models after fact-finding, studying them and determine whether
more fact finding is required:
Functional decomposition Diagram
Top-down representation of function or process by breaking them down into lower-level functions and
processes. Is like drawing an organization chart. These processes translate into program modules during
application development.
Business Process Modeling
Describes one or more business process. Filling a product order, updating cus account. Analysts often
create models using a standard language business process modeling notation (BPMN) which includes
various shapes and symbols to present events, processes and workflows. CASE tools can be used. Overall
diagram is called a pool and designated customer areas are called swim lanes.
ADVANGATE: faster results, fewer errors and reduced cost.
Data Flow Diagrams
Show how system stores, processes and transforms data.

29
Unified Modeling Language (UML)
Visualizing and documenting software systems design. Object-oriented design concepts. Various
graphical tools to represent information system from a user’s viewpoint.
Case Diagrams
Visually represents interaction between users and information system. User becomes an actor with
specific role describing how he interacts with system.
Sequence Diagrams
Shows timing of interactions between objects as they occur. Systems analyst might use sequence
diagrams to show all possible outcomes or focus on single scenario.
System Requirements checklist
System requirement is a characteristic or feature that must be included in an info system to satisfy
business requirements and be acceptable to users. Serve as benchmarks to measure overall
acceptability of finished system.
5 General categories:
Outputs
Invent system produce daily report with SOH etc.
Contact Management system generate daily reminder list for all reps.
Cus analysis system produce quarterly reports comparing to previous quarters.
Inputs
Manufacturing employees swipe ID cards in online data collection terminals recording labor
costs etc.
Each input form must include certain info (forced)
Data entry screens must be in uniform.
Processes
HR system interface properly with existing payroll system
prescription system must automatically generate insurance claim form
Video rental system must not execute new rental transaction for cus who have overdue videos.
Performance
System must support 25 user online simultaneously
Response time
Operational 7 days a week

30
Controls
Employee record only editable by HR member
Transactions must have audit trails
Must not exceed credit limit.
Future Growth, Costs and benefits
Must consider Scalability (how system will handle future growth and demands) and Total Cost of
Ownership (includes all future operational and support costs).
Microsoft have method for measuring total costs and benefits called Rapid Economic Justification (REJ).
Fact-Finding
First determine info needed. Ask questions like:
- What business functions are supported by current system
- What strategic objectives and business requirements must be supported by new system?
- What are the benefits and TCO of proposed system
- What transaction will the system process?
- What info needed by users?
- Must system interface with legacy systems?
- What security issues exist?
To get these answers must have Fact-Finding Plan. (who, what, where, when, how and then more
importantly, WHY?) or more structured as the Zachman Framework.
Difference between asking what IS being done and what COULD or SHOULD be done.
Who does this? (current system)
Why does this person do it? (current system)
Who should do it? (future system)
Zachman International
Model asking traditional fact-finding questions in system development context. Viewing project from
different perspectives.

31
Interviews
Important fact-finding tool. Planned meeting during which you obtain information from another person.
7 Steps of an Interview:
Determine people
Right people. During analysis phase speak to people in all levels of organization. In an informal
structure some people have more influence or knowledge than appears on organization’s chart.
Your knowledge about formal and informal structures helps determining correct people to
interview. Group interviews saves time but foresee problems as well.
Establish objectives for interview
Determine general areas to be discussed and list facts you want to gather. Try to solicit ideas,
suggestions and opinions during interview.
Develop interview questions
Helps keep track, standard list allows to compare answers from people in same roles. (avoid
leading questions suggesting or favor a particular reply). Interview should include different kind
of Questions:
Open-ended: Encourage spontaneous and unstructured responses. Determine opinions,
attitudes etc. What are users saying about the new system? Is there anything else you can tell
me about this topic?
Closed-ended: limit or restrict the response. When you want specific info to verify facts. Do you
review the reports before they are sent out? How many of hours does a clerk receive?
Range-of-Response: Closed-ended when asking person to evaluate something by providing
limited answers to specific responses or on a numeric scale. On a scale of 1-to-10 how effective
was your training? Low, medium or high etc.
Prepare for the interview
Meeting request, keep managers informed when meeting with their staff, follow up the day
prior. Send list of topic days before especially when detailed information is needed so person
can prepare. Ask interviewer to have docs available if you have questions about them. Decide on
location.

32
Conduct the interview
Introduce yourself, describe project and explain objectives. Ask questions in order you have
prepared them and give interview enough time to answer. Establish good rapport. Concentrate
on what is said and notice any nonverbal communication that takes placed, called engaged
listening. Summarize main points covered and explain next course of action. Thank the person
and encourage him to contact you with questions or additional comments. Ask whether they
can suggest additional topics for discussion.
Document the interview
Note taking is acceptable but should be kept to a minimum. Distracts other person. Record info
quickly after interview so don’t schedule back-to-back interviews.
Evaluate the interview
try to identify any possible biases. Might try to protect their own area or function and give
incomplete answers or they might distort facts.
Structured brainstorming small group of people and take turn to speak
Unstructured brainstorming anyone can speak at any time.
Other Fact-Finding Techniques
Document Review
but documents can sometimes be outdated. Obtain docs and forms currently in use.
Observation
of current operating procedures. Allows to verify statements made in interviews about how they
really operate. Plan in advance with checklist of specific tasks you want to observe and
questions you want to ask.
- Ask sufficient questions, identify methods of handling situations that are not covered by
standard operating procedures.
- Observe all steps in a transaction and note documents, inputs, outputs and processes involved.
- Examine each form, record and report
- Consider each user working in the system. What they do, info they receive and from whom,
how regularly interrupted.
- Talk to people who receive reports and whether it discloses sufficient information.
Hawthrone Effect: productivity improved during observation whether conditions were made
better or worse.

33
Questionnaires and Surveys
Where need input from large amount of people. Must contain heading with general instruction.
- Keep it user-friendly
- Provide clear instructions
- Logical order, simple to complex
- simple terms and wording
- Limit open-ended questions
- Include section for general comments.
- Test on small group of people before distributing it to a large group
Sampling
Collecting examples of actual documents.
Example: 200 people have error on statement, you want to speak to 20:
Systematic sample: every 10th customer would be selected.
Stratified sample: select 5 from each of the 4 different zip codes.
Random sample: and 20 customers.
Must be fair representation.
Research
Internet, magazines, seminars…
Documentation
Keeping accurate records of interviews, facts, ideas and observations is essential.
Record info as soon as received
Use simplest recording method
Record finding that other can understand it
Organize documentation so related material is located easily.
Personal Information Managers to track of meeting interviews (PDA’s)
The systems analysis phase includes 3 activities:
- requirement modeling
- Data and process modeling
- Consideration of development strategies.

34
Glossary
4G (fourth generation) The latest wireless standard
actor The user in a use case diagram, having a specific role that describes how he or she interacts with the system
analytical skills Skills used to identify a problem, evaluate the key elements, and develop a useful solution
brainstorming Small group discussion of a specific problem, opportunity, or issue
business process model Describes one or more business processes
closed-ended questions Questions that limit or restrict the response
construction phase Focuses on program and application development tasks similar to the SDLC
cutover phase Resembles the final tasks in the SDLC implementation phase
engaged listening Concentrating on what is said and noticing any nonverbal communication that takes place
functional decomposition diagram
Top-down representation of a function or process
Hawthorne Effect Productivity improves whenever workers know they are being observed
histogram Vertical bar chart showing the distribution of questionnaire or sampling results
informal structure Some people have more influence or knowledge than appears on an organizational chart
inputs Necessary data that enters the system, either manually or in an automated manner
interpersonal skills Skills used to work with people at all organizational levels, balance conflicting needs of users, and communicate effectively
interview Planned meeting during which you obtain information from another person
mobile device platform Operating system for wireless devices
observation Seeing the current system in action to give additional perspective and a better understanding of system procedure
open-ended questions Questions that encourage spontaneous and unstructured responses
outputs Electronic or printed information produced by the system
performance Refers to system characteristics such as speed, volume, capacity, availability, and reliability
personal digital assistants (PDAs)
Hand-held computers that can handle calendars, schedules, appointments, telephone lists, and calculations
personal information manager (PIM)
Program to keep track of meetings, interviews, appointments, and deadlines
pool The overall diagram, using BPMN terminology
processes The logical rules that are applied to transform the data into meaningful information
productivity software Includes word processing, spreadsheet, database management, presentation graphics, and collaborative software programs
questionnaire Document containing a number of standard questions that can be sent to many individuals
random sample A sample selecting any customers
range-of-response questions
Closed-ended questions that ask the person to evaluate something providing limited answers to specific responses

35
rapid application development
A team-based technique that speeds up information systems development and produces a functioniong information system
Rapid Economic Justification
Microsoft framework to help IT professionals analyze and optimize IT investments
requirements planning phase
Combines elements of the systems planning and analysis phases of the SDLC
sampling Collecting examples of actual documents when studying an information system
scalability Refers to a system's ability to handle increased business volume and transactions in the future
scrum Agile method that involves intense interaction
security Hardware, software, and procedural controls that safeguard and protect the system and its data from internal or external threats
sequence diagram Shows the timing of interactions between objects as they occur
site visit Observing a system in use at another location
smart phone Merger of various technologies resulting from the rapid growth of wireless communications, eg, the Apple iPhone
stratified sample A sample broken into categories
survey Another term for questionnaire
swim lanes Designated customer areas, using BPMN terminology
system requirement Characteristic or feature that must be included in an information system to satisfy business requirements and be acceptable to users
system requirements document
End product of systems analysis phase; An overall design for the new system
systematic sample A sample where every 10th person is chosen, for example
Unified Modeling Language
Widely used method of visualizing and documenting software systems design
unstructured brainstorming
Brainstorming where anyone can speak at any time
use case diagram Visually represents the interaction between users and the information system
user design phase Users interact with systems analysts to develop models and prototypes that represent all system processes, outputs, and inputs
Zachman Framework for Enterprise Architecture
Model that asks the traditional fact-finding questions in a systems development context

36
Table of Contents
Data and process Modeling Tools ............................................................................................................... 38
DFD Symbols: ...................................................................................................................................... 38
Process Symbol: .................................................................................................................................. 39
Data Flow Symbol: .............................................................................................................................. 39
Data Store Symbol: ............................................................................................................................. 39
Entity Symbol ...................................................................................................................................... 40
Guidelines for drawing DFD’s: .................................................................................................................... 40
Steps to follow: ....................................................................................................................................... 40
Step 1: Draw Context Diagram ............................................................................................................ 40
Step 2: Draw a Diagram 0 DFD ............................................................................................................ 40
Step 3: Draw lower-level Diagrams ..................................................................................................... 41
Data Dictionary ........................................................................................................................................... 42
Documenting Data .................................................................................................................................. 42
Documenting Data Elements: ............................................................................................................. 42
Documenting Data Flows: ................................................................................................................... 43
Documenting Data Stores: .................................................................................................................. 43
Documenting Processes: ..................................................................................................................... 43
Documenting Entities .......................................................................................................................... 44
Documenting Records ......................................................................................................................... 44
Data Dictionary Reports ...................................................................................................................... 44
Process Description Tools ........................................................................................................................... 45
Modular Design ....................................................................................................................................... 45
Structured English ................................................................................................................................... 46
Decision Tables ....................................................................................................................................... 46
Table with 1 condition ........................................................................................................................ 46
Table with 2 conditions (page 223 in text book) ................................................................................ 47
Table with 3 conditions ....................................................................................................................... 47
Multiple Outcomes ............................................................................................................................. 48
Decision Trees ......................................................................................................................................... 48
Logical Versus Physical Models ................................................................................................................... 48

37
Four-Model Approach ............................................................................................................................. 48
Glossary ....................................................................................................................................................... 49

38
PHASE 2 – DATA AND PROCESS ANALYSIS
Data and process Modeling Tools
Graphical techniques to describe an IS, Popular Method is the DFD:
DFD’s (DATA FLOW DIAGRAMS)
Shows how data moves through an IS but does not show program logic or processing steps. Set of DFD’s
provides logical model that shows what system does and how.
DFD Symbols:
4 Basic symbols:
Processes
Data flows
Data stores
Entities
Popular symbol sets is Gane and Sarson and Yourdan, Symbols are reference by usingall capital letters:

39
Process Symbol:
Receives input data and produces output that has different content, form or both.
Example = Calculating Pay (receive Hours and Rate, produces Total)
Processes contain the business logic also called business rules that transforms data and produce the
required results.
Process identifies specific function, name is a verb (and sometime adjective) followed by singular noun
and appears in the symbol in CAPITALS (Calculate commission, verify order).
In DFD can be referred to as a BLACK BOX because inputs, outputs and general functions of process are
known but underlying details and logic are hidden. This avoids unnecessary detail and clutter. Can zoom
in on process if more detail is required.
Data Flow Symbol:
Path for data to move from one part of IS to another. Can be single data item (Student ID) or set of data
(roster with all ID’s, names etc.)
Names: (Deposit, Student Grade, Order, Grading).
Process changes data/form, always data flowing in and data flowing out!
one in and out, one in and 2 out, 2 in and 1 out etc…
Incorrect:
both out or both in and if input doesn’t make sense with output received.
Spontaneous generation produces output but has no input data flow
Black hole process that has input but produces no output
Gray hole process that has at least one input and output but the input is insufficient to generate
outcome shown.
Data Store Symbol:
Data stored because one or more process need to use the data at a later time.
Plural name (noun and adjectives), examples: Students, Products, Accounts Receivable, policies.
Each Data store has at least one in and one outflow of data connected to a process.
Tax Table is example where there will be no input because contains fixed reference data not updated by
system.

40
Entity Symbol
Shows only external entities that provide data or receive output. (shows boundaries of system).
(Customer, Patient, Bank).
DFD entities also called terminators because they are data origins or final destinations.
Source = Entity supplying data
Sink = Entity receiving data
Must be connected to a process!
Guidelines for drawing DFD’s:
Fit to one page
Use name of IS as process name in context diagram (Process same as system name) Grading
System. For processes at a lower level you would use verb followed by descriptive noun
(Establish Gradebook)
Unique names within each set of symbols
Don’t cross lines (no more than 9 process symbols) can make duplicate but make note not to
confuse!
Unique name and reference for each Process. Highest level contains process 0, represent entire
IS but not internal workings. Create DFD named Diagram 0 which will show additional process
which will be named and numbered as you do lower-level DFD’s
Obtain as much user input and feedback as possible. Model should be accurate, easy to
understand and meet needs of users.
Steps to follow:
Step 1: Draw Context Diagram
Top-level view of an IS showing system’s boundaries and scope. Single process symbol in middle of page
and number it “0” This represent entire IS system (Black box). Then place entities and connect with data
flow symbols. Data stores not shown yet.
Step 2: Draw a Diagram 0 DFD
To show detail of “0” Black box. Zooms in on system and shows major internal processes, data flows and
data stores. It repeats the entities and data flows in the context diagram, retain all connections that flow
into and of process 0.

41
Sub-processes labelled 1, 2… (Establish gradebook 1), (Assign final grade 2) etc.
These numbers are important as they identity a series of DFDs. Doesn’t resemble sequential order.
A diverging data flow is dataflow in which the same data travels to two or more different locations.
When you explode a DFD the higher-level diagram is called the parent diagram and the lower-level
diagram the child diagram.
When creating a set of DFDs you break the processing logic down into smaller units called functional
primitives (process that consists of single function that is not exploded further which programmers will
use to develop code). Document logic for functional primitive by writing process description in data
dictionary.
Step 3: Draw lower-level Diagrams
When drawing lower-level Diagrams leveling and balancing must be used.
Leveling:
Process of drawing a series of increasingly detailed diagrams until all functional primitives are identified.
Analyst starts with overall view (Context Diagram), then created Diagram 0 which shows more detail,
then continues to create lower-level DFD’s until all processes are identified as functional primitives
which represent single processing functions. Also called: exploding, partitioning or decomposing.
Processes are numbered using a decimal notation consisting of parent’s reference number: 1.1, 1.2,
when 1.2 is decomposed further it would be 1.2.1 and 1.2.2 and so forth making it easy to integrate and
identify all DFD’s.
Balancing:
Maintains consistency among a set of DFDs by ensuring the input and output data flows align properly.
Makes sure input and output data flows of the parent are maintained on the child DFD.
Example: Child still have 2 inputs and 3 outputs after exploded.

42
Data Dictionary
Detail within DFD’s are documented separately in data dictionary which is the second component of
structured analysis. A Data Dictionary or Data repository is a central storehouse of information about
the system’s data. Used to collect, document and organize specific facts about the system, incl contents
of data flows, data stores, entities and processes.
Defines and describes all data elements and meaningful combinations of data elements (data item or
field which is smallest piece of data that has meaning within an IS)
Example: Balance, Company name…
Record is meaningful combination of related data elements. (relationships)
Serves as a central storehouse of documentation for an IS
Documenting Data
Provide clear, comprehensive information about the data and processes making up the system.
Documenting Data Elements:
Data element name or label
standard name which should be meaningful to users.
Alias
Any name other than standard data element name
Type and length
numeric, alphabetic and max number of characters.
Default Value
Default value if not inserted. COD Terms
Acceptable Values
Set of values permitted. Specifically listed or referenced in a table or from range of values. Can
have validity rules.
Source can be specific form, department or outside organization
Security Identification for certain users only to be able to update data
Responsible users ID of user(s) responsible for entering or changing values of element.
Description and comments Additional notes.

43
Documenting Data Flows:
Data flow name/label
Description
Describe flow and purpose
Alternate name(s)
Aliases
Origin
beginning or source (process, data store or entity)
Destination
Ending point(s) (process, data store or entity)
Record
represents group of related data
Volume and frequency
expected number of occurrences for data flow per unit of time.
Description and comments Additional notes.
Documenting Data Stores:
Name/label
Description
Describe store and purpose
Alias
Attributes
Standard DFD names that enter or leave the data store
Volume and frequency
estimated number of records in data store and how frequently updated.
Documenting Processes:
Name/label
Description
Brief statement of purpose
Process number
reference number identifying process and indicates relationships among various levels in the
system.
Process description
input and output data flows. For functional primitives the process description also documents
the processing steps and business logic.

44
Documenting Entities
Name
Description
Entity and its purpose
Alias
Input data flows
input data flows to entity
Output data flows
Output data flows leaving the entity
Documenting Records
Record or data structure name
Record name as it appears in related data flow and data store entries in data dictionary
Definition and description
Brief definition
Alias
Attributes
list of all data elements included in record, Data element names must match exactly what you
entered in data dictionary,.
Data Dictionary Reports
List element alphabetically by name
Report describing each element and indicating the user or department that is responsible for
data entry, updating or deletion
Report of all data flows and data stores that use a particular data element
Detailed reports showing all characteristics of elements, records, data flows, processes or any
other selected item stored in Data dictionary.

45
Process Description Tools
A Process description documents detail of functional primitives and represents a specific set of
processing steps and business logic.
Process Description Tools:
Structured English
Decision tables
Decision trees
Modular Design
When analyzing functional primitive, break processing steps down into smaller units called modular
design. Modular Design based on combinations of logical structures (control structures) serving as
building blocks for process. Each structure have a single entry and exit point.
Rectangle = step or process
Diamond = condition or decision
Sequence completion of steps in sequential order… one after another.
Selection completion of one of two or more process steps based on results of test or condition.
Iteration completion of process step that is repeated until specific condition changes (looping)

46
Structured English
Subset of standard English describing logical processes clearly and accurately. Following rules apply:
Use only the 3 building block of sequence, selection and iteration.
Use indentation for readability
Use limited vocabulary, including standard terms used in data dictionary and specific words
describing processing rules.
Represents pseudocode used in program design.
Primary purpose to describe underlying business logic. Must be understandable to users who must
confirm that process is correct as well as other analysts and programmers.
Example:
Label: Verify order
Description: Accept or reject customer order based on credit status and product availability
Entry Type: Process
Process Description:
Input data flows: ORDER, CREDIT STATUS PRODUCT DETAIL
Output data flows: REJECTED ORDER, ACCEPTED ORDER
For each ORDER
If CUSTOMER STATUS CODE = Y and if PRODUCT DETAIL = OK
Output ACCEPTED ORDER
Else
Output REJECTED ORDER
Decision Tables
Logical structure showing combination of conditions and outcomes.
Table with 1 condition
Only 2 possibilities = Yes or No (Condition available OR not).

47
Table with 2 conditions
(page 223 in text book)
Process description contains 2 conditions: Product in stock and customer credit status. Both must be
met for order to be accepted OR gets rejected. (number of rules double each time you add another
condition)
Step 1 Place name of process in a heading at the top
Step 2 Enter conditions under heading with one condition per line
Step 3 Enter all potential combinations of Y/N each column shows numbered possibility called a rule.
Step 4 Place an X in action entries for each rule to indicate where to accept or reject:
Table with 3 conditions
No there will be 8th possible rule.
Regardless of number of conditions, each numbered column or rule represents a different set of
conditions. Analyze the logic carefully and show outcome for each rule. (below ones should be X)
When all outcomes determined you can simplify table in multi-condition table, some rules might be
duplicated, redundant or unrealistic, Simply by following these steps:
Step 1 Study each combination of conditions and outcomes. Only one or 2 may control outcome
Step 2 Identify conditions not affecting outcome, mark with dashes (-)
Step 3 Combine and renumber rules
Shown on Page 228 in Text Book.

48
Multiple Outcomes
See example on page 228 of text book, very simple.
Decision table are best way to describe complex set of conditions and easy for programmers to work
from when developing code.
Decision Trees
Graphical representation of conditions, actions and rules found in a decision table. Logic structure in
horizontal form.
Also see example on page 230
Logical Versus Physical Models
Structured analysis tools used to develop logical model for NEW IS, can use to develop physical models
of IS. Physical model shows how system’s requirements are implemented. Create physical model of
NEW IS that follows from logical model and involves operational tasks and techniques.
Four-Model Approach Develop physical model of current system…
then Logic model of current system
then Logic model of New system
and lastly physical model of New system.
Benefit: give clear picture of current system functions before you make modifications or improvements.
Disadvantage: added time and cost needed to develop physical and logical model of current system.

49
Glossary
alias Any name other than the standard data element name
balancing Maintains consistency among a set of DFDs by ensuring that input and output data flows align properly
black box A process symbol in a DFD
black hole A process that receives input, but produces no output
business rules Another term for business logic
child diagram Lower-level diagram in exploded DFD
context diagram Top-level view of an information system that shows the system's boundaries and scope
control structures Another term for logical structures
data element Smallest piece of data that has meaning within an information system
data flow A path for data to move from one part of the information system to another
data flow diagram Uses various symbols to show how the system transforms input data into useful information
data item Another term for data element
data repository Another term for data dictionary
data store Symbol used in a DFD to represent data that the system stores for later use
data structure Another term for record
decision table Logical structure that shows every combination of conditions and outcomes
decision tree Graphical representation of the conditions, actions, and rules found in a decision table
decomposing Another term for leveling
diagram 0 Zooms in on the system to show major internal processes, data flows, and data stores
diverging data flow Data flow in which the same data travels to two or more different locations
domain Set of values permitted for the data element
entity Rectangle, which may be shaded to make it look three-dimensional, used to represent an external entity in a DFD
exploding Another term for leveling
four-model approach Developing physical and logical models of both the current system and the new system
functional primitive Process that consists of a single function that is not exploded further
Gane and Sarson Symbol set used in DFDs; used in the textbook DFD examples
gray hole A process that has at least one input and one output, but the input obviously is insufficient to generate the output shown
iteration Completion of a process step that is repeated until a specific condition changes
length Maximum number of characters or digits for a data element
leveling The process of drawing a series of increasingly detailed diagrams, until all functional primitives are identified
logical model Shows what the system must do, regardless of how it will be implemented physically
logical structures Serve as the building blocks for the process: sequence, selection, and iteration
looping Another term for iteration
modular design Based on combinations of three logical structures

50
parent diagram Higher-level diagram in an exploded DFD
partitioning Another term for leveling
physical model Describes how the system will be constructed
process Receives input data and produces output that has a different content, form, or both
process 0 The starting process symbol in a context diagram that represents the entire information system
pseudocode Used as a shorthand notation for the actual code
record Meaningful combination of related data elements that is included in a data flow or retained in a data store
selection Completion of one of two or more process steps based on the results of a test or condition
sequence Completion of steps in a sequential order, one after another
source Entity that supplies data to the system
spontaneous generation
A process that produces output, but has no input data flow
structured English Subset of standard English that describes logical processes clearly and accurately
terminators Another name for DFD entities, because they are data origins or final destinations
type Refers to whether the data element contains numeric, alphabetic, or character values
validity rules Additional rules that may define a data element's domain
Yourdon Symbol set used in DFDs

51
Table of Contents
OVERVIEW ................................................................................................................................................... 53
Impact of the internet ................................................................................................................................. 53
Software as a service .............................................................................................................................. 53
Traditional vs Web-Based Systems Development .................................................................................. 53
Web 2.0 and Cloud Computing ........................................................................................................... 54
Outsourcing ................................................................................................................................................. 54
Growth of Outsourcing ........................................................................................................................... 54
App Service Provider (ASP) ................................................................................................................. 54
Internet Business Service (IBS) – managed hosting ............................................................................ 54
Outsourcing Fees .................................................................................................................................... 55
Outsourcing Issues and concerns............................................................................................................ 55
Offshore Outsourcing .............................................................................................................................. 55
In-House Software Development................................................................................................................ 55
Comparison/Reasons choosing between In-House and buying: ............................................................ 56
Customizing Software Package ............................................................................................................... 56
Creating User Applications .......................................................................................................................... 56
Role of Systems Analyst .............................................................................................................................. 57
Analyzing Cost and Benefits .................................................................................................................... 57
Financial Analysis Tools ....................................................................................................................... 57
Cost-Benefit Analysis Checklist ........................................................................................................... 57
Software acquisition Process ...................................................................................................................... 57
Step 1: Evaluate IS Requirements ........................................................................................................... 57
Step 2: Identify Potential Vendors or Outsourcing Options ................................................................... 58
Step 3: Evaluate the Alternatives ............................................................................................................ 58
Step 4: Perform Cost-Benefit Analysis .................................................................................................... 59
Step 5: Prepare a Recommendation ....................................................................................................... 59
Step 6: Implement the Solution .............................................................................................................. 59
Completion of System Analysis Tasks ......................................................................................................... 59
System Requirement Document ............................................................................................................. 59
Presentation to Management ................................................................................................................. 59

52
Management will choose one of 5 alternatives: ................................................................................ 60
Transition to Systems Design ...................................................................................................................... 60
System Design Guidelines ........................................................................................................................... 60
User Considerations ................................................................................................................................ 61
Data Considerations ................................................................................................................................ 61
Architecture considerations .................................................................................................................... 62
Design Trade-Offs ................................................................................................................................... 62
Prototyping ............................................................................................................................................. 62
Prototyping Methods .......................................................................................................................... 62
Prototyping Tools ................................................................................................................................ 62
Limitations of Prototypes .................................................................................................................... 62
Glossary ....................................................................................................................................................... 63

53
PHASE 2 – OPTIONS FOR DEVELOPMENT
OVERVIEW
Review of internet’s impact, software outsourcing options, and in-house software development
alternatives.
Impact of the internet Internet’s impact and how it compares to traditional methods:
Software as a service Traditional model, software vendors develop and sell application packages to customers and customers
purchase licenses for right to use them under terms of license agreement.
New model: SAAS – Software as a service deployment where app is hosted as service provided over the
internet. Reduce need for software maintenance, operation and support.
Traditional vs Web-Based Systems Development
TRADITIONAL DEVELOPMENT:
System design influenced by compatibility issues, incl existing hardware and software platforms
and legacy system requirements.
System designed to run local and WAN.
Systems often utilize Internet links and resources but Web-based features are treated as
enhancements rather than core elements of the design.
Follow one of 3 main paths:
- in-house
- purchase of SW with possible modification
- use of outside consultants.
Scalability effected by network limitations and constraints
Apps require substantial desktop computing power and resources
Security issues less complex than with Web-based systems, private company network.
WEB-BASED DEVELOPMENT:
Developed and delivered in an Internet-based framework .NET or WebSphere.
Web as platform rather than communication channel.
Easily scalable, run on multiple HW environments.

54
Large firms deploy Web-based systems as enterprise-wide software solutions for apps as CRM,
order processing and materials management.
Software apps as service so less dependent on desktop computing power and resources.
When as a Service rather than a Product, they purchase, can limit in-house involvement to a
minimum and have vendor install, configure and maintain system by paying agree-upon fees.
Requires additional layers called middleware to communicate with existing SW and legacy
systems.
Web 2.0 and Cloud Computing
Web 2.0
Second generation of the Web that will enable people to collaborate, interact and share info much more
effectively. Based on continuously available user apps rather than static HTML Web pages without
limitations regarding the number of users or how they will be able to access, modify and exchange date.
Enhance interactive experiences like wikis, blogs and social-net-working.
Cloud computing
Will offer overall online software and data environment supported by supercomputer technology.
Ultimate form of SaaS delivery service where users just need Internet connection and a browser.
Outsourcing
Transfer of IS development, operation or maintenance to an outside firm for a fee.
BPO (Business process outsourcing) outsourcing of basic business process.
Growth of Outsourcing Service provider offers outsourcing solutions. Two popular outsourcing options:
App Service Provider (ASP)
Delivers software app or access to an app by charging usage or subscription fee. Rents operation
package to customer, provide SW such as databases and accounting packages.
Internet Business Service (IBS) – managed hosting
Provides Web-based support for transaction such as order processing, billing and CRM.
Advantages:
- online data center support
- mainframe computing power
- Universal access via internet.

55
Outsourcing Fees
Several models exist:
Fixed fee
Set fee based on level of service and user support.
Subscription
Variable fee based on number of users or workstations
Usage or transaction
Variable fee based on volume of transactions or operations performed.
Outsourcing Issues and concerns
Effects firm’s resources, operations and profitability.
Sensitive information, trust to maintain security, confidentiality and quality.
Review insurance, potential liability, licensing and information ownership, warranties and disaster
recovery.
Offshore Outsourcing
Also known as Global outsourcing practice of shifting IT Dev, support and operations to other countries.
Concerns about project control, security, disparate cultures and effective communication with critical
functions.
In-House Software Development
Company develop own system, purchase, possibly customize and implement.
Important consideration = TCO
Make or Buy Decision
Choice between Dev and purchasing.
Software vendors are companies who develop software for sale.
VAR enhances commercial package by adding custom features and configuring it for particular industry.
Horizontal App software package can be used by different types of organizations.
Vertical App software package handle info requirements for specific type of business.

56
Comparison/Reasons choosing between In-House and buying:
In-House Purchasing
Satisfy unique business requirements Lower costs
Minimize changes in business procedures &policies Less time to implement
Meet constraints of existing systems Proven reliability and performance benchmarks
Meet constraints of existing technology Less technical Dev staff
Develop internal resources and capabilities Future upgrades provided by vendor
Satisfy unique security requirements Obtain input from other companies
Customizing Software Package
Can customize if needs aren’t met in 3 different ways:
Purchase basic package that vendors will customize to suit your needs. (add-ons)
Negotiate directly with software vendor to make enhancements to meet your needs an pay for
changes.
Purchase and make own modifications if permissible under terms of software license.
Disadvantages:
System analysts and programmers unfamiliar with SW
If customized, modified package costs more and longer to obtain
Issue with future support
Future upgrades might not be able to upgrade customized version
Creating User Applications
User App utilizes standard business software such as Excel which has been configured in specific manner
to enhance user productivity. Excel linked with system for quick calculations.
IT staff can create a user interface (includes screens, commands, controls and features) enabling user to
interact more effectively with App.
Main objective is to allow lower-level employees more access to data they require with no intervention
from IT department. Accomplished by creating effective user interfaces for company-wide apps such as
accounting, inventory and sales systems or customizing Word, Excel etc.
Help desk or Information center (IC) provide technical support in medium-sized companies.
Some apps have powerful screen generators and report generators allowing users to design own data
entry.

57
Role of Systems Analyst
Objective is to obtain product with lowest TCO but actual cost and performance can be difficult to
forecast. When selecting analysts work as an evaluation and selection team. Team approach ensure
critical factors aren’t overlooked and sound choice is made, must include users to participate and feel
ownership of new system.
Primary objective is to eliminate system alternatives not meeting requirements, rank alternatives that
are feasible and present viable alternatives to management for final decision.
Analyzing Cost and Benefits
Financial analysis tools and techniques applied to evaluate Dev strategies and decide hot project will
move forward. Accurate estimate of TCO is critical.
Financial Analysis Tools
Payback analysis determines how long it takes an IS to pay for itself through reduced costs and
increased benefits.
ROI (Return on Investment) percentage rate comparing total net benefits received from project to total
costs.
NPV Net present value total value of benefits minus total value of costs with both costs and benefits
adjusted to reflect point in time at which they occur.
Cost-Benefit Analysis Checklist
List each Dev strategy considered
Identify all costs & benefits, indicate when costs will be incurred and benefits realized
Consider future growth/scalability
Include support costs for HW and SW.
Analyze various SW licensing options, including fixed fees and formulas based on # users and
transactions.
Apply financial analysis tools to each options
Study results and prepare report to management
Software acquisition Process
Step 1: Evaluate IS Requirements
Identify Key Features
Clear, detailed list of features serving as an overall specification for the system.

58
Consider network and Web-related issues
run on a network, internet or intranet?
Estimate volume and future growth
Show estimates with current activity levels and two forecasts based on existing processing
procedures and another that assumes new site is operational.
Specify HW, SW or personnel constraints
Will it affect acquisition decision and investigate company’s policy regarding outsourcing IT
functions. Define in-house staffing requirements to Dev, acquire and implement and maintain
the system.
Prepare a request for Proposal or quotation
RFP (Request for Proposal) – Document describes company, lists IT services or products and
specifies features you require. Spells out service and support levels you require. Designate some
features as essential and others as desirable. Requires pricing and payment terms.
Can use evaluation model (technique uses common yardstick to measure and compare vendor
ratings).
RFQ (Request for Quotation) – More specific than RFP. Already know specific product or service
and need to obtain price or bids. Involves outright purchase or variety of leasing options and can
include maintenance or technical support terms.
Step 2: Identify Potential Vendors or Outsourcing Options
Through internet or work with consulting firm and can also use Internet bulletin board (system contains
thousands of forums called news groups), good place to share info and share ideas. Blogs, technical
chats, webcasts.
Step 3: Evaluate the Alternatives
Obtain info from as many sources possible. As part of evaluation process information must try and get
info from following sources:
Existing users
Application Testing (get users in organization to test product)
Benchmarking measures time package takes to process certain number of transaction and
measure other products against it.

59
Step 4: Perform Cost-Benefit Analysis
Calculate TCO for each option. Try to prepare charts to show results graphically and build “what if”
capability. Consider a supplemental maintenance agreement (offers additional support and assistance
from vendor).
Step 5: Prepare a Recommendation
Recommendation that evaluates and describes the alternatives together with costs, benefits,
advantages and disadvantages of each option.
Step 6: Implement the Solution
Tasks depend on solution selected. In-house more time and effort than outsourcing. Network
installations if needed. Before new SW becomes operational you must complete all implementation
stems including loading, configuring and testing the software, training and converting data files to the
new system’s format.
Completion of System Analysis Tasks
To complete Systems analysis phase must prepare the System requirements document and presentation
to management.
System Requirement Document
Contains requirements and describes alternatives considered with recommendation to management.
Starting point for measuring performance, accuracy and completeness.
Presentation to Management
End of systems analysis phase. System Requirement Document basis for presentations.
Brief overview of purpose and primary objectives and what decisions need to be made
Summarize primary viable alternatives (costs, pro’s and con’s)
Explain evaluation and selection team chose for alternative recommendation
Allow time for discussion Q & A’s
Obtain final decision or agree on timetable for next step.

60
Management will choose one of 5 alternatives:
Develop in-house
Begin system tasks described in next chapters.
If outsourcing chosen, work with representatives of service provider
Modify current system
Purchase or customize software package
Negotiate purchase terms, if no mode plan implementation phase otherwise Systems design
phase. If vendor makes mods start planning testing and documentation.
Perform additional systems analysis work
might be various requests, further investigation, create prototype… action and schedule new
follow-up presentation.
Stop all further work.
File research
Transition to Systems Design
Preparing for Systems Design – requires accurate documentation.
Logical and Physical Design
Logical – “WHAT” must take place, NOT “how”
Physical – like set of blueprints for actual construction of a building. Describe actual processes of
entering verifying and storing data.
System Design Guidelines
Step 1
Review system Requirements
Study carefully to understand logical design.
Step 2
Design system

61
User interface, output and input issues
Design user interface, screens, commands, controls and features. Input output forms etc.
Data issues
Determine how data will be organized, stored, maintained, updated, accessed and used.
System architecture issues
Determine processing strategies and methods, client/server interaction, network config and
internet/intranet interface issues.
Step 3
Create system design specification
Describe proposed design.
Step 4
Deliver management presentation
Include progress report, budget update and timetable.
Goal of system Design is for system to be:
Effective
Reliable
Maintainable
User Considerations
Consider any point where users receive output or provide input
Anticipate future needs
Provide flexibility
Parameter is a value that user enters whenever a query is run which provides flexibility and enable users
to access info easily.
Data Considerations
Enter data as soon as possible
Verify data as it is entered
Use automated methods of data entry whenever possible
Control data entry access and report all entries or changes to critical values.
Log every instance of data entry and changes.
Enter data once
Avoid data duplication

62
Architecture considerations
Use modular design
Design modules that perform a single function
Design Trade-Offs
Making system easier to use might need more complex programming requirements. Or making it more
flexible increase maintenance requirements. Meeting one makes it more difficult to satisfy another
user’s needs. Normally Quality versus costs.
Prototyping Produces early, rapidly constructed working version. Involves repetitive sequence of analysis, design,
modeling and testing. Users input essential at every stage.
Prototyping Methods
System Prototyping – produces full-featured working model of IS. System prototype is ready for
implementation in the SDLC.
Design Prototyping (throwaway prototyping) – objectives more limited, user-approved model. Makes it
possible to capture user input and approval while continuing to develop the system.
Benefits:
Users and systems developers can avoid misunderstandings
Developers can create accurate specifications for finished system based on prototype
Managers evaluate working model more effectively
Analysts can use to develop testing and training procedures
Reduces risk and potential financial exposure that occurs when finished system fails
Problems:
Rapid pace of Dev can create quality problems only discovered when system is fully operational.
Reliability and maintainability can’t be tested.
In complex systems prototype becomes unwieldy and difficult to manage.
Prototyping Tools
Mainly done in CASE.
4GL (fourth-generation language) commands tend to resemble natural statements that people use.
Limitations of Prototypes
Final version of system demands higher-level performance. Prototype model and not full system, slower
and might lack security.

63
SOA – Service-oriented architecture – Architectural style whose goal is to archive loose coupling among
interacting software objects that provide services.
Loose coupling – means that objects can interact but are essentially independent.
Glossary
.NET Microsoft Web-based development environment
application service provider (ASP)
Firm that delivers a software application, or access to an application, by charging a usage or subscription fee
audit trails Reports that trace the data entry and changes to critical data values
build or buy Another term for make or buy
business process outsourcing (BPO)
The outsourcing of a basic business process
cloud computing Refers to the cloud symbol that indicates a network, or the Internet
evaluation and selection team
Team that selects hardware and software
evaluation model Technique that uses a common yardstick to measure and compare vendor ratings
fourth-generation environment
Framework for rapid, efficient software development
fourth-generation language (4GL)
Commands tend to resemble natural statements that people use
global outsourcing Another term for offshore outsourcing
help desk Responsible for providing user support
horizontal application Software package that can be used by many different types of organizations
in-house software Software made, built, or developed by the company's IT department
information center (IC)
Another term for help desk
Internet business services (IBS)
Provide powerful web-based support for transactions such as order processing, billing, and customer relationship management
logical design Defines what must take place, not how it must take place
loose coupling Objects can interact, but are essentially independent
maintenance agreement
Offers additional support and assistance from the vendor
make or buy Choice between developing versus purchasing software
managed hosting Another term for IBS because system operations are managed by the outside firm, or host
net present value (NPV)
Total value of the benefits minus the total value of the costs of a project
newsgroup Forum that covers any imaginable topic
offshore outsourcing Practice of shifting IT development, support, and operations to other countries
outsourcing The transfer of information systems development, operation, or maintenance to an outside firm
payback analysis Determines how long it takes an information system to pay for itself through reduced costs

64
and increased benefits
physical design Describes the actual processes of entering, verifying, and storing data
prototype An early, rapidly constructed version of the proposed information system
prototyping Produces an early, rapidly constructed version of the proposed information system
report generator Allows users to design their own reports
request for proposal (RFP)
Document that describes your company, lists the IT services or products you need, and specifies the features you require
request for quotation (RFQ)
More specific than an RFP; Used to obtain price quotations or bids for a specific product or service
return on investment (ROI)
Percentage rate that compares the total net benefits received from a project to the total costs of the project
screen generator Allows users to design their own data entry forms
service provider Firm that offers outsourcing solutions
service-oriented architecture (SOA)
An architectural style whose goal is to achieve loose coupling among interfacing software objects that provide services
Software as a Service (Saas)
A model of software deployment where an application is hosted as a service provided over the Internet
software requirements specification
Another term for a systems requirements document
software vendors Companies that develop software for sale
subscription model Variable fee based on the number of users or workstations that have access to the application
system prototyping Produces a full-featured, working model of the information system
system requirements document
Contains the requirements for the new system, describes the alternatives considered, and makes a specific recommendation
systems design Has as its goal to build a system that satisfies business requirements
transaction model Another term for a usage model
user application Utilizes standard business software, which has been configured in a specific manner to enhance user productivity
value-added reseller (VAR)
Firm that enhances a commercial package by adding custom features and configuring it for a particular industry
vertical application Software package developed to handle information requirements for a specific type of business
Web 2.0 A second generation of the Web that will enable people to collaborate, interact, and share information much more effectively
WebSphere IBM Web-based development environment
Y2K issue When some older programs that used only two characters to store the year might not adjust properly to the new century

65
Table of Contents
OVERVIEW ................................................................................................................................................... 67
Evolution of UI ........................................................................................................................................ 67
HCI ........................................................................................................................................................... 67
User Rights .............................................................................................................................................. 67
7 Principles of User-Centered Design ..................................................................................................... 68
1. Understand Business................................................................................................................... 68
2. Maximize Graphical Effectiveness .............................................................................................. 68
3. Think like a User .......................................................................................................................... 68
4. Use Modes and Prototypes ......................................................................................................... 68
5. Focus on Usability ....................................................................................................................... 68
6. Invite Feedback ........................................................................................................................... 68
7. Document everything ................................................................................................................. 68
Designing UI ................................................................................................................................................ 68
1. Transparent Interface ................................................................................................................. 68
2. Easy to learn and use .................................................................................................................. 69
3. Enhance Productivity .................................................................................................................. 69
4. Easy for Users to obtain help or correct errors .......................................................................... 69
5. Minimize input data problems .................................................................................................... 69
6. Provide feedback to users ........................................................................................................... 69
7. Attractive layout and design ....................................................................................................... 70
8. Familiar terms and images .......................................................................................................... 70
Control Features ..................................................................................................................................... 70
Output Design ............................................................................................................................................. 71
Report Design .......................................................................................................................................... 71
Detail Reports ..................................................................................................................................... 71
Exception Reports ............................................................................................................................... 71
Summary Reports ................................................................................................................................ 71
User Involvement in Report Design ........................................................................................................ 71
Report Design Principles ......................................................................................................................... 71
Design Features: .................................................................................................................................. 71

66
Output Technology Types ....................................................................................................................... 72
Input Design ................................................................................................................................................ 73
Source Documents and Forms ................................................................................................................ 73
Data Entry Screens .................................................................................................................................. 74
Guidelines to design data entry screens: ............................................................................................ 74
Input Masks ............................................................................................................................................. 74
Validation Rules ...................................................................................................................................... 75
Input Technology .................................................................................................................................... 76
Input Volume reduction ...................................................................................................................... 76
Security and Control issues ......................................................................................................................... 77
Output Security and Control ................................................................................................................... 77
Input Security and Control ...................................................................................................................... 77
Glossary ....................................................................................................................................................... 78

67
PHASE 3 – Designing the Interface
OVERVIEW
UI (User Interface) – describes how users interact with a computer system (all HW, SW, screens, menus,
functions, output and features that effect two-way communications between user and computer.
Evolution of UI
UI manly consisted of process-control screens that allowed user to send commands to the system, this
changed to a more user-centered systems. In user-centered system, distinction blurs between input,
output and the interface itself.
HCI
HCI describes relationship between computers and people who use them to perform their jobs. It
includes all communications and instructions necessary to enter input in to system and obtain output.
GUI (Graphical User Interface) – using icons, graphical objects and pointing devices.
User Rights
IBM’s usability expert DR. Clare-Marie Karat notes that “in this new computer age, the customer is not
only right, the customer has rights” as listed below:
Perspective – User right, if there is a problem, the system is the problem, not the user.
Installation – User has right to install and uninstall SW and HW easily without negative
consequences.
Compliance – System to perform exactly as promised.
Instruction – Easy-to-use instructions
Control – Right to be in control and get system to respond quick.
Feedback – System to provide clear, understandable and accurate info.
Dependencies – Right to be informed clearly about systems requirements
Scope – Know limits of system’s capabilities
Assistance – right to communicate with provider and receive thoughtful helpful response
Usability – User should be master of SW and HW, product should be natural and intuitive to use

68
7 Principles of User-Centered Design
1. Understand Business
Understand underlying business function and how system supports individual, departmental and
enterprise goals. Objective to design UI that helps users perform jobs. FDD good starting point.
2. Maximize Graphical Effectiveness
People learn better visually.
3. Think like a User
Understand user experience, knowledge & skill levels. Accommodate novice and experienced users.
4. Use Modes and Prototypes
UI critical part because this is where they interact with the system. Create Prototypes for user
approval. Can present initial screen design in form of a Storyboard (sketch showing general screen
layout and design). Interface designers can obtain data usability metrics (software records and
measures user interaction with system).
5. Focus on Usability
Interface should include all tasks, commands and communications between users and IS.
6. Invite Feedback
Even after system is operational.
7. Document everything
Document all screen designs for later use by programmers.
Designing UI
Good interface is a combination of:
Ergonomics (how people work, learn and interact).
Aesthetics (how an interface can be made attractive and easy to use.
Interface Technology (operational structure required to carry out design objectives)
8 Basic Guidelines:
1. Transparent Interface
Facilitate system design objectives rather than calling attention to the interface
Easy to learn and remember
Improve user efficiency and productivity
Commands, actions, and system responses that are consistent and predictable
Minimize data entry problems
Users to correct errors easily
Logical and attractive layout

69
2. Easy to learn and use
Clearly label controls, buttons and icons
Only images users can understand easily and on-screen instructions that are logical, concise
and clear.
Show all command in list of menu items, dim commands not currently available
Easy to navigate or return to an level in menu structure
3. Enhance Productivity
Organize tasks, command and functions in groups that resemble actual business operations.
Alphabetical menu lists or frequently at top (or let users decide).
Shortcuts avoiding multiple menu levels
Default values
Duplicate value function
Fast-find feature displaying list of possible values when entering first few letters
Natural language allowing users to type commands or requests in normal English phrases
4. Easy for Users to obtain help or correct errors
Help must always be available
Provide User selected help (when user requests it) and Context-sensitive help offer
assistance for task in progress
Provide direct route for users to return to point from where help was requested. Help text
should be simple and concise.
Include contact info
Require user confirmation before data deletion (Are you sure?) and method of recovering
data
Provide Undo key
If user-entered command contains error, highlight erroneous part
Hypertext links to navigate through help topics
5. Minimize input data problems
Create input masks (templates or patterns) and allow data validation rules.
Event-driven messages and reminders.
List of predefined values that users can select
Build rules for data integrity (info needed before action can be performed)
6. Provide feedback to users
Messages at logical place on screen
Alert users to lengthy processing times or delays, on-screen progress report
Message on screen long enough for users to read them
Let user know if task or operation was successful or not
Provide text explanation if icon or image is used
Use specific, understandable and professional messages

70
7. Attractive layout and design
Appropriate colors
Use special effects sparingly
Hyperlinks
Group related objects and info
Screen density and keep uncluttered
Display titles, messages and instruction in consistent manner
Consistent terminology
Commands always have same effect
Similar mouse actions (double-clicking example)
8. Familiar terms and images
Green = Go, Red = Stop etc
Provide keystroke (easy to remember) File, Exit.
Familiar commands (Cut, Copy and paste)
Windows look and feel if user used to Windows
Avoid complex terms.
Control Features
Menu bar – top of screen and display menu options
Toolbar – contains icons or buttons representing shortcuts
Command button – initiates action such as printing
Dialog box – user insert info about task
Text box – User insert data
Toggle button – represent on or off status
List box – list of choices
Drop-down list box – show current selection when user clicks arrow
Option button (radio button) – one or more choices from group
Check Box – select one or more choices from a group
Calendar control – allow user to select date
A switchboard uses command buttons enabling users to navigate system and select from groups of
related tasks

71
Output Design
Questions before Designing output:
Purpose?
Who, why and how will it be used?
What specific info to be included?
Output be printed, on-screen or both?
When and how often?
Security or confidentiality issues?
Report Design
Different ways to view (screen, print) must obtain info user needs, not too much or too few resulting in
no value, different type of reports:
Detail Reports
One or more lines of output for each record processed. Each line is called a detail line. (SOH, info for
each line).
Exception Reports
Displays only records that meet a specific condition or conditions. (only view due accounts or only view
employees who worked overtime.
Summary Reports
Upper-level managers want to see total figures. Sales per rep and not each sale.
User Involvement in Report Design Design mock-up report or prototype for users to review. This can be on word or Exce, when approved
you should document design by creating a report analysis form which contain info about the layout
fields, frequency distribution, data security considerations and other issues.
Report Design Principles Printed reports to be attractive, professional and easy to read. When value of a control field changes, a
control break occurs which usually causes specific actions such as printing subtotals for a group of
records, that type of detail report is called a control break report. To produce a control break report the
records must be arranged, or sorted in control field order.
Design Features:
Report Headers and Footers
Header identify report with date and necessary info
Footer can include Grand totals for numeric fields etc.

72
Page Header and Footers
Header appear at top of page with column heading identifying data
Footer at bottom of page and is used to display report title and page number.
Column Heading Alignment
Left-adjustment for name fields, Right-adjustment for numeric fields
Column Spacing
Crowded report is hard to read, and large gaps make if difficult for the eye to follow
Field Order
Displayed and Grouped in Logical order
Grouping Detail Lines
Based on control field, Can print a Group Header and a Group Footer.
Repeating Fields
Store number repeated on every row… find out from users. Show 0 values or not.
Consistent Design
Reports should be uniform and consistent. Abbreviations should also be consistent.
Output Technology Types
Various output types exist, listed below:
Internet-based Information Delivery
Output displayed online (catalogue with SOH)
Webcasts (audio or video media files)
Confirming online stock trades, replaced memos and printed correspondence
Blogs
Web-based output, written from particular point of view. Review Products…
Instant Messaging
communicate over internet.
Wireless Devices
Mobile, handheld computers, phones.

73
Digital Audio, Images and Video
Transmitted as output to users who reproduce the content. Attach to email, sent as clip.
Podcasts
specially formatted digital audio file downloaded by Internet users. Used as sales and marketing
tool.
Automated Facsimile Systems
allows customer to request a fax using e-mail.
Computer Output to Microfilm (COM)
Scan and store images of original docs to provide high-quality records management and
archiving. Legal reasons, display signature, date stamp or other visual features.
Computer Output to Digital Media
Storing paper apps (insurance) and retrieved quickly. Magnetic tape, CDs, DVD’s
Specialized Forms of output
Portable Web-connected devices running apps and so forth
Retail POS, credit card transactions, print receipts
ATM’s, deposit slip
Plotters
Input Design
GIGO!! Good input design requires attention to human factors as well as technology issues.
Source Documents and Forms Source documents collects input data, provides a record of the original transaction. Generally paper
based but also provided online. Good form layout makes form easy to complete. Data entry positions to
be marked clearly with blank lines or boxes and descriptive captions.
Different Zones:
Heading zone (company name or logo)
Control zone (Codes, identification, numbers)
Instruction zone (instructions for competing form)
Body zone (at least half the page)
Totals zone
Authorization zone (signatures)
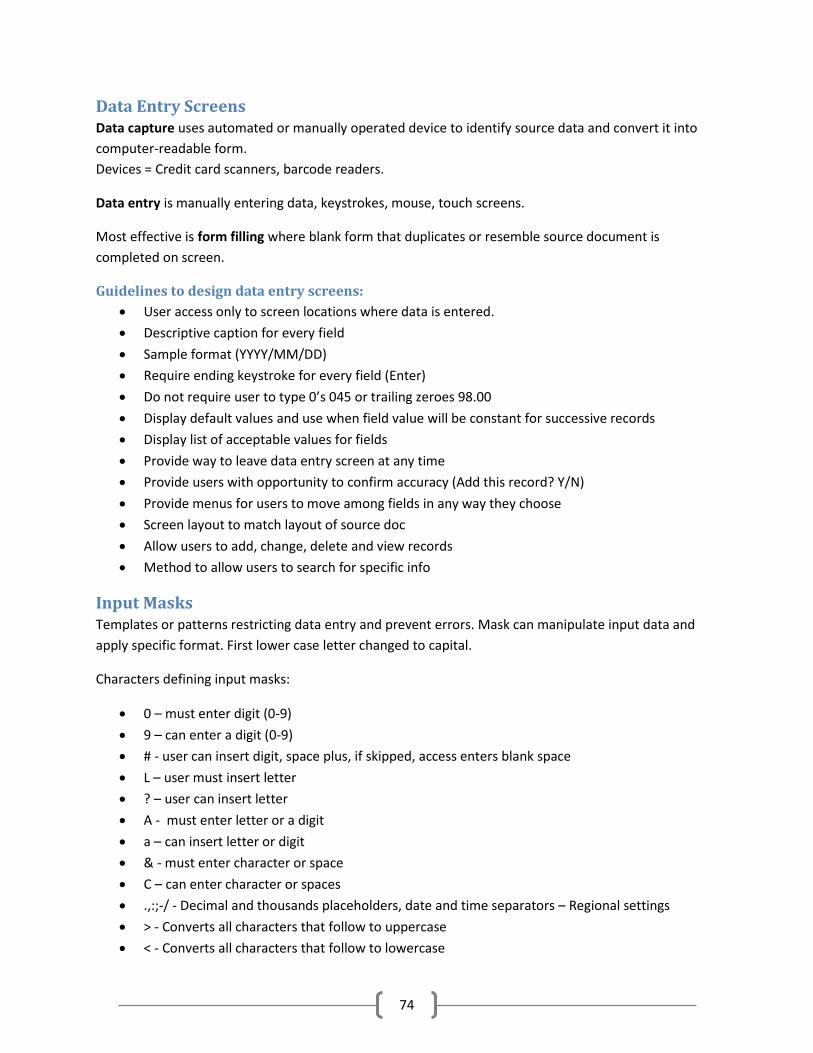
74
Data Entry Screens Data capture uses automated or manually operated device to identify source data and convert it into
computer-readable form.
Devices = Credit card scanners, barcode readers.
Data entry is manually entering data, keystrokes, mouse, touch screens.
Most effective is form filling where blank form that duplicates or resemble source document is
completed on screen.
Guidelines to design data entry screens:
User access only to screen locations where data is entered.
Descriptive caption for every field
Sample format (YYYY/MM/DD)
Require ending keystroke for every field (Enter)
Do not require user to type 0’s 045 or trailing zeroes 98.00
Display default values and use when field value will be constant for successive records
Display list of acceptable values for fields
Provide way to leave data entry screen at any time
Provide users with opportunity to confirm accuracy (Add this record? Y/N)
Provide menus for users to move among fields in any way they choose
Screen layout to match layout of source doc
Allow users to add, change, delete and view records
Method to allow users to search for specific info
Input Masks Templates or patterns restricting data entry and prevent errors. Mask can manipulate input data and
apply specific format. First lower case letter changed to capital.
Characters defining input masks:
0 – must enter digit (0-9)
9 – can enter a digit (0-9)
# - user can insert digit, space plus, if skipped, access enters blank space
L – user must insert letter
? – user can insert letter
A - must enter letter or a digit
a – can insert letter or digit
& - must enter character or space
C – can enter character or spaces
.,:;-/ - Decimal and thousands placeholders, date and time separators – Regional settings
> - Converts all characters that follow to uppercase
< - Converts all characters that follow to lowercase

75
Validation Rules Reducing number of input errors improves data quality, done by eliminating unnecessary data entry. A
data validation rule improves input quality by testing data and rejecting any entry that fails to meet
specified conditions.
Example of 8 Validation Rules:
Sequence check
If data must be in predetermined sequence
Existence check
Used for mandatory data items, will not allow to save record till suitable value is inserted (Item
Group)
Data Type check
Numeric
Range Check
Certain values or limit check
Reasonableness check
If valid but unusual, verify it with this check
Validity check
if data must have certain values (referential integrity) new customer number not matching
number already stored.
Combination Check
on 2 or more fields to ensure consistent and reasonable (field alone valid but in combination
not)
Batch controls
Record counts and numeric field totals checked. If system total don’t match input totals data
entry error occurred. Batch control totals often are called hash totals.

76
Input Technology
Input methods should be cost-efficient, timely and simple as possible.
INPUT TECHNOLOTY
Traditional Evolving Emerging
Keyboard Body motion detection Brain-Computer Interface (BCI)
Mouse Advanced voice recognition Neural networks
Pointing Devices Biological feedback Artificial Intelligence (AI)
Microphone Embedded magnetic data Advanced motion sensors
OCR (optical character recognition) RFID Two-way satellite interface
MICR (magnetic ink character recognition)
Advanced optical recognition Virtual environments
Graphic input devices Physical adaptation devices 3-D Technology
Batch Input specific time schedule. Enters data as batch.
Online Input (online data entry)
Immediate validation and availability of data
source data automation popular which combines online data and automated data capture using
input devices such as RFID tags or magnetic data strips – Fast and accurate
Examples of Source data automation:
- POS (barcode scanners, magnetic swipe scanners)
- ATM
- Magnetic employee ID cards
- Patient ID bracelets
- Retail stores portable bar code scanners
Tradeoffs
Online advantages but more expensive than batch, decision depends on business requirements.
Input Volume reduction
1. Input necessary data ONLY
2. Do NOT input data user can retrieve from system files or calculate from other data
3. Do not input constant data, if orders in batch with same date then user should enter the order
date only once for the first order in the batch.
4. Use codes, they are shorter than the data they represent.

77
Security and Control issues Must protect data, own info and that of the customers, employees and suppliers.
Output Security and Control Control
Must be accurate complete, current and secure.
Reports must have code, printing date and time period covered with pages numbered
consecutively.
Security
Privacy rights and shields organization’s proprietary data from theft or unauthorized access.
Limit number of printed copies and use tracking procedure to account for each copy
Procedure to ensure output delivered to authorized recipients only
Where possible security should be designed into system by using passwords, holding sensitive
data and controlling user access
Some firms have diskless workstation = network terminal that supports full-featured user
interface but limits printing or copying of data except to certain network resources that can be
monitored and controlled.
Input Security and Control Control
When batch input used computer can produce input log file that identifies documents the date
entered
Should be traceable – audit trail
Company must have procedures for handling source documents to ensure data not lost before
entering the system
Security
Data recovery utilities should be able to restore lost or damaged data
Company should have a records retention policy that meet legal requirements and business
needs.
Protect data from unauthorized access. Allow user to view credit limit but not change it
Sensitive data can be encrypted or coded (only users with decoding software can read it).

78
Glossary
aesthetics Focuses on how an interface can be made attractive and easy to use
audit trail Records the source of each data item and when it entered the system
authorization zone Contains any required signatures
batch controls Totals used to verify batch input
batch input Data that is entered on a specified time schedule
body zone The main part of the form; contains captions and areas for entering viable data
calendar control Allows the user to select a date that the system will use as a field value
command button Initiates an action such as printing a form or requesting help
context-sensitive Help that offers assistance for the task in progress
control break report Detail report created as the result of a control break
control field Field that controls the output
control zone Contains codes, identification information, numbers, and dates that are used for storing completed forms
data capture Uses an automated or manually operated device to identify source data and convert it into computer-readable form
data security Policies and procedures that protect data from loss or damage
data validation rule Improves input quality by testing the data and rejecting any entry that fails to meet specified conditions
detail report Produces one or more lines of output for each record processed
diskless workstation Network terminal that supports a full-featured user interface, but limits the printing or copying of data
drop-down list box Displays the current selection; when the user clicks the arrow, a list of the available choices displays
encrypted Coded
encryption The coding of data so that only users with decoding software can read it
exception report Displays only those records that meet a specific condition or conditions
existence check Used for mandatory data items
faxback Another term for automated facsimile
form filling Most effective method of online data entry in which a blank form that duplicates the source document is completed on the screen
form layout Good ____ makes the form easy to complete and provides enough space for users to enter data
garbage in, garbage out Means the quality of the output is only as good as the quality of the input
graphical user interface (GUI)
Interface that uses icons, graphical, and pointing devices
group header Appears above the first detail line in a group
input control Includes the necessary measures to ensure that input data is correct, complete, and secure
list box Displays a list of choices that the user can select
menu bar Feature at the top of the screen that displays the main menu options

79
mock-up A sample report used in designing a report
natural language Feature that allows users to type commands or requests in normal English phrases
online data entry Date entry over the Internet
output control Methods to maintain output integrity and security
page header Appears at the top of a page and includes the column headings that identify the data
podcast Specially formatted digital audio file that can be downloaded by Internet users from a variety of content providers
radio button Another term for option button
range check Tests data items to verify that they fall between a specified minimum and maximum value
reasonableness check Identifies values that are questionable, but not necessarily wrong
records retention policy Governs the storage of source documents in a safe location for a specified length of time
referential integrity Checking that a value entered refers to another value
report header Appears at the beginning of a report and identifies the report
RFID tag Type of input device for online data entry
text box Can display messages or provide a place for a user to enter data
turnaround documents Output documents that are later entered back into the same or another information system
usability metrics Data regarding user interaction with a system
user interface (UI) Describes how users interact with a computer system
user-centered System where the distinction blurs between input, output, and the interface itself
Webcast Audio or video media file distributed over the Internet

80
Table of Contents
OVERVIEW ................................................................................................................................................... 82
Data Design Concepts ................................................................................................................................. 82
Data Structures ....................................................................................................................................... 82
File-Oriented System ........................................................................................................................... 82
Database Management System .......................................................................................................... 82
DBMS Components ............................................................................................................................. 84
Web-Based Database Design ...................................................................................................................... 85
Characteristics ......................................................................................................................................... 85
Internet Terminology .............................................................................................................................. 85
Connecting a Database to the Web ........................................................................................................ 85
Data Security ....................................................................................................................................... 86
Data Design Terminology ............................................................................................................................ 86
Referential Integrity ................................................................................................................................ 87
Entity-Relationship Diagrams ...................................................................................................................... 87
Drawing an ERD ....................................................................................................................................... 87
Types of Relationships ........................................................................................................................ 87
Cardinality ........................................................................................................................................... 89
Normalization.......................................................................................................................................... 90
Unnormalized Design (Repeating Groups) .......................................................................................... 90
First Normal Form (1NF) ..................................................................................................................... 91
Second Normal Form (2NF) ................................................................................................................. 91
Third Normal Form (3NF) .................................................................................................................... 92
Using codes during Data Design ................................................................................................................. 93
Types of Codes ........................................................................................................................................ 93
Developing a Code .............................................................................................................................. 94
DB Design: One step at a time .................................................................................................................... 94
Data Storage and Access ............................................................................................................................. 94
Strategic Tools for Data Storage and Access: ......................................................................................... 95
Data Warehousing .............................................................................................................................. 95
Data Mining ......................................................................................................................................... 95

81
Logical and Physical Storage ................................................................................................................... 95
Logical Storage .................................................................................................................................... 95
Physical Storage .................................................................................................................................. 95
Data Coding and Storage ........................................................................................................................ 95
EBCDIC, ASCII and BINARY .................................................................................................................. 95
Unicode ................................................................................................................................................... 95
Storing Dates ........................................................................................................................................... 96
Data Control ................................................................................................................................................ 96
Glossary ....................................................................................................................................................... 96

82
PHASE 3 – Designing the Data
OVERVIEW
How data will be organized, stored and managed.
Data Design Concepts Analyst must understand basic data design concepts including data structures and characteristics of file-
oriented and DB management systems including Web-based design.
Data Structures Is framework for organizing, storing and managing data, consist of files (tables) that interact in various
ways. Each file or table contains data. Depending on how files and tables are designed an IS is called a
file-oriented system or a database management system.
File-Oriented System
(File processing system) stores data in one or more separate files. Same data is stored in more than one
location, this redundancy is a major disadvantage of file-oriented systems because it reduces efficiency
and data quality.
Database Management System
All tables are connected by common fields like a customer number. Common field connecting two tables
is said to link, join or relate the tables. This design also is called a relational database or relational
model. Most popular approach.
Overview of File Processing
Older approach but some companies still use. Can be cost-effective in certain situations. In typical file
processing environment a company might have 3 departments each with its own IS and data files.
3 Potential Problems:
Data redundancy (more storage and maintaining and updating data in several locations is
expensive.
Data integrity problems occur if updates are not applied in every file and data only changed in
one system will have different info in other.
Rigid data structure when info is needed for decisions retrieving info from independent, file-
based systems will be slow and inefficient.

83
File-oriented IS can contain various types of files:
Master File – Relatively permanent data (Product)
Table File – Reference data, also relatively static (Tax Table)
Transactional File – records contain day-to-day business and operational data, this updates
master file (payments file)
Work File – Temporary file created by IS for single task (report files)
Security File – saved for backup and recovery purposes (audit trail files)
History File – Archiving purposes (Inactive student file)
Database System
Overall framework avoids data redundancy and supports real-time, dynamic environment. Several
systems can be built around a single database.
A DBMS (Database Management system) is a collection of tools, features and interfaces that enables
users to add, update, manage, access and analyze the contents of a set of data.
Main Advantage = offers timely, interactive and flexible data access, more advantages:
Scalability
System can be expanded, modified or downsized easily
Client/server better support
Processing is distributed throughout the organization.
Economy of scale
Better utilization of hardware. Powerful mainframe server less expensive than several smaller
computers.
Flexible data sharing
Data shared across enterprise allowing more users to access more data.
Enterprise-wide application
DBA assess requirements and maintains the DB for benefit of entire organization rather than
single department or user.
Stronger standards
Uniformity
Controlled redundancy
Storing data in one place
Better Security
DBA can define authorization procedures to ensure only legitimate users can access DB and
allow different users to have different levels of access.
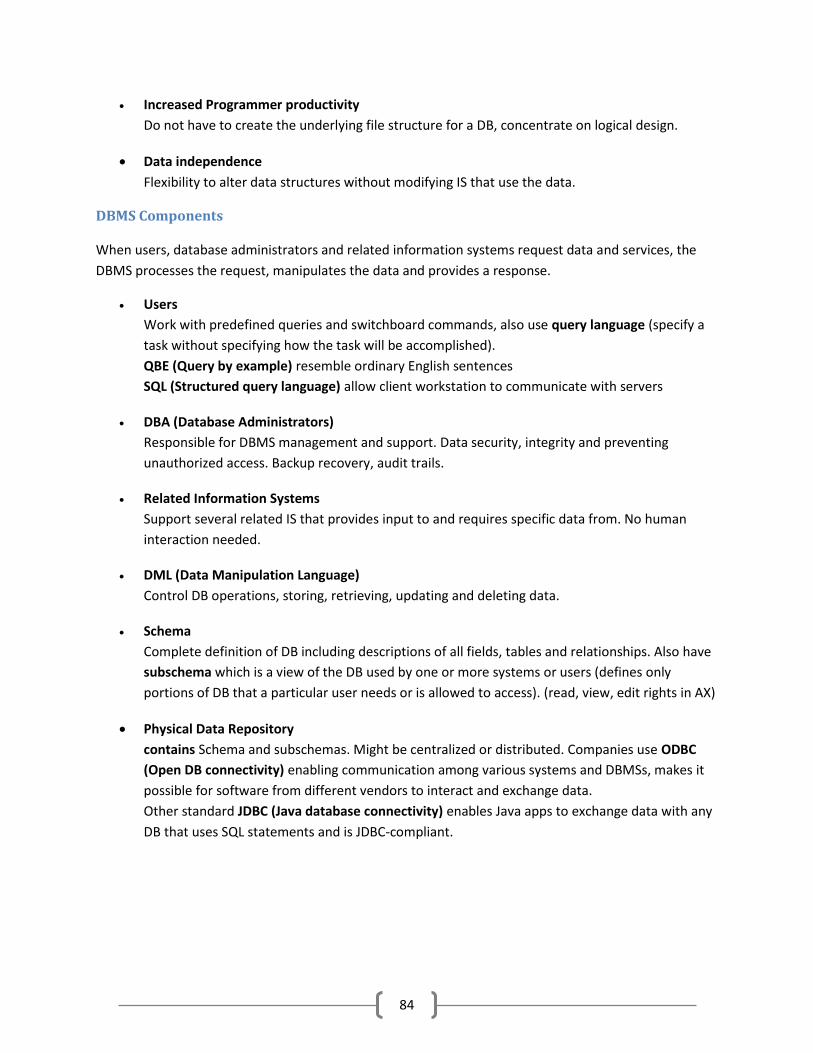
84
Increased Programmer productivity
Do not have to create the underlying file structure for a DB, concentrate on logical design.
Data independence
Flexibility to alter data structures without modifying IS that use the data.
DBMS Components
When users, database administrators and related information systems request data and services, the
DBMS processes the request, manipulates the data and provides a response.
Users
Work with predefined queries and switchboard commands, also use query language (specify a
task without specifying how the task will be accomplished).
QBE (Query by example) resemble ordinary English sentences
SQL (Structured query language) allow client workstation to communicate with servers
DBA (Database Administrators)
Responsible for DBMS management and support. Data security, integrity and preventing
unauthorized access. Backup recovery, audit trails.
Related Information Systems
Support several related IS that provides input to and requires specific data from. No human
interaction needed.
DML (Data Manipulation Language)
Control DB operations, storing, retrieving, updating and deleting data.
Schema
Complete definition of DB including descriptions of all fields, tables and relationships. Also have
subschema which is a view of the DB used by one or more systems or users (defines only
portions of DB that a particular user needs or is allowed to access). (read, view, edit rights in AX)
Physical Data Repository
contains Schema and subschemas. Might be centralized or distributed. Companies use ODBC
(Open DB connectivity) enabling communication among various systems and DBMSs, makes it
possible for software from different vendors to interact and exchange data.
Other standard JDBC (Java database connectivity) enables Java apps to exchange data with any
DB that uses SQL statements and is JDBC-compliant.

85
Web-Based Database Design
Characteristics Internet serves as interface. Provides power and flexibility because not tied to any specific combination
of hardware and software.
CHARACTERISTIC EXPLANATION
Global access Worldwide access, using existing infrastructure and standard telecommunications protocols
Ease of use Web browsers provide familiar interface, user-friendly and easy to learn
Multiple platforms Not dependent on specific combo of HW and SW, just browser and internet connection
Cost effectiveness Only browser and Web-based systems do not require powerful workstations. Flexibility is high, numerous outsourcing options exist for Dev, hosting, maintenance and system support
Security issues Universal issue but Internet connectivity raises special concerns
Adaptability issues Migrating a traditional DB design to Web can require design modification, additional SW and some added expense
Internet Terminology Web Browser – app enabling user to navigate, browse internet
Web page – is text document written in HTML (Hypertext Markup Language)
Tags – Formatting codes used by HTML which specify how text and visual elements will be displayed
Web server – where Web pages are stored
Web site – Web pages and Web server together
Intranet – Private, company-owned network to provide Web-based access to internal users
Extranet – Extension of a company intranet allowing access by external users (customers/suppliers)
Web-centric – Intranets and extranet use same protocols (data transmission standards) as the internet
Connecting a Database to the Web DB must be connected to the Internet or intranet. DB and Internet speak different languages, objective
is to connect DB to Web and enable data to be viewed and updated.
To bridge the gap it is necessary to use middleware (software integrates different apps and allows them
to exchange data. Middleware interpret client requests in HTML form and translate requests into
commands DB can execute.
4 Steps:
1. Client workstation requests a Web page
2. Web server uses middleware to generate a data query to DB server
3. DB server responds
4. Middleware translates retrieved data into an HTML page that can be sent by the Web server and
displayed by user’s browser.

86
Data Security
Well-designed systems provide security at 3 levels:
DB itself
Web server
Telecommunication links that connect components of the system.
Data Design Terminology
Data design terms include the following Definitions:
Entity
Person, place, thing or event for which data is collected & maintained.(Customer, order)
Table or File
Contains set related records (2-dim structures consisting of vertical columns & horizontal rows.
Field
Also called attribute, single characteristic or fact about entity. A common field is an attribute
that appears in more than one entity.
Record
Also called tuple (set of related fields)
Data design use key fields to organize, access and maintain data structures. Contain following keys:
Primary Key (PK)
Field or combination of fields that uniquely and minimally identifies particular member of an
entity. (Student Number)
Can also be combination key (Composite key) (Student ID + Course ID).
Candidate Key
Any field that can serve as PK.
Any field that is not a primary key or candidate key is called a nonkey field.
Foreign Key
Is a field in one table that must match primary key value in another table to establish the
relationship. Foreign key need to be unique and can appear more than once in record unlike PK.
Secondary Key
Field or combination of fields that can be used to access or retrieve records. Values are not
unique. Can be used to sort or display record in a certain order.

87
Referential Integrity
Set of rules that avoids data inconsistency and quality problems. In relational DB, referential integrity
means that a foreign key value cannot be entered in one table unless it matches an existing PK in
another table.
Without referential Integrity you might have an order called an orphan because it had no related
customer (customer not created). RI will now allow order to be created if customer doesn’t exist.
RI will also prevent deletion of a record if record has a PK that matches FK in another table.
Entity-Relationship Diagrams
IS must recognize relationships among entities. ERD is a model showing logical relationships and
interaction among system entities. Overall view of system and blueprint for creating physical data
structures.
Drawing an ERD List entities and consider nature of relationships that link them. Unlike data flow diagrams, ERD depict
relationships and not data or information flows.
Types of Relationships
One-to-One (1:1)
Office Manager – Heads – Office
Vehicle ID number – Assigned to – Vehicle
Department Head – Chairs – Department
One-to-Many (1:M)
When one occurrence of first entity can relate to many instances of second entity.
Department –Employs – Employees
Individual – owns – Automobile
Customer – Places - Order

88
Many-to-Many (M:N)
One instance of 1st entity can relate to many instances of 2nd entity and one instance of 2nd entity to
many instances of 1st entity. Not allowed when designing a DB, must find a way to make M:N into 1:M
Student – Enrolls in – Class
Passenger – Reserves seat on – Flight
Event or transaction that links the two entities is actually a third entity called an associative entity (own
characteristics) Rental being it below:
When placing an order:
Order – Lists – Product
Lists – (Order-Line) – with Order-Line being the Composite Entity.

89
Cardinality
Describes numeric relationship between 2 entities and shows how instances of 1 entity relate to
instances of another.
One customer can have none or many orders, but each order must have one and only one customer.
Crow’s foot notation method of cardinality notation
Examples of Cardinality Notation:
Full Example in Practice

90
Normalization
Process of creating table designs by assigning specific fields or attributes to each table in DB. A table
design specifies fields and identifies the PK in particular table or file.
Normalization used to develop overall DB design that is simple, flexible and free of data redundancy.
Involves applying set of rules that help identify correct inherent problems and complexities.
Standard Notation Format:
Name of Table, followed by parenthetical expression that contains field names separated by commas
with the PK field(s) underlined:
NAME (FIELD 1, FIELD 2, FIELD 3)
Four Stages:
Unnormalized Design (Repeating Groups)
Repeating group is set of one or more fields that occur any number of times in a single record with each
occurrence having different values.
Table design containing repeating groups is called unnormalized. STD notation method representing
Unnormalized design is to enclose repeating group of fields within a second set of parentheses:
NAME (FIELD 1, FIELD 2, FIELD 3, (REPEATING FIELD 1, REPEATING FIELD 2).

91
First Normal Form (1NF)
To convert into 1NF must expand table’s PK to include the PK of the repeating group. When eliminating
repeating groups additional records emerge, one for each combination of a specific order and a specific
product, result is more records but a greatly simplified design.
Second Normal Form (2NF)
Functional Dependence is a relationship that exists when on attribute uniquely determines another
attribute.
Design is in 2NF If it is in 1NF and all fields that are not part of the PK are functionally dependent on the
entire PK.
STEPS
1. Create and name separate table for each field in the existing PK.
2. Create new table for each possible combination of original PK
3. Study 3 tables and place each field with its appropriate PK on which it functionally depends.
Remove any table that did not have any additional fields assigned to it.

92
Problems that exist in 1NF but not in 2NF:
Won’t be able to change product description in one place and will need to update each record.
Contain inconsistent data, nothing prevents product number from having different product
description in different records.
Adding new product is a problem, PK must include an order number and a product number but
you need values for both fields in order to add a record.
Deleting product also a problem, all related records are deleted once order is filled and paid for.
If product deleted ordered products lose main data of product.
Third Normal Form (3NF)
Every nonkey field depends on the PK, the whole key and nothing but the key!!
This avoids redundancy and integrity problems that still can exist in 2NF designs.
A table is in 3NF if it is in 2NF and if no nonkey field is dependent on another nonkey field.

93
Summary of Rules for different Normalization levels:
1NF No repeating or duplicate fields
Each cell contains only a single value
Each record is unique and identified by PK
2NF All non-key fields depend on all components of the PK
Guaranteed when primary key is a single field
3NF No non-key field depends upon another
All non-key fields depend only on the PK
Using codes during Data Design
Student number, Customer accounts, Zip Codes is example of Codes.
Codes often are shorter than the data they represent, they save storage space and costs, reduce data
transmission time and decrease data entry time.
Types of Codes
Sequence codes
Specific order. No additional info other than an indication of order of entry into the system.
Employee code “1233”.
Block sequence codes
number for different classifications, First year subjects end with “01” 2nd year subjects end with
“02”.
Alphabetic codes
Use alphabet letters to distinguish one item from another based on a category and abbreviation:
- Category codes (Identify group of related items)
- Abbreviation codes (Standard state codes NY for New York, ZA etc)

94
Significant digit codes
Distinguish items by using a series of subgroups of digits (Zip Codes, Inventory location codes)
Derivation codes
Data from different item attributes or characteristics to build the codes. Magazine subscriber
code, name, code, address (Derived from address).
Developing a Code
Keep codes concise
Allow for expansion
Keep codes stable
Make codes unique
Use sortable codes
Avoid confusing codes
Make codes meaningful
Use code for single purpose
Keep codes consistent
DB Design: One step at a time
After normalizing table designs, you can create physical DB.
1. Create initial ERD. Start by reviewing your DFDs and class diagrams to identify all system entities
2. Create an ERD. Carefully analyze each relationship to determine if it is 1:1, 1:M or M:N
3. During modeling, you created data dictionary. Now review all the data elements to be sure each
one is assigned to an appropriate entity.
4. Review 3NF designs for all tables and verify all PK, SK and FK. If associative entities created
during design process, update ERD now.
Now changing logical model into a physical data structure that will support user needs and business
requirements.
Data Storage and Access
Involve strategic business tools such as data warehousing and data mining software, as well as logical
and physical storage issues, selection of data storage formats and special considerations regarding
storage of date fields.

95
Strategic Tools for Data Storage and Access:
Data Warehousing
Integrated collection of data that can include seemingly unrelated info no matter where it is stored in
the company. It can link various IS and DB, and provides an enterprise-wide view to support
management analysis and decision making.
Allows users to specify dimensions or characteristics. Rather than accessing separate systems, a data
warehouse stores transaction data in a format that allows users to retrieve and analyze data easily.
Other firms prefer a data mart designed to serve needs of a specific department such as sales and
marketing, or finance.
Data Mining
Looks for meaningful data patterns and relationships. Help a consumer products firm identify potential
customers based on prior purchases. Used as marketing tool
Clickstream storage, data gathering from visitors interaction on web by clicking and checkout amounts.
Logical and Physical Storage
Logical Storage
Data user can view, understand and access. Consist of alphabetic and numeric characters. When
designing fields space should be provided for largest values that can be anticipated.
A logical record is a set of field values that describes a single person, place, thing or event.
Physical Storage
Involves physical record, or block, which is smallest data unit that can be handled by OS.
When system reads physical record, it loads data from storage into a buffer (segment of comp memory).
When system writes physical record, all data in memory buffer is saved physically to storage location
Data Coding and Storage
EBCDIC, ASCII and BINARY
EBCDIC (Extended Binary Coded Decimal Interchange Code) used on mainframe computers and high-
capacity servers. (require 8 bits, or one byte for each character)
ASCII (American Standard Code for Information Interchange) used on most personal computers, (require
8 bits, or one byte for each character)
BINARY more efficient storage unit. Represent numbers as actual binary values rather as coded numeric
digits.
Unicode Two bytes per character. Creates translatable content right from the start. Very recent form of coding
and supported by most popular OS.

96
Storing Dates Most date formats are based on model established by ISO (international Organization for
Standardization (ISO). Requires four digits for the year, 2 for month and 2 for day.
Absolute date is the total number of days from some specific base date. To calculate number of days
between 2 absolute date you can subtract one date from the other.
Data Control Limiting access to files and DB is most common way of protecting stored data. Users must furnish a
proper user ID and Password to access file or DB.
Different permissions associated with different users.
Encryption and all system files and DB must be backed up regularly and a series of backup copies must
be retained for specified period of time.
Special audit fields can be activated where additional control is kept about date when record was
created, modified or number of time accessed.
Glossary ASCII American Standard Code for Information Interchange; Coding method used on
personal computers
associative entity Event or transaction that links the two entities of an M:N relationship, but has its own characteristics
attribute Another term for field
binary storage format Represents numbers as actual binary values, rather than as coded numeric digits
block Another term for physical record
block sequence codes Use blocks of numbers for different classifications
blocking factor Number of logical records that each physical record contains
candidate key Any field that can serve as a primary key
category codes Identify a group of related items
clicks to close Average page views to accomplish a purchase or obtain desired information
client-server Type of system in which processing is distributed throughout the organization
data element Another term for field
data manipulation language (DML)
Controls database operations, including storing, retrieving, updating, and deleting data
data mart Data storage that is designed to serve the needs of a specific department
data structure Framework for organizing, storing, and managing data
data warehouse Integrated collection of data that can include seemingly unrelated information, no matter where it is stored in the company
derivation codes Combine data from different item attributes, or characteristics, to build the code

97
encryption Process of converting readable data into unreadable characters to prevent unauthorized access to the data
entity Person, place, thing, or event for which data is collected and maintained
extranet Extension of a company intranet that allows access by external users
first normal form (1NF) A table that does not contain a repeating group
history file Created for archiving purposes
JDBC (Java database connectivity)
Enables Java applications to exchange data with any database that uses SQL statements and is JDBC-compliant
key fields Used to organize, access, and maintain data structures
logical record Set of field values that describes a single person, place, thing, or event
long integer format Binary storage format that uses 32 bits, or four bytes, to represent a 10-digit number in binary form
many-to-many relationship Exists when one instance of the first entity can relate to many instances of the second entity, and one instance of the second entity can relate to many instances of the first entity
market basket analysis Data mining technique described by Wikipedia wherein stores make use of a detailed analysis of items purchased together without attempting to explain the correlation
nonkey field Any field that is not a primary key or a candidate key
one-to-many relationship Exists when one occurrence of the first entity can relate to many instances of the second entity, but each instance of the second entity can associate with only one instance of the first entity
one-to-one relationship Exists when exactly one of the second entity occurs for each instance of the first entity
password Specific code that must be furnished by a user to access a file or database
query by example (QBE) User provides an example of the data requested
record Set of related fields that describes one instance, or occurrence of an entity
recovery procedures Can be used to restore the file or database to its current state at the time of the last backup, in the event of a file catastrophe
relational model Another term for relational database
repeating group Set of one or more fields that can occur any number of times in a single record, with each occurrence having different values
second normal form (2NF) A table design wherein the table is in 1NF, and all fields that are not part of the primary key are funtionally dependent on the entire primary key
secondary key Field or combination of fields that can be used to access or retrieve records
subschema View of the database used by one or more systems or users
table Another term for file
table design Specifies the fields and identifies the primary key in a particular table or file
table file Contains reference data used by the information system
tags HTML formatting codes
Unifided Modeling Language (UML)
Widely used method of visualizing and documenting software systems design
Web site The Web server and the Web pages together
Web-centric Using the same protocols as the Internet

98
work file Temporary file created by an information system for a single task
Y2K issue Major problem that faced many firms that used only two digits to represent the year at the beginning of the 21st century

99
Table of Contents
Software Quality Insurance ....................................................................................................................... 101
Application Development Overview ......................................................................................................... 101
App DEV Tasks ....................................................................................................................................... 101
Traditional Method (or O-O) ............................................................................................................. 101
Agile Method ..................................................................................................................................... 101
System DEV Tools .................................................................................................................................. 102
Structured App Development ................................................................................................................... 102
Structured Charts .................................................................................................................................. 102
Module .............................................................................................................................................. 102
Data Couple ....................................................................................................................................... 102
Control Couple .................................................................................................................................. 103
Condition ........................................................................................................................................... 103
Loop................................................................................................................................................... 103
Cohesion and Coupling ......................................................................................................................... 103
Drawing a Structure Chart .................................................................................................................... 103
Object-Orientated Application Development ........................................................................................... 103
Characteristic of Object-Oriented App DEV .......................................................................................... 104
Implementation of O-O Designs ........................................................................................................... 104
Object-Oriented Cohesion and Coupling .............................................................................................. 104
Agile Application Development ................................................................................................................ 104
Coding ....................................................................................................................................................... 104
Programing Environments ................................................................................................................ 104
Testing the system .................................................................................................................................... 105
Unit Testing ........................................................................................................................................... 105
Integration Testing ................................................................................................................................ 105
System Testing ...................................................................................................................................... 105
Documentation ......................................................................................................................................... 106
Program Documentation ...................................................................................................................... 106
System Documentation ......................................................................................................................... 106
Operations Documentation .................................................................................................................. 106

100
User Documentation ............................................................................................................................. 106
Management Approval ............................................................................................................................. 107
System Installation and Evaluation ........................................................................................................... 107
Operational and Test Environments ..................................................................................................... 107
Training ................................................................................................................................................. 107
Training Plan ..................................................................................................................................... 107
Types of training: .................................................................................................................................. 108
Vendor Training................................................................................................................................. 108
Webinars, Podcasts and Tutorials ..................................................................................................... 108
Outside Training Resources .............................................................................................................. 108
Training Tips ...................................................................................................................................... 108
Interactive Training ........................................................................................................................... 108
Data Conversion ........................................................................................................................................ 109
System changeover ................................................................................................................................... 109
Direct Cutover ....................................................................................................................................... 109
Parallel Operation ................................................................................................................................. 109
Pilot Operation ...................................................................................................................................... 109
Phased Operation ................................................................................................................................. 109
Post-Implementation Tasks ...................................................................................................................... 110
Glossary ..................................................................................................................................................... 111

101
PHASE 4 – Making the System Operational
Software Quality Insurance
Avoid problems or to identify them as soon as possible. Poor quality can result from inaccurate
requirements, design problems, coding errors, faulty documentation and ineffective testing. To improve
finished product software engineering and ISO should be considered:
Software Engineering
Software DEV process that stresses solid design, accurate documentation and careful testing. SEI
(Software Engineering Institute) have set of Dev standards called CMM (Capability Maturity
Model), purpose to improve SW quality, reduce DEV time and cut costs. They also have new
model CMMI (Capability Maturity Model Integration) that integrates SW and Systems Dev into
much larger framework called process improvement. It track and organization’s processes using
5 maturity levels where 1 is poorly controlled and Level 5 with optimal results.
ISO (International Organization for Standardization)
Establishes quality standards for products and services. International recognized symbols etc.
ISO requires specific DEV plan, which outlines a step-by-step process for transforming user
requirements into finished product.
Application Development Overview
Process of constructing the programs and code modules that serve as building blocks of the IS.
Application DEV Tasks depends on method:
App DEV Tasks
Traditional Method (or O-O)
Ready to translate design into a functioning Application. At this point, coding and testing tasks begin.
Although programmers typically perform the actual coding, IT manager usually assign systems analysts
to work with them as a team.
Agile Method
Plan project, lay groundwork, assemble team and prepare to interact with customers. Intense
communication and collaboration will now begin between IT team and users or customers. Uses various
modes, including spiral model or Extreme Programming (XP).

102
System DEV Tools Structured DEV relies heavily on DFDs and structure charts; O-O use variety of diagrams including use of
Case, class sequence and transition state diagrams. System DEV can also use multipurpose tools to help
translate system logic, tools include the following:
Entity-Relationship Diagrams
Flowcharts
Pseudocode
Decision Tables and Decision Trees4
Structured App Development
Usually involves a Top-down approach that proceeds from a general design to detailed structure.
System broken down to subsystems and modules in a process called partitioning. Also called modular
design and similar to constructing a leveled set of DFDs.
Structured Charts Show program modules and relationships among them. Consists of rectangles that represent program
modules with arrows and other symbols. Typically a higher-level module is called a control module,
directs lower-level modules called subordinate modules. Symbols represent various actions or
conditions and represent the following:
Module
Rectangle. Rectangle with vertical lines at the edges indicate that module is a library module (Reusable
code) Fig 11-10 on page 515.
Data Couple
Arrow with empty circle. Shows data that one module passes to another.

103
Control Couple
Arrow with filled circle. Shows a message also called a status flag which one module sends to another.
Module uses a flag to signal specific condition or action to another module. Notification about account
being overdue.
Condition
Diamond. A condition line indicates that a control module determines which subordinate module will be
invoked depending on a specific condition.
Loop
Curved arrow that one or more modules are repeated.
Cohesion and Coupling Cohesion measures module’s scope and processing characteristics. Module performing single function
or task has high degree of cohesion which is desirable. When you notice word and in module name, you
know more than one task is involved.
Coupling describes degree of interdependence among modules. Modules that are independent are
loosely coupled which is desirable, easier to maintain and modify. Tightly coupled is when one module
is linked to internal logic contained in another module.
Drawing a Structure Chart Will be based on DFD’s, 4 steps to follow:
1. Review DFDs
2. Identify Modules and Relationships
3. Add Couples, Loops and Conditions
4. Analyze the structure Chart and data dictionary
Object-Orientated Application Development
O-O analysis makes it easier to translate an object model directly into an object-oriented programming
language. Process is called OOD (Object-oriented Dev).

104
Characteristic of Object-Oriented App DEV
Relationships between objects already exist. Object interaction is defined during analysis, the App’s
structure is represented by the object model itself. Relationship and interaction among classes are
described using a class diagram which includes the class attributes (describe characteristics of objects in
the class) and methods (represent program logic).
Implementation of O-O Designs Must analyze classes, attributes, methods and messages that are documented. Programmer makes
necessary revisions and updates t class diagrams, sequence diagrams, state transition diagrams and
activity diagrams. Programmer analyzes sequence diagrams and state transition diagrams showing the
events and messages that trigger changes to an object. O-O app are called event-driven.
Object-Oriented Cohesion and Coupling Classes should be as loosely coupled as possible as well as methods and highly cohesive.
Agile Application Development Development team in constant communication with the primary user customer. XP Extreme
Programming is the newest agile method which is an iterative approach.
User stores (User requirements) are implemented in iteration cycles (includes planning, designing,
coding and testing of one or more features). Iteration planning meetings are held to break down user
stories into specific tasks
Team regularly meets with customer for approval who tested prototype releases as they become
available.
The onlooker examines code strategically to see the forest while the driver is concerned with individual
trees immediately in front of him.
Coding
Process of turning program logic into specific instructions that the computer system can execute.
Programing Environments
To simplify integration of system components and reduce code DEV time, programmers use an
integrated development environment (IDE) . IDE’s make it easier to program interactive SW products
by providing built-in tools and advanced features such as real-time error detection, syntax hints and
highlighted code.

105
Testing the system
1. Compile program using a CASE tool or a language compiler. This process detects syntax errors
which are language grammar errors.
2. Programmer checks the program. Desk checking process of reviewing program code to spot
logic errors. Other companies need formal type of desk checking called a structured
walkthrough or code review. Group of IT staff members participate
3. Design walkthrough session held with users to review CI with cross-section of people who will
work with new system.
Unit Testing Testing individual program or module. Obj to identify &eliminate execution errors that could cause
program to terminate abnormally & logic errors that could have been missed during desk checking.
Test data should contain both correct data and erroneous data and should test all possible
situations that could occur. Programmers must test programs that interact with other programs
and files individually before integrating then into the system.
Stub testing where programmer simulates each program outcome or result and displays a
message to indicate whether or not the program executed successfully. Each stub represents
and entry or exit point that will be linked later to another program or data file.
Test Plan consist of detailed procedures specifying how & when testing will be performed& who
will participate,what test data will be used. Should include scenarios for every possible situation.
Integration Testing Testing one or more program that depend on each other also called link testing. Like AX and ILS. Testing
sequence should not move to the integration test stage unless it has performed properly in all unit tests.
System Testing Involves entire IS. Includes all typical processing situations and is intended to assure users, developers
and managers that the program meets all specifications and all necessary features have been included.
Objectives:
Perform a final test of all programs
Verify that the system will handle all input data properly, both valid and invalid
Ensure that IT staff has the documentation and instructions needed to operate the system
properly and that backup and restart capabilities of system are adequate.
Demonstrate that users can interact with the system successfully
Verify all components are integrated properly & actual processing situations will be handled
correctly
Confirm IS can handle predicted volumes of data in timely and efficient manner.
Successful completion key to user and management approval, system tests also called acceptance tests.

106
Documentation
Describes IS and helps users, managers and IT staff who must interact with it. Essential for successful
system operation and maintenance. Documentation includes the following:
Program Documentation Describes inputs, outputs and processing logic for all program modules. Starts with analysis phase and
continues during systems implementation.
System Documentation System’s functions and how they are implemented. System documentation includes data dictionary
entries, data flow diagrams, object models and screen layouts, source documents and systems request
that initiated the project. Most prepared during the systems analysis and systems design phases.
Operations Documentation Contains all information needed for processing and distributing online and printed output. Includes
following
Program, systems analyst, programmer and system identification
Scheduling Info for printed output, frequency and deadlines
Input files and where they originate, output files and destinations
E-mail and report distribution lists
Forms, including online forms
Error and Informational messages to operators and restart procedures.
Special instructions, such as security requirements
User Documentation Consists of instructions and info to users who will interact with the system and includes user manuals.
Help screens and tutorials. Includes the following:
System overview clearly describing all major system features, capabilities and limitations
Description of source document content, preparation, processing and samples instructions
Example of reports that are produced regularly.
Security and audit trail info
Explanation of responsibility for specific input, output or processing requirements
FAQs
Users prefer online documentation

107
Management Approval
Describe test results, update status of all required docs and summarize input from users who
participated in system testing. Provide detailed time schedules, cost estimates, staffing requirements for
making the system fully operational.
System Installation and Evaluation
Following sections describe system installation and evaluation tasks that are performed for every IS
project whether developed or purchased, Remaining steps in systems implementation:
Operational and Test Environments Environment for actual system operation is called Operational environment or production
environment. Environment that analysts and programmers use to develop and maintain programs is
called the test environment. Limited-access workstation.
Operational environment includes HW and SW config and settings, system utilities and any other
components that might affect system performance. Test platform rigorously before system installations
begins.
Training Requires training for users, managers and IT staff members:
Training Plan
Should start with plan early in Sys Dev process. 3 Main groups for training:
Users
System Overview, Key terms, Main menus and Sub Menus, Major systems functions,
Troubleshooting.
Managers
Project origin, Cost-benefit analysis, support for business goal, Handling system charges, Major
reports and displays, User training
IT Staff
Project history and justification, system architecture, System documentation, vendor support,
logging and resolving problems, Technical training

108
Types of training:
Vendor Training
Purchase of SW or HW, then vendor-supplied training is one of the features you should include in the
RFP (Request for Proposal) and RFQ (request for Quotation). Might have to implement training in-house
as well if IT staff customized the package.
Webinars, Podcasts and Tutorials
Many vendors offer these. Webinar combines words Web and seminar providing an interactive
experience.
Webcast one-way transmission whenever a user wants or needs training support.
Podcast Web-based broadcast that allows user to download multimedia files to PC or portable device,
can be prescheduled, made available on demand or delivered as automatic updates. Advantage is that
subscriber can access recorded material anywhere.
Tutorial series of online interactive lessons that present material and provide a dialog with users.
Outside Training Resources
Can arrange for in-house as well or any providers outside.
Training Tips
If have helpdesk they might be able to handle user training. Multimedia effective training method.
Group training sessions per function.
Select most effective place to conduct the training
Provide for learning by hearing, seeing and doing
Rely on previous trainees (they can then assist other users)
Interactive Training
Most effective, interactive, self-paced and multimedia-based:
Online Training
should include step-by-step instructions. Materials should resemble actual screens and tasks
should be typical of a user’s daily work.
Video Tutorials
No need for a big budged, Capture screens, integrate screen images and text, Capture live-
motion video, Record audio narration and then a Training video is produced.

109
Data Conversion
Existing data is loaded into the new system. Data conversion might be needed before, during or after
operational environment is complete depending on the system.
Data conversion plan must be developed as early as possible with conversion process and should be
tested when the test environment is developed. Important for new system to be loaded with accurate,
error-free data.
System changeover Process of putting new info system online and retiring the old system. Can be rapid or slow depending
on the method, There 4 different methods:
Direct Cutover Least expensive, new system occur immediately, involves more risks. Timing should be planned
properly, best to convert beginning of a quarter, calendar year or fiscal year.
Parallel Operation Both old and new IS operate fully for a specified period. When users and management are satisfied that
the new system operates correctly, the old system is terminated.
Pilot Operation Implementing complete new system at a selected location of the company, new sales reporting system
might be implemented in only one branch called the pilot site (Brooklyn POS). Old system continues to
operate for the entire organization including pilot site. If successful it will be implemented in the rest of
the organization. Combination of parallel and direct cutover methods.
Phased Operation Implement new system in stages or modules.

110
Post-Implementation Tasks
Assesses overall quality of IS. Verifies that new system meets specified requirements, complies with user
objectives and produces anticipated benefits. Evaluation includes feedback for the following areas:
Accuracy, completeness and timeliness of IS output
User satisfaction
System reliability and maintainability
Adequacy of system controls and security measures
HW efficiency and platform performance
Effectiveness of DB implementation
Performance of IT team
Completeness and quality of documentation
Quality and effectiveness of training
Accuracy of cost-benefit estimates and DEV schedules.
Can apply same techniques in post-implementation that you used to determin the system requirements
during systems analysis phase:
Interview members of management and key users
Observe users and computer operations personnel actually working on system
Read all documentation and training materials
Examine all source docs, output reports and screen displays
Use questionnaires
Analyze maintenance and help desk logs.
Final report to management:
Final versions of all system documentation
Planned modifications and enhancements to the system that have been identified
Recap of all systems Dev costs and schedules
Comparison of actual costs and schedules to the original estimates
Post-implementation evaluation

111
Glossary
acceptance tests Another term sometimes used for system tests
application development Process of constructing the programs and core modules that serve as the building blocks of the information system
attributes Describe the characteristics of objects in the class
bug tracking software Another term for defect tracking software
Capability Maturity Model Integration (CMMI)
SEI's new model that integrates software and systems development into a much larger framework
code review Another term for structured walkthrough
coding Process of turning program logic into specific instructions that the computer system can execute
cohesion Measures a module's scope and processing characteristics
control couple Shows a status flag that one module sends to another
data conversion Existing data is loaded into the new system
defect tracking software Used by system developers to document and track program defects, code changes, and replacement code
design walkthrough Reviews interface with a cross-section of people who will work with the new system and ensures that all necessary features have been included
desk checking Process of reviewing the program code to spot logic errors
direct cutover Approach that causes the changeover from the old system to the new system to occur immediately when the new system becomes operational
documentation Describes an information system and helps users, managers, and IT staff who must interact with it
exporting Sending data in an acceptable format from the old system to the new system
integrated development environment (IDE)
Makes it easier to program interactive software products by providing built-in tools and advanced features
integration testing Testing two or more programs that depend on each other
iteration planning meeting
Held at the beginning of each iteration cycle to break down the user stories into specific tasks that are assigned to team members
library module Reusable code; Can be invoked from more than one point in a structure chart
link testing Another term for integration testing
logic errors Parts of the program code that produce incorrect results
loop Indicates one or more modules are repeated
loosely coupled Modules that are independent
methods Represent program logic
module Consists of related program code organized into small units that are easy to understand and maintain
online documentation Provides immediate Help when users have questions or encounter problems
operational environment Environment for the actual system operation
operations documentation
Contains all the information needed for processing and distributing online and printed output
parallel programming Two programmers work on the same task on the same computer

112
phased operation Changeover method that allows you to implement the new system in stages, or modules
pilot operation Changeover method that involves implementing the complete new system at a selected location of the company
podcast Web-based broadcast that allows a user to download multimedia files to a PC or portable device
process improvement Large framework into which CMMI integrates software and systems development
pseudocode Technique for representing program logic that is Similar to structured English, but not language-specific
release plan Specifies when user stories will be implemented and the timing of the releases
software engineering Software development process that stresses solid design, accurate documentation, and careful testing
status flag Message one module sends to another
structure chart Shows the program modules and the relationships among them using rectangles, arrows, and other symbols
stub testing The programmer simulates each program outcome or result and displays a message to indicate whether or not the program executed successfully
subordinate modules Lower-level modules that are directed by a higher-level control module
system changeover Process of putting the new information system online and retiring the old system
system documentation Describes the system's functions and how they are implemented
test data Should contain both correct data and erroneous data and should test all possible situations that could occur
tightly coupled One module is linked to internal logic contained in another module
top-down approach Proceeds from a general design to a detailed structure
train-the-trainer Training strategy in which you can select knowledgeable users who then conduct sessions for others
training plan How to use the documentation material in future training sessions
tutorial Series of online interactive lessons that present material and provide a dialog with users
Webcast One-way transmission of a pre-recorded Webinar session, delivered whenever a user wants or needs training support

113
Table of Contents
OVERVIEW ................................................................................................................................................. 115
User Support ............................................................................................................................................. 115
User Training ......................................................................................................................................... 115
Help Desks ............................................................................................................................................. 115
Maintenance Tasks ................................................................................................................................... 115
Corrective Maintenance ....................................................................................................................... 116
Adaptive Maintenance .......................................................................................................................... 116
Perfective Maintenance ........................................................................................................................ 116
Preventive Maintenance ....................................................................................................................... 116
Maintenance Management ...................................................................................................................... 116
Maintenance Team ............................................................................................................................... 116
Maintenance requests .......................................................................................................................... 117
System Performance Management .......................................................................................................... 118
Fault Management ................................................................................................................................ 118
Performance and Workload Measurement .......................................................................................... 118
Response Time ...................................................................................................................................... 118
Bandwidth and throughput .................................................................................................................. 119
Turnaround Time .................................................................................................................................. 119
Capacity Planning .................................................................................................................................. 119
System security overview ......................................................................................................................... 119
System Security Concepts ..................................................................................................................... 119
Risk Management ................................................................................................................................. 120
Risk Identification ................................................................................................................................. 120
Threat Categories: ............................................................................................................................. 120
Risk assessment .................................................................................................................................... 120
Risk Control ........................................................................................................................................... 120
Attacker Profiles and Attacks ................................................................................................................ 121
Type of attacks and examples ............................................................................................................... 121
Security Levels ........................................................................................................................................... 121
Glossary ..................................................................................................................................................... 122

114

115
PHASE 5 – SYSTEMS SUPPORT AND SECURITY
OVERVIEW
Involves 3 main concerns: User expectations, system performance, and security requirements. Systems
analyst is like an internal consultant who provides guidance, support and training.
Systems support and security phase begins when system becomes operational and continues until
system reaches the end of its useful life.
User Support Provided in many forms:
User Training With new employees or when existing system changes or new version is released the IT department
might develop a user training package.
Help Desks To make data more accessible and to empower users. Help desk is a centralized resource staffed by IT
professionals who provide users with support they need to do their jobs. 3 Objectives:
Show people how to use system resources more effectively
Provide answers to technical or operational questions
Make users more productive by teaching them how to meet their own info needs.
Help desk staff will perform some of the following tasks:
Show user how to create a data query or report
Resolve network access or password problems
Recover damaged data
Demonstrate advanced feature of a system
Troubleshoot software issues via remote control utilities.
Maintenance Tasks
Important component of TCO, ongoing maintenance expenses determine economic life of a system.
Operational costs include supplies, equipment rental and software leases. Maintenance expenses vary
significantly during operational life and include spending to support maintenance activities.
Maintenance activities include chaning programs, procudures or documentation to ensure correct

116
system performance, adapting system to changing requirements and making system operate more
efficiently. Different types of Maintenance:
Corrective Maintenance Diagnose and fix logic errors
Replace defective network cabling
Restore proper configuration settings
Debug program code
Update drivers
Install software patch
Adaptive Maintenance
Add online capability
Crete new reports
Add new data entry field to input screen
Install links to Web site
Create employee portal
Perfective Maintenance Install additional memory
Write macros to handle repetitive tasks
Compress system files
Optimize user desktop settings
Develop library for code reuse
Install more powerful network server
Preventive Maintenance Install new antivirus software
Develop standard backup schedule
Implement regular defragmentation process
Analyze problem report for patterns
Tighten all cable connections
Maintenance Management
Requires effective management, quality assurance, and cost control.
Maintenance Team

117
System Administrator
manages computer and network systems. Primary responsibility for the operation, configuration
and security of one or more systems. Routine maintenance and preventive action.
System Analysts
Investigate and rapidly locate source of problems.
Analysis means examining the whole in order to learn about individual elements
Synthesis involves studying parts to understand the overall system
Programmers
Application programmer, systems programmer and database programmer and
programmer/analyst.
Maintenance requests
Initial Determination:
When user submits maintenance request, system administrator makes initial determination
whether request is justifiable and involves severe problem that requires immediate attention. I f
justifiable but noncritical, administrator determine whether request is within preauthorized cost
level.
Systems review committee
when request exceeds predetermined cost level or involves major config change, systems
review committee either approves or rejects.
Task Completion:
System administrator usually responsible for assigning maintenance tasks to individuals or to
team.
User notification:
Users who initiate maintenance requests expect prompt response, especially if situation directly
affects work.
Establishing Priorities:
Committee normally separates maintenance from new DEV requests when setting priorities.
Configuration Management:
CM – referred to as change control (CC), process for controlling changes in system requirements
during SW DEV. Keep track of all documentation and ensuring updates are distributed properly
and important aspects of Config management.

118
Maintenance Releases
When maintenance release methodology is used, all noncritical changes are held till they can
be implemented at the same time.
When used all changes are tested together before new system version is released, fewer
versions, less expense and less interruption for users.
Version Control
Process of tracking system releases or versions. When new version released prior release is
archived or stored. Restore old version if new version gives problems.
Baselines
Formal reference point measuring system characteristics at specific time. 3 Types:
Functional baseline: Config of system documented at beginning of project. All necessary system
requirements and design constraints
Allocated baseline: Documents at end of design phase and identifies changes since functional
baseline. Includes testing and verification.
Product baseline: describes system at beginning of system operation. Incorporates changes
made since allocated baseline and includes results of performance and acceptance tests.
System Performance Management
To ensure satisfactory support for business operations, IT department must manage system faults and
interruptions, measure system performance and workload and anticipate future needs.
Fault Management Monitoring the system for sign of trouble, logging all slystem failures, diagnosing the problem and
applying corrective action.
Performance and Workload Measurement To measure system performance, many firms use benchmark testing, uses set of standards tests to
evaluate performance and capacity. Performance measurements, called metrics can monitor number of
transactions processed in a given time period, number of records accessed and volume of data.
Response Time Overall time between request and delivery of the response. In online environment, response time is
measured from the instant the user presses ENTER until requested screen display appears. Response
time is the one that users notice and complain about the most.

119
Bandwidth and throughput Bandwidth describes amount of data system can transfer in fixed time period, bits per second.
Throughput measures actual system performance under specific circumstances and is affected by
network loads and HW efficiency.
System admin measure many other performance characteristic, typical examples:
Arrivals – number of items that appear on a device during a given observation time
Busy- Time given resource is unavailable
Completions – number of arrivals processed during given observation period
Queue Length – number requests pending for a service
Service Time – Time it takes to process given task once it reaches front of queue
Think Time – Time an app user to issue another request
Utilization – how much of a given resource required to complete a task
Wait Time – Time requests must wait for a resource to become available
Turnaround Time Applies to centralized batch processing operations. Measures time between submitting request for info
and the fulfillment of request. Also to measure IT support.
Capacity Planning Process monitoring current activity and performance levels, anticipates future activity and forecasts
resources needed to provide desired levels of service.
Can use what-if analysis vary one or more elements in a model in order to measure the effect on other
elements.
System security overview
Protects system and keeps it safe, free from danger and reliable.
System Security Concepts
CIA triangle:

120
Confidentiality protects info from unauthorized disclosure and safeguard privacy
Integrity prevents unauthorized users from creating, modifying or deleting information
Availability ensures authorized users have timely and reliable access to necessary information
Risk Management Involves constant attention to 3 interactive tasks:
Risk Identification – analyze assets, threats and vulnerabilities
Risk assessment – measures risk likelihood and impact
Risk Control – Develops safeguards that reduce risks and their impact
Risk Identification List and classify business assets. HW, SW, networks, people etc.
A threat is internal or external entity that could endanger and asset, natural disasters, SW attacks, or
theft.
Threat Categories:
THREAT CATEGORY
Extortion Hacker steals trade secrets & threaten to release if not paid
HW and SW failures Router stops functioning or SW causes app server to crash
Human error or failure Employee accidently deletes files
Natural Disasters Floods destroy company building and networked systems
Service failure Electricity is disrupted and brings entire system down for hours
SW attack Group plants destructive SW, a virus, or worm in company network
Technical obsolescence Outdated SW is slow, difficult to use and vulnerable to attacks
Theft of physical/intellectual Property Server stolen, intellectual property is stolen or used without permission, physical or electronic
Trespass and Espionage Employee enters unlocked server room and views payroll data
Vandalism Attacker defaces Web site logo or destroys CEO’s hard drive physical or electronically
Risk assessment Risk is impact of an attack multiplied by likelihood of a vulnerability being exploited. Critical risks will
head the list.
Risk Control Mitigation reduces impact of risk by careful planning and preparation.
Transference shifts risk to another asset or party
Acceptance nothing is done.

121
Attacker Profiles and Attacks ATTACKER DESCRIPTION SKILL SET
Cyberterrorist Attacks to advance political, social or ideological goals High
Employee Use unauthorized info or privileges into computer systems to steal info or cause damage
Varies
Hacker Advances to attack computer systems with malicious intent or expose flaws and improve security
High
Hacktivist Attacks to further social or political cause Varies
Script Kiddie Inexperienced or juvenile hacker to gain recognition Low
Spy Non-employee to steal info and sell it. High
Type of attacks and examples ATTACK EXAMPLE
Back Door Finds vulnerability in SW and exploits it
Denial of service One or more computer send stream of connection requests to disable Web server
DNS poisoning False DNS, Info steers user to attacker’s Web site
Dumpster diving Scours trash for valuable info
Mail Bombing Enormous volumes of e-mail sent to target address
Malicious Code Infected e-mail with viruses, worms, Trojan horses, spyware
Man in the middle Intercepts traffic and poses as recipient, after reading or modify it
Password Cracking Discover password to gain entry
Privilege Escalation Employee tricks computer into raising her account to admin level
Sniffing Network traffic is intercepted and scanned for valuable info
Social engineering Calls help desk posing as legitimate user and requests password to be changed
Spam Unwanted, useless e-mail
Spoofing IP address is forged t match trusted host.
Security Levels Physical Security
Network security
Application security
File security
User security
Procedural security

122
Glossary maintenance activities Includes activities to ensure correct system performance, adapt to changing requirements,
and operate efficiently
maintenance team Includes a system administrator and one or more systesms analysts and programmers
malware Hostile software designed to infiltrate, damage, or deny service to a computer system
network interface Combination of hardware and software that allows the computer to interact with the network
obsolete No longer supports user needs, or the platform is outmoded
offsiting Practice of storing backup media away from the main business location in order to mitigate the risk of a catastrophic disaster
permissions Another term for user rights; Describe the rights a user has to a particular file or directory on a server
power-on password Another term for BIOS-level password
pretexting Method of obtaining personal information under false pretenses
private key encryption Is symmetric; A single key is used to encrypt and decrypt information
private network Dedicated connection, similar to a leased telephone line
procedural security Concerned with managerial policies and controls that ensure secure operations
response time Overall time between a request for system activity and the delivery of the response
risk assessment Measures risk likelihood and impact
security policy Developed based on the three elements in the CIA triangle
service Application that monitors, or listens on, a particular port
service packs Maintenance releases provided by commercial software suppliers
superuser Another term for administrator
transference Shifts the risk to another asset or party
tunnel Secure network connection
turnaround time Measures the time between submitting a request for information and the fulfillment of the request
Universal Security Slot (USS)
Can be fastened to a cable lock or laptop alarm
vulnerability Security weakness or soft spot
what-if analysis Allows you to vary one or more elements in a model in order to measure the effect on other elements
Wired Equivalent Privacy (WEP)
Earliest form of wireless security; Required each wireless client to use a special, pre-shared key