Embed Size (px)
Citation preview


Post-Deployment Surveillance Report |1
Table of Contents
Binge Drinking among Male Reserve and National Guard Veterans: Data from the 2009-2011 National Health Study for a New Generation of U.S. Veterans ......................................... 1 Motorcycle Crash Mortality among Male OEF/OIF/OND Veterans within Five Years Following Separation from Service ................................... 3 Incidence and Prevalence of Selected Diseases among Users of VHA Services and Veterans of the Vietnam War, 1990-1991 Gulf War, and Operation Enduring Freedom/Operation Iraqi Freedom/Operation New Dawn (OEF/OIF/OND) ............................... 5 Data Points: Observations from the Epidemiology Program ................... 9 Appendix: Methods and Case Definitions of Specified Disease/Condition ........................ 12
ACKNOWLEDGEMENTS The Epidemiology Program, Department of Veterans Affairs, thanks Stephanie Mathis, MPH, and Robert Pack, PhD, for their contributions during the editorial process.
The Post-Deployment Surveillance Report is a biannual publication of the Epidemiology Program, Department of Veterans Affairs. Reports and supplemental information are available online at www.publichealth.va.gov/epidemiology/reports/surveillance/index.asp
Binge Drinking among Male Reserve and National Guard Veterans: Data from the 2009-2011 National Health Study for a New Generation of U.S. Veterans Yasmin Cypel, PhD, MS; Aaron Schneiderman, PhD, MPH, RN; Robert Bossarte, PhD
Epidemiology Program, Post-Deployment Health, Office of Public Health
Binge drinking has been estimated to account for more than 50 percent of annual alcohol-related deaths among U.S. adults.1,2 Numerous medical problems are associated with binge drinking, including external injuries, adverse birth outcomes, liver disease, hypertension, and other health disorders.3 Existing research has reported comparatively high levels of alcohol use disorders among Veterans returning from Iraq and Afghanistan.4 While less is known about the lifetime prevalence or correlates of binge drinking among male National Guard (NG) and Reserve Veterans of Operation Enduring Freedom/Operation Iraqi Freedom (OEF/OIF), in a recent study of alcohol use, nine percent of a sample of female NG and Reserve participants reported binge drinking in the past four weeks.5
Data from the 2009-2011 National Health Study for a New Generation of U.S. Veterans6 were obtained and analyzed to gather more information on the prevalence of binge drinking among male NG and Reserve Veterans. Analysis was limited to 10,105 male study participants: 4,536 men who served in the NG, and 5,569 men who served in a Reserve component. Binge drinking was defined as drinking five or more drinks on an occasion7, once per month or more.
The proportion of Veterans who reported binge drinking was significantly higher among NG participants when compared to Reservists (31.8 percent versus 29.4 percent; p=0.017) (supplemental table available online). The majority of binge drinkers in both the NG and Reserve were between 24 and 34 years of age; approximately 40 to 50 percent of binge drinkers reported being separated, divorced, widowed, or never married. The majority of binge drinkers, both NG and Reserve, had SF12 mental health scores (55.6 percent and 56.2 percent, respectively) below the U.S. population mean. Binge drinking was also strongly associated with frequency of alcohol use. Approximately 40 percent of binge drinkers in each of the two components reported being heavy users of alcohol
1 Naimi TS, Nelson DE, Brewer RD. The intensity of binge alcohol consumption among U.S. adults. Am J Prev Med. 2010; 38 (2): 201-207. 2 Centers for Disease Control and Prevention. Vital signs: binge drinking prevalence, frequency, and intensity among adults – United States, 2010. MMWR Morb Mortal Wkly Rep. 2012; 61(1): 14-19. 3 Centers for Disease Control and Prevention. Fact Sheets- Binge Drinking. Centers for Disease Control and Prevention. www.cdc.gov/alcohol/fact-sheets/binge-drinking.htm. Published January 16, 2014. Accessed July 29, 2015. 4 Eisen SV, Schultz MR, Vogt D, et al. Mental and physical health status and alcohol and drug use following return from deployment to Iraq or Afghanistan. Am J Public Health. 2012; Suppl 1: S66-S73. 5 Cucciare MA, Sadler AG, Mengeling MA, et al.. Associations between deployment, military rank, and binge drinking in active duty and Reserve/National Guard U.S. servicewomen. Drug Alcohol Depend. 2015; 153: 37-42. 6 Eber S, Barth S, Kang H, Mahan C, Dursa E, Schneiderman A. The National Health Study for a New Generation of United States Veterans: methods for a large-scale study on the health of recent Veterans. Mil Med. 2013; 178(9):966-969. 7 National Institute of Alcohol Abuse and Alcoholism. NIAAA council approves definition of binge drinking (pubs.niaaa.nih.gov/publications/Newsletter/winter2004/Newsletter_Number3.pdf) [PDF-1.6MB]. NIAAA Newsletter. 2004.

Post-Deployment Surveillance Report |2
(15 or more drinks of alcohol per week).8 Age, race, marital status, self-perceived mental health, and alcohol and cigarette use were significantly related (p<0.05) to binge drinking for both the NG and Reservists (Table 1). Education and military service, however, were significantly associated (p<0.05) with binge drinking among Reservists only.
The prevalence of binge drinking among male NG (31.8 percent) and Reserve (29.4 percent) Veterans is higher than the 23.2 percent reported for males in the U.S. general population in 20102, but still lower than recent reports by the Department of Defense for male active duty military personnel.9,10 While the prevalence of binge drinking among NG and Reserve Veterans does not appear elevated when compared to active duty personnel, results from this study provide an indication of problematic drinking behaviors among some members of these groups. Approximately 60 percent of participants classified as “light” or “moderate” drinkers8 also endorsed binge drinking. Enhanced assessment and intervention efforts among those across the full spectrum of alcohol use may substantially reduce problems associated with binge drinking. Continued efforts are needed to reduce the social and medical costs associated with excessive alcohol use.
Table 1. Analysis of main effects from logistic regression, weighted: National Guard versus Reserve, males only
Age <0.0001 * <0.0001 *
Race/Ethnicity 0.0318 * 0.0077 *
Marital Status 0.0002 * <0.0001 *
Body Mass Index 0.3782 0.0648
0.2607 0.4700
0.9594 0.9913
<0.0001 * <0.0001 *
Light drinking was defined for males as having approximately 1-3 drinks/week; whereas moderate and heavy drinking for males were defined as having approximately 4-14 drinks/week and 15+ drinks/week, respectively. b "Nonsmokers" responded "no" to "During the past 12 months, have you smoked cigarettes?" and "no" to "IF NO, have you ever smoked cigarettes even occasionally?". 'Current cigarette smokers' responded "yes" to smoking cigarettes in the past 12 months. ' Former cigarette smokers' responded "no" to smoking cigarettes in the past 12 months, but "yes" to ever smoking occasionally.
Research Profile: Gulf Era Twin Registry
The Gulf Era Twin Registry was initiated by VA’s Epidemiology Program to identify Veterans who are twins who served after 2001 and who are willing to participate in future research studies.
Enrollment is now closed, but the Epidemiology Program plans to reopen enrollment for recent service Veteran twin pairs and Veteran twin pairs who served during or before the 1990s.
Twin registries can make an important contribution to research. Similar twin registries have been established for Veterans of WWII and the Vietnam War. Learn more about the Gulf Era Twin Registry: http://www.publichealth.va.gov/epidemiology/studies/gulf-era-twin-registry.asp
8 US Department of Agriculture, U.S. Department of Health and Human Services. Dietary Guidelines for Americans, 2010 (www.health.gov/dietaryguidelines/dga2010/DietaryGuidelines2010.pdf), 7th edition, Washington DC: U.S. Government Printing Office; 2010. 9 Stahre MA, Brewer RD, Fonseca VP, et al.. Binge drinking among U.S. active-duty military personnel. Am J Prev Med. 2009; 36(3): 208-217. 10 Jacobson IG, Ryan MA, Hooper TI, et al. Alcohol use and alcohol-related problems before and after military combat deployment. JAMA. 2008; 300(6): 663-675.
Welcome to the first issue of the Post-Deployment Surveillance Report. This issue highlights new data on binge drinking among Reserve and National Guard Operation Enduring Freedom/Operation Iraqi Freedom (OEF/OIF) -era Veterans, and motorcycle crash mortality among OEF, OIF, and Operation New Dawn Veterans. This issue also presents data on the incidence and prevalence of select diagnoses among users of VA health services.
We welcome your feedback and questions. Please contact us if you have any questions or comments.
Stephanie Eber, MPH Managing Editor [email protected]
Robert Bossarte, PhD Director, Epidemiology Program
Aaron Schneiderman, PhD Deputy Director, Epidemiology Program
Main effect National Guard (p-values)
Reserve (p-values)
Education 0.1863 0.0016 *
Region 0.1517 0.2944
Income 0.4330 0.4697
0.3686 0.0417*
0.0276 * 0.0010 *
<0.0001 * <0.0001 *
0.0735 0.8914
Military Service
Deployment
SF12 Mental Health Score
SF12 Physical Health Score
Alcohol Use, Frequencya
Cigarette Smokingb
User of VA Health Services
*Statistically significant (p≤0.05)a

Post-Deployment Surveillance Report |3
Motorcycle Crash Mortality among Male OEF/OIF/OND Veterans within Five Years Following Separation from Service Robert Bossarte, PhD1; Deborah Dougherty, PhD2; Aaron Schneiderman, PhD, MPH, RN1; Charles Wolters, MS2
Epidemiology Program, Post-Deployment Health, Office of Public Health1
Under contract to Intellica Corporation2
Previous studies have identified the first years following separation from active duty military service as a period of increased risk for external cause mortality. In separate studies, Vietnam Veterans and 1991 Gulf War Veterans, when compared to Veterans who did not deploy, had a statistically significant increased risk for death from external causes, including motor vehicle crashes (MVCs), within the first five years following separation from service.1,2 Importantly, the differences observed in external cause mortality were no longer significant beyond five years after separation from service.2
Each year approximately 4,000 U.S. motorcyclists are killed in traffic crashes.3 At a rate of slightly more than 23 deaths per 100,000 million miles traveled, motorcyclist mortality is approximately 26 times higher than MVC mortality among occupants of passenger vehicles.3 Existing studies of Veteran mortality have not explicitly considered risk associated with motorcycle crash. The main objective of this study was to calculate time-dependent risk of motorcycle crash mortality among Veterans previously deployed to Operation Enduring Freedom, Operation Iraqi Freedom, or Operation New Dawn (OEF/OIF/OND).
Data for this project were obtained from the U.S. Department of Veterans Affairs (VA), Office of Public Health OEF/OIF/OND roster, which includes service-related information for all active duty, National Guard, and Reserve Veterans who were deployed in support of operations in Iraq or Afghanistan and have since separated or were deactivated from active duty status. Outcome data were obtained from the VA/Department of Defense Suicide Data Repository, a resource for cause of death among Veterans for the calendar years 1979 through 2011. Analyses were stratified by age and restricted to males,
1 Centers for Disease Control and Prevention. Postservice Mortality among Vietnam Veterans. JAMA. 1987; 36(5): 61-64. 2 Kang HK, Bullman TA. Mortality among U.S. Veterans of the Persian Gulf War: 7-Year Follow Up. Am J of Epidemiol. 2001; 154(5): 399-405. 3 U.S. Department of Transportation, National Highway Traffic Saftey Administration. Traffic Safety Facts, 2012 Data: Motorcycles. U.S. Department of Transportation, National Highway Traffic Safety Administration. http://www-nrd.nhtsa.dot.gov/Pubs/812035.pdf. Published June 2014. Accessed July 29, 2015.
due to the modest percentage of female OEF/OEF/OND Veterans and the comparatively small number of motorcycle related fatalities among them. Deaths resulting from motorcycle crashes were identified using International Classification of Disease, Tenth Revision (ICD10) codes V20-V29. Mortality risk was calculated using the Life Test Procedure in SAS (version 9.4) for each of the first five years following separation/deactivation from service. The period of observation began on the first day of separation/deactivation and ended on the day of death, up to five years post-separation, or December 31, 2011. Trends in risk and average percentage of change over time were calculated using the Joinpoint analysis program.
A total of 1,315,446 male OEF/OIF/OND Veterans were included in the analyses. Within the first five years following separation, a total of 234 male OEF/OIF/OND Veterans died from a motorcycle crash. Among the youngest Veterans, risk for motorcycle crash mortality was highest in the first year following separation/deactivation and decreased with time; more than 70 percent of all decedents were 18 to 29 years of age (Figure 1). Results from the Joinpoint analyses confirm trends identified from the life table calculations. Among male Veterans ages 18 to 29 years, risk for motorcycle crash mortality decreased by an average of 26.9 percent with each year of observation, a trend that was statistically significant (p=0.05). No statistically significant changes in motorcycle crash mortality risk were identified for other age groups.
These results support earlier findings that identified increased mortality risk due to MVCs both during the five year period following military separation and among younger male Veterans during this recognized period of elevated risk.1,2,4 Previous research on mortality among Gulf War Veterans did not identify statistically significant associations between deployment-related exposure and risk for MVC death.5 Reasons for motorcycle crash mortality risk are not clear. Additional research is needed to understand factors associated with increased risk for motor vehicle mortality that may be unique to OEF/OIF/OND Veterans. Analysis of national crash data has identified lack of helmet use, alcohol use, and excess speed as factors routinely associated with increased risk for fatal motorcycle crashes.6 Age specific interventions that focus on
4 Lincoln AE, Hooper TI, Kang HK, Debakey SF, Cowan DN, Gackstetter GD. Motor Vehicle Fatalities Among Gulf War Era Veterans: Characteristics, Mechanisms, and Circumstances. Traffic Inj Prev. 2006; 7(1): 31-37. 5 Gackstetter GD, Hooper TI, DeBakey SF, et al. Fatal Motor Vehicle Crashes among Veterans of the 1991 Gulf War and Exposure to Munitions Demolitions at Khamisiyah: A Nested Case-Control Study. Am J Ind Med. 2006; 49(4): 261-270. 6 Williams, A. Motorcyclist Traffic Fatalities by State; 2014 Preliminary Data. Governors Highway Safety Association.

Post-Deployment Surveillance Report |4
motorcyclists in the most vulnerable age groups should be developed and implemented. Enhanced public health communications campaigns to promote motorcycle safety training and licensure, consistent use of approved protective gear, and avoidance of high-risk behaviors when motorcycling are recommended to reduce additional loss of life.
Figure 1: Trend of hazard rate for motorcycle mortality among deployed OEF/OIF/OND Veterans by age and number of years following separation/deactivation from military service
0
0.00002
0.00004
0.00006
0.00008
0.0001
0.00012
Year 1 Year 2 Year 3 Year 4 Year 5
Haza
rd R
ate
Overall 18-29 Years
30-39 Years 40-49 Years
RESEARCH HIGHLIGHT: Prevalence of a Positive Screen for PTSD among Participants in the National Health Study for a New Generation of U.S. Veterans The National Health Study for a New Generation of U.S. Veterans is a health study of 20,563 Veterans who served in Operation Enduring Freedom (OEF) and Operation Iraqi Freedom (OIF), and non-deployed Veterans who served during the same time period.
Researchers sent Veterans a survey which included questions that help VA health care providers screen Veterans for post-traumatic stress disorder (PTSD). This is the first study to report positive screens for PTSD in OEF/OIF-era Veterans who were not deployed and those who do not use VA health care.
Researchers determined if Veterans screened positive for PTSD by looking at survey answers to the PTSD Checklist Civilian Version (PCL-C). The PCL-C is a screening instrument routinely used in VA.
www.ghsa.org/html/publications/spotlight/motorcycle2014.html. Published May 2015. Accessed July 29, 2015.
PTSD in Recent Veterans: Who Screens Positive?
Post-Deployment Surveillance Report |5
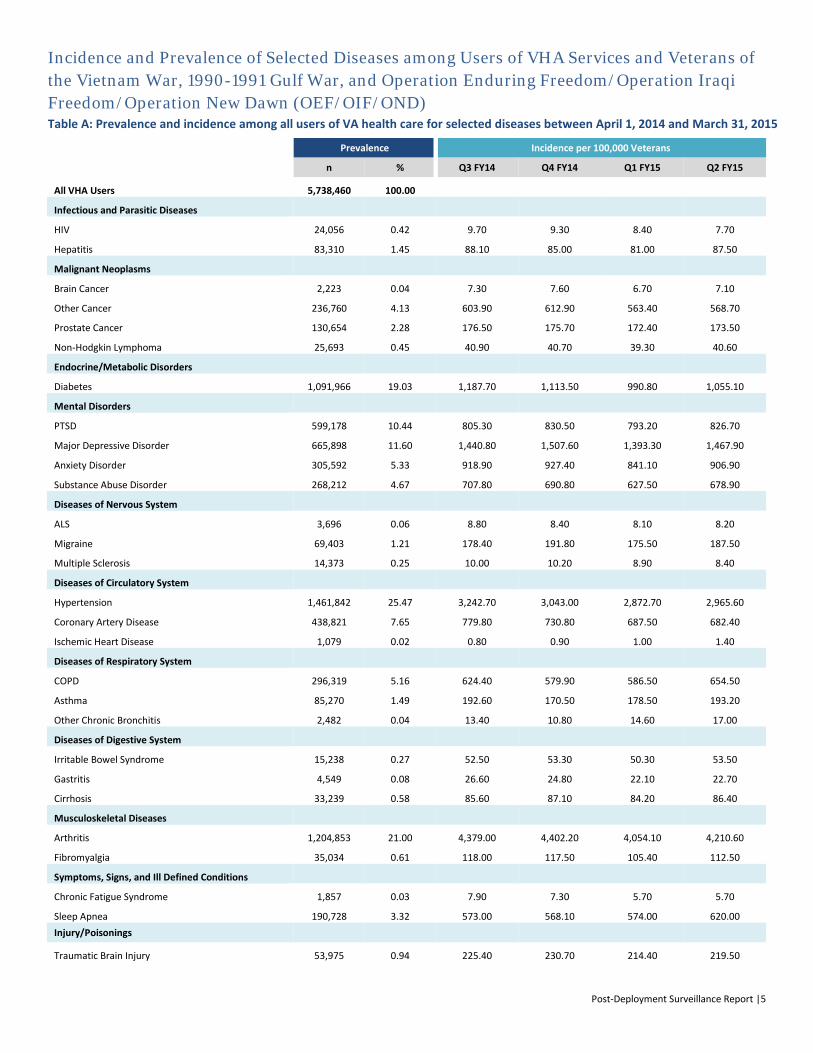
Incidence and Prevalence of Selected Diseases among Users of VHA Services and Veterans of the Vietnam War, 1990-1991 Gulf War, and Operation Enduring Freedom/Operation Iraqi Freedom/Operation New Dawn (OEF/OIF/OND) Table A: Prevalence and incidence among all users of VA health care for selected diseases between April 1, 2014 and March 31, 2015
Prevalence Incidence per 100,000 Veterans
n % Q3 FY14 Q4 FY14 Q1 FY15 Q2 FY15
All VHA Users 5,738,460 100.00 Infectious and Parasitic Diseases
HIV 24,056 0.42 9.70 9.30 8.40 7.70
Hepatitis 83,310 1.45 88.10 85.00 81.00 87.50
Malignant Neoplasms Brain Cancer 2,223 0.04 7.30 7.60 6.70 7.10
Other Cancer 236,760 4.13 603.90 612.90 563.40 568.70
Prostate Cancer 130,654 2.28 176.50 175.70 172.40 173.50
Non-Hodgkin Lymphoma 25,693 0.45 40.90 40.70 39.30 40.60
Endocrine/Metabolic Disorders Diabetes 1,091,966 19.03 1,187.70 1,113.50 990.80 1,055.10
Mental Disorders PTSD 599,178 10.44 805.30 830.50 793.20 826.70
Major Depressive Disorder 665,898 11.60 1,440.80 1,507.60 1,393.30 1,467.90
Anxiety Disorder 305,592 5.33 918.90 927.40 841.10 906.90
Substance Abuse Disorder 268,212 4.67 707.80 690.80 627.50 678.90
Diseases of Nervous System 8.40 8.20 ALS 3,696 0.06 8.80 8.10
Migraine 69,403 1.21 178.40 191.80 175.50 187.50
Multiple Sclerosis 14,373 0.25 10.00 10.20 8.90 8.40
Diseases of Circulatory System 1,461,842 3,242.70 2,965.60 Hypertension 25.47 3,043.00 2,872.70
Coronary Artery Disease 438,821 7.65 779.80 730.80 687.50 682.40
Ischemic Heart Disease 1,079 0.02 0.80 0.90 1.00 1.40
Diseases of Respiratory System 624.40 579.90 COPD 296,319 5.16 586.50 654.50
Asthma 85,270 1.49 192.60 170.50 178.50 193.20
Other Chronic Bronchitis 2,482 0.04 13.40 10.80 14.60 17.00
Diseases of Digestive System 0.27 52.50 Irritable Bowel Syndrome 15,238 53.30 50.30 53.50
Gastritis 4,549 0.08 26.60 24.80 22.10 22.70
Cirrhosis 33,239 0.58 85.60 87.10 84.20 86.40
Musculoskeletal Diseases 1,204,853 4,379.00 4,054.10 4,210.60 Arthritis 21.00 4,402.20
Fibromyalgia 35,034 0.61 118.00 117.50 105.40 112.50
Symptoms, Signs, and Ill Defined Conditions 0.03 7.90 5.70 Chronic Fatigue Syndrome 1,857 7.30 5.70
Sleep Apnea 190,728 3.32 573.00 568.10 574.00 620.00 Injury/Poisonings
0.94 Traumatic Brain Injury 53,975 225.40 230.70 214.40 219.50

Post-Deployment Surveillance Report |6
Table B: Prevalence and incidence among Vietnam Veterans using VA health care for selected diseases between April 1, 2014 and March 31, 2015
Prevalence Crude Incidence per 100,000 Veterans Age Adjusted Incidence per 100,000 Veterans
n % Q3 FY14 Q4 FY14 Q1 FY15 Q2 FY15 Q3 FY14 Q4 FY14 Q1 FY15 Q2 FY15
Vietnam VHA Users 1,004,527 100.00
Infectious and Parasitic Diseases
HIV 2,527 0.25 3.60 3.90 3.80 3.30 3.88 1.92 1.59 1.60
Hepatitis 17,321 1.72 78.30 75.30 64.20 75.90 57.76 79.60 74.75 70.42
Malignant Neoplasms
Brain Cancer 436 0.04 7.90 7.00 6.50 9.10 4.69 6.93 3.74 6.25
Other Cancer 54,383 5.41 768.50 784.00 718.60 730.80 583.06 567.00 524.78 550.74
Prostate Cancer 37,404 3.72 275.00 271.20 274.60 280.40 189.72 202.87 217.71 211.05
Non-Hodgkin Lymphoma 6,641 0.66 48.00 49.60 47.00 47.60 33.45 38.05 37.59 35.70
Endocrine/Metabolic Disorders
Diabetes 282,203 28.09 1,592.30 1,491.20 1,296.90 1,366.70 1,145.21 1,085.38 996.43 1,000.19
Mental Disorders
PTSD 183,680 18.29 858.90 846.10 760.30 770.60 506.13 482.05 429.21 440.25
Major Depressive Disorder 95,677 9.52 979.30 1,024.60 895.10 932.50 763.41 846.58 671.15 760.91
Anxiety Disorder 36,330 3.62 559.20 568.50 507.90 517.60 414.40 416.11 401.53 377.52
Substance Abuse Disorder 37,303 3.71 522.70 499.00 447.80 469.80 470.77 406.12 351.99 398.06
Diseases of Nervous System
ALS 697 0.07 8.50 8.90 7.90 8.50 8.45 5.89 6.26 5.20
Migraine 3,650 0.36 55.60 51.10 45.20 52.80 44.85 42.37 27.16 46.52
Multiple Sclerosis 2,023 0.20 6.20 6.30 6.20 5.20 5.56 4.89 4.04 9.04
Diseases of Circulatory System
Hypertension 307,324 30.59 4,430.20 4,156.50 3,961.50 4,077.80 3,180.99 2,979.80 2,793.78 3,014.81
Coronary Artery Disease 110,544 11.00 1,094.40 1,017.40 959.50 980.10 826.32 759.11 761.25 760.47
Ischemic Heart Disease 246 0.02 0.80 1.10 1.20 1.80 0.32 0.63 1.31 0.79
Diseases of Respiratory System
COPD 67,569 6.73 749.60 700.70 716.50 811.10 596.26 584.02 564.70 643.95
Asthma 10,868 1.08 132.10 112.80 122.80 138.10 92.48 77.73 83.29 85.91
Other Chronic Bronchitis 584 0.06 16.80 14.10 17.10 22.40 12.09 15.01 15.59 11.20
Diseases of Digestive System
Irritable Bowel Syndrome 1,436 0.14 25.10 25.90 24.10 27.70 17.47 18.11 14.51 18.47
Gastritis 1,161 0.12 35.00 36.50 29.40 29.90 32.74 27.14 23.82 20.40
Cirrhosis 8,409 0.84 115.30 111.30 103.00 111.90 81.66 92.09 79.20 94.11
Musculoskeletal Diseases
Arthritis 200,679 19.98 3,380.50 3,331.90 3,017.30 3,121.60 2,611.68 2,655.93 2,330.95 2,480.89
Fibromyalgia 3,825 0.38 85.40 83.80 69.90 73.50 63.62 63.81 61.31 50.44
Symptoms, Signs, and Ill Defined Conditions
Chronic Fatigue Syndrome 199 0.02 5.90 4.70 3.70 3.10 5.07 3.88 4.04 3.64
Sleep Apnea 40,732 4.05 598.30 584.80 571.70 605.00 408.30 402.84 399.52 403.89 Injury/Poisonings
Traumatic Brain Injury 3,303 0.33 78.80 77.00 70.60 79.00 68.97 65.11 68.33 62.39

Post-Deployment Surveillance Report |7
Table C: Prevalence and incidence among 1990-1991 Gulf War Veterans using VA health care for selected diseases between April 1, 2014 and March 31, 2015
Prevalence Crude Incidence per 100,000 Veterans Age Adjusted Incidence per 100,000 Veterans
n % Q3 FY14 Q4 FY14 Q1 FY15 Q2 FY15 Q3 FY14 Q4 FY14 Q1 FY15 Q2 FY15
Gulf War VHA Users 205,232 100.00
Infectious and Parasitic Diseases 14.40 12.80 15.60 HIV 1,053 0.51 11.00 5.27 5.31 6.14 3.35
Hepatitis 1,493 0.73 52.40 58.00 51.60 61.40 30.39 35.61 26.76 26.79
Malignant Neoplasms
4.40
Brain Cancer 69 0.03 3.60 5.70 6.30 1.61 4.04 2.82 7.98
Other Cancer 3,510 1.71 275.70 284.50 240.40 278.80 293.84 363.48 257.35 318.37
Prostate Cancer 1,595 0.78 71.10 77.80 92.10 80.20 123.53 156.58 155.76 145.50
Non-Hodgkin Lymphoma 449 0.22 23.50 20.90 19.90 23.40 33.75 173.82 26.95 20.00
Endocrine/Metabolic Disorders
1,226.60
Diabetes 29,836 14.54 1,322.90 1,112.10 1,185.40 1,037.30 1,421.71 1,152.41 973.64
Mental Disorders
1,914.20
909.62
1,083.83
854.72 PTSD 41,984 20.46 1,974.90 2,181.60 1,878.90 784.51
Major Depressive Disorder 32,000 15.59 2,399.10 2,453.50 2,325.20 2,256.00 1,175.26 1,061.72 1,117.20 952.86
Anxiety Disorder 13,946 6.80 1,427.30 1,419.20 1,247.70 1,249.10 802.96 601.18 672.18 546.43
Substance Abuse Disorder 9,806 4.78 786.60 756.30 696.20 755.80 496.65 319.83 308.50 382.44
Diseases of Nervous System
ALS 72 0.04 2.20 4.30 8.50 4.90 0.62 2.98 8.38 3.29
Migraine 4,537 2.21 266.70 358.20 306.60 299.40 105.07 113.44 120.13 113.54
Multiple Sclerosis 715 0.35 15.40 16.60 10.70 9.90 5.74 5.52 3.01 5.84
Diseases of Circulatory System
3,278.50
3,634.67
Hypertension 47,378 23.09 3,197.40 2,938.50 2,937.60 2,651.10 3,364.74 2,425.68
Coronary Artery Disease 5,931 2.89 429.00 396.50 394.90 384.60 647.67 669.98 619.38 625.35
Ischemic Heart Disease 29 0.01 1.50 0.00 0.00 0.70 0.28 0.00 0.00 0.13
Diseases of Respiratory System
286.37
COPD 3,803 1.85 341.60 303.50 305.20 334.40 886.87 302.64 518.88
Asthma 4,228 2.06 245.70 244.30 239.50 243.80 126.54 108.21 111.50 144.09
Other Chronic Bronchitis 52 0.03 9.50 11.50 7.80 5.60 9.90 7.89 14.59 11.18
Diseases of Digestive System
145.00
66.01
Irritable Bowel Syndrome 1,493 0.73 132.10 125.50 133.70 62.78 57.19 75.79
Gastritis 90 0.04 16.80 14.40 10.70 14.10 13.63 24.88 9.40 11.88
Cirrhosis 666 0.32 49.20 49.80 40.60 64.50 190.20 35.98 34.46 62.69
Musculoskeletal Diseases
6,247.60
3,159.73
Arthritis 54,217 26.42 6,213.10 5,896.60 5,760.60 3,700.83 3,824.94 4,076.78
Fibromyalgia 2,722 1.33 208.70 205.00 194.40 205.00 105.16 89.30 76.30 113.01
Symptoms, Signs, and Ill Defined Conditions Chronic Fatigue Syndrome 321 0.16 30.20 36.20 27.90 24.20 16.28 16.01 8.21 10.13
Sleep Apnea 11,806 5.75 1,143.10 1,144.40 1,142.90 1,278.10 563.78 778.62 560.33 691.26
Injury/Poisonings 85.15
Traumatic Brain Injury 2,056 1.00 256.00 232.20 218.00 226.60 103.40 92.02 104.31

Post-Deployment Surveillance Report |8
Table D: Prevalence and incidence among Operation Enduring Freedom/Operation Iraqi Freedom/Operation New Dawn (OEF/OIF/OND) Veterans using VA health care for selected diseases between April 1, 2014 and March 31, 2015
Prevalence Crude Incidence per 100,000 Veterans Age Adjusted Incidence per 100,000 Veterans
n % Q3 FY14 Q4 FY14 Q1 FY15 Q2 FY15 Q3 FY14 Q4 FY14 Q1 FY15 Q2 FY15
OEF/OIF/OND VHA Users 723,143 100.00
Infectious and Parasitic Diseases
0.16
13.11
3.36 HIV 1,177 14.00 13.60 13.02 4.12 7.57 2.98
Hepatitis 2,246 0.31 52.56 57.67 51.71 54.75 34.69 43.38 36.77 24.52
Malignant Neoplasms
3.62
4.93
Brain Cancer 211 0.03 3.96 3.93 1.12 1.53 8.71 4.42
Other Cancer 4,460 0.62 116.22 117.72 114.84 118.24 301.24 208.43 438.33 220.19
Prostate Cancer 962 0.13 16.57 20.40 18.41 18.58 77.74 294.37 115.05 80.68
Non-Hodgkin Lymphoma 538 0.07 13.52 11.55 13.90 11.13 19.56 26.00 36.70 19.24
Endocrine/Metabolic Disorders
428.39
411.32
757.22
Diabetes 24,725 3.42 399.95 421.99 615.81 785.40 697.00
Mental Disorders
4,807.00
PTSD 194,189 26.85 4,660.59 4,804.29 4,683.63 1,815.25 1,847.84 1,659.53 1,854.02
Major Depressive Disorder 112,981 15.62 3,676.18 3,845.15 3,833.05 3,885.95 1,632.49 1,861.75 1,489.20 1,779.78
Anxiety Disorder 71,863 9.94 2,821.15 2,783.76 2,574.17 2,737.98 1,040.17 1,174.56 952.95 1,046.86
Substance Abuse Disorder 38,097 5.27 1,320.85 1,270.91 1,157.27 1,214.01 469.74 525.91 379.22 418.85
Diseases of Nervous System
2.02
ALS 109 0.02 2.33 2.04 3.05 4.25 4.74 3.70 1.92
Migraine 23,850 3.30 717.13 751.04 711.48 721.24 488.04 257.88 275.79 247.92
Multiple Sclerosis 1,136 0.16 14.93 15.64 15.04 11.36 4.70 5.97 5.71 4.01
Diseases of Circulatory System
1,375.09
2,186.80
Hypertension 64,993 8.99 1,425.60 1,367.75 1,408.07 2,427.31 2,432.41 2,514.28
Coronary Artery Disease 4,450 0.62 155.87 130.98 133.24 123.76 522.97 261.34 457.33 210.73
Ischemic Heart Disease 14 0.00 0.93 0.00 1.12 0.87 0.60 0.00 1.14 0.57
Diseases of Respiratory System
310.69
446.33
535.95
COPD 8,679 1.20 288.30 423.43 371.75 365.64 422.88
Asthma 13,518 1.87 388.16 366.86 363.28 362.48 187.39 164.73 405.40 200.01
Other Chronic Bronchitis 87 0.01 3.49 3.17 4.03 5.23 5.26 5.31 5.59 2.81
Diseases of Digestive System
143.17
59.23 Irritable Bowel Syndrome 3,719 0.51 137.66 135.30 134.25 55.81 83.34 59.35
Gastritis 136 0.02 7.45 7.01 5.83 6.33 10.19 17.00 5.64 3.52
Cirrhosis 480 0.07 13.28 16.52 17.71 17.03 24.73 20.22 35.45 28.90
Musculoskeletal Diseases
6,862.01
Arthritis 159,615 22.07 6,978.47 6,551.20 6,441.45 5,344.11 4,967.25 3,867.53 4,099.55
Fibromyalgia 4,923 0.68 161.54 155.77 161.53 165.42 94.68 85.56 80.18 86.40
Symptoms, Signs, and Ill Defined Conditions
7.76
21.19 Chronic Fatigue Syndrome 265 0.04 8.86 9.96 9.87 12.01 10.47 7.14
Sleep Apnea 27,968 3.87 933.67 916.26 988.60 1,062.07 657.80 674.73 2,806.42 793.40
Injury/Poisonings
30,764
Traumatic Brain Injury 4.25 1,286.20 1,314.78 1,227.74 1,160.62 1,235.56 440.15 414.70 1,920.67

Post-Deployment Surveillance Report |9
Data Points: Observations from the Epidemiology Program Age-adjusted incidence rates among Vietnam, 1990-1991 Gulf War, and OEF/OIF/OND Veterans for “Other Chronic Bronchitis” between April 1, 2014 and March 31, 2015
Q3 FY 14 Q4 FY 14 Q1 FY15 Q2 FY15Vietnam 12.09 15.01 15.59 11.2Gulf War 9.9 7.89 14.59 11.18OEF/OIF/OND 5.26 5.31 5.59 2.81
0
2
4
6
8
10
12
14
16
18
Age
Adju
sted
Inci
denc
e pe
r 100
,000
Vet
eran
s
• MAIN FINDING: Rates for “other chronic bronchitis” were highest among Vietnam Veterans when compared to other Veteran groups.
Population prevalence (percent) of Hepatitis among all VHA users, Vietnam, 1990-1991 Gulf War, and OEF/OIF/OND Veterans between April 1, 2014 and March 31, 2015
0.31
0.73
1.72
1.45
0 0.2 0.4 0.6 0.8 1 1.2 1.4 1.6 1.8 2
OEF/OIF/OND
Gulf War
Vietnam
VHA users
Prevalence (%)
• MAIN FINDING: The population prevalence of hepatitis was highest among Vietnam Veterans when compared to other Veteran groups.

Post-Deployment Surveillance Report |10
Population prevalence (percent) of Migraine among all VHA users, Vietnam, 1990-1991 Gulf War, and OEF/OIF/OND Veterans between April 1, 2014 and March 31, 2015
3.3
2.21
0.36
1.21
0 0.5 1 1.5 2 2.5 3 3.5
OEF/OIF/OND
Gulf War
Vietnam
VHA users
Prevalence (%)
• MAIN FINDING: The population prevalence of migraine was highest among OEF/OIF/OND Veterans when compared to other Veteran groups.
Population prevalence (percent) of Sleep Apnea among all VHA users, Vietnam, 1990-1991 Gulf War, and OEF/OIF/OND Veterans between April 1, 2014 and March 31, 2015
3.87
5.75
4.05
3.32
0 1 2 3 4 5 6 7
OEF/OIF/OND
Gulf War
Vietnam
VHA users
Prevalence (%)
• MAIN FINDING: The population prevalence of sleep apnea was highest among Gulf War Veterans when compared to other Veteran groups.

Post-Deployment Surveillance Report |11
Crude rate of PTSD among Female OEF/OIF/OND Veterans between April 1, 2014 and March 31, 2015
0
1,000
2,000
3,000
4,000
5,000
6,000
7,000
8,000
3rd Qtr, FY14 4th Qtr, FY14 1st Qtr, FY15 2nd Qtr, FY15
Rate
per
100
,000
Vet
eran
s
Quarter, Fiscal Year
18 to 29
30 to 39
40 to 49
50 to 59
60 to 69
Crude rate of PTSD among Male OEF/OIF/OND Veterans between April 1, 2014 and March 31, 2015
0
1,000
2,000
3,000
4,000
5,000
6,000
7,000
8,000
3rd Qtr, FY14 4th Qtr, FY14 1st Qtr, FY15 2nd Qtr, FY15
Rate
per
100
,000
Vet
eran
s
Quarter, Fiscal Year
18 to 29
30 to 39
40 to 49
50 to 59
60 to 69
• MAIN FINDING: Across age groups, rates of PTSD among women were not the same as rates of PTSD among men.
Age Ranges
Age Ranges
Post-Deployment Surveillance Report |12
Appendix: Methods and Case Definitions of Specified Disease/Condition Methods
Calculations included Veterans who were deployed in support of the Vietnam War, 1990-1991 Gulf War, or Operation Enduring Freedom/Operation Iraqi Freedom/ Operation New Dawn (OEF/OIF/OND) and visited the VA health care system between April 1, 2014 and March 31, 2015. Cases, prevalent and incident, were identified using the International Classification of Disease, Ninth Revision, Clinical Modification (ICD9) codes related to the specified diseases and conditions (table below) found in the inpatient and outpatient administrative health care records. Only the primary diagnostic positions were considered in disease/condition identification. Prevalent cases included all Veterans who were treated for a specified disease or condition during the surveillance period. Incident cases included Veterans who contracted the illness during the surveillance period; they were not diagnosed with the disease/condition of interest prior to April 1, 2014. Incident risk was calculated for each quarter of the surveillance period. The incidents per quarter were divided by the number of disease-free Veterans receiving care during the quarter.
Age adjustments were made to the incident risk figures to allow for comparison of the three Veteran cohorts. This adjustment ensures that any observed cohort differences in the disease incidence risks were not confounded by the differences in their age distribution. The age grouping used for the adjustments (18-29, 30-39, 40-49, 50-59, 60-69, 70-79, 80+) took into consideration the age range of the three cohorts. The first step in calculating the disease specific age-adjusted incident risk was to determine the age-adjustment weight. The weight for each age category equaled the proportion of that category in the standard population, defined here as all Veterans receiving care within the VA health care system from April 1, 2014 through March 31, 2015, deployed and non-deployed. Within each disease/condition of interest, the cohort-age-specific crude incident risk was multiplied by the age-adjustment weight to yield the age-specific adjustment factor. Finally, the age-adjusted incident risk for each cohort was calculated by summing these factors. (For more detail regarding the age-adjustment procedure, refer to: Klein RJ, Schoenborn CA. Age Adjustment Using the 2000 Projected U.S. Population. Statistical Notes. 2001; 20: 1-10.).

Post-Deployment Surveillance Report |13
Case Definitions of Specified Disease/Condition
Condition ICD-9-CM Codes (primary diagnosis only)
Human Immunodeficiency Virus (HIV) 042
Hepatitis 070, 571.1, 571.4
Brain Cancer 191
Other Cancer 140-184, 186-190, 192-199, 201, 203, 205-208
Prostate Cancer 185
Non-Hodgkin Lymphoma 200, 202, 204
Diabetes 249, 250
Posttraumatic Stress Disorder (PTSD) 309.81
Major Depressive Disorder 296.2, 296.3, 296.9, 300.4, 311
Anxiety Disorder 300.0, 300.2, 300.3
Substance Abuse Disorder 304, 305.1-305.9
Amyotrophic Lateral Sclerosis (ALS) 335.2
Migraine 346
Multiple Sclerosis 340
Hypertension 401
Coronary Artery Disease (CAD) 410.00-410.02, 410.20-410.22, 410.30-410.32, 410.40-410.43, 410.50-410.53, 410.60-410.62, 410.70-410.72, 410.80-410.82, 410.90-410.92, 411.0, 411.1, 411.81, 411.89, 412, 413.0, 413.1, 413.9, 414.00-414.07, 414.2, 414.3, 414.8, 414.9, v45.81, v45.82
Ischemic Heart Disease 410-414, Excluding CAD cases
Chronic Obstructive Pulmonary Disease (COPD) 490-491.7, 491.9, 492, 494-496
Asthma 493
Other Chronic Bronchitis* 491.8
Irritable Bowel Syndrome 564.1
Gastritis 235
Cirrhosis 571.2, 571.5, 571.6, 577.8, 587
Arthritis 710-716, 719-721, 725-728, 729.0, 729.1, 729.4
Fibromyalgia 729.1
Chronic Fatigue Syndrome 780.71
Sleep Apnea 327.23
Traumatic Brain Injury (TBI) 310.2, 800, 801, 803, 804, 850-854, 905.0, 907.0, 950, 959.01, v15.52
*The ICD-9-CM code for other chronic bronchitis includes constrictive bronchiolitis. There is no ICD-9-CM code specifically for constrictive bronchiolitis.