Embed Size (px)
Citation preview


i | Mound Road Benefit-Cost Analysis
Table of Contents
Table of Contents .......................................................................................................................................................... i
List of Tables ............................................................................................................................................................... iii
List of Figures ............................................................................................................................................................. iv
Key to Abbreviations ................................................................................................................................................... v
Executive Summary ................................................................................................................................................... vii
1.0 Introduction ..................................................................................................................................................... 1
1.1 Project Description ................................................................................................................................... 1
1.2 Project Location ....................................................................................................................................... 1
1.3 Project Goals............................................................................................................................................ 4
2.0 General Principles .......................................................................................................................................... 6
2.1 Baseline Description & Existing Conditions.............................................................................................. 6
2.1.1 Traffic Volumes ........................................................................................................................... 6
2.1.2 Pavement .................................................................................................................................... 6
2.1.3 Traffic Operations ........................................................................................................................ 6
2.1.4 Safety .......................................................................................................................................... 7
2.1.5 Economic Conditions .................................................................................................................. 8
2.2 Mound Road Project & Changes to Baseline Conditions ......................................................................... 8
2.2.1 Pavement .................................................................................................................................... 8
2.2.2 Segment Improvements, Widening, Signing & Lighting .............................................................. 8
2.2.3 Traffic Signalization ..................................................................................................................... 9
2.2.4 ITS and Connected Vehicle Technology ..................................................................................... 9
2.2.5 Non-Motorized Users .................................................................................................................. 9
2.3 Analysis Period & General Assumptions ................................................................................................ 11
2.4 Affected Users........................................................................................................................................ 11
3.0 Benefits .......................................................................................................................................................... 12
3.1 Value of Travel Time Savings ................................................................................................................ 12
3.2 Safety Benefits ....................................................................................................................................... 14
3.2.1 Existing Safety Conditions ........................................................................................................ 14
3.2.2 Safety Benefits .......................................................................................................................... 18
3.3 Emission Reduction Benefits ................................................................................................................. 20
3.4 Vehicle Operating Cost Savings ............................................................................................................ 22
3.5 ITS & Connected Vehicle Technology.................................................................................................... 23
3.5.1 Proposed CV Infrastructure ....................................................................................................... 23
3.5.2 General CV Assumptions .......................................................................................................... 23
3.5.3 CV Benefits ............................................................................................................................... 25
3.6 Additional Benefit Discussion ................................................................................................................. 26
4.0 Costs .............................................................................................................................................................. 30

ii | Mound Road Benefit-Cost Analysis
4.1 Capital Expenditures .............................................................................................................................. 30
4.2 Operating & Maintenance Expenditures................................................................................................. 31
5.0 Results of Benefit-Cost Analysis ................................................................................................................ 32
6.0 References .................................................................................................................................................... 33
Appendix A – Benefit-Cost Analysis (BCA) Spreadsheet ...................................................................................... 35
Appendix B – Synchro/SimTraffic Mound Road Arterial Report ........................................................................... 62
Appendix C – MCDR Connected Vehicles Initiative Memo .................................................................................... 75

iii | Mound Road Benefit-Cost Analysis
List of Tables
Table 1: Mound Road Baseline, Modifications to Baseline, and Expected Impacts ....................................................... vii
Table 2: Mound Road BCA Key Parameters ................................................................................................................ viii
Table 3: Mound Road BCA Total Benefits at 7% Discount Rate...................................................................................... x
Table 4: 2011-2015 Mound Road Crash Location by Crash Type ................................................................................. 16
Table 5: 2011-2015 Mound Road Crash Location by Time of Day ................................................................................ 16
Table 6: 2011-2015 Mound Road Crash Location by Pavement Condition ................................................................... 16
Table 7: Mound Road Connected Vehicle Technology Benefits .................................................................................... 26
Table 8: Mound Road Project Costs .............................................................................................................................. 30
Table 9: Recommended Concrete Treatments and Associated Costs .......................................................................... 31
Table 10: Mound Road Benefit-Cost Analysis Results .................................................................................................. 32

iv | Mound Road Benefit-Cost Analysis
List of Figures
Figure 1: Mound Road Location on a State & Regional Context ..................................................................................... 2
Figure 2: Mound Road Location & Employers ................................................................................................................. 3
Figure 3: MDOT Strategic Freight Goals.......................................................................................................................... 4
Figure 4: Existing Peak Hour Level of Service ................................................................................................................. 7
Figure 5: Mound Road Proximity to 1,273 Mile Iron Belle Trail and Freedom Trail ........................................................ 10
Figure 6: Average Annual Percent Travel Time Savings ............................................................................................... 13
Figure 7: 2011-2015 Mound Road Crash Distribution by Severity ................................................................................. 14
Figure 8: 2011-2015 Mound Road Affected Individuals by Crash Severity .................................................................... 14
Figure 9: 2011-2015 Mound Road and Michigan Crash Rates ...................................................................................... 15
Figure 10: Predicted Annual Crash Frequency Reduction by Crash Severity in Baseline Year (2016) ......................... 19
Figure 11: Connected Vehicle Population over Time ..................................................................................................... 24
Figure 12: Mound Road Existing PASER Rating ........................................................................................................... 27
Figure 13: Typical Pavement Conditions along Mound Road (15 Mile Road to Metro parkway) ................................... 28

v | Mound Road Benefit-Cost Analysis
Key to Abbreviations
AADT Annual Average Daily Traffic AASHTO American Association of State Highway and Transportation Officials ADA Americans with Disabilities Act AERIS Applications for the Environment: Real-Time Information Synthesis BCA Benefit Cost Analysis BCR Benefit Cost Ratio CMAQ Congestion Mitigation and Air Quality CMF Crash Modification Factor CO Carbon Monoxide CO2 Carbon Dioxide DOT Department of Transportation DSRC Dedicated Short Range Communication EDI Eberle Design Inc EIA Energy Information Administration EMSI Economic Modeling Specialists International EPA Environmental Protection Agency FAST (ACT) Fixing America’s Surface Transportation FAST Fixed Automated Spray Technology FCA Fiat Chrysler Automobiles FHWA Federal Highway Administration GDP Gross Domestic Product GM General Motors GPS Global Positioning System INFRA Infrastructure for Rebuilding America ITS Intelligent Transportation Systems KABCO Fatal (K), Incapacitating Injury (A), Non-incapacitating injury (B), Possible Injury (C), No Injury (O) LED Light-emitting diode LOS Level of Service MCDR Macomb County Department of Roads MDOT Michigan Department of Transportation MOE Measure of Effectiveness MTIC Mound Road Industrial Corridor Technology and Innovation MUTCD Manual on Uniform Traffic Control Devices MVMT Million Vehicle Miles Traveled NCHRP National Cooperative Highway Research Program NHFP National Highway Freight Program NHS National Highway System NHTSA National Highway Traffic Safety Administration NPV Net Present Value NOx Nitrogen Oxide OEM Original Equipment Manufacturers OMB Office of Management and Budget PASER Pavement Surface Evaluation an Rating PCC Portland Cement Concrete PCD Purdue Coordination Diagram PM Particulate Matter RSU Road Side Unit SEMCOG Southeast Michigan Council of Governments

vi | Mound Road Benefit-Cost Analysis
SPF Safety Performance Functions TACOM Tank-Automotive and Armaments Command TARDEC Tank Automotive Research, Development and Engineering Center TCAT Traffic Crash Analysis Tool TIA Traffic Improvement Association TRB Transportation Research Board V2I Vehicle-to-Infrastructure V2V Vehicle-to-Vehicle VOC Volatile Organic Compound

vii | Mound Road Benefit-Cost Analysis
Executive Summary
The Mound Road Industrial Corridor Technology and Innovation (MTIC) Project, also known as Innovating Mound, is a partnership of Macomb County, the City of Sterling Heights and the City of Warren, Michigan, with the objective of transforming nine miles of the Mound Road corridor from a 30-year-old 8-lane roadway in dilapidated and decaying conditions to a next-generation critical commercial corridor of national significance. Mound Road is part of the National Highway System, is the longest non-freeway segment included in the National Highway Freight Program, and is vital to the economic development of southeast Michigan. The corridor is home to several national automotive, aerospace, defense, and advance manufacturing companies including the General Motors Technical Center, Ford Axle Plant and Transmission Plant, Fiat Chrysler Automobiles Stamping Plant and Assembly Plant, U.S. Army’s Tank-Automotive and Armaments Command and Tank Automotive Research, Development and Engineering Center, and BAE Systems. Overall the corridor supports a direct employment total of 20,200 people which support 17,720 jobs in Macomb County and an additional 98,100 jobs in the state of Michigan. Currently the Mound Road corridor is characterized by substandard infrastructure conditions which are in need of improvement. Table 1 presents a summary of key baseline problems to be addressed, proposed changes to baseline conditions, and type of projected impacts.
Table 1: Mound Road Baseline, Modifications to Baseline, and Expected Impacts
Current Status/Baseline & Problem to be Addressed
Change to Baseline Type of Impacts
Deteriorated pavement and infrastructure conditions which have exceeded service life
Reconstruction with high performance concrete pavement (P1 Modified); New drainage; Curb & gutter; Driveways; Restoration & landscaping
Lower operations & maintenance costs; Increased safety from improved pavement friction; Noise reduction; Lower vehicle maintenance costs; Infrastructure conducive to business retention and attraction
Inefficient traffic flow progression; Substandard signal design; Congestion from capacity constraints in the northern end of the corridor
Signal optimization and modernizations; Widening of the roadway between 17 Mile to M-59; Connected Vehicle Technology; Fiber Optic Communications; ITS Technology, FAST system and weather station
Travel Time Savings for passenger vehicles, public transportation, freight, and emergency vehicles; Emission reductions for a wide array of pollutants; Fuel savings; Significant expected crash reductions; Infrastructure conducive to business retention and attraction
Non-MUTCD conforming signing MUTCD conforming traffic signs Expected crash reductions
Limited non-motorized user mobility and connectivity
Non-motorized multi-use paths; Two pedestrian bridges
Increase safety, mobility, access & connectivity for non-motorized users; Community integration; Infrastructure conducive to business retention and attraction
Low visibility at night Energy efficient unified lighting Increase safety; Lower energy consumption
Overall infrastructure conditions which do not reflect business and employment needs and characteristics of the corridor
ITS and Connected Vehicle Technologies throughout the entire corridor
Travel time savings; Significant safety benefits; Emission reduction; Fuel consumption reduction; Infrastructure conducive to business retention and attraction; Advancement of Connected Vehicle Technology applications and goals

viii | Mound Road Benefit-Cost Analysis
A benefit-cost analysis based on the guidance for INFRA grant application was conducted for those project improvements and benefit/cost categories which are reasonably expected to have an impact on the affected users of the project. The primary items included in this assessment consist of an analysis of the following categories:
Travel Time Savings
Safety Benefits
Emissions Reduction
Vehicle Operating Cost Savings (i.e. Fuel)
ITS & Connected Vehicle Technology Savings
Capital Expenditures
Operating & Maintenance Expenditures
Table 2 presents key parameters/assumptions used in the BCA analysis to obtained projected benefits and costs, with a more thorough description and information on each parameter/assumption found under each respective chapter and in Appendix A.
Table 2: Mound Road BCA Key Parameters
Name Value Unit Reference Source Key1
Total Project Cost $216,960,000 Total ($2016) na
Construction 3 Years (2020 - 2022) na
Analysis Period 20 Years (2023 - 2042) na
Values Expressed in (Baseline) 2016 $ BCA for INFRA (9)
Affected Users All Existing Number 2015 Traffic Data (6, Appendix A)
Discount Rate 7% Percent BCA for INFRA (9)
Inflation Adjustment Varies by Year Ratio BCA for INFRA (9, Appendix A)
AADT Varies per Segment Number 2015 Traffic Data (6, Appendix A)
Percent Buses Varies per Segment Percent 2015 Traffic Data (6, Appendix A)
Percent Trucks Varies per Segment Percent 2015 Traffic Data (6, Appendix A)
Peak Volume in AM Peak 15.0% Percent 2015 Traffic Data (6)
Peak Volume in Off Peak 65.0% Percent 2015 Traffic Data (6)
Peak Volume in PM Peak 20.0% Percent 2015 Traffic Data (6)
Average Passenger Vehicle Occupancy 1.39 per Passenger Vehicle BCA for INFRA (9)
Average Truck Vehicle Occupancy 1.00 per Truck Vehicle BCA for INFRA (9)
Average Vehicle Occupancy for O (No Injury) Crashes
1.39 per Crash BCA for INFRA (9)
Segment Length Varies per Segment Miles Synchro, SimTraffic Simulation
(Appendix B)
No-Build Average Travel Time per Vehicle (AM, PM, Off Peak)
Varies per Segment Seconds Synchro, SimTraffic Simulation
(Appendix B)
Build Average Travel Time per Vehicle (AM, PM, Off Peak)
Varies per Segment Seconds Synchro, SimTraffic Simulation
(Appendix B)
No-Build Average Speed per Vehicle (AM, PM, Off Peak)
Varies per Segment Miles per Hour Synchro, SimTraffic Simulation
(Appendix B)
Build Average Speed per Vehicle (AM, PM, Off Peak)
Varies per Segment Miles per Hour Synchro, SimTraffic Simulation
(Appendix B)
No-Build Annual Maintenance Cost $4,930,000 $ per Year ($2016) Macomb County Department of
Roadways
No-Build Annual Maintenance Cost Increase over 2016
2.5% Percent Appendix A
Build Annual Maintenance Cost Varies per Year per Projected PASER
conditions $ per Year ($2016) Appendix A
Annual Crashes Varies per Injury &
Crash Category KABCO Scale 2011-2015 (10, Appendix A)

ix | Mound Road Benefit-Cost Analysis
Value of Travel Time Savings - All Purpose
$14.10 per Person-Hour
($2016) BCA for INFRA (9)
Value of Travel Time Savings - Truck $27.20 per Person-Hour
($2016) BCA for INFRA (9)
Value of Travel Time Savings - Bus $28.30 per Person-Hour
($2016) BCA for INFRA (9)
KABCO Level Values - O $3,200 per Individual ($2016) BCA for INFRA (9)
KABCO Level Values - C $63,900 per Individual ($2016) BCA for INFRA (9)
KABCO Level Values - B $125,000 per Individual ($2016) BCA for INFRA (9)
KABCO Level Values - A $459,100 per Individual ($2016) BCA for INFRA (9)
KABCO Level Values - K $9,600,000 per Individual ($2016) BCA for INFRA (9)
Value of Emission - VOC $1,872 $ per Short Ton ($2016) BCA for INFRA (9)
Value of Emission - NOx $7,377 $ per Short Ton ($2016) BCA for INFRA (9)
Value of Emission - PM $337,459 $ per Short Ton ($2016) BCA for INFRA (9)
Value of Emission - CO $4,697.12 $ per Metric Ton ($2016) Wang et. al. 1994 (20)
Value of Emission - CO2 Varies per Year $ per Short Ton ($2016) Luckow et. al. 2016 (21, Appendix A)
Value of Gasoline $2.25 $ per Gallon ($2016) U.S. EPA 2016 Gasoline - All Grades
(25)
Crash Modification Factors (CMF) Varies per Treatment Rate CMF Clearinghouse & MDOT CMFs
(13, 14, Appendix A)
Emission Equivalency Factors (VOC, NOx, PM, CO)
Varies per Speed & Pollutant (20 Year
Project Life) Grams per Mile
MDOT CMAQ Emission Factors (17, Appendix A)
CO2 Emission Formula Based
(Speed Dependent) Grams per Mile
Barth and Boriboonsomsin 2009 (18, Appendix A)
Fuel Consumption Formula Based
(Speed Dependent) Milli-Liters per Kilometer
Evans and Herman 1976, 1978 (22, 23, Appendix A)
Growth in AADT over 2015 per year 1.5% Percent Historical Spot Volumes (7)
Growth in Annual Travel Times over 2015
1.5% Percent Historical Spot Volumes (7)
Growth in Annual Crashes over 2015 1.5% Percent Historical Spot Volumes (7)
Growth in Annual Emissions over 2015 1.5% Percent Historical Spot Volumes (7)
Growth in Annual Fuel Consumption over 2015
1.5% Percent Historical Spot Volumes (7)
Connected Vehicle Market Penetration Rate
Varies per Year (0% to 100%)
Percent FHWA-JPO-14-125 (26, Appendix A,
Appendix C)
Connected Vehicle Mobility Benefit Varies per Year (0%
to 25%) Percent Guler et. al. 2014 (28, Appendix A)
Connected Vehicle Safety Benefit Varies per Year (0%
to 80%) Percent NHTSA (30, Appendix A)
Connected Vehicle Emission Benefit - VOC
Varies per Year (0% to 10.89%)
Percent Liu et. al. 2017 (29, Appendix A)
Connected Vehicle Emission Benefit - NOx
Varies per Year (0% to 15.51%)
Percent Liu et. al. 2017 (29, Appendix A)
Connected Vehicle Emission Benefit - PM
Varies per Year (0% to 19.09%)
Percent Liu et. al. 2017 (29, Appendix A)
Connected Vehicle Emission Benefit - CO
Varies per Year (0% to 13.23%)
Percent Liu et. al. 2017 (29, Appendix A)
Connected Vehicle Emission Benefit - CO2
Varies per Year (0% to 6.55%)
Percent Liu et. al. 2017 (29, Appendix A)
Connected Vehicle Fuel Benefit Varies per Year (0%
to 13%) Percent FHWA-JPO-16-225 (27, Appendix A)
1. Refer to Chapter 6 and Appendix A for additional information

x | Mound Road Benefit-Cost Analysis
The results of the BCA analysis are based on the key parameters listed on the table above, a 2016 baseline year, 2020 to 2022 construction period, and a 20-year 2023 to 2042 analysis period. The results indicate the following benefits discounted at 7% (Table 3):
Table 3: Mound Road BCA Total Benefits at 7% Discount Rate
BCA Category Total Discounted at 7%
Travel Time Savings $ 284,943,820
Safety Benefits $ 232,161,183
Emission Reduction Benefits $ 5,136,765
Vehicle Operating Cost Savings $ 17,974,215
ITS & Connected Vehicle Technology Savings $ 289,979,213
Capital Expenditures $ (154,947,662)
Operating & Maintenance Expenditures $ 46,556,394
NPV at 7% $ 721,803,927
BCR 5.66
The results of the BCA for the Mound Road project indicate a Net Present Value (NPV) discounted at 7% of $721,803,927. This corresponds to a Benefit-Cost Ratio (BCR) of 5.66. The BCA analysis indicates that the project yields a return on investment which far surpasses the total project cost.

1 | Mound Road Benefit-Cost Analysis
1.0 Introduction
1.1 Project Description
The Mound Road Industrial Corridor Technology and Innovation (MTIC) Project is a partnership of Macomb County, the City of Sterling Heights and the City of Warren, Michigan, with the objective of transforming nine miles of the Mound Road corridor from a 30-year-old 8-lane roadway in dilapidated and decaying conditions to a next-generation critical commercial corridor of national significance. Mound Road is part of the National Highway System (NHS) and is the longest non-freeway segment included in the National Highway Freight Program (NHFP) in Michigan with approximately 12.24 miles and is vital to the economic development of southeast Michigan. Mound Road connects state-owned roads/highways Interstate 696 (I-696) to Michigan 59 (M-59) and serves a significant industrial corridor. The corridor acts as the primary transportation route for several national automotive, aerospace, defense, and advanced manufacturing companies. The MTIC Project area is home to the General Motors Technical Center in Warren with over 17,000 employees, Ford Axle Plant and Transmission Plant in Sterling Heights, US Army’s Tank-Automotive and Armaments Command (TACOM) and Tank Automotive Research, Development and Engineering Center (TARDEC) in Warren, Fiat Chrysler Automobiles (FCA) Stamping Plant and Assembly Plant in Sterling Heights, and BAE Systems in Sterling Heights. Most of these major employers have been operating in the corridor for decades but demand for redevelopment is growing. For example, global defense contractor BAE Systems moved into their 81 acre campus in March 2012, their first in Michigan. According to the Southeast Michigan Council of Governments (SEMCOG), employment between 2015 and 2040 is forecasted to grow 7% in Sterling Heights and 10% in Warren. These job growth rates meet or exceed the regional forecast of 7% (1). An economic impact analysis of the Mound Road Corridor was completed in March 2017 by Economic Modeling Specialists International (Emsi). Emsi’s analysis found that the Mound Road corridor has a direct employment total of 20,200 people. Moreover these jobs support another 17,720 jobs in Macomb County. Additionally, the 20,200 jobs along Mound Road support another 98,100 jobs in the Michigan economy outside of Macomb County (2). Given the current dilapidated infrastructure conditions along the corridor and the number of manufacturing and research facilities of vital national importance, the project aims to renovate and establish a next-generation critical commercial corridor via:
High performance concrete pavement for improved surface rideability and extensive service life
Intelligent Transportation Systems (ITS) for optimized traffic operations and proactive incident management
Connected vehicle technology deployment to enhance freight movement and facilitate overall real-time communication between vehicle and infrastructure (V2I)
Comprehensive signal infrastructure and signage improvements to improve traffic flow and safety along the corridor for passenger and commercial / industrial freight
Two grade separated pedestrian crossings supplemented by the installation of non-motorized multi-use paths to improve non-motorized user safety, mobility and promote regional trails
Install energy efficient unified lighting to increase visibility along the corridor and reduce energy consumption
1.2 Project Location
The MTIC Project is located in the cities of Sterling Heights and Warren, Macomb County, Michigan. Within these two cities Mound Road extends for nine miles starting at the intersection with I-696 to the south and proceeds north to the intersection with M-59 (Figure 1, 2). This entire nine mile section falls within the Detroit Urbanized Area and is part of the NHS and the NHFP. The corridor is an 8-lane divided roadway for six miles in length between I-696 and 17 Mile Road, and a 6-lane divided roadway for three miles between 17 Mile Road and M-59. Land uses surrounding the corridor are primarily commercial and industrial, with primary manufacturing installations located throughout the extent of the corridor. These employers of vital importance are indicated in red in Figure 2.

2 | Mound Road Benefit-Cost Analysis
Figure 1: Mound Road Location on a State & Regional Context

3 | Mound Road Benefit-Cost Analysis
Figure 2: Mound Road Location & Employers

4 | Mound Road Benefit-Cost Analysis
1.3 Project Goals
The Mound Road project is a regionally significant project. Substantial portions of the corridor have been in the Long Range Plan for southeast Michigan for over a decade. The project will further the policies and goals of the federal and state level. The FAST Act established a national policy of maintaining and improving the condition and performance of the National Multimodal Freight Network (“the Network”), to ensure that the Network provides a foundation for the U.S. to compete in the global economy. The FAST Act specifies goals associated with this national policy related to the condition, safety, security, efficiency, productivity, resiliency, and reliability of the Network, and also to reduce the adverse environmental impacts of freight movement on the Network. These goals are to be pursued in a manner that is not burdensome to State and local governments (3). The FAST Act also established a new NHFP to improve the efficient movement of freight on the National Highway Freight Network (NHFN) and support several goals, including (4):
Investing in infrastructure and operational improvements that strengthen economic competitiveness, reduce congestion, reduce the cost of freight transportation, improve reliability, and increase productivity;
Improving the safety, security, efficiency, and resiliency of freight transportation in rural and urban areas; Improving the state of good repair of the NHFN; Using innovation and advanced technology to improve NHFN safety, efficiency, and reliability; Improving the efficiency and productivity of the NHFN; Improving State flexibility to support multi-State corridor planning and address highway freight connectivity;
and Reducing the environmental impacts of freight movement on the NHFN
The State of Michigan has adopted very similar policies and goals for the roads under its jurisdiction. In a supplement to the 2035 Michigan Transportation Plan, MDOT has proposed its own strategic goals for freight as shown in Figure 3 (5).
Figure 3: MDOT Strategic Freight Goals

5 | Mound Road Benefit-Cost Analysis
The Mound Road project goals align closely with those established by the MDOT and the U.S. DOT. The main goals of the Mound Road project are to:
Enhance and support national and regional economic efficiency, productivity and competitiveness
Reduce congestion
Improve safety and security
Improve state of good repair
Implement advance technology for operational, safety and network maintenance improvements

6 | Mound Road Benefit-Cost Analysis
2.0 General Principles
2.1 Baseline Description & Existing Conditions
The MTIC project represents nine miles of primary arterial roadway on the National Highway System within Macomb County in the southeast region of Michigan. The north-south corridor is an 8-lane divided roadway for six miles in length between I-696 and 17 Mile Road, and a 6-lane divided roadway for three miles in length between 17 Mile Road and M-59. The speed limit throughout the entire corridor is 50 mph. The median is 50 feet wide.
2.1.1 Traffic Volumes
According to 2015 traffic volume data, the corridor has an Average Annual Daily Traffic (AADT) of approximately 70,000 vehicles, split almost equally by direction. The AADT varies between mile road cross streets where the highest volumes are typically experienced along the southern section of the corridor (6). Peak volumes occur between 7:00 AM – 9:00 AM and 3:00 PM – 6:00 PM. These hours comprise approximately 15% and 20% of the total daily traffic respectively (6). Historical traffic volumes are not available for the entire corridor, however, historical spot volumes indicate variance in traffic growth ranging from 1% to 6% depending on the location (7). Given the variation in traffic growth projections and the lack of comprehensive historical data points, an annual growth projection of 1.5% is assumed applicable for the entire corridor under existing conditions. This growth is assumed constant and is not expected to be affected by capacity constrains given that Mound Road is a primary arterial road servicing key major commercial and industrial facilities, acts as a primary thoroughfare connecting I-696 and M-59 which experience approximately 170,000 and 90,000 AADT respectively, and is not currently characterized by any intersections with a level of service (LOS) F (Figure 4) which would indicate potential intersection operations at full capacity. This value is also suggested as an acceptable expected traffic growth rate by the Macomb County Department of Roads (MCDR). The 2015 traffic data indicates that the average percentage of trucks in the corridor is approximately 4.7%, with the highest percentage of freight traffic occurring in the NB direction of Mound Road between 13 Mile and 18 Mile Roads. Buses, primarily school buses, constitute on average 0.3% of the total traffic in the corridor.
2.1.2 Pavement
Existing pavement throughout the corridor is Portland Cement Concrete (PCC) which has exceeded its service life. Per SEMCOG Pavement Surface Evaluation and Rating (PASER) pavement condition data, the pavement in the majority of the project area is in poor condition with few segments in fair condition. Historical pavement data indicates that pavement conditions in the last ten years have deteriorated throughout the entire corridor, a process which is expected to continue and increase in scope as conditions worsen (8). Damages to the deteriorated pavement are further exacerbated by aggressive freeze-thaw cycles typical of Michigan climatic conditions. As a result, the MCDR is currently budgeting $4.6 million each year for concrete replacement with an additional $0.3 million a year to monitor the corridor for major pavement deficiencies such as significant cracking or pot holes. Additional costs result from the continuous required work zone set ups for the annual pavement maintenance efforts, in particular for user delay costs. While difficult to quantify, given the type of vital commercial/industrial installations along the corridor, user delay costs along with deteriorated infrastructure conditions can be unusually high and potentially hinder further economic development within the corridor. Under a no-built scenario and given the current poor condition of the pavement, it is expected that maintenance costs will increase in the future. In addition, it is likely that user delay will increase proportionally as a result of longer maintenance periods required in order to maintain the roadway.
2.1.3 Traffic Operations
The Mound Road corridor is divided by nine primary signalized intersections and several additional signals located at the main entrances of the larger commercial/industrial installations (i.e. TACOM, GM etc.) and at several median crossovers. A traffic model of existing conditions of the corridor indicates unacceptable LOS E for two primary intersections. Figure 4 provides the overall intersection level of service for the nine primary intersections.

7 | Mound Road Benefit-Cost Analysis
Figure 4: Existing Peak Hour Level of Service
Nearly all of the signals can be upgraded to improve both operational efficiency and safety. Operational inefficiencies in the corridor include but are not limited to:
Outdated or obsolete vehicle detection system
Uncoordinated or inadequate signal timing optimization
As a result, travel times through the corridor can be unreasonably excessive with poor traffic progression during the critical peak hours. Additional congestion conditions tend to stem as a result of a bottleneck created at 17 Mile Road. This is a result of a sudden drop in capacity from the transition from an 8-lane divided to a 6-lane divided roadway, despite volumes between the two areas being relatively similar.
2.1.4 Safety
Safety concerns exist throughout the Mound Road corridor. A 5-year crash analysis determined that the average crash rate is greater than that of the State of Michigan, primarily as a result of the high frequency of rear-end crashes. Primary safety concerns in the corridor include but are not limited to:
Diagonal span signal installation
Inadequate number of signal heads per approach
Low signal head visibility (i.e. signal head placement, lack of backplates)
Poor intersection illumination
Incandescent 8” signal heads and case signs
Unmarked or low-visibility crosswalks
Lack of pedestrian countdown signals
Non-ADA compliant intersection crossings
Non-conforming MUTCD signing
Lack of midblock crossings
LOS Control Delay per Vehicle Criteria (seconds)
A < 10 B 10 to 20 C 20 to 35 D 35 to 50 E 50 to 80 F > 80

8 | Mound Road Benefit-Cost Analysis
With respect to non-motorized users, in several areas along the corridor, pedestrians have to travel to the nearest intersection to cross Mound Road. Depending on the location, these distances can be as much as 0.5 miles, thus resulting in risky pedestrian behaviors associated with crossings at uncontrolled and unmarked locations.
2.1.5 Economic Conditions
The Mound Road corridor is a vitally-important national asset that employs over 20,000 workers and facilitates freight movement for key aerospace, defense and automotive manufacturing/research facilities such as the Warren General Motors Technical Center, the Sterling Height Ford Axle and Transmission Plan, the Sterling Heights FCA Stamping and Assembly Plant, and the U.S. Army’s TACOM and TARDEC facilities. As indicated before, a 2017 economic impact analysis found that a total of 20,200 people are employed along the corridor. These jobs support an additional 17,720 jobs in Macomb County alone. The combine earnings total $2.8 billion annually and taxes on production nearing $190 million (2). Given the significant number of employers of national importance that this corridor supports, the costs associated with infrastructure critical deficiencies can result in negative economic outcomes.
2.2 Mound Road Project & Changes to Baseline Conditions
The Mound Road project is designed to rectify existing roadway, operational and safety shortfalls for the corridor, and is expected to have important and long-lasting effects on the baseline conditions of not only the immediate locality, but also the County, Metro Detroit and the State of Michigan. These improvements include but are not limited to critical infrastructure updates including roadway and signal modernization, substantial operational and safety improvements, and implementation of innovative technologies such as deployment of connected vehicle technology (i.e. V2I) and leveraging of automotive assets located along Mound Road to further connected and autonomous vehicle technology.
2.2.1 Pavement
The most critical roadway infrastructure update included in the project is the complete reconstruction of Mound Road with high performance PCC pavement (P1 Modified). The P1 Modified concrete is based on optimized aggregate gradation and 25 to 40 percent replacement of the PCC in the concrete mixture with a supplementary cementituous material (slag cement, fly ash). The mix is more expensive to produce but its benefits are considerable as this mix as the following characteristics:
More durable
Easier to place
Ultimate strength higher than standard aggregate grades mixes
Superior roadway friction
Low life-cycle cost
30 year minimum service life
Due to its superiority, this high performance concrete mix is now specified exclusively by the Michigan Department of Transportation for high volume concrete roadways.
2.2.2 Segment Improvements, Widening, Signing & Lighting
Additionally the reconstruction will incorporate updates to the curb and gutter along the roadway, improvement to driveways affected by the reconstruction for improved access management, drainage improvements, and landscaping which will increase the corridor’s curb appeal. Existing lighting along the corridor will also be upgraded to improve visibility and safety for both motorized and non-motorized users. All signing along the corridor will be replaced with MUTCD conforming signs. This is expected to significantly improve safety by adequately providing drivers with all essential roadway information. The project will additionally eliminate the bottleneck on Mound Road between 17 Mile Road and M-59 where the road capacity narrows from an 8-lane divided highway to a 6-lane divided highway. The widening of this three mile segment has been in the SEMCOG regional long range plan for decades.

9 | Mound Road Benefit-Cost Analysis
2.2.3 Traffic Signalization
Significant signal modernization will be implemented on both the primary intersections and all signalized median crossovers. Primary signal modernization will include the following upgrades:
Mast arm signal layout
Intelligent Transportation Systems (ITS) cabinet and controller with battery back-up
12” Light-Emitting Diode (LED) signal head
LED illuminated case signs
Backplates
Illuminated mast arm mounted street name signs
Pedestrian countdown signals (audible)
ADA compliant pedestrian pushbuttons
High-visibility crosswalks
Wireless vehicle detection
2.2.4 ITS and Connected Vehicle Technology
Each primary signal will be equipped with advanced ITS technologies to significantly improve safety and intersection operational efficiency. These include:
Video surveillance capabilities through closed-circuit televisions
Performance measures and Purdue Coordination Diagram (PCD) modules and customizations
Video analytics program running in concert with Oculairs to assist in incident management
Work zone ITS/connected vehicle technology to enhance safety and improve mobility during construction
Dilemma zone detection equipment at all of the intersections for the Mound Road approaches
Eberle Design Inc (EDI) data aggregator to provide cost effective remote access to real-time traffic data and corresponding measures of effectiveness (MOE) for various data points from any isolated or network intersection or arterial roadway.
To support future advancements and innovations in roadway safety and operations, connected vehicle technology will be deployed throughout the corridor. This includes the installation of approximately 50 roadside units (RSU) at strategic locations along all of the nine miles of Mound Road. To make immediate use of the roadside units, up to 50 on-board connected vehicle units will be made available for emergency response vehicles or public transit vehicles. Communications for the technology will be supported via the installation of 12 total miles of fiber optic communication cabling installed along the network. It is the intent of this project that the capabilities of existing automotive facilities will be leveraged in concert with all of the Vehicle to Infrastructure (V2I) deployments to further the advancement of the development of connected vehicles applications and testing with Original Equipment Manufacturers (OEM). To combat winter icing conditions on bridges, the projected proposes to install an environmental sensing station in the corridor along with Fixed Automated Spray Technology (FAST) units on the bridge decks crossing four separate drains: the Red Run Drain, the Beaver Creek, the Sterling Relief Drain, and the Plumbrook Drain. The FAST system is being deployed to support and supplement winter maintenance operations by monitoring winter weather conditions and preventing snow and ice from bonding to the surface by automatically spraying anti-icing solutions at the applicable areas. The FAST system will improve service delivery to the motoring public with the safe, timely, and rapid application of chemicals on the bridge roadway surfaces. Currently these locations are more prone to crashes when the pavement condition is icy.
2.2.5 Non-Motorized Users
The project consists of the installation of two grade separated non-motorized crossings on Mound Road. The first bridge is proposed near Metro Parkway (16 Mile Road) to facilitate users of the Macomb County Freedom Trail and to improve access to the 1,273 mile Iron Belle Trail which runs from Detroit to the Michigan/Wisconsin border.

10 | Mound Road Benefit-Cost Analysis
The second bridge is proposed to be located on the south end of the corridor near 13 Mile Road. Figure 5 illustrates a map of the Iron Belle Trail and Freedom Trail in Macomb County and its proximity to Mound Road.
Figure 5: Mound Road Proximity to 1,273 Mile Iron Belle Trail and Freedom Trail

11 | Mound Road Benefit-Cost Analysis
2.3 Analysis Period & General Assumptions
The Mound Road project BCA encompasses all of the components of the project in the assessment of the costs of the project as well as its benefits. The analysis period covers the full initial development and construction period of the project plus 20 years of operations following the completion of construction for the assessment of the costs and benefits. The 20 year period has been selected in order to minimize BCA projection errors resulting from exceedingly long term future uncertainties in the infrastructure, travel patterns, economic conditions etc. Construction of the project is expected to last three construction seasons with a start date of 2020 and an end date of 2022. The project is expected to be fully operational by 2023. As a result, all benefits are expected to initiate in 2023 and are assessed 20 years following this date with a BCA assessment end date of 2042. Per the Benefit-Cost Analysis Guidance for INFRA Applications, this BCA utilizes a 2016 base year. Inflation adjustments for the study for values incurred prior to 2016 are based upon the Gross Domestic Product (GDP) deflator adjustment factors. Similarly, in accordance with this guidance and Office of Management and Budget (OMB) Circular A-94, all benefits and costs presented in this BCA use a real discount rate of 7% per year (9).
2.4 Affected Users
The Mound Road project will directly benefit all of the existing users which currently use the facility. This includes both motorized and non-motorized users which on average is approximately 70,000 AADT for both directions. It must be stressed that a significant portion of the users directly benefiting from the project are employees of industries of key national importance, including the U.S. Army’s TACOM and TARDEC facilities, GM Tech Center campus, as well as manufacturing plants for the Big Three (i.e. Ford, GM, and FCA). In addition nearly 4.7% of the cumulative 70,000 AADT using the Mound Road corridor are trucks. It is expected that deployment of connected vehicle technologies will significantly improve freight movement along the corridor as well as furthering the development of connected vehicle applications. While the infrastructure, operational, and safety improvements for the project are significant, this BCA assumes no new additional users will be attracted to the corridor as a result of the improvements. Instead this BCA assumes that the same number of existing users utilizing Mound Road under the no-build scenario will be utilizing the corridor under the build scenario. Similarly to the existing no-build scenario, this BCA assumes a 1.5% annual growth in traffic volumes for the build scenario. This projection is based on the examination of available historical spot volume data along the corridor (7). The growth is assumed constant for the analysis period of the BCA and is not expected to be affected by capacity constraints given that Mound Road is a primary arterial road in the north-south direction servicing key major commercial and manufacturing facilities, acts as a primary thoroughfare connecting I-696 and M-59 both of which are characterized by significant AADT volumes, and is expected to have improved capacity over existing conditions due to signal modernization and optimization as well as the introduction of additional travel lanes in the northern section of the corridor. This value is also suggested as an acceptable expected traffic growth rate by the MCDR. Lastly, traffic patterns for the project are not expected to change over existing baseline conditions. As a result, AM and PM peak traffic volumes under the built scenario are expected to comprise approximately 15% and 20% of the total daily traffic respectively (6).
12 | Mound Road Benefit-Cost Analysis
3.0 Benefits
The benefits chapter represents a discussion of the analysis conducted for those items which are reasonably expected to result in positive economic value to the affected users of the project and the public at large. These discussions intend to supplement and closely reflect the analysis conducted in the attached BCA spreadsheets (see Appendix A for more information). The benefits analysis also acknowledges that transportation improvements may result in a mix of positive and negative outcomes. These nuances are considered throughout this assessment. The primary items under the benefits analysis include an assessment of:
Travel times
Safety
Emissions
Vehicle operating costs
ITS & Connected Vehicle Technology Additional items are also discussed in qualitative terms due to the difficulties in quantifying certain topics with a high confidence level.
3.1 Value of Travel Time Savings
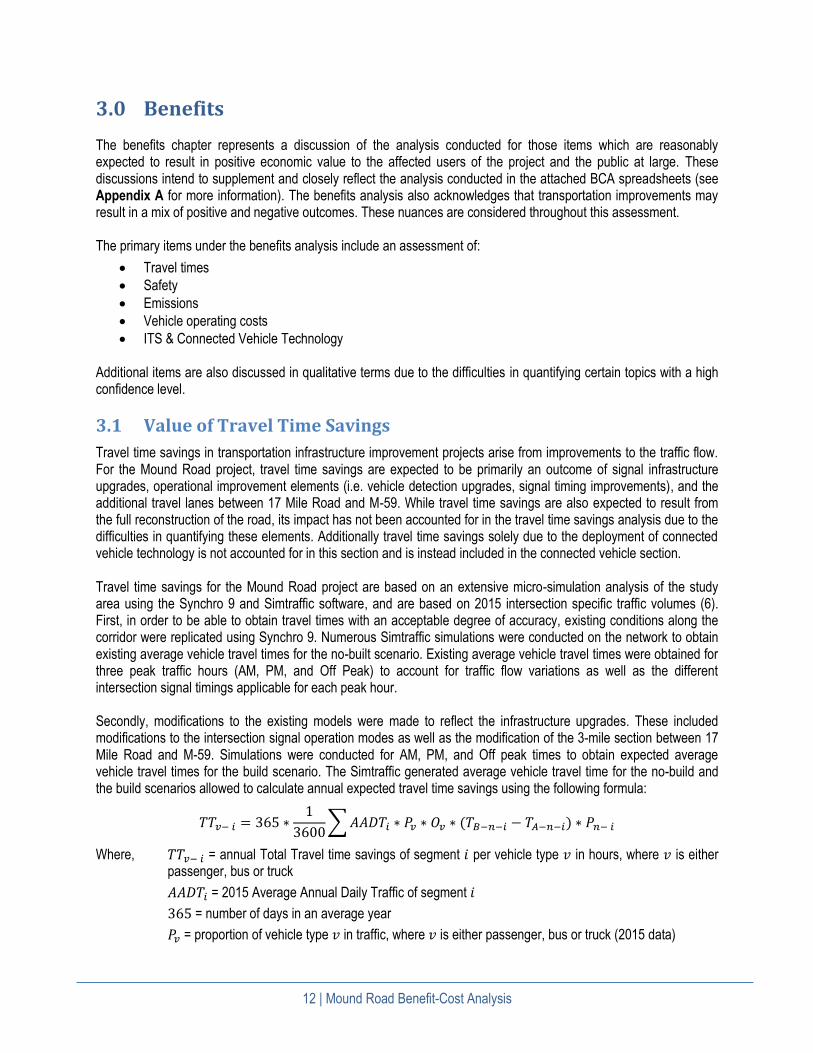
Travel time savings in transportation infrastructure improvement projects arise from improvements to the traffic flow. For the Mound Road project, travel time savings are expected to be primarily an outcome of signal infrastructure upgrades, operational improvement elements (i.e. vehicle detection upgrades, signal timing improvements), and the additional travel lanes between 17 Mile Road and M-59. While travel time savings are also expected to result from the full reconstruction of the road, its impact has not been accounted for in the travel time savings analysis due to the difficulties in quantifying these elements. Additionally travel time savings solely due to the deployment of connected vehicle technology is not accounted for in this section and is instead included in the connected vehicle section. Travel time savings for the Mound Road project are based on an extensive micro-simulation analysis of the study area using the Synchro 9 and Simtraffic software, and are based on 2015 intersection specific traffic volumes (6). First, in order to be able to obtain travel times with an acceptable degree of accuracy, existing conditions along the corridor were replicated using Synchro 9. Numerous Simtraffic simulations were conducted on the network to obtain existing average vehicle travel times for the no-built scenario. Existing average vehicle travel times were obtained for three peak traffic hours (AM, PM, and Off Peak) to account for traffic flow variations as well as the different intersection signal timings applicable for each peak hour. Secondly, modifications to the existing models were made to reflect the infrastructure upgrades. These included modifications to the intersection signal operation modes as well as the modification of the 3-mile section between 17 Mile Road and M-59. Simulations were conducted for AM, PM, and Off peak times to obtain expected average vehicle travel times for the build scenario. The Simtraffic generated average vehicle travel time for the no-build and the build scenarios allowed to calculate annual expected travel time savings using the following formula:
𝑇𝑇𝑣− 𝑖 = 365 ∗1
3600∑ 𝐴𝐴𝐷𝑇𝑖 ∗ 𝑃𝑣 ∗ 𝑂𝑣 ∗ (𝑇𝐵−𝑛−𝑖 − 𝑇𝐴−𝑛−𝑖) ∗ 𝑃𝑛− 𝑖
Where, 𝑇𝑇𝑣− 𝑖 = annual Total Travel time savings of segment 𝑖 per vehicle type 𝑣 in hours, where 𝑣 is either passenger, bus or truck
𝐴𝐴𝐷𝑇𝑖 = 2015 Average Annual Daily Traffic of segment 𝑖
365 = number of days in an average year
𝑃𝑣 = proportion of vehicle type 𝑣 in traffic, where 𝑣 is either passenger, bus or truck (2015 data)

13 | Mound Road Benefit-Cost Analysis
𝑂𝑣 = average occupancy of vehicle type 𝑣, where 𝑣 is either passenger, bus or truck (based on BCA Guidance provided data)
365 = number of days in an average year
1/3600 = seconds in an hour (conversion from sec to hr)
𝑇𝐵−𝑛−𝑖 = average vehicle travel time (in seconds) for no-built scenario of segment 𝑖 in peak period 𝑛
𝑇𝐴−𝑛−𝑖 = average vehicle travel time (in seconds) for built scenario of segment 𝑖 in peak period 𝑛
𝑃𝑛− 𝑖 = proportion of travel of segment 𝑖 in peak period 𝑛, where 𝑛 is either AM, PM, or OFF peak (based on 2015 data and is 0.15 for AM, 0.2 for PM, and 0.65 for OFF peak)
The total travel time savings for each vehicle type (passenger all purpose trips, bus and tracks) were then multiplied by the individual 2016 dollar amounts provided in the BCA guidance and were summed to obtain a total annual travel time saving value of the project versus the existing conditions. Because the traffic volume data used represents 2015 data, a 1.5% growth factor is initially applied to base year 2016. The 1.5% growth factor is then applied to each additional applicable year with benefits initiating in 2023 (post-construction) and are calculated up until 2042.
The travel time savings analysis resulting from the project indicates an average overall travel time savings improvement of 13.8% over baseline conditions as seen on Figure 6. This translates to:
$41,709,883 in annual average savings
$834,197,659 in total savings over the 20 year operational period of the analysis
$284,943,820 in total savings over the 20 year operational period of the analysis when discounted at 7%
Figure 6: Average Annual Percent Travel Time Savings It should be noted that the reduction in travel time savings also result in additional benefits, in particular for those corresponding to improved just-in-time deliveries for goods and freight passing through the corridor. The latter comprise approximately 4.7% of the corridor’s AADT. Consequently, benefits corresponding to travel times can be expected to be higher.

14 | Mound Road Benefit-Cost Analysis
3.2 Safety Benefits
3.2.1 Existing Safety Conditions
In line with the INFRA grant core principles, the Mound Road project recognizes that safety is a top priority, in particular the elimination of fatal and injury crashes. Consequently effort has been made to design a project which improves safety by incorporating proven as well as innovative safety treatments. Currently Mound Road is characterized by a relatively high frequency of crashes. A review of 2011-2015 crashes obtained from the Traffic Improvement Association (TIA) Traffic Crash Analysis Tool (TCAT) reported a total of 3,914 total crashes along the subject corridor, 1% of which were reported as fatal and incapacitating injury (type A) crashes and approximately 21% involved some other level of injury (10)1. These 3,914 crashes involved 8,209 vehicles, resulted in 10 fatalities, incapacitating injuries to 38 individuals, and included some other form of injury to an additional 1,118 individuals. Figure 7 presents the 2011-2015 crash distribution by severity along the corridor, while Figure 8 presents the 2011-2015 number of individuals affected and/or involved in the incidents by crash severity2.
The safety conditions of the corridor are best illustrate via crash rates which normalize the crash data by taking into account exposure variables such as traffic volumes thus providing a more effective comparison between data points. Figure 9 presents the 2011-2015 historical crash rates per 100 Million Vehicle Miles Traveled (MVMT) for the Mound Road Corridor and the State of Michigan (11). The data indicates that crash rates along the corridor, while exhibiting a similar trend as the State of Michigan, have increased at a much faster rate with an average increase of 8.5% per year as opposed to 1.8% for the state. Similarly, the average crash rate for the corridor for years 2011 to 2015 is nearly 4% higher than that of the state of Michigan at 317.7 per 100 MVMT as opposed to 306.4 per 100 MVMT.
1 The TIA TCAT is an online search tool for traffic crashes in Michigan. Crashes in Michigan are reported on the KABCO scale and include fatal, injury type A, B, C, or no injury crashes. The severity of a crash is determined by the most severe injury in the crash. A refers to an incapacitating injury that prevents a person from walking, driving or normal activities which he/she was capable of performing prior to the crash. B is described is any injury that is evident at the scene of the crash, but the injury is not fatal or incapacitating. C refers to an injury reported by an occupant, but not visible to the officer completing the crash report. 2 The Michigan State Police Department reports O (No Injury) crashes on a per vehicle basis. A 1.39 average occupancy rate based on the BCA guidance has been applied to report the number of individuals involved in O (No injury) crashes.
Figure 7: 2011-2015 Mound Road Crash Distribution by Severity
Figure 8: 2011-2015 Mound Road Affected Individuals by Crash Severity

15 | Mound Road Benefit-Cost Analysis
In addition to the trends and average crash rates being higher than that of the State of Michigan, the Southeast Michigan Council of Governments (SEMCOG) lists two-miles of the nine-mile Mound Road corridor between 15 Mile Road to Metro Parkway (16 Mile) and Metro Parkway to 17 Mile Road as the 35th and 64th highest-frequency crash locations within the Southeast Michigan region (12). This condition is particularly significant given that the Southeast Michigan region has the largest and highest density roadway network within Michigan and a population of approximately 4,750,000 (1).
Figure 9: 2011-2015 Mound Road and Michigan Crash Rates Table 4 indicates a more in-depth assessment of existing crashes. The data indicates that approximately 64.4% of the crashes occurring along Mound Road are segment crashes while the other 35.6% are intersection related crashes. The predominant crash type for both locations are rear end crashes with 53.2% and 49.9% respectively. On segments, sideswipe same crashes comprise more than 25% of all crashes, followed by angle and single vehicle crashes following with approximately 6-7% each. At intersections, 20% of all crashes are angle crashes, followed by sideswipe same crashes with approximately 16.1%. In terms of the time of the day, 1 in 4 of the total crashes occurred during dark conditions. Overall, head-on crashes for the corridor are low because of the boulevard geometry and prohibition of direct left turns at major intersections. A summary of segment and intersection related crashes by time of day (day/night) and pavement conditions is provided in Table 5 & 6 respectively. The data indicates little variation between segment and intersection crashes for the two categories. Overall 21.8% of the crashes along the corridor occur at night. In terms of pavement conditions, 18.2% of the total crashes occur on wet pavement (i.e. rainy conditions) and 9.4% occur on snowy, icy or slush conditions.

16 | Mound Road Benefit-Cost Analysis
Table 4: 2011-2015 Mound Road Crash Location by Crash Type
Crash Type Total Segment Intersection
Single Motor Vehicle 5.5% 6.9% 2.9%
Head-On 0.2% 0.3% 0.1%
Head-On Left Turn 0.2% 0.2% 0.1%
Angle 11.5% 6.6% 20.4%
Rear End 52.1% 53.2% 49.9%
Rear End Left Turn 1.3% 1.6% 0.7%
Rear End Right Turn 3.7% 2.0% 6.9%
Sideswipe Same 22.4% 25.9% 16.1%
Sideswipe Opposite 0.2% 0.2% 0.3%
Other 2.9% 3.0% 2.7%
Total 100.0% 64.4% 35.6%
Table 5: 2011-2015 Mound Road Crash Location by Time of Day
Time of the Day Total Segment Intersection
Day 78.2% 76.6% 81.0%
Night 21.8% 23.4% 19.0%
Total 100.0% 64.4% 35.6%
Table 6: 2011-2015 Mound Road Crash Location by Pavement Condition
Pavement Condition Total Segment Intersection
Dry 71.7% 72.3% 70.5%
Wet 18.2% 16.8% 20.9%
Snow/Ice/Slush 9.4% 10.3% 7.9%
Other/Unknown 0.7% 0.6% 0.7%
Total 100.0% 64.4% 35.6%
Crash attributes for the Mound Road corridor appear to be typical for divided roadways. However, the large number of crashes and particular emphasis on specific crash types does present an opportunity to significantly improve safety along the corridor. Specifically an opportunity is presented to significantly reduce rear-end, angle, single vehicle, and sideswipe same crashes, several of which also present a safety risk in terms of fatal and severe injury outcomes. The review of individual crash reports for the fatal and serious injury incidents indicates that 8 of the 10 fatal crashes are likely correctable. Specifically:
3 of the 8 crashes were as a result of red light running which could be corrected by improving signal visibility and signal timing
3 crashes were rear end crashes occurring as a result of failure to stop which could be corrected by improving pavement friction performance, signal visibility, signal timing, and traffic flow progression
1 fatality involved a single vehicle that was weaving, lost control and rolled over at night which could be corrected by pavement in good repair and improved street lighting
1 fatality involved a pedestrian crossing at an uncontrolled midblock location at night which could be corrected with improved street lighting and pedestrian facilities

17 | Mound Road Benefit-Cost Analysis
A similar pattern is reflected on the serious injury crash reports with 22 of the 30 reviewed crash reports being potentially correctable. Specifically:
14 of the correctable crashes involved red light running at different intersections along the corridor
7 were rear end crashes from failure to stop due to stopped traffic upstream of an intersection or stop and go traffic along the segment
1 involved loss of vehicle control due to wet pavement conditions supplemented by stop and go traffic
1 involved a pedestrian crossing at a uncontrolled midblock location Currently the network is characterized by a number of safety deficiencies which contribute to the high number of crashes. Primary network wide safety deficiencies include:
Poor pavement friction performance due to severely deteriorating pavement conditions
Low visibility, low reflectivity pavement markings
Low visibility at night due to poor lighting conditions throughout the corridor
Inadequate and substandard signs
Inefficient traffic flow progression Primary intersection safety deficiencies include:
Poor placement of signal heads (i.e. diagonal span configuration)
Inadequate number of signal heads per through movement
Incandescent overhead case signs
Lack of backplates
Poor intersection illumination
Low visibility crosswalks
Outdated pedestrian signal infrastructure
Non-ADA compliant crossings
Inefficient traffic flow progression In concert with the existing safety deficiencies and existing crash patterns, significant safety components are designed into the Mound Road project to directly rectify safety deficiencies. Primary network wide safety improvements include:
New concrete pavement with increased pavement friction performance
Recessed durable pavement markings
Improved lighting
MUTCD conforming signs
Improved traffic flow progression as a result of signal optimization, signal upgrades, connected vehicle technology, updated signage etc.
Two new pedestrian bridges at strategic locations along the corridor
Installation of FAST systems at four locations to apply deicing chemicals to the bridge decks
Primary intersection safety improvements include:
Mast arm signal configuration with one signal head per lane
12” LED signal heads
LED illuminated case signs
Backplates
Pedestrian countdown signals (audible)
High-visibility crosswalks
Improved traffic flow progression as a result of signal optimization, signal upgrades, connected vehicle technology etc.

18 | Mound Road Benefit-Cost Analysis
3.2.2 Safety Benefits
Safety benefit calculations for the Mound Road project are based on the existing observed crash patterns with emphasis on the fatal and serious injury crashes, as well as consideration of the existing safety improvement opportunities along the network in direct correlation to the crash patterns. Due to the lack of localized safety performance functions (SPF) to aid in the identification of expected crashes per year, annualized baseline crash conditions are based on the annual average of the 2011-2015 crashes occurring along the network as obtained from the TIA TCAT data source. Per the BCA guidelines, annual crashes are quantified in terms of the number of individual injuries or non-injuries per incident, the breakdown of which is based on the KABCO scale. Projected crash reductions for the baseline crash conditions were then estimated using crash modification factors (CMF) for each relevant and proven countermeasure. CMFs were obtained from the CMF clearinghouse portal as well as from the Michigan Department of Transportation’s (MDOT) approved CMF list (13, 14). A total of 17 individual CMFs were identified based on the proposed safety treatments. These included a combination of network wide treatments, intersection specific treatments, as well as CMFs applicable to specific crash types, severities, and time of day. Following the identification of the appropriate CMFs, several crash categories were defined to be able to apply the appropriate CMFs. The crash categories were identified in order to fulfill two basic requirements. First each identified crash category provides a direct match to at least one of the identified CMFs (i.e. nightime angle intersection crashes). Secondly, crash categories are isolated to eliminate double counting, meaning that a unique CMF value can be applied to a unique crash only once. Given the significant number of safety improvements listed under this project, a minimum of 3 CMFs and up to a maximum of 10 CMFs were applicable for each crash category. The Highway Safety Manual (HSM) provides a method for combining multiple CMFs which allows for the multiplication of all applicable CMFs and assumes independence of each treatment (15, 16). While this particular method is acceptable, it requires engineering judgment as it can lead to implausible crash reduction factors. Consequently, this study limits the number of CMFs utilized in calculating the combined CMF value to three to provide a more realistic approach in estimating the crash reduction factor. The method can be expressed as:
𝐶𝑀𝐹𝑡 = (𝐶𝑀𝐹1 ∗ 𝐶𝑀𝐹2 ∗ 𝐶𝑀𝐹3)
Where, 𝐶𝑀𝐹𝑡 = CMF for combined safety treatments
𝐶𝑀𝐹1 = CMF for first best safety treatment
𝐶𝑀𝐹2 = CMF for second best safety treatment
𝐶𝑀𝐹3 = CMF for third best safety treatment
Following the identification of the CMF for combined safety treatments, the predicted annual crash frequency reduction for each applicable category and severity is identified via the following:
𝑁 = 𝑁𝑏𝑎𝑠𝑒 ∗ (1 − 𝐶𝑀𝐹𝑡)
Where, 𝑁 = predicted annual crash frequency reduction for a given crash category and severity
𝑁𝑏𝑎𝑠𝑒 = annual crash frequency for baseline conditions for a given crash category and severity
𝐶𝑀𝐹𝑡 = CMF for combined safety treatment
The predicted annual crash reductions for each crash category and severity were then multiplied by the respective monetized values provided in the BCA guidelines for crashes on the KABCO scale. A 1.5% growth factor is additionally applied to the baseline annualized crash frequency starting with base year 2016 and up to 2042. The 1.5% growth factor corresponds to the projected traffic growth rate, thus assumes a direct correlation between AADT

19 | Mound Road Benefit-Cost Analysis
and crashes. This assumption is deemed reasonable given that AADT values are one of the primary independent variables in an urban SPF for both segment and intersection locations. Similar to additional benefits associated with the operational timeline of the project, safety benefits initiate in 2023 and are quantified up until the end of the 20 year operational period in 2042. The safety benefits resulting from the wide array of safety improvements indicate an average annual crash reduction of nearly 60%, with Figure 10 illustrating annual crash reduction by crash severity in base year. This amounts to approximately:
$33,983,596 in annual average savings
$679,671,927 in total savings over the 20 year operational period of the analysis
$232,161,183 in total savings over the 20 year operational period of the analysis when discounted at 7% One important item to note under the safety benefits is that it does not take into account safety benefits resulting from connected vehicle technology. This topic is discussed in more detailed under its applicable section.
Figure 10: Predicted Annual Crash Frequency Reduction by Crash Severity in Baseline Year (2016)

20 | Mound Road Benefit-Cost Analysis
3.3 Emission Reduction Benefits
Emission reductions in a transportation infrastructure improvement project arise primarily from improvements to the traffic flow such as fewer number of stops, reduced idle time, changes to average travel speeds etc. With respect to the latter, the amount of pollutants released in the atmosphere from the production and combustion of fuels generally follows a concave up curve with emission rates decreasing from low to mid-range speeds and increases again when traveling at higher speeds, with variation in the pattern among the various pollutants (17, 18). The emission reduction benefits for the Mound Road project are expected to be primarily an outcome of the signal infrastructure upgrades and operational improvement elements (i.e. vehicle detection upgrades, signal timing improvements). Similar to the other benefits, emission reductions are expected from the deployment of connected vehicle technologies, however this impact is not accounted for in this section and instead is assessed in the connected vehicle section. Emissions reduction benefits are calculated for Volatile Organic Compounds (VOCs), Nitrogen Oxide (NOx), Particulate Matter (PM), Carbon Monoxide (CO) and Carbon Dioxide (CO2). The first four pollutants also represent the common emission types reported under the MDOT Congestion Mitigation and Air Quality (CMAQ) transportation related projects, while CO2 is included to quantify benefits stemming from this more common greenhouse gas. Due to the calculation and valuation characteristics between the listed pollutants, two separate methods were implemented to assess the benefits resulting from emission reductions. These include emission reduction benefits from non-CO2 (VOCs, NOx, PM, CO) pollutants and CO2. Emission reduction benefits from non-CO2 pollutants are based on a micro-simulation analysis of the study area using the Synchro 9 and Simtraffic software based on 2015 intersection specific traffic volumes as well as on the MDOT CMAQ emission factors (6, 17). The MDOT CMAQ emission factors are equivalent values of a particular pollutant (i.e. VOCs, NOX, PM and CO) for the State of Michigan in relationship to the average vehicle speed in increments of 1 mph for a transportation project. Vehicle type and service life of the project are also variables considered in the utilization of the emission factors. Based on this premise, existing conditions along the Mound Road corridor were replicated using Synchro 9. Several Simtraffic simulations were conducted on the network to obtain existing average vehicle speed for the no-build scenario. Existing average vehicle speeds were obtained for AM peak traffic, PM peak traffic, and Off peak traffic to account for traffic flow variations as well as different existing intersection signal timings applicable for each peak hour. Modifications to the existing models were than conducted to reflect the proposed infrastructure upgrades. These included modifications to the intersection signal operation modes and the modification of the 3-mile section between 17 Mile Road and M-59 from a 6-lane divided to an 8-lane divided roadway. Similarly to the existing conditions, several Simtraffic models were conducted for AM, PM and Off peak times to obtain expected average vehicle speeds for the build scenario. The obtained average vehicle speeds for the no-build and the built scenarios were utilized in concert with the MDOT CMAQ emission factors and additional network variables using the following formula based on the SEMCOG emission assessment for freeways and arterial travel (19):
𝐸𝑖 = 365 ∗1
𝐶∗ ∑[𝐴𝐴𝐷𝑇𝑖 ∗ 𝐿𝑖 ∗ 𝑃𝑛−𝑖 ∗ (𝐸𝐹𝐵−𝑖 − 𝐸𝐹𝐴−𝑖)]
Where, 𝐸𝑖 = Non-CO2 emission reduction for segment 𝑖 (metric ton or short ton/yr)
𝐴𝐴𝐷𝑇𝑖 = 2015 Average Annual Daily Traffic of segment 𝑖
𝐿𝑖 = miles of arterial roadway affected for segment 𝑖
𝑃𝑛−𝑖 = proportion of travel of segment 𝑖 in peak period 𝑛, where 𝑛 is either AM, PM, or OFF peak (based on 2015 data and is 0.15 for AM, 0.2 for PM, and 0.65 for OFF peak)

21 | Mound Road Benefit-Cost Analysis
𝐸𝐹𝐴−𝑖 = emission factor after implementation for segment 𝑖 (g/mi)
𝐸𝐹𝐵−𝑖 = emission factor before implementation for segment 𝑖 (g/mi)
365 = number of days in an average year
𝐶 = variable for converting grams into either short ton (i.e. 1,101,500) or metric ton (i.e. 1,000,000)
The total reduction in emissions for the non-CO2 pollutants (i.e. VOCs, NOx, PM, CO) were then summed to obtain the total annual emission reduction savings for the project versus the existing conditions and multiplied by the individual 2016 dollar amount provided in the BCA guidance for VOCs, NOx, PM, and the average expected U.S. cost for CO as provided by the Argonne National Lab (20). Because the traffic volume data used represents 2015 data, a 1.5% growth factor is initially applied to base year 2016. The 1.5% growth factor is then applied to each additional applicable year with benefits initiating in 2023 and assessed up until 2042.
In comparison, CO2 emission reduction benefits are based upon the acceptable concept that the cost of CO2 is non-linear and increases exponentially with time. Consequently each year has a different cost valuation (21). Prior to estimating the CO2 emission reduction benefit however and similar to Non-CO2 calculations, existing baseline conditions and projected conditions in relationship to the project were quantified. Similar to the Non-CO2 emissions, CO2 emission also exhibit a concave-up curve in relationship to speed, however MDOT does not provide equivalency factors for this pollutant. In lieu of this omission, CO2 emissions are quantified based on the CO2 emission – speed curve as presented by Barth and Boriboonsomsin, 2009 (18). Utilizing the average vehicle travel speeds obtained under the no build and built scenarios, the CO2 emission benefits are quantified utilizing a similar formula as the prior pollutants:
𝐸𝑖 = 365 ∗1
1,101,500∗ ∑[𝐴𝐴𝐷𝑇𝑖 ∗ 𝐿𝑖 ∗ 𝑃𝑛−𝑖 ∗ (𝐶𝐵−𝑖 − 𝐶𝐴−𝑖)]
Where, 𝐸𝑖 = CO2 emission reduction for segment 𝑖 (short ton/yr)
𝐴𝐴𝐷𝑇𝑖 = 2015 Average Annual Daily Traffic of segment 𝑖
𝐿𝑖 = miles of arterial roadway affected for segment 𝑖
𝑃𝑛−𝑖 = proportion of travel of segment 𝑖 in peak period 𝑛, where 𝑛 is either AM, PM, or OFF peak (based on 2015 data and is 0.15 for AM, 0.2 for PM, and 0.65 for OFF peak)
𝐶𝐴−𝑖 = CO2 emission after implementation for segment 𝑖 (g/mi), based on CO2 emission-speed curve
𝐶𝐵−𝑖 = CO2 emission before implementation for segment 𝑖 (g/mi), based on CO2 emission-speed curve
365 = number of days in an average year
1/1,101,500 = conversion factor from grams to short ton
The total reduction in emissions for CO2 are then summed to obtain the total annual emission reduction saving. Similar to non-CO2 emissions, a 1.5% growth factor is initially applied to base year 2016 and each corresponding year following up until 2042. Corresponding CO2 costs applicable for each of the analysis are obtained from the Spring Energy Economics 2016 national CO2 price forecasts for mid-range predictions (21). These values are multiplied by the corresponding annual CO2 saving quantities with benefits initiating in 2023 and up until 2042.
The emission reduction benefit analysis indicates an overall reduction of 11.7% for VOCs, 5.3% for NOx, 11.4% for PM, 5.9% for CO, and 4.2% for CO2. The total emission reduction savings for both non-CO2 and CO2 pollutants resulting from the project indicate the following savings:
$776,214 in annual average savings
$15,524,275 in total savings over the 20 year operational period of the analysis
$5,136,765 in total savings over the 20 year operational period of the analysis when discounted at 7%

22 | Mound Road Benefit-Cost Analysis
3.4 Vehicle Operating Cost Savings
Vehicle operating cost savings relate to costs associated with vehicle maintenance, depreciation, fuel consumption etc. This study uses fuel consumption to reflect these cost savings. In transportation improvement projects with no changes to segment lengths or mode variations, fuel consumption savings arise primarily from improvements to the traffic flow due to fewer stops, reduced idle time, or changes to travel speeds. With respect to the later, fuel consumption typically decreases when moving from low to mid-range speeds and increases when traveling at higher speeds. Based on this premise fuel consumption savings for the Mound Road project are assessed as a function of the average travel speed along the corridor under a no-build and build scenario. The fuel consumption and speed relationship is based upon the fuel-speed function developed by Evans and Herman (1976, 1978) in the Detroit metropolitan area. This function which is applicable for low to mid-range speeds is expressed as (22, 23, 24):
𝐹𝑖 =𝑘1
𝑉𝑖+ 𝑘2
Where, 𝐹𝑖 = fuel consumption of segment 𝑖 per unit distance (mL/km)
𝑉𝑖 = average travel speed of segment 𝑖 (km/h)
𝑘1 = constant where 𝑘1= 2,722 for medium cars (mL/h)
𝑘2 = constant where 𝑘2= 85.1 for medium cars (mL/km) In order to be utilize this relationship, the average vehicle travel speeds was obtained from Synchro 9 and Simtraffic simulations for both no-build and build scenarios, and based on 2015 intersection specific traffic volumes (6). Similar to the prior benefit calculations, average vehicle travel speeds were obtained for AM, PM, and Off peak times to account for variations in signal timings and traffic patterns. The obtained data allowed to quantify fuel consumption savings utilizing the following formula:
𝐹𝑖 = 365 ∗ 0.000264172 ∗ ∑[𝐴𝐴𝐷𝑇𝑖 ∗ 𝐿𝑖 ∗ 1.60934 ∗ 𝑃𝑛−𝑖 ∗ (𝐹𝐵−𝑖 − 𝐹𝐴−𝑖)]
Where, 𝐹𝑖 = fuel consumption savings of segment 𝑖 (gallons/yr)
𝐴𝐴𝐷𝑇𝑖 = 2015 Average Annual Daily Traffic of segment 𝑖
𝐿𝑖 = miles of arterial roadway affected for segment 𝑖
𝑃𝑛−𝑖 = proportion of travel of segment 𝑖 in peak period 𝑛, where 𝑛 is either AM, PM, or OFF peak (based on 2015 data and is 0.15 for AM, 0.2 for PM, and 0.65 for OFF peak)
𝐹𝐴−𝑖 = fuel consumption after implementation of segment 𝑖 (mL/km)
𝐹𝐵−𝑖 = fuel consumption before implementation of segment 𝑖 (mL/km)
365 = number of days in an average year
0.000264172 = conversion factor for mL to gallons
1.60934 = conversion factor for miles to km The total fuel consumption savings for each segment are then summed to obtain a network wide fuel consumption saving rate and multiplied by the average cost of fuel as reported by the U.S. Energy Information Administration (EIA) for 2016 (25). A 1.5% growth factor is applied to base year 2016 and subsequent years since traffic volumes used are based on 2015 data. Obtained benefits are assessed for 20 year operations between 2023 and 2042. The fuel consumption benefit analysis indicates an overall n reduction of 5.6% along with the following savings:
$2,631,053 in annual average savings
$52,621,067 in total savings over the 20 year operational period of the analysis
$17,974,215 in total savings over the 20 year operational period of the analysis when discounted at 7%
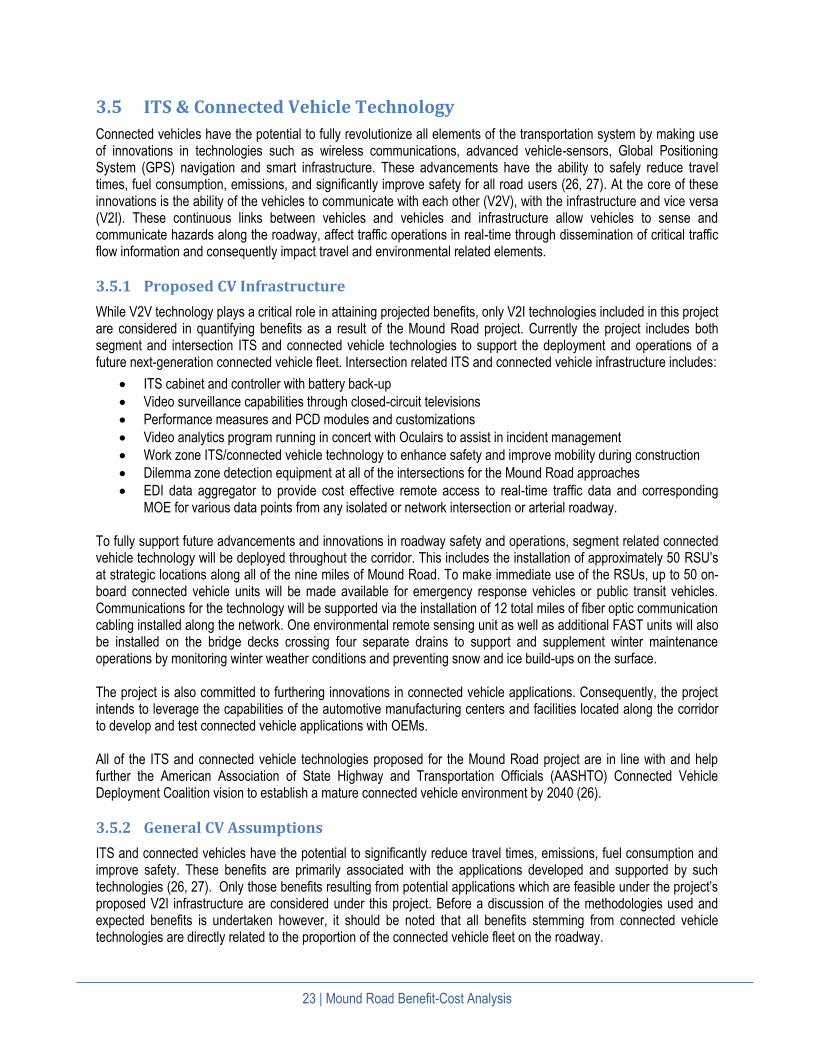
23 | Mound Road Benefit-Cost Analysis
3.5 ITS & Connected Vehicle Technology
Connected vehicles have the potential to fully revolutionize all elements of the transportation system by making use of innovations in technologies such as wireless communications, advanced vehicle-sensors, Global Positioning System (GPS) navigation and smart infrastructure. These advancements have the ability to safely reduce travel times, fuel consumption, emissions, and significantly improve safety for all road users (26, 27). At the core of these innovations is the ability of the vehicles to communicate with each other (V2V), with the infrastructure and vice versa (V2I). These continuous links between vehicles and vehicles and infrastructure allow vehicles to sense and communicate hazards along the roadway, affect traffic operations in real-time through dissemination of critical traffic flow information and consequently impact travel and environmental related elements.
3.5.1 Proposed CV Infrastructure
While V2V technology plays a critical role in attaining projected benefits, only V2I technologies included in this project are considered in quantifying benefits as a result of the Mound Road project. Currently the project includes both segment and intersection ITS and connected vehicle technologies to support the deployment and operations of a future next-generation connected vehicle fleet. Intersection related ITS and connected vehicle infrastructure includes:
ITS cabinet and controller with battery back-up
Video surveillance capabilities through closed-circuit televisions
Performance measures and PCD modules and customizations
Video analytics program running in concert with Oculairs to assist in incident management
Work zone ITS/connected vehicle technology to enhance safety and improve mobility during construction
Dilemma zone detection equipment at all of the intersections for the Mound Road approaches
EDI data aggregator to provide cost effective remote access to real-time traffic data and corresponding MOE for various data points from any isolated or network intersection or arterial roadway.
To fully support future advancements and innovations in roadway safety and operations, segment related connected vehicle technology will be deployed throughout the corridor. This includes the installation of approximately 50 RSU’s at strategic locations along all of the nine miles of Mound Road. To make immediate use of the RSUs, up to 50 on-board connected vehicle units will be made available for emergency response vehicles or public transit vehicles. Communications for the technology will be supported via the installation of 12 total miles of fiber optic communication cabling installed along the network. One environmental remote sensing unit as well as additional FAST units will also be installed on the bridge decks crossing four separate drains to support and supplement winter maintenance operations by monitoring winter weather conditions and preventing snow and ice build-ups on the surface. The project is also committed to furthering innovations in connected vehicle applications. Consequently, the project intends to leverage the capabilities of the automotive manufacturing centers and facilities located along the corridor to develop and test connected vehicle applications with OEMs. All of the ITS and connected vehicle technologies proposed for the Mound Road project are in line with and help further the American Association of State Highway and Transportation Officials (AASHTO) Connected Vehicle Deployment Coalition vision to establish a mature connected vehicle environment by 2040 (26).
3.5.2 General CV Assumptions
ITS and connected vehicles have the potential to significantly reduce travel times, emissions, fuel consumption and improve safety. These benefits are primarily associated with the applications developed and supported by such technologies (26, 27). Only those benefits resulting from potential applications which are feasible under the project’s proposed V2I infrastructure are considered under this project. Before a discussion of the methodologies used and expected benefits is undertaken however, it should be noted that all benefits stemming from connected vehicle technologies are directly related to the proportion of the connected vehicle fleet on the roadway.

24 | Mound Road Benefit-Cost Analysis
According to NHTSA, vehicles embedded with Dedicated Short Range Communication (DSRC) capabilities to facilitate communication between V2V and V2I are expected to be deployed as soon as 2020 (26). From there on, U.S. DOT and AASHTO have established three separate deployment models (aggressive, moderate and conservative) which predict the market penetration rate of the connected vehicle fleet on the roadway. Figure 11 illustrates these three models as presented by the two agencies (26).
Figure 11: Connected Vehicle Population over Time (26). The MCDR which maintains the traffic signals along the Mound Road corridor in addition to 1,700 miles of roadway and over 900 traffic signals in the region, is at the forefront of connected vehicle technology infrastructure deployment (V2I) in the state of Michigan. The agency has already deployed DSRC units at strategic locations along main corridors within the County and has plans to systematically integrate its roadway network ahead of most regions in the United States. Recently the agency also partnered with MDOT and GM’s Research & Development Center to test and demonstrate successfully V2I capabilities on the Cadillac CTS sedan by sending real-time data using the deployed DSRC units which alerted drivers of potential red light violations at their current speed. These vehicles which are equipped with V2I and V2V technologies can already be found throughout the region’s roadway network. Appendix C presents a memo from MCDR on its initiatives and successes with deployment and testing of connected vehicle technology in the County. Given the aggressive timeline which MCDR has established for full scale deployment of V2I technologies within the County, and the availability of V2I and V2V technologies on existing vehicle models, this BCA utilizes the aggressive deployment model (i.e. 1 Year Mandate) in estimating the market penetration rate of connected vehicles for the Mound Road project. The 1 Year Mandate is based on a scenario where car manufactures phase in connected vehicle equipment in all of the new vehicles following a given model year. Under this scenario a 95% connected vehicle fleet deployment is reached by year 2042. This year also corresponds to the last year in the BCA analysis period. The 1 Year Mandate connected vehicle population curve forms the basis of all Mound Road connected vehicle benefits. Under this premise only the proportion of vehicles equipped with connected vehicle technologies can realize those benefits in a particular year.

25 | Mound Road Benefit-Cost Analysis
Secondly, connected vehicle benefits are assumed linearly related to the connected vehicle deployment curve. This means that the full projected benefit is realized only when 100% of the vehicles are equipped with connected vehicle technology. This assumption, which is consistent with applicable research on this topic (27, 28, 29), is expressed as:
𝐵𝑖 =𝑃𝑖 ∗ 𝐵𝑚𝑎𝑥
𝑃𝑚𝑎𝑥
Where, 𝐵𝑖 = connected vehicle benefit for market penetration rate at year 𝑖 (Mobility, Safety, Emission, Fuel)
𝑃𝑖 = connected vehicle market penetration rate at year 𝑖
𝐵𝑚𝑎𝑥 = maximum potential connected vehicle benefit (Mobility, Safety, Emission, Fuel)
𝑃𝑚𝑎𝑥 = maximum connected vehicle market penetration rate (100%)
3.5.3 CV Benefits
ITS and connected vehicle benefits are assessed in terms of reductions in travel times, emissions, fuel consumption, and improvements in safety. With regards to reductions in travel times, the benefits are expected to be a result of the combination of intelligent traffic signal systems, freight signal priorities, and emergency vehicle preemption which optimizes traffic flow operations through the intersections based on real-time information as well as prioritizing freight and emergency vehicle movements (27). Research on this topic indicates a potential reduction in travel times of 25% at a 100% market penetration rate along an urban network (28). Based on this rate and utilizing existing travel times along the Mound Road corridor obtained as indicated in the prior benefit sections, the connected vehicle mobility benefit was assessed using the following method:
𝑇𝑣−𝑖 = 𝑃𝑖 ∗ 𝐵𝑖 ∗ 𝑇𝑣−𝑖𝑒
Where, 𝑇𝑣− 𝑖 = annual Total Travel time savings at year 𝑖 per vehicle type 𝑣 in hours, where 𝑣 is either passenger, bus or truck
𝑃𝑖 = connected vehicle market penetration rate at year 𝑖 (%)
𝐵𝑖 = connected vehicle mobility benefit at year 𝑖 (%)
𝑇𝑣−𝑖𝑒 = total existing corridor travel time at year 𝑖 per vehicle type 𝑣 in hours, where 𝑣 is either
passenger, bus or truck
Emission benefits resulting from connected vehicle technology are assessed in a similar manner as travel times, and are based on expected reductions in emissions of 10.89% for VOCs, 15.51% for NOx, 19.09% for PM, 13.23% for CO, and 6.55% for CO2 (29). These benefits are an outcome of eco-signal operations (i.e. eco-approach/departure at signalized intersections, eco-traffic signal priority, connected eco-driving, and eco-traffic signal timing) which reduce idle time, the number of stops, and increase traffic flow efficiency along the corridor (27). Given these findings, the connected vehicle emission benefit is then assessed as follows:
𝐸𝑝−𝑖 = 𝑃𝑖 ∗ 𝐵𝑝−𝑖 ∗ 𝐸𝑝−𝑖𝑒
Where, 𝐸𝑝− 𝑖 = annual Emission savings at year 𝑖 per pollutant 𝑝 in short ton or metric ton, where 𝑝 is either
VOC, NOx, PM, CO, and CO2
𝑃𝑖 = connected vehicle market penetration rate at year 𝑖 (%)
𝐵𝑝−𝑖 = connected vehicle emission benefit at year 𝑖 per pollutant 𝑝, where 𝑝 is either VOC, NOx, PM,
CO, and CO2 (%)
𝐸𝑝−𝑖𝑒 = total existing corridor emissions at year 𝑖 per pollutant 𝑝 in short ton or metric ton, where 𝑝 is
either VOC, NOx, PM, CO, and CO2 Fuel consumptions savings from connected vehicle technology are a result of similar eco-signal operations as those listed under the emissions benefits (27). At 100% market penetration rate, connected vehicle technologies are

26 | Mound Road Benefit-Cost Analysis
expected to reduce fuel consumption along a coordinate urban network by 13% (27). Akin to the emission benefits, fuel consumption savings from connected vehicle technology can be expressed as:
𝐹𝑖 = 𝑃𝑖 ∗ 𝐵𝑖 ∗ 𝐹𝑖𝑒
Where, 𝐹 𝑖 = annual Fuel Consumption savings at year 𝑖 in gallons
𝑃𝑖 = connected vehicle market penetration rate at year 𝑖 (%)
𝐵𝑖 = connected vehicle fuel consumption benefit at year 𝑖 (%)
𝐹𝑖𝑒 = total existing corridor fuel consumption at year 𝑖 in gallons
Lastly, safety benefits from connected vehicle technology are a result of applications which provide information and alert vehicles of upcoming hazards or events along the corridor and at intersections (27). According to NHTSA, connected vehicle technology can positively impact up to 80% of non-impaired crashes in both mid-blocks and intersections (30). Using this crash reduction rate as baseline and applying it only to non-impacted crashes from the prior safety benefits, safety benefits from connected vehicle technology can be expressed as:
𝑆𝑗−𝑖 = 𝑃𝑖 ∗ 𝐵𝑖 ∗ 𝑆𝑗−𝑖𝑒
Where, 𝑆𝑗−𝑖= annual Safety benefits at year 𝑖 in gallons per injury type 𝑗, where 𝑗 is either no injury, injury type
C, injury type B, injury type A, or Fatal
𝑃𝑖 = connected vehicle market penetration rate at year 𝑖 (%)
𝐵𝑖 = connected vehicle safety benefit at year 𝑖 (%)
𝑆𝑗−𝑖𝑒 = total existing corridor un-impacted and non-impaired crashes at year 𝑖 per injury type 𝑗, where 𝑗
is either no injury, injury type C, injury type B, injury type A, or Fatal Following the calculations of travel time savings by vehicle type, emission savings by pollutant type, fuel consumption savings, and safety benefits by injury type, each year of data was multiplied by the applicable dollar amount of each category and summed to obtain the total savings from the connected vehicle technology as a result of infrastructure improvements proposed for the Mound Road project. Table 7 presents the projected benefits resulting from connected vehicle technology.
Table 7: Mound Road Connected Vehicle Technology Benefits
Benefit Category Annual
Average ($2016)
Total ($2016) Total Discounted
at 7%
Travel Time $40,264,099 $805,281,976 $218,846,696
Emission $793,294 $15,865,889 $4,229,470
Fuel $3,245,978 $64,919,566 $17,642,805
Safety $9,063,053 $181,261,066 $49,260,242
Total Connected Vehicle Benefits $53,366,425 $1,067,328,498 $289,979,213
3.6 Additional Benefit Discussion
This section is presented to provide a qualitative discussion on those aspects of the project which are not easily quantifiable but which are believed to have a positive impact on the region and the users of the facility. The qualitative discussion covers both economic related benefits and quality of life benefits. These are associated to overall project improvements and in particular to the pavement reconstruction, the proposed bridges and non-motorized user pathways, truck priority and emergency preemption systems, and ITS.

27 | Mound Road Benefit-Cost Analysis
With regards to the pavement reconstruction, in addition to the safety impacts which have been accounted for under the safety benefits, the existing distressed and deteriorated pavement condition which apply to the entire corridor also has a significant impact on vehicle maintenance, noise, freight and business retention and attraction. A review of existing PASER ratings along the corridor indicate that entire project area is either in poor or fair conditions (Figure 12). The worst pavement conditions are found north of Metro Parkway (16 Mile Road), along the northbound direction between 14 Mile Road and Metro Parkway, as well as south of 12 mile road. Figure 13 presents an image indicating typical pavement conditions along the corridor. These conditions are generally exacerbated following the winter season due to aggressive freeze-thaw cycles which are typical of Michigan’s climatic environment.
Figure 12: Mound Road Existing PASER Rating

28 | Mound Road Benefit-Cost Analysis
Figure 13: Typical Pavement Conditions along Mound Road (15 Mile Road to Metroparkway) These excessive poor pavement conditions can have significant detrimental impacts not only on safety but also vehicle maintenance, noise, freight, and business retention and creation. With regards to vehicle maintenance, the correlation between deteriorated pavement condition and vehicle operating costs is well documented (31). A 2012 study by the National Cooperative Highway Research Program (NCHRP) on pavement conditions and its impacts found that a decrease in pavement roughness is directly associated with reductions in fuel consumptions, reductions in tire wear, and reductions in vehicle maintenance and repair. The study estimates that a decrease in pavement roughness of 63.5 in/mi can result in a total of $24 billion in fuel savings, $340 million in tire wear savings, and $24.5 billion to $73.5 billion per year in repair and maintenance costs among the 255 million vehicles in the US for both passenger vehicles and in particular trucks (31). Given the high AADT and in particular the number of trucks which service the large manufacturing facilities along the corridor, improvements in pavement conditions can not only result in significant savings in fuel consumptions, tire wear, and vehicle maintenance and repairs for the users, but also increase efficiency for the vital employment centers located along Mound Road. Similar to vehicle maintenance costs, pavement conditions also impact noise levels along the corridor. In general, noise can be defined as undesirable or excessive sound which impacts everyday essential activities, where at the higher extreme end exposure can also result in irreparable damage. While most of the noise resulting from a typical roadway is inevitable, as the pavement deteriorates the noise from the friction between the tires and pavement will get louder as the pavement texture becomes rougher and less flat. While difficult to quantify, it is not improbable to assume that the replacement of the existing pavement can lead to lower noise levels and improved quality of life in particular for the residents and noise sensitive facilities located in proximity to the corridor. Most importantly, and in particular given that Mound Road acts as a primary corridor for several commercial and manufacturing facilities of national importance, the poor and deteriorating pavements conditions can have a detrimental impact on freight movement through the corridor as well as business retention and creation. According to a 2010 study on Michigan’s Roads commissioned by the Michigan Chamber of Commerce the cost of not fully funding infrastructure projects in the state can result in approximately 12,000 lost jobs, while the opposite would result in 15,000 created jobs (32). Similar correlations between good infrastructure conditions and business retention and creation can also be found in additional studies. A report by the Oregon Department of Transportation on

29 | Mound Road Benefit-Cost Analysis
Oregon’s road conditions indicated that declining pavement and bridge conditions could reduce the state’s future economic growth, result in an estimated 100,000 future lost jobs, and a loss of $94 billion in the state’s gross domestic product (GDP) as a result of the higher transportation costs stemming from inadequate road and bridge conditions. The same study noted that deteriorating road conditions will reduce the ability of firms in the state to compete in the global market due to higher user costs and business accessibility, higher truck operating costs and reduced market accessibility and economic competitiveness (33). With regards to truck movements, research on the economic costs of pavement deterioration notes that “at some point truckers will drive a less direct route or choose congestion over a lack of safety and road quality. If the highway is in extremely poor conditions and creates a perceived safety hazard or requires substantially slower speeds to traverse, truck drivers will avoid the roadway” (34). The above examples stress the importance of roadways in good state of work. This is particularly important for the Mound Road corridor which in addition to being part of the NHS and is the longest non-freeway segment included in the NHFP, also serves as a significant industrial corridor. It is important to reiterate that Mound Road acts as the primary transportation route for several national automotive, aerospace, defense and advanced manufacturing companies including the GM Technical Center, the Ford Axle Plan and Transmission Plant, the FCA Stamping Plant and Assembly Plant, BAE Systems, and the U.S. Army’s TACOM and TARDEC facilities, all of which rely on efficient freight movement. In addition the corridor has a direct employment total of 20,200 people which support another 17,720 jobs within the County and another 98,100 jobs in the Michigan economy (2). Thus, given the documented impact which road conditions can have upon the economy, an improved Mound Road corridor in a good state can have long lasting economic impacts on the local, regional, and potentially national economy. The truck priority system proposed under this project aims to further increase economic output along the region, make the corridor more efficient and attractive to freight movement, and help support the many industries located along the corridor. In concert with the existing deteriorated pavement conditions the project also recognizes the impact which work zones have on the transportation network. Currently, the Mound Road corridor requires annual and extended work zones in order to maintain the pavement in minimal serviceable conditions. The reconstruction of the pavement would eliminate the need for long-term annual work zones thus significantly reducing user delay costs along the corridor. In addition, the project proposes the implementation of work zone ITS technologies in particular to improve safety and alleviate user delays associated with the construction of the project. Examples include ITS technologies for traffic monitoring and management and provide up-to date traveler information in advance of the work zones. Lastly, the Mound Road project recognizes that an efficient transportation network must adequately service all users of the facility including non-motorized users. Consequently, in addition to the pedestrian improvements at intersections along the corridor (i.e. ADA compliant crossings, high-visibility crossable and audible pedestrian countdown signals) the project includes two new grade separate pedestrian crossings as well as the installation of non-motorized multi-use paths to improve non-motorized user safety, mobility, and promote regional trails. The first of the two bridges is proposed to be located on the south end of the corridor near 13 Mile Road, while the second bridge is to be located near Metro Parkway to provide a direct connection to the Macomb County Freedom Trail and improve access to the Iron Belle Trail. The Iron Belle Trail is a 1,273 miles long trail which runs from Detroit to the Michigan/Wisconsin border (refer to Figure 5 for the location of Mound Road with respect to the Iron Bell Trail). In addition both bridges and non-motorized user path improvements significantly increase mobility across the corridor over existing conditions. These benefits are aimed at both the commercial/industrial facilities and the residential neighborhoods located on both sides of Mound Road. The improved mobility is expected to promote and provide safe crossings for the employees on one side of the corridor who intend to utilize commercial/industrial facilities on the opposite side of Mound Road. Similarly, the increased mobility and connectivity is expected to further community integration and improve quality of life between the residential neighborhoods which are currently separate by an 8-lane divided roadway. .

30 | Mound Road Benefit-Cost Analysis
4.0 Costs
The cost chapter represents a discussion of the analysis conducted for those items which represent a cost to the project. These discussions intend to supplement and reflect the analysis conducted in the attached BCA spreadsheets (see Appendix A for more information). The primary items under the costs analysis include an assessment of:
Capital Expenditures
Operating & Maintenance Expenditures
4.1 Capital Expenditures
Capital expenditures refer to those costs which are necessary for the full realization of the Mound Road project. The project has a total budget of $216,860,000. This includes the full construction cost of the project along with necessary engineering and construction contingencies. Table 8 presents a full itemized breakdown of the Mound Road project costs.
Table 8: Mound Road Project Costs
Budget Item Amount ($2016) % of Budget
Mobilization $ 10,000,000 4.6%
Earthwork $ 13,000,000 6.0%
Pavement Base $ 20,000,000 9.2%
Drainage $ 15,000,000 6.9%
Curb & Gutter and Driveways $ 4,500,000 2.1%
Concrete Pavement $ 46,000,000 21.2%
Temporary Traffic Control $ 7,000,000 3.2%
Restoration & Landscaping $ 4,500,000 2.1%
Non-Motorized Multi-Use Path $ 2,100,000 1.0%
Pedestrian Bridge (2 locations) $ 10,000,000 4.6%
Signal Modernizations $ 11,300,000 5.2%
Connected Vehicle Technology $ 1,500,000 0.7%
Fiber Optic Communication $ 1,200,000 0.6%
ITS Technology $ 1,800,000 0.8%
FAST with Weather Station $ 1,300,000 0.6%
Electrical and Lighting $ 1,200,000 0.6%
Traffic Signs $ 4,000,000 1.8%
Permanent Pavement Markings $ 500,000 0.2%
Construction Costs $ 154,900,000 71.4%
Contingencies @ 15% of Construction Costs $ 23,235,000 10.7%
Engineering @ 13% of Construction Costs $ 20,137,000 9.3%
Construction Engineering @ 12% of Construction Costs $ 18,588,000 8.6%
Total Project Costs $ 216,860,000 100%
The full project cost of $216,860,000 is expected to be distributed evenly between the three-year construction period of 2020 and 2022 with approximately $72,286,667 per year. In addition, the project consists of an additional $100,000 in expenditures which represent costs accrued in 2017 as part of the planning efforts and pre-construction costs needed to develop the Mound Road project. In total, the Mound Road project costs needed to fully realize the listed benefits amount to a total of $154,947,662 when discounted at 7%.
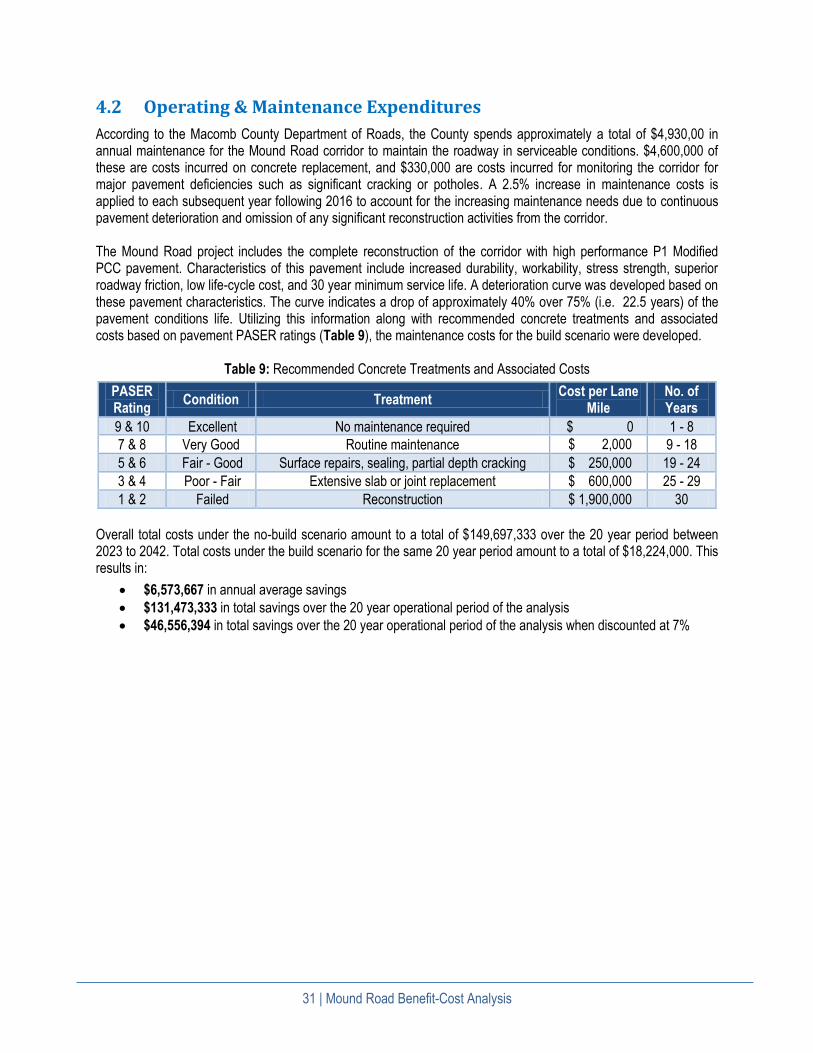
31 | Mound Road Benefit-Cost Analysis
4.2 Operating & Maintenance Expenditures
According to the Macomb County Department of Roads, the County spends approximately a total of $4,930,00 in annual maintenance for the Mound Road corridor to maintain the roadway in serviceable conditions. $4,600,000 of these are costs incurred on concrete replacement, and $330,000 are costs incurred for monitoring the corridor for major pavement deficiencies such as significant cracking or potholes. A 2.5% increase in maintenance costs is applied to each subsequent year following 2016 to account for the increasing maintenance needs due to continuous pavement deterioration and omission of any significant reconstruction activities from the corridor. The Mound Road project includes the complete reconstruction of the corridor with high performance P1 Modified PCC pavement. Characteristics of this pavement include increased durability, workability, stress strength, superior roadway friction, low life-cycle cost, and 30 year minimum service life. A deterioration curve was developed based on these pavement characteristics. The curve indicates a drop of approximately 40% over 75% (i.e. 22.5 years) of the pavement conditions life. Utilizing this information along with recommended concrete treatments and associated costs based on pavement PASER ratings (Table 9), the maintenance costs for the build scenario were developed.
Table 9: Recommended Concrete Treatments and Associated Costs
PASER Rating
Condition Treatment Cost per Lane
Mile No. of Years
9 & 10 Excellent No maintenance required $ 0 10,000,000
1 - 8
7 & 8 Very Good Routine maintenance $ 2,000 13,000,000
9 - 18
5 & 6 Fair - Good Surface repairs, sealing, partial depth cracking $ 250,000 20,000,000
19 - 24
3 & 4 Poor - Fair Extensive slab or joint replacement $ 600,000 15,000,000
25 - 29
1 & 2 Failed Reconstruction $ 1,900,000 20,000,000
30
Overall total costs under the no-build scenario amount to a total of $149,697,333 over the 20 year period between 2023 to 2042. Total costs under the build scenario for the same 20 year period amount to a total of $18,224,000. This results in:
$6,573,667 in annual average savings
$131,473,333 in total savings over the 20 year operational period of the analysis
$46,556,394 in total savings over the 20 year operational period of the analysis when discounted at 7%

32 | Mound Road Benefit-Cost Analysis
5.0 Results of Benefit-Cost Analysis
The Mound Road benefit-cost analysis presented an analysis of the following benefits and costs:
Travel Time Savings
Safety Benefits
Emission Reduction Benefits
Vehicle Operating Cost Savings
ITS & Connected Vehicle Technology Savings
Capital Expenditures
Operating & Maintenance Expenditures Table 10 summarizes the obtained benefit-cost results for all of the above items.
Table 10: Mound Road Benefit-Cost Analysis Results
BCA Category Total ($2016) Total Discounted at 7%
Travel Time Savings $ 834,197,659 $ 284,943,820
Safety Benefits $ 679,671,927 $ 232,161,183
Emission Reduction Benefits $ 15,524,275 $ 5,136,765
Vehicle Operating Cost Savings $ 52,621,067 $ 17,974,215
ITS & Connected Vehicle Technology Savings $ 1,067,328,498 $ 289,979,213
Capital Expenditures $ (216,960,000) $ (154,947,662)
Operating & Maintenance Expenditures $ 131,473,333 $ 46,556,394
NPV at 7% $ 721,803,927
BCR 5.66
The results of the BCA for the Mound Road project indicate a Net Present Value (NPV) discounted at 7% of $721,803,927. This corresponds to a Benefit-Cost Ratio (BCR) of 5.66. The BCA analysis indicates that the project yields a return on investment which far surpasses the total project cost.

33 | Mound Road Benefit-Cost Analysis
6.0 References
1. Southeast Michigan Council of Governments. Community Profiles. http://semcog.org/Community-Profiles, Accessed September 2017.
2. Economic Modeling Specialists International (EMSI). Economic Impact Analysis of the Mound Road Corridor, March 2017.
3. U.S. Department of Transportation. Fixing America’s Surface Transportation or “FAST Act”: Freight Planning and Policy Provisions, February 2016. https://www.fhwa.dot.gov/fastact/factsheets/fpppfs.cfm, Accessed September 2017.
4. U.S. Department of Transportation. National Highway Freight Program (NHFP) Fact Sheet, February 2016. https://www.fhwa.dot.gov/fastact/factsheets/nhfpfs.pdf, Accessed September 2017.
5. Michigan Department of Transportation. Michigan Freight Plan: Supplement to the 2035 MI Transportation Plan, 2012.
6. Kimley-Horn of Michigan, Inc. 2015 Traffic Data Collection by Intersection.
7. MS2. Mound Road Historical Traffic Volumes, MS2 Transportation Data Management System. http://macomb.ms2soft.com/tcds/tsearch.asp?loc=Macomb&mod=, Accessed August 2017.
8. Southeast Michigan Council of Governments. Pavement Conditions. http://maps.semcog.org/PavementCondition/, Accessed September 2017.
9. U.S. Department of Transportation. Benefit-Cost Analysis Guidance for TIGER and INFRA Applications, July 2017.
10. Transportation Improvement Association (TIA) Traffic Crash Analysis Tool (TCAT). 2011-2015 Crashes, Accessed August 2017.
11. Michigan Department of Transportation. Michigan Performance Plan, Fiscal Year 2017. http://www.michigan.gov/documents/msp/Performance_Plan_and_Charts_FINAL_06222016_537921_7.pdf, Accessed August 2017
12. Southeast Michigan Council of Governments. High-Frequency Crash Locations. http://semcog.org/High-Frequency-Crash-Locations, Accessed August 2017.
13. CMF Clearing House. http://www.cmfclearinghouse.org/, Accessed August 2017
14. Michigan Department of Transportation. MDOT Crash Reduction Factors. https://www.michigan.gov/documents/mdot/mdot_Crash_Reduction_Factors_303744_7.pdf, Accessed August 2017.
15. F. Gross and A. Hamidi. Investigation of Existing and Alternative Methods for Combining Multiple CMFs. T-06-013, Highway Safety Improvement Program Technical Support, 2011.
16. American Association of State Highway and Transportation Officials (AASHTO). Highway Safety Manual. AASHTO, Washington D.C., 2010.
17. Michigan Department of Transportation. Congestion Mitigation and Air Quality Improvement (CMAQ) Michigan Emission Factors. https://www.michigan.gov/documents/mdot/MDOT_CMAQ_EmissionFactorsTables_437123_7.pdf, Accessed August 2017.
18. M. Barth and K. Boriboonsomsin. Traffic Congestion and Greenhouse Gases. Access 35, 2009.

34 | Mound Road Benefit-Cost Analysis
19. Southeast Michigan Council of Governments. Southeast Michigan On-Road Mobile Source Emissions Inventory, 2008. http://www.michigan.gov/documents/deq/deq-aqd-air-aqe-sip-pm25-appendixD_223436_7.pdf, Accessed August 2017.
20. M. Q. Wang, D. J. Santini, and S.A. Warinner. Methods of Valuing Air Pollution and Estimated Monetary Values of Air Pollutants in Various U.S. Regions. Argonne National Lab, 1994.
21. P. Luckow, E. Stanton, S. Fields, W. Ong, B. Biewald, S. Jackson, J. Fisher. Spring 2016 National Carbon Dioxide Price Forecast. Synapse Energy Economics, Inc, 2016.
22. L. Evans and R. Herman. Urban Fuel Economy – Computer Simulation Calculations Interpreted in Terms of Simple Mode. Transportation Research, 1978.
23. L. Evans and R. Herman. A simplified approach to calculations of fuel consumptions in urban traffic systems. Traffic Eng. Control 17, 18(9), pp. 352-54, 1976.
24. D.C. Biggs and R. Akcelik. Technical Note 1: An Interpretation of the Parameters in the Simple Average Travel Speed Model of Fuel Consumption. Australian Road Research Board, 15(1), 1985.
25. U.S. Energy Information Administration (EIA), U.S. Annual Retail Gasoline and Diesel Price, 2016 Gasoline – All Grades, 2017. https://www.eia.gov/dnav/pet/pet_pri_gnd_dcus_nus_a.htm, Accessed August 2017
26. J. Wright, J. K. Garret, C. J. Hill, G. D. Krueger, J. H. Evans, S. Andrews, C. K. Wilson, R. Rajbhandari, B. Burkhard. National Connected Vehicle Field Infrastructure Footprint Analysis: Final Report. U.S. Department of Transportation, FHWA-JPO-14-125, 2014.
27. J. Chang, G. Hatcher, D. Hicks, J. Schneeberger, B. Staples, S. Sundarajn, M. Vasudevan, P. Wang, K. Wunderlich. Estimated Benefits of Connected Vehicle Applicaions: Dynamic Mobility Applications, AERIS, V2I Safety, and Road Weather Management. U.S. Department of Transportation, FHWA-JPO-15-255, 2015.
28. S. Guler, M. Menendez, and L. Meier. Using Connected Vehicle Technology to Improve the Efficiency of Intersections. Transportation Research Part C, Vol 46, pp. 121-131, 2014,
29. J. Liu., K. M. Kockelman, A. Nichols. Anticipating the Emissions Impacts of Smoother Driving by Connected and Autonomous Vehicles, Using the MOVES Model. 96th Annual Meeting of the Transportation Research Board, 2017. http://www.caee.utexas.edu/prof/kockelman/public_html/TRB17CAVEmissions.pdf, Accessed September 2017.
30. National Highway Traffic Safety Administration (NHTSA). U.S. DOT advances deployment of Connected Vehicle Technology to prevent hundreds of thousands of crashes, 2016. https://www.nhtsa.gov/press-releases/us-dot-advances-deployment-connected-vehicle-technology-prevent-hundreds-thousands, Accessed September 2017
31. K. Chatti and I. Zaabar. Estimating the effects of Pavement Conditions on Vehicle Operating Costs. National Cooperative Highway Research Program (NCHRP) Report 720, 2012.
32. A. L. Rosaen, C. M. Sallee, and J. Eli. Michigan’s Roads: The Cost of Doing Nothing and the Rewards of Bold Action. Anderson Economic Group, LLC, Commissioned By The Michigan Chamber of Commerce, 2010. http://www.andersoneconomicgroup.com/Portals/0/upload/AEG-%20Michigans%20Roads%20-%20Cost%20of%20Doing%20Nothing.pdf, Accessed September 2017.
33. Oregon Department of Transportation. Rough Roads Ahead: The Cost of Poor Highway Conditions to Oregon’s Economy. http://www.oregon.gov/ODOT/Planning/Documents/Rough-Roads-Ahead-1.pdf, Accessed September 2017.
34. A. Winston and C. Duncan. The Economic Costs of Pavement Deterioration. 94th Annual Meeting of the Transportation Research Board. http://amonline.trb.org/trb57535-2015-1.1793793/t001-1.1822030/689-1.1810886/15-5450-1.1822123/15-5450-1.1957324?qr=1, Accessed September 2017.

35 | Mound Road Benefit-Cost Analysis
Appendix A – Benefit-Cost Analysis (BCA) Spreadsheet

The contents of Appendix A – Benefit Cost Analysis (BCA) Spreadsheet are provided electronically as well.
The following is a guide to the contents of the BCA Spreadsheet:
Tab 1. Summary Matrix
Summary of key components of the BCA.
Tab 2. BCA Results
BCA results including 7% discounted NPV and BCR values.
Tab 3. TOTAL Travel Time
Results of travel time savings analysis.
Tab 4. Travel Time – Calc
Travel time saving calculations for no-build and build scenario using 2015 traffic data. Output
represents 2015 travel time savings in hours.
Tab 5. Travel Time – Value
Standard travel time values (cost per unit of travel time and average occupancy rates).
Tab 6. TOTAL Safety Benefits
Results of safety benefits analysis.
Tab 7. Safety Benefits – Calc
Crash reduction calculations for build scenario using 2011-2015 annualized crash data. Output
represents 2015 crash reductions.
Tab 8. CMF – Values
Crash Modification Factors utilized in the analysis of the safety benefits.
Tab 9. KABCO Level – Values
Standard KABCO level values (cost per level of injury).
Tab 10. TOTAL Emissions
Results of emissions savings analysis (VOC, NOx, PM, CO, CO2).
Tab 11. Emissions – Calc (Non-CO2)
Emission saving calculations for VOC, NOx, PM, and CO for no-build and build scenario using
2015 traffic data. Output represents 2015 emission savings in short ton or metric ton.
Tab 12. Emissions – Calc (CO2)
Emission saving calculations for CO2 for no-build and build scenario using 2015 traffic data.
Output represents 2015 CO2 emission savings in short ton.
Tab 13. Emissions – Values
Standard emission values (cost per unit of emission for VOC, NOx, PM, CO, and CO2).
Tab 14. TOTAL Fuel Savings
Results of fuel savings analysis.
Tab 15. Fuel Savings – Calc
Fuel saving calculations for no-build and build scenario using 2015 traffic data. Output
represents 2015 fuel savings in gallons.
Tab 16. Fuel Savings – Values
Standard fuel values (value of gasoline price).
Tab 17. ITS & Connected Veh Savings
Analysis and results of ITS/Connected Vehicle savings for build scenario.
Tab 18. ITS & Connected Veh – Back Calc
ITS/connected vehicle related calculations for no-build scenario. Output represents 2015
existing conditions in terms of travel time, emissions, fuel, and safety.
Tab 19. Operations & Maintenance Costs
Analysis and results of operation & maintenance for no-build and build scenario.
Tab 20. Inflation Adjustment – Values
Inflation adjustments rates
BCA Spreadsheet - Guide
36 | Mound Road Benefit-Cost Analysis

Current Status/Baseline & Problem to be Addressed
Change to Baseline Type of ImpactsPopulation Affected by
Impacts
Deteriorated pavement and infrastructure conditions which have exceeded service life
Reconstruction with high performance concrete pavement (P1 Modified); New drainage; Curb & gutter; Driveways; Restoration & landscaping
Lower operations & maintenance costs; Increased safety from improved pavement friction; Noise reduction; Lower vehicle maintenance costs; Infrastructure conducive to business retention and attraction
All existing users of the facility
Inefficient traffic flow progression; Substandard signal design; Congestion from capacity constraints in the northern end of the corridor
Signal optimization and modernizations; Widening of the roadway between 17 Mile to M-59; Connected Vehicle Technology; Fiber Optic Communications; ITS Technology, FAST system and weather station
Travel Time Savings for passenger vehicles, public transportation, freight, and emergency vehicles; Emission reductions for a wide array of pollutants; Fuel savings; Significant expected crash reductions; Infrastructure conducive to business retention and attraction
All existing users of the facility
Non-MUTCD conforming signing MUTCD conforming traffic signs Expected crash reductions All existing users of the facility
Limited non-motorized user mobility and connectivity
Non-motorized multi-use paths; Two pedestrian bridges
Increase safety, mobility, access & connectivity for non-motorized users; Community integration; Infrastructure conducive to business retention and attraction
All existing users of the facility
Low visibility at night Energy efficient unified lighting Increase safety; Lower energy consumption
All existing users of the facility
Overall infrastructure conditions which do not reflect business and employment needs and characteristics of the corridor
ITS and Connected Vehicle Technologies throughout the entire corridor
Travel time savings; Significant safety benefits; Emission reduction; Fuel consumption reduction; Infrastructure conducive to business retention and attraction; Advancement of Connected Vehicle Technology applications and goals
All existing users of the facility
Tab 1. Summary Matrix
37 | Mound Road Benefit-Cost Analysis

Calendar Year Project YearConstruction
Costs ($2016)
Discounted
Construction
Costs at 7%
Value of Travel
Time Savings
($2016)
Discounted
Travel Time
Savings at 7%
Safety Benefits
($2016)
Discounted
Safety Benefits
at 7%
Emissions Savings
($2016)
Discounted
Emissions
Savings at 7%
2016 na ‐$ ‐$ ‐$ ‐$ ‐$ ‐$ ‐$ ‐$
2017 Planning (100,000)$ (93,458)$ ‐$ ‐$ ‐$ ‐$ ‐$ ‐$
2018 na ‐$ ‐$ ‐$ ‐$ ‐$ ‐$ ‐$ ‐$
2019 na ‐$ ‐$ ‐$ ‐$ ‐$ ‐$ ‐$ ‐$
(Beg Construction) 2020 Construction (72,286,667)$ (55,147,152)$ ‐$ ‐$ ‐$ ‐$ ‐$ ‐$
2021 Construction (72,286,667)$ (51,539,394)$ ‐$ ‐$ ‐$ ‐$ ‐$ ‐$
(End Construction) 2022 Construction (72,286,667)$ (48,167,658)$ ‐$ ‐$ ‐$ ‐$ ‐$ ‐$
2023 1 ‐$ ‐$ 36,075,492$ 22,466,003$ 29,392,913$ 18,304,429$ 599,078$ 373,076$
2024 2 ‐$ ‐$ 36,616,624$ 21,311,209$ 29,833,806$ 17,363,547$ 611,309$ 355,788$
2025 3 ‐$ ‐$ 37,165,873$ 20,215,773$ 30,281,313$ 16,471,028$ 623,773$ 339,291$
2026 4 ‐$ ‐$ 37,723,361$ 19,176,644$ 30,735,533$ 15,624,387$ 636,473$ 323,551$
2027 5 ‐$ ‐$ 38,289,212$ 18,190,929$ 31,196,566$ 14,821,264$ 649,414$ 308,532$
2028 6 ‐$ ‐$ 38,863,550$ 17,255,881$ 31,664,515$ 14,059,423$ 662,599$ 294,202$
2029 7 ‐$ ‐$ 39,446,503$ 16,368,896$ 32,139,482$ 13,336,743$ 676,034$ 280,530$
2030 8 ‐$ ‐$ 40,038,201$ 15,527,505$ 32,621,575$ 12,651,209$ 689,723$ 267,487$
2031 9 ‐$ ‐$ 40,638,774$ 14,729,362$ 33,110,898$ 12,000,913$ 714,476$ 258,959$
2032 10 ‐$ ‐$ 41,248,356$ 13,972,245$ 33,607,562$ 11,384,044$ 739,816$ 250,601$
2033 11 ‐$ ‐$ 41,867,081$ 13,254,046$ 34,111,675$ 10,798,883$ 765,756$ 242,419$
2034 12 ‐$ ‐$ 42,495,087$ 12,572,763$ 34,623,350$ 10,243,800$ 792,307$ 234,415$
2035 13 ‐$ ‐$ 43,132,513$ 11,926,499$ 35,142,700$ 9,717,250$ 819,483$ 226,594$
2036 14 ‐$ ‐$ 43,779,501$ 11,313,455$ 35,669,841$ 9,217,765$ 847,296$ 218,957$
2037 15 ‐$ ‐$ 44,436,194$ 10,731,922$ 36,204,889$ 8,743,954$ 875,758$ 211,507$
2038 16 ‐$ ‐$ 45,102,736$ 10,180,281$ 36,747,962$ 8,294,499$ 904,884$ 204,244$
2039 17 ‐$ ‐$ 45,779,278$ 9,656,996$ 37,299,181$ 7,868,146$ 934,687$ 197,169$
2040 18 ‐$ ‐$ 46,465,967$ 9,160,608$ 37,858,669$ 7,463,709$ 965,180$ 190,282$
2041 19 ‐$ ‐$ 47,162,956$ 8,689,736$ 38,426,549$ 7,080,060$ 993,591$ 183,068$
2042 20 ‐$ ‐$ 47,870,401$ 8,243,067$ 39,002,947$ 6,716,132$ 1,022,637$ 176,093$
(154,947,662)$ 284,943,820$ 232,161,183$ 5,136,765$
Calendar Year Project YearFuel Savings
($2016)
Discounted Fuel
Savings at 7%
Operation and
Maintenance
Costs Savings
($2016)
Discounted
Operation and
Maintenance at
7%
ITS/Connected
Vehicle Savings
($2016)
ITS/Connected
Vehicle Savings
at 7%
NPV at 7%
2016 na ‐$ ‐$ ‐$ ‐$ ‐$ ‐$ ‐$
2017 Planning ‐$ ‐$ ‐$ ‐$ ‐$ ‐$ (93,458)$
2018 na ‐$ ‐$ ‐$ ‐$ ‐$ ‐$ ‐$
2019 na ‐$ ‐$ ‐$ ‐$ ‐$ ‐$ ‐$
(Beg Construction) 2020 Construction ‐$ ‐$ ‐$ ‐$ ‐$ ‐$ (55,147,152)$
2021 Construction ‐$ ‐$ ‐$ ‐$ ‐$ ‐$ (51,539,394)$
(End Construction) 2022 Construction ‐$ ‐$ ‐$ ‐$ ‐$ ‐$ (48,167,658)$
2023 1 2,275,637$ 1,417,152$ 5,860,221$ 3,649,451$ 4,181,088$ 2,603,771$ 48,813,882$
2024 2 2,309,771$ 1,344,308$ 6,006,726$ 3,495,969$ 7,374,443$ 4,291,993$ 48,162,813$
2025 3 2,344,418$ 1,275,208$ 6,156,894$ 3,348,943$ 10,903,315$ 5,930,681$ 47,580,924$
2026 4 2,379,584$ 1,209,660$ 6,310,817$ 3,208,099$ 15,187,261$ 7,720,434$ 47,262,774$
2027 5 2,415,278$ 1,147,481$ 6,468,587$ 3,073,179$ 20,258,008$ 9,624,434$ 47,165,818$
2028 6 2,451,507$ 1,088,498$ 6,630,302$ 2,943,933$ 25,170,798$ 11,176,135$ 46,818,073$
2029 7 2,488,280$ 1,032,548$ 6,796,059$ 2,820,123$ 30,699,357$ 12,739,142$ 46,577,982$
2030 8 2,525,604$ 979,473$ 6,965,961$ 2,701,520$ 36,868,224$ 14,298,133$ 46,425,326$
2031 9 2,563,488$ 929,126$ 7,006,110$ 2,539,337$ 43,709,656$ 15,842,391$ 46,300,088$
2032 10 2,601,940$ 881,367$ 7,184,613$ 2,433,677$ 49,831,437$ 16,879,632$ 45,801,566$
2033 11 2,640,969$ 836,063$ 7,367,578$ 2,332,387$ 56,450,545$ 17,870,797$ 45,334,594$
2034 12 2,680,584$ 793,088$ 7,555,117$ 2,235,287$ 63,585,586$ 18,812,681$ 44,892,033$
2035 13 2,720,793$ 752,322$ 7,747,345$ 2,142,206$ 69,549,028$ 19,230,886$ 43,995,756$
2036 14 2,761,605$ 713,651$ 7,944,379$ 2,052,979$ 75,868,248$ 19,605,797$ 43,122,604$
2037 15 2,803,029$ 676,968$ 8,146,339$ 1,967,447$ 80,689,966$ 19,487,683$ 41,819,482$
2038 16 2,845,074$ 642,171$ 8,353,347$ 1,885,460$ 85,727,438$ 19,349,811$ 40,556,467$
2039 17 2,887,750$ 609,162$ 8,565,531$ 1,806,872$ 90,987,430$ 19,193,515$ 39,331,860$
2040 18 2,931,066$ 577,850$ 8,783,019$ 1,731,542$ 96,476,886$ 19,020,092$ 38,144,083$
2041 19 2,975,032$ 548,147$ (7,610,056)$ (1,402,146)$ 100,059,052$ 18,435,798$ 33,534,663$
2042 20 3,019,658$ 519,971$ 9,234,443$ 1,590,129$ 103,750,731$ 17,865,408$ 35,110,802$
17,974,215$ 46,556,394$ 289,979,213$ 721,803,927$
BCR 5.66
Note:
1. Base year is assumed as 2016 per INFRA BCA Guidelines
2. Assumes construction begins in 2020 and ends in 2022.
3. Construction cost expenditures are projected to be incurred evenly over the 3‐year period.
TOTALS
TOTALS
4. Assumes a 1.5% annual growth corresponding to projected traffic volume growth for subject corridor. 1.5% Growth is applied to year 2016 (base year) as well since calculations are
based on 2015 data. There are no concerns with regards to capacity constraints for this growth rate.
Tab 2. BCA Results
38 | Mound Road Benefit-Cost Analysis

Year Project Year
TOTAL Travel
Time Savings for
All Purpose
(hr/year)
TOTAL Travel
Time Savings
for Buses
(hr/year)
TOTAL Travel
Time Savings
for Trucks
(hr/year)
TOTAL Travel
Time Savings for
All Purpose
($2016)
TOTAL Travel
Time Savings
for Buses
($2016)
TOTAL Travel
Time Savings
for Trucks
($2016)
TOTAL Travel
Time Savings
($2016)
2016 na 2,142,175 5,530 78,817 ‐$ ‐$ ‐$ ‐$
2017 na 2,174,308 5,613 79,999 ‐$ ‐$ ‐$ ‐$
2018 na 2,206,923 5,697 81,199 ‐$ ‐$ ‐$ ‐$
2019 na 2,240,026 5,782 82,417 ‐$ ‐$ ‐$ ‐$
(Beg Construction) 2020 Construction 2,273,627 5,869 83,653 ‐$ ‐$ ‐$ ‐$
2021 Construction 2,307,731 5,957 84,908 ‐$ ‐$ ‐$ ‐$
(End Construction) 2022 Construction 2,342,347 6,047 86,182 ‐$ ‐$ ‐$ ‐$
2023 1 2,377,482 6,137 87,474 33,522,501$ 173,686$ 2,379,305$ 36,075,492$
2024 2 2,413,145 6,229 88,787 34,025,338$ 176,291$ 2,414,994$ 36,616,624$
2025 3 2,449,342 6,323 90,118 34,535,719$ 178,935$ 2,451,219$ 37,165,873$
2026 4 2,486,082 6,418 91,470 35,053,754$ 181,619$ 2,487,988$ 37,723,361$
2027 5 2,523,373 6,514 92,842 35,579,561$ 184,344$ 2,525,307$ 38,289,212$
2028 6 2,561,224 6,612 94,235 36,113,254$ 187,109$ 2,563,187$ 38,863,550$
2029 7 2,599,642 6,711 95,648 36,654,953$ 189,916$ 2,601,635$ 39,446,503$
2030 8 2,638,637 6,811 97,083 37,204,777$ 192,764$ 2,640,659$ 40,038,201$
2031 9 2,678,216 6,914 98,539 37,762,849$ 195,656$ 2,680,269$ 40,638,774$
2032 10 2,718,389 7,017 100,017 38,329,292$ 198,591$ 2,720,473$ 41,248,356$
2033 11 2,759,165 7,123 101,518 38,904,231$ 201,569$ 2,761,280$ 41,867,081$
2034 12 2,800,553 7,229 103,040 39,487,794$ 204,593$ 2,802,700$ 42,495,087$
2035 13 2,842,561 7,338 104,586 40,080,111$ 207,662$ 2,844,740$ 43,132,513$
2036 14 2,885,200 7,448 106,155 40,681,313$ 210,777$ 2,887,411$ 43,779,501$
2037 15 2,928,477 7,560 107,747 41,291,533$ 213,938$ 2,930,722$ 44,436,194$
2038 16 2,972,405 7,673 109,363 41,910,906$ 217,148$ 2,974,683$ 45,102,736$
2039 17 3,016,991 7,788 111,004 42,539,569$ 220,405$ 3,019,303$ 45,779,278$
2040 18 3,062,246 7,905 112,669 43,177,663$ 223,711$ 3,064,593$ 46,465,967$
2041 19 3,108,179 8,024 114,359 43,825,328$ 227,067$ 3,110,562$ 47,162,956$
2042 20 3,154,802 8,144 116,074 44,482,708$ 230,473$ 3,157,220$ 47,870,401$
Average 38,758,158$ 200,813$ 2,750,913$ 41,709,883$
Total 775,163,153$ 4,016,253$ 55,018,253$ 834,197,659$
Note:
2. Savings are based on 2016$
3. Assumes construction begins in 2020 and ends in 2022. Travel time savings are first realized in 2023.
4. Assumes no new additional users. All users are existing regardless of whether the proposal is built or not.
1. Assumes a 1.5% annual growth corresponding to projected traffic volume growth for subject corridor. 1.5% Growth is applied to year 2016 (base year)
as well since travel time calculations are based on 2015 data. There are no concerns with regards to capacity constraints for this growth rate
Tab 3. TOTAL Travel Time
39 | Mound Road Benefit-Cost Analysis

Synchro ID AproachAverage
Daily TrafficPercent Bus
Percent
Truck
AM Peak Existing ‐
Average Travel
Time per Vehicle
(second)
AM Peak
Proposed ‐
Average Travel
Time per Vehicle
(second)
PM Peak Existing ‐
Average Travel
Time per Vehicle
(second)
PM Peak
Proposed ‐
Average Travel
Time per Vehicle
(second)
OFF Peak Existing ‐
Average Travel
Time per Vehicle
(second)
OFF Peak
Proposed ‐
Average Travel
Time per Vehicle
(second)
TOTAL Travel
Time Savings for
All Purpose
(hr/year)
TOTAL Travel
Time Savings for
Buses (hr/year)
TOTAL Travel
Time Savings for
Trucks (hr/year)
9 NB 48682 0.2% 4.2% 10.7 14.5 16.9 16.2 10.7 12.5 ‐10494.25 ‐15.79 ‐331.69
9 SB 1534 0.2% 4.2% 39.5 42.9 39.1 42.6 39.1 41.3 ‐545.62 ‐0.82 ‐17.25
10 NB 49976 0.3% 4.8% 16.1 14 82.9 98.5 157.9 123.9 128966.72 293.30 4692.86
10 SB 50059 0.2% 4.2% 42.2 29.9 34.9 31.8 20.2 19.7 18816.96 28.32 594.74
13 NB 48682 0.2% 4.2% 14.2 17.3 67.1 57.3 62.6 46.1 80149.84 120.63 2533.26
13 SB 1534 0.2% 4.2% 5.3 25.3 5.2 28.6 4.6 8.2 ‐2070.89 ‐3.12 ‐65.45
14 NB 48682 0.2% 4.2% 28.3 35.9 278.9 296 148.1 128.3 54504.52 82.03 1722.70
14 SB 1534 0.2% 4.2% 11.7 54.3 11.4 45.4 11.1 18.3 ‐3693.29 ‐5.56 ‐116.73
22 NB 48682 0.2% 4.2% 4.1 4.1 4.4 7.4 3.4 3.4 ‐3935.34 ‐5.92 ‐124.38
22 SB 1534 0.2% 4.2% 13.6 13.2 13.4 13.2 12.5 12.6 7.23 0.01 0.23
23 NB 44274 0.4% 5.7% 13.7 14.6 16.5 19.7 14.5 13.8 ‐1874.86 ‐5.75 ‐81.88
23 SB 43958 0.2% 4.8% 17.9 20.3 22.1 26.4 16 16.8 ‐10240.38 ‐15.51 ‐372.24
28 NB 41699 0.5% 6.0% 35.9 31.5 36.6 37.5 32.8 29.9 12994.92 49.99 599.93
28 SB 43395 0.3% 5.0% 28.1 25.4 28.8 26.5 24.5 23.9 7268.40 16.57 276.09
31 NB 41767 0.3% 6.2% 27.7 23.2 26.2 25.3 26 25.1 7925.24 18.29 378.07
31 SB 44703 0.4% 4.9% 23.3 19.9 28.8 23.3 20.1 18.9 14259.02 43.33 530.79
34 NB 40658 0.3% 6.2% 39.8 24.3 33.2 32.8 27.3 20.1 37957.94 87.62 1810.79
34 SB 46834 0.4% 5.1% 15.6 14.7 12.8 13.2 11.9 12.4 ‐1684.08 ‐5.13 ‐65.39
35 NB 43413 0.8% 6.0% 21 27.9 27.3 27.9 17.9 18.5 ‐8809.87 ‐54.40 ‐408.03
35 SB 46834 0.4% 5.1% 31.8 26.4 21.1 22.3 18.7 19.8 ‐904.41 ‐2.75 ‐35.11
36 NB 43413 0.8% 6.0% 13.3 15.6 15.4 15.9 12.9 13.4 ‐4390.68 ‐27.11 ‐203.35
36 SB 42974 0.3% 5.1% 49 37.9 37.3 34.6 31 28.4 22315.65 50.91 865.51
41 NB 39444 0.8% 6.0% 13.4 10.5 40.9 26.1 32.5 20.4 58336.51 360.25 2701.85
41 SB 43926 0.3% 5.1% 15.4 15.3 13.8 13.8 14 14.2 ‐673.47 ‐1.54 ‐26.12
42 NB 43926 0.2% 6.3% 18.5 19.1 108 71 100.2 54.9 212742.79 327.38 10312.62
42 SB 47125 0.3% 5.1% 19.8 18.1 17.6 17.1 18.2 17.3 5905.76 13.47 229.05
116 NB 48682 0.2% 4.2% 38.8 41.4 155.7 153.7 38.4 40.2 ‐7608.33 ‐11.45 ‐240.47
116 SB 1534 0.2% 4.2% 28.4 33.9 28.3 34.1 28.3 31.1 ‐786.40 ‐1.18 ‐24.86
275 NB 36956 0.1% 6.2% 19.9 18.6 54.3 19.2 19.8 16 47263.88 36.29 2249.92
275 SB 39336 0.2% 4.9% 21.1 19.3 20.6 19.3 17.6 16.4 6891.80 10.45 256.00
277 NB 42416 0.1% 5.8% 21.9 28.4 38.1 31.4 21.3 23 ‐4162.52 ‐3.18 ‐184.58
277 SB 43514 0.1% 5.0% 80.6 33.4 24 24.3 22 21.9 41254.28 31.26 1547.26
377 NB 37776 0.6% 4.4% 21.9 17 75.3 72.4 18.6 18 8623.21 39.18 287.33
377 SB 38158 0.5% 4.6% 22.3 19.2 286.8 203.4 18.1 17.1 90814.45 344.23 3166.88
457 NB 46261 0.2% 4.2% 18.2 13.7 36.6 31.8 42.3 34.7 40980.18 61.68 1295.24
457 SB 5002 0.2% 4.2% 17.8 16.1 16.5 15.8 11.5 11.4 310.00 0.47 9.80
458 NB 7889 0.3% 4.8% 12.8 12 18.2 18.6 20.5 19.9 453.69 1.03 16.51
458 SB 43978 0.2% 4.8% 54.3 34 85.4 70 33.3 32.9 37594.57 56.94 1366.56
530 NB 32896 0.5% 5.0% 35.5 20.2 37.4 45.9 28.3 21.7 21401.52 81.46 814.64
530 SB 18872 0.6% 3.2% 57.9 46.9 894.1 501.3 50.7 47.5 210545.14 944.73 5038.55
564 NB 2046 0.2% 4.2% 5.7 5.6 6.8 11.9 8.4 8.3 ‐259.12 ‐0.39 ‐8.19
564 SB 26591 0.2% 4.2% 14.7 5.4 15.1 6.6 11.1 4.6 26224.60 39.47 828.87
572 NB 48682 0.2% 4.2% 15.2 12.1 33.1 25.4 49.1 26.6 109074.62 164.17 3447.47
572 SB 1534 0.2% 4.2% 20.3 65.4 18.5 80.5 15.9 17.5 ‐4175.87 ‐6.28 ‐131.98
573 NB 2056 0.2% 4.2% 22 19.4 125.4 72.6 82.5 57 7624.54 11.48 240.99
573 SB 46996 0.2% 4.2% 13.8 24 11.7 31.1 8.8 8.7 ‐33843.22 ‐50.94 ‐1069.67
574 NB 43926 0.2% 6.3% 11.4 11.7 81 53.2 103.5 79.1 123721.32 190.39 5997.34
574 SB 41082 0.1% 5.0% 73.5 66.6 69.8 70.8 70.6 66.2 20312.63 15.39 761.84
590 NB 39661 0.8% 6.0% 24.4 23.2 24.3 24 24.4 23.3 4974.94 30.72 230.41
590 SB 41136 0.3% 5.1% 24.6 24.1 23.6 23.5 23.7 23.8 164.53 0.38 6.38
591 NB 39661 0.8% 6.0% 24.3 24 36 28.3 25.5 24.5 11642.93 71.90 539.24
591 SB 41136 0.3% 5.1% 8.8 8.4 8.4 8 8.8 8.1 3263.14 7.44 126.56
594 NB 16451 0.5% 3.6% 51.6 48.7 50.3 46.1 44.6 42.9 5291.67 19.85 142.91
594 SB 20089 0.7% 3.0% 74.5 69 290.7 72.5 70.9 68.5 125482.62 656.21 2812.31
722 NB 39059 0.2% 6.3% 69.1 56.1 80.7 63.5 76.3 65 65544.59 100.86 3177.25
722 SB 43514 0.1% 5.0% 20.3 17.4 13.8 13.9 13.8 14 1659.49 1.26 62.24
723 NB 42416 0.1% 5.8% 14.6 16.5 22.9 19.9 14.2 15.5 ‐2981.26 ‐2.28 ‐132.20
723 SB 38607 0.2% 4.9% 174.5 68.4 65.6 69 68.6 59.4 109541.95 166.08 4069.07
724 NB 35067 0.1% 5.8% 54.1 50.6 122.4 60.5 62.5 55.7 80568.75 61.60 3572.65
724 SB 39336 0.2% 4.9% 14.1 15.2 13.3 13.4 12.4 12.9 ‐2683.07 ‐4.07 ‐99.67
725 NB 36956 0.1% 6.2% 13.6 12.8 38.6 14.2 13.9 12.8 27889.84 21.41 1327.65
725 SB 36706 0.5% 4.6% 71.7 58.9 65.3 62.7 63.4 55.3 37825.19 143.37 1319.04
726 NB 33868 0.1% 6.2% 54.8 53.2 348.4 272.9 61.2 59.3 74128.95 56.92 3528.78
726 SB 38158 0.5% 4.6% 15.4 12.7 19 14.2 12.9 12.3 8956.41 33.95 312.33
741 NB 37776 0.6% 4.4% 17.9 16.2 279.3 262.1 15.7 15.3 20002.82 90.89 666.51
741 SB 35033 0.6% 3.2% 28.4 22.7 647.8 481.2 26.4 22 175901.65 789.28 4209.50
782 NB 42273 0.3% 4.8% 39 34.6 47.1 37.4 41.2 35.8 34544.24 78.56 1257.00
782 SB 43958 0.2% 4.8% 12.4 14.3 11.8 14.7 11.3 11.7 ‐6620.93 ‐10.03 ‐240.67
783 NB 48682 0.4% 5.7% 12.8 13.2 14.7 16.7 12.5 12.6 ‐3382.19 ‐10.37 ‐147.70
783 SB 41835 0.3% 5.0% 35.4 30.5 52.5 42.6 30.4 30.4 15158.80 34.55 575.80
786 NB 17037 0.2% 1.7% 14.2 6.2 39.9 10.4 17.9 6.4 34330.16 50.35 428.00
786 SB 14202 0.2% 2.3% 9.8 10.3 9.2 9.2 9 9.2 ‐400.05 ‐0.59 ‐6.79
832 NB 16451 0.2% 1.7% 67.3 64.2 81.6 68.5 64.8 63.6 8790.55 12.89 109.59
832 SB 15451 0.5% 3.3% 10.3 6.1 13.5 10.7 12.3 8.3 7939.19 29.69 195.93
922 NB 44086 0.3% 4.8% 20.6 20.2 30.2 30.3 22.5 22.1 1768.86 4.02 64.37
922 SB 42484 0.2% 4.8% 8.6 8.3 12 11.3 9.5 9.8 ‐56.88 ‐0.09 ‐2.07
923 NB 44086 0.3% 4.8% 8.3 8.2 13.2 24 8.6 8.6 ‐12647.35 ‐28.76 ‐460.21
923 SB 42484 0.2% 4.8% 33.6 33.5 47.8 43.9 32.7 33.2 2673.33 4.05 97.18
977 NB 48127 0.2% 4.2% 9.2 8.1 77.4 58.7 57.1 50.5 53137.46 79.98 1679.49
977 SB 46715 0.2% 4.2% 22.1 31.3 22.2 32.3 16.7 16.8 ‐21808.34 ‐32.82 ‐689.29
978 NB 2156 0.2% 4.2% 34.8 20.4 139.7 99.3 140.7 106.8 9375.15 14.11 296.32
978 SB 46715 0.2% 4.2% 7 6.4 11.4 11.1 5.3 5.1 1762.29 2.65 55.70
2091 NB 18401 0.5% 3.1% 6.3 9.3 7.2 9.1 6.6 8.6 ‐5324.80 ‐19.87 ‐123.19
2091 SB 14202 0.5% 2.6% 37.7 67.4 36.4 45.3 26.7 53.9 ‐46381.93 ‐172.18 ‐895.33
2092 NB 18401 0.3% 3.2% 30.5 55.5 22.1 42 17.4 39.7 ‐55618.04 ‐124.39 ‐1326.86
2092 SB 14202 0.2% 2.3% 8 16.7 7.5 8.4 6.9 11.7 ‐8986.47 ‐13.26 ‐152.51
Source:
1. Average Daily Traffic, Percent Bus, Percent Truck ‐‐ Kimley‐Horn of Michigan, Inc. 2015 Traffic Data Collection by Intersection.
2. Average Vehicle Travel Times ‐‐ Synchro & Simtraffic simulation models for corresponding 2015 Traffic Data
Note:
1. Average vehicle travel times for each time period of the day (i.e. AM, PM, Off peak) are calculated using Synchro and Sim Traffic for Existing conditions and Proposed conditions in the subject corridor
2. Based on 2015 Traffic Data by Kimley‐Horn of Michigan, Inc., Peak volume (i.e. 7AM‐9AM & 3PM‐6PM) applys to 35% of the Average Daily Traffic; 15% for AM peak and 20% for PM peak
4. Positive (+) values represent reductions in travel time; Negative (‐) values represent increases in travel time
3. All values presented in the above table are based on and represent 2015 data. A 1.5% annual growth rate will be applied for future years. The 1.5% annual growth corresponds to a projected growth in traffic volumes for the subject coridor.
Tab 4. Travel Time - Calc
40 | Mound Road Benefit-Cost Analysis

Category $2016 per Person‐hour
Personal 13.60$
Business 25.40$
All Purposes 14.10$
Truck Drivers 27.20$
Bus Drivers 28.30$
Source:
Revised Departmental Guidance on Valuation of Travel Time in Economic Analysis
Vehicle Type Occupancy
Passenger Vehicles 1.39
Trucks 1
Source:
Federal Highway Administration Highway Statistics 2015, Table VM1
Private Vehicle Travel
Commercial Vehicle Operators
https://www.transportation.gov/office‐policy/transportation‐policy/revised‐
departmental‐guidance‐valuation‐travel‐time‐economic
Tab 5. Travel Time - Value
41 | Mound Road Benefit-Cost Analysis

O C B A K O C B A KNo Injury Possible Injury Non‐Incapacitating Incapacitating Killed No Injury Possible Injury Non‐Incapacitating Incapacitating Killed
2016 na 1027.5 114.7 19.4 4.8 1.2 ‐$ ‐$ ‐$ ‐$ ‐$ ‐$
2017 na 1043.0 116.4 19.7 4.9 1.2 ‐$ ‐$ ‐$ ‐$ ‐$ ‐$
2018 na 1058.6 118.2 19.9 4.9 1.2 ‐$ ‐$ ‐$ ‐$ ‐$ ‐$
2019 na 1074.5 120.0 20.2 5.0 1.2 ‐$ ‐$ ‐$ ‐$ ‐$ ‐$
(Beg Construction) 2020 Construction 1090.6 121.8 20.6 5.1 1.2 ‐$ ‐$ ‐$ ‐$ ‐$ ‐$
2021 Construction 1106.9 123.6 20.9 5.2 1.3 ‐$ ‐$ ‐$ ‐$ ‐$ ‐$
(End Construction) 2022 Construction 1123.6 125.4 21.2 5.2 1.3 ‐$ ‐$ ‐$ ‐$ ‐$ ‐$
2023 1 1140.4 127.3 21.5 5.3 1.3 3,649,303$ 8,135,369$ 2,686,184$ 2,441,997$ 12,480,060$ 29,392,913$
2024 2 1157.5 129.2 21.8 5.4 1.3 3,704,043$ 8,257,400$ 2,726,476$ 2,478,627$ 12,667,261$ 29,833,806$
2025 3 1174.9 131.2 22.1 5.5 1.3 3,759,604$ 8,381,261$ 2,767,373$ 2,515,806$ 12,857,270$ 30,281,313$
2026 4 1192.5 133.1 22.5 5.6 1.4 3,815,998$ 8,506,980$ 2,808,884$ 2,553,543$ 13,050,129$ 30,735,533$
2027 5 1210.4 135.1 22.8 5.6 1.4 3,873,238$ 8,634,584$ 2,851,017$ 2,591,846$ 13,245,881$ 31,196,566$
2028 6 1228.5 137.2 23.2 5.7 1.4 3,931,336$ 8,764,103$ 2,893,783$ 2,630,724$ 13,444,569$ 31,664,515$
2029 7 1247.0 139.2 23.5 5.8 1.4 3,990,306$ 8,895,565$ 2,937,189$ 2,670,185$ 13,646,237$ 32,139,482$
2030 8 1265.7 141.3 23.8 5.9 1.4 4,050,161$ 9,028,998$ 2,981,247$ 2,710,238$ 13,850,931$ 32,621,575$
2031 9 1284.7 143.4 24.2 6.0 1.5 4,110,913$ 9,164,433$ 3,025,966$ 2,750,891$ 14,058,695$ 33,110,898$
2032 10 1303.9 145.6 24.6 6.1 1.5 4,172,577$ 9,301,900$ 3,071,355$ 2,792,154$ 14,269,575$ 33,607,562$
2033 11 1323.5 147.8 24.9 6.2 1.5 4,235,166$ 9,441,428$ 3,117,426$ 2,834,037$ 14,483,619$ 34,111,675$
2034 12 1343.3 150.0 25.3 6.3 1.5 4,298,693$ 9,583,050$ 3,164,187$ 2,876,547$ 14,700,873$ 34,623,350$
2035 13 1363.5 152.2 25.7 6.4 1.6 4,363,173$ 9,726,795$ 3,211,650$ 2,919,696$ 14,921,386$ 35,142,700$
2036 14 1383.9 154.5 26.1 6.5 1.6 4,428,621$ 9,872,697$ 3,259,825$ 2,963,491$ 15,145,207$ 35,669,841$
2037 15 1404.7 156.8 26.5 6.6 1.6 4,495,050$ 10,020,788$ 3,308,722$ 3,007,943$ 15,372,385$ 36,204,889$
2038 16 1425.8 159.2 26.9 6.7 1.6 4,562,476$ 10,171,099$ 3,358,353$ 3,053,062$ 15,602,971$ 36,747,962$
2039 17 1447.2 161.6 27.3 6.7 1.6 4,630,913$ 10,323,666$ 3,408,728$ 3,098,858$ 15,837,016$ 37,299,181$
2040 18 1468.9 164.0 27.7 6.9 1.7 4,700,377$ 10,478,521$ 3,459,859$ 3,145,341$ 16,074,571$ 37,858,669$
2041 19 1490.9 166.4 28.1 7.0 1.7 4,770,883$ 10,635,699$ 3,511,757$ 3,192,521$ 16,315,689$ 38,426,549$
2042 20 1513.3 168.9 28.5 7.1 1.7 4,842,446$ 10,795,234$ 3,564,433$ 3,240,409$ 16,560,425$ 39,002,947$
Average 4,219,264$ 9,405,978$ 3,105,721$ 2,823,396$ 14,429,238$ 33,983,596$
Total 84,385,276$ 188,119,569$ 62,114,414$ 56,467,917$ 288,584,751$ 679,671,927$
Note:
2. Savings are based on 2016$
3. Assumes construction begins in 2020 and ends in 2022. Safety benefits are first realized in 2023.
4. Assumes no new additional users. All users are existing regardless of whether the proposal is built or not.
1. Assumes a 1.5% annual growth corresponding to projected traffic volume growth for subject corridor. 1.5% Growth is applied to year 2016 (base year) as well since crash data calculations are based on 2015
data. There are no concerns with regards to capacity constraints for this growth rate
TOTAL Safety
Benefits ($2016)Year Project Year
Estimated Annual Crash Reduction Safety Benefits ($2016)
Tab 6. TOTAL Safety Benefits
42 | Mound Road Benefit-Cost Analysis

O4C B A K O4
C B A K
(No Injury) (Possible Injury)(Non
Incapacitating)(Incapacitating) (Killed) (No Injury) (Possible Injury)
(Non
Incapacitating)(Incapacitating) (Killed)
Rear End 3096 287 34 6 1 619.1 57.4 6.8 1.2 0.2Single Vehicle 104 14 3 0 0 20.9 2.8 0.6 0.0 0.0Pedestrian Crashes @ Proposed Ped Bridge Locations 1 1 0 0 0 0.3 0.2 0.0 0.0 0.0
All Other 1845 102 17 5 2 368.9 20.4 3.4 1.0 0.4
Rear End 753 81 21 4 0 150.7 16.2 4.2 0.8 0.0
Single Vehicle 95 15 6 0 2 18.9 3.0 1.2 0.0 0.4
Pedestrian Crashes @ Proposed Ped Bridge Locations 1 1 0 0 0 0.3 0.2 0.0 0.0 0.0
All Other 571 25 9 2 1 114.3 5.0 1.8 0.4 0.2
Pedestrian Involved 0 4 0 0 0 0.0 0.8 0.0 0.0 0.0
Motorcycle Crashes @ 3‐Lane Section 1 1 0 0 0 0.3 0.2 0.0 0.0 0.0
All Other 439 125 28 12 1 87.8 25.0 5.6 2.4 0.2
Pedestrian Involved 0 0 0 0 0 0.0 0.0 0.0 0.0 0.0
Motorcycle Crashes @ 3‐Lane Section 0 0 0 0 0 0.0 0.0 0.0 0.0 0.0
All Other 6 0 0 0 0 1.1 0.0 0.0 0.0 0.0
Pedestrian Involved 0 0 0 0 0 0.0 0.0 0.0 0.0 0.0
Motorcycle Crashes @ 3‐Lane Section 4 3 0 0 0 0.8 0.6 0.0 0.0 0.0
All Other 1715 200 17 1 0 343.1 40.0 3.4 0.2 0.0
Pedestrian Involved 6 1 3 0 0 1.1 0.2 0.6 0.0 0.0
Motorcycle Crashes @ 3‐Lane Section 0 0 0 0 0 0.0 0.0 0.0 0.0 0.0
All Other 33 2 2 0 0 6.7 0.4 0.4 0.0 0.0
Pedestrian Involved 3 1 1 0 0 0.6 0.2 0.2 0.0 0.0
Motorcycle Crashes @ 3‐Lane Section 6 0 2 0 0 1.1 0.0 0.4 0.0 0.0
All Other 557 22 3 0 0 111.5 4.4 0.6 0.0 0.0
Pedestrian Involved 0 0 0 0 0 0.0 0.0 0.0 0.0 0.0
Motorcycle Crashes @ 3‐Lane Section 0 0 0 0 0 0.0 0.0 0.0 0.0 0.0
All Other 126 37 10 4 2 25.3 7.4 2.0 0.8 0.4
Pedestrian Involved 0 0 0 0 0 0.0 0.0 0.0 0.0 0.0
Motorcycle Crashes @ 3‐Lane Section 0 0 0 0 0 0.0 0.0 0.0 0.0 0.0
All Other 3 0 0 0 0 0.6 0.0 0.0 0.0 0.0
Pedestrian Involved 0 0 0 0 0 0.0 0.0 0.0 0.0 0.0
Motorcycle Crashes @ 3‐Lane Section 1 0 0 0 1 0.3 0.0 0.0 0.0 0.2
All Other 353 31 2 2 0 70.6 6.2 0.4 0.4 0.0
Pedestrian Involved 0 0 0 0 0 0.0 0.0 0.0 0.0 0.0
Motorcycle Crashes @ 3‐Lane Section 3 0 0 0 0 0.6 0.0 0.0 0.0 0.0
All Other 10 2 2 0 0 1.9 0.4 0.4 0.0 0.0
Pedestrian Involved 0 0 0 0 0 0.0 0.0 0.0 0.0 0.0
Motorcycle Crashes @ 3‐Lane Section 0 0 0 1 0 0.0 0.0 0.0 0.2 0.0
All Other 150 2 1 1 0 30.0 0.4 0.2 0.2 0.0
Single Vehicle
2011‐2015 Crashes3
Applicable Crash Category (based on proposed safety treatment)
Annualized Crashes3
All Other
I
n
t
e
r
s
e
c
t
i
o
n
S
e
g
m
e
n
t
A
l
l
C
r
a
s
h
e
s
D
a
y
t
i
m
e
N
i
g
h
t
t
i
m
e
Daytime
Nighttime
Angle
Head‐On
Rear End
Single Vehicle
All Other
Angle
Head‐On
Rear End
Tab 7. Safety Benefits - Calc (1)
43 | Mound Road Benefit-Cost Analysis

CMF1 CMF2 CMF3 CMF4 CMF5 CMF6 CMF7 CMF8 CMF9 CMF10 CMFt CMF1 CMF2 CMF3 CMF4 CMF5 CMF6 CMF7 CMF8 CMF9 CMF10 CMFt CMF1 CMF2 CMF3 CMF4 CMF5 CMF6 CMF7 CMF8 CMF9 CMF10 CMFt
Rear End 0.95 0.58 0.93 0.51 0.95 0.58 0.85 0.47 0.95 0.58 0.85 0.47
Single Vehicle 0.95 0.70 0.93 0.62 0.95 0.70 0.85 0.57 0.95 0.70 0.85 0.57
Pedestrian Crashes @ Proposed Ped Bridge Locations 0.95 0.76 0.93 0.10 0.07 0.95 0.76 0.85 0.10 0.06 0.95 0.76 0.85 0.10 0.06
All Other 0.95 0.76 0.93 0.67 0.95 0.76 0.85 0.61 0.95 0.76 0.85 0.61
Rear End 0.95 0.58 0.93 0.75 0.40 0.95 0.58 0.85 0.75 0.37 0.95 0.58 0.85 0.75 0.37
Single Vehicle 0.95 0.70 0.93 0.75 0.49 0.95 0.70 0.85 0.75 0.45 0.95 0.70 0.85 0.75 0.45
Pedestrian Crashes @ Proposed Ped Bridge Locations 0.95 0.76 0.93 0.75 0.10 0.06 0.95 0.76 0.85 0.75 0.10 0.06 0.95 0.76 0.85 0.75 0.10 0.06
All Other 0.95 0.76 0.93 0.75 0.53 0.95 0.76 0.85 0.75 0.48 0.95 0.76 0.85 0.75 0.48
Pedestrian Involved 0.95 0.76 0.93 0.90 0.58 0.85 0.70 0.60 0.75 0.24 0.95 0.76 0.85 0.90 0.58 0.85 0.70 0.60 0.75 0.24 0.95 0.76 0.85 0.90 0.58 0.85 0.70 0.60 0.75 0.24
Motorcycle Crashes @ 3‐Lane Section 0.95 0.76 0.93 0.90 0.58 0.85 0.70 0.88 0.31 0.95 0.76 0.85 0.90 0.58 0.85 0.70 0.88 0.31 0.95 0.76 0.85 0.90 0.58 0.85 0.70 0.88 0.31
All Other 0.95 0.76 0.93 0.90 0.58 0.85 0.70 0.60 0.75 0.24 0.95 0.76 0.85 0.90 0.58 0.85 0.70 0.60 0.75 0.24 0.95 0.76 0.85 1.00 0.58 0.85 0.70 0.60 0.75 0.24
Pedestrian Involved 0.95 0.76 0.93 0.90 0.90 0.85 0.90 0.58 0.95 0.76 0.85 0.90 0.90 0.85 0.90 0.55 0.95 0.76 0.85 0.90 0.90 0.85 0.90 0.55
Motorcycle Crashes @ 3‐Lane Section 0.95 0.76 0.93 0.90 0.90 0.85 0.90 0.88 0.57 0.95 0.76 0.85 0.90 0.90 0.85 0.90 0.88 0.55 0.95 0.76 0.85 0.90 0.90 0.85 0.90 0.88 0.55
All Other 0.95 0.76 0.93 0.90 0.90 0.85 0.90 0.58 0.95 0.76 0.85 0.90 0.90 0.85 0.90 0.55 0.95 0.76 0.85 0.90 0.90 0.85 0.90 0.55
Pedestrian Involved 0.95 0.58 0.93 0.90 0.90 0.85 0.70 0.60 0.75 0.24 0.95 0.58 0.85 0.90 0.90 0.85 0.70 0.60 0.75 0.24 0.95 0.58 0.85 0.90 0.90 0.85 0.70 0.60 0.75 0.24
Motorcycle Crashes @ 3‐Lane Section 0.95 0.58 0.93 0.90 0.90 0.85 0.70 0.88 0.35 0.95 0.58 0.85 0.90 0.90 0.85 0.70 0.88 0.35 0.95 0.58 0.85 0.90 0.90 0.85 0.70 0.88 0.35
All Other 0.95 0.58 0.93 0.90 0.90 0.85 0.70 0.35 0.95 0.58 0.85 0.90 0.90 0.85 0.70 0.35 0.95 0.58 0.85 0.90 0.90 0.85 0.70 0.35
Pedestrian Involved 0.95 0.70 0.93 0.90 0.90 0.85 0.90 0.60 0.75 0.32 0.95 0.70 0.85 0.90 0.90 0.85 0.90 0.60 0.75 0.32 0.95 0.70 0.85 0.90 0.90 0.85 0.90 0.60 0.75 0.32
Motorcycle Crashes @ 3‐Lane Section 0.95 0.70 0.93 0.90 0.90 0.85 0.88 0.53 0.95 0.70 0.85 0.90 0.90 0.85 0.88 0.51 0.95 0.70 0.85 0.90 0.90 0.85 0.88 0.51
All Other 0.95 0.70 0.93 0.90 0.90 0.85 0.54 0.95 0.70 0.85 0.90 0.90 0.85 0.51 0.95 0.70 0.85 0.90 0.90 0.85 0.51
Pedestrian Involved 0.95 0.76 0.93 0.90 0.90 0.85 0.90 0.60 0.75 0.34 0.95 0.76 0.85 0.90 0.90 0.85 0.90 0.60 0.75 0.34 0.95 0.76 0.85 0.90 0.90 0.85 0.90 0.60 0.75 0.34
Motorcycle Crashes @ 3‐Lane Section 0.95 0.76 0.93 0.90 0.90 0.85 0.88 0.57 0.95 0.76 0.85 0.90 0.90 0.85 0.88 0.55 0.95 0.76 0.85 0.90 0.90 0.85 0.88 0.55
All Other 0.95 0.76 0.93 0.90 0.90 0.85 0.58 0.95 0.76 0.85 0.90 0.90 0.85 0.55 0.95 0.76 0.85 0.90 0.90 0.85 0.55
Pedestrian Involved 0.95 0.76 0.93 0.90 0.58 0.85 0.75 0.70 0.60 0.75 0.24 0.95 0.76 0.85 0.90 0.58 0.85 0.75 0.70 0.60 0.75 0.24 0.95 0.76 0.85 0.90 0.58 0.85 0.75 0.70 0.60 0.75 0.24
Motorcycle Crashes @ 3‐Lane Section 0.95 0.76 0.93 0.90 0.58 0.85 0.75 0.70 0.88 0.30 0.95 0.76 0.85 0.90 0.58 0.85 0.75 0.70 0.88 0.30 0.95 0.76 0.85 0.90 0.58 0.85 0.75 0.70 0.88 0.30
All Other 0.95 0.76 0.93 0.90 0.58 0.85 0.75 0.70 0.30 0.95 0.76 0.85 0.90 0.58 0.85 0.75 0.70 0.30 0.95 0.76 0.85 0.90 0.58 0.85 0.75 0.70 0.30
Pedestrian Involved 0.95 0.76 0.93 0.90 0.90 0.85 0.75 0.90 0.60 0.75 0.34 0.95 0.76 0.85 0.90 0.90 0.85 0.75 0.90 0.60 0.75 0.34 0.95 0.76 0.85 0.90 0.90 0.85 0.75 0.90 0.60 0.75 0.34
Motorcycle Crashes @ 3‐Lane Section 0.95 0.76 0.93 0.90 0.90 0.85 0.75 0.90 0.88 0.48 0.95 0.76 0.85 0.90 0.90 0.85 0.75 0.90 0.88 0.48 0.95 0.76 0.85 0.90 0.90 0.85 0.75 0.90 0.88 0.48
All Other 0.95 0.76 0.93 0.90 0.90 0.85 0.75 0.90 0.48 0.95 0.76 0.85 0.90 0.90 0.85 0.75 0.90 0.48 0.95 0.76 0.85 0.90 0.90 0.85 0.75 0.90 0.48
Pedestrian Involved 0.95 0.58 0.93 0.90 0.90 0.85 0.75 0.70 0.60 0.75 0.24 0.95 0.58 0.85 0.90 0.90 0.85 0.75 0.70 0.60 0.75 0.24 0.95 0.58 0.85 0.90 0.90 0.85 0.75 0.70 0.60 0.75 0.24
Motorcycle Crashes @ 3‐Lane Section 0.95 0.58 0.93 0.90 0.90 0.85 0.75 0.70 0.88 0.30 0.95 0.58 0.85 0.90 0.90 0.85 0.75 0.70 0.88 0.30 0.95 0.58 0.85 0.90 0.90 0.85 0.75 0.70 0.88 0.30
All Other 0.95 0.58 0.93 0.90 0.90 0.85 0.75 0.70 0.30 0.95 0.58 0.85 0.90 0.90 0.85 0.75 0.70 0.30 0.95 0.58 0.85 0.90 0.90 0.85 0.75 0.70 0.30
Pedestrian Involved 0.95 0.70 0.93 0.90 0.90 0.85 0.75 0.90 0.60 0.75 0.32 0.95 0.70 0.85 0.90 0.90 0.85 0.75 0.90 0.60 0.75 0.32 0.95 0.70 0.85 0.90 0.90 0.85 0.75 0.90 0.60 0.75 0.32
Motorcycle Crashes @ 3‐Lane Section 0.95 0.70 0.93 0.90 0.90 0.85 0.75 0.88 0.45 0.95 0.70 0.85 0.90 0.90 0.85 0.75 0.88 0.45 0.95 0.70 0.85 0.90 0.90 0.85 0.75 0.88 0.45
All Other 0.95 0.70 0.93 0.90 0.90 0.85 0.75 0.45 0.95 0.70 0.85 0.90 0.90 0.85 0.75 0.45 0.95 0.70 0.85 0.90 0.90 0.85 0.75 0.45
Pedestrian Involved 0.95 0.76 0.93 0.90 0.90 0.85 0.75 0.90 0.60 0.75 0.34 0.95 0.76 0.85 0.90 0.90 0.85 0.75 0.90 0.60 0.75 0.34 0.95 0.76 0.85 0.90 0.90 0.85 0.75 0.90 0.60 0.75 0.34
Motorcycle Crashes @ 3‐Lane Section 0.95 0.76 0.93 0.90 0.90 0.85 0.75 0.88 0.48 0.95 0.76 0.85 0.90 0.90 0.85 0.75 0.88 0.48 0.95 0.76 0.85 0.90 0.90 0.85 0.75 0.88 0.48
All Other 0.95 0.76 0.93 0.90 0.90 0.85 0.75 0.48 0.95 0.76 0.85 0.90 0.90 0.85 0.75 0.48 0.95 0.76 0.85 0.90 0.90 0.85 0.75 0.48
CMF1 CMF2 CMF3 CMF4 CMF5 CMF6 CMF7 CMF8 CMF9 CMF10 CMFt CMF1 CMF2 CMF3 CMF4 CMF5 CMF6 CMF7 CMF8 CMF9 CMF10 CMFt
Rear End 0.95 0.58 0.85 0.47 0.95 0.58 0.85 0.47
Single Vehicle 0.95 0.70 0.85 0.57 0.95 0.70 0.85 0.57
Pedestrian Crashes @ Proposed Ped Bridge Locations 0.95 0.76 0.85 0.10 0.06 0.95 0.76 0.85 0.10 0.06
All Other 0.95 0.76 0.85 0.61 0.95 0.76 0.85 0.61
Rear End 0.95 0.58 0.85 0.75 0.37 0.95 0.58 0.85 0.75 0.37
Single Vehicle 0.95 0.70 0.85 0.75 0.45 0.95 0.70 0.85 0.75 0.45
Pedestrian Crashes @ Proposed Ped Bridge Locations 0.95 0.76 0.85 0.75 0.10 0.06 0.95 0.76 0.85 0.75 0.10 0.06
All Other 0.95 0.76 0.85 0.75 0.48 0.95 0.76 0.85 0.75 0.48
Pedestrian Involved 0.95 0.76 0.85 0.90 0.58 0.85 0.70 0.60 0.75 0.24 0.95 0.76 0.85 0.90 0.58 0.85 0.70 0.60 0.75 0.24
Motorcycle Crashes @ 3‐Lane Section 0.95 0.76 0.85 0.90 0.58 0.85 0.70 0.88 0.31 0.95 0.76 0.85 0.90 0.58 0.85 0.70 0.88 0.31
All Other 0.95 0.76 0.85 0.90 0.58 0.85 0.70 0.60 0.75 0.24 0.95 0.76 0.85 0.90 0.58 0.85 0.70 0.60 0.75 0.24
Pedestrian Involved 0.95 0.76 0.85 0.90 0.90 0.85 0.90 0.55 0.95 0.76 0.85 0.90 0.90 0.85 0.90 0.55
Motorcycle Crashes @ 3‐Lane Section 0.95 0.76 0.85 0.90 0.90 0.85 0.90 0.88 0.55 0.95 0.76 0.85 0.90 0.90 0.85 0.90 0.88 0.55
All Other 0.95 0.76 0.85 0.90 0.90 0.85 0.90 0.55 0.95 0.76 0.85 0.90 0.90 0.85 0.90 0.55
Pedestrian Involved 0.95 0.58 0.85 0.90 0.90 0.85 0.70 0.60 0.75 0.24 0.95 0.58 0.85 0.90 0.90 0.85 0.70 0.60 0.75 0.24
Motorcycle Crashes @ 3‐Lane Section 0.95 0.58 0.85 0.90 0.90 0.85 0.70 0.88 0.35 0.95 0.58 0.85 0.90 0.90 0.85 0.70 0.88 0.35
All Other 0.95 0.58 0.85 0.90 0.90 0.85 0.70 0.35 0.95 0.58 0.85 0.90 0.90 0.85 0.70 0.35
Pedestrian Involved 0.95 0.70 0.85 0.90 0.90 0.85 0.90 0.60 0.75 0.32 0.95 0.70 0.85 0.90 0.90 0.85 0.90 0.60 0.75 0.32
Motorcycle Crashes @ 3‐Lane Section 0.95 0.70 0.85 0.90 0.90 0.85 0.88 0.51 0.95 0.70 0.85 0.90 0.90 0.85 0.88 0.51
All Other 0.95 0.70 0.85 0.90 0.90 0.85 0.51 0.95 0.70 0.85 0.90 0.90 0.85 0.51
Pedestrian Involved 0.95 0.76 0.85 0.90 0.90 0.85 0.90 0.60 0.75 0.34 0.95 0.76 0.85 0.90 0.90 0.85 0.90 0.60 0.75 0.34
Motorcycle Crashes @ 3‐Lane Section 0.95 0.76 0.85 0.90 0.90 0.85 0.88 0.55 0.95 0.76 0.85 0.90 0.90 0.85 0.88 0.55
All Other 0.95 0.76 0.85 0.90 0.90 0.85 0.55 0.95 0.76 0.85 0.90 0.90 0.85 0.55
Pedestrian Involved 0.95 0.76 0.85 0.90 0.58 0.85 0.75 0.70 0.60 0.75 0.24 0.95 0.76 0.85 0.90 0.58 0.85 0.75 0.70 0.60 0.75 0.24
Motorcycle Crashes @ 3‐Lane Section 0.95 0.76 0.85 0.90 0.58 0.85 0.75 0.70 0.88 0.30 0.95 0.76 0.85 0.90 0.58 0.85 0.75 0.70 0.88 0.30
All Other 0.95 0.76 0.85 0.90 0.58 0.85 0.75 0.70 0.30 0.95 0.76 0.85 0.90 0.58 0.85 0.75 0.70 0.30
Pedestrian Involved 0.95 0.76 0.85 0.90 0.90 0.85 0.75 0.90 0.60 0.75 0.34 0.95 0.76 0.85 0.90 0.90 0.85 0.75 0.90 0.60 0.75 0.34
Motorcycle Crashes @ 3‐Lane Section 0.95 0.76 0.85 0.90 0.90 0.85 0.75 0.90 0.88 0.48 0.95 0.76 0.85 0.90 0.90 0.85 0.75 0.90 0.88 0.48
All Other 0.95 0.76 0.85 0.90 0.90 0.85 0.75 0.90 0.48 0.95 0.76 0.85 0.90 0.90 0.85 0.75 0.90 0.48
Pedestrian Involved 0.95 0.58 0.85 0.90 0.90 0.85 0.75 0.70 0.60 0.75 0.24 0.95 0.58 0.85 0.90 0.90 0.85 0.75 0.70 0.60 0.75 0.24
Motorcycle Crashes @ 3‐Lane Section 0.95 0.58 0.85 0.90 0.90 0.85 0.75 0.70 0.88 0.30 0.95 0.58 0.85 0.90 0.90 0.85 0.75 0.70 0.88 0.30
All Other 0.95 0.58 0.85 0.90 0.90 0.85 0.75 0.70 0.30 0.95 0.58 0.85 0.90 0.90 0.85 0.75 0.70 0.30
Pedestrian Involved 0.95 0.70 0.85 0.90 0.90 0.85 0.75 0.90 0.60 0.75 0.32 0.95 0.70 0.85 0.90 0.90 0.85 0.75 0.90 0.60 0.75 0.32
Motorcycle Crashes @ 3‐Lane Section 0.95 0.70 0.85 0.90 0.90 0.85 0.75 0.88 0.45 0.95 0.70 0.85 0.90 0.90 0.85 0.75 0.88 0.45
All Other 0.95 0.70 0.85 0.90 0.90 0.85 0.75 0.45 0.95 0.70 0.85 0.90 0.90 0.85 0.75 0.45
Pedestrian Involved 0.95 0.76 0.85 0.90 0.90 0.85 0.75 0.90 0.60 0.75 0.34 0.95 0.76 0.85 0.90 0.90 0.85 0.75 0.90 0.60 0.75 0.34
Motorcycle Crashes @ 3‐Lane Section 0.95 0.76 0.85 0.90 0.90 0.85 0.75 0.88 0.48 0.95 0.76 0.85 0.90 0.90 0.85 0.75 0.88 0.48
All Other 0.95 0.76 0.85 0.90 0.90 0.85 0.75 0.48 0.95 0.76 0.85 0.90 0.90 0.85 0.75 0.48
Applicable CMF's8
Applicable CMF's8
Single Vehicle
All Other
A (Incapacitating) K (Killed)Applicable Crash Category (based on proposed safety treatment)
A
l
l
C
r
a
s
h
e
s
S
e
g
m
e
n
t
Daytime
Nighttime
I
n
t
e
r
s
e
c
t
i
o
n
D
a
y
t
i
m
e
Angle
Head‐On
Rear End
Single Vehicle
All Other
N
i
g
h
t
t
i
m
e
Angle
Head‐On
Rear End
Single Vehicle
All Other
O (No Injury) C (Possible Injury) B (Not Incapacitating)Applicable Crash Category (based on proposed safety treatment)
A
l
l
C
r
a
s
h
e
s
S
e
g
m
e
n
t
Daytime
Nighttime
I
n
t
e
r
s
e
c
t
i
o
n
D
a
y
t
i
m
e
Angle
Head‐On
Rear End
Single Vehicle
All Other
N
i
g
h
t
t
i
m
e
Angle
Head‐On
Rear End
Tab 7. Safety Benefits - Calc (2)
44 | Mound Road Benefit-Cost Analysis

O4C B A K O4
C B A K
(No Injury) (Possible Injury)(Non
Incapacitating)(Incapacitating) (Killed) (No Injury) (Possible Injury)
(Non
Incapacitating)(Incapacitating) (Killed)
Rear End 301.9 30.5 3.6 0.6 0.1 965,944$ 1,950,018$ 451,903$ 292,897$ 1,020,768$
Single Vehicle 8.0 1.2 0.3 0.0 0.0 25,457$ 77,785$ 32,606$ ‐$ ‐$
Pedestrian Crashes @ Proposed Ped Bridge Locations 0.3 0.2 0.0 0.0 0.0 827$ 11,954$ ‐$ ‐$ ‐$
All Other 121.2 7.9 1.3 0.4 0.2 387,841$ 503,565$ 164,178$ 177,350$ 1,483,392$
Rear End 89.7 10.2 2.6 0.5 0.0 287,104$ 652,422$ 330,881$ 231,478$ ‐$
Single Vehicle 9.7 1.7 0.7 0.0 0.2 30,957$ 106,154$ 83,063$ ‐$ 2,126,400$
Pedestrian Crashes @ Proposed Ped Bridge Locations 0.3 0.2 0.0 0.0 0.0 839$ 12,052$ ‐$ ‐$ ‐$
All Other 53.7 2.6 0.9 0.2 0.1 171,807$ 164,702$ 115,988$ 94,666$ 989,760$
Pedestrian Involved 0.0 0.6 0.0 0.0 0.0 ‐$ 38,667$ ‐$ ‐$ ‐$
Motorcycle Crashes @ 3‐Lane Section 0.2 0.1 0.0 0.0 0.0 615$ 8,837$ ‐$ ‐$ ‐$
All Other 66.4 18.9 4.2 1.8 0.2 212,634$ 1,208,349$ 529,480$ 833,432$ 1,452,288$
Pedestrian Involved 0.0 0.0 0.0 0.0 0.0 ‐$ ‐$ ‐$ ‐$ ‐$
Motorcycle Crashes @ 3‐Lane Section 0.0 0.0 0.0 0.0 0.0 ‐$ ‐$ ‐$ ‐$ ‐$
All Other 0.5 0.0 0.0 0.0 0.0 1,490$ ‐$ ‐$ ‐$ ‐$
Pedestrian Involved 0.0 0.0 0.0 0.0 0.0 ‐$ ‐$ ‐$ ‐$ ‐$
Motorcycle Crashes @ 3‐Lane Section 0.5 0.4 0.0 0.0 0.0 1,748$ 25,109$ ‐$ ‐$ ‐$
All Other 224.7 26.2 2.2 0.1 0.0 718,927$ 1,673,924$ 278,333$ 60,133$ ‐$
Pedestrian Involved 0.8 0.1 0.4 0.0 0.0 2,438$ 8,754$ 51,375$ ‐$ ‐$
Motorcycle Crashes @ 3‐Lane Section 0.0 0.0 0.0 0.0 0.0 ‐$ ‐$ ‐$ ‐$ ‐$
All Other 3.1 0.2 0.2 0.0 0.0 9,917$ 12,633$ 24,713$ ‐$ ‐$
Pedestrian Involved 0.4 0.1 0.1 0.0 0.0 1,171$ 8,409$ 16,450$ ‐$ ‐$
Motorcycle Crashes @ 3‐Lane Section 0.5 0.0 0.2 0.0 0.0 1,530$ ‐$ 22,545$ ‐$ ‐$
All Other 46.7 2.0 0.3 0.0 0.0 149,327$ 126,775$ 33,818$ ‐$ ‐$
Pedestrian Involved 0.0 0.0 0.0 0.0 0.0 ‐$ ‐$ ‐$ ‐$ ‐$
Motorcycle Crashes @ 3‐Lane Section 0.0 0.0 0.0 0.0 0.0 ‐$ ‐$ ‐$ ‐$ ‐$
All Other 17.6 5.1 1.4 0.6 0.3 56,303$ 328,874$ 173,875$ 255,443$ 2,670,720$
Pedestrian Involved 0.0 0.0 0.0 0.0 0.0 ‐$ ‐$ ‐$ ‐$ ‐$
Motorcycle Crashes @ 3‐Lane Section 0.0 0.0 0.0 0.0 0.0 ‐$ ‐$ ‐$ ‐$ ‐$
All Other 0.3 0.0 0.0 0.0 0.0 917$ ‐$ ‐$ ‐$ ‐$
Pedestrian Involved 0.0 0.0 0.0 0.0 0.0 ‐$ ‐$ ‐$ ‐$ ‐$
Motorcycle Crashes @ 3‐Lane Section 0.2 0.0 0.0 0.0 0.1 619$ ‐$ ‐$ ‐$ 1,335,360$
All Other 49.1 4.3 0.3 0.3 0.0 157,154$ 275,543$ 34,775$ 127,722$ ‐$
Pedestrian Involved 0.0 0.0 0.0 0.0 0.0 ‐$ ‐$ ‐$ ‐$ ‐$
Motorcycle Crashes @ 3‐Lane Section 0.3 0.0 0.0 0.0 0.0 985$ ‐$ ‐$ ‐$ ‐$
All Other 1.1 0.2 0.2 0.0 0.0 3,448$ 14,154$ 27,688$ ‐$ ‐$
Pedestrian Involved 0.0 0.0 0.0 0.0 0.0 ‐$ ‐$ ‐$ ‐$ ‐$
Motorcycle Crashes @ 3‐Lane Section 0.0 0.0 0.0 0.1 0.0 ‐$ ‐$ ‐$ 47,333$ ‐$
All Other 15.5 0.2 0.1 0.1 0.0 49,528$ 13,176$ 12,888$ 47,333$ ‐$
TOTAL 3,239,527$ 7,221,858$ 2,384,555$ 2,167,788$ 11,078,688$
Note:
1. 2011 ‐ 2015 crashes for the subject corridor are obtained from the Transportation improvement Association (TIA) TCAT database
2. Annual crashes are obtained via the average of the 2011‐2015 crashes. Crashes are increased by 1.5% each year starting with 2016 by assuming a direct correlation between traffic volumes and crash frequency.
3. Crashes reported represent all of the number of injuries, fatalities, or no injuries involved in the accident on a per individual basis
4. The Michigan State Police Department reports O (No Injury) crashes on a per vehicle basis and not on a per individual basis. Consequently a 1.39 average occupancy rate based on the BCA Guidance has been applied to report the number of individuals involved in O (No Injury) cras
5. The impact of multiple safety treatments on crashes is assessed via the multiplication of the best three CMF's. The number of CMF's applied was limited to 3 to avoid unrealistic crash reductions:
Where, CMF for combined treatments
CMF for first best treatment
CMF for second best treatment
CMF for third best treatment
6. Applicable Crash Categories listed correspond with the identified CMFs based on the proposed safety treatment.
7. In order to avoid double counting which may stem from applying CMF's to overlapping Crash Categories, the Crash Categories have been split and isolated
8. Refer to CMF Tab for applicable CMFs
Estimated Annual Crash Reduction3 Annual Safety Benefits
Angle
Head‐On
Rear End
Single Vehicle
All Other
Applicable Crash Category (based on proposed safety treatment)
A
l
l
C
r
a
s
h
e
s
S
e
g
m
e
n
t
Daytime
Nighttime
I
n
t
e
r
s
e
c
t
i
o
n
D
a
y
t
i
m
e
Angle
Head‐On
Rear End
Single Vehicle
All Other
N
i
g
h
t
t
i
m
e
∗ ∗
Tab 7. Safety Benefits - Calc (3)
45 | Mound Road Benefit-Cost Analysis

CMF ID Name CMF Crash Type Crash Severity Area Type Time of Day Source
62 Install signs to conform to MUTCD 0.85 All Injury Urban All http://www.cmfclearinghouse.org/detail.cfm?facid=62
63 Install signs to conform to MUTCD 0.93 All PDO Urban All http://www.cmfclearinghouse.org/detail.cfm?facid=63
194 Increased pavement friction 0.76 All All All All http://www.cmfclearinghouse.org/detail.cfm?facid=194
197 Increased pavement friction 0.58 Rear End All All All http://www.cmfclearinghouse.org/detail.cfm?facid=197
198 Increased pavement friction 0.7 Single Vehicle All All All http://www.cmfclearinghouse.org/detail.cfm?facid=198
1263 Improve lighting 0.75 All All All Nighttime http://www.cmfclearinghouse.org/detail.cfm?facid=1263
1410 Add 3‐inch yellow retroreflective sheeting to signal backplates 0.85 All All Signalized Intersection All http://www.cmfclearinghouse.org/detail.cfm?facid=1410
1413 Add signal (additional primary head) 0.9 All All Signalized Intersection All http://www.cmfclearinghouse.org/detail.cfm?facid=1413
1418 Add signal (additional primary head) 0.58 Angle All Signalized Intersection All http://www.cmfclearinghouse.org/detail.cfm?facid=1418
1802 Install pedestrian overpass/underpass 0.1 Pedestrian All All All http://www.cmfclearinghouse.org/detail.cfm?facid=1802
2950 Change no. of lanes on major road of a 4‐leg signalized intersection from X to Y 0.9 Motorcycle Crashes All Urban Signalized Intersection All http://www.cmfclearinghouse.org/detail.cfm?facid=2950
4123 Install high‐visibility crosswalk 0.6 Pedestrian All Urban Intersection All http://www.cmfclearinghouse.org/detail.cfm?facid=4123
MDOT‐1 Signal Optimization & Timing Updates 0.9 All All Signalized Intersection All https://www.michigan.gov/documents/mdot/mdot_Crash_Reduction_Factors_303744_7.pdf
MDOT‐2 Ped. Countdown Signals ‐ Upgrade from existing signal 0.75 Pedestrian All Signalized Intersection All https://www.michigan.gov/documents/mdot/mdot_Crash_Reduction_Factors_303744_7.pdf
MDOT‐3 Signing and Pavement Markings ‐ Improve/Upgrade 0.7 Angle, Rear‐End All Intersection All https://www.michigan.gov/documents/mdot/mdot_Crash_Reduction_Factors_303744_7.pdf
MDOT‐4 Signing and Pavement Markings ‐ Improve/Upgrade 0.9 Head‐On, Pedestrian All Intersection All https://www.michigan.gov/documents/mdot/mdot_Crash_Reduction_Factors_303744_7.pdf
MDOT‐5 Recessed Durable Pavement Markings 0.95 All All All All https://www.michigan.gov/documents/mdot/mdot_Crash_Reduction_Factors_303744_7.pdf
Tab 8. CMF - Values
46 | Mound Road Benefit-Cost Analysis

KABCO Level Monetized Value ($2016)
O ‐ No Injury 3,200$
C ‐ Possible Injury 63,900$
B ‐ Non Incapacitating Injury 125,000$
A ‐ Incapacitating 459,100$
K ‐ Killed 9,600,000$
U ‐ Injured (Severity Unknown) 174,000$
# Accidents Reported (Unknown if Injured) 132,200$
Note: Michigan State Police UD‐10 Forms use KABCO scale for reporting crashes
Property Damage Only (PDO) Crashes ($2016) 4,252$
Source:
Guidance on Treatment of the Economic Value of a Statistical Life in U.S. Department of Transportation Analysis (2016)
https://www.transportation.gov/office‐policy/transportation‐policy/revised‐departmental‐guidance‐on‐valuation‐of‐a‐statistical‐life‐in‐economic‐analysis
Tab 9. KABCO Level - Values
47 | Mound Road Benefit-Cost Analysis

Year Project Year
TOTAL VOC
Savings
(short ton/year)
TOTAL Nox
Savings
(short ton/year)
TOTAL PM Savings
(short ton/year)
TOTAL CO Savings
(metric ton/year)
TOTAL CO2 Savings
(short ton/year)
TOTAL VOC
Savings
($2016)
TOTAL Nox
Savings
($2016)
TOTAL PM Savings
($2016)
TOTAL CO Savings
($2016)
TOTAL CO2 Savings
($2016)
TOTAL Emission
Savings
($2016)
2016 na 3.66 4.82 0.70 38.62 3,791 ‐$ ‐$ ‐$ ‐$ ‐$ ‐$
2017 na 3.71 4.89 0.71 39.20 3,848 ‐$ ‐$ ‐$ ‐$ ‐$ ‐$
2018 na 3.77 4.97 0.72 39.78 3,906 ‐$ ‐$ ‐$ ‐$ ‐$ ‐$
2019 na 3.82 5.04 0.73 40.38 3,964 ‐$ ‐$ ‐$ ‐$ ‐$ ‐$
Construction)2020 Construction 3.88 5.12 0.74 40.99 4,024 ‐$ ‐$ ‐$ ‐$ ‐$ ‐$
2021 Construction 3.94 5.19 0.75 41.60 4,084 ‐$ ‐$ ‐$ ‐$ ‐$ ‐$
onstruction) 2022 Construction 4.00 5.27 0.77 42.22 4,145 ‐$ ‐$ ‐$ ‐$ ‐$ ‐$
2023 1 4.06 5.35 0.78 42.86 4,208 7,599$ 39,471$ 262,241$ 201,307$ 88,459$ 599,078$
2024 2 4.12 5.43 0.79 43.50 4,271 7,713$ 40,063$ 266,175$ 204,327$ 93,031$ 611,309$
2025 3 4.18 5.51 0.80 44.15 4,335 7,829$ 40,664$ 270,168$ 207,391$ 97,720$ 623,773$
2026 4 4.24 5.60 0.81 44.82 4,400 7,947$ 41,274$ 274,220$ 210,502$ 102,530$ 636,473$
2027 5 4.31 5.68 0.82 45.49 4,466 8,066$ 41,893$ 278,333$ 213,660$ 107,461$ 649,414$
2028 6 4.37 5.76 0.84 46.17 4,533 8,187$ 42,522$ 282,508$ 216,865$ 112,517$ 662,599$
2029 7 4.44 5.85 0.85 46.86 4,601 8,310$ 43,160$ 286,746$ 220,118$ 117,701$ 676,034$
2030 8 4.51 5.94 0.86 47.57 4,670 8,434$ 43,807$ 291,047$ 223,420$ 123,015$ 689,723$
2031 9 4.57 6.03 0.88 48.28 4,740 8,561$ 44,464$ 295,413$ 226,771$ 139,267$ 714,476$
2032 10 4.64 6.12 0.89 49.00 4,811 8,689$ 45,131$ 299,844$ 230,172$ 155,980$ 739,816$
2033 11 4.71 6.21 0.90 49.74 4,883 8,819$ 45,808$ 304,342$ 233,625$ 173,162$ 765,756$
2034 12 4.78 6.30 0.92 50.48 4,956 8,952$ 46,495$ 308,907$ 237,129$ 190,824$ 792,307$
2035 13 4.85 6.40 0.93 51.24 5,031 9,086$ 47,193$ 313,540$ 240,686$ 208,978$ 819,483$
2036 14 4.93 6.49 0.94 52.01 5,106 9,222$ 47,901$ 318,244$ 244,297$ 227,633$ 847,296$
2037 15 5.00 6.59 0.96 52.79 5,183 9,361$ 48,619$ 323,017$ 247,961$ 246,800$ 875,758$
2038 16 5.08 6.69 0.97 53.58 5,260 9,501$ 49,348$ 327,862$ 251,680$ 266,492$ 904,884$
2039 17 5.15 6.79 0.99 54.39 5,339 9,644$ 50,089$ 332,780$ 255,456$ 286,719$ 934,687$
2040 18 5.23 6.89 1.00 55.20 5,419 9,788$ 50,840$ 337,772$ 259,287$ 307,492$ 965,180$
2041 19 5.31 7.00 1.02 56.03 5,501 9,935$ 51,603$ 342,839$ 263,177$ 326,038$ 993,591$
2042 20 5.39 7.10 1.03 56.87 5,583 10,084$ 52,377$ 347,981$ 267,124$ 345,071$ 1,022,637$
Average 8,786$ 45,636$ 303,199$ 232,748$ 185,844$ 776,214$
Total 175,727$ 912,723$ 6,063,981$ 4,654,955$ 3,716,889$ 15,524,275$
Note:
2. Savings are based on 2016$
3. Assumes construction begins in 2020 and ends in 2022. Emission savings are first realized in 2023.
4. Assumes no new additional users. All users are existing regardless of whether the proposal is built or not.
1. Assumes a 1.5% annual growth corresponding to projected traffic volume growth for subject corridor. 1.5% Growth is applied to year 2016 (base year) as well since emission data calculations are based on 2015 data. There are no concerns with
regards to capacity constraints for this growth rate
Tab 10. TOTAL Emissions
48 | Mound Road Benefit-Cost Analysis

VOC NOx CO PM VOC NOx CO PM VOC NOx CO PM VOC NOx CO PM
9 NB 48682 0.10 49 0.0807 0.3437 2.0550 0.0156 36 0.1021 0.3503 2.3177 0.0206 49 0.0807 0.3437 2.0550 0.0156 42 0.0902 0.3447 2.1410 0.0179
9 SB 1534 0.50 47 0.0830 0.3434 2.0675 0.0162 43 0.0886 0.3442 2.1206 0.0175 48 0.0819 0.3435 2.0612 0.0159 45 0.0854 0.3431 2.0799 0.0168
10 NB 49976 0.10 24 0.1406 0.4056 2.7640 0.0298 27 0.1290 0.3888 2.6279 0.0273 7 0.3894 0.7356 4.8430 0.0718 7 0.3894 0.7356 4.8430 0.0718
10 SB 50059 0.10 11 0.2516 0.5511 3.8606 0.0488 16 0.1899 0.4748 3.4179 0.0386 23 0.1457 0.4128 2.8582 0.0308 24 0.1406 0.4056 2.7640 0.0298
13 NB 48682 0.10 34 0.1073 0.3560 2.3944 0.0218 28 0.1257 0.3841 2.6069 0.0265 8 0.3480 0.6796 4.5466 0.0649 11 0.2516 0.5511 3.8606 0.0488
13 SB 1534 0.10 37 0.1000 0.3492 2.2837 0.0201 8 0.3480 0.6796 4.5466 0.0649 43 0.0886 0.3442 2.1206 0.0175 24 0.1406 0.4056 2.7640 0.0298
14 NB 48682 0.40 50 0.0795 0.3438 2.0488 0.0152 39 0.0956 0.3470 2.2157 0.0191 10 0.2651 0.5677 3.6540 0.0511 11 0.2516 0.5511 3.8606 0.0488
14 SB 1534 0.10 42 0.0902 0.3447 2.1410 0.0179 9 0.3066 0.6237 4.2503 0.0580 44 0.0870 0.3436 2.1003 0.0172 27 0.1290 0.3888 2.6279 0.0273
22 NB 48682 0.01 37 0.1000 0.3492 2.2837 0.0201 37 0.1000 0.3492 2.2837 0.0201 44 0.0870 0.3436 2.1003 0.0172 44 0.0870 0.3436 2.1003 0.0172
22 SB 1534 0.10 38 0.0978 0.3481 2.2497 0.0196 39 0.0956 0.3470 2.2157 0.0191 42 0.0902 0.3447 2.1410 0.0179 41 0.0918 0.3453 2.1613 0.0183
23 NB 44274 0.10 32 0.1132 0.3653 2.4797 0.0234 29 0.1224 0.3793 2.5859 0.0258 30 0.1192 0.3745 2.5650 0.0250 31 0.1162 0.3699 2.5223 0.0242
23 SB 43958 0.10 30 0.1192 0.3745 2.5650 0.0250 26 0.1322 0.3936 2.6488 0.0281 33 0.1103 0.3606 2.437 0.0226 32 0.1132 0.3653 2.4797 0.0234
28 NB 41699 0.40 35 0.1043 0.3514 2.3518 0.0210 40 0.0934 0.3459 2.1817 0.0186 39 0.0956 0.3470 2.2157 0.0191 43 0.0886 0.3442 2.1206 0.0175
28 SB 43395 0.20 30 0.1192 0.3745 2.5650 0.0250 34 0.1073 0.3560 2.3944 0.0218 35 0.1043 0.3514 2.3518 0.0210 36 0.1021 0.3503 2.3177 0.0206
31 NB 41767 0.20 31 0.1162 0.3699 2.5223 0.0242 37 0.1000 0.3492 2.2837 0.0201 33 0.1103 0.3606 2.437 0.0226 34 0.1073 0.3560 2.3944 0.0218
31 SB 44703 0.20 32 0.1132 0.3653 2.4797 0.0234 37 0.1000 0.3492 2.2837 0.0201 37 0.1000 0.3492 2.2837 0.0201 39 0.0956 0.3470 2.2157 0.0191
34 NB 40658 0.20 19 0.1683 0.4446 3.2102 0.0349 31 0.1162 0.3699 2.5223 0.0242 27 0.1290 0.3888 2.6279 0.0273 37 0.1000 0.3492 2.2837 0.0201
34 SB 46834 0.10 31 0.1162 0.3699 2.5223 0.0242 33 0.1103 0.3606 2.4370 0.0226 40 0.0934 0.3459 2.1817 0.0186 39 0.0956 0.3470 2.2157 0.0191
35 NB 43413 0.10 23 0.1457 0.4128 2.8582 0.0308 17 0.1827 0.4647 3.3487 0.0374 27 0.1290 0.3888 2.6279 0.0273 26 0.1322 0.3936 2.6488 0.0281
35 SB 46834 0.10 17 0.1827 0.4647 3.3487 0.0374 20 0.1610 0.4346 3.1409 0.0336 28 0.1257 0.3841 2.6069 0.0265 27 0.1290 0.3888 2.6279 0.0273
36 NB 43413 0.10 40 0.0934 0.3459 2.1817 0.0186 34 0.1073 0.3560 2.3944 0.0218 41 0.0918 0.3453 2.1613 0.0183 39 0.0956 0.3470 2.2157 0.0191
36 SB 42974 0.30 22 0.1508 0.4201 2.9525 0.0317 28 0.1257 0.3841 2.6069 0.0265 34 0.1073 0.3560 2.3944 0.0218 37 0.1000 0.3492 2.2837 0.0201
41 NB 39444 0.10 27 0.1290 0.3888 2.6279 0.0273 34 0.1073 0.3560 2.3944 0.0218 11 0.2516 0.5511 3.8606 0.0488 18 0.1755 0.4547 3.2794 0.0361
41 SB 43926 0.20 38 0.0978 0.3481 2.2497 0.0196 39 0.0956 0.3470 2.2157 0.0191 42 0.0902 0.3447 2.1410 0.0179 42 0.0902 0.3447 2.1410 0.0179
42 NB 43926 0.20 32 0.1132 0.3653 2.4797 0.0234 31 0.1162 0.3699 2.5223 0.0242 9 0.3066 0.6237 4.2503 0.0580 11 0.2516 0.5511 3.8606 0.0488
42 SB 47125 0.10 25 0.1356 0.3983 2.6698 0.0289 27 0.1290 0.3888 2.6279 0.0273 27 0.1290 0.3888 2.6279 0.0273 28 0.1257 0.3841 2.6069 0.0265
116 NB 48682 0.50 48 0.0819 0.3435 2.0612 0.0159 45 0.0854 0.3431 2.0799 0.0168 49 0.0807 0.3437 2.0550 0.0156 46 0.0842 0.3432 2.0737 0.0165
116 SB 1534 0.40 50 0.0795 0.3438 2.0488 0.0152 42 0.0902 0.3447 2.1410 0.0179 50 0.0795 0.3438 2.0488 0.0152 45 0.0854 0.3431 2.0799 0.0168
275 NB 36956 0.20 28 0.1257 0.3841 2.6069 0.0265 30 0.1192 0.3745 2.5650 0.0250 28 0.1257 0.3841 2.6069 0.0265 35 0.1043 0.3514 2.3518 0.0210
275 SB 39336 0.10 25 0.1356 0.3983 2.6698 0.0289 28 0.1257 0.3841 2.6069 0.0265 30 0.1192 0.3745 2.5650 0.0250 33 0.1103 0.3606 2.4370 0.0226
277 NB 42416 0.10 23 0.1457 0.4128 2.8582 0.0308 18 0.1755 0.4547 3.2794 0.0361 24 0.1406 0.4056 2.7640 0.0298 22 0.1508 0.4201 2.9525 0.0317
277 SB 43514 0.20 7 0.3894 0.7356 4.8430 0.0718 17 0.1827 0.4647 3.3487 0.0374 26 0.1322 0.3936 2.6488 0.0281 26 0.1322 0.3936 2.6488 0.0281
377 NB 37776 0.20 25 0.1356 0.3983 2.6698 0.0289 32 0.1132 0.3653 2.4797 0.0234 29 0.1224 0.3793 2.5859 0.0258 30 0.1192 0.3745 2.5650 0.0250
377 SB 38158 0.20 29 0.1224 0.3793 2.5859 0.0258 34 0.1073 0.3560 2.3944 0.0218 36 0.1021 0.3503 2.3177 0.0206 38 0.0978 0.3481 2.2497 0.0196
457 NB 46261 0.01 9 0.3066 0.6237 4.2503 0.0580 12 0.2380 0.5345 3.7673 0.0466 4 0.6836 1.1642 6.9812 0.1217 5 0.4723 0.8474 5.4356 0.0857
457 SB 5002 0.10 21 0.1559 0.4274 3.0467 0.0327 24 0.1406 0.4056 2.7640 0.0298 33 0.1103 0.3606 2.437 0.0226 33 0.1103 0.3606 2.4370 0.0226
458 NB 7889 0.10 37 0.1000 0.3492 2.2837 0.0201 39 0.0956 0.3470 2.2157 0.0191 29 0.1224 0.3793 2.5859 0.0258 28 0.1257 0.3841 2.6069 0.0265
458 SB 43978 0.30 17 0.1827 0.4647 3.3487 0.0374 28 0.1257 0.3841 2.6069 0.0265 28 0.1257 0.3841 2.6069 0.0265 29 0.1224 0.3793 2.5859 0.0258
530 NB 32896 0.20 23 0.1457 0.4128 2.8582 0.0308 40 0.0934 0.3459 2.1817 0.0186 29 0.1224 0.3793 2.5859 0.0258 38 0.0978 0.3481 2.2497 0.0196
530 SB 18872 0.60 38 0.0978 0.3481 2.2497 0.0196 47 0.0830 0.3434 2.0675 0.0162 43 0.0886 0.3442 2.1206 0.0175 46 0.0842 0.3432 2.0737 0.0165
564 NB 2046 0.10 37 0.1000 0.3492 2.2837 0.0201 37 0.1000 0.3492 2.2837 0.0201 46 0.0842 0.3432 2.0737 0.0165 46 0.0842 0.3432 2.0737 0.0165
564 SB 26591 0.01 10 0.2651 0.5677 3.9540 0.0511 28 0.1257 0.3841 2.6069 0.0265 14 0.2108 0.5014 3.5805 0.0421 32 0.1132 0.3653 2.4797 0.0234
572 NB 48682 0.10 13 0.2244 0.5180 3.6739 0.0444 16 0.1899 0.4748 3.4179 0.0386 5 0.4723 0.8474 5.4356 0.0857 9 0.3066 0.6237 4.2503 0.0580
572 SB 1534 0.20 33 0.1103 0.3606 2.4370 0.0226 10 0.2651 0.5677 3.6540 0.0511 42 0.0902 0.3447 2.1410 0.0179 38 0.0978 0.3481 2.2497 0.0196
573 NB 2056 0.20 30 0.1192 0.3745 2.5650 0.0250 34 0.1073 0.3560 2.3944 0.0218 8 0.3480 0.6796 4.5466 0.0649 12 0.2380 0.5345 3.7673 0.0466
573 SB 46996 0.10 23 0.1457 0.4128 2.8582 0.0308 13 0.2244 0.5180 3.6739 0.0444 36 0.1021 0.3503 2.3177 0.0206 36 0.1021 0.3503 2.3177 0.0206
574 NB 43926 0.10 43 0.0886 0.3442 2.1206 0.0175 42 0.0902 0.3447 2.1410 0.0179 38 0.0978 0.3481 2.2497 0.0196 36 0.1021 0.3503 2.3177 0.0206
574 SB 41082 0.70 36 0.1021 0.3503 2.3177 0.0206 39 0.0956 0.3470 2.2157 0.0191 37 0.1000 0.3492 2.2837 0.0201 40 0.0934 0.3459 2.1817 0.0186
590 NB 39661 0.30 44 0.0870 0.3436 2.1003 0.0172 46 0.0842 0.3432 2.0737 0.0165 44 0.0870 0.3436 2.1003 0.0172 46 0.0842 0.3432 2.0737 0.0165
590 SB 41136 0.30 44 0.0870 0.3436 2.1003 0.0172 45 0.0854 0.3431 2.0799 0.0168 45 0.0854 0.3431 2.0799 0.0168 45 0.0854 0.3431 2.0799 0.0168
591 NB 39661 0.30 44 0.0870 0.3436 2.1003 0.0172 45 0.0854 0.3431 2.0799 0.0168 42 0.0902 0.3447 2.1410 0.0179 44 0.0870 0.3436 2.1003 0.0172
591 SB 41136 0.10 41 0.0918 0.3453 2.1613 0.0183 43 0.0886 0.3442 2.1206 0.0175 41 0.0918 0.3453 2.1613 0.0183 44 0.0870 0.3436 2.1003 0.0172
594 NB 16451 0.60 43 0.0886 0.3442 2.1206 0.0175 45 0.0854 0.3431 2.0799 0.0168 49 0.0807 0.3437 2.0550 0.0156 51 0.0787 0.3442 2.0509 0.0150
594 SB 20089 0.90 44 0.0870 0.3436 2.1003 0.0172 47 0.0830 0.3434 2.0675 0.0162 46 0.0842 0.3432 2.0737 0.0165 48 0.0819 0.3435 2.0612 0.0159
722 NB 39059 0.70 38 0.0978 0.3481 2.2497 0.0196 47 0.0830 0.3434 2.0675 0.0162 34 0.1073 0.3560 2.3944 0.0218 40 0.0934 0.3459 2.1817 0.0186
722 SB 43514 0.10 25 0.1356 0.3983 2.6698 0.0289 30 0.1192 0.3745 2.5650 0.0250 37 0.1000 0.3492 2.2837 0.0201 37 0.1000 0.3492 2.2837 0.0201
723 NB 42416 0.20 39 0.0956 0.3470 2.2157 0.0191 35 0.1043 0.3514 2.3518 0.0210 40 0.0934 0.3459 2.1817 0.0186 37 0.1000 0.3492 2.2837 0.0201
723 SB 38607 0.70 15 0.1972 0.4848 3.4871 0.0399 38 0.0978 0.3481 2.2497 0.0196 38 0.0978 0.3481 2.2497 0.0196 43 0.0886 0.3442 2.1206 0.0175
724 NB 35067 0.70 48 0.0819 0.3435 2.0612 0.0159 51 0.0787 0.3442 2.0509 0.0150 41 0.0918 0.3453 2.1613 0.0183 46 0.0842 0.3432 2.0737 0.0165
724 SB 39336 0.20 39 0.0956 0.3470 2.2157 0.0191 37 0.1000 0.3492 2.2837 0.0201 45 0.0854 0.3431 2.0799 0.0168 43 0.0886 0.3442 2.1206 0.0175
725 NB 36956 0.10 39 0.0956 0.3470 2.2157 0.0191 42 0.0902 0.3447 2.1410 0.0179 38 0.0978 0.3481 2.2497 0.0196 42 0.0902 0.3447 2.1410 0.0179
725 SB 36706 0.70 36 0.1021 0.3503 2.3177 0.0206 43 0.0886 0.3442 2.1206 0.0175 40 0.0934 0.3459 2.1817 0.0186 46 0.0842 0.3432 2.0737 0.0165
726 NB 33868 0.70 47 0.0830 0.3434 2.0675 0.0162 48 0.0819 0.3435 2.0612 0.0159 42 0.0902 0.3447 2.1410 0.0179 43 0.0886 0.3442 2.1206 0.0175
726 SB 38158 0.20 36 0.1021 0.3503 2.3177 0.0206 43 0.0886 0.3442 2.1206 0.0175 42 0.0902 0.3447 2.1410 0.0179 44 0.0870 0.3436 2.1003 0.0172
741 NB 37776 0.20 37 0.1000 0.3492 2.2837 0.0201 41 0.0918 0.3453 2.1613 0.0183 42 0.0902 0.3447 2.1410 0.0179 43 0.0886 0.3442 2.1206 0.0175
741 SB 35033 0.20 29 0.1224 0.3793 2.5859 0.0258 36 0.1021 0.3503 2.3177 0.0206 31 0.1162 0.3699 2.5223 0.0242 37 0.1000 0.3492 2.2837 0.0201
782 NB 42273 0.40 37 0.1000 0.3492 2.2837 0.0201 42 0.0902 0.3447 2.1410 0.0179 35 0.1043 0.3514 2.3518 0.0210 40 0.0934 0.3459 2.1817 0.0186
782 SB 43958 0.10 35 0.1043 0.3514 2.3518 0.0210 30 0.1192 0.3745 2.5650 0.0250 38 0.0978 0.3481 2.2497 0.0196 37 0.1000 0.3492 2.2837 0.0201
783 NB 48682 0.10 42 0.0902 0.3447 2.1410 0.0179 40 0.0934 0.3459 2.1817 0.0186 43 0.0886 0.3442 2.1206 0.0175 42 0.0902 0.3447 2.1410 0.0179
783 SB 41835 0.40 36 0.1021 0.3503 2.3177 0.0206 42 0.0902 0.3447 2.1410 0.0179 42 0.0902 0.3447 2.1410 0.0179 42 0.0902 0.3447 2.1410 0.0179
786 NB 17037 0.10 16 0.1899 0.4748 3.4179 0.0386 37 0.1000 0.3492 2.2837 0.0201 13 0.2244 0.5180 3.6739 0.0444 36 0.1021 0.3503 2.3177 0.0206
786 SB 14202 0.10 41 0.0918 0.3453 2.1613 0.0183 39 0.0956 0.3470 2.2157 0.0191 45 0.0854 0.3431 2.0799 0.0168 44 0.0870 0.3436 2.1003 0.0172
832 NB 16451 0.90 49 0.0807 0.3437 2.0550 0.0156 51 0.0787 0.3442 2.0509 0.0150 50 0.0795 0.3438 2.0488 0.0152 51 0.0787 0.3442 2.0509 0.0150
832 SB 15451 0.10 22 0.1508 0.4201 2.9525 0.0317 38 0.0978 0.3481 2.2497 0.0196 19 0.1683 0.4446 3.2102 0.0349 28 0.1257 0.3841 2.6069 0.0265
922 NB 44086 0.30 46 0.0842 0.3432 2.0737 0.0165 47 0.0830 0.3434 2.0675 0.0162 42 0.0902 0.3447 2.1410 0.0179 43 0.0886 0.3442 2.1206 0.0175
922 SB 42484 0.10 42 0.0902 0.3447 2.1410 0.0179 43 0.0886 0.3442 2.1206 0.0175 38 0.0978 0.3481 2.2497 0.0196 37 0.1000 0.3492 2.2837 0.0201
923 NB 44086 0.10 43 0.0886 0.3442 2.1206 0.0175 44 0.0870 0.3436 2.1003 0.0172 42 0.0902 0.3447 2.1410 0.0179 42 0.0902 0.3447 2.1410 0.0179
923 SB 42484 0.40 43 0.0886 0.3442 2.1206 0.0175 43 0.0886 0.3442 2.1206 0.0175 44 0.0870 0.3436 2.1003 0.0172 44 0.0870 0.3436 2.1003 0.0172
977 NB 48127 0.10 34 0.1073 0.3560 2.3944 0.0218 39 0.0956 0.3470 2.2157 0.0191 7 0.3894 0.7356 4.8430 0.0718 9 0.3066 0.6237 4.2503 0.0580
977 SB 46715 0.20 32 0.1132 0.3653 2.4797 0.0234 23 0.1457 0.4128 2.8582 0.0308 42 0.0902 0.3447 2.1410 0.0179 42 0.0902 0.3447 2.1410 0.0179
978 NB 2156 0.20 20 0.1610 0.4346 3.1409 0.0336 35 0.1043 0.3514 2.3518 0.0210 6 0.4308 0.7915 5.1393 0.0788 9 0.3066 0.6237 4.2503 0.0580
978 SB 46715 0.01 22 0.1508 0.4201 2.9525 0.0317 24 0.1406 0.4056 2.7640 0.0298 30 0.1192 0.3745 2.5650 0.0250 31 0.1162 0.3699 2.5223 0.0242
2091 NB 18401 0.01 26 0.1322 0.3936 2.6488 0.0281 18 0.1755 0.4547 3.2794 0.0361 25 0.1356 0.3983 2.6698 0.0289 20 0.1610 0.4346 3.1409 0.0336
2091 SB 14202 0.10 13 0.2244 0.5180 3.6739 0.0444 7 0.3894 0.7356 4.8430 0.0718 19 0.1683 0.4446 3.2102 0.0349 9 0.3066 0.6237 4.2503 0.0580
2092 NB 18401 0.10 13 0.2244 0.5180 3.6739 0.0444 7 0.3894 0.7356 4.8430 0.0718 23 0.1457 0.4128 2.8582 0.0308 10 0.2651 0.5677 3.954 0.0511
2092 SB 14202 0.01 21 0.1559 0.4274 3.0467 0.0327 10 0.2651 0.5677 3.6540 0.0511 24 0.1406 0.4056 2.7640 0.0298 14 0.2108 0.5014 3.5805 0.0421
Synchro
IDAproach
Average Daily
Traffic
Segment
Legth (mi)Equivalency Factors (g/mi)
AM Peak ‐ Existing
Avg. Speed per Veh
(mph)
Avg. Speed per Veh
(mph)
Equivalency Factors (g/mi)
AM Peak ‐ Proposed
Avg. Speed per Veh
(mph)
OFF Peak ‐ Existing
Equivalency Factors (g/mi) Avg. Speed per Veh
(mph)
OFF Peak ‐ Proposed
Equivalency Factors (g/mi)
Tab 11. Emissions - Calc (Non-CO2) (1)
49 | Mound Road Benefit-Cost Analysis

VOC NOx CO PM VOC NOx CO PM
9 NB 48682 0.10 31 0.1162 0.3699 2.5223 0.0242 32 0.1132 0.3653 2.4797 0.0234 ‐0.0142 ‐0.0012 ‐0.1542 ‐0.0034
9 SB 1534 0.50 48 0.0819 0.3435 2.0612 0.0159 44 0.0870 0.3436 2.1003 0.0172 ‐0.0011 0.0000 ‐0.0078 ‐0.0003
10 NB 49976 0.10 7 0.3894 0.7356 4.8430 0.0718 6 0.4308 0.7915 5.1393 0.0788 ‐0.0108 ‐0.0143 ‐0.0709 ‐0.0017
10 SB 50059 0.10 13 0.2244 0.5180 3.6739 0.0444 15 0.1972 0.4848 3.4871 0.0399 0.0299 0.0378 0.3015 0.0051
13 NB 48682 0.10 7 0.3894 0.7356 4.8430 0.0718 9 0.3066 0.6237 4.2503 0.0580 0.1233 0.1640 0.9463 0.0202
13 SB 1534 0.10 38 0.0978 0.3481 2.2497 0.0196 7 0.3894 0.7356 4.8430 0.0718 ‐0.0066 ‐0.0085 ‐0.0715 ‐0.0013
14 NB 48682 0.40 5 0.4723 0.8474 5.4356 0.0857 5 0.4723 0.8474 5.4356 0.0857 0.0410 0.0665 ‐1.1324 0.0059
14 SB 1534 0.10 43 0.0886 0.3442 2.1206 0.0175 11 0.2516 0.5511 3.8606 0.0488 ‐0.0047 ‐0.0057 ‐0.0564 ‐0.0010
22 NB 48682 0.01 34 0.1073 0.3560 2.3944 0.0218 20 0.161 0.4346 3.1409 0.0336 ‐0.0017 ‐0.0025 ‐0.0265 ‐0.0004
22 SB 1534 0.10 39 0.0956 0.3470 2.2157 0.0191 40 0.0934 0.3459 2.1817 0.0186 0.0000 0.0000 ‐0.0001 0.0000
23 NB 44274 0.10 26 0.1322 0.3936 2.6488 0.0281 22 0.1508 0.4201 2.9525 0.0317 ‐0.0046 ‐0.0065 ‐0.0790 ‐0.0008
23 SB 43958 0.10 24 0.1406 0.4056 2.7640 0.0298 20 0.161 0.4346 3.1409 0.0336 ‐0.0115 ‐0.0171 ‐0.1856 ‐0.0025
28 NB 41699 0.40 35 0.1043 0.3514 2.3518 0.021 34 0.1073 0.3560 2.3944 0.0218 0.0309 0.0095 0.4798 0.0069
28 SB 43395 0.20 30 0.1192 0.3745 2.565 0.025 32 0.1132 0.3653 2.4797 0.0234 0.0127 0.0153 0.2053 0.0030
31 NB 41767 0.20 33 0.1103 0.3606 2.4370 0.0226 34 0.1073 0.3560 2.3944 0.0218 0.0138 0.0194 0.2195 0.0036
31 SB 44703 0.20 26 0.1322 0.3936 2.6488 0.0281 32 0.1132 0.3653 2.4797 0.0234 0.0256 0.0282 0.3505 0.0062
34 NB 40658 0.20 22 0.1508 0.4201 2.9525 0.0317 23 0.1457 0.4128 2.8582 0.0308 0.0746 0.1035 1.0263 0.0174
34 SB 46834 0.10 38 0.0978 0.3481 2.2497 0.0196 36 0.1021 0.3503 2.3177 0.0206 ‐0.0022 0.0004 ‐0.0392 ‐0.0004
35 NB 43413 0.10 18 0.1755 0.4547 3.2794 0.0361 17 0.1827 0.4647 3.3487 0.0374 ‐0.0131 ‐0.0186 ‐0.1601 ‐0.0025
35 SB 46834 0.10 25 0.1356 0.3983 2.6698 0.0289 24 0.1406 0.4056 2.7640 0.0298 0.0002 0.0000 ‐0.0023 ‐0.0002
36 NB 43413 0.10 34 0.1073 0.3560 2.3944 0.0218 33 0.1103 0.3606 2.4370 0.0226 ‐0.0074 ‐0.0051 ‐0.1201 ‐0.0017
36 SB 42974 0.30 29 0.1224 0.3793 2.5859 0.0258 31 0.1162 0.3699 2.5223 0.0242 0.0417 0.0500 0.6424 0.0094
41 NB 39444 0.10 9 0.3066 0.6237 4.2503 0.0580 14 0.2108 0.5014 3.5805 0.0421 0.0940 0.1203 0.7872 0.0160
41 SB 43926 0.20 43 0.0886 0.3442 2.1206 0.0175 43 0.0886 0.3442 2.1206 0.0175 0.0010 0.0005 0.0164 0.0002
42 NB 43926 0.20 9 0.3066 0.6237 4.2503 0.0580 11 0.2516 0.5511 3.8606 0.0488 0.1348 0.1776 1.0417 0.0224
42 SB 47125 0.10 28 0.1257 0.3841 2.6069 0.0265 28 0.1257 0.3841 2.6069 0.0265 0.0049 0.0070 0.0343 0.0012
116 NB 48682 0.50 12 0.2380 0.5345 3.7673 0.0466 12 0.2380 0.5345 3.7673 0.0466 ‐0.0226 0.0031 ‐0.1329 ‐0.0058
116 SB 1534 0.40 50 0.0795 0.3438 2.0488 0.0152 41 0.0918 0.3453 2.1613 0.0183 ‐0.0016 0.0000 ‐0.0127 ‐0.0004
275 NB 36956 0.20 11 0.2516 0.5511 3.8606 0.0488 29 0.1224 0.3793 2.5859 0.0258 0.0997 0.1397 1.1521 0.0206
275 SB 39336 0.10 26 0.1322 0.3936 2.6488 0.0281 28 0.1257 0.3841 2.6069 0.0265 0.0112 0.0170 0.1450 0.0029
277 NB 42416 0.10 14 0.2108 0.5014 3.5805 0.0421 16 0.1899 0.4748 3.4179 0.0386 ‐0.0097 ‐0.0146 ‐0.2372 ‐0.0019
277 SB 43514 0.20 24 0.1406 0.4056 2.7640 0.0298 24 0.1406 0.4056 2.7640 0.0298 0.0894 0.1172 0.7120 0.0149
377 NB 37776 0.20 7 0.3894 0.7356 4.8430 0.0718 8 0.348 0.6796 4.5466 0.0649 0.0343 0.0482 0.2796 0.0068
377 SB 38158 0.20 3 0.81038 1.3542 7.90848 0.1433 4 0.6836 1.1642 6.9812 0.1217 0.0769 0.1086 0.7198 0.0141
457 NB 46261 0.01 4 0.6836 1.1642 6.9812 0.1217 5 0.4723 0.8474 5.4356 0.0857 0.0291 0.0433 0.2341 0.0050
457 SB 5002 0.10 23 0.1457 0.4128 2.8582 0.0308 24 0.1406 0.4056 2.7640 0.0298 0.0005 0.0008 0.0112 0.0001
458 NB 7889 0.10 26 0.1322 0.3936 2.6488 0.0281 25 0.1356 0.3983 2.6698 0.0289 ‐0.0006 ‐0.0010 ‐0.0022 ‐0.0001
458 SB 43978 0.30 11 0.2516 0.5511 3.8606 0.0488 13 0.2244 0.5180 3.6739 0.0444 0.0705 0.0954 0.7814 0.0130
530 NB 32896 0.20 24 0.1406 0.4056 2.7640 0.0298 27 0.1290 0.3888 2.6279 0.0273 0.0570 0.0734 0.8338 0.0139
530 SB 18872 0.60 2 2.2373 3.7023 21.3167 0.3941 4 0.6836 1.1642 6.9812 0.1217 1.1850 1.9098 12.0886 0.2088
564 NB 2046 0.10 31 0.1162 0.3699 2.5223 0.0242 21 0.1559 0.4274 3.0467 0.0327 ‐0.0005 ‐0.0008 ‐0.0078 ‐0.0001
564 SB 26591 0.01 10 0.2651 0.5677 3.954 0.0511 23 0.1457 0.4128 2.8582 0.0308 0.0095 0.0130 0.1103 0.0018
572 NB 48682 0.10 6 0.4308 0.7915 5.1393 0.0788 8 0.348 0.6796 4.5466 0.0649 0.2088 0.2811 1.6479 0.0349
572 SB 1534 0.20 36 0.1021 0.3503 2.3177 0.0206 8 0.348 0.6796 4.5466 0.0649 ‐0.0079 ‐0.0101 ‐0.0783 ‐0.0014
573 NB 2056 0.20 5 0.4723 0.8474 5.4356 0.0857 9 0.3066 0.6237 4.2503 0.0580 0.0145 0.0193 0.1154 0.0024
573 SB 46996 0.10 27 0.1290 0.3888 2.6279 0.0273 10 0.2651 0.5677 3.954 0.0511 ‐0.0608 ‐0.0803 ‐0.6648 ‐0.0106
574 NB 43926 0.10 32 0.1132 0.3653 2.4797 0.0234 32 0.1132 0.3653 2.4797 0.0234 ‐0.0044 ‐0.0022 ‐0.0758 ‐0.0010
574 SB 41082 0.70 38 0.0978 0.3481 2.2497 0.0196 37 0.1000 0.3492 2.2837 0.0201 0.0460 0.0231 0.7851 0.0105
590 NB 39661 0.30 44 0.0870 0.3436 2.1003 0.0172 44 0.0870 0.3436 2.1003 0.0172 0.0088 0.0013 0.0924 0.0022
590 SB 41136 0.30 46 0.0842 0.3432 2.0737 0.0165 46 0.0842 0.3432 2.0737 0.0165 0.0010 0.0003 0.0138 0.0002
591 NB 39661 0.30 30 0.1192 0.3745 2.565 0.025 38 0.0978 0.3481 2.2497 0.0196 0.0260 0.0239 0.4020 0.0063
591 SB 41136 0.10 43 0.0886 0.3442 2.1206 0.0175 45 0.0854 0.3431 2.0799 0.0168 0.0058 0.0020 0.0809 0.0013
594 NB 16451 0.60 44 0.0870 0.3436 2.1003 0.0172 48 0.0819 0.3435 2.0612 0.0159 0.0092 ‐0.0005 0.0598 0.0025
594 SB 20089 0.90 11 0.2516 0.5511 3.8606 0.0488 45 0.0854 0.3431 2.0799 0.0168 0.2117 0.2482 2.4363 0.0416
722 NB 39059 0.70 33 0.1103 0.3606 2.4370 0.0226 41 0.0918 0.3453 2.1613 0.0183 0.1355 0.0936 2.2027 0.0313
722 SB 43514 0.10 37 0.1000 0.3492 2.2837 0.0201 37 0.1000 0.3492 2.2837 0.0201 0.0035 0.0051 0.0250 0.0008
723 NB 42416 0.20 25 0.1356 0.3983 2.6698 0.0289 29 0.1224 0.3793 2.5859 0.0258 ‐0.0083 0.0028 ‐0.2165 ‐0.0018
723 SB 38607 0.70 39 0.0956 0.3470 2.2157 0.0191 37 0.1000 0.3492 2.2837 0.0201 0.1792 0.2024 2.5245 0.0377
724 NB 35067 0.70 21 0.1559 0.4274 3.0467 0.0327 43 0.0886 0.3442 2.1206 0.0175 0.1536 0.1456 2.1835 0.0353
724 SB 39336 0.20 42 0.0902 0.3447 2.1410 0.0179 42 0.0902 0.3447 2.1410 0.0179 ‐0.0071 ‐0.0027 ‐0.1053 ‐0.0016
725 NB 36956 0.10 16 0.1899 0.4748 3.4179 0.0386 38 0.0978 0.3481 2.2497 0.0196 0.0296 0.0342 0.4256 0.0062
725 SB 36706 0.70 39 0.0956 0.3470 2.2157 0.0191 41 0.0918 0.3453 2.1613 0.0183 0.0746 0.0256 1.0377 0.0169
726 NB 33868 0.70 8 0.348 0.6796 4.5466 0.0649 10 0.2651 0.5677 3.954 0.0511 0.1397 0.1783 1.1485 0.0241
726 SB 38158 0.20 29 0.1224 0.3793 2.5859 0.0258 38 0.0978 0.3481 2.2497 0.0196 0.0228 0.0199 0.3433 0.0055
741 NB 37776 0.20 17 0.1827 0.4647 3.3487 0.0374 14 0.2108 0.5014 3.5805 0.0421 ‐0.0084 ‐0.0161 ‐0.0406 ‐0.0010
741 SB 35033 0.20 2 2.2373 3.7023 21.3167 0.3941 2 2.2373 3.7023 21.3167 0.3941 0.0315 0.0413 0.4995 0.0080
782 NB 42273 0.40 31 0.1162 0.3699 2.5223 0.0242 39 0.0956 0.3470 2.2157 0.0191 0.0710 0.0495 1.1930 0.0163
782 SB 43958 0.10 37 0.1000 0.3492 2.2837 0.0201 29 0.1224 0.3793 2.5859 0.0258 ‐0.0119 ‐0.0149 ‐0.1837 ‐0.0030
783 NB 48682 0.10 36 0.1021 0.3503 2.3177 0.0206 32 0.1132 0.3653 2.4797 0.0234 ‐0.0060 ‐0.0057 ‐0.0920 ‐0.0015
783 SB 41835 0.40 24 0.1406 0.4056 2.7640 0.0298 30 0.1192 0.3745 2.565 0.025 0.0336 0.0391 0.4050 0.0076
786 NB 17037 0.10 6 0.4308 0.7915 5.1393 0.0788 22 0.1508 0.4201 2.9525 0.0317 0.0841 0.1141 0.9259 0.0156
786 SB 14202 0.10 44 0.0870 0.3436 2.1003 0.0172 44 0.0870 0.3436 2.1003 0.0172 ‐0.0008 ‐0.0003 ‐0.0111 ‐0.0002
832 NB 16451 0.90 40 0.0934 0.3459 2.1817 0.0186 48 0.0819 0.3435 2.0612 0.0159 0.0153 0.0007 0.1262 0.0037
832 SB 15451 0.10 17 0.1827 0.4647 3.3487 0.0374 22 0.1508 0.4201 2.9525 0.0317 0.0215 0.0302 0.3253 0.0043
922 NB 44086 0.30 31 0.1162 0.3699 2.5223 0.0242 31 0.1162 0.3699 2.5223 0.0242 0.0053 0.0013 0.0685 0.0013
922 SB 42484 0.10 30 0.1192 0.3745 2.565 0.025 32 0.1132 0.3653 2.4797 0.0234 0.0000 0.0017 ‐0.0031 0.0001
923 NB 44086 0.10 34 0.1073 0.3560 2.3944 0.0218 34 0.1073 0.3560 2.3944 0.0218 0.0004 0.0001 0.0049 0.0001
923 SB 42484 0.40 30 0.1192 0.3745 2.565 0.025 33 0.1103 0.3606 2.4370 0.0226 0.0100 0.0157 0.1588 0.0027
977 NB 48127 0.10 4 0.6836 1.1642 6.9812 0.1217 5 0.4723 0.8474 5.4356 0.0857 0.1560 0.2192 1.2668 0.0264
977 SB 46715 0.20 32 0.1132 0.3653 2.4797 0.0234 22 0.1508 0.4201 2.9525 0.0317 ‐0.0384 ‐0.0560 ‐0.5161 ‐0.0086
978 NB 2156 0.20 5 0.4723 0.8474 5.4356 0.0857 7 0.3894 0.7356 4.8430 0.0718 0.0151 0.0206 0.1282 0.0026
978 SB 46715 0.01 14 0.2108 0.5014 3.5805 0.0421 14 0.2108 0.5014 3.5805 0.0421 0.0005 0.0008 0.0096 0.0001
2091 NB 18401 0.01 23 0.1457 0.4128 2.8582 0.0308 18 0.1755 0.4547 3.2794 0.0361 ‐0.0018 ‐0.0025 ‐0.0326 ‐0.0003
2091 SB 14202 0.10 14 0.2108 0.5014 3.5805 0.0421 11 0.2516 0.5511 3.8606 0.0488 ‐0.0578 ‐0.0748 ‐0.4704 ‐0.0096
2092 NB 18401 0.10 18 0.1755 0.4547 3.2794 0.0361 10 0.2651 0.5677 3.954 0.0511 ‐0.0733 ‐0.0951 ‐0.6868 ‐0.0124
2092 SB 14202 0.01 22 0.1508 0.4201 2.9525 0.0317 20 0.161 0.4346 3.1409 0.0336 ‐0.0030 ‐0.0041 ‐0.0342 ‐0.0005
Source:
1. Average Daily Traffic ‐‐ Kimley‐Horn of Michigan, Inc. 2015 Traffic Data Collection by Intersection.
2. Average Vehicle Speed, Segment Length ‐‐ Synchro & Simtraffic simulation models for 2015 Traffic Data
3. Emission Equivalency Factors ‐ Michigan Department of Transportation (MDOT). CMAQ Emissions Factors Table (Statewide). Accessed February 2017. http://www.michigan.gov/documents/mdot/MDOT_CMAQ_EmissionFactorsTables_437123_7.pdf
4. Emission Estimations ‐ Michigan Department of Transportation (MDOT) & South Eastern Michigan Council of Govenrments (SEMCOG). Emissions from Freeway and Arterial Travel. http://www.michigan.gov/mdot/0,4616,7‐151‐9621_11041_60661‐‐‐,00.htm
Note:
1. Average vehicle speeds for each time period of the day (i.e. AM, PM, Off peak) are calculated using Synchro and Sim Traffic for Existing conditions and Proposed conditions in the subject corridor
2. Based on 2015 Traffic Data by Kimley‐Horn of Michigan, Inc., Peak volume (i.e. 7AM‐9AM & 3PM‐6PM) applys to 35% of the Average Daily Traffic; 15% for AM peak and 20% for PM peak
3. All values presented in the above table are based on and represent 2015 data. A 1.5% annual growth rate will be applied for future years. The 1.5% annual growth corresponds to a projected growth in traffic volumes for the subject coridor
4. Positive (+) values represent reduction in emissions; Negative (‐) values represent increases in emissions
5. A linear interpolation is applied to calculate intermediate speeds (i.e. between 2.5 mph to 5 mph) as indidcated in the MDOT emmission equivalency factor guidelines (See Source 2)
6. Equivalency factors represent are based for All Vehicles and assuming a 20 year project life
7. Carbon Monoxide (CO) has been included in the emission calculations as this is common reported pollutant in Michigan transportation projects similar to VOCs, NOx, PM, SO2 , and CO 2 as indicate in Source 2 and 3 above
8. 1 metric ton = 1.1015 short ton
9. Emissions estimations are based on MDOTs and SEMCOG Arterial Travel Emission estimation formula (pg 14 of Appendix D of the following report):
http://www.michigan.gov/documents/deq/deq‐aqd‐air‐aqe‐sip‐pm25‐appendixD_223436_7.pdf
Where, Emission for segment i
2015 Average Annual Daily Traffic of segment i
Miles of arterial roadway affected for segment i
Proportion of travel of segment I in peak period n (off peak is 1‐sum of P)
Emission Factor after implemention for segment i
Emission Factor before implemention for segment i
Synchro
IDAproach
Average Daily
Traffic
Segment
Legth (mi)Avg. Speed per Veh
(mph)
PM Peak ‐ Existing
Equivalency Factors (g/mi)CO Savings (metric
ton/yr)
PM Savings (short
ton/yr)
PM Peak ‐ Proposed
Equivalency Factors (g/mi)Avg. Speed per Veh
(mph)
VOC Savings
(short ton/yr)
NOx Savings
(short ton/yr)
∗ ∗ ∗
Tab 11. Emissions - Calc (Non-CO2) (2)
50 | Mound Road Benefit-Cost Analysis

Avg. Speed per Veh
(mph)
CO2 Emmission
(g/mi)
Avg. Speed per Veh
(mph)
CO2 Emmission
(g/mi)
Avg. Speed per Veh
(mph)
CO2 Emmission
(g/mi)
Avg. Speed per Veh
(mph)
CO2 Emmission
(g/mi)
Avg. Speed per Veh
(mph)
CO2 Emmission
(g/mi)
Avg. Speed per Veh
(mph)
CO2 Emmission
(g/mi)
9 NB 48682 0.10 49 325 36 335 49 325 42 329 31 347 32 344 ‐5.52506
9 SB 1534 0.50 47 325 43 327 48 325 45 325 48 325 44 326 ‐0.15885
10 NB 49976 0.10 24 385 27 365 7 958 7 958 7 958 6 1035 ‐20.70045
10 SB 50059 0.10 11 686 16 510 23 395 24 385 13 609 15 531 80.34748
13 NB 48682 0.10 34 339 28 360 8 880 11 686 7 958 9 803 248.08346
13 SB 1534 0.10 37 334 8 880 43 327 24 385 38 333 7 958 ‐12.40736
14 NB 48682 0.40 50 325 39 332 10 725 11 686 5 1113 5 1113 155.50838
14 SB 1534 0.10 42 329 9 803 44 326 27 365 43 327 11 686 ‐8.53971
22 NB 48682 0.01 37 334 37 334 44 326 44 326 34 339 20 425 ‐2.77463
22 SB 1534 0.10 38 333 39 332 42 329 41 330 39 332 40 331 ‐0.02351
23 NB 44274 0.10 32 344 29 355 30 350 31 347 26 370 22 405 ‐9.95788
23 SB 43958 0.10 30 350 26 370 33 342 32 344 24 385 20 425 ‐18.62653
28 NB 41699 0.40 35 336 40 331 39 332 43 327 35 336 34 339 18.17020
28 SB 43395 0.20 30 350 34 339 35 336 36 335 30 350 32 344 9.77816
31 NB 41767 0.20 31 347 37 334 33 342 34 339 33 342 34 339 11.86795
31 SB 44703 0.20 32 344 37 334 37 334 39 332 26 370 32 344 23.51575
34 NB 40658 0.20 19 446 31 347 27 365 37 334 22 405 23 395 99.26006
34 SB 46834 0.10 31 347 33 342 40 331 39 332 38 333 36 335 ‐0.34918
35 NB 43413 0.10 23 395 17 489 27 365 26 370 18 468 17 489 ‐31.01896
35 SB 46834 0.10 17 489 20 425 28 360 27 365 25 375 24 385 6.69266
36 NB 43413 0.10 40 331 34 339 41 330 39 332 34 339 33 342 ‐4.56743
36 SB 42974 0.30 22 405 28 360 34 339 37 334 29 355 31 347 48.64787
41 NB 39444 0.10 27 365 34 339 11 686 18 468 9 803 14 570 251.71982
41 SB 43926 0.20 38 333 39 332 42 329 42 329 43 327 43 327 0.43667
42 NB 43926 0.20 32 344 31 347 9 803 11 686 9 803 11 686 286.45415
42 SB 47125 0.10 25 375 27 365 27 365 28 360 28 360 28 360 7.41743
116 NB 48682 0.50 48 325 45 325 49 325 46 325 12 648 12 648 0.00000
116 SB 1534 0.40 50 325 42 329 50 325 45 325 50 325 41 330 ‐0.31770
275 NB 36956 0.20 28 360 30 350 28 360 35 336 11 686 29 355 203.74239
275 SB 39336 0.10 25 375 28 360 30 350 33 342 26 370 28 360 12.52953
277 NB 42416 0.10 23 395 18 468 24 385 22 405 14 570 16 510 ‐16.69059
277 SB 43514 0.20 7 803 17 489 26 370 26 370 24 385 24 385 135.71953
377 NB 37776 0.20 25 375 32 344 29 355 30 350 7 958 8 880 58.39504
377 SB 38158 0.20 29 355 34 339 36 335 38 333 3 1246 4 1179 43.07483
457 NB 46261 0.01 9 803 12 648 4 1179 5 958 4 1179 5 1113 27.69500
457 SB 5002 0.10 21 415 24 385 33 342 33 342 23 395 24 385 1.07737
458 NB 7889 0.10 37 334 39 332 29 355 28 360 26 370 25 375 ‐1.03259
458 SB 43978 0.30 17 489 28 360 28 360 29 355 11 686 13 609 166.40348
530 NB 32896 0.20 23 395 40 331 29 355 38 333 24 385 27 365 60.38947
530 SB 18872 0.60 38 333 47 325 43 327 46 325 2 1313 4 1179 110.79719
564 NB 2046 0.10 37 334 37 334 46 325 46 325 31 347 21 415 ‐0.91866
564 SB 26591 0.01 10 725 28 360 14 570 32 344 10 725 23 395 23.55497
572 NB 48682 0.10 13 609 16 510 5 1113 9 803 6 1035 8 880 398.95402
572 SB 1534 0.20 33 342 10 725 42 329 38 333 36 335 8 880 ‐17.21793
573 NB 2056 0.20 30 350 34 339 8 880 12 648 5 1113 9 803 29.26478
573 SB 46996 0.10 23 395 13 609 36 335 36 335 27 365 10 725 ‐162.05540
574 NB 43926 0.10 43 327 42 329 38 333 36 335 32 344 32 344 ‐2.16515
574 SB 41082 0.70 36 335 39 332 37 334 40 331 38 333 37 334 20.96431
590 NB 39661 0.30 44 326 46 325 44 326 46 325 44 326 44 326 3.94270
590 SB 41136 0.30 44 326 45 325 45 325 45 325 46 325 46 325 0.76675
591 NB 39661 0.30 44 326 45 325 42 329 44 326 30 350 38 333 20.35417
591 SB 41136 0.10 41 330 43 327 41 330 44 326 43 327 45 325 4.51530
594 NB 16451 0.60 43 327 45 325 49 325 51 325 44 326 48 325 2.04424
594 SB 20089 0.90 44 326 47 325 46 325 48 325 11 686 45 325 433.98293
722 NB 39059 0.70 38 333 47 325 34 339 40 331 33 342 41 330 78.14238
722 SB 43514 0.10 25 375 30 350 37 334 37 334 37 334 37 334 5.40715
723 NB 42416 0.20 39 332 35 336 40 331 37 334 25 375 29 355 4.07602
723 SB 38607 0.70 15 531 38 333 38 333 43 327 39 332 37 334 295.85549
724 NB 35067 0.70 48 325 51 325 41 330 46 325 21 415 43 327 168.78083
724 SB 39336 0.20 39 332 37 334 45 325 43 327 42 329 42 329 ‐5.01833
725 NB 36956 0.10 39 331 42 329 38 333 42 329 16 510 38 333 47.33069
725 SB 36706 0.70 36 335 43 327 40 331 46 325 39 332 41 330 48.31804
726 NB 33868 0.70 47 325 48 325 42 329 43 327 8 880 10 725 249.91582
726 SB 38158 0.20 36 335 43 327 42 329 44 326 29 355 38 333 18.04970
741 NB 37776 0.20 37 334 41 330 42 329 43 327 17 489 14 570 ‐37.05237
741 SB 35033 0.20 29 355 36 335 31 347 37 334 2 1313 2 1313 26.49699
782 NB 42273 0.40 37 334 42 329 35 336 40 331 31 347 39 332 39.64221
782 SB 43958 0.10 35 336 30 350 38 333 37 334 37 334 29 355 ‐9.99606
783 NB 48682 0.10 42 329 40 331 43 327 42 329 36 335 32 344 ‐4.89997
783 SB 41835 0.40 36 335 42 329 42 329 42 329 24 385 30 350 44.22204
786 NB 17037 0.10 16 510 37 334 13 609 36 335 6 1035 22 405 186.37873
786 SB 14202 0.10 41 330 39 332 45 325 44 326 44 326 44 326 ‐0.54120
832 NB 16451 0.90 49 325 51 325 50 325 51 325 40 331 48 325 6.13272
832 SB 15451 0.10 22 405 38 333 19 446 28 360 17 489 22 405 42.78991
922 NB 44086 0.30 46 325 47 325 42 329 43 327 31 347 31 347 3.56085
922 SB 42484 0.10 42 329 43 327 38 333 37 334 30 350 32 344 0.89746
923 NB 44086 0.10 43 327 44 326 42 329 42 329 34 339 34 339 0.27391
923 SB 42484 0.40 43 327 43 327 44 326 44 326 30 350 33 342 9.29133
977 NB 48127 0.10 34 339 39 332 7 958 9 803 4 1179 5 1113 183.55100
977 SB 46715 0.20 32 344 23 395 42 329 42 329 32 344 22 405 ‐60.91292
978 NB 2156 0.20 20 425 35 336 6 1035 9 803 5 1113 7 958 27.92512
978 SB 46715 0.01 22 405 24 385 30 350 31 347 14 570 14 570 0.74109
2091 NB 18401 0.01 26 370 18 468 25 375 20 425 23 395 18 468 ‐3.75757
2091 SB 14202 0.10 13 609 7 803 19 446 9 803 14 570 11 686 ‐133.59340
2092 NB 18401 0.10 13 609 7 803 23 395 10 725 18 468 10 725 ‐179.91352
2092 SB 14202 0.01 21 415 10 725 24 385 14 570 22 405 20 425 ‐8.03561
Source:
1. Average Daily Traffic ‐‐ Kimley‐Horn of Michigan, Inc. 2015 Traffic Data Collection by Intersection.
2. Average Vehicle Traveled Distance ‐‐ Synchro & Simtraffic simulation models for 2015 Traffic Data
3. CO 2 Emissions ‐ M. Barth and K. Borioboonsomsin. Traffic Congestion and Greenhouse Gases. Access 35, 2009.
http://uctc.berkeley.edu/access/35/access35.pdf
Note:
2. Based on 2015 Traffic Data by Kimley‐Horn of Michigan, Inc., Peak volume (i.e. AM, PM) applys to 35% of the Average Daily Traffic; 15% for AM peak and 20% for PM peak
3. All values presented in the above table are based on and represent 2015 data. A 1.5% annual growth rate will be applied for future years. The 1.5% annual growth corresponds to a projected growth in traffic volumes for the subject corido
4. Positive (+) values represent reductions in CO2; Negative (‐) values represent increases in CO2
5. 1 metric ton = 1.1015 short ton
Synchro
IDAproach
Average
Daily
Traffic
AM Peak ‐ Existing AM Peak ‐ Proposed OFF Peak ‐ Existing OFF Peak ‐ Proposed PM Peak ‐ Existing PM Peak ‐ ProposedSegment
Legth (mi)
CO2 Savings (short
ton/yr)
1. CO 2 Emissions are based on the CO2 Emmission ‐ Speed Curve as presented on Page 5 of the following journal: M. Barth and K. Boriboonsomsin. Traffic Congestion and Greenhouse Gases. Access 35, 2009.
Tab 12. Emissions - Calc (CO2)
51 | Mound Road Benefit-Cost Analysis

Emission type$/short ton
($2016)
VOCs 1,872$
NOx 7,377$
PM 337,459$
SOx 43,600$
Source:
http://www.nhtsa.gov/staticfiles/rulemaking/pdf/cafe/FRIA_2017‐2025.pdf
Emission type$/metric ton
($1989)*
$/metric ton
($2016)
CO 2,714$ 4,697.12$
*Average cost of 18 regions in the US for 1989
Source:
https://www.osti.gov/scitech/servlets/purl/10114725
Year$/short ton
($2015)*
$/short ton
($2016)
2017 ‐$ ‐$
2018 ‐$ ‐$
2019 ‐$ ‐$
2020 ‐$ ‐$
2021 ‐$ ‐$
2022 20.00$ 20.26$
2023 20.75$ 21.02$
2024 21.50$ 21.78$
2025 22.25$ 22.54$
2026 23.00$ 23.30$
2027 23.75$ 24.06$
2028 24.50$ 24.82$
2029 25.25$ 25.58$
2030 26.00$ 26.34$
2031 29.00$ 29.38$
2032 32.00$ 32.42$
2033 35.00$ 35.46$
2034 38.00$ 38.50$
2035 41.00$ 41.54$
2036 44.00$ 44.58$
2037 47.00$ 47.62$
2038 50.00$ 50.66$
2039 53.00$ 53.70$
2040 56.00$ 56.74$
2041 58.50$ 59.27$
2042 61.00$ 61.81$
*Value based on Mid Case
Source:
http://www.synapse‐energy.com/sites/default/files/2016‐Synapse‐CO2‐Price‐Forecast‐66‐008.pdf
P. Luckow, E. Stanton, S. Fields, W. Ong, B. Biewald, S. Jackson, J. Fisher. (2016) Spring 2016 National
Carbon Dioxide Price Forecast. Synapse Energy Economics, Inc.
Corporate Average Fuel Economy For MY2017‐2025 Passenger Cars and Light Trucks (August 2012),
page 992, Table VIII‐16, "Economic Values Used for Benefits Computations (2010 dollars)
M.Q. Wang, D. J. Santini, and S.A. Warinner (1994), Methods of Valuing Air Poluution and Estimated
Monetary Values of Air Pollutant in Various U.S. Regions, Argonne National Lab.
Tab 13. Emissions - Values
52 | Mound Road Benefit-Cost Analysis

Year Project Year
TOTAL Fuel
Savings
(gallons/yr)
TOTAL Fuel
Savings
($2016)
2016 na 911,293 ‐$
2017 na 924,963 ‐$
2018 na 938,837 ‐$
2019 na 952,920 ‐$
eg Construction) 2020 Construction 967,213 ‐$
2021 Construction 981,722 ‐$
nd Construction) 2022 Construction 996,447 ‐$
2023 1 1,011,394 2,275,637$
2024 2 1,026,565 2,309,771$
2025 3 1,041,963 2,344,418$
2026 4 1,057,593 2,379,584$
2027 5 1,073,457 2,415,278$
2028 6 1,089,559 2,451,507$
2029 7 1,105,902 2,488,280$
2030 8 1,122,491 2,525,604$
2031 9 1,139,328 2,563,488$
2032 10 1,156,418 2,601,940$
2033 11 1,173,764 2,640,969$
2034 12 1,191,371 2,680,584$
2035 13 1,209,241 2,720,793$
2036 14 1,227,380 2,761,605$
2037 15 1,245,790 2,803,029$
2038 16 1,264,477 2,845,074$
2039 17 1,283,445 2,887,750$
2040 18 1,302,696 2,931,066$
2041 19 1,322,237 2,975,032$
2042 20 1,342,070 3,019,658$
Average 2,631,053$
Total 52,621,067$
Note:
2. Savings are based on 2016$
3. Assumes construction begins in 2020 and ends in 2022. Fuel consumption savings are first realized in 2023.
4. Assumes no new additional users. All users are existing regardless of whether the proposal is built or not.
1. Assumes a 1.5% annual growth corresponding to projected traffic volume growth for subject corridor. 1.5% Growth is
applied to year 2016 (base year) as well since fuel consumption data calculations are based on 2015 data. There are no
concerns with regards to capacity constraints for this growth rate.
Tab 14. TOTAL Fuel Savings
53 | Mound Road Benefit-Cost Analysis

9 NB 48682 0.10 49 120 36 132 49 120 42 125 31 140 32 138 ‐3980
9 SB 1534 0.50 47 121 43 124 48 120 45 123 48 120 44 124 ‐318
10 NB 49976 0.10 24 156 27 148 7 327 7 327 7 327 6 367 ‐5335
10 SB 50059 0.10 11 239 16 191 23 159 24 156 13 215 15 198 9841
13 NB 48682 0.10 34 135 28 146 8 297 11 239 7 327 9 273 35218
13 SB 1534 0.10 37 131 8 297 43 124 24 156 38 130 7 327 ‐2012
14 NB 48682 0.40 50 119 39 128 10 254 11 239 5 423 5 423 25876
14 SB 1534 0.10 42 125 9 273 44 124 27 148 43 124 11 239 ‐1446
22 NB 48682 0.01 37 131 37 131 44 124 44 124 34 135 20 170 ‐526
22 SB 1534 0.10 38 130 39 128 42 125 41 126 39 128 40 127 ‐6
23 NB 44274 0.10 32 138 29 143 30 141 31 140 26 150 22 162 ‐1377
23 SB 43958 0.10 30 141 26 150 33 136 32 138 24 156 20 170 ‐3521
28 NB 41699 0.40 35 133 40 127 39 128 43 124 35 133 34 135 8397
28 SB 43395 0.20 30 141 34 135 35 133 36 132 30 141 32 138 3464
31 NB 41767 0.20 31 140 37 131 33 136 34 135 33 136 34 135 3381
31 SB 44703 0.20 32 138 37 131 37 131 39 128 26 150 32 138 6985
34 NB 40658 0.20 19 174 31 140 27 148 37 131 22 162 23 159 21252
34 SB 46834 0.10 31 140 33 136 40 127 39 128 38 130 36 132 ‐511
35 NB 43413 0.10 23 159 17 185 27 148 26 150 18 179 17 185 ‐4422
35 SB 46834 0.10 17 185 20 170 28 146 27 148 25 153 24 156 160
36 NB 43413 0.10 40 127 34 135 41 126 39 128 34 135 33 136 ‐1884
36 SB 42974 0.30 22 162 28 146 34 135 37 131 29 143 31 140 11694
41 NB 39444 0.10 27 148 34 135 11 239 18 179 9 273 14 206 33190
41 SB 43926 0.20 38 130 39 128 42 125 42 125 43 124 43 124 233
42 NB 43926 0.20 32 138 31 140 9 273 11 239 9 273 11 239 39246
42 SB 47125 0.10 25 153 27 148 27 148 28 146 28 146 28 146 1613
116 NB 48682 0.50 48 120 45 123 49 120 46 122 12 226 12 226 ‐6858
116 SB 1534 0.40 50 119 42 125 50 119 45 123 50 119 41 126 ‐466
275 NB 36956 0.20 28 146 30 141 28 146 35 133 11 239 29 143 31592
275 SB 39336 0.10 25 153 28 146 30 141 33 136 26 150 28 146 3265
277 NB 42416 0.10 23 159 18 179 24 156 22 162 14 206 16 191 ‐2770
277 SB 43514 0.20 7 327 17 185 26 150 26 150 24 156 24 156 28792
377 NB 37776 0.20 25 153 32 138 29 143 30 141 7 327 8 297 11166
377 SB 38158 0.20 29 143 34 135 36 132 38 130 3 649 4 508 36810
457 NB 46261 0.01 9 273 12 226 4 508 5 423 4 508 5 423 5666
457 SB 5002 0.10 21 166 24 156 33 136 33 136 23 159 24 156 165
458 NB 7889 0.10 37 131 39 128 29 143 28 146 26 150 25 153 ‐186
458 SB 43978 0.30 17 185 28 146 28 146 29 143 11 239 13 215 24461
530 NB 32896 0.20 23 159 40 127 29 143 38 130 24 156 27 148 15552
530 SB 18872 0.60 38 130 47 121 43 124 46 122 2 931 4 508 153772
564 NB 2046 0.10 37 131 37 131 46 122 46 122 31 140 21 166 ‐165
564 SB 26591 0.01 10 254 28 146 14 206 32 138 10 254 23 159 3285
572 NB 48682 0.10 13 215 16 191 5 423 9 273 6 367 8 297 87236
572 SB 1534 0.20 33 136 10 254 42 125 38 130 36 132 8 297 ‐2539
573 NB 2056 0.20 30 141 34 135 8 297 12 226 5 423 9 273 4905
573 SB 46996 0.10 23 159 13 215 36 132 36 132 27 148 10 254 ‐21721
574 NB 43926 0.10 43 124 42 125 38 130 36 132 32 138 32 138 ‐1191
574 SB 41082 0.70 36 132 39 128 37 131 40 127 38 130 37 131 11290
590 NB 39661 0.30 44 124 46 122 44 124 46 122 44 124 44 124 2469
590 SB 41136 0.30 44 124 45 123 45 123 45 123 46 122 46 122 245
591 NB 39661 0.30 44 124 45 123 42 125 44 124 30 141 38 130 6816
591 SB 41136 0.10 41 126 43 124 41 126 44 124 43 124 45 123 1574
594 NB 16451 0.60 43 124 45 123 49 120 51 118 44 124 48 120 2731
594 SB 20089 0.90 44 124 47 121 46 122 48 120 11 239 45 123 69015
722 NB 39059 0.70 38 130 47 121 34 135 40 127 33 136 41 126 34489
722 SB 43514 0.10 25 153 30 141 37 131 37 131 37 131 37 131 1142
723 NB 42416 0.20 39 128 35 133 40 127 37 131 25 153 29 143 ‐1455
723 SB 38607 0.70 15 198 38 130 38 130 43 124 39 128 37 131 55073
724 NB 35067 0.70 48 120 51 118 41 126 46 122 21 166 43 124 43679
724 SB 39336 0.20 39 128 37 131 45 123 43 124 42 125 42 125 ‐1817
725 NB 36956 0.10 39 128 42 125 38 130 42 125 16 191 38 130 8866
725 SB 36706 0.70 36 132 43 124 40 127 46 122 39 128 41 126 20555
726 NB 33868 0.70 47 121 48 120 42 125 43 124 8 297 10 254 33765
726 SB 38158 0.20 36 132 43 124 42 125 44 124 29 143 38 130 6039
741 NB 37776 0.20 37 131 41 126 42 125 43 124 17 185 14 206 ‐3501
741 SB 35033 0.20 29 143 36 132 31 140 37 131 2 931 2 931 8102
782 NB 42273 0.40 37 131 42 125 35 133 40 127 31 140 39 128 18318
782 SB 43958 0.10 35 133 30 141 38 130 37 131 37 131 29 143 ‐3078
783 NB 48682 0.10 42 125 40 127 43 124 42 125 36 132 32 138 ‐1575
783 SB 41835 0.40 36 132 42 125 42 125 42 125 24 156 30 141 9934
786 NB 17037 0.10 16 191 37 131 13 215 36 132 6 367 22 162 27504
786 SB 14202 0.10 41 126 39 128 45 123 44 124 44 124 44 124 ‐192
832 NB 16451 0.90 49 120 51 118 50 119 51 118 40 127 48 120 4695
832 SB 15451 0.10 22 162 38 130 19 174 28 146 17 185 22 162 6708
922 NB 44086 0.30 46 122 47 121 42 125 43 124 31 140 31 140 1490
922 SB 42484 0.10 42 125 43 124 38 130 37 131 30 141 32 138 42
923 NB 44086 0.10 43 124 44 124 42 125 42 125 34 135 34 135 92
923 SB 42484 0.40 43 124 43 124 44 124 44 124 30 141 33 136 2703
977 NB 48127 0.10 34 135 39 128 7 327 9 273 4 508 5 423 39411
977 SB 46715 0.20 32 138 23 159 42 125 42 125 32 138 22 162 ‐11464
978 NB 2156 0.20 20 170 35 133 6 367 9 273 5 423 7 327 5744
978 SB 46715 0.01 22 162 24 156 30 141 31 140 14 206 14 206 155
2091 NB 18401 0.01 26 150 18 179 25 153 20 170 23 159 18 179 ‐554
2091 SB 14202 0.10 13 215 7 327 19 174 9 273 14 206 11 239 ‐19308
2092 NB 18401 0.10 13 215 7 327 23 159 10 254 18 179 10 254 ‐26813
2092 SB 14202 0.01 21 166 10 254 24 156 14 206 22 162 20 170 ‐1048
Source:
1. Average Daily Traffic ‐‐ Kimley‐Horn of Michigan, Inc. 2015 Traffic Data Collection by Intersection.
2. Average Vehicle Traveled Distance ‐‐ Synchro & Simtraffic simulation models for 2015 Traffic Data
3. Fuel Consumption ‐‐ L. Evans and R. Herman. Urban Fuel Economy ‐ Computer Simulation Calculations Interpreted in Terms of Simple Mode. Transportation Research, 1978 (b).
‐‐ L. Evans and R. Herman. A simplified approach to calculations of fuel consumptions in urban traffic systems. Traffic Eng. Control 17, 18(9), pp. 352‐54 1976.
Note:
1 . Based on 2015 Traffic Data by Kimley‐Horn of Michigan, Inc., Peak volume (i.e. 7AM‐9AM & 3PM‐6PM) applys to 35% of the Average Daily Traffic; 15% for AM peak and 20% for PM peak
3. Positive (+) values represent reductions in fuel consumption; Negative (‐) values represent increases in fuel consumption
4. Fuel Consumption is based on the Fuel Consumption formula established Evans and Herman (1976, 1978) in the metropolitan Detroit area and which is applicable for low and mid‐range speeds, where:
Where, Fuel consumption for segment i per unit distance (mL/km)
Average travel speed for segment I in km/h
Cosntant where k1 = 2722 for medium cars (mL/h)
Constant where k2 = 85.1 for medium cars (mL/km)
Note: 1 mph = 1.609344 kmh
1 mile = 1.60934 km
1 mL = 0.000264172
2. All values presented in the above table are based on and represent 2015 data. A 1.5% annual growth rate will be applied for future years. The 1.5% annual growth corresponds to a projected growth in traffic volumes for the subject
coridor.
Fuel
Consumption
(mL/km)
OFF Peak ‐ Existing
Fuel
Consumption
(mL/km)
Avg. Speed
per Veh (mph)
Avg. Speed
per Veh (mph)
Avg. Speed
per Veh (mph)
Avg. Speed
per Veh (mph)
Avg. Speed
per Veh (mph)
Segment
Legth (mi)
Synchro
IDAproach
Average
Daily
Traffic
AM Peak ‐ Proposed
Fuel
Consumption
(mL/km)
Avg. Speed
per Veh (mph)
Fuel
Consumption
(mL/km)
AM Peak ‐ Existing
Fuel Savings
(gallons/yr)
OFF Peak ‐ Proposed PM Peak ‐ Existing PM Peak ‐ Proposed
Fuel
Consumption
(mL/km)
Fuel
Consumption
(mL/km)
Tab 15. Fuel Savings - Calc
54 | Mound Road Benefit-Cost Analysis

Retail Gasoline Price Year $/gallon
2016 2.25$
Source:
https://www.eia.gov/dnav/pet/pet_pri_gnd_dcus_nus_a.htm
US. Energy Information Administration (EIA), U.S. Annual Retail Gasoline and Diesel Price, 2016 Gasoline ‐
All Grades, Release Date 8/14/2017, Accessed August, 2017
Tab 16. Fuel Savings - Values
55 | Mound Road Benefit-Cost Analysis

Connected
Vehicle
MOBILITY
Benefit2
TOTAL Travel
Time Savings for
All Purpose
(hr/year)
TOTAL Travel
Time Savings for
Buses (hr/year)
TOTAL Travel
Time Savings for
Trucks (hr/year)
TOTAL Travel Time
Savings From
Connected Vehicles
($2016)
Connected
Vehicle SAFETY
Benefit3
TOTAL Crash
Reduction
O
(No Injury)
TOTAL Crash
Reduction
C (Possible
Injury)
TOTAL Crash
Reduction
B
(Non‐Incapacitating)
TOTAL Crash
Reduction
A
(Incapacitating)
TOTAL Crash
Reduction
K
(Killed)
TOTAL Safety
Benefits From
Connected Vehicles
($2016)
2016 na 0% 0% ‐ ‐ ‐ ‐$ 0% 0.0 0.0 0.0 0.0 0.0 ‐$
2017 na 0% 0% ‐ ‐ ‐ ‐$ 0% 0.0 0.0 0.0 0.0 0.0 ‐$
2018 na 0% 0% ‐ ‐ ‐ ‐$ 0% 0.0 0.0 0.0 0.0 0.0 ‐$
2019 na 0% 0% ‐ ‐ ‐ ‐$ 0% 0.0 0.0 0.0 0.0 0.0 ‐$
(Beg Construction) 2020 Construction 0% 0% ‐ ‐ ‐ ‐$ 0% 0.0 0.0 0.0 0.0 0.0 ‐$
2021 Construction 8% 2% 26,760 64 972 ‐$ 6% 5.2 0.4 0.1 0.0 0.0 ‐$
(End Construction) 2022 Construction 15% 4% 95,491 230 3,469 ‐$ 12% 18.5 1.5 0.2 0.0 0.0 ‐$
2023 1 22% 6% 208,492 501 7,574 3,159,927$ 18% 40.5 3.2 0.5 0.1 0.0 711,268$
2024 2 29% 7% 367,710 884 13,358 5,573,059$ 23% 71.4 5.7 0.9 0.2 0.0 1,254,441$
2025 3 35% 9% 543,641 1,307 19,749 8,239,480$ 28% 105.6 8.4 1.3 0.2 0.1 1,854,626$
2026 4 41% 10% 757,199 1,820 27,507 11,476,183$ 33% 147.1 11.8 1.8 0.3 0.1 2,583,176$
2027 5 47% 12% 1,009,959 2,427 36,689 15,307,051$ 38% 196.2 15.7 2.4 0.4 0.1 3,445,467$
2028 6 52% 13% 1,254,818 3,016 45,583 19,018,162$ 42% 243.7 19.5 3.0 0.5 0.2 4,280,801$
2029 7 57% 14% 1,530,347 3,678 55,593 23,194,104$ 46% 297.2 23.7 3.7 0.7 0.2 5,220,765$
2030 8 62% 16% 1,837,764 4,417 66,760 27,853,342$ 50% 356.9 28.5 4.4 0.8 0.2 6,269,514$
2031 9 67% 17% 2,178,321 5,236 79,131 33,014,869$ 54% 423.1 33.8 5.3 0.9 0.3 7,431,323$
2032 10 71% 18% 2,482,876 5,968 90,195 37,630,736$ 57% 482.2 38.5 6.0 1.1 0.3 8,470,309$
2033 11 75% 19% 2,812,075 6,759 102,153 42,620,112$ 60% 546.2 43.6 6.8 1.2 0.4 9,593,369$
2034 12 79% 20% 3,166,829 7,612 115,041 47,996,800$ 63% 615.1 49.1 7.6 1.4 0.4 10,803,609$
2035 13 82% 21% 3,463,093 8,324 125,803 52,487,012$ 66% 672.6 53.7 8.3 1.5 0.5 11,814,311$
2036 14 85% 21% 3,776,942 9,078 137,204 57,243,745$ 68% 733.6 58.6 9.1 1.6 0.5 12,885,005$
2037 15 87% 22% 4,016,123 9,653 145,893 60,868,799$ 70% 780.0 62.3 9.7 1.7 0.5 13,700,969$
2038 16 89% 22% 4,265,939 10,253 154,968 64,655,025$ 71% 828.5 66.2 10.3 1.9 0.6 14,553,211$
2039 17 91% 23% 4,526,718 10,880 164,441 68,607,422$ 73% 879.2 70.3 10.9 2.0 0.6 15,442,857$
2040 18 93% 23% 4,798,799 11,534 174,325 72,731,117$ 74% 932.0 74.5 11.6 2.1 0.6 16,371,060$
2041 19 94% 24% 4,976,092 11,960 180,765 75,418,190$ 75% 966.5 77.2 12.0 2.2 0.7 16,975,894$
2042 20 95% 24% 5,158,768 12,399 187,401 78,186,838$ 76% 1001.9 80.1 12.4 2.2 0.7 17,599,090$
40,264,099$ 9,063,053$
805,281,976$ 181,261,066$
Connected
Vehicle VOC
EMISSION
Benefit4
Connected
Vehicle NOx
EMISSION
Benefit4
Connected
Vehicle PM
EMISSION
Benefit4
Connected
Vehicle CO
EMISSION
Benefit4
Connected Vehicle
CO2 EMISSION
Benefit4
TOTAL VOC
Savings
(short
ton/year)
TOTAL NOx
Savings
(short ton/year)
TOTAL PM
Savings
(short ton/year)
TOTAL CO Savings
(metric ton/year)
TOTAL CO2
Savings
(short ton/year)
TOTAL Emission
Savings From
Connected
Vehicles
2016 na 0% 0% 0% 0% 0% 0% ‐ ‐ ‐ ‐ ‐ ‐$
2017 na 0% 0% 0% 0% 0% 0% ‐ ‐ ‐ ‐ ‐ ‐$
2018 na 0% 0% 0% 0% 0% 0% ‐ ‐ ‐ ‐ ‐ ‐$
2019 na 0% 0% 0% 0% 0% 0% ‐ ‐ ‐ ‐ ‐ ‐$
(Beg Construction) 2020 Construction 0% 0% 0% 0% 0% 0% ‐ ‐ ‐ ‐ ‐ ‐$
2021 Construction 8% 1% 1% 2% 1% 1% 0.0 0.1 0.0 0.6 37.8 ‐$
(End Construction) 2022 Construction 15% 2% 2% 3% 2% 1% 0.1 0.3 0.0 2.1 134.8 ‐$
2023 1 22% 2% 3% 4% 3% 1% 0.2 0.8 0.1 4.6 294.4 55,148$
2024 2 29% 3% 4% 6% 4% 2% 0.3 1.3 0.1 8.2 519.2 97,658$
2025 3 35% 4% 5% 7% 5% 2% 0.5 2.0 0.2 12.1 767.6 144,965$
2026 4 41% 4% 6% 8% 5% 3% 0.7 2.8 0.2 16.8 1,069.1 202,724$
2027 5 47% 5% 7% 9% 6% 3% 0.9 3.7 0.3 22.4 1,426.0 271,479$
2028 6 52% 6% 8% 10% 7% 3% 1.1 4.6 0.4 27.9 1,771.8 338,644$
2029 7 57% 6% 9% 11% 8% 4% 1.3 5.6 0.5 34.0 2,160.8 414,645$
2030 8 62% 7% 10% 12% 8% 4% 1.6 6.7 0.6 40.8 2,594.9 499,910$
2031 9 67% 7% 10% 13% 9% 4% 1.9 8.0 0.7 48.4 3,075.7 601,898$
2032 10 71% 8% 11% 14% 9% 5% 2.2 9.1 0.7 55.1 3,505.8 696,707$
2033 11 75% 8% 12% 14% 10% 5% 2.5 10.3 0.8 62.4 3,970.6 801,151$
2034 12 79% 9% 12% 15% 10% 5% 2.8 11.6 1.0 70.3 4,471.5 915,810$
2035 13 82% 9% 13% 16% 11% 5% 3.0 12.7 1.0 76.9 4,889.8 1,016,349$
2036 14 85% 9% 13% 16% 11% 6% 3.3 13.8 1.1 83.9 5,332.9 1,124,668$
2037 15 87% 9% 13% 17% 12% 6% 3.5 14.7 1.2 89.2 5,670.7 1,213,126$
2038 16 89% 10% 14% 17% 12% 6% 3.7 15.6 1.3 94.7 6,023.4 1,306,895$
2039 17 91% 10% 14% 17% 12% 6% 4.0 16.5 1.4 100.5 6,391.6 1,406,214$
2040 18 93% 10% 14% 18% 12% 6% 4.2 17.5 1.4 106.6 6,775.8 1,511,331$
2041 19 94% 10% 15% 18% 12% 6% 4.4 18.2 1.5 110.5 7,026.1 1,584,965$
2042 20 95% 10% 15% 18% 13% 6% 4.5 18.9 1.6 114.6 7,284.0 1,661,600$
793,294$
15,865,889$
EMISSIONS
Year Project Year
Connected
Vehicle Market
Penetration
Rate1
Average
Total
Average
Total
Year Project Year
Connected
Vehicle Market
Penetration
Rate1
TRAVEL TIME SAFETY
Tab 17. ITS & Connected Veh Savings (1)
56 | Mound Road Benefit-Cost Analysis

Connected
Vehicle FUEL
CONSUMPTION
Benefit5
TOTAL Fuel
Reduction
(gallons/yr)
TOTAL Fuel
Consumption Savings
From Connected
Vehicles ($2016)
2016 na 0% 0% ‐ ‐$ ‐$
2017 na 0% 0% ‐ ‐$ ‐$
2018 na 0% 0% ‐ ‐$ ‐$
2019 na 0% 0% ‐ ‐$ ‐$
(Beg Construction) 2020 Construction 0% 0% ‐ ‐$ ‐$
2021 Construction 8% 1% 14,532 ‐$ ‐$
(End Construction) 2022 Construction 15% 2% 51,855 ‐$ ‐$
2023 1 22% 3% 113,220 254,744$ 4,181,088$
2024 2 29% 4% 199,682 449,284$ 7,374,443$
2025 3 35% 5% 295,219 664,244$ 10,903,315$
2026 4 41% 5% 411,190 925,178$ 15,187,261$
2027 5 47% 6% 548,449 1,234,011$ 20,258,008$
2028 6 52% 7% 681,418 1,533,191$ 25,170,798$
2029 7 57% 7% 831,042 1,869,843$ 30,699,357$
2030 8 62% 8% 997,981 2,245,458$ 36,868,224$
2031 9 67% 9% 1,182,918 2,661,566$ 43,709,656$
2032 10 71% 9% 1,348,304 3,033,684$ 49,831,437$
2033 11 75% 10% 1,527,073 3,435,913$ 56,450,545$
2034 12 79% 10% 1,719,719 3,869,367$ 63,585,586$
2035 13 82% 11% 1,880,602 4,231,355$ 69,549,028$
2036 14 85% 11% 2,051,035 4,614,830$ 75,868,248$
2037 15 87% 11% 2,180,921 4,907,071$ 80,689,966$
2038 16 89% 12% 2,316,581 5,212,306$ 85,727,438$
2039 17 91% 12% 2,458,194 5,530,937$ 90,987,430$
2040 18 93% 12% 2,605,946 5,863,378$ 96,476,886$
2041 19 94% 12% 2,702,223 6,080,002$ 100,059,052$
2042 20 95% 12% 2,801,423 6,303,203$ 103,750,731$
3,245,978$ 53,366,425$
64,919,566$ 1,067,328,498$
https://ntl.bts.gov/lib/52000/52600/52602/FHWA‐JPO‐14‐125_v2.pdf
2. Connected Vehicle MOBILITY Benefit ‐‐ S. Guler, M. Menendez, and L. Meier. Using Connected Vehicle Technology to Improve the Efficiency of Intersections. Transportation Research Part C, Vol 46, pp. 121‐131, 2014
https://trid.trb.org/view.aspx?id=1325264
3. Connected Vehicle SAFETY Benefit ‐‐ National Highway Traffic Safety Administration (NHTSA). U.S. DOT advances deployment of Connected Vehicle Technology to prevent hundreds of thousands of crashes, 2016.
https://www.nhtsa.gov/press‐releases/us‐dot‐advances‐deployment‐connected‐vehicle‐technology‐prevent‐hundreds‐thousands
http://www.caee.utexas.edu/prof/kockelman/public_html/TRB17CAVEmissions.pdf
https://ntl.bts.gov/lib/56000/56200/56238/FHWA‐JPO‐16‐255.pdf
Note:
2.Connected Vehicle MOBILITY Benefit is based on Guler et.al. (2014) which estimates a mobility benefit up to 25% at 100% market penetration rate.
Given the findings, the travel time benefit reaches a maximum of 25% at 100% market penetration rate. A linear relationship is utilzied to extrapolate the expected mobility benefit stemming from connected vehicle
technology and ITS between at unknown market penetration rates. Mobility benefit at a particular market penetration rate can be expressed as
Where, Mobility benefit at market penetration rate of year i (%)
Market penetration rate of year i (%)
Maximum mobility benefit, equals 25%
Market penetration rate in which the maximum mobility benefit is reached, equals 100%
3. Connected Vehicle SAFETY Benefit is based on NHTSA prediction which states that safety applications as a result of such technology can eliminate or mitigate up to 80% of non‐impared crashes.
It is assumed that the 80% crash reduction is fully achieved until 100% connected vehicle market penetration rate is achieved.
A linear relationship is utilized to extrapolate the expected crash reduction at unkown marke penetration rates.
Where, Safety benefit at market penetration rate of year i (%)
Market penetration rate of year I (%)
Maximum safety benefit, equals 80%
Market penetration rate in which the maximum mobility benefit is reached, equals 100%
4. Connected Vehicle EMISSION Benefit is based on Liu et. al. (2017), which provides average emission reductions of 10.89% for VOC, 15.51% for NOx, 19.09% for PM, 13.23% for CO, and 6.55% for CO 2 at a 100% market
penetration rate. Given the findings, the particular emmission benefit reaches its maximum reduction at 100% market penetration rate. A linear relationship is utilzied to extrapolate the expected mobility benefit
stemming from connected vehicle technology and ITS between at unknown market penetration rates
Where, Emission benefit at market penetration rate of year i (%)
Market penetration rate of year i (%)
Maximum emission benefit, equals 10.89% for VOC, 15.51% for NOx, 19.09% for PM, 13.23% for CO, and 6.55% for CO2
Market penetration rate in which the maximum mobility benefit is reached, equals 100%
5. Connected Vehicle FUEL CONSUMPTION Benefit is based on FHWA's Report (FHWA‐JPO‐15‐255), which notes a 13% fuel reduction benefit along a coordinated cooridor.
Given the findings, the maximum fuel reduction benefit of 13% is reached at 100% market penetration rate.
A linear relationship is utilzied to extrapolate the expected mobility benefit stemming from connected vehicle technology and ITS between at unknown market penetration rates
Where, Fuel reduction benefit at market penetration rate of year i (%)
Market penetration rate of year i (%)
Maximum fuel reduction benefit, equals 13%
Market penetration rate in which the maximum mobility benefit is reached, equals 100%
7. Savings are based on 2016$
8. Assumes construction begins in 2020 and ends in 2022. Connected vehicle benefits are first realized in 2023.
9. Assumes no new additional users. All users are existing regardless of whether the proposal is built or not.
5. Connected Vehicle FUEL CONSUMPTION Benefit ‐‐ J. Chang, G. Hatcher, D. Hicks, J. Schneeberger, B. Staples, S. Sundarajn, M. Vasudevan, P. Wang, K. Wunderlich. Estimated Benefits of Connected Vehicle Applicaions: Dynamic
Mobility Applications, AERIS, V2I Safety, and Road Weather Management. U.S. Department of Transportation, FHWA‐JPO‐15‐255, 2015.
1. Connected Vehicle Market Penetration Rate is based on FHWA's Report (Page 93 of FHWA‐JPO‐14‐125) "Connected Vehicle Equipped Population Over Time" Curve with a 1‐Year Mandate assumption, and which assumes an initial
deployment start date of 2020.
6. Assumes a 1.5% annual growth corresponding to projected traffic volume growth for subject corridor. 1.5% Growth is applied to year 2016 (base year) as well since connected vehicle data calculations are based on 2015 data. There
are no concerns with regards to capacity constraints for this growth rate
Total
FUEL CONSUMPTION
TOTAL Connected Vehicles
Benefit ($2016)
1. Connected Vehicle Market Penetration Rate ‐‐ J. Wright, J. K. Garret, C. J. Hill, G. D. Krueger, J. H. Evans, S. Andrews, C. K. Wilson, R. Rajbhandari, B. Burkhard. National Connected Vehicle Field Infrastructure Footprint Analysis: Final
Report. U.S. Department of Transportation, FHWA‐JPO‐14‐125, 2014.
4. Connected Vehicle EMISSION Benefit ‐‐ J. Liu., K. M. Kockelman, A. Nichols. Anticipating the Emissions Impacts of Smoother Driving by Connected and Autonomous Vehicles, Using the MOVES Model. 96th Annual Meeting of the
Transportation Research Board, 2017
Year Project Year
Connected
Vehicle Market
Penetration
Rate1
Average
∗
∗
∗
∗
Tab 17. ITS & Connected Veh Savings (2)
57 | Mound Road Benefit-Cost Analysis

FUEL CONSUMPTION3
TOTAL EXISTING
Travel Time for
All Purpose
(hr/year)
TOTAL EXISTING
Travel Time for
Buses (hr/year)
TOTAL EXISTING
Travel Time for
Trucks (hr/year)
TOTAL EXISTING
VOC (short ton/yr)
TOTAL EXISTING
NOx (short ton/yr)
TOTAL EXISTING CO
(metric ton/yr)
TOTAL EXISTING
PM (short ton/yr)
TOTAL EXISTING CO2
(short ton/yr)
TOTAL EXISTING Fuel
Consumption
(gallons/yr)
9 NB 48682 0.2% 4.2% 0.10 78313 118 2475 0.1 0.6 3.8 0.0 503 93391
9 SB 1534 0.2% 4.2% 0.50 8093 12 256 0.0 0.1 0.6 0.0 78 14336
10 NB 49976 0.3% 4.8% 0.10 812968 1849 29582 0.6 1.1 8.3 0.1 1364 233470
10 SB 50059 0.2% 4.2% 0.10 178323 268 5636 0.3 0.8 5.8 0.1 748 141366
13 NB 48682 0.2% 4.2% 0.10 368873 555 11659 0.5 1.0 7.6 0.1 1236 210245
13 SB 1534 0.2% 4.2% 0.10 997 2 32 0.0 0.0 0.1 0.0 16 3009
14 NB 48682 0.2% 4.2% 0.40 1025092 1543 32400 1.8 3.8 26.8 0.3 4432 809124
14 SB 1534 0.2% 4.2% 0.10 2325 3 73 0.0 0.0 0.1 0.0 16 2952
22 NB 48682 0.2% 4.2% 0.01 24301 37 768 0.0 0.1 0.4 0.0 50 9586
22 SB 1534 0.2% 4.2% 0.10 2655 4 84 0.0 0.0 0.1 0.0 16 3014
23 NB 44274 0.4% 5.7% 0.10 86595 265 3782 0.2 0.6 4.2 0.0 491 98029
23 SB 43958 0.2% 4.8% 0.10 103022 156 3745 0.2 0.5 4.0 0.0 484 96157
28 NB 41699 0.5% 6.0% 0.40 186956 719 8631 0.5 1.9 13.8 0.1 1751 337004
28 SB 43395 0.3% 5.0% 0.20 150001 342 5698 0.3 1.0 7.7 0.1 931 183491
31 NB 41767 0.3% 6.2% 0.20 144718 334 6904 0.3 1.0 7.5 0.1 901 177392
31 SB 44703 0.4% 4.9% 0.20 133164 405 4957 0.3 1.1 7.8 0.1 961 188339
34 NB 40658 0.3% 6.2% 0.20 162627 375 7758 0.4 1.1 8.3 0.1 983 195014
34 SB 46834 0.4% 5.1% 0.10 78809 240 3060 0.2 0.5 3.8 0.0 493 94239
35 NB 43413 0.8% 6.0% 0.10 115441 713 5347 0.2 0.6 4.4 0.0 527 104851
35 SB 46834 0.4% 5.1% 0.10 131888 402 5121 0.2 0.6 4.7 0.0 564 111062
36 NB 43413 0.8% 6.0% 0.10 76751 474 3555 0.1 0.5 3.5 0.0 453 86369
36 SB 42974 0.3% 5.1% 0.30 200297 457 7769 0.5 1.6 11.8 0.1 1428 281344
41 NB 39444 0.8% 6.0% 0.10 162239 1002 7514 0.3 0.7 5.4 0.1 812 142019
41 SB 43926 0.3% 5.1% 0.20 82983 189 3218 0.3 1.0 6.9 0.1 911 171525
42 NB 43926 0.2% 6.3% 0.20 518067 797 25113 0.8 1.7 12.8 0.2 2019 344590
42 SB 47125 0.3% 5.1% 0.10 115099 263 4464 0.2 0.6 4.5 0.0 543 108263
116 NB 48682 0.2% 4.2% 0.50 406128 611 12836 0.9 3.1 21.3 0.2 2880 532624
116 SB 1534 0.2% 4.2% 0.40 5852 9 185 0.0 0.1 0.5 0.0 63 11324
275 NB 36956 0.1% 6.2% 0.20 130372 100 6206 0.4 1.0 7.7 0.1 957 188302
275 SB 39336 0.2% 4.9% 0.10 98511 149 3659 0.2 0.5 3.7 0.0 442 88451
277 NB 42416 0.1% 5.8% 0.10 139219 106 6173 0.2 0.6 4.6 0.0 555 109328
277 SB 43514 0.1% 5.0% 0.20 181612 138 6811 0.5 1.3 9.5 0.1 1207 240010
377 NB 37776 0.6% 4.4% 0.20 153928 699 5129 0.4 1.1 8.4 0.1 1078 212770
377 SB 38158 0.5% 4.6% 0.20 369841 1402 12897 0.6 1.4 9.7 0.1 1158 280839
457 NB 46261 0.2% 4.2% 0.01 234008 352 7396 0.1 0.2 1.1 0.0 163 33934
457 SB 5002 0.2% 4.2% 0.10 9061 14 286 0.0 0.1 0.5 0.0 57 11271
458 NB 7889 0.3% 4.8% 0.10 19926 45 725 0.0 0.1 0.7 0.0 88 17491
458 SB 43978 0.2% 4.8% 0.30 275968 418 10031 0.7 1.9 14.3 0.1 1794 348125
530 NB 32896 0.5% 5.0% 0.20 136689 520 5203 0.3 0.8 6.4 0.1 758 151238
530 SB 18872 0.6% 3.2% 0.60 564063 2531 13499 2.0 3.8 24.7 0.3 1725 503376
564 NB 2046 0.2% 4.2% 0.10 2116 3 67 0.0 0.0 0.2 0.0 21 4025
564 SB 26591 0.2% 4.2% 0.01 44567 67 1409 0.0 0.0 0.4 0.0 52 9194
572 NB 48682 0.2% 4.2% 0.10 267702 403 8461 0.7 1.3 9.1 0.1 1564 287724
572 SB 1534 0.2% 4.2% 0.20 3530 5 112 0.0 0.0 0.2 0.0 32 6111
573 NB 2056 0.2% 4.2% 0.20 22716 34 718 0.0 0.1 0.7 0.0 108 19056
573 SB 46996 0.2% 4.2% 0.10 64141 97 2027 0.2 0.6 4.2 0.0 517 101513
574 NB 43926 0.2% 6.3% 0.10 493062 759 23901 0.1 0.5 3.6 0.0 462 88955
574 SB 41082 0.1% 5.0% 0.70 389623 295 14613 1.0 3.3 24.0 0.2 3026 583527
590 NB 39661 0.8% 6.0% 0.30 127004 784 5882 0.3 1.4 9.1 0.1 1222 228098
590 SB 41136 0.3% 5.1% 0.30 130608 298 5066 0.3 1.4 9.4 0.1 1263 234877
591 NB 39661 0.8% 6.0% 0.30 142841 882 6616 0.4 1.4 9.6 0.1 1242 236919
591 SB 41136 0.3% 5.1% 0.10 47823 109 1855 0.1 0.5 3.2 0.0 427 80411
594 NB 16451 0.5% 3.6% 0.60 104033 390 2810 0.3 1.1 7.5 0.1 1012 185526
594 SB 20089 0.7% 3.0% 0.90 314627 1645 7051 0.7 2.3 16.1 0.1 2176 408268
722 NB 39059 0.2% 6.3% 0.70 391672 603 18986 1.0 3.2 23.8 0.2 2914 570064
722 SB 43514 0.1% 5.0% 0.10 86031 65 3227 0.2 0.5 3.7 0.0 467 90552
723 NB 42416 0.1% 5.8% 0.20 90000 69 3991 0.3 1.0 7.1 0.1 903 174582
723 SB 38607 0.2% 4.9% 0.70 433133 657 16089 1.0 3.3 24.0 0.2 3100 585512
724 NB 35067 0.1% 5.8% 0.70 340505 260 15099 0.8 2.9 20.8 0.2 2648 507787
724 SB 39336 0.2% 4.9% 0.20 67524 102 2508 0.2 0.9 6.1 0.0 809 151491
725 NB 36956 0.1% 6.2% 0.10 91722 70 4366 0.1 0.5 3.3 0.0 420 81249
725 SB 36706 0.5% 4.6% 0.70 319219 1210 11132 0.8 3.0 20.7 0.2 2686 511575
726 NB 33868 0.1% 6.2% 0.70 526304 404 25054 1.1 3.2 22.6 0.2 3099 584788
726 SB 38158 0.5% 4.6% 0.20 73973 280 2580 0.2 0.9 6.3 0.1 802 153938
741 NB 37776 0.6% 4.4% 0.20 347710 1580 11586 0.3 0.9 6.6 0.1 844 161827
741 SB 35033 0.6% 3.2% 0.20 717095 3218 17161 1.3 2.4 16.1 0.2 1105 324494
782 NB 42273 0.3% 4.8% 0.40 237739 541 8651 0.6 2.0 14.7 0.1 1797 352340
782 SB 43958 0.2% 4.8% 0.10 68063 103 2474 0.1 0.5 3.6 0.0 462 88965
783 NB 48682 0.4% 5.7% 0.10 83653 256 3653 0.1 0.6 3.8 0.0 504 95263
783 SB 41835 0.3% 5.0% 0.40 198600 453 7544 0.6 2.0 14.0 0.1 1784 343855
786 NB 17037 0.2% 1.7% 0.10 51218 75 639 0.1 0.3 2.4 0.0 354 63953
786 SB 14202 0.2% 2.3% 0.10 17875 26 303 0.0 0.2 1.1 0.0 146 27197
832 NB 16451 0.2% 1.7% 0.90 155876 229 1943 0.4 1.7 11.2 0.1 1519 277364
832 SB 15451 0.5% 3.3% 0.10 25640 96 633 0.1 0.2 1.8 0.0 217 41813
922 NB 44086 0.3% 4.8% 0.30 140064 319 5097 0.4 1.5 10.7 0.1 1378 262091
922 SB 42484 0.2% 4.8% 0.10 56111 85 2040 0.1 0.5 3.6 0.0 448 86592
923 NB 44086 0.3% 4.8% 0.10 55866 127 2033 0.1 0.5 3.5 0.0 458 86968
923 SB 42484 0.2% 4.8% 0.40 203941 309 7413 0.5 2.0 13.6 0.1 1766 335592
977 NB 48127 0.2% 4.2% 0.10 349981 527 11062 0.6 1.2 8.6 0.1 1356 249577
977 SB 46715 0.2% 4.2% 0.20 117129 176 3702 0.3 1.1 7.7 0.1 982 188151
978 NB 2156 0.2% 4.2% 0.20 36198 54 1144 0.1 0.1 0.8 0.0 129 23330
978 SB 46715 0.2% 4.2% 0.01 42641 64 1348 0.0 0.1 0.5 0.0 58 11413
2091 NB 18401 0.5% 3.1% 0.01 16687 62 386 0.0 0.0 0.2 0.0 22 4384
2091 SB 14202 0.5% 2.6% 0.10 58746 218 1134 0.1 0.2 1.7 0.0 220 41132
2092 NB 18401 0.3% 3.2% 0.10 50813 114 1212 0.1 0.3 2.1 0.0 255 48887
2092 SB 14202 0.2% 2.3% 0.01 14021 21 238 0.0 0.0 0.1 0.0 18 3490
15295920 36765 555651 30.8 90.1 641.8 6.0 82433 15973683TOTAL
Segment
Length
(mi)
TRAVEL TIME1 EMISSIONS2
Synchro
IDAproach
Average
Daily
Traffic
Percent
Bus
Percent
Truck
Tab 18. ITS & Connected Veh - Back Calc (1)
58 | Mound Road Benefit-Cost Analysis

O
(No Injury)
C
(Possible Injury)
B (Non‐
Incapacitating)
A
(Incapacitating)
K
(Killed)
2011‐2015 Non‐Impaired Crashes6
9704 936.0 153.0 34.0 9.0
Annualized Non‐Impaired Crashes6
1941 187 31 7 2
Annual Crash Reduction from traditional safety treatments6, 7
1012 113 19 5 1
Connected Vehicle Applicable Non‐Impared Crashes6, 7
928 74 12 2 1
Note:
1. Refer to TRAVEL TIME tabs for travel time calculations, sources and notes
2. Refer to EMISSION tabs for emmission calculations, sources and notes
3. Refer to FUEL tabs for emmission calculations, sources and notes
4. Refer to SAFETY tabs for safety calculations, sources and notes
6. Crashes reported represent all of the number of injuries, fatalities, or no injuries involved in the accident on a per individual basis
SAFETY4
5. TRAVEL TIME, EMMISSION, FUEL CONSUMPTION, and SAFETY values represent 2015 data. A 1.5% annual growth rate will be applied for future years. The
1.5% annual growth corresponds to a projected growth in traffic volumes for the subject corridor
7. To avoid double counting of crash benefits only those crashes not affected by traditional safety treatments as listed under the SAFETY tabs are considered
under the connected vehicle safety benefits
Tab 18. ITS & Connected Veh - Back Calc (2)
59 | Mound Road Benefit-Cost Analysis

Infrastructure Condition Maintenance Cost ($2016)3 Infrastructure Condition Cost per Lane Mile ($2016)4 Maintenance Cost ($2016)5, 6
2016 na Poor ‐ Fair 4,930,000$ na ‐$ ‐$ ‐$
2017 na Poor ‐ Fair 5,053,250$ na ‐$ ‐$ ‐$
2018 na Poor ‐ Fair 5,179,581$ na ‐$ ‐$ ‐$
2019 na Poor ‐ Fair 5,309,071$ na ‐$ ‐$ ‐$
(Beg Construction)2020 Construction Poor ‐ Fair 5,441,798$ na ‐$ ‐$ ‐$
2021 Construction Poor ‐ Fair 5,577,842$ na ‐$ ‐$ ‐$
(End Construction) 2022 Construction Poor ‐ Fair 5,717,289$ na ‐$ ‐$ ‐$
2023 1 Poor ‐ Fair 5,860,221$ Excellent ‐$ ‐$ 5,860,221$
2024 2 Poor ‐ Fair 6,006,726$ Excellent ‐$ ‐$ 6,006,726$
2025 3 Poor ‐ Fair 6,156,894$ Excellent ‐$ ‐$ 6,156,894$
2026 4 Poor ‐ Fair 6,310,817$ Excellent ‐$ ‐$ 6,310,817$
2027 5 Poor ‐ Fair 6,468,587$ Excellent ‐$ ‐$ 6,468,587$
2028 6 Poor ‐ Fair 6,630,302$ Excellent ‐$ ‐$ 6,630,302$
2029 7 Poor ‐ Fair 6,796,059$ Excellent ‐$ ‐$ 6,796,059$
2030 8 Poor ‐ Fair 6,965,961$ Excellent ‐$ ‐$ 6,965,961$
2031 9 Poor ‐ Fair 7,140,110$ Very Good 2,000$ 134,000$ 7,006,110$
2032 10 Poor ‐ Fair 7,318,613$ Very Good 2,000$ 134,000$ 7,184,613$
2033 11 Poor ‐ Fair 7,501,578$ Very Good 2,000$ 134,000$ 7,367,578$
2034 12 Poor ‐ Fair 7,689,117$ Very Good 2,000$ 134,000$ 7,555,117$
2035 13 Poor ‐ Fair 7,881,345$ Very Good 2,000$ 134,000$ 7,747,345$
2036 14 Poor ‐ Fair 8,078,379$ Very Good 2,000$ 134,000$ 7,944,379$
2037 15 Poor ‐ Fair 8,280,339$ Very Good 2,000$ 134,000$ 8,146,339$
2038 16 Poor ‐ Fair 8,487,347$ Very Good 2,000$ 134,000$ 8,353,347$
2039 17 Poor ‐ Fair 8,699,531$ Very Good 2,000$ 134,000$ 8,565,531$
2040 18 Poor ‐ Fair 8,917,019$ Very Good 2,000$ 134,000$ 8,783,019$
2041 19 Poor ‐ Fair 9,139,944$ Fair ‐ Good 250,000$ 16,750,000$ (7,610,056)$
2042 20 Poor ‐ Fair 9,368,443$ Very Good 2,000$ 134,000$ 9,234,443$
7,484,867$ 911,200$ 6,573,667$
149,697,333$ 18,224,000$ 131,473,333$
Note:
1. Savings are based on 2016$
2. Assumes construction begins in 2020 and ends in 2022. New infrastructure enters in operations in 2023
3. According to Macomb County Department of Roads, the County spends the following on annual maintenance on Mound Road:
Maintenance Type Annual Cost
Concrete Replacement 4,600,000$
Patrol Patching 330,000$
Total 4,930,000$
4. Recommended Concrete Treatments and Associated Costs:
PASER Rating Condition Cost per Lane Mile No. of Years
9 & 10 Excellent ‐$ 1 ‐ 8
7 & 8 Very Good 2,000$ 9 ‐ 18
5 & 6 Fair ‐ Good 250,000$ 19 ‐ 24
3 & 4 Poor ‐ Fair 600,000$ 25 ‐ 29
1 & 2 Failed 1,900,000$ 30
5. Pavement quality for new pavement (Build) drops approximately 40% over 75% from its initial life (i.e. 22.5 years)
Southeast Michigan Council of Governments (SEMCOG). Status of Pavement Management Systems (PMS) in Southeast Michigan. May 2003.
6. Total Mound Road Lane Miles = 67
No maintenance required
Routine maintenance
Surface repairs, sealing, partial depth patching
Extensive slab or joint rehabilitation
Reconstruction
Operations &
Maintenance Savings
Average
Total
Treatment
Year Project YearNo Build Scenario Build Scenario
A 2.5% increase in maintenance costs is applied to each subsequent year following 2016 to account for the increasing maintenance needs due to continous pavement deterioration and omission of any significant reconstruction
activities from the corridor.
Tab 19. Operations & Maintenance Costs
60 | Mound Road Benefit-Cost Analysis

Base Year of
Nominal Dollar
Multiplier to Adjust to
Real $2016
1989 1.7307
2001 1.3306
2002 1.3105
2003 1.2849
2004 1.2505
2005 1.2115
2006 1.1754
2007 1.1449
2008 1.1229
2009 1.1145
2010 1.1010
2011 1.0787
2012 1.0592
2013 1.0424
2014 1.0240
2015 1.0132
2016 1.0000
Source:
http://www.bea.gov/iTable/iTable.cfm?ReqID=9&step=1
Bureau of Economic Analysis, National Income and Product Accounts, Table 1.1.9, "Implicit
Price Deflators for Gross Domestic Product" (March 2016)
Tab 20. Inflation Adjustment - Values
61 | Mound Road Benefit-Cost Analysis

62 | Mound Road Benefit-Cost Analysis
Appendix B – Synchro/SimTraffic Mound Road Arterial Report

Arterial Level of ServiceAM Existing Conditions 02/06/2017
Mound Signal Timing Optimization SimTraffic ReportHRC GH Page 27
Arterial Level of Service: NB Mound Road
Delay Travel Dist ArterialCross Street Node (s/veh) time (s) (mi) SpeedXON of 10 Mile 564 1.6 5.7 0.1 3711 Mile Road Ramps 22 1.0 4.1 0.0 37I-696 Ramps 9 0.3 10.7 0.1 4911 Mile Road Ramps 116 1.7 38.8 0.5 48I-696 Ramps 14 1.5 28.3 0.4 5011 Mile Road Ramps 13 4.1 14.2 0.1 34XOS of Martin Rd 572 10.4 15.2 0.1 13XON of Martin Rd 573 7.8 22.0 0.2 30TACOM Main Gate 977 2.9 9.2 0.1 34XON TACOM 978 20.6 34.8 0.2 20XOS 12 Mile Road 457 15.1 18.2 0.0 912 Mile Road 10 8.1 16.1 0.1 24XON of 12 Mile 458 2.8 12.8 0.1 37GM Technical Center 922 2.3 20.6 0.3 46XON of GM Tech Cente 923 0.8 8.3 0.1 43XOS of 13 Mile 782 10.5 39.0 0.4 3713 Mile Road 23 4.8 13.7 0.1 32XON of 13 Mile 783 1.9 12.8 0.1 42Chicago Road 28 12.3 35.9 0.4 35Arden Avenue 31 9.9 27.7 0.2 31XOS of 14 Mile 34 25.4 39.8 0.2 1914 Mile Road 35 10.9 21.0 0.1 23XON of 14 Mile 36 2.8 13.3 0.1 40XOS of Sterling Dr 590 3.3 24.4 0.3 44XON of Sterling Dr 591 2.3 24.3 0.3 44XOS of 15 Mile 41 6.2 13.4 0.1 2715 Mile Road 42 6.0 18.5 0.2 32XON of 15 Mile 574 1.7 11.4 0.1 43XOS of Metro Pkwy 722 21.4 69.1 0.7 38Metro Parkway 277 11.4 21.9 0.1 23XON of Metro Pkwy 723 2.5 14.6 0.2 39XOS of 17 Mile 724 8.7 54.1 0.7 4817 Mile Road 275 7.4 19.9 0.2 28XON of 17 Mile 725 3.0 13.6 0.1 39XOS of 18 Mile 726 8.4 54.8 0.7 4718 Mile Road 377 10.2 21.9 0.2 25XON of 18 Mile 741 4.5 17.9 0.2 3718 1/2 Mile Road 530 19.7 35.5 0.2 2319 Mile Road 594 10.9 51.6 0.6 43Forum at Gateways Sh 832 6.5 67.3 0.9 49XOS of Hall Road 786 9.4 14.2 0.1 16Hall Road South (Dob 2092 22.4 30.5 0.1 13Hall Road North 2091 2.4 6.3 0.0 26Total 327.6 1047.4 10.3 35
63 | Mound Road Benefit-Cost Analysis

Arterial Level of ServiceAM Existing Conditions 02/06/2017
Mound Signal Timing Optimization SimTraffic ReportHRC GH Page 28
Arterial Level of Service: SB Mound Road
Delay Travel Dist ArterialCross Street Node (s/veh) time (s) (mi) SpeedHall Road North 2091 28.5 37.7 0.1 13Hall Road South (Dob 2092 4.1 8.0 0.0 21XOS of Hall Road 786 1.9 9.8 0.1 41Forum at Gateways Sh 832 6.1 10.3 0.1 2219 Mile Road 594 13.0 74.5 0.9 4418 1/2 Mile Road 530 15.6 57.9 0.6 38XON of 18 Mile 741 11.6 28.4 0.2 2918 Mile Road 377 8.6 22.3 0.2 29XOS of 18 Mile 726 4.4 15.4 0.2 36XON of 17 Mile 725 21.5 71.7 0.7 3617 Mile Road 275 10.0 21.1 0.1 25XOS of 17 Mile 724 2.7 14.1 0.2 39XON of Metro Pkwy 723 125.0 174.5 0.7 15Metro Parkway 277 68.9 80.6 0.2 7XOS of Metro Pkwy 722 9.1 20.3 0.1 25XON of 15 Mile 574 22.8 73.5 0.7 3615 Mile Road 42 9.2 19.8 0.1 25XOS of 15 Mile 41 3.4 15.4 0.2 38XON of Sterling Dr 591 1.6 8.8 0.1 41XOS of Sterling Dr 590 3.0 24.6 0.3 44XON of 14 Mile 36 27.9 49.0 0.3 2214 Mile Road 35 20.6 31.8 0.1 17XOS of 14 Mile 34 5.9 15.6 0.1 31
31 8.9 23.3 0.2 32Chicago Road 28 11.1 28.1 0.2 30XON of 13 Mile 783 11.8 35.4 0.4 3613 Mile Road 23 7.2 17.9 0.1 30XOS of 13 Mile 782 3.2 12.4 0.1 35XON of GM Tech Cente 923 4.9 33.6 0.4 43GM Technical Center 922 1.5 8.6 0.1 42XON of 12 Mile 458 35.2 54.3 0.3 1712 Mile Road 10 32.3 42.2 0.1 11XOS 12 Mile Road 457 9.7 17.8 0.1 21XON TACOM 978 3.8 7.0 0.0 22TACOM Main Gate 977 7.8 22.1 0.2 32XON of Martin Rd 573 7.2 13.8 0.1 23XOS of Martin Rd 572 6.7 20.3 0.2 3311 Mile Road Ramps 13 1.3 5.3 0.1 37I-696 Ramps 14 2.1 11.7 0.1 4211 Mile Road Ramps 116 1.3 28.4 0.4 50I-696 Ramps 9 2.0 39.5 0.5 4711 Mile Road Ramps 22 2.5 13.6 0.1 38XON of 10 Mile 564 11.2 14.7 0.0 10Total 597.1 1335.3 10.3 28
64 | Mound Road Benefit-Cost Analysis

Arterial Level of ServiceMD Existing Conditions 02/06/2017
Mound Signal Timing Optimization SimTraffic ReportHRC GH Page 27
Arterial Level of Service: NB Mound Road
Delay Travel Dist ArterialCross Street Node (s/veh) time (s) (mi) SpeedXON of 10 Mile 564 0.7 8.4 0.1 4611 Mile Road Ramps 22 0.5 3.4 0.0 44I-696 Ramps 9 0.3 10.7 0.1 4911 Mile Road Ramps 116 1.5 38.4 0.5 49I-696 Ramps 14 123.0 148.1 0.4 1011 Mile Road Ramps 13 53.1 62.6 0.1 8XOS of Martin Rd 572 33.2 49.1 0.1 5XON of Martin Rd 573 68.1 82.5 0.2 8TACOM Main Gate 977 40.0 57.1 0.1 7XON TACOM 978 98.5 140.7 0.2 6XOS 12 Mile Road 457 39.2 42.3 0.0 412 Mile Road 10 48.9 157.9 0.1 7XON of 12 Mile 458 6.5 20.5 0.1 29GM Technical Center 922 3.9 22.5 0.3 42XON of GM Tech Cente 923 1.1 8.6 0.1 42XOS of 13 Mile 782 12.0 41.2 0.4 3513 Mile Road 23 5.9 14.5 0.1 30XON of 13 Mile 783 2.1 12.5 0.1 43Chicago Road 28 9.6 32.8 0.4 39Arden Avenue 31 8.2 26.0 0.2 33XOS of 14 Mile 34 12.9 27.3 0.2 2714 Mile Road 35 7.9 17.9 0.1 27XON of 14 Mile 36 2.6 12.9 0.1 41XOS of Sterling Dr 590 2.9 24.4 0.3 44XON of Sterling Dr 591 3.1 25.5 0.3 42XOS of 15 Mile 41 25.4 32.5 0.1 1115 Mile Road 42 51.6 100.2 0.2 9XON of 15 Mile 574 2.8 103.5 0.1 38XOS of Metro Pkwy 722 24.9 76.3 0.7 34Metro Parkway 277 10.4 21.3 0.1 24XON of Metro Pkwy 723 2.4 14.2 0.2 40XOS of 17 Mile 724 12.8 62.5 0.7 4117 Mile Road 275 8.1 19.8 0.2 28XON of 17 Mile 725 3.0 13.9 0.1 38XOS of 18 Mile 726 12.7 61.2 0.7 4218 Mile Road 377 6.8 18.6 0.2 29XON of 18 Mile 741 3.1 15.7 0.2 4218 1/2 Mile Road 530 12.8 28.3 0.2 2919 Mile Road 594 5.1 44.6 0.6 49Forum at Gateways Sh 832 5.0 64.8 0.9 50XOS of Hall Road 786 12.9 17.9 0.1 13Hall Road South (Dob 2092 8.9 17.4 0.1 23Hall Road North 2091 2.6 6.6 0.0 25Total 797.0 1807.2 10.3 24
65 | Mound Road Benefit-Cost Analysis
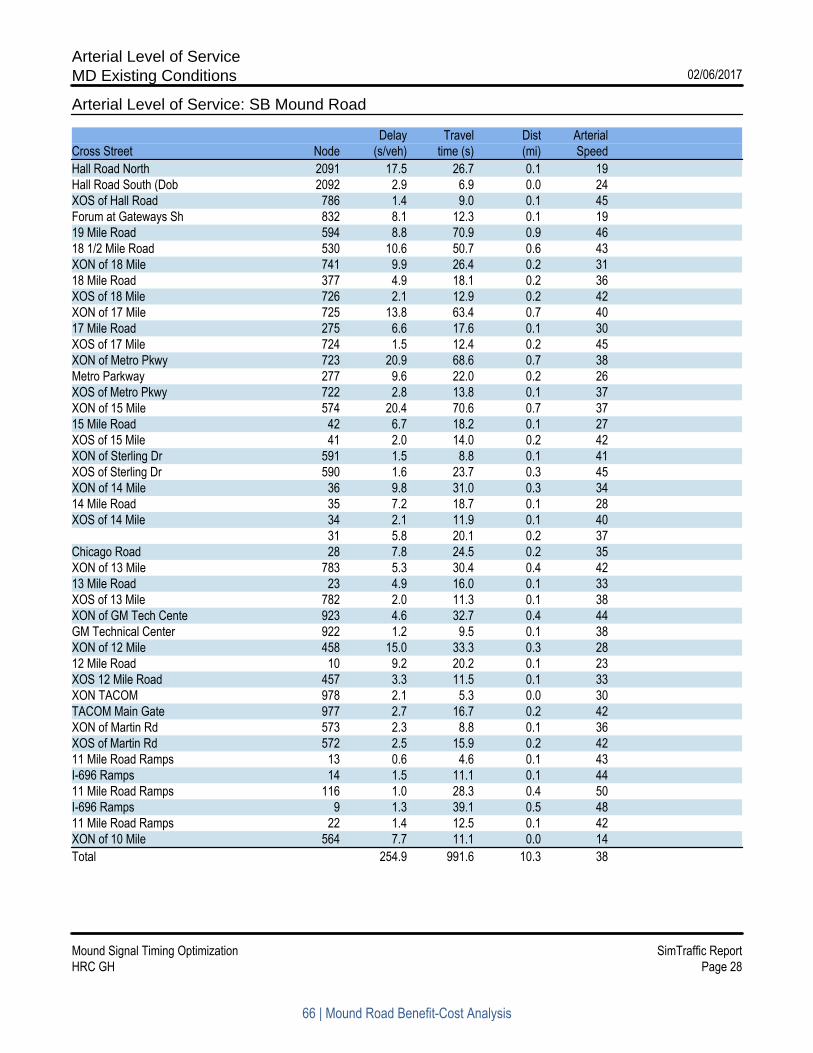
Arterial Level of ServiceMD Existing Conditions 02/06/2017
Mound Signal Timing Optimization SimTraffic ReportHRC GH Page 28
Arterial Level of Service: SB Mound Road
Delay Travel Dist ArterialCross Street Node (s/veh) time (s) (mi) SpeedHall Road North 2091 17.5 26.7 0.1 19Hall Road South (Dob 2092 2.9 6.9 0.0 24XOS of Hall Road 786 1.4 9.0 0.1 45Forum at Gateways Sh 832 8.1 12.3 0.1 1919 Mile Road 594 8.8 70.9 0.9 4618 1/2 Mile Road 530 10.6 50.7 0.6 43XON of 18 Mile 741 9.9 26.4 0.2 3118 Mile Road 377 4.9 18.1 0.2 36XOS of 18 Mile 726 2.1 12.9 0.2 42XON of 17 Mile 725 13.8 63.4 0.7 4017 Mile Road 275 6.6 17.6 0.1 30XOS of 17 Mile 724 1.5 12.4 0.2 45XON of Metro Pkwy 723 20.9 68.6 0.7 38Metro Parkway 277 9.6 22.0 0.2 26XOS of Metro Pkwy 722 2.8 13.8 0.1 37XON of 15 Mile 574 20.4 70.6 0.7 3715 Mile Road 42 6.7 18.2 0.1 27XOS of 15 Mile 41 2.0 14.0 0.2 42XON of Sterling Dr 591 1.5 8.8 0.1 41XOS of Sterling Dr 590 1.6 23.7 0.3 45XON of 14 Mile 36 9.8 31.0 0.3 3414 Mile Road 35 7.2 18.7 0.1 28XOS of 14 Mile 34 2.1 11.9 0.1 40
31 5.8 20.1 0.2 37Chicago Road 28 7.8 24.5 0.2 35XON of 13 Mile 783 5.3 30.4 0.4 4213 Mile Road 23 4.9 16.0 0.1 33XOS of 13 Mile 782 2.0 11.3 0.1 38XON of GM Tech Cente 923 4.6 32.7 0.4 44GM Technical Center 922 1.2 9.5 0.1 38XON of 12 Mile 458 15.0 33.3 0.3 2812 Mile Road 10 9.2 20.2 0.1 23XOS 12 Mile Road 457 3.3 11.5 0.1 33XON TACOM 978 2.1 5.3 0.0 30TACOM Main Gate 977 2.7 16.7 0.2 42XON of Martin Rd 573 2.3 8.8 0.1 36XOS of Martin Rd 572 2.5 15.9 0.2 4211 Mile Road Ramps 13 0.6 4.6 0.1 43I-696 Ramps 14 1.5 11.1 0.1 4411 Mile Road Ramps 116 1.0 28.3 0.4 50I-696 Ramps 9 1.3 39.1 0.5 4811 Mile Road Ramps 22 1.4 12.5 0.1 42XON of 10 Mile 564 7.7 11.1 0.0 14Total 254.9 991.6 10.3 38
66 | Mound Road Benefit-Cost Analysis

Arterial Level of ServicePM Existing Conditions 02/06/2017
Mound Signal Timing Optimization SimTraffic ReportHRC GH Page 27
Arterial Level of Service: NB Mound Road
Delay Travel Dist ArterialCross Street Node (s/veh) time (s) (mi) SpeedXON of 10 Mile 564 2.6 6.8 0.1 3111 Mile Road Ramps 22 1.3 4.4 0.0 34I-696 Ramps 9 6.5 16.9 0.1 3111 Mile Road Ramps 116 120.6 155.7 0.5 12I-696 Ramps 14 254.3 278.9 0.4 511 Mile Road Ramps 13 57.2 67.1 0.1 7XOS of Martin Rd 572 28.3 33.1 0.1 6XON of Martin Rd 573 111.5 125.4 0.2 5TACOM Main Gate 977 71.2 77.4 0.1 4XON TACOM 978 125.9 139.7 0.2 5XOS 12 Mile Road 457 33.5 36.6 0.0 412 Mile Road 10 45.3 82.9 0.1 7XON of 12 Mile 458 8.1 18.2 0.1 26GM Technical Center 922 12.2 30.2 0.3 31XON of GM Tech Cente 923 3.3 13.2 0.1 34XOS of 13 Mile 782 19.0 47.1 0.4 3113 Mile Road 23 8.0 16.5 0.1 26XON of 13 Mile 783 3.7 14.7 0.1 36Chicago Road 28 12.9 36.6 0.4 35Arden Avenue 31 8.7 26.2 0.2 33XOS of 14 Mile 34 18.9 33.2 0.2 2214 Mile Road 35 16.9 27.3 0.1 18XON of 14 Mile 36 4.6 15.4 0.1 34XOS of Sterling Dr 590 3.0 24.3 0.3 44XON of Sterling Dr 591 14.5 36.0 0.3 30XOS of 15 Mile 41 33.2 40.9 0.1 915 Mile Road 42 52.3 108.0 0.2 9XON of 15 Mile 574 5.3 81.0 0.1 32XOS of Metro Pkwy 722 34.3 80.7 0.7 33Metro Parkway 277 28.0 38.1 0.1 14XON of Metro Pkwy 723 10.7 22.9 0.2 25XOS of 17 Mile 724 74.4 122.4 0.7 2117 Mile Road 275 42.0 54.3 0.2 11XON of 17 Mile 725 23.4 38.6 0.1 16XOS of 18 Mile 726 277.3 348.4 0.7 818 Mile Road 377 62.3 75.3 0.2 7XON of 18 Mile 741 24.3 279.3 0.2 1718 1/2 Mile Road 530 17.2 37.4 0.2 2419 Mile Road 594 10.7 50.3 0.6 44Forum at Gateways Sh 832 21.9 81.6 0.9 40XOS of Hall Road 786 34.4 39.9 0.1 6Hall Road South (Dob 2092 13.5 22.1 0.1 18Hall Road North 2091 3.3 7.2 0.0 23Total 1760.3 2892.2 10.3 15
67 | Mound Road Benefit-Cost Analysis

Arterial Level of ServicePM Existing Conditions 02/06/2017
Mound Signal Timing Optimization SimTraffic ReportHRC GH Page 28
Arterial Level of Service: SB Mound Road
Delay Travel Dist ArterialCross Street Node (s/veh) time (s) (mi) SpeedHall Road North 2091 27.1 36.4 0.1 14Hall Road South (Dob 2092 3.5 7.5 0.0 22XOS of Hall Road 786 1.2 9.2 0.1 44Forum at Gateways Sh 832 9.3 13.5 0.1 1719 Mile Road 594 239.5 290.7 0.9 1118 1/2 Mile Road 530 855.4 894.1 0.6 2XON of 18 Mile 741 525.8 647.8 0.2 218 Mile Road 377 228.6 286.8 0.2 3XOS of 18 Mile 726 8.0 19.0 0.2 29XON of 17 Mile 725 15.5 65.3 0.7 3917 Mile Road 275 7.4 20.6 0.1 26XOS of 17 Mile 724 2.0 13.3 0.2 42XON of Metro Pkwy 723 20.0 65.6 0.7 39Metro Parkway 277 10.7 24.0 0.2 24XOS of Metro Pkwy 722 2.7 13.8 0.1 37XON of 15 Mile 574 18.5 69.8 0.7 3815 Mile Road 42 6.1 17.6 0.1 28XOS of 15 Mile 41 1.9 13.8 0.2 43XON of Sterling Dr 591 1.3 8.4 0.1 43XOS of Sterling Dr 590 1.6 23.6 0.3 46XON of 14 Mile 36 16.4 37.3 0.3 2914 Mile Road 35 9.9 21.1 0.1 25XOS of 14 Mile 34 3.0 12.8 0.1 38
31 15.1 28.8 0.2 26Chicago Road 28 11.8 28.8 0.2 30XON of 13 Mile 783 28.2 52.5 0.4 2413 Mile Road 23 10.8 22.1 0.1 24XOS of 13 Mile 782 2.5 11.8 0.1 37XON of GM Tech Cente 923 19.3 47.8 0.4 30GM Technical Center 922 3.5 12.0 0.1 30XON of 12 Mile 458 66.6 85.4 0.3 1112 Mile Road 10 24.3 34.9 0.1 13XOS 12 Mile Road 457 8.3 16.5 0.1 23XON TACOM 978 8.2 11.4 0.0 14TACOM Main Gate 977 7.5 22.2 0.2 32XON of Martin Rd 573 5.1 11.7 0.1 27XOS of Martin Rd 572 4.8 18.5 0.2 3611 Mile Road Ramps 13 1.1 5.2 0.1 38I-696 Ramps 14 1.9 11.4 0.1 4311 Mile Road Ramps 116 1.2 28.3 0.4 50I-696 Ramps 9 1.7 39.1 0.5 4811 Mile Road Ramps 22 2.4 13.4 0.1 39XON of 10 Mile 564 11.6 15.1 0.0 10Total 2251.2 3128.7 10.3 13
68 | Mound Road Benefit-Cost Analysis

Arterial Level of ServiceAM Proposed Conditions 02/06/2017
Mound Signal Timing Optimization SimTraffic ReportHRC GH Page 27
Arterial Level of Service: NB Mound Road
Delay Travel Dist ArterialCross Street Node (s/veh) time (s) (mi) SpeedXON of 10 Mile 564 1.6 5.6 0.1 3711 Mile Road Ramps 22 1.0 4.1 0.0 37I-696 Ramps 9 4.2 14.5 0.1 3611 Mile Road Ramps 116 4.3 41.4 0.5 45I-696 Ramps 14 9.4 35.9 0.4 3911 Mile Road Ramps 13 7.1 17.3 0.1 28XOS of Martin Rd 572 7.4 12.1 0.1 16XON of Martin Rd 573 5.2 19.4 0.2 34TACOM Main Gate 977 1.8 8.1 0.1 39XON TACOM 978 6.1 20.4 0.2 35XOS 12 Mile Road 457 10.5 13.7 0.0 1212 Mile Road 10 5.6 14.0 0.1 27XON of 12 Mile 458 2.0 12.0 0.1 39GM Technical Center 922 1.8 20.2 0.3 47XON of GM Tech Cente 923 0.7 8.2 0.1 44XOS of 13 Mile 782 6.0 34.6 0.4 4213 Mile Road 23 5.6 14.6 0.1 29XON of 13 Mile 783 2.3 13.2 0.1 40Chicago Road 28 8.0 31.5 0.4 40Arden Avenue 31 5.4 23.2 0.2 37XOS of 14 Mile 34 9.7 24.3 0.2 3114 Mile Road 35 17.9 27.9 0.1 17XON of 14 Mile 36 5.2 15.6 0.1 34XOS of Sterling Dr 590 2.1 23.2 0.3 46XON of Sterling Dr 591 1.9 24.0 0.3 45XOS of 15 Mile 41 3.3 10.5 0.1 3415 Mile Road 42 6.8 19.1 0.2 31XON of 15 Mile 574 2.1 11.7 0.1 42XOS of Metro Pkwy 722 8.0 56.1 0.7 47Metro Parkway 277 18.0 28.4 0.1 18XON of Metro Pkwy 723 4.4 16.5 0.2 35XOS of 17 Mile 724 5.5 50.6 0.7 5117 Mile Road 275 6.4 18.6 0.2 30XON of 17 Mile 725 2.3 12.8 0.1 42XOS of 18 Mile 726 6.6 53.2 0.7 4818 Mile Road 377 5.5 17.0 0.2 32XON of 18 Mile 741 3.1 16.2 0.2 4118 1/2 Mile Road 530 4.4 20.2 0.2 4019 Mile Road 594 7.3 48.7 0.6 45Forum at Gateways Sh 832 3.5 64.2 0.9 51XOS of Hall Road 786 1.4 6.2 0.1 37Hall Road South (Dob 2092 47.3 55.5 0.1 7Hall Road North 2091 5.3 9.3 0.0 18Total 273.9 993.7 10.3 37
69 | Mound Road Benefit-Cost Analysis

Arterial Level of ServiceAM Proposed Conditions 02/06/2017
Mound Signal Timing Optimization SimTraffic ReportHRC GH Page 28
Arterial Level of Service: SB Mound Road
Delay Travel Dist ArterialCross Street Node (s/veh) time (s) (mi) SpeedHall Road North 2091 58.3 67.4 0.1 7Hall Road South (Dob 2092 12.8 16.7 0.0 10XOS of Hall Road 786 2.5 10.3 0.1 39Forum at Gateways Sh 832 1.8 6.1 0.1 3819 Mile Road 594 7.7 69.0 0.9 4718 1/2 Mile Road 530 5.0 46.9 0.6 47XON of 18 Mile 741 5.5 22.7 0.2 3618 Mile Road 377 5.0 19.2 0.2 34XOS of 18 Mile 726 1.7 12.7 0.2 43XON of 17 Mile 725 9.3 58.9 0.7 4317 Mile Road 275 8.0 19.3 0.1 28XOS of 17 Mile 724 3.7 15.2 0.2 37XON of Metro Pkwy 723 18.0 68.4 0.7 38Metro Parkway 277 21.3 33.4 0.2 17XOS of Metro Pkwy 722 6.2 17.4 0.1 30XON of 15 Mile 574 15.7 66.6 0.7 3915 Mile Road 42 7.6 18.1 0.1 27XOS of 15 Mile 41 3.3 15.3 0.2 39XON of Sterling Dr 591 1.1 8.4 0.1 43XOS of Sterling Dr 590 2.5 24.1 0.3 45XON of 14 Mile 36 16.7 37.9 0.3 2814 Mile Road 35 15.2 26.4 0.1 20XOS of 14 Mile 34 5.0 14.7 0.1 33
31 5.5 19.9 0.2 37Chicago Road 28 8.3 25.4 0.2 34XON of 13 Mile 783 6.9 30.5 0.4 4213 Mile Road 23 9.7 20.3 0.1 26XOS of 13 Mile 782 5.1 14.3 0.1 30XON of GM Tech Cente 923 4.8 33.5 0.4 43GM Technical Center 922 1.2 8.3 0.1 43XON of 12 Mile 458 14.9 34.0 0.3 2812 Mile Road 10 20.2 29.9 0.1 16XOS 12 Mile Road 457 8.0 16.1 0.1 24XON TACOM 978 3.3 6.4 0.0 24TACOM Main Gate 977 17.1 31.3 0.2 23XON of Martin Rd 573 17.4 24.0 0.1 13XOS of Martin Rd 572 52.0 65.4 0.2 1011 Mile Road Ramps 13 21.3 25.3 0.1 8I-696 Ramps 14 44.8 54.3 0.1 911 Mile Road Ramps 116 6.8 33.9 0.4 42I-696 Ramps 9 5.5 42.9 0.5 4311 Mile Road Ramps 22 2.2 13.2 0.1 39XON of 10 Mile 564 1.9 5.4 0.0 28Total 490.8 1229.3 10.3 30
70 | Mound Road Benefit-Cost Analysis

Arterial Level of ServiceMD Proposed Conditions 02/06/2017
Mound Signal Timing Optimization SimTraffic ReportHRC GH Page 27
Arterial Level of Service: NB Mound Road
Delay Travel Dist ArterialCross Street Node (s/veh) time (s) (mi) SpeedXON of 10 Mile 564 0.8 8.3 0.1 4611 Mile Road Ramps 22 0.4 3.4 0.0 44I-696 Ramps 9 2.2 12.5 0.1 4211 Mile Road Ramps 116 3.2 40.2 0.5 46I-696 Ramps 14 102.7 128.3 0.4 1111 Mile Road Ramps 13 36.6 46.1 0.1 11XOS of Martin Rd 572 17.2 26.6 0.1 9XON of Martin Rd 573 42.7 57.0 0.2 12TACOM Main Gate 977 30.5 50.5 0.1 9XON TACOM 978 65.6 106.8 0.2 9XOS 12 Mile Road 457 31.6 34.7 0.0 512 Mile Road 10 45.3 123.9 0.1 7XON of 12 Mile 458 6.7 19.9 0.1 28GM Technical Center 922 3.5 22.1 0.3 43XON of GM Tech Cente 923 1.1 8.6 0.1 42XOS of 13 Mile 782 7.1 35.8 0.4 4013 Mile Road 23 5.1 13.8 0.1 31XON of 13 Mile 783 2.2 12.6 0.1 42Chicago Road 28 6.7 29.9 0.4 43Arden Avenue 31 7.4 25.1 0.2 34XOS of 14 Mile 34 5.7 20.1 0.2 3714 Mile Road 35 8.5 18.5 0.1 26XON of 14 Mile 36 3.3 13.4 0.1 39XOS of Sterling Dr 590 1.9 23.3 0.3 46XON of Sterling Dr 591 2.2 24.5 0.3 44XOS of 15 Mile 41 13.3 20.4 0.1 1815 Mile Road 42 42.1 54.9 0.2 11XON of 15 Mile 574 3.4 79.1 0.1 36XOS of Metro Pkwy 722 13.9 65.0 0.7 40Metro Parkway 277 12.3 23.0 0.1 22XON of Metro Pkwy 723 3.6 15.5 0.2 37XOS of 17 Mile 724 6.1 55.7 0.7 4617 Mile Road 275 4.7 16.0 0.2 35XON of 17 Mile 725 2.0 12.8 0.1 42XOS of 18 Mile 726 11.6 59.3 0.7 4318 Mile Road 377 6.4 18.0 0.2 30XON of 18 Mile 741 2.7 15.3 0.2 4318 1/2 Mile Road 530 6.2 21.7 0.2 3819 Mile Road 594 3.4 42.9 0.6 51Forum at Gateways Sh 832 2.8 63.6 0.9 51XOS of Hall Road 786 1.5 6.4 0.1 36Hall Road South (Dob 2092 31.3 39.7 0.1 10Hall Road North 2091 4.6 8.6 0.0 20Total 612.1 1524.3 10.3 28
71 | Mound Road Benefit-Cost Analysis

Arterial Level of ServiceMD Proposed Conditions 02/06/2017
Mound Signal Timing Optimization SimTraffic ReportHRC GH Page 28
Arterial Level of Service: SB Mound Road
Delay Travel Dist ArterialCross Street Node (s/veh) time (s) (mi) SpeedHall Road North 2091 44.7 53.9 0.1 9Hall Road South (Dob 2092 7.7 11.7 0.0 14XOS of Hall Road 786 1.6 9.2 0.1 44Forum at Gateways Sh 832 4.1 8.3 0.1 2819 Mile Road 594 5.1 68.5 0.9 4818 1/2 Mile Road 530 7.2 47.5 0.6 46XON of 18 Mile 741 5.1 22.0 0.2 3718 Mile Road 377 3.6 17.1 0.2 38XOS of 18 Mile 726 1.6 12.3 0.2 44XON of 17 Mile 725 5.6 55.3 0.7 4617 Mile Road 275 5.2 16.4 0.1 33XOS of 17 Mile 724 2.1 12.9 0.2 43XON of Metro Pkwy 723 11.7 59.4 0.7 43Metro Parkway 277 9.4 21.9 0.2 26XOS of Metro Pkwy 722 3.1 14.0 0.1 37XON of 15 Mile 574 16.1 66.2 0.7 4015 Mile Road 42 5.8 17.3 0.1 28XOS of 15 Mile 41 2.1 14.2 0.2 42XON of Sterling Dr 591 1.0 8.1 0.1 44XOS of Sterling Dr 590 1.7 23.8 0.3 45XON of 14 Mile 36 7.2 28.4 0.3 3714 Mile Road 35 8.4 19.8 0.1 27XOS of 14 Mile 34 2.6 12.4 0.1 39
31 4.7 18.9 0.2 39Chicago Road 28 7.2 23.9 0.2 36XON of 13 Mile 783 5.2 30.4 0.4 4213 Mile Road 23 5.5 16.8 0.1 32XOS of 13 Mile 782 2.4 11.7 0.1 37XON of GM Tech Cente 923 5.0 33.2 0.4 44GM Technical Center 922 1.5 9.8 0.1 37XON of 12 Mile 458 14.4 32.9 0.3 2912 Mile Road 10 8.6 19.7 0.1 24XOS 12 Mile Road 457 3.2 11.4 0.1 33XON TACOM 978 1.9 5.1 0.0 31TACOM Main Gate 977 2.6 16.8 0.2 42XON of Martin Rd 573 2.3 8.7 0.1 36XOS of Martin Rd 572 3.8 17.5 0.2 3811 Mile Road Ramps 13 4.2 8.2 0.1 24I-696 Ramps 14 8.7 18.3 0.1 2711 Mile Road Ramps 116 3.6 31.1 0.4 45I-696 Ramps 9 3.5 41.3 0.5 4511 Mile Road Ramps 22 1.4 12.6 0.1 41XON of 10 Mile 564 1.3 4.6 0.0 32Total 253.7 994.0 10.3 37
72 | Mound Road Benefit-Cost Analysis

Arterial Level of ServicePM Proposed Conditions 02/06/2017
Mound Signal Timing Optimization SimTraffic ReportHRC GH Page 27
Arterial Level of Service: NB Mound Road
Delay Travel Dist ArterialCross Street Node (s/veh) time (s) (mi) SpeedXON of 10 Mile 564 5.9 11.9 0.1 2111 Mile Road Ramps 22 4.3 7.4 0.0 20I-696 Ramps 9 5.8 16.2 0.1 3211 Mile Road Ramps 116 119.2 153.7 0.5 12I-696 Ramps 14 271.7 296.0 0.4 511 Mile Road Ramps 13 47.3 57.3 0.1 9XOS of Martin Rd 572 20.6 25.4 0.1 8XON of Martin Rd 573 59.0 72.6 0.2 9TACOM Main Gate 977 52.4 58.7 0.1 5XON TACOM 978 85.3 99.3 0.2 7XOS 12 Mile Road 457 28.7 31.8 0.0 512 Mile Road 10 50.7 98.5 0.1 6XON of 12 Mile 458 8.5 18.6 0.1 25GM Technical Center 922 12.3 30.3 0.3 31XON of GM Tech Cente 923 3.4 24.0 0.1 34XOS of 13 Mile 782 9.4 37.4 0.4 3913 Mile Road 23 11.2 19.7 0.1 22XON of 13 Mile 783 5.7 16.7 0.1 32Chicago Road 28 13.9 37.5 0.4 34Arden Avenue 31 7.9 25.3 0.2 34XOS of 14 Mile 34 18.4 32.8 0.2 2314 Mile Road 35 17.5 27.9 0.1 17XON of 14 Mile 36 5.1 15.9 0.1 33XOS of Sterling Dr 590 2.6 24.0 0.3 44XON of Sterling Dr 591 6.7 28.3 0.3 38XOS of 15 Mile 41 18.3 26.1 0.1 1415 Mile Road 42 39.5 71.0 0.2 11XON of 15 Mile 574 5.2 53.2 0.1 32XOS of Metro Pkwy 722 16.9 63.5 0.7 41Metro Parkway 277 21.2 31.4 0.1 16XON of Metro Pkwy 723 7.7 19.9 0.2 29XOS of 17 Mile 724 10.7 60.5 0.7 4317 Mile Road 275 8.2 19.2 0.2 29XON of 17 Mile 725 3.4 14.2 0.1 38XOS of 18 Mile 726 218.2 272.9 0.7 1018 Mile Road 377 59.0 72.4 0.2 8XON of 18 Mile 741 32.1 262.1 0.2 1418 1/2 Mile Road 530 14.4 45.9 0.2 2719 Mile Road 594 5.8 46.1 0.6 48Forum at Gateways Sh 832 8.1 68.5 0.9 48XOS of Hall Road 786 5.4 10.4 0.1 22Hall Road South (Dob 2092 33.5 42.0 0.1 10Hall Road North 2091 5.1 9.1 0.0 18Total 1386.1 2455.7 10.3 18
73 | Mound Road Benefit-Cost Analysis

Arterial Level of ServicePM Proposed Conditions 02/06/2017
Mound Signal Timing Optimization SimTraffic ReportHRC GH Page 28
Arterial Level of Service: SB Mound Road
Delay Travel Dist ArterialCross Street Node (s/veh) time (s) (mi) SpeedHall Road North 2091 36.0 45.3 0.1 11Hall Road South (Dob 2092 4.4 8.4 0.0 20XOS of Hall Road 786 1.2 9.2 0.1 44Forum at Gateways Sh 832 6.4 10.7 0.1 2219 Mile Road 594 9.5 72.5 0.9 4518 1/2 Mile Road 530 462.7 501.3 0.6 4XON of 18 Mile 741 404.1 481.2 0.2 218 Mile Road 377 142.5 203.4 0.2 4XOS of 18 Mile 726 3.3 14.2 0.2 38XON of 17 Mile 725 13.4 62.7 0.7 4117 Mile Road 275 6.3 19.3 0.1 28XOS of 17 Mile 724 2.1 13.4 0.2 42XON of Metro Pkwy 723 22.8 69.0 0.7 37Metro Parkway 277 11.3 24.3 0.2 24XOS of Metro Pkwy 722 2.9 13.9 0.1 37XON of 15 Mile 574 19.5 70.8 0.7 3715 Mile Road 42 5.8 17.1 0.1 28XOS of 15 Mile 41 1.9 13.8 0.2 43XON of Sterling Dr 591 0.9 8.0 0.1 45XOS of Sterling Dr 590 1.6 23.5 0.3 46XON of 14 Mile 36 13.6 34.6 0.3 3114 Mile Road 35 11.1 22.3 0.1 24XOS of 14 Mile 34 3.6 13.2 0.1 36
31 9.6 23.3 0.2 32Chicago Road 28 9.4 26.5 0.2 32XON of 13 Mile 783 18.2 42.6 0.4 3013 Mile Road 23 15.2 26.4 0.1 20XOS of 13 Mile 782 5.4 14.7 0.1 29XON of GM Tech Cente 923 15.4 43.9 0.4 33GM Technical Center 922 3.0 11.3 0.1 32XON of 12 Mile 458 51.2 70.0 0.3 1312 Mile Road 10 21.2 31.8 0.1 15XOS 12 Mile Road 457 7.7 15.8 0.1 24XON TACOM 978 7.9 11.1 0.0 14TACOM Main Gate 977 17.6 32.3 0.2 22XON of Martin Rd 573 24.6 31.1 0.1 10XOS of Martin Rd 572 67.0 80.5 0.2 811 Mile Road Ramps 13 24.6 28.6 0.1 7I-696 Ramps 14 35.9 45.4 0.1 1111 Mile Road Ramps 116 7.0 34.1 0.4 41I-696 Ramps 9 5.2 42.6 0.5 4411 Mile Road Ramps 22 2.1 13.2 0.1 40XON of 10 Mile 564 3.2 6.6 0.0 23Total 1538.1 2384.2 10.3 16
74 | Mound Road Benefit-Cost Analysis

75 | Mound Road Benefit-Cost Analysis
Appendix C – MCDR Connected Vehicles Initiative Memo

Macomb County Department of Roads
117 S Groesbeck Hwy
Mt Clemens, MI 48043 T: 586.463.8671
F: 586.463.4266
Project Memorandum
Project Name: Connected Vehicles Initiative Issue Date: December 5, 2016
This year, the Macomb County Department of Roads (MCDR) Traffic Division, Electrical Department, and Traffic Operations Center (TOC) staff has been involved in assisting General Motors (GM) with a research project pertaining to connected vehicles. The effort has been two-legged, as both the Michigan Department of Transportation (MDOT) and Macomb County have joined forces to help the initiative at multiple locations in the County with different General Motors personnel. The first initiative involved the MCDR working directly with GM engineers at a signalized location located on the General Motors Technical Center campus in Warren. The signalized location was slated to be removed several years ago until General Motors decided to use it for connected vehicles as an on-campus test bed. After multiple meetings and consultation from contractors assisting MDOT, a road side unit (RSU) was successfully deployed by MCDR Electricians, MCDR TOC Engineers, and MCDR TOC IT/ITS Technicians on November 23. The RSU is connected to the standard SEPAC-driven traffic controller in the existing cabinet and sends SPaT (Signal Phase and Timing) messages to the vehicle. Photos below depict moments captured on the day of implementation. The second initiative, on a separate schedule under different directives, occurred at two individual locations – 12 Mile and Mound Road and 13 Mile and Mound Road in Warren. Consultant Mixon-Hill was primarily responsible for development, along with MDOT Engineers, with input from all other parties noted in this document. After a few software tweaks and new iterations, the successful installation of an RSU at each location on November 16, and now are streaming SpaT messages correctly. This now sets the platform upon which numerous safety and mobility applications can be implemented as illustrated in the next page. MCDR will continue to be offering technical assistance while GM tests connected vehicle infrastructure in the near future.
76 | Mound Road Benefit-Cost Analysis

Office Memorandum MCDR Traffic Operations Center
Page 2
The Macomb County Connected Vehicle Intersection
77 | Mound Road Benefit-Cost Analysis