Embed Size (px)
Citation preview

TABLE OF CONTENTS 2
CHAPTER 1
Basic Economic Ideas And Resource Allocation
2 CHAPTER 2
The Price System & The Micro Economy
7 CHAPTER 3
Government Microeconomic Intervention
9 CHAPTER 4
The Macro Economy
15 CHAPTER 5
Macroeconomic Policies
CIE A2-LEVEL ECONOMICS//9708
PAGE 2 OF 15
1. BASIC ECONOMIC IDEAS AND RESOURCE
ALLOCATION
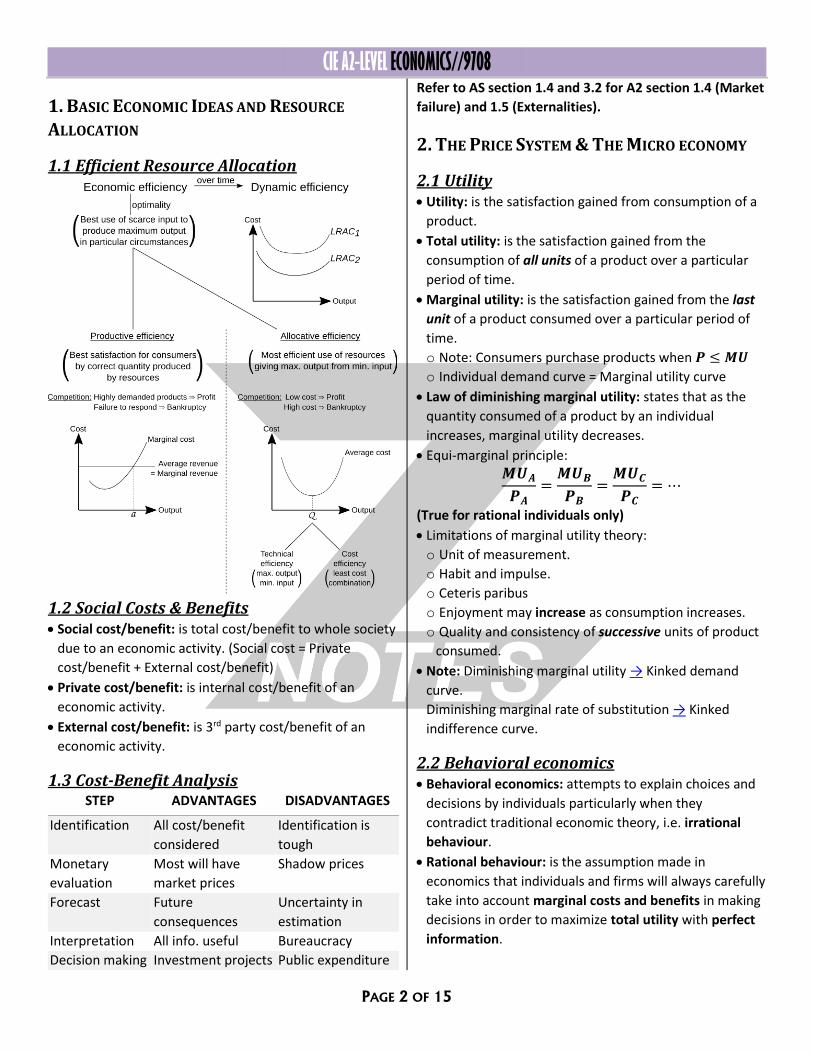
1.1 Efficient Resource Allocation
1.2 Social Costs & Benefits Social cost/benefit: is total cost/benefit to whole society
due to an economic activity. (Social cost = Private
cost/benefit + External cost/benefit)
Private cost/benefit: is internal cost/benefit of an
economic activity.
External cost/benefit: is 3rd party cost/benefit of an
economic activity.
1.3 Cost-Benefit Analysis STEP ADVANTAGES DISADVANTAGES
Identification All cost/benefit
considered
Identification is
tough
Monetary
evaluation
Most will have
market prices
Shadow prices
Forecast Future
consequences
Uncertainty in
estimation
Interpretation All info. useful Bureaucracy
Decision making Investment projects Public expenditure
Refer to AS section 1.4 and 3.2 for A2 section 1.4 (Market
failure) and 1.5 (Externalities).
2. THE PRICE SYSTEM & THE MICRO ECONOMY
2.1 Utility Utility: is the satisfaction gained from consumption of a
product.
Total utility: is the satisfaction gained from the
consumption of all units of a product over a particular
period of time.
Marginal utility: is the satisfaction gained from the last
unit of a product consumed over a particular period of
time.
o Note: Consumers purchase products when 𝑷 ≤ 𝑴𝑼
o Individual demand curve = Marginal utility curve
Law of diminishing marginal utility: states that as the
quantity consumed of a product by an individual
increases, marginal utility decreases.
Equi-marginal principle:
𝑴𝑼𝑨
𝑷𝑨=
𝑴𝑼𝑩
𝑷𝑩=
𝑴𝑼𝑪
𝑷𝑪= ⋯
(True for rational individuals only)
Limitations of marginal utility theory:
o Unit of measurement.
o Habit and impulse.
o Ceteris paribus
o Enjoyment may increase as consumption increases.
o Quality and consistency of successive units of product
consumed.
Note: Diminishing marginal utility → Kinked demand
curve.
Diminishing marginal rate of substitution → Kinked
indifference curve.
2.2 Behavioral economics Behavioral economics: attempts to explain choices and
decisions by individuals particularly when they
contradict traditional economic theory, i.e. irrational
behaviour.
Rational behaviour: is the assumption made in
economics that individuals and firms will always carefully
take into account marginal costs and benefits in making
decisions in order to maximize total utility with perfect
information.
CIE A2-LEVEL ECONOMICS//9708
PAGE 3 OF 15
Note: Imperfect information, often caused by framing
(incorrect representation) leads to bounded rationality,
so individuals have to resort to heuristics (mental
shortcuts) to take decisions.
These include:
o Anchoring
o Availability
o Representation
Other aspects of behavioral economics:
o Endowment effect.
o Loss aversion.
o Reference points.
o Certainty vs. uncertainty.
o Over-confidence.
o Too much choice.
o Herd instinct & competition.
o Implications for policy.
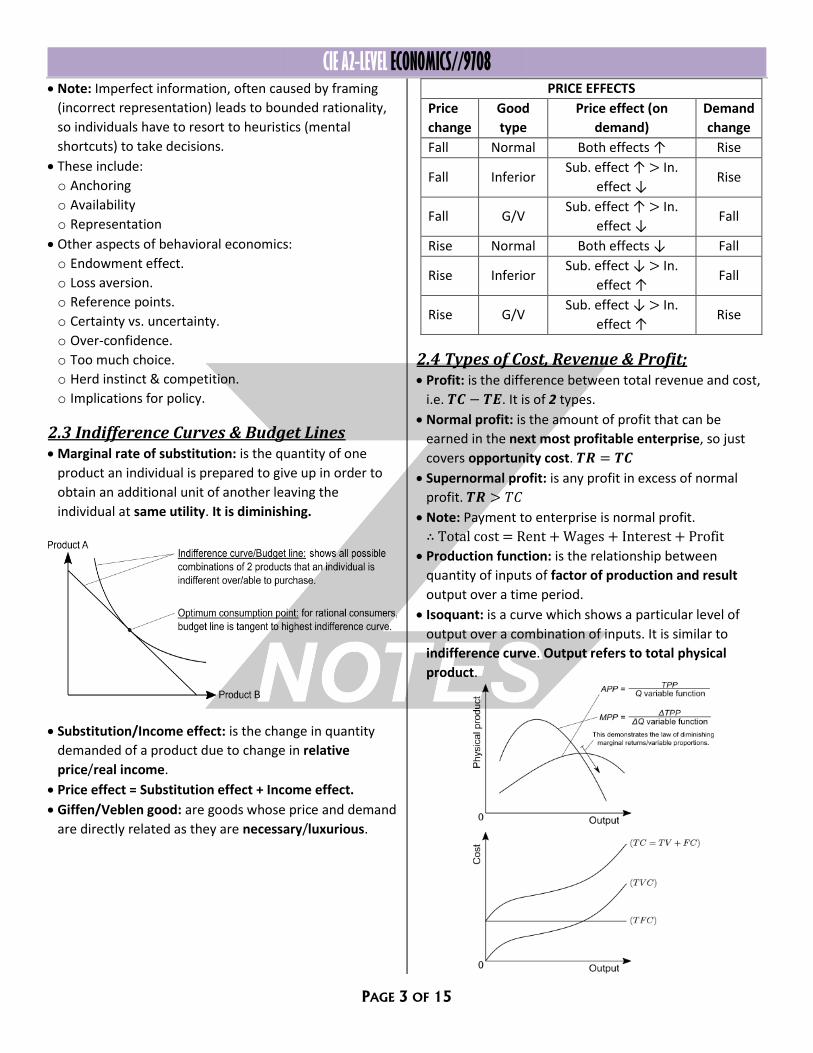
2.3 Indifference Curves & Budget Lines Marginal rate of substitution: is the quantity of one
product an individual is prepared to give up in order to
obtain an additional unit of another leaving the
individual at same utility. It is diminishing.
Substitution/Income effect: is the change in quantity
demanded of a product due to change in relative
price/real income.
Price effect = Substitution effect + Income effect.
Giffen/Veblen good: are goods whose price and demand
are directly related as they are necessary/luxurious.
PRICE EFFECTS
Price
change
Good
type
Price effect (on
demand)
Demand
change
Fall Normal Both effects ↑ Rise
Fall Inferior Sub. effect ↑ > In.
effect ↓ Rise
Fall G/V Sub. effect ↑ > In.
effect ↓ Fall
Rise Normal Both effects ↓ Fall
Rise Inferior Sub. effect ↓ > In.
effect ↑ Fall
Rise G/V Sub. effect ↓ > In.
effect ↑ Rise
2.4 Types of Cost, Revenue & Profit; Profit: is the difference between total revenue and cost,
i.e. 𝑻𝑪 − 𝑻𝑬. It is of 2 types.
Normal profit: is the amount of profit that can be
earned in the next most profitable enterprise, so just
covers opportunity cost. 𝑻𝑹 = 𝑻𝑪
Supernormal profit: is any profit in excess of normal
profit. 𝑻𝑹 > 𝑇𝐶
Note: Payment to enterprise is normal profit.
∴ Total cost = Rent + Wages + Interest + Profit
Production function: is the relationship between
quantity of inputs of factor of production and result
output over a time period.
Isoquant: is a curve which shows a particular level of
output over a combination of inputs. It is similar to
indifference curve. Output refers to total physical
product.

CIE A2-LEVEL ECONOMICS//9708
PAGE 4 OF 15
Note: In long-run there are no fixed/sunk costs. So, the
LRAC is a combination of a series of SRAC.
Note:
𝐿𝑒𝑎𝑠𝑡 𝑐𝑜𝑠𝑡 𝑐𝑜𝑚𝑏𝑖𝑛𝑎𝑡𝑖𝑜𝑛 →𝑴𝑷𝑷 𝑭𝒂𝒄𝒕𝒐𝒓 𝑨
𝑷 𝑭𝒂𝒄𝒕𝒐𝒓 𝑨=
𝑴𝑷𝑷 𝑭𝒂𝒄𝒕𝒐𝒓 𝑩
𝑷 𝑭𝒂𝒄𝒕𝒐𝒓 𝑩= ⋯
Revenue:
𝑻𝑹 = 𝑷𝑿𝑸 𝑨𝑹 =𝑻𝑹
𝑸 𝑴𝑹 =
∆𝑻𝑹
∆𝑸 ∴ 𝑨𝑹 = 𝑷
2.5 Differing Types of Business Structures &
their Objectives Firm: is a business which hires factors of production to
produce goods and services.
Industry: is a group of firms producing similar goods and
services.
TYPES OF BUSINESS
STRUCTURES
STRATEGIES EMPLOYED TO
FULFILL AIMS
Sole trade
Partnership
Private limited company
Public limited company
Barriers to entry.
Improve quality & lower
price.
Advertise.
Takeover.
Objectives: are standardized to profit maximisation.
This may not be possible as:
o 𝑀𝐶 & 𝑀𝑅 difficult to calculate.
o Could encourage takeover.
o May encourage new entrants.
o May attract investigation by competition commission.
Other objectives, such as:
o Growth
o Revenue maximisation
o Sales maximisation
o Profit satisficing
o Managerial utility maximisation
o Survival
o Loss minimisation
o Ethical responsibilities
o Strategic monopolization
These other objectives are due to divorce of ownership
and control, causing the principal-agent problem of
conflicting interests of managers & shareholders.
The organizational slack gives rise to X-inefficiency, but
strict AGMs (annual general meetings) can prevent this.
2.6 Growth & Survival of Firms Growth: of firms is a key objective of managers as their
salaries and status are directly related to size of firm.
Survival of small firms:
o Low startup costs.
o Small niche markets.
o Personalised services.
o Government support.
o May grow.
o Act as ancillary firms.
o Full ownership and
independence.
o Provide employment.
o Are flexible.
o Good labour relations.
o Training for labour &
enterprise.
o Combine with other
firms
Economies of scale Diseconomies of scale
Inte
rnal
Technical
Financial
Managerial
Marketing
Purchasing
Risk-bearing
Increased dimensions
Economies of scope
Lack of communication
Demotivation
Alienation
Slack management (X-
inefficiency)
Non-flexibility
Labour disputes &
turnover
Exte
rnal
Transport
Concentration
Knowledge
Ancillary industries
Specialised labour
Reputation
Competition for inputs
Congestion
Pollution

CIE A2-LEVEL ECONOMICS//9708
PAGE 5 OF 15
2.7 Different Market Structures Market structure: is the way in which a market is
organized in terms of the number of firms and the
barriers to the entry of new firms.
Imperfect competition: is any market structure except
perfect competition.
Concentration ratio: is the proportion of a market’s
output controlled by the largest firms.
Perfect competition:
Many buyers and sellers – low concentration ratio.
They are price takers – no preferential treatment.
(𝑨𝑹 = 𝑴𝑹)
Perfect knowledge – of prices & profits.
Homogenous product – no product differentiation
𝑷𝑬𝑫 = ∞
No barriers – free entry and exit.
No transport costs – perfect factor mobility.
Same technology for all firms.
Normal profits in long run.
(𝑴𝑪) = (𝑨𝑪) = (𝑴𝑹 = 𝑨𝑹 = 𝑷)
Short run abnormal profits or losses offset by hit & run
competition.
o Efficient – Allocative: 𝑴𝑪 = 𝑨𝑹,
Productive: 𝑴𝑪 = 𝑨𝑪
o Low prices and high quality.
o Lots of suppliers – cost reduction. 𝑴𝑪 = 𝑺
o Responsive to changes in demand due to flexibility.
High turnover for firms – creates uncertainty.
Lack of research – innovation is copied.
Lack of variation – limits consumer choice.
Unable to take advantages of economies of scale.
Shutdown – Short run: 𝑷 = 𝒎𝒊𝒏. 𝑨𝑽𝑪, Long run: 𝑷 =
𝒎𝒊𝒏. 𝑨𝑪
Acts as efficiency benchmarks for other market
structures.
Monopolistic competition:
Many firms – low concentration ratio
Price makers – 𝑨𝑹 > 𝑀𝑅
Heterogeneous, i.e. differentiated products – 𝑷𝑬𝑫: −𝟏
to −∞
Excess capacity – Industry should have fewer & larger
firms.
Low startup costs – Permits entry and exit.
Allows short run profits & losses to be offset.
Nonprice competition – advertising, branding, packaging,
servicing.
Normal profits in longrun – 𝑨𝑪 = 𝑨𝑹
Inefficient – Allocative: 𝑴𝑪 < 𝐴𝑅, Productive: 𝑴𝑪 >
𝐴𝐶.
Oligopoly:
Few firms – high concentration ratio
Mixture of price takers and price makers (leaders).
Barriers to entry – excess capacity.
Abnormal profits in long & short run – 𝑨𝑹 > 𝐴𝐶
Inefficient – Allocative: 𝑨𝑹 > 𝑀𝐶, Productive: 𝑴𝑪 >
𝑀𝐶.
Mutually interdependent – kinked demand curve.
Knowledge – of competitions – maybe collusion – by
cartels.
Price stability/rigidity – fear of price war.
Monopoly:
Pure (single)
Legal (SOE)
Natural (competition winner)
Dominant (40%+ share)
Price maker – 𝑨𝑹 > 𝑀𝑅 – 𝑷𝑬𝑫: 𝟎 to −𝟏, so, no
substitutes.
Excess capacity – productive inefficiency.
• Perfect
competition:
Many firms, no barriers.
• Monopolistic
competition:
Many firms, few barriers.
• Oligopoly: Few firms, high barriers.
• Monopoly: One firm, very high barriers.
CIE A2-LEVEL ECONOMICS//9708
PAGE 6 OF 15
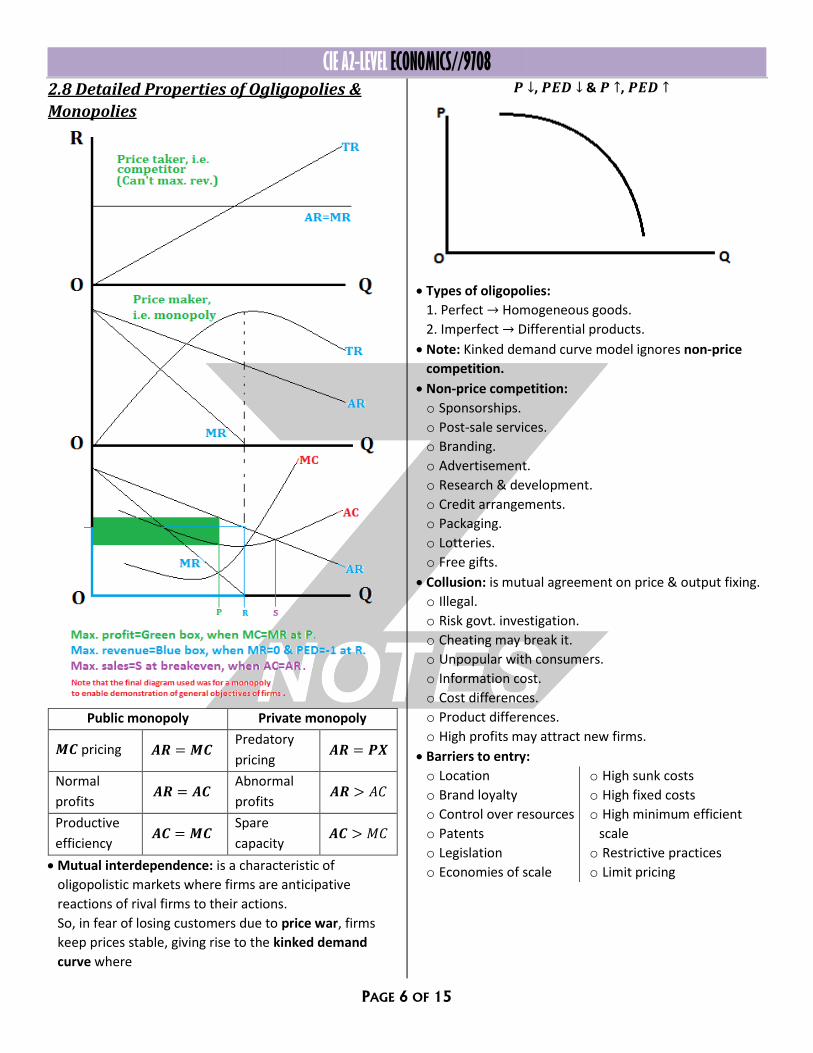
2.8 Detailed Properties of Ogligopolies &
Monopolies
Public monopoly Private monopoly
𝑴𝑪 pricing 𝑨𝑹 = 𝑴𝑪 Predatory
pricing 𝑨𝑹 = 𝑷𝑿
Normal
profits 𝑨𝑹 = 𝑨𝑪
Abnormal
profits 𝑨𝑹 > 𝐴𝐶
Productive
efficiency 𝑨𝑪 = 𝑴𝑪
Spare
capacity 𝑨𝑪 > 𝑀𝐶
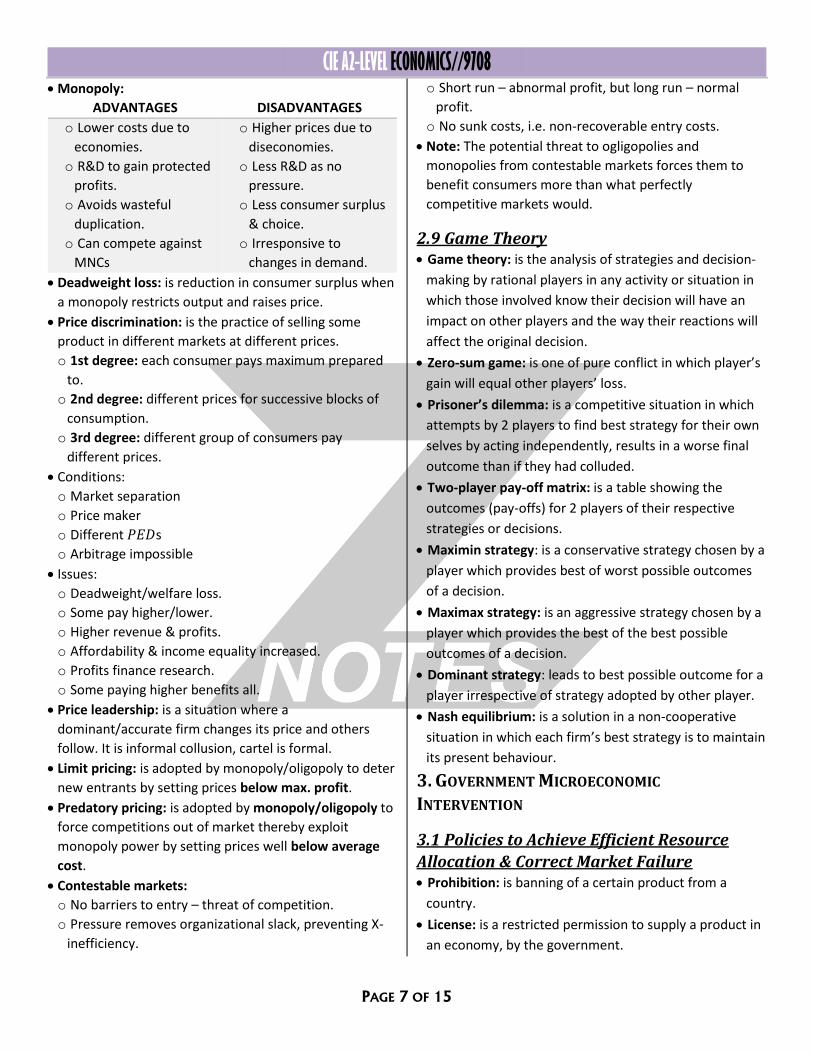
Mutual interdependence: is a characteristic of
oligopolistic markets where firms are anticipative
reactions of rival firms to their actions.
So, in fear of losing customers due to price war, firms
keep prices stable, giving rise to the kinked demand
curve where
𝑷 ↓, 𝑷𝑬𝑫 ↓ & 𝑷 ↑, 𝑷𝑬𝑫 ↑
Types of oligopolies:
1. Perfect → Homogeneous goods.
2. Imperfect → Differential products.
Note: Kinked demand curve model ignores non-price
competition.
Non-price competition:
o Sponsorships.
o Post-sale services.
o Branding.
o Advertisement.
o Research & development.
o Credit arrangements.
o Packaging.
o Lotteries.
o Free gifts.
Collusion: is mutual agreement on price & output fixing.
o Illegal.
o Risk govt. investigation.
o Cheating may break it.
o Unpopular with consumers.
o Information cost.
o Cost differences.
o Product differences.
o High profits may attract new firms.
Barriers to entry:
o Location
o Brand loyalty
o Control over resources
o Patents
o Legislation
o Economies of scale
o High sunk costs
o High fixed costs
o High minimum efficient
scale
o Restrictive practices
o Limit pricing
CIE A2-LEVEL ECONOMICS//9708
PAGE 7 OF 15
Monopoly:
ADVANTAGES DISADVANTAGES
o Lower costs due to
economies.
o R&D to gain protected
profits.
o Avoids wasteful
duplication.
o Can compete against
MNCs
o Higher prices due to
diseconomies.
o Less R&D as no
pressure.
o Less consumer surplus
& choice.
o Irresponsive to
changes in demand.
Deadweight loss: is reduction in consumer surplus when
a monopoly restricts output and raises price.
Price discrimination: is the practice of selling some
product in different markets at different prices.
o 1st degree: each consumer pays maximum prepared
to.
o 2nd degree: different prices for successive blocks of
consumption.
o 3rd degree: different group of consumers pay
different prices.
Conditions:
o Market separation
o Price maker
o Different 𝑃𝐸𝐷s
o Arbitrage impossible
Issues:
o Deadweight/welfare loss.
o Some pay higher/lower.
o Higher revenue & profits.
o Affordability & income equality increased.
o Profits finance research.
o Some paying higher benefits all.
Price leadership: is a situation where a
dominant/accurate firm changes its price and others
follow. It is informal collusion, cartel is formal.
Limit pricing: is adopted by monopoly/oligopoly to deter
new entrants by setting prices below max. profit.
Predatory pricing: is adopted by monopoly/oligopoly to
force competitions out of market thereby exploit
monopoly power by setting prices well below average
cost.
Contestable markets:
o No barriers to entry – threat of competition.
o Pressure removes organizational slack, preventing X-
inefficiency.
o Short run – abnormal profit, but long run – normal
profit.
o No sunk costs, i.e. non-recoverable entry costs.
Note: The potential threat to ogligopolies and
monopolies from contestable markets forces them to
benefit consumers more than what perfectly
competitive markets would.
2.9 Game Theory Game theory: is the analysis of strategies and decision-
making by rational players in any activity or situation in
which those involved know their decision will have an
impact on other players and the way their reactions will
affect the original decision.
Zero-sum game: is one of pure conflict in which player’s
gain will equal other players’ loss.
Prisoner’s dilemma: is a competitive situation in which
attempts by 2 players to find best strategy for their own
selves by acting independently, results in a worse final
outcome than if they had colluded.
Two-player pay-off matrix: is a table showing the
outcomes (pay-offs) for 2 players of their respective
strategies or decisions.
Maximin strategy: is a conservative strategy chosen by a
player which provides best of worst possible outcomes
of a decision.
Maximax strategy: is an aggressive strategy chosen by a
player which provides the best of the best possible
outcomes of a decision.
Dominant strategy: leads to best possible outcome for a
player irrespective of strategy adopted by other player.
Nash equilibrium: is a solution in a non-cooperative
situation in which each firm’s best strategy is to maintain
its present behaviour.
3. GOVERNMENT MICROECONOMIC
INTERVENTION
3.1 Policies to Achieve Efficient Resource
Allocation & Correct Market Failure Prohibition: is banning of a certain product from a
country.
License: is a restricted permission to supply a product in
an economy, by the government.
CIE A2-LEVEL ECONOMICS//9708
PAGE 8 OF 15
Property rights: ensure owners of economic goods have
a right to decide how such assets are used.
Pollution permit: is a license for a firm to bring about a
reduction in the level of pollution over a period of time.
Information:
o helps utility maximization by ensuring rational
decisions.
o prevents market failure concerning merit & demerit
goods.
Nudge theory: is an attempt by a government to alter
the economic behaviour of people in some way.
Regulating bodies: are organisations that are set up to
enforce particular policies and regulations in an
economy, especially about monopolies, environment,
consumer & transportation.
Efficiency: is the most economic use of resources.
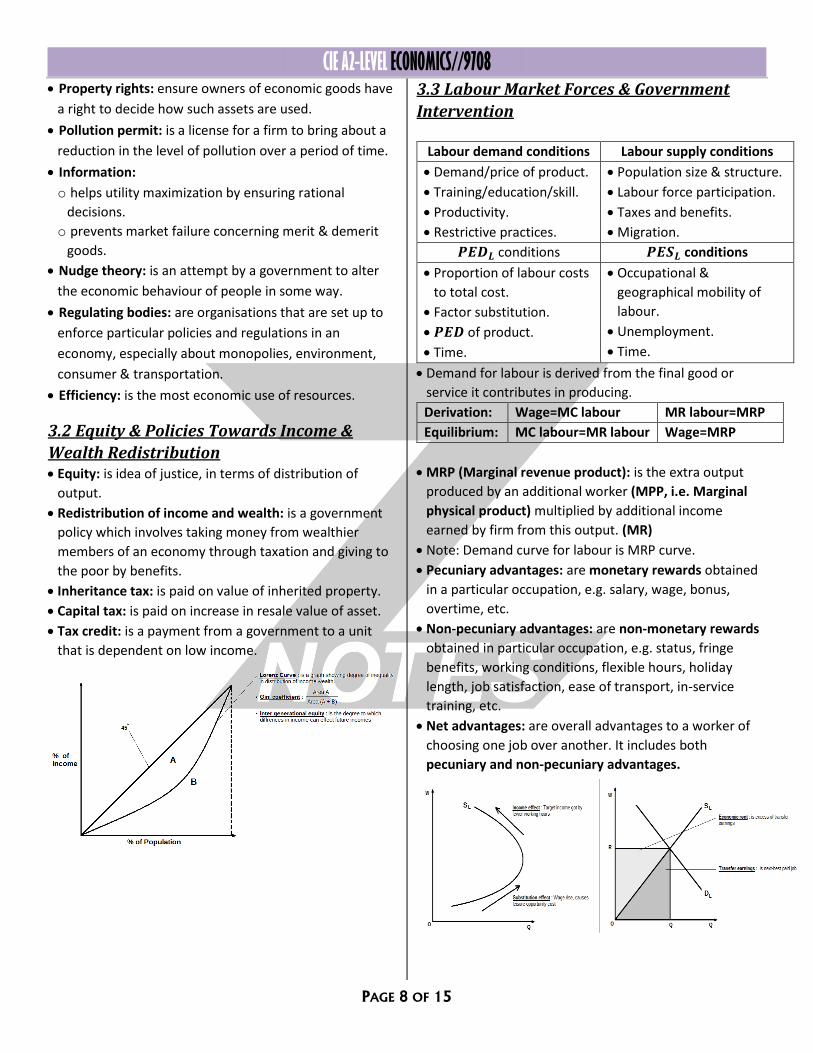
3.2 Equity & Policies Towards Income &
Wealth Redistribution Equity: is idea of justice, in terms of distribution of
output.
Redistribution of income and wealth: is a government
policy which involves taking money from wealthier
members of an economy through taxation and giving to
the poor by benefits.
Inheritance tax: is paid on value of inherited property.
Capital tax: is paid on increase in resale value of asset.
Tax credit: is a payment from a government to a unit
that is dependent on low income.
3.3 Labour Market Forces & Government
Intervention
Labour demand conditions Labour supply conditions
Demand/price of product.
Training/education/skill.
Productivity.
Restrictive practices.
Population size & structure.
Labour force participation.
Taxes and benefits.
Migration.
𝑷𝑬𝑫𝑳 conditions 𝑷𝑬𝑺𝑳 conditions
Proportion of labour costs
to total cost.
Factor substitution.
𝑷𝑬𝑫 of product.
Time.
Occupational &
geographical mobility of
labour.
Unemployment.
Time.
Demand for labour is derived from the final good or
service it contributes in producing.
Derivation: Wage=MC labour MR labour=MRP
Equilibrium: MC labour=MR labour Wage=MRP
MRP (Marginal revenue product): is the extra output
produced by an additional worker (MPP, i.e. Marginal
physical product) multiplied by additional income
earned by firm from this output. (MR)
Note: Demand curve for labour is MRP curve.
Pecuniary advantages: are monetary rewards obtained
in a particular occupation, e.g. salary, wage, bonus,
overtime, etc.
Non-pecuniary advantages: are non-monetary rewards
obtained in particular occupation, e.g. status, fringe
benefits, working conditions, flexible hours, holiday
length, job satisfaction, ease of transport, in-service
training, etc.
Net advantages: are overall advantages to a worker of
choosing one job over another. It includes both
pecuniary and non-pecuniary advantages.
CIE A2-LEVEL ECONOMICS//9708
PAGE 9 OF 15
Wage differentials:
o Personal: Age, qualifications, experience, skills, hours
worked.
o Firm: Factor mix, profitability, non-pecuniary
advantages.
o Geographical: Different mix of industries, mobility
affected by social ties and housing.
o Occupational: 𝑀𝑅𝑃, strength of trade unions &
employers, mobility affected by qualifications and
skills.
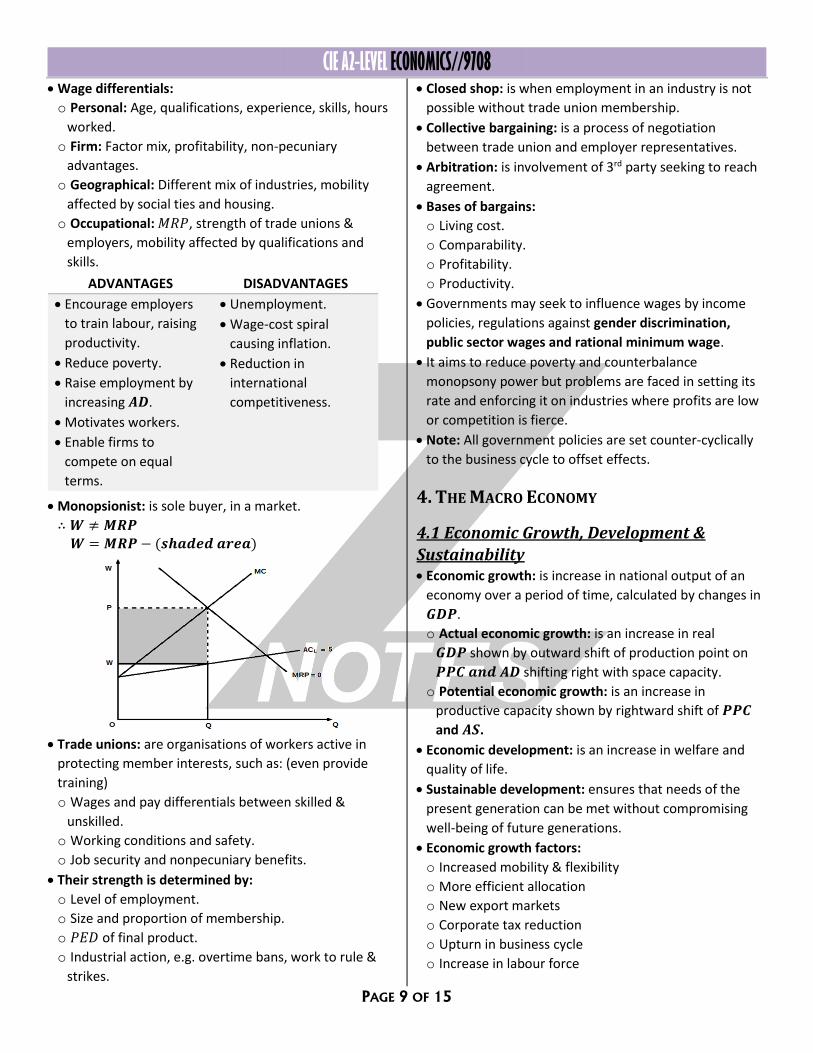
Monopsionist: is sole buyer, in a market.
∴ 𝑾 ≠ 𝑴𝑹𝑷 𝑾 = 𝑴𝑹𝑷 − (𝒔𝒉𝒂𝒅𝒆𝒅 𝒂𝒓𝒆𝒂)
Trade unions: are organisations of workers active in
protecting member interests, such as: (even provide
training)
o Wages and pay differentials between skilled &
unskilled.
o Working conditions and safety.
o Job security and nonpecuniary benefits.
Their strength is determined by:
o Level of employment.
o Size and proportion of membership.
o 𝑃𝐸𝐷 of final product.
o Industrial action, e.g. overtime bans, work to rule &
strikes.
Closed shop: is when employment in an industry is not
possible without trade union membership.
Collective bargaining: is a process of negotiation
between trade union and employer representatives.
Arbitration: is involvement of 3rd party seeking to reach
agreement.
Bases of bargains:
o Living cost.
o Comparability.
o Profitability.
o Productivity.
Governments may seek to influence wages by income
policies, regulations against gender discrimination,
public sector wages and rational minimum wage.
It aims to reduce poverty and counterbalance
monopsony power but problems are faced in setting its
rate and enforcing it on industries where profits are low
or competition is fierce.
Note: All government policies are set counter-cyclically
to the business cycle to offset effects.
4. THE MACRO ECONOMY
4.1 Economic Growth, Development &
Sustainability Economic growth: is increase in national output of an
economy over a period of time, calculated by changes in
𝑮𝑫𝑷.
o Actual economic growth: is an increase in real
𝑮𝑫𝑷 shown by outward shift of production point on
𝑷𝑷𝑪 𝒂𝒏𝒅 𝑨𝑫 shifting right with space capacity.
o Potential economic growth: is an increase in
productive capacity shown by rightward shift of 𝑷𝑷𝑪
and 𝑨𝑺.
Economic development: is an increase in welfare and
quality of life.
Sustainable development: ensures that needs of the
present generation can be met without compromising
well-being of future generations.
Economic growth factors:
o Increased mobility & flexibility
o More efficient allocation
o New export markets
o Corporate tax reduction
o Upturn in business cycle
o Increase in labour force
ADVANTAGES DISADVANTAGES
Encourage employers
to train labour, raising
productivity.
Reduce poverty.
Raise employment by
increasing 𝑨𝑫.
Motivates workers.
Enable firms to
compete on equal
terms.
Unemployment.
Wage-cost spiral
causing inflation.
Reduction in
international
competitiveness.

CIE A2-LEVEL ECONOMICS//9708
PAGE 10 OF 15
o Labour quality improvement
o More research & development
o Technological advances
o Net investment in capital stock
o Capital-intensive production
And everything that shifts 𝑨𝑫 & 𝑨𝑺 to the right.
BENEFITS COSTS
Higher living standards
Poor gain without
income redistribution
Reduced cyclical
unemployment
Greater international
power
Increased tax revenue
Opportunity costs of
forgone consumer goods
Pollution
Depletion of resources
Stress
Structural
unemployment
Exploiting resources:
o Increase employment, output, income and tax
revenue.
o Improve trade position and living standard.
o Develop other industries using income.
Conserving resources:
o Prevent reduction in quantity & quality of resources
sustaining development.
o Avoid over-dependence.
Exploit resources when:
o Poor and in debt.
o Have comparative advantage.
o Have current world demand.
4.2 National Income Statistics National income: is total income of an economy over a
given period of time.
THE STATISTICS ARE USED
TO:
THE METHODS USED TO
CALCULATE THESE ARE:
Calculate economic
growth.
Make international
comparisons.
Formulate economic
policy.
Output
Income (excluding
transfer payments)
Expenditure:
(+) – exports, subsidies
(−) – imports, taxes
𝑮𝑫𝑷 = Total domestic income − imports
𝑮𝑵𝑷 = 𝐺𝐷𝑃 + net foreign property incomes
𝑮𝑵𝑰 = 𝐺𝐷𝑃 + primary foreign incomes
𝑵𝑵𝑷 = 𝐺𝑁𝑃 − depreciation (fall in value of capital)
𝑵𝑫𝑷 = 𝐺𝐷𝑃 − depreciation
Problems involved in making comparisons
ove
r ti
me
Price changes (inflation adjustment)
Population changes (per capita adjustment
Shadow economy
Working hours and conditions
Externalities
Distribution of income
Product quality
Labour & capital balance
bet
wee
n c
ou
ntr
ies
Different currencies (Use purchasing power parity)
Different tastes
Different climates
Differences in accuracy.
National debt: is amount of money government & public
sector owes domestically and abroad accumulating over
a number of years.
o It increases during economic downturns & military
conflicts.
o Opportunity cost of tax revenue.
o Balance of payments deficit.
o Debt burden on citizens.
o Caused by budget deficit.
Measurable economic
welfare:
-Real GDP per capita
-Leisure time
-Unpaid work
-Depletion of natural
resources
-Changes in development
Human development index:
-Life expectancy
-Per capita 𝐺𝑁𝐼
-Years of schooling
Human poverty index:
-Longevity
-Adult literacy
-Deprivation
Multidimensional poverty
index:
-Replaced HPI in 2010.
-Child mortality & nutrition
-Schooling & attendance
-Electricity, water,
sanitation, fuel, flooring &
assets
CIE A2-LEVEL ECONOMICS//9708
PAGE 11 OF 15
4.3 Classification of Countries Developing economy: has low 𝐺𝐷𝑃 per head.
Developed economy: has high 𝐺𝐷𝑃 per head.
Emerging economy: has rapid growth rate providing
good investment opportunities, e.g. BRIC, MINT, etc.
Dependency ratio: is the proportion of economically
inactive to labour force.
Optimum population: maximizes GDP per head.
Infant mortality rate: is the no. of deaths of infants
below one year old in a given year per thousand live
births.
Natural increase: is the difference between:
Birth rate (no. of live births per thousand population per
year) & Death rate (no. of deaths per thousand
population per year)
Migration: is the difference between:
Immigration (people coming into country) & Emigration
(people leaving country)
Population structure: shows population of a country by
age and gender in a pyramid.
Characteristics of developing economies
High national increase
Population above optimum
More young people than
old
High dependency ratio
Low incomes
High income inequality
Less working women
Employment in primary
sector
Exports of narrow range of
goods
Rural-urban migration
Net emigration
High external debt
Dependent on developed
economies
Low quality of life.
Note: Emerging economies share some of these
properties, while developed economies have
characteristics contrasting to aforementioned.
4.4 Employment/Unemployment Labour force: is all the people eligible of working in a
country, employed and/or receiving unemployment
benefits.
Participation rate: is the proportion of population either
employed or officially registered as unemployed.
Working population: are the people willing and able to
work.
Size of labour force depends on:
o Population size
o Birth rate
o Death rate
o School leaving age
o Retirement age
o No. of people in post-
school education
o Availability and value
of unemployment
benefits
o Attitudes to working
women
o State of economy
Labour productivity: measures efficiency of labour in
terms of output per person per period of time. It is
affected by:
o Education
o Skills
o Training
o Experience
o Technical knowledge
o Level of capital available
o Working methods & practices
o Motivation
Unemployment: is a situation that occurs when people
are able and willing to work but, are unable to gain
employment.
∴ 𝑼𝒏𝒆𝒎𝒑𝒍𝒐𝒚𝒎𝒆𝒏𝒕 𝒓𝒂𝒕𝒆
=𝑵𝒐. 𝒐𝒇 𝒑𝒆𝒐𝒑𝒍𝒆 𝒖𝒏𝒆𝒎𝒑𝒍𝒐𝒚𝒆𝒅
𝑾𝒐𝒓𝒌𝒊𝒏𝒈 𝒑𝒐𝒑𝒖𝒍𝒂𝒕𝒊𝒐𝒏× 𝟏𝟎𝟎%
Note: Unemployment rate may show a pattern affected by the trade cycle.
Full employment: is level of employment when everyone (except frictionally unemployed (around 3%)) who is willing and able to work have a job.
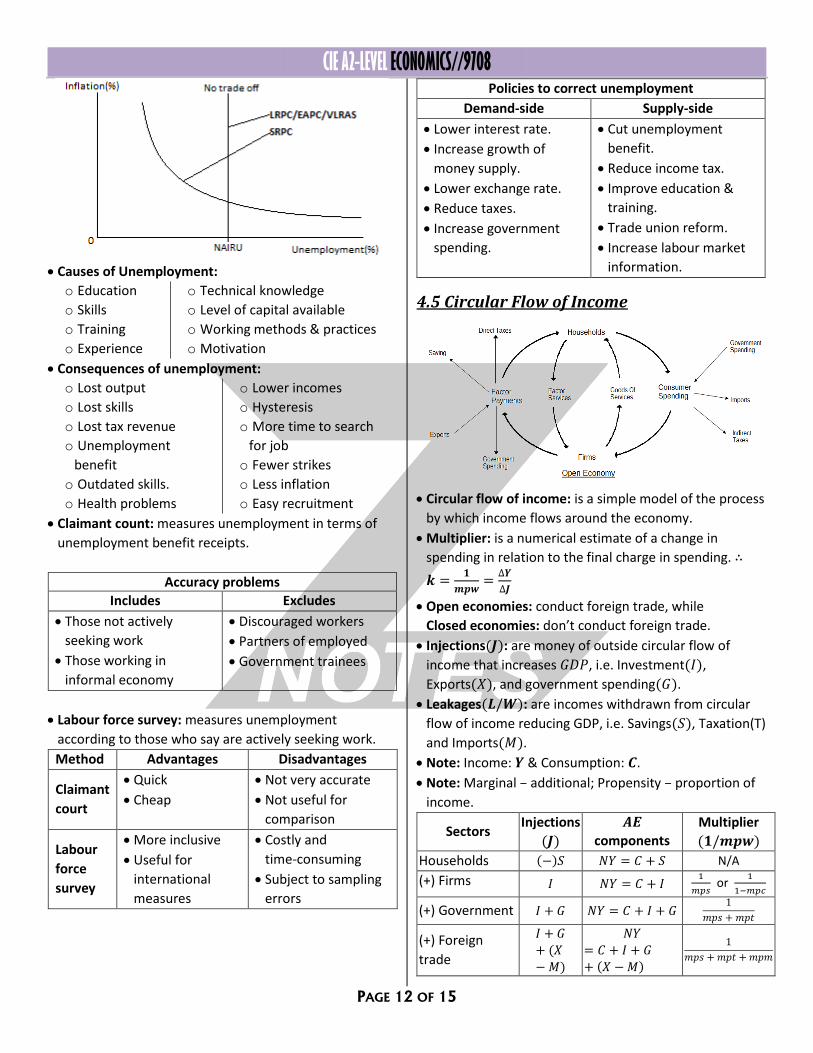
Natural rate of unemployment (𝑵𝑨𝑰𝑹𝑼): i.e. non-accelerating inflation rate of unemployment is unemployment rate at macroeconomic equilibrium which prevents rate of inflation from rising.
Note: NAIRU is shown on expectations augmented Philips curve/long-run Philips curve/very long-run aggregate supply curve of new-classical economists.
CIE A2-LEVEL ECONOMICS//9708
PAGE 12 OF 15
Causes of Unemployment:
o Education
o Skills
o Training
o Experience
o Technical knowledge
o Level of capital available
o Working methods & practices
o Motivation
Consequences of unemployment:
o Lost output
o Lost skills
o Lost tax revenue
o Unemployment
benefit
o Outdated skills.
o Health problems
o Lower incomes
o Hysteresis
o More time to search
for job
o Fewer strikes
o Less inflation
o Easy recruitment
Claimant count: measures unemployment in terms of
unemployment benefit receipts.
Accuracy problems
Includes Excludes
Those not actively
seeking work
Those working in
informal economy
Discouraged workers
Partners of employed
Government trainees
Labour force survey: measures unemployment
according to those who say are actively seeking work.
Method Advantages Disadvantages
Claimant
court
Quick
Cheap
Not very accurate
Not useful for
comparison
Labour
force
survey
More inclusive
Useful for
international
measures
Costly and
time-consuming
Subject to sampling
errors
Policies to correct unemployment
Demand-side Supply-side
Lower interest rate.
Increase growth of
money supply.
Lower exchange rate.
Reduce taxes.
Increase government
spending.
Cut unemployment
benefit.
Reduce income tax.
Improve education &
training.
Trade union reform.
Increase labour market
information.
4.5 Circular Flow of Income
Circular flow of income: is a simple model of the process
by which income flows around the economy.
Multiplier: is a numerical estimate of a change in
spending in relation to the final charge in spending. ∴
𝒌 =𝟏
𝒎𝒑𝒘=
∆𝒀
∆𝑱
Open economies: conduct foreign trade, while
Closed economies: don’t conduct foreign trade.
Injections(𝑱): are money of outside circular flow of
income that increases 𝐺𝐷𝑃, i.e. Investment(𝐼),
Exports(𝑋), and government spending(𝐺).
Leakages(𝑳/𝑾): are incomes withdrawn from circular
flow of income reducing GDP, i.e. Savings(𝑆), Taxation(T)
and Imports(𝑀).
Note: Income: 𝒀 & Consumption: 𝑪.
Note: Marginal – additional; Propensity – proportion of
income.
Sectors Injections
(𝑱)
𝑨𝑬
components
Multiplier
(𝟏/𝒎𝒑𝒘)
Households (−)𝑆 𝑁𝑌 = 𝐶 + 𝑆 N/A
(+) Firms 𝐼 𝑁𝑌 = 𝐶 + 𝐼 1
𝑚𝑝𝑠 or
1
1−𝑚𝑝𝑐
(+) Government 𝐼 + 𝐺 𝑁𝑌 = 𝐶 + 𝐼 + 𝐺 1
𝑚𝑝𝑠 + 𝑚𝑝𝑡
(+) Foreign
trade
𝐼 + 𝐺
+ (𝑋
− 𝑀)
𝑁𝑌
= 𝐶 + 𝐼 + 𝐺
+ (𝑋 − 𝑀)
1
𝑚𝑝𝑠 + 𝑚𝑝𝑡 + 𝑚𝑝𝑚
CIE A2-LEVEL ECONOMICS//9708
PAGE 13 OF 15
𝑨𝑷𝑪 𝑴𝑷𝑪 𝑨𝑷𝑺 𝑴𝑷𝑺 𝟏
𝐶
𝑌
∆𝐶
∆𝑌
𝑆
𝑌
∆𝑆
∆𝑌
𝐴𝑃𝐶
+ 𝐴𝑃𝑆;
𝑀𝑃𝐶
+ 𝑀𝑃𝑆
∴ 𝑨𝑬 = 𝑪 + 𝑰 + 𝑮 + (𝑿 − 𝑴)
Note:
o 𝐴𝐷 − 𝑃𝑟𝑖𝑐𝑒; 𝐴𝐸 − 𝐼𝑛𝑐𝑜𝑚𝑒 o 𝐷𝑖𝑠𝑝𝑜𝑠𝑎𝑏𝑙𝑒 𝑖𝑛𝑐𝑜𝑚𝑒 = 𝑖𝑛𝑐𝑜𝑚𝑒 + 𝑠𝑡𝑎𝑡𝑒 𝑏𝑒𝑛𝑒𝑓𝑖𝑡𝑠 −
𝑑𝑖𝑟𝑒𝑐𝑡 𝑡𝑎𝑥𝑒𝑠.
Consumption: is spending by households on goods and
services.
Saving: is income that is disposable after consumption.
Dissaving: is spending financed by borrowing on past
savings.
Paradox of thrift: is the contradiction that increase in
savings lead to fall in savings in long-run due to lower
spending and income.
Consumption function: 𝑪 = 𝒂 + (𝒎𝒑𝒄)𝒀; (𝒂 =
autonomous consumption)
Saving function: 𝑺 = −𝒂 + (𝒎𝒑𝒔)𝒀; (𝒂 = autonomous
dissaving)
Note: autonomous – when income is zero.
As income rises, 𝑨𝑷𝑺 & 𝑴𝑷𝑺 rises while 𝑨𝑷𝑪 & 𝑴𝑷𝑪
falls.
Investment: is spending by firms on capital goods.
Government spending: is total local & national
expenditure on goods & service.
Net exports: is income from exports minus income spent
on imports.
Determinants of components of 𝑨𝑬 (& AD)
Consumption (𝑪) Net exports (𝑿 − 𝑴)
Disposable income
Distribution of income &
wealth
Interest rate
Credit availability
Expectations
𝐺𝐷𝑃 of a country
𝐺𝐷𝑃 of other countries
Relative prices of exports
Quality of exports
Exchange rate
Investments (𝑰) Government spending (𝑮)
Interest rate
Technology
Cost of capital
Consumer demand
Expectations
Government policies
Government policies
Tax revenue
Demographic changes
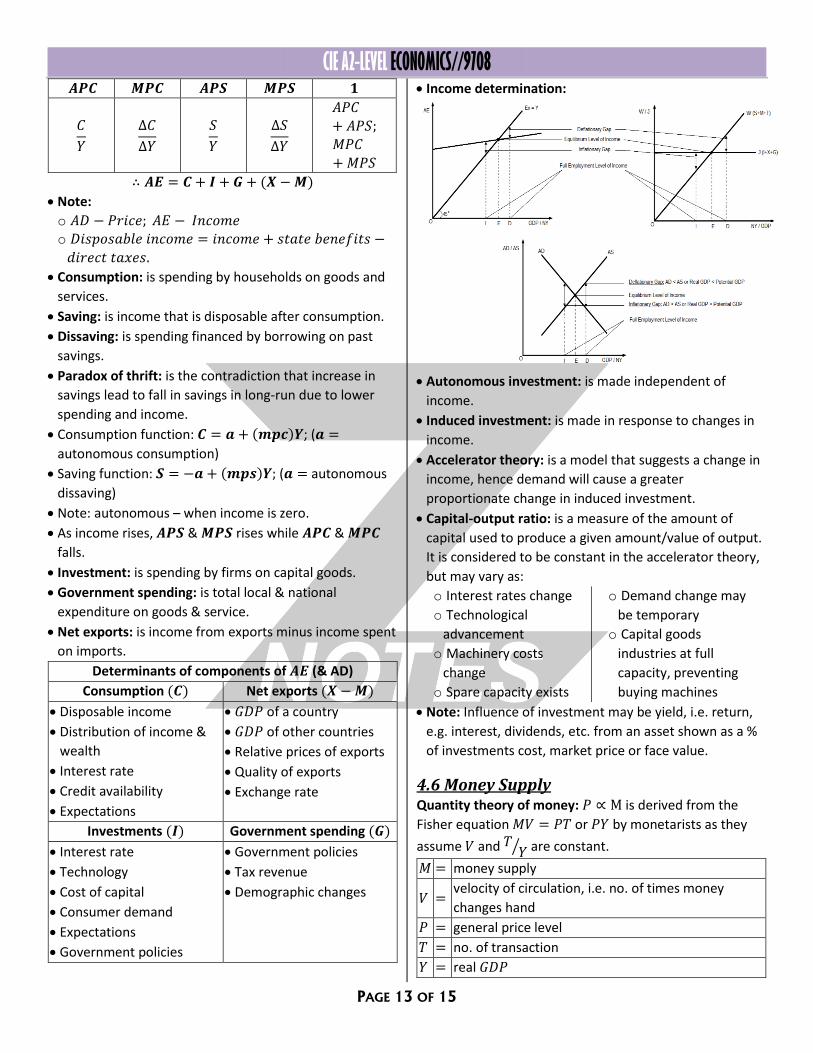
Income determination:
Autonomous investment: is made independent of
income.
Induced investment: is made in response to changes in
income.
Accelerator theory: is a model that suggests a change in
income, hence demand will cause a greater
proportionate change in induced investment.
Capital-output ratio: is a measure of the amount of
capital used to produce a given amount/value of output.
It is considered to be constant in the accelerator theory,
but may vary as:
o Interest rates change
o Technological
advancement
o Machinery costs
change
o Spare capacity exists
o Demand change may
be temporary
o Capital goods
industries at full
capacity, preventing
buying machines
Note: Influence of investment may be yield, i.e. return,
e.g. interest, dividends, etc. from an asset shown as a %
of investments cost, market price or face value.
4.6 Money Supply Quantity theory of money: 𝑃 ∝ M is derived from the
Fisher equation 𝑀𝑉 = 𝑃𝑇 or 𝑃𝑌 by monetarists as they
assume 𝑉 and 𝑇 𝑌⁄ are constant.
𝑀 = money supply
𝑉 = velocity of circulation, i.e. no. of times money
changes hand
𝑃 = general price level
𝑇 = no. of transaction
𝑌 = real 𝐺𝐷𝑃

CIE A2-LEVEL ECONOMICS//9708
PAGE 14 OF 15
There is a time lag.-Keynesians disagree.
Narrow money: can be spent directly, i.e. notes, coins &
current accounts.
Broad money: used for spending sand savings i.e. notes,
coins and all bank deposits.
Money supply may increase due to:
Credit creation, i.e. lending by banks.
o Budget deficit financing by banks of government
spending.
o Quantitative easing by purchase of government
securities (used to raise money) from private sector to
raise money supply.
o Total currency inflow into country.
Monetary transmission mechanism: is the process by
which a change in monetary policy works through
economy via change in 𝐴𝐷 thus, the price level and 𝐺𝐷𝑃.
Central bank:
o Controls money
supply
o Issues notes & coins
o Sets interest rate
o Settles external debt
o Holds gold & foreign
currency reserves
Commercial bank:
o Accepts deposits
o Lends (even mortgage)
o Bill payments
o Selling insurance &
foreign currency
o Holds important
documents &
valuables.
o Helps with wills and
tax.
𝑪𝒓𝒆𝒅𝒊𝒕 𝒎𝒖𝒍𝒕𝒊𝒑𝒍𝒊𝒆𝒓
=𝑉𝑎𝑙𝑢𝑒 𝑜𝑓 𝑛𝑒𝑤 𝑎𝑠𝑠𝑒𝑡𝑠 𝑐𝑟𝑒𝑎𝑡𝑒𝑑
𝑉𝑎𝑙𝑢𝑒 𝑜𝑓 𝑐ℎ𝑎𝑛𝑔𝑒 𝑖𝑛 𝑙𝑖𝑞𝑢𝑖𝑑 𝑎𝑠𝑠𝑒𝑡𝑠 𝑜𝑟
100
𝑙𝑖𝑞𝑢𝑖𝑑𝑖𝑡𝑦 𝑟𝑎𝑡𝑖𝑜
𝑳𝒊𝒒𝒖𝒊𝒅𝒊𝒕𝒚 𝒓𝒂𝒕𝒊𝒐 =𝑉𝑎𝑙𝑢𝑒 𝑜𝑓 𝑙𝑖𝑞𝑢𝑖𝑑 𝑎𝑠𝑠𝑒𝑡𝑠
𝑉𝑎𝑙𝑢𝑒 𝑜𝑓 𝑡𝑜𝑡𝑎𝑙 𝑎𝑠𝑠𝑒𝑡𝑠× 100%
4.7 Interest Rate Determination Keynesians: are economists who think that government
intervention by fiscal policy is needed to achieve a full
employment as markets are too slow to adjust. Demand
for money is explained by liquidity preference theory.
o Idle balances: is the amount of money held for
speculative demand(s); i.e. interest elastic demand for
holding money with a motive to make future gains
from buying financial assets.
o Active balances: is the money held for transactionary
motive of buying day-to-day goods & services and
precautionary motive of unexpected events. Denoted
by(𝑇).
Influences on demand of money
Transactionary Precautionary
Prices.
Products.
Frequency of pay.
Income.
Credit cost.
Insurance cost.
Expectations.
Income.
Monetarists: are economists who believe that control of
money supply by monetary policy is essential to avoid
inflation as markets clear easily. They support the
loanable funds theory.
4.8 Policies of Trade & Aid Towards
Developing Economies Multinational corporation (MNC): are usually large
public limited companies that produce in more than one
country.
Advantages Disadvantages
May raise output,
employment, exports and
tax revenue.
Low price, high quality &
choice due to competition.
Brings new ideas & capital.
Pollution & depletion of
non-renewable resources.
Profit diversion & top-level
employment, non-local.
Drive out domestic firms &
unduly influence
government.
CIE A2-LEVEL ECONOMICS//9708
PAGE 15 OF 15
Foreign aid: is assistance given to developing economies
on favourable terms. They can be tied (conditional),
untied (unconditional), bilateral (2 countries) &
multilateral (many countries).
It is best untied and multilateral.
Foreign direct investment (FDI): is setting up of
production units or purchase of existing production units
in other countries.
World Bank: is an international organization that lends
money to developing economies for projects that will
promote development.
It consists of:
o International Bank for Reconstruction and
Development
o International Finance Corporation
o International Development Association
o Multilateral Investment Guarantee Agency
o International Centre for Settlement of Investment
Disputes
International monetary fund (IMF): is an international
organization that promotes free trade and helps
countries in balance of payments difficulties.
lt aims to:
o promote international monetary cooperation.
o facilitate expansion and balanced growth of
international trade.
o provide exchange stability.
o assist setup of multinational payment system
o make resources available to members experiencing
balance of payments problems.
IBRD & IDA loans & grants cover:
o Health & education, e.g. sanitation, combating AIDs.
o Agriculture & rural development, e.g. irrigation.
o Environmental & rural development, e.g. irrigation.
o Infrastructure, e.g. roads, railways, electricity.
o Governance, e.g. anti-corruption. Lack of strong legal framework in an economy can give rise to
corruption, thus activities such as bribes, aid-fund diversion, etc.
which can hinder development can occur.
5. GOVERNMENT MACRO INTERVENTION
5.1 Interconnectedness of Macro-economic
Problems Inflation reduces internal value of money.
Exports become dearer and imports cheaper.
Current account deficit occurs if ML-condition met.
Exchange rate falls due to reduced demand and
increased supply of currency.
Fall in unemployment increases 𝐴𝐷, thus causes
inflation.
Timbergen’s rule: is that there must be at least one
policy measure for every macroeconomic objective.
Refer to AS section 5 for more.