Embed Size (px)
Citation preview


TABLE OF CONTENTS
Calculation Methods
Source of Data
Report Summary: * Calculation Objectives * Classification of Soils * Selection of Storm Events * Existing Site Overview * Proposed Site Overview *
* *
Summary of Flows at Design Point 1 and 10 Summary of Flows at Design Point 2 and 20 Conclusion
Stormwater Analysis: * Existing Conditions • Watershed Routing Diagram
• 2-Year 24 Hour Storm Event Analysis
• 10-Year 24 Hour Storm Event Analysis
• 100-Year 24 Hour Storm Event Analysis
* Proposed Conditions • Watershed Routing Diagram
• 2-Year 24 Hour Storm Event Analysis
• 10-Year 24 Hour Storm Event Analysis
• 100-Year 24 Hour Storm Event Analysis
Appendix: * Pre-Development Drainage Plan * Post-Development Drainage Plan *
* *
Operation & Maintenance Program Stormwater Management Standards Checklist for Stormwater Report
* *
USDA Natural Resource Conservation Service – Soil Survey Flood Insurance Rate Map

CALCULATION METHODS
− TR 20 SCS Unit Hydrograph Procedure
− Runoff Curve Numbers
− Time of Concentration by TR55 Methodology
− Reach and Pond Rating by the Storage-Indication Method
− Manning Equation
SOURCE OF DATA
− Technical Report No. 20
− Technical Report No. 55
− Technical Paper No. 40
− Field Survey by Meridian Associates, Inc.
− Soil Testing by Meridian Associates, Inc.
− Massachusetts Stormwater Handbook February 2008

1
REPORT SUMMARY:
Calculation Objective
The purpose of this drainage analysis is to design a stormwater management system that
will not increase peak rates and volumes of stormwater runoff that will flow offsite from
pre to post development at the selected design points during the 2, 10, and 100-year
design storm events.
The following analysis is separated into existing conditions and proposed conditions for
ease of comparison. Drainage maps have been incorporated into this report to depict
existing and proposed watershed areas and subcatchments for the site.
Classification of Soils:
The drainage class of the various soil types on the locus property has been categorized by
applying the information provided by the soil maps prepared by the United States
Department of Agriculture, National Resource Conservation Service (hereon referred to
as the USDA NRCS). Based upon the USDA NRCS Soil Maps, four (4) soil groups exist
within the subcatchment areas that are used throughout this drainage analysis. The four
different soil types are as follows:
• Paxton Fine Sandy Loam, 3-8% Slopes, Very Stony, Hydrological Soil Group C;
• Paxton Fine Sandy Loam, 8-15% Slopes, Very Stony, Hydrological Soil Group C;
• Woodbridge Fine Sandy Loam, 0-8% slopes, Extremely Stony, Hydrological Soil
Group C;
• Woodbridge Fine Sandy Loam, 3-8% slopes, Extremely Stony, Hydrological Soil
Group C;
Paxton Fine Sandy Loam, 3-8% Slopes
This unit consists of very deep, strongly sloping, well-drained soil on drumlin and
drumlin like areas. Seasonal high groundwater is typically found at depths of 18-37”
below the existing grade. Parent material is Coarse-loamy lodgment till derived from
gneiss, granite, and/or schist. The permeability of this soil is moderate in the subsoil and
slow or very slow in the substratum.
2
Paxton Fine Sandy Loam, 18-15% Slopes
This unit consists of deep, moderately steep, well-drained soil on drumlins. Seasonal high
groundwater is typically found at depths of 18-37” below the existing grade. Parent
material is coarse-loamy lodgment till derived from gneiss, granite, and/or schist. The
permeability of this soil is moderate in the subsoil and slow or very slow in the
substratum.
Woodbridge Fine Sandy Loam, 0-8% slopes, Extremely Stony
This unit consists of very deep, gently sloping, moderately well-drained soil on the tops
of drumlins and on glacial till uplands. Seasonal high groundwater is typically found at
depths of 19-27” below the existing grade. Parent material is coarse-loamy lodgment till
derived from gneiss, granite, and/or schist. The permeability of this soil is moderate in the
subsoil and slow or very slow in the substratum.
Woodbridge Fine Sandy Loam, 3-8% slopes
This unit consists of very deep, gently sloping, moderately well-drained soil on the tops
of drumlins and on glacial till uplands. Seasonal high groundwater is typically found at
depths of 19-27” below the existing grade. Parent material is coarse-loamy lodgment till
derived from gneiss, granite, and/or schist. The permeability of this soil is moderate in the
subsoil and slow or very slow in the substratum.
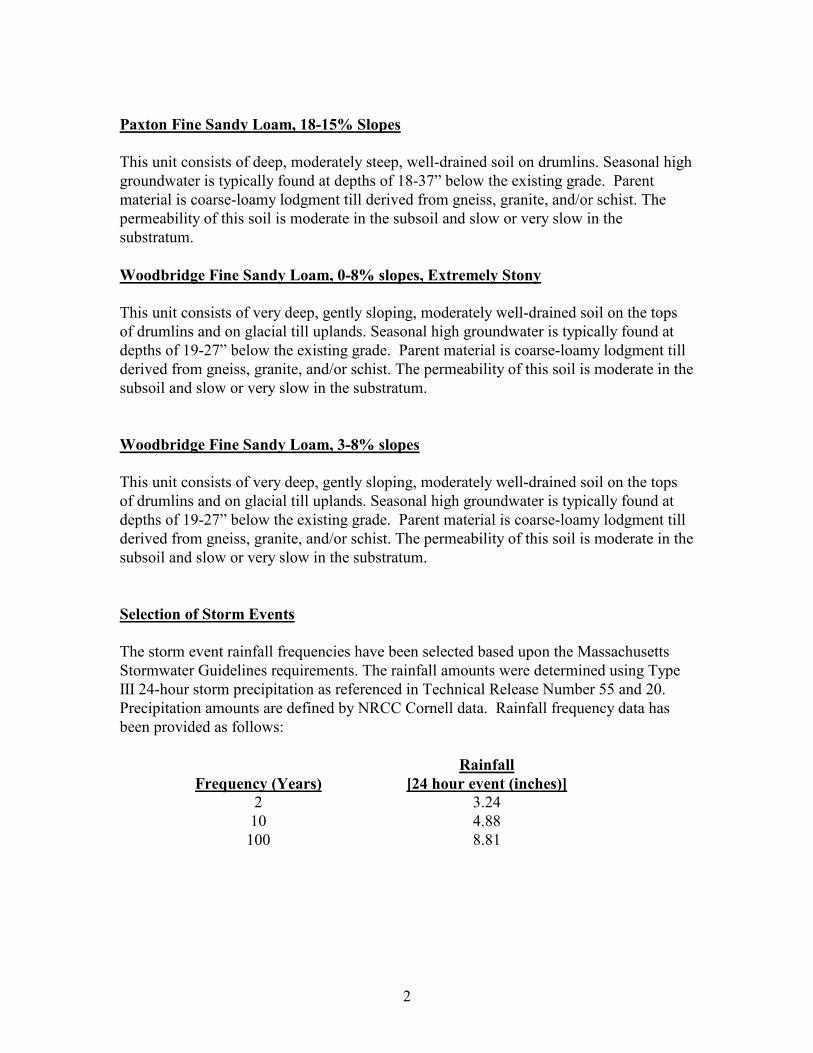
Selection of Storm Events
The storm event rainfall frequencies have been selected based upon the Massachusetts
Stormwater Guidelines requirements. The rainfall amounts were determined using Type
III 24-hour storm precipitation as referenced in Technical Release Number 55 and 20.
Precipitation amounts are defined by NRCC Cornell data. Rainfall frequency data has
been provided as follows:
Frequency (Years)
Rainfall
[24 hour event (inches)]
2 3.24
10 4.88
100 8.81

3
Existing Site Overview
The project area is bordered by undeveloped land to the east and west with agricultural
fields to the south with agricultural fields and solar farms to the north on the opposite side
of Estabrook Avenue. The majority of the area included within the drainage analysis
currently slopes west to east and east to west toward two existing resource areas. The
stormwater runoff patterns established within the pre-development conditions are based
on existing topography which indicates that the runoff flows to one (1) of two (2) design
points which are listed below:
• Design Point #1 (DP1) is the existing resource area to the west/northwest.
• Design Point #2 (DP2) is the existing resource area to the northeast.
The existing site has been broken into two (2) subcatchments as depicted on the Pre-
Development Drainage Plan. The following summarizes the various hydraulic conditions
and areas comprising the pre-hydrologic model:
• Subcatchment S1 – This is denoted as S1 on the accompanying Pre-Development
Drainage Plan. The subcatchment area consists of wooded land, meadow grass,
maintained grass areas and a dirt road. Stormwater runoff generated in this
subcatchment flows to the existing resource area to the north of the field and south
of Estabrook Avenue. (DP1).
• Subcatchment S2 – This is denoted as S2 on the accompanying Pre-Development
Drainage Plan. The subcatchment area consists of wooded land, meadow grass,
maintained grass areas and a dirt road. Stormwater runoff generated in this
subcatchment flows to the existing resource area to the west/northwest of the field
and south of Estabrook Avenue. (DP1).
Proposed Site Overview
The proposed project is comprised of the development of a solar electric generating
facility, the construction of a gravel access road, water quality swales, sedimentation
basins, inverter/transformer stations, interconnection equipment, electrical conduit, new
utility poles and risers, fencing, gates, and associated seeding and stabilization. The
existing runoff patterns will be maintained with limited selective grading. The proposed
solar facility will be installed using a screw and/or post system which minimizes impact
on the existing topography and reduces the need for excess earthwork.
A drainage system consisting of water quality swales and sedimentation basins are
proposed to provide water quality treatment for the gravel access drive as well as nitrogen
removal. Additionally, peak rates of stormwater runoff in the proposed conditions will
not result in an increase in the 2, 10, and 100-year storm events at the selected design
points.

4
The proposed site has been broken into subcatchments as depicted on the Post-
Development Drainage Plan. The following summarizes the various hydraulic conditions
and areas comprising the post-hydrologic model.
• Subcatchment 10S – This is denoted as 10S on the accompanying Pre-
Development Drainage Plan. The subcatchment area consists of wooded land,
meadow grass and “Solar Farm Seed Mix” grassed areas and “Wetmix” grassed
areas, portions of the gravel drive, water quality swale and sedimentation basin.
Stormwater runoff generated in this subcatchment flows to the existing resource
area to the north of the field and south of Estabrook Avenue. (DP1).
• Subcatchment 11S – This is denoted as 11S on the accompanying Pre-
Development Drainage Plan. The subcatchment area consists of meadow grass
and “Solar Farm Seed Mix” grassed areas and “Wetmix” grassed areas, concrete
pad, water quality swale and sedimentation basin. Stormwater runoff generated in
this subcatchment flows to the existing resource area to the north of the field and
south of Estabrook Avenue. (DP1).
• Subcatchment 20S – This is denoted as S10 on the accompanying Pre-
Development Drainage Plan. The subcatchment area consists of wooded land,
meadow grass and “Solar Farm Seed Mix” grassed areas and “Wetmix” grassed
areas, portions of the gravel drive, water quality swale and sedimentation basin.
Stormwater runoff generated in this subcatchment flows to the existing resource
area to the west/northwest of the field and south of Estabrook Avenue. (DP2).
• Subcatchment 21S – This is denoted as 11S on the accompanying Pre-
Development Drainage Plan. The subcatchment area consists of meadow grass
and “Solar Farm Seed Mix” grassed areas and “Wetmix” grassed areas, water
quality swale and sedimentation basin. Stormwater runoff generated in this
subcatchment flows to the existing resource area to the north of the field and south
of Estabrook Avenue. (DP2).

5
The following Table demonstrates the peak flows and volumes resulting from the
stormwater analysis described in this report.
STORMWATER ANALYSIS
Summary of Flows at Design Points 1 and 10
Existing Conditions (Pre) Proposed Conditions (Post)
Storm Event Peak Flow
(CFS)
Peak Flow
(CFS)
2-Year (3.24 in./hr.)
15.06
13.51
10-Year (4.88 in./hr.) 35.73 30.96
100-Year (8.81 in./hr.) 93.17 81.72
Summary of Flows at Design Points 2 and 20
Existing Conditions (Pre) Proposed Conditions (Post)
Storm Event Peak Flow
(CFS)
Peak Flow
(CFS)
2-Year (3.24 in./hr.)
12.29
8.68
10-Year (4.88 in./hr.) 29.69 20.87
100-Year (8.81 in./hr.) 79.08 66.14
∗ CFS – Cubic Feet Per Second
∗ AF – Acre Feet
Conclusion
The calculations demonstrate that the proposed development will not result in an increase
in the peak rate of stormwater runoff for the 2-year, 10-year, or 100-year 24-hour storm
events at the selected design points.
P:\6108_Estabrook_Grafton_Phase3\ADMIN\Reports\Stormwater\Stormwater\_04 6108-Stormwater.doc

EXISTING CONDITIONS
STORMWATER CALCULATIONS


1S
West/Northwest
Wetland
2S
Northern Wetland
1R
West/Northwestern
Wetland
2R
Northern Wetland
Routing Diagram for 6108_PREPrepared by Meridian Associates, Printed 7/27/2018
HydroCAD® 10.00 s/n 00814 © 2011 HydroCAD Software Solutions LLC
Subcat Reach Pond Link

6108_PRE Printed 7/27/2018Prepared by Meridian Associates
Page 2HydroCAD® 10.00 s/n 00814 © 2011 HydroCAD Software Solutions LLC
Area Listing (all nodes)
Area
(sq-ft)
CN Description
(subcatchment-numbers)
1,022,666 70 Woods, Good, HSG C (1S, 2S)
765,034 74 Pasture/grassland/range, Good, HSG C (1S, 2S)
15,268 89 Gravel roads, HSG C (1S, 2S)
1,802,968 72 TOTAL AREA

Type III 24-hr 2-Year Rainfall=3.24"6108_PRE Printed 7/27/2018Prepared by Meridian Associates
Page 3HydroCAD® 10.00 s/n 00814 © 2011 HydroCAD Software Solutions LLC
Summary for Subcatchment 1S: West/Northwest Wetland
Runoff = 15.06 cfs @ 12.24 hrs, Volume= 61,994 cf, Depth> 0.86"
Runoff by SCS TR-20 method, UH=SCS, Time Span= 5.00-20.00 hrs, dt= 0.05 hrsType III 24-hr 2-Year Rainfall=3.24"
Area (sf) CN Description
9,559 89 Gravel roads, HSG C363,247 70 Woods, Good, HSG C489,187 74 Pasture/grassland/range, Good, HSG C
861,993 72 Weighted Average861,993 100.00% Pervious Area
Tc Length Slope Velocity Capacity Description(min) (feet) (ft/ft) (ft/sec) (cfs)
8.1 50 0.0600 0.10 Sheet Flow, Sheet FlowWoods: Light underbrush n= 0.400 P2= 3.10"
5.2 537 0.0600 1.71 Shallow Concentrated Flow, Shallow Concentrated FlowShort Grass Pasture Kv= 7.0 fps
2.3 210 0.0950 1.54 Shallow Concentrated Flow, Shallow Concentrated FlowWoodland Kv= 5.0 fps
15.6 797 Total

Type III 24-hr 2-Year Rainfall=3.24"6108_PRE Printed 7/27/2018Prepared by Meridian Associates
Page 4HydroCAD® 10.00 s/n 00814 © 2011 HydroCAD Software Solutions LLC
Summary for Subcatchment 2S: Northern Wetland
Runoff = 12.29 cfs @ 12.42 hrs, Volume= 63,433 cf, Depth> 0.81"
Runoff by SCS TR-20 method, UH=SCS, Time Span= 5.00-20.00 hrs, dt= 0.05 hrsType III 24-hr 2-Year Rainfall=3.24"
Area (sf) CN Description
5,709 89 Gravel roads, HSG C659,419 70 Woods, Good, HSG C275,847 74 Pasture/grassland/range, Good, HSG C
940,975 71 Weighted Average940,975 100.00% Pervious Area
Tc Length Slope Velocity Capacity Description(min) (feet) (ft/ft) (ft/sec) (cfs)
9.5 50 0.0400 0.09 Sheet Flow, Sheet FlowWoods: Light underbrush n= 0.400 P2= 3.10"
12.9 840 0.0470 1.08 Shallow Concentrated Flow, Shallow Concentrated FlowWoodland Kv= 5.0 fps
0.1 35 0.5700 5.28 Shallow Concentrated Flow, Shallow Concentrated FlowShort Grass Pasture Kv= 7.0 fps
2.3 140 0.0430 1.04 Shallow Concentrated Flow, Shallow Concentrated FlowWoodland Kv= 5.0 fps
0.7 87 0.0920 2.12 Shallow Concentrated Flow, Shallow Concentrated FlowShort Grass Pasture Kv= 7.0 fps
1.7 155 0.0900 1.50 Shallow Concentrated Flow, Shallow Concentrated FlowWoodland Kv= 5.0 fps
27.2 1,307 Total

Type III 24-hr 2-Year Rainfall=3.24"6108_PRE Printed 7/27/2018Prepared by Meridian Associates
Page 5HydroCAD® 10.00 s/n 00814 © 2011 HydroCAD Software Solutions LLC
Summary for Reach 1R: West/Northwestern Wetland
Inflow Area = 861,993 sf, 0.00% Impervious, Inflow Depth > 0.86" for 2-Year eventInflow = 15.06 cfs @ 12.24 hrs, Volume= 61,994 cfOutflow = 15.06 cfs @ 12.24 hrs, Volume= 61,994 cf, Atten= 0%, Lag= 0.0 min
Routing by Stor-Ind+Trans method, Time Span= 5.00-20.00 hrs, dt= 0.05 hrs

Type III 24-hr 2-Year Rainfall=3.24"6108_PRE Printed 7/27/2018Prepared by Meridian Associates
Page 6HydroCAD® 10.00 s/n 00814 © 2011 HydroCAD Software Solutions LLC
Summary for Reach 2R: Northern Wetland
Inflow Area = 940,975 sf, 0.00% Impervious, Inflow Depth > 0.81" for 2-Year eventInflow = 12.29 cfs @ 12.42 hrs, Volume= 63,433 cfOutflow = 12.29 cfs @ 12.42 hrs, Volume= 63,433 cf, Atten= 0%, Lag= 0.0 min
Routing by Stor-Ind+Trans method, Time Span= 5.00-20.00 hrs, dt= 0.05 hrs

Type III 24-hr 10-Year Rainfall=4.88"6108_PRE Printed 7/27/2018Prepared by Meridian Associates
Page 7HydroCAD® 10.00 s/n 00814 © 2011 HydroCAD Software Solutions LLC
Summary for Subcatchment 1S: West/Northwest Wetland
Runoff = 35.73 cfs @ 12.22 hrs, Volume= 139,113 cf, Depth> 1.94"
Runoff by SCS TR-20 method, UH=SCS, Time Span= 5.00-20.00 hrs, dt= 0.05 hrsType III 24-hr 10-Year Rainfall=4.88"
Area (sf) CN Description
9,559 89 Gravel roads, HSG C363,247 70 Woods, Good, HSG C489,187 74 Pasture/grassland/range, Good, HSG C
861,993 72 Weighted Average861,993 100.00% Pervious Area
Tc Length Slope Velocity Capacity Description(min) (feet) (ft/ft) (ft/sec) (cfs)
8.1 50 0.0600 0.10 Sheet Flow, Sheet FlowWoods: Light underbrush n= 0.400 P2= 3.10"
5.2 537 0.0600 1.71 Shallow Concentrated Flow, Shallow Concentrated FlowShort Grass Pasture Kv= 7.0 fps
2.3 210 0.0950 1.54 Shallow Concentrated Flow, Shallow Concentrated FlowWoodland Kv= 5.0 fps
15.6 797 Total

Type III 24-hr 10-Year Rainfall=4.88"6108_PRE Printed 7/27/2018Prepared by Meridian Associates
Page 8HydroCAD® 10.00 s/n 00814 © 2011 HydroCAD Software Solutions LLC
Summary for Subcatchment 2S: Northern Wetland
Runoff = 29.69 cfs @ 12.40 hrs, Volume= 145,189 cf, Depth> 1.85"
Runoff by SCS TR-20 method, UH=SCS, Time Span= 5.00-20.00 hrs, dt= 0.05 hrsType III 24-hr 10-Year Rainfall=4.88"
Area (sf) CN Description
5,709 89 Gravel roads, HSG C659,419 70 Woods, Good, HSG C275,847 74 Pasture/grassland/range, Good, HSG C
940,975 71 Weighted Average940,975 100.00% Pervious Area
Tc Length Slope Velocity Capacity Description(min) (feet) (ft/ft) (ft/sec) (cfs)
9.5 50 0.0400 0.09 Sheet Flow, Sheet FlowWoods: Light underbrush n= 0.400 P2= 3.10"
12.9 840 0.0470 1.08 Shallow Concentrated Flow, Shallow Concentrated FlowWoodland Kv= 5.0 fps
0.1 35 0.5700 5.28 Shallow Concentrated Flow, Shallow Concentrated FlowShort Grass Pasture Kv= 7.0 fps
2.3 140 0.0430 1.04 Shallow Concentrated Flow, Shallow Concentrated FlowWoodland Kv= 5.0 fps
0.7 87 0.0920 2.12 Shallow Concentrated Flow, Shallow Concentrated FlowShort Grass Pasture Kv= 7.0 fps
1.7 155 0.0900 1.50 Shallow Concentrated Flow, Shallow Concentrated FlowWoodland Kv= 5.0 fps
27.2 1,307 Total

Type III 24-hr 10-Year Rainfall=4.88"6108_PRE Printed 7/27/2018Prepared by Meridian Associates
Page 9HydroCAD® 10.00 s/n 00814 © 2011 HydroCAD Software Solutions LLC
Summary for Reach 1R: West/Northwestern Wetland
Inflow Area = 861,993 sf, 0.00% Impervious, Inflow Depth > 1.94" for 10-Year eventInflow = 35.73 cfs @ 12.22 hrs, Volume= 139,113 cfOutflow = 35.73 cfs @ 12.22 hrs, Volume= 139,113 cf, Atten= 0%, Lag= 0.0 min
Routing by Stor-Ind+Trans method, Time Span= 5.00-20.00 hrs, dt= 0.05 hrs

Type III 24-hr 10-Year Rainfall=4.88"6108_PRE Printed 7/27/2018Prepared by Meridian Associates
Page 10HydroCAD® 10.00 s/n 00814 © 2011 HydroCAD Software Solutions LLC
Summary for Reach 2R: Northern Wetland
Inflow Area = 940,975 sf, 0.00% Impervious, Inflow Depth > 1.85" for 10-Year eventInflow = 29.69 cfs @ 12.40 hrs, Volume= 145,189 cfOutflow = 29.69 cfs @ 12.40 hrs, Volume= 145,189 cf, Atten= 0%, Lag= 0.0 min
Routing by Stor-Ind+Trans method, Time Span= 5.00-20.00 hrs, dt= 0.05 hrs

Type III 24-hr 100-Year Rainfall=8.81"6108_PRE Printed 7/27/2018Prepared by Meridian Associates
Page 11HydroCAD® 10.00 s/n 00814 © 2011 HydroCAD Software Solutions LLC
Summary for Subcatchment 1S: West/Northwest Wetland
Runoff = 93.17 cfs @ 12.21 hrs, Volume= 362,934 cf, Depth> 5.05"
Runoff by SCS TR-20 method, UH=SCS, Time Span= 5.00-20.00 hrs, dt= 0.05 hrsType III 24-hr 100-Year Rainfall=8.81"
Area (sf) CN Description
9,559 89 Gravel roads, HSG C363,247 70 Woods, Good, HSG C489,187 74 Pasture/grassland/range, Good, HSG C
861,993 72 Weighted Average861,993 100.00% Pervious Area
Tc Length Slope Velocity Capacity Description(min) (feet) (ft/ft) (ft/sec) (cfs)
8.1 50 0.0600 0.10 Sheet Flow, Sheet FlowWoods: Light underbrush n= 0.400 P2= 3.10"
5.2 537 0.0600 1.71 Shallow Concentrated Flow, Shallow Concentrated FlowShort Grass Pasture Kv= 7.0 fps
2.3 210 0.0950 1.54 Shallow Concentrated Flow, Shallow Concentrated FlowWoodland Kv= 5.0 fps
15.6 797 Total

Type III 24-hr 100-Year Rainfall=8.81"6108_PRE Printed 7/27/2018Prepared by Meridian Associates
Page 12HydroCAD® 10.00 s/n 00814 © 2011 HydroCAD Software Solutions LLC
Summary for Subcatchment 2S: Northern Wetland
Runoff = 79.08 cfs @ 12.37 hrs, Volume= 385,403 cf, Depth> 4.91"
Runoff by SCS TR-20 method, UH=SCS, Time Span= 5.00-20.00 hrs, dt= 0.05 hrsType III 24-hr 100-Year Rainfall=8.81"
Area (sf) CN Description
5,709 89 Gravel roads, HSG C659,419 70 Woods, Good, HSG C275,847 74 Pasture/grassland/range, Good, HSG C
940,975 71 Weighted Average940,975 100.00% Pervious Area
Tc Length Slope Velocity Capacity Description(min) (feet) (ft/ft) (ft/sec) (cfs)
9.5 50 0.0400 0.09 Sheet Flow, Sheet FlowWoods: Light underbrush n= 0.400 P2= 3.10"
12.9 840 0.0470 1.08 Shallow Concentrated Flow, Shallow Concentrated FlowWoodland Kv= 5.0 fps
0.1 35 0.5700 5.28 Shallow Concentrated Flow, Shallow Concentrated FlowShort Grass Pasture Kv= 7.0 fps
2.3 140 0.0430 1.04 Shallow Concentrated Flow, Shallow Concentrated FlowWoodland Kv= 5.0 fps
0.7 87 0.0920 2.12 Shallow Concentrated Flow, Shallow Concentrated FlowShort Grass Pasture Kv= 7.0 fps
1.7 155 0.0900 1.50 Shallow Concentrated Flow, Shallow Concentrated FlowWoodland Kv= 5.0 fps
27.2 1,307 Total

Type III 24-hr 100-Year Rainfall=8.81"6108_PRE Printed 7/27/2018Prepared by Meridian Associates
Page 13HydroCAD® 10.00 s/n 00814 © 2011 HydroCAD Software Solutions LLC
Summary for Reach 1R: West/Northwestern Wetland
Inflow Area = 861,993 sf, 0.00% Impervious, Inflow Depth > 5.05" for 100-Year eventInflow = 93.17 cfs @ 12.21 hrs, Volume= 362,934 cfOutflow = 93.17 cfs @ 12.21 hrs, Volume= 362,934 cf, Atten= 0%, Lag= 0.0 min
Routing by Stor-Ind+Trans method, Time Span= 5.00-20.00 hrs, dt= 0.05 hrs

Type III 24-hr 100-Year Rainfall=8.81"6108_PRE Printed 7/27/2018Prepared by Meridian Associates
Page 14HydroCAD® 10.00 s/n 00814 © 2011 HydroCAD Software Solutions LLC
Summary for Reach 2R: Northern Wetland
Inflow Area = 940,975 sf, 0.00% Impervious, Inflow Depth > 4.91" for 100-Year eventInflow = 79.08 cfs @ 12.37 hrs, Volume= 385,403 cfOutflow = 79.08 cfs @ 12.37 hrs, Volume= 385,403 cf, Atten= 0%, Lag= 0.0 min
Routing by Stor-Ind+Trans method, Time Span= 5.00-20.00 hrs, dt= 0.05 hrs
PROPOSED CONDITIONS
STORMWATER CALCULATIONS


10S
West/Northwestern
Wetland
11S
To Swale
20S
Northern Wetland
21S
To Swale
10R
West/Northwestern
Wetland
11R
Southern Swale
20R
Northern Wetland
21R
Northern Swale
11P
Sedimentation Basin
21P
Sedimentation Basin
Routing Diagram for 6108_POSTPrepared by Meridian Associates, Printed 7/12/2019
HydroCAD® 10.00 s/n 00814 © 2011 HydroCAD Software Solutions LLC
Subcat Reach Pond Link

6108_POST Printed 7/12/2019Prepared by Meridian Associates
Page 2HydroCAD® 10.00 s/n 00814 © 2011 HydroCAD Software Solutions LLC
Area Listing (all nodes)
Area
(sq-ft)
CN Description
(subcatchment-numbers)
559,656 70 Woods, Good, HSG C (10S, 20S, 21S)
1,191,894 74 Pasture/grassland/range, Good, HSG C (10S, 11S, 20S, 21S)
36,154 89 Gravel roads, HSG C (11S, 20S, 21S)
13,400 96 Gravel surface, HSG C (10S)
1,864 98 Proposed Concrete ESS Pad, HSG C (11S)
1,802,968 73 TOTAL AREA

Type III 24-hr 2-Year Rainfall=3.24"6108_POST Printed 7/12/2019Prepared by Meridian Associates
Page 3HydroCAD® 10.00 s/n 00814 © 2011 HydroCAD Software Solutions LLC
Summary for Subcatchment 10S: West/Northwestern Wetland
Runoff = 13.51 cfs @ 12.15 hrs, Volume= 51,407 cf, Depth> 1.01"
Runoff by SCS TR-20 method, UH=SCS, Time Span= 5.00-24.00 hrs, dt= 0.05 hrsType III 24-hr 2-Year Rainfall=3.24"
Area (sf) CN Description
13,400 96 Gravel surface, HSG C232,366 70 Woods, Good, HSG C367,334 74 Pasture/grassland/range, Good, HSG C
613,100 73 Weighted Average613,100 100.00% Pervious Area
Tc Length Slope Velocity Capacity Description(min) (feet) (ft/ft) (ft/sec) (cfs)
5.4 50 0.0600 0.16 Sheet Flow, Sheet FlowGrass: Dense n= 0.240 P2= 3.10"
4.5 577 0.0919 2.12 Shallow Concentrated Flow, Shallow Concentrated FlowShort Grass Pasture Kv= 7.0 fps
9.9 627 Total
Summary for Subcatchment 11S: To Swale
Runoff = 4.60 cfs @ 12.29 hrs, Volume= 21,963 cf, Depth> 1.06"
Runoff by SCS TR-20 method, UH=SCS, Time Span= 5.00-24.00 hrs, dt= 0.05 hrsType III 24-hr 2-Year Rainfall=3.24"
Area (sf) CN Description
245,679 74 Pasture/grassland/range, Good, HSG C* 1,864 98 Proposed Concrete ESS Pad, HSG C
1,350 89 Gravel roads, HSG C
248,893 74 Weighted Average247,029 99.25% Pervious Area
1,864 0.75% Impervious Area
Tc Length Slope Velocity Capacity Description(min) (feet) (ft/ft) (ft/sec) (cfs)
5.4 50 0.0600 0.16 Sheet Flow, Sheet FlowGrass: Dense n= 0.240 P2= 3.10"
13.7 1,150 0.0400 1.40 Shallow Concentrated Flow, Shallow Concentrated FlowShort Grass Pasture Kv= 7.0 fps
19.1 1,200 Total

Type III 24-hr 2-Year Rainfall=3.24"6108_POST Printed 7/12/2019Prepared by Meridian Associates
Page 4HydroCAD® 10.00 s/n 00814 © 2011 HydroCAD Software Solutions LLC
Summary for Subcatchment 20S: Northern Wetland
Runoff = 8.68 cfs @ 12.28 hrs, Volume= 41,991 cf, Depth> 0.95"
Runoff by SCS TR-20 method, UH=SCS, Time Span= 5.00-24.00 hrs, dt= 0.05 hrsType III 24-hr 2-Year Rainfall=3.24"
Area (sf) CN Description
6,690 89 Gravel roads, HSG C313,580 70 Woods, Good, HSG C210,154 74 Pasture/grassland/range, Good, HSG C
530,424 72 Weighted Average530,424 100.00% Pervious Area
Tc Length Slope Velocity Capacity Description(min) (feet) (ft/ft) (ft/sec) (cfs)
9.5 50 0.0400 0.09 Sheet Flow, Sheet FlowWoods: Light underbrush n= 0.400 P2= 3.10"
9.0 775 0.0826 1.44 Shallow Concentrated Flow, Shallow Concentrated FlowWoodland Kv= 5.0 fps
18.5 825 Total
Summary for Subcatchment 21S: To Swale
Runoff = 7.32 cfs @ 12.37 hrs, Volume= 38,124 cf, Depth> 1.11"
Runoff by SCS TR-20 method, UH=SCS, Time Span= 5.00-24.00 hrs, dt= 0.05 hrsType III 24-hr 2-Year Rainfall=3.24"
Area (sf) CN Description
28,114 89 Gravel roads, HSG C368,727 74 Pasture/grassland/range, Good, HSG C13,710 70 Woods, Good, HSG C
410,551 75 Weighted Average410,551 100.00% Pervious Area
Tc Length Slope Velocity Capacity Description(min) (feet) (ft/ft) (ft/sec) (cfs)
9.5 50 0.0400 0.09 Sheet Flow, Sheet FlowWoods: Light underbrush n= 0.400 P2= 3.10"
7.4 310 0.0194 0.70 Shallow Concentrated Flow, Shallow Concentrated FlowWoodland Kv= 5.0 fps
7.3 748 0.0598 1.71 Shallow Concentrated Flow, Shallow Concentrated FlowShort Grass Pasture Kv= 7.0 fps
0.1 20 0.0900 4.83 Shallow Concentrated Flow, Shallow Concentrated FlowUnpaved Kv= 16.1 fps
0.1 17 0.1100 2.32 Shallow Concentrated Flow, Shallow Concentrated FlowShort Grass Pasture Kv= 7.0 fps
24.4 1,145 Total

Type III 24-hr 2-Year Rainfall=3.24"6108_POST Printed 7/12/2019Prepared by Meridian Associates
Page 5HydroCAD® 10.00 s/n 00814 © 2011 HydroCAD Software Solutions LLC
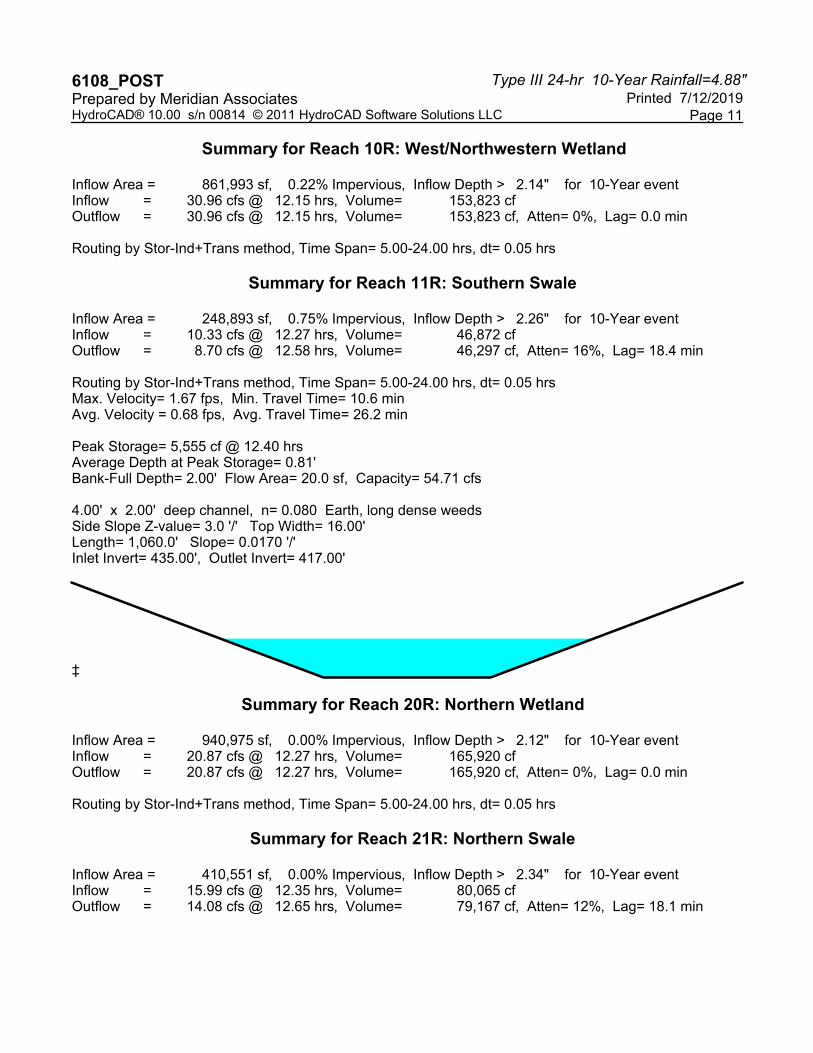
Summary for Reach 10R: West/Northwestern Wetland
Inflow Area = 861,993 sf, 0.22% Impervious, Inflow Depth > 0.97" for 2-Year eventInflow = 13.51 cfs @ 12.15 hrs, Volume= 69,467 cfOutflow = 13.51 cfs @ 12.15 hrs, Volume= 69,467 cf, Atten= 0%, Lag= 0.0 min
Routing by Stor-Ind+Trans method, Time Span= 5.00-24.00 hrs, dt= 0.05 hrs
Summary for Reach 11R: Southern Swale
Inflow Area = 248,893 sf, 0.75% Impervious, Inflow Depth > 1.06" for 2-Year eventInflow = 4.60 cfs @ 12.29 hrs, Volume= 21,963 cfOutflow = 3.65 cfs @ 12.69 hrs, Volume= 21,561 cf, Atten= 21%, Lag= 24.1 min
Routing by Stor-Ind+Trans method, Time Span= 5.00-24.00 hrs, dt= 0.05 hrsMax. Velocity= 1.30 fps, Min. Travel Time= 13.6 minAvg. Velocity = 0.56 fps, Avg. Travel Time= 31.7 min
Peak Storage= 3,002 cf @ 12.46 hrsAverage Depth at Peak Storage= 0.51'Bank-Full Depth= 2.00' Flow Area= 20.0 sf, Capacity= 54.71 cfs
4.00' x 2.00' deep channel, n= 0.080 Earth, long dense weedsSide Slope Z-value= 3.0 '/' Top Width= 16.00'Length= 1,060.0' Slope= 0.0170 '/'Inlet Invert= 435.00', Outlet Invert= 417.00'
‡
Summary for Reach 20R: Northern Wetland
Inflow Area = 940,975 sf, 0.00% Impervious, Inflow Depth > 0.95" for 2-Year eventInflow = 8.68 cfs @ 12.28 hrs, Volume= 74,314 cfOutflow = 8.68 cfs @ 12.28 hrs, Volume= 74,314 cf, Atten= 0%, Lag= 0.0 min
Routing by Stor-Ind+Trans method, Time Span= 5.00-24.00 hrs, dt= 0.05 hrs
Summary for Reach 21R: Northern Swale
Inflow Area = 410,551 sf, 0.00% Impervious, Inflow Depth > 1.11" for 2-Year eventInflow = 7.32 cfs @ 12.37 hrs, Volume= 38,124 cfOutflow = 6.15 cfs @ 12.75 hrs, Volume= 37,495 cf, Atten= 16%, Lag= 22.9 min

Type III 24-hr 2-Year Rainfall=3.24"6108_POST Printed 7/12/2019Prepared by Meridian Associates
Page 6HydroCAD® 10.00 s/n 00814 © 2011 HydroCAD Software Solutions LLC
Routing by Stor-Ind+Trans method, Time Span= 5.00-24.00 hrs, dt= 0.05 hrsMax. Velocity= 1.45 fps, Min. Travel Time= 12.9 minAvg. Velocity = 0.64 fps, Avg. Travel Time= 29.3 min
Peak Storage= 4,786 cf @ 12.53 hrsAverage Depth at Peak Storage= 0.70'Bank-Full Depth= 2.00' Flow Area= 20.0 sf, Capacity= 51.61 cfs
4.00' x 2.00' deep channel, n= 0.080 Earth, long dense weedsSide Slope Z-value= 3.0 '/' Top Width= 16.00'Length= 1,125.0' Slope= 0.0151 '/'Inlet Invert= 433.00', Outlet Invert= 416.00'
‡
Summary for Pond 11P: Sedimentation Basin
Inflow Area = 248,893 sf, 0.75% Impervious, Inflow Depth > 1.04" for 2-Year eventInflow = 3.65 cfs @ 12.69 hrs, Volume= 21,561 cfOutflow = 1.58 cfs @ 13.25 hrs, Volume= 18,060 cf, Atten= 57%, Lag= 33.6 minPrimary = 1.58 cfs @ 13.25 hrs, Volume= 18,060 cfSecondary = 0.00 cfs @ 5.00 hrs, Volume= 0 cf
Routing by Stor-Ind method, Time Span= 5.00-24.00 hrs, dt= 0.05 hrsPeak Elev= 415.15' @ 13.25 hrs Surf.Area= 4,916 sf Storage= 6,941 cf
Plug-Flow detention time= 131.8 min calculated for 18,013 cf (84% of inflow)Center-of-Mass det. time= 65.7 min ( 963.1 - 897.5 )
Volume Invert Avail.Storage Storage Description
#1 413.00' 25,189 cf Custom Stage Data (Prismatic) Listed below (Recalc)
Elevation Surf.Area Inc.Store Cum.Store(feet) (sq-ft) (cubic-feet) (cubic-feet)
413.00 0 0 0414.00 3,817 1,909 1,909416.00 5,725 9,542 11,451418.00 8,013 13,738 25,189
Device Routing Invert Outlet Devices
#1 Primary 414.00' 18.0" Round 18" Culvert L= 414.0' CPP, square edge headwall, Ke= 0.500 Inlet / Outlet Invert= 414.00' / 414.00' S= 0.0000 '/' Cc= 0.900 n= 0.013 Corrugated PE, smooth interior, Flow Area= 1.77 sf
#2 Device 1 414.00' 4.0" Vert. 4" Vertical Orifice/Grate C= 0.600 #3 Device 1 414.50' 12.0" Vert. 12" Vertical Orifice/Grate C= 0.600

Type III 24-hr 2-Year Rainfall=3.24"6108_POST Printed 7/12/2019Prepared by Meridian Associates
Page 7HydroCAD® 10.00 s/n 00814 © 2011 HydroCAD Software Solutions LLC
#4 Secondary 416.50' 22.0' long x 10.0' breadth Broad-Crested Rectangular Weir Head (feet) 0.20 0.40 0.60 0.80 1.00 1.20 1.40 1.60 Coef. (English) 2.49 2.56 2.70 2.69 2.68 2.69 2.67 2.64
Primary OutFlow Max=1.58 cfs @ 13.25 hrs HW=415.15' (Free Discharge)1=18" Culvert (Barrel Controls 1.58 cfs @ 1.50 fps)
2=4" Vertical Orifice/Grate (Passes < 0.42 cfs potential flow)3=12" Vertical Orifice/Grate (Passes < 1.49 cfs potential flow)
Secondary OutFlow Max=0.00 cfs @ 5.00 hrs HW=413.00' (Free Discharge)4=Broad-Crested Rectangular Weir ( Controls 0.00 cfs)
Summary for Pond 21P: Sedimentation Basin
Inflow Area = 410,551 sf, 0.00% Impervious, Inflow Depth > 1.10" for 2-Year eventInflow = 6.15 cfs @ 12.75 hrs, Volume= 37,495 cfOutflow = 3.63 cfs @ 13.16 hrs, Volume= 32,323 cf, Atten= 41%, Lag= 24.7 minPrimary = 3.63 cfs @ 13.16 hrs, Volume= 32,323 cfSecondary = 0.00 cfs @ 5.00 hrs, Volume= 0 cf
Routing by Stor-Ind method, Time Span= 5.00-24.00 hrs, dt= 0.05 hrsPeak Elev= 415.42' @ 13.16 hrs Surf.Area= 6,356 sf Storage= 10,576 cf
Plug-Flow detention time= 113.2 min calculated for 32,323 cf (86% of inflow)Center-of-Mass det. time= 54.5 min ( 951.2 - 896.8 )
Volume Invert Avail.Storage Storage Description
#1 413.00' 30,351 cf Custom Stage Data (Prismatic) Listed below (Recalc)
Elevation Surf.Area Inc.Store Cum.Store(feet) (sq-ft) (cubic-feet) (cubic-feet)
413.00 0 0 0414.00 5,010 2,505 2,505416.00 6,905 11,915 14,420418.00 9,026 15,931 30,351
Device Routing Invert Outlet Devices
#1 Primary 414.00' 24.0" Round 24" Culvert L= 35.0' CPP, square edge headwall, Ke= 0.500 Inlet / Outlet Invert= 414.00' / 414.00' S= 0.0000 '/' Cc= 0.900 n= 0.013 Corrugated PE, smooth interior, Flow Area= 3.14 sf
#2 Device 1 414.00' 4.0" Vert. 4" Verical Orifice/Grate C= 0.600 #3 Device 1 414.50' 12.0" Vert. 12" Vertical Orifice/Grate C= 0.600 #4 Device 1 415.00' 12.0" Vert. 12" Orifice/Grate C= 0.600 #5 Device 1 415.80' 18.0" Vert. 18" Vertical Orifice/Grate C= 0.600 #6 Secondary 416.50' 22.0' long x 10.0' breadth Broad-Crested Rectangular Weir
Head (feet) 0.20 0.40 0.60 0.80 1.00 1.20 1.40 1.60 Coef. (English) 2.49 2.56 2.70 2.69 2.68 2.69 2.67 2.64

Type III 24-hr 2-Year Rainfall=3.24"6108_POST Printed 7/12/2019Prepared by Meridian Associates
Page 8HydroCAD® 10.00 s/n 00814 © 2011 HydroCAD Software Solutions LLC
Primary OutFlow Max=3.63 cfs @ 13.16 hrs HW=415.42' (Free Discharge)1=24" Culvert (Passes 3.63 cfs of 5.87 cfs potential flow)
2=4" Verical Orifice/Grate (Orifice Controls 0.47 cfs @ 5.39 fps)3=12" Vertical Orifice/Grate (Orifice Controls 2.47 cfs @ 3.26 fps)4=12" Orifice/Grate (Orifice Controls 0.69 cfs @ 2.21 fps)5=18" Vertical Orifice/Grate ( Controls 0.00 cfs)
Secondary OutFlow Max=0.00 cfs @ 5.00 hrs HW=413.00' (Free Discharge)6=Broad-Crested Rectangular Weir ( Controls 0.00 cfs)

Type III 24-hr 10-Year Rainfall=4.88"6108_POST Printed 7/12/2019Prepared by Meridian Associates
Page 9HydroCAD® 10.00 s/n 00814 © 2011 HydroCAD Software Solutions LLC
Summary for Subcatchment 10S: West/Northwestern Wetland
Runoff = 30.95 cfs @ 12.15 hrs, Volume= 111,512 cf, Depth> 2.18"
Runoff by SCS TR-20 method, UH=SCS, Time Span= 5.00-24.00 hrs, dt= 0.05 hrsType III 24-hr 10-Year Rainfall=4.88"
Area (sf) CN Description
13,400 96 Gravel surface, HSG C232,366 70 Woods, Good, HSG C367,334 74 Pasture/grassland/range, Good, HSG C
613,100 73 Weighted Average613,100 100.00% Pervious Area
Tc Length Slope Velocity Capacity Description(min) (feet) (ft/ft) (ft/sec) (cfs)
5.4 50 0.0600 0.16 Sheet Flow, Sheet FlowGrass: Dense n= 0.240 P2= 3.10"
4.5 577 0.0919 2.12 Shallow Concentrated Flow, Shallow Concentrated FlowShort Grass Pasture Kv= 7.0 fps
9.9 627 Total
Summary for Subcatchment 11S: To Swale
Runoff = 10.33 cfs @ 12.27 hrs, Volume= 46,872 cf, Depth> 2.26"
Runoff by SCS TR-20 method, UH=SCS, Time Span= 5.00-24.00 hrs, dt= 0.05 hrsType III 24-hr 10-Year Rainfall=4.88"
Area (sf) CN Description
245,679 74 Pasture/grassland/range, Good, HSG C* 1,864 98 Proposed Concrete ESS Pad, HSG C
1,350 89 Gravel roads, HSG C
248,893 74 Weighted Average247,029 99.25% Pervious Area
1,864 0.75% Impervious Area
Tc Length Slope Velocity Capacity Description(min) (feet) (ft/ft) (ft/sec) (cfs)
5.4 50 0.0600 0.16 Sheet Flow, Sheet FlowGrass: Dense n= 0.240 P2= 3.10"
13.7 1,150 0.0400 1.40 Shallow Concentrated Flow, Shallow Concentrated FlowShort Grass Pasture Kv= 7.0 fps
19.1 1,200 Total

Type III 24-hr 10-Year Rainfall=4.88"6108_POST Printed 7/12/2019Prepared by Meridian Associates
Page 10HydroCAD® 10.00 s/n 00814 © 2011 HydroCAD Software Solutions LLC
Summary for Subcatchment 20S: Northern Wetland
Runoff = 20.56 cfs @ 12.27 hrs, Volume= 92,711 cf, Depth> 2.10"
Runoff by SCS TR-20 method, UH=SCS, Time Span= 5.00-24.00 hrs, dt= 0.05 hrsType III 24-hr 10-Year Rainfall=4.88"
Area (sf) CN Description
6,690 89 Gravel roads, HSG C313,580 70 Woods, Good, HSG C210,154 74 Pasture/grassland/range, Good, HSG C
530,424 72 Weighted Average530,424 100.00% Pervious Area
Tc Length Slope Velocity Capacity Description(min) (feet) (ft/ft) (ft/sec) (cfs)
9.5 50 0.0400 0.09 Sheet Flow, Sheet FlowWoods: Light underbrush n= 0.400 P2= 3.10"
9.0 775 0.0826 1.44 Shallow Concentrated Flow, Shallow Concentrated FlowWoodland Kv= 5.0 fps
18.5 825 Total
Summary for Subcatchment 21S: To Swale
Runoff = 15.99 cfs @ 12.35 hrs, Volume= 80,065 cf, Depth> 2.34"
Runoff by SCS TR-20 method, UH=SCS, Time Span= 5.00-24.00 hrs, dt= 0.05 hrsType III 24-hr 10-Year Rainfall=4.88"
Area (sf) CN Description
28,114 89 Gravel roads, HSG C368,727 74 Pasture/grassland/range, Good, HSG C13,710 70 Woods, Good, HSG C
410,551 75 Weighted Average410,551 100.00% Pervious Area
Tc Length Slope Velocity Capacity Description(min) (feet) (ft/ft) (ft/sec) (cfs)
9.5 50 0.0400 0.09 Sheet Flow, Sheet FlowWoods: Light underbrush n= 0.400 P2= 3.10"
7.4 310 0.0194 0.70 Shallow Concentrated Flow, Shallow Concentrated FlowWoodland Kv= 5.0 fps
7.3 748 0.0598 1.71 Shallow Concentrated Flow, Shallow Concentrated FlowShort Grass Pasture Kv= 7.0 fps
0.1 20 0.0900 4.83 Shallow Concentrated Flow, Shallow Concentrated FlowUnpaved Kv= 16.1 fps
0.1 17 0.1100 2.32 Shallow Concentrated Flow, Shallow Concentrated FlowShort Grass Pasture Kv= 7.0 fps
24.4 1,145 Total
Type III 24-hr 10-Year Rainfall=4.88"6108_POST Printed 7/12/2019Prepared by Meridian Associates
Page 11HydroCAD® 10.00 s/n 00814 © 2011 HydroCAD Software Solutions LLC
Summary for Reach 10R: West/Northwestern Wetland
Inflow Area = 861,993 sf, 0.22% Impervious, Inflow Depth > 2.14" for 10-Year eventInflow = 30.96 cfs @ 12.15 hrs, Volume= 153,823 cfOutflow = 30.96 cfs @ 12.15 hrs, Volume= 153,823 cf, Atten= 0%, Lag= 0.0 min
Routing by Stor-Ind+Trans method, Time Span= 5.00-24.00 hrs, dt= 0.05 hrs
Summary for Reach 11R: Southern Swale
Inflow Area = 248,893 sf, 0.75% Impervious, Inflow Depth > 2.26" for 10-Year eventInflow = 10.33 cfs @ 12.27 hrs, Volume= 46,872 cfOutflow = 8.70 cfs @ 12.58 hrs, Volume= 46,297 cf, Atten= 16%, Lag= 18.4 min
Routing by Stor-Ind+Trans method, Time Span= 5.00-24.00 hrs, dt= 0.05 hrsMax. Velocity= 1.67 fps, Min. Travel Time= 10.6 minAvg. Velocity = 0.68 fps, Avg. Travel Time= 26.2 min
Peak Storage= 5,555 cf @ 12.40 hrsAverage Depth at Peak Storage= 0.81'Bank-Full Depth= 2.00' Flow Area= 20.0 sf, Capacity= 54.71 cfs
4.00' x 2.00' deep channel, n= 0.080 Earth, long dense weedsSide Slope Z-value= 3.0 '/' Top Width= 16.00'Length= 1,060.0' Slope= 0.0170 '/'Inlet Invert= 435.00', Outlet Invert= 417.00'
‡
Summary for Reach 20R: Northern Wetland
Inflow Area = 940,975 sf, 0.00% Impervious, Inflow Depth > 2.12" for 10-Year eventInflow = 20.87 cfs @ 12.27 hrs, Volume= 165,920 cfOutflow = 20.87 cfs @ 12.27 hrs, Volume= 165,920 cf, Atten= 0%, Lag= 0.0 min
Routing by Stor-Ind+Trans method, Time Span= 5.00-24.00 hrs, dt= 0.05 hrs
Summary for Reach 21R: Northern Swale
Inflow Area = 410,551 sf, 0.00% Impervious, Inflow Depth > 2.34" for 10-Year eventInflow = 15.99 cfs @ 12.35 hrs, Volume= 80,065 cfOutflow = 14.08 cfs @ 12.65 hrs, Volume= 79,167 cf, Atten= 12%, Lag= 18.1 min

Type III 24-hr 10-Year Rainfall=4.88"6108_POST Printed 7/12/2019Prepared by Meridian Associates
Page 12HydroCAD® 10.00 s/n 00814 © 2011 HydroCAD Software Solutions LLC
Routing by Stor-Ind+Trans method, Time Span= 5.00-24.00 hrs, dt= 0.05 hrsMax. Velocity= 1.83 fps, Min. Travel Time= 10.3 minAvg. Velocity = 0.77 fps, Avg. Travel Time= 24.3 min
Peak Storage= 8,699 cf @ 12.47 hrsAverage Depth at Peak Storage= 1.07'Bank-Full Depth= 2.00' Flow Area= 20.0 sf, Capacity= 51.61 cfs
4.00' x 2.00' deep channel, n= 0.080 Earth, long dense weedsSide Slope Z-value= 3.0 '/' Top Width= 16.00'Length= 1,125.0' Slope= 0.0151 '/'Inlet Invert= 433.00', Outlet Invert= 416.00'
‡
Summary for Pond 11P: Sedimentation Basin
Inflow Area = 248,893 sf, 0.75% Impervious, Inflow Depth > 2.23" for 10-Year eventInflow = 8.70 cfs @ 12.58 hrs, Volume= 46,297 cfOutflow = 4.45 cfs @ 13.00 hrs, Volume= 42,311 cf, Atten= 49%, Lag= 25.2 minPrimary = 4.45 cfs @ 13.00 hrs, Volume= 42,311 cfSecondary = 0.00 cfs @ 5.00 hrs, Volume= 0 cf
Routing by Stor-Ind method, Time Span= 5.00-24.00 hrs, dt= 0.05 hrsPeak Elev= 416.39' @ 13.00 hrs Surf.Area= 6,177 sf Storage= 13,800 cf
Plug-Flow detention time= 86.1 min calculated for 42,199 cf (91% of inflow)Center-of-Mass det. time= 45.7 min ( 915.8 - 870.2 )
Volume Invert Avail.Storage Storage Description
#1 413.00' 25,189 cf Custom Stage Data (Prismatic) Listed below (Recalc)
Elevation Surf.Area Inc.Store Cum.Store(feet) (sq-ft) (cubic-feet) (cubic-feet)
413.00 0 0 0414.00 3,817 1,909 1,909416.00 5,725 9,542 11,451418.00 8,013 13,738 25,189
Device Routing Invert Outlet Devices
#1 Primary 414.00' 18.0" Round 18" Culvert L= 414.0' CPP, square edge headwall, Ke= 0.500 Inlet / Outlet Invert= 414.00' / 414.00' S= 0.0000 '/' Cc= 0.900 n= 0.013 Corrugated PE, smooth interior, Flow Area= 1.77 sf
#2 Device 1 414.00' 4.0" Vert. 4" Vertical Orifice/Grate C= 0.600 #3 Device 1 414.50' 12.0" Vert. 12" Vertical Orifice/Grate C= 0.600

Type III 24-hr 10-Year Rainfall=4.88"6108_POST Printed 7/12/2019Prepared by Meridian Associates
Page 13HydroCAD® 10.00 s/n 00814 © 2011 HydroCAD Software Solutions LLC
#4 Secondary 416.50' 22.0' long x 10.0' breadth Broad-Crested Rectangular Weir Head (feet) 0.20 0.40 0.60 0.80 1.00 1.20 1.40 1.60 Coef. (English) 2.49 2.56 2.70 2.69 2.68 2.69 2.67 2.64
Primary OutFlow Max=4.45 cfs @ 13.00 hrs HW=416.39' (Free Discharge)1=18" Culvert (Barrel Controls 4.45 cfs @ 2.52 fps)
2=4" Vertical Orifice/Grate (Passes < 0.63 cfs potential flow)3=12" Vertical Orifice/Grate (Passes < 4.47 cfs potential flow)
Secondary OutFlow Max=0.00 cfs @ 5.00 hrs HW=413.00' (Free Discharge)4=Broad-Crested Rectangular Weir ( Controls 0.00 cfs)
Summary for Pond 21P: Sedimentation Basin
Inflow Area = 410,551 sf, 0.00% Impervious, Inflow Depth > 2.31" for 10-Year eventInflow = 14.08 cfs @ 12.65 hrs, Volume= 79,167 cfOutflow = 10.78 cfs @ 12.90 hrs, Volume= 73,209 cf, Atten= 23%, Lag= 14.8 minPrimary = 10.78 cfs @ 12.90 hrs, Volume= 73,209 cfSecondary = 0.00 cfs @ 5.00 hrs, Volume= 0 cf
Routing by Stor-Ind method, Time Span= 5.00-24.00 hrs, dt= 0.05 hrsPeak Elev= 416.44' @ 12.90 hrs Surf.Area= 7,370 sf Storage= 17,550 cf
Plug-Flow detention time= 69.2 min calculated for 73,017 cf (92% of inflow)Center-of-Mass det. time= 33.3 min ( 904.1 - 870.9 )
Volume Invert Avail.Storage Storage Description
#1 413.00' 30,351 cf Custom Stage Data (Prismatic) Listed below (Recalc)
Elevation Surf.Area Inc.Store Cum.Store(feet) (sq-ft) (cubic-feet) (cubic-feet)
413.00 0 0 0414.00 5,010 2,505 2,505416.00 6,905 11,915 14,420418.00 9,026 15,931 30,351
Device Routing Invert Outlet Devices
#1 Primary 414.00' 24.0" Round 24" Culvert L= 35.0' CPP, square edge headwall, Ke= 0.500 Inlet / Outlet Invert= 414.00' / 414.00' S= 0.0000 '/' Cc= 0.900 n= 0.013 Corrugated PE, smooth interior, Flow Area= 3.14 sf
#2 Device 1 414.00' 4.0" Vert. 4" Verical Orifice/Grate C= 0.600 #3 Device 1 414.50' 12.0" Vert. 12" Vertical Orifice/Grate C= 0.600 #4 Device 1 415.00' 12.0" Vert. 12" Orifice/Grate C= 0.600 #5 Device 1 415.80' 18.0" Vert. 18" Vertical Orifice/Grate C= 0.600 #6 Secondary 416.50' 22.0' long x 10.0' breadth Broad-Crested Rectangular Weir
Head (feet) 0.20 0.40 0.60 0.80 1.00 1.20 1.40 1.60 Coef. (English) 2.49 2.56 2.70 2.69 2.68 2.69 2.67 2.64

Type III 24-hr 10-Year Rainfall=4.88"6108_POST Printed 7/12/2019Prepared by Meridian Associates
Page 14HydroCAD® 10.00 s/n 00814 © 2011 HydroCAD Software Solutions LLC
Primary OutFlow Max=10.78 cfs @ 12.90 hrs HW=416.44' (Free Discharge)1=24" Culvert (Passes 10.78 cfs of 13.87 cfs potential flow)
2=4" Verical Orifice/Grate (Orifice Controls 0.63 cfs @ 7.26 fps)3=12" Vertical Orifice/Grate (Orifice Controls 4.53 cfs @ 5.77 fps)4=12" Orifice/Grate (Orifice Controls 3.66 cfs @ 4.66 fps)5=18" Vertical Orifice/Grate (Orifice Controls 1.95 cfs @ 2.72 fps)
Secondary OutFlow Max=0.00 cfs @ 5.00 hrs HW=413.00' (Free Discharge)6=Broad-Crested Rectangular Weir ( Controls 0.00 cfs)

Type III 24-hr 100-Year Rainfall=8.81"6108_POST Printed 7/12/2019Prepared by Meridian Associates
Page 15HydroCAD® 10.00 s/n 00814 © 2011 HydroCAD Software Solutions LLC
Summary for Subcatchment 10S: West/Northwestern Wetland
Runoff = 78.76 cfs @ 12.14 hrs, Volume= 282,296 cf, Depth> 5.53"
Runoff by SCS TR-20 method, UH=SCS, Time Span= 5.00-24.00 hrs, dt= 0.05 hrsType III 24-hr 100-Year Rainfall=8.81"
Area (sf) CN Description
13,400 96 Gravel surface, HSG C232,366 70 Woods, Good, HSG C367,334 74 Pasture/grassland/range, Good, HSG C
613,100 73 Weighted Average613,100 100.00% Pervious Area
Tc Length Slope Velocity Capacity Description(min) (feet) (ft/ft) (ft/sec) (cfs)
5.4 50 0.0600 0.16 Sheet Flow, Sheet FlowGrass: Dense n= 0.240 P2= 3.10"
4.5 577 0.0919 2.12 Shallow Concentrated Flow, Shallow Concentrated FlowShort Grass Pasture Kv= 7.0 fps
9.9 627 Total
Summary for Subcatchment 11S: To Swale
Runoff = 25.89 cfs @ 12.26 hrs, Volume= 116,923 cf, Depth> 5.64"
Runoff by SCS TR-20 method, UH=SCS, Time Span= 5.00-24.00 hrs, dt= 0.05 hrsType III 24-hr 100-Year Rainfall=8.81"
Area (sf) CN Description
245,679 74 Pasture/grassland/range, Good, HSG C* 1,864 98 Proposed Concrete ESS Pad, HSG C
1,350 89 Gravel roads, HSG C
248,893 74 Weighted Average247,029 99.25% Pervious Area
1,864 0.75% Impervious Area
Tc Length Slope Velocity Capacity Description(min) (feet) (ft/ft) (ft/sec) (cfs)
5.4 50 0.0600 0.16 Sheet Flow, Sheet FlowGrass: Dense n= 0.240 P2= 3.10"
13.7 1,150 0.0400 1.40 Shallow Concentrated Flow, Shallow Concentrated FlowShort Grass Pasture Kv= 7.0 fps
19.1 1,200 Total

Type III 24-hr 100-Year Rainfall=8.81"6108_POST Printed 7/12/2019Prepared by Meridian Associates
Page 16HydroCAD® 10.00 s/n 00814 © 2011 HydroCAD Software Solutions LLC
Summary for Subcatchment 20S: Northern Wetland
Runoff = 53.59 cfs @ 12.25 hrs, Volume= 238,431 cf, Depth> 5.39"
Runoff by SCS TR-20 method, UH=SCS, Time Span= 5.00-24.00 hrs, dt= 0.05 hrsType III 24-hr 100-Year Rainfall=8.81"
Area (sf) CN Description
6,690 89 Gravel roads, HSG C313,580 70 Woods, Good, HSG C210,154 74 Pasture/grassland/range, Good, HSG C
530,424 72 Weighted Average530,424 100.00% Pervious Area
Tc Length Slope Velocity Capacity Description(min) (feet) (ft/ft) (ft/sec) (cfs)
9.5 50 0.0400 0.09 Sheet Flow, Sheet FlowWoods: Light underbrush n= 0.400 P2= 3.10"
9.0 775 0.0826 1.44 Shallow Concentrated Flow, Shallow Concentrated FlowWoodland Kv= 5.0 fps
18.5 825 Total
Summary for Subcatchment 21S: To Swale
Runoff = 39.30 cfs @ 12.33 hrs, Volume= 196,835 cf, Depth> 5.75"
Runoff by SCS TR-20 method, UH=SCS, Time Span= 5.00-24.00 hrs, dt= 0.05 hrsType III 24-hr 100-Year Rainfall=8.81"
Area (sf) CN Description
28,114 89 Gravel roads, HSG C368,727 74 Pasture/grassland/range, Good, HSG C13,710 70 Woods, Good, HSG C
410,551 75 Weighted Average410,551 100.00% Pervious Area
Tc Length Slope Velocity Capacity Description(min) (feet) (ft/ft) (ft/sec) (cfs)
9.5 50 0.0400 0.09 Sheet Flow, Sheet FlowWoods: Light underbrush n= 0.400 P2= 3.10"
7.4 310 0.0194 0.70 Shallow Concentrated Flow, Shallow Concentrated FlowWoodland Kv= 5.0 fps
7.3 748 0.0598 1.71 Shallow Concentrated Flow, Shallow Concentrated FlowShort Grass Pasture Kv= 7.0 fps
0.1 20 0.0900 4.83 Shallow Concentrated Flow, Shallow Concentrated FlowUnpaved Kv= 16.1 fps
0.1 17 0.1100 2.32 Shallow Concentrated Flow, Shallow Concentrated FlowShort Grass Pasture Kv= 7.0 fps
24.4 1,145 Total

Type III 24-hr 100-Year Rainfall=8.81"6108_POST Printed 7/12/2019Prepared by Meridian Associates
Page 17HydroCAD® 10.00 s/n 00814 © 2011 HydroCAD Software Solutions LLC
Summary for Reach 10R: West/Northwestern Wetland
Inflow Area = 861,993 sf, 0.22% Impervious, Inflow Depth > 5.48" for 100-Year eventInflow = 81.72 cfs @ 12.14 hrs, Volume= 393,539 cfOutflow = 81.72 cfs @ 12.14 hrs, Volume= 393,539 cf, Atten= 0%, Lag= 0.0 min
Routing by Stor-Ind+Trans method, Time Span= 5.00-24.00 hrs, dt= 0.05 hrs
Summary for Reach 11R: Southern Swale
Inflow Area = 248,893 sf, 0.75% Impervious, Inflow Depth > 5.64" for 100-Year eventInflow = 25.89 cfs @ 12.26 hrs, Volume= 116,923 cfOutflow = 22.94 cfs @ 12.50 hrs, Volume= 116,014 cf, Atten= 11%, Lag= 14.2 min
Routing by Stor-Ind+Trans method, Time Span= 5.00-24.00 hrs, dt= 0.05 hrsMax. Velocity= 2.18 fps, Min. Travel Time= 8.1 minAvg. Velocity = 0.85 fps, Avg. Travel Time= 20.9 min
Peak Storage= 11,222 cf @ 12.36 hrsAverage Depth at Peak Storage= 1.33'Bank-Full Depth= 2.00' Flow Area= 20.0 sf, Capacity= 54.71 cfs
4.00' x 2.00' deep channel, n= 0.080 Earth, long dense weedsSide Slope Z-value= 3.0 '/' Top Width= 16.00'Length= 1,060.0' Slope= 0.0170 '/'Inlet Invert= 435.00', Outlet Invert= 417.00'
‡
Summary for Reach 20R: Northern Wetland
Inflow Area = 940,975 sf, 0.00% Impervious, Inflow Depth > 5.44" for 100-Year eventInflow = 66.14 cfs @ 12.48 hrs, Volume= 426,895 cfOutflow = 66.14 cfs @ 12.48 hrs, Volume= 426,895 cf, Atten= 0%, Lag= 0.0 min
Routing by Stor-Ind+Trans method, Time Span= 5.00-24.00 hrs, dt= 0.05 hrs
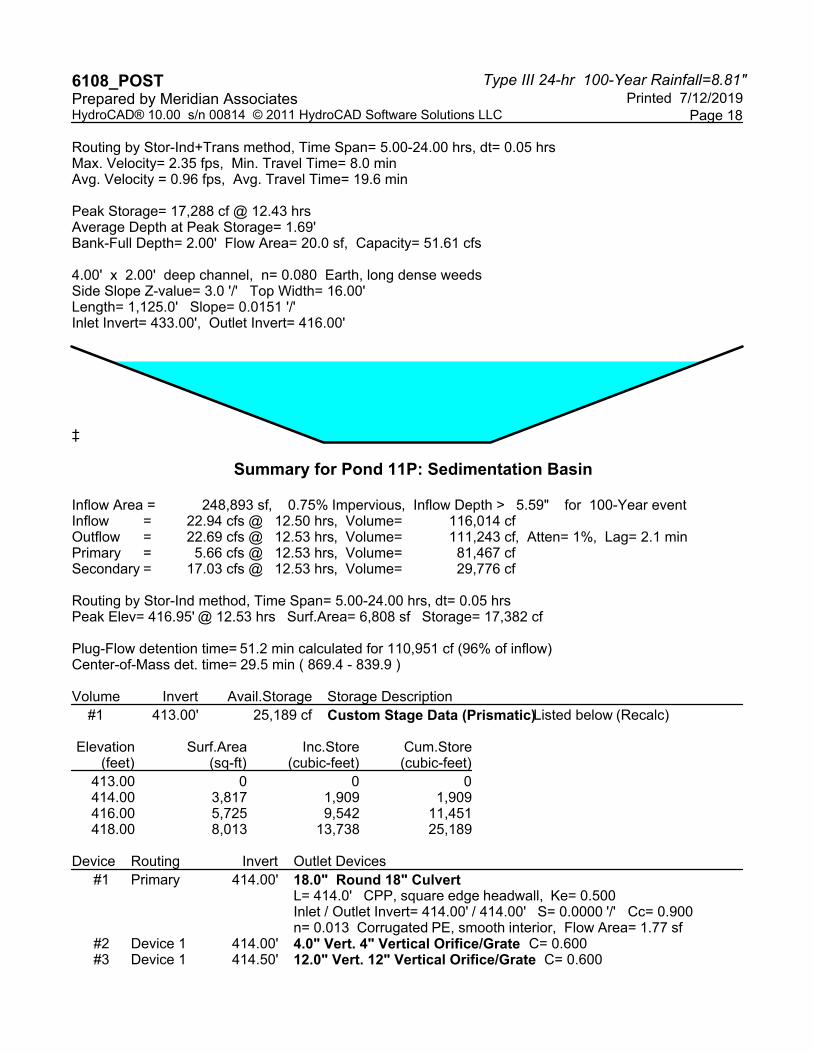
Summary for Reach 21R: Northern Swale
Inflow Area = 410,551 sf, 0.00% Impervious, Inflow Depth > 5.75" for 100-Year eventInflow = 39.30 cfs @ 12.33 hrs, Volume= 196,835 cfOutflow = 36.01 cfs @ 12.57 hrs, Volume= 195,411 cf, Atten= 8%, Lag= 14.1 min
Type III 24-hr 100-Year Rainfall=8.81"6108_POST Printed 7/12/2019Prepared by Meridian Associates
Page 18HydroCAD® 10.00 s/n 00814 © 2011 HydroCAD Software Solutions LLC
Routing by Stor-Ind+Trans method, Time Span= 5.00-24.00 hrs, dt= 0.05 hrsMax. Velocity= 2.35 fps, Min. Travel Time= 8.0 minAvg. Velocity = 0.96 fps, Avg. Travel Time= 19.6 min
Peak Storage= 17,288 cf @ 12.43 hrsAverage Depth at Peak Storage= 1.69'Bank-Full Depth= 2.00' Flow Area= 20.0 sf, Capacity= 51.61 cfs
4.00' x 2.00' deep channel, n= 0.080 Earth, long dense weedsSide Slope Z-value= 3.0 '/' Top Width= 16.00'Length= 1,125.0' Slope= 0.0151 '/'Inlet Invert= 433.00', Outlet Invert= 416.00'
‡
Summary for Pond 11P: Sedimentation Basin
Inflow Area = 248,893 sf, 0.75% Impervious, Inflow Depth > 5.59" for 100-Year eventInflow = 22.94 cfs @ 12.50 hrs, Volume= 116,014 cfOutflow = 22.69 cfs @ 12.53 hrs, Volume= 111,243 cf, Atten= 1%, Lag= 2.1 minPrimary = 5.66 cfs @ 12.53 hrs, Volume= 81,467 cfSecondary = 17.03 cfs @ 12.53 hrs, Volume= 29,776 cf
Routing by Stor-Ind method, Time Span= 5.00-24.00 hrs, dt= 0.05 hrsPeak Elev= 416.95' @ 12.53 hrs Surf.Area= 6,808 sf Storage= 17,382 cf
Plug-Flow detention time= 51.2 min calculated for 110,951 cf (96% of inflow)Center-of-Mass det. time= 29.5 min ( 869.4 - 839.9 )
Volume Invert Avail.Storage Storage Description
#1 413.00' 25,189 cf Custom Stage Data (Prismatic) Listed below (Recalc)
Elevation Surf.Area Inc.Store Cum.Store(feet) (sq-ft) (cubic-feet) (cubic-feet)
413.00 0 0 0414.00 3,817 1,909 1,909416.00 5,725 9,542 11,451418.00 8,013 13,738 25,189
Device Routing Invert Outlet Devices
#1 Primary 414.00' 18.0" Round 18" Culvert L= 414.0' CPP, square edge headwall, Ke= 0.500 Inlet / Outlet Invert= 414.00' / 414.00' S= 0.0000 '/' Cc= 0.900 n= 0.013 Corrugated PE, smooth interior, Flow Area= 1.77 sf
#2 Device 1 414.00' 4.0" Vert. 4" Vertical Orifice/Grate C= 0.600 #3 Device 1 414.50' 12.0" Vert. 12" Vertical Orifice/Grate C= 0.600

Type III 24-hr 100-Year Rainfall=8.81"6108_POST Printed 7/12/2019Prepared by Meridian Associates
Page 19HydroCAD® 10.00 s/n 00814 © 2011 HydroCAD Software Solutions LLC
#4 Secondary 416.50' 22.0' long x 10.0' breadth Broad-Crested Rectangular Weir Head (feet) 0.20 0.40 0.60 0.80 1.00 1.20 1.40 1.60 Coef. (English) 2.49 2.56 2.70 2.69 2.68 2.69 2.67 2.64
Primary OutFlow Max=5.66 cfs @ 12.53 hrs HW=416.94' (Free Discharge)1=18" Culvert (Barrel Controls 5.66 cfs @ 3.20 fps)
2=4" Vertical Orifice/Grate (Passes < 0.70 cfs potential flow)3=12" Vertical Orifice/Grate (Passes < 5.27 cfs potential flow)
Secondary OutFlow Max=16.91 cfs @ 12.53 hrs HW=416.94' (Free Discharge)4=Broad-Crested Rectangular Weir (Weir Controls 16.91 cfs @ 1.73 fps)
Summary for Pond 21P: Sedimentation Basin
Inflow Area = 410,551 sf, 0.00% Impervious, Inflow Depth > 5.71" for 100-Year eventInflow = 36.01 cfs @ 12.57 hrs, Volume= 195,411 cfOutflow = 35.75 cfs @ 12.60 hrs, Volume= 188,464 cf, Atten= 1%, Lag= 2.0 minPrimary = 16.20 cfs @ 12.60 hrs, Volume= 154,923 cfSecondary = 19.55 cfs @ 12.60 hrs, Volume= 33,542 cf
Routing by Stor-Ind method, Time Span= 5.00-24.00 hrs, dt= 0.05 hrsPeak Elev= 416.99' @ 12.60 hrs Surf.Area= 7,951 sf Storage= 21,743 cf
Plug-Flow detention time= 40.9 min calculated for 188,464 cf (96% of inflow)Center-of-Mass det. time= 21.7 min ( 863.3 - 841.5 )
Volume Invert Avail.Storage Storage Description
#1 413.00' 30,351 cf Custom Stage Data (Prismatic) Listed below (Recalc)
Elevation Surf.Area Inc.Store Cum.Store(feet) (sq-ft) (cubic-feet) (cubic-feet)
413.00 0 0 0414.00 5,010 2,505 2,505416.00 6,905 11,915 14,420418.00 9,026 15,931 30,351
Device Routing Invert Outlet Devices
#1 Primary 414.00' 24.0" Round 24" Culvert L= 35.0' CPP, square edge headwall, Ke= 0.500 Inlet / Outlet Invert= 414.00' / 414.00' S= 0.0000 '/' Cc= 0.900 n= 0.013 Corrugated PE, smooth interior, Flow Area= 3.14 sf
#2 Device 1 414.00' 4.0" Vert. 4" Verical Orifice/Grate C= 0.600 #3 Device 1 414.50' 12.0" Vert. 12" Vertical Orifice/Grate C= 0.600 #4 Device 1 415.00' 12.0" Vert. 12" Orifice/Grate C= 0.600 #5 Device 1 415.80' 18.0" Vert. 18" Vertical Orifice/Grate C= 0.600 #6 Secondary 416.50' 22.0' long x 10.0' breadth Broad-Crested Rectangular Weir
Head (feet) 0.20 0.40 0.60 0.80 1.00 1.20 1.40 1.60 Coef. (English) 2.49 2.56 2.70 2.69 2.68 2.69 2.67 2.64

Type III 24-hr 100-Year Rainfall=8.81"6108_POST Printed 7/12/2019Prepared by Meridian Associates
Page 20HydroCAD® 10.00 s/n 00814 © 2011 HydroCAD Software Solutions LLC
Primary OutFlow Max=16.20 cfs @ 12.60 hrs HW=416.99' (Free Discharge)1=24" Culvert (Passes 16.20 cfs of 17.99 cfs potential flow)
2=4" Verical Orifice/Grate (Orifice Controls 0.71 cfs @ 8.08 fps)3=12" Vertical Orifice/Grate (Orifice Controls 5.33 cfs @ 6.78 fps)4=12" Orifice/Grate (Orifice Controls 4.61 cfs @ 5.87 fps)5=18" Vertical Orifice/Grate (Orifice Controls 5.55 cfs @ 3.71 fps)
Secondary OutFlow Max=19.51 cfs @ 12.60 hrs HW=416.99' (Free Discharge)6=Broad-Crested Rectangular Weir (Weir Controls 19.51 cfs @ 1.83 fps)

PRE-DEVELOPMENT
DRAINAGE PLAN


POST-DEVELOPMENT
DRAINAGE PLAN


APPENDIX


OPERATION & MAINTENANCE
PROGRAM


OPERATION AND MAINTENANCE PROGRAM
for
A PROPOSED STORMWATER MANAGEMENT SYSTEM
located at
44 ESTABROOK AVENUE
GRAFTON, MASSACHUSETTS
Prepared for:
BlueWave Capital, LLC
75 Arlington Street Boston, Massachusetts 02116
Prepared by:
Meridian Associates, Inc.
500 Cummings Center, Suite 5950 Beverly, Massachusetts 01915
(978) 299-0447
June 12, 2018
August 3, 2018

Project Name: Knowlton Farms Solar Development (Phase 3)
44 Estabrook Avenue
Grafton, Ma 01519
Owner Name: Patricia K. Knowlton, Trustee - Knowlton Farms Nominee Trust
44 Estabrook Avenue
Grafton, Ma 01519
Party Responsible for Maintenance
During Construction: BlueWave Capital, LLC
75 Arlington Street
Boston, Massachusetts 02116
Party Responsible for Maintenance
After Construction: BlueWave Capital, LLC
75 Arlington Street
Boston, Massachusetts 02116
Erosion and Sedimentation Control Measures during Construction Activities
Haybales
Staked haybales will be installed upgradient of the resource areas as depicted on the Erosion
& Sediment Control Plan. The haybales shall be installed prior to the commencement of any
work on-site and in accordance with the design plans. An additional supply of haybales shall
be on-site to replace and/or repair any haybales that have been disturbed or are in poor
condition. The line of haybales shall be inspected and maintained on a weekly basis and after
every major storm event (2-year or greater) during construction. No construction activities
are to occur beyond the haybale line at any time. Deposited sediments shall be removed
when the volume of the deposition reaches approximately one-half the height of the hay bale.
Water Quality Swales with Checkdams
The Water Quality Swales shall be checked weekly and after major storm events during
construction for rilling, erosion, and debris removal. Avoid compaction of the parent
material by working from the edge of the areas proposed as the locations of the Water Quality
Swales. Debris and sediment accumulated at the checkdams is to be removed.
Sedimentation Basins
The Sedimentation Basin shall be checked weekly and after major storm events during
construction for rilling, erosion, and debris removal. Avoid compaction of the parent

material by working from the edge of the areas proposed as the locations of the
Sedimentation Basins.
Temporary Diversion Swales
Swales shall be checked weekly and after every major storm event during construction for
rilling, gullying, erosion and debris removal.
Gravel Access Drive & Temporary Construction Parking Areas
The gravel access drive and temporary construction parking areas shall be inspected weekly.
The access drive should be inspected for ruts, channelized drainage, gullying and
sedimentation. Repairs to the drive and parking areas shall be made with new clean stone,
and shall be compacted into place. Large ruts may be filled with larger stone and set in place
with dense grade material, then overlain by new crushed stone.
Stockpiles
All unused debris, soil, and other material shall be stockpiled in locations of relatively flat
grades, away from any trees identified to be saved and upgradient of the haybales. Stockpile
side slopes shall not be greater than 2:1. All stockpiles shall be surrounded by a row of
haybales, and shall be placed outside the 100 foot buffer to any bordering vegetated wetland.
Surrounding haybales shall be inspected and maintained on a daily basis.
Surface Stabilization
Once the forested areas have been cleared and grubbed, the entire area will be tilled following
the installation of the array; areas of exposed soils will be seeded with the Solar Farm Seed
Mix provided by Ersnt Conservation Seeds. This seed mix contains a variety of low-growing,
low-maintenance fescues that will stabilize the ground surface.
Construction Tracking Pad
Construction tracking pads shall be installed at the designated entrances/exits to the site at
Cape Road and on both sides of the wetland crossing, as shown on the Erosion & Sediment
Control plans to reduce the amount of sediment transported off site. The construction
tracking pads shall be inspected weekly.
Removal of Sediment and Erosion Controls
At the completion of construction activities and after receiving approval from the Town of
Mendon, all physical sediment and erosion controls shall be removed from the site. The
areas where the controls have been removed shall be seeded and stabilized immediately upon
removal.

Long-Term Inspection and Maintenance Measures after Construction
Erosion Control
Eroded sediments can adversely affect the performance of the stormwater management
system. Eroding or barren areas should be immediately re-vegetated.
Gravel Access Drive
The gravel access drive shall be inspected bi-annually and after every major storm event for
ruts, channelized drainage, gullying and sedimentation. Repairs to the drive shall be made
with new clean stone, and shall be compacted into place. Large ruts may be filled with larger
stone and set in place with dense grade material, then overlain by new crushed stone.
Water Quality Swales with Checkdams
The Sedimentation Basin shall be checked bi-annually and after every major storm event for
rilling, gullying, erosions and debris removal. Maintenance mowing shall occur at a
minimum of twice per year.
Sedimentation Basins
The Sedimentation Basin shall be checked bi-annually and after every major storm event for
rilling, gullying, erosions and debris removal. Maintenance mowing shall occur at a
minimum of twice per year.
Debris and Litter Removal
Trash may collect in the BMP’s, potentially causing clogging of the facilities. All debris and
litter shall be removed when necessary, and after each storm event. Sediment and debris
collected from vacuuming and/or sweeping should be disposed of at a permitted waste
disposal facility. Avoid disposing of this material on site, where it could be washed into the
proposed detention basin.
Solar Farm Seed Mix Grass Mowing
Grass shall be inspected annually and maintenance mowing shall occur as needed. All lawn
mowing to take place will be done with a mulch mower so grass clippings will not be an
issue.
Good Housekeeping Practices (in accordance with Standard 10 of the Stormwater
Management Handbook to prevent illicit discharges)

Provisions for storing paints, cleaners, automotive waste and other potentially
hazardous household waste products inside or under cover
• All materials on site will be stored inside in a neat, orderly, manner in their appropriate
containers with the original manufacturer’s label.
• Only store enough material necessary. Whenever possible, all of a product shall be used
up before disposing of container.
• Manufacturer, local, and State recommendations for proper use and disposal shall be
followed.
Vehicle washing controls
• A commercial car wash shall be used when possible. Car washes treat and/or recycle
water.
• Cars shall be washed on gravel, grass, or other permeable surfaces to allow filtration to
occur.
• Use biodegradable soaps.
• A water hose with a nozzle that automatically turns off when left unattended.
Requirements for routine inspection and maintenance of stormwater BMPs
See Inspection and Maintenance Measures after Construction.
Spill prevention and response plans
Spill Control Practices shall be in conformance with the guidelines set forth in the National
Pollutant Discharge Elimination System (NPDES) Stormwater Pollution Prevention Plan
(SWPPP)
Provisions for maintenance of lawns, gardens, and other landscaped areas
• Grass shall not be cut shorter than 2 to 3 inches and mulch clipping should be left on
lawn as a natural fertilizer.
• Use low volume water approaches such as drip-type or sprinkler systems. Water plants
only when needed to enhance root growth and avoid runoff problems.
• The use of mulch shall be utilized where possible. Mulch helps retain water and prevents
erosion.
Requirements for storage and use of fertilizers, herbicides and pesticides
• Fertilizers used will be applied only in the minimum amounts recommended by the
manufacturer. Once applied, fertilizer will be worked into the soil to limit exposure to
storm water. Storage will be in a covered shed. The contents of any partially used bags
of fertilizer will be transferred to a sealable plastic bin to avoid spills.
• Do not fertilize before a rainstorm.
• Consider using organic fertilizers. They release nutrients more slowly.
• Pesticides shall be applied on lawns and gardens only when necessary and applied only in
the minimum amounts recommended by the manufacturer.
Pet waste management
• Scoop up and seal pet wastes in a plastic bag. Dispose of properly, in the garbage.

Provisions for operation and management of septic systems
Not Applicable
Provisions for solid waste management
• All solid waste shall be disposed of or recycled in accordance with local town regulations.
Snow disposal and plowing plans relative to Resource Area
• Snow shall be plowed and stored on gravel, grass, or other permeable surfaces to allow
filtration to occur.
• Once snow melts all sand salt and debris shall be extracted from surface and properly
disposed of.
• Snow shall not be disposed of in any resource area or waterbody.
• Avoid disposing snow on top of storm drain catchbasins or stormwater drainage swale.
Winter Road Salt and/or Sand use and storage restrictions
• Salt storage piles should be located outside the 100-year buffer zone and shall be covered
at all times.
• The amount of road salt applied should be regulated to prevent over salting of roadways
and increasing runoff concentrations. Alternative materials, such as sand or gravel,
should be used in especially sensitive areas.
Roadway and Parking Lot sweeping schedule
• Pavement sweeping shall be conducted at a frequency of not less than once per year.
• Removal of any accumulated sand, grit, and debris from driveway after the snow melts
shall be completed shortly after snow melts for the season.
Documentation that Stormwater BMPs are designed to provide for shutdown and
containment in the event of a spill or discharges to or near critical areas or from
LUHPPL
Not Applicable
Training for staff or personnel involved with implementing Long-Term Pollution
Prevention Plan
To be determined by the owner.
List of Emergency contacts for implementing Long-Term Pollution Prevention Plan
To be determined by the owner.
P:\6108_Estabrook_Grafton_Phase3\ADMIN\Reports\Stormwater\Stormwater\_03 6108-O&M.doc

STORMWATER MANAGEMENT
CONSTRUCTION PHASE
INSPECTION SCHEDULE AND EVALUATION CHECKLIST
PROJECT LOCATION: 44 Estabrook Avenue, Grafton, Massachusetts WEATHER: _______________________
Inspection
Date Inspector Area Inspected
Required Inspection
Frequency if BMP Comments Recommendation
Follow-up
Inspection Required
(yes/no)
Haybales Weekly and After
Major Storm Events
Construction
Tracking Pads
Weekly and After
Major Storm Events
Gravel Access Drive
and Temporary
Parking Areas
Weekly and After
Major Storm Events
Water Quality
Swales
Weekly and After
Major Storm Events
Sedimentation
Basin
Weekly and After
Major Storm Events
Temporary
Diversion Swales
Weekly and After
Major Storm Events
(1) Refer to the Massachusetts Stormwater Handbook, Volume Two: Stormwater Technical Handbook (February 2008) for
recommendations regarding frequency for inspection and maintenance of specific BMP’s.
(2) Inspections to be conducted by a qualified professional such as an environmental scientist or civil engineer.
Limited or no use of sodium chloride salts, fertilizers or pesticides recommended.
Other notes: (Include deviations from: Con. Comm. Order of Conditions, PB Approval, Construction Sequence and Approved Plan)
Stormwater Control Manager: __________________________________________________

STORMWATER MANAGEMENT
AFTER CONSTRUCTION
INSPECTION SCHEDULE AND EVALUATION CHECKLIST
PROJECT LOCATION: 44 Estabrook Avenue, Grafton, Massachusetts WEATHER:________________________
Inspection
Date Inspector Area Inspected
Required Inspection
Frequency if BMP Comments Recommendation
Follow-up
Inspection Required
(yes/no)
Sedimentation
Basin
Bi-annually and After
Major Storm Event
Gravel Access Drive Bi-annually and After
Major Storm Event
Water Quality
Swales
Bi-annually and After
Major Storm Event
(1) Refer to the Massachusetts Stormwater Handbook, Volume Two: Stormwater Technical Handbook (February 2008) for
recommendations regarding frequency for inspection and maintenance of specific BMP’s.
(2) Inspections to be conducted by a qualified professional such as an environmental scientist or civil engineer.
Limited or no use of sodium chloride salts, fertilizers or pesticides recommended.
Other notes: (Include deviations from: Con. Comm. Order of Conditions, PB Approval, Construction Sequence and Approved Plan)
Stormwater Control Manager: ____________________________________________________ P:\6108_Estabrook_Grafton_Phase3\ADMIN\Reports\Stormwater\Stormwater\_03 6108-O&M.doc

USDA NATURAL RESOURCE
CONSERVATION SERVICE
NATIONAL COOPERATIVE SOIL SURVEY


Soil Map—Worcester County, Massachusetts, Southern Part
Natural ResourcesConservation Service
Web Soil SurveyNational Cooperative Soil Survey
5/11/2018Page 1 of 3
4676
900
4677
000
4677
100
4677
200
4677
300
4677
400
4677
500
4677
600
4677
700
4677
800
4677
900
4678
000
4678
100
4678
200
4676
800
4676
900
4677
000
4677
100
4677
200
4677
300
4677
400
4677
500
4677
600
4677
700
4677
800
4677
900
4678
000
4678
100
279800 279900 280000 280100 280200 280300 280400 280500 280600 280700 280800
279700 279800 279900 280000 280100 280200 280300 280400 280500 280600 280700
42° 13' 30'' N71
° 4
0' 8
'' W42° 13' 30'' N
71° 3
9' 2
1'' W
42° 12' 44'' N
71° 4
0' 8
'' W
42° 12' 44'' N
71° 3
9' 2
1'' W
N
Map projection: Web Mercator Corner coordinates: WGS84 Edge tics: UTM Zone 19N WGS840 300 600 1200 1800
Feet0 100 200 400 600
MetersMap Scale: 1:6,880 if printed on A portrait (8.5" x 11") sheet.
Soil Map may not be valid at this scale.

MAP LEGEND MAP INFORMATION
Area of Interest (AOI)Area of Interest (AOI)
SoilsSoil Map Unit Polygons
Soil Map Unit Lines
Soil Map Unit Points
Special Point FeaturesBlowout
Borrow Pit
Clay Spot
Closed Depression
Gravel Pit
Gravelly Spot
Landfill
Lava Flow
Marsh or swamp
Mine or Quarry
Miscellaneous Water
Perennial Water
Rock Outcrop
Saline Spot
Sandy Spot
Severely Eroded Spot
Sinkhole
Slide or Slip
Sodic Spot
Spoil Area
Stony Spot
Very Stony Spot
Wet Spot
Other
Special Line Features
Water FeaturesStreams and Canals
TransportationRails
Interstate Highways
US Routes
Major Roads
Local Roads
BackgroundAerial Photography
The soil surveys that comprise your AOI were mapped at 1:25,000.
Warning: Soil Map may not be valid at this scale.
Enlargement of maps beyond the scale of mapping can cause misunderstanding of the detail of mapping and accuracy of soil line placement. The maps do not show the small areas of contrasting soils that could have been shown at a more detailed scale.
Please rely on the bar scale on each map sheet for map measurements.
Source of Map: Natural Resources Conservation ServiceWeb Soil Survey URL: Coordinate System: Web Mercator (EPSG:3857)
Maps from the Web Soil Survey are based on the Web Mercator projection, which preserves direction and shape but distorts distance and area. A projection that preserves area, such as the Albers equal-area conic projection, should be used if more accurate calculations of distance or area are required.
This product is generated from the USDA-NRCS certified data as of the version date(s) listed below.
Soil Survey Area: Worcester County, Massachusetts, Southern PartSurvey Area Data: Version 10, Oct 6, 2017
Soil map units are labeled (as space allows) for map scales 1:50,000 or larger.
Date(s) aerial images were photographed: Sep 12, 2014—Sep 28, 2014
The orthophoto or other base map on which the soil lines were compiled and digitized probably differs from the background imagery displayed on these maps. As a result, some minor shifting of map unit boundaries may be evident.
Soil Map—Worcester County, Massachusetts, Southern Part
Natural ResourcesConservation Service
Web Soil SurveyNational Cooperative Soil Survey
5/11/2018Page 2 of 3

Map Unit Legend
Map Unit Symbol Map Unit Name Acres in AOI Percent of AOI
52A Freetown muck, 0 to 1 percent slopes
25.8 19.4%
73A Whitman fine sandy loam, 0 to 3 percent slopes, extremely stony
5.9 4.5%
305B Paxton fine sandy loam, 3 to 8 percent slopes
24.9 18.8%
305C Paxton fine sandy loam, 8 to 15 percent slopes
8.4 6.4%
307C Paxton fine sandy loam, 8 to 15 percent slopes, extremely stony
10.8 8.1%
307E Paxton fine sandy loam, 15 to 35 percent slopes, extremely stony
10.5 7.9%
310B Woodbridge fine sandy loam, 3 to 8 percent slopes
25.2 19.0%
312B Woodbridge fine sandy loam, 0 to 8 percent slopes, extremely stony
21.2 16.0%
Totals for Area of Interest 132.7 100.0%
Soil Map—Worcester County, Massachusetts, Southern Part
Natural ResourcesConservation Service
Web Soil SurveyNational Cooperative Soil Survey
5/11/2018Page 3 of 3


FEDERAL EMERGENCY
MANAGEMENT AGENCY
FLOOD INSURANCE RATE MAP


Town of Grafton, MA May 17, 2018
Property Information
Property ID 110/049.0-0000-0006.0
Location 44 ESTABROOK AVENUE
Owner KNOWLTON PATRICIA K TRUSTEE
MAP FOR REFERENCE ONLY NOT A LEGAL DOCUMENT
Town of Grafton, MA makes no claims and no warranties,expressed or implied, concerning the validity or accuracy ofthe GIS data presented on this map.
Parcels updated 4/1/2018Properties updated 4/1/2018
1" = 1026 ft

STORMWATER MANAGEMENT
STANDARDS


1
Stormwater Management Standards
Project Narrative:
This site is located at 44 Estabrook Avenue in Grafton, Massachusetts on an undeveloped
parcel of land. The area is comprised of mostly grassed meadow surrounded by forest and
low lying resource areas. The land currently slopes from east to west to two (2) wetland
resource areas. Elevations on the site range from 480 along the eastern property line to an
elevation of approximately 410 in the middle of the site.
The proposed project is comprised of the development of the existing land into a solar
energy generating facility. The existing runoff patterns onsite will be maintained with
limited selective grading. The proposed solar facility will be installed using a screw and
post system providing low impact development on the existing topography of the locus
area.
The proposed project is comprised of the development of a solar electric generating
facility, the construction of a gravel access road, water quality swales and sedimentation
basins, inverter/transformer stations, interconnection equipment, electrical conduit, new
utility poles and risers, fencing, gates, and associated seeding and stabilization.
The solar energy generating facility has been designed and incorporated into the existing
topography in order to manage stormwater runoff in an appropriate and responsible
manner.
The following are the DEP Stormwater Standards as outlined in the Wetlands
Regulations:
Standard 1: No new stormwater conveyances may discharge untreated stormwater
directly to or cause erosion in wetlands or waters of the Commonwealth.
The existing project topography directs the stormwater runoff from the area of the
proposed work across the site toward existing railroad tracks, wooded land, or Boston
Post Road. There currently is no treatment of stormwater prior to discharge to these
locations. The proposed conditions will not have a point source discharge and will direct
stormwater in the same general patterns as the existing conditions, across proposed “solar
farm mix” and wooded areas prior to discharging toward the design points.
Standard 2: Peak Rate Attenuation - Stormwater management systems shall be
designed so that post-development peak discharge rates do not exceed pre-
development peak discharge rates. This standard may be waived for discharges to
land subject to coastal storm flowage as defined in 310 CMR 10.04.
For the purpose of analyzing pre and post development stormwater peak rates of runoff,
two (2) design points have been selected based on existing topographic conditions and

2
was used for both the pre and the post calculations. Comparison values for pre and post
development stormwater peak rates are given for the design points only.
The storm events used to calculate peak runoff rates for pre and post construction
conditions have been selected based upon the Massachusetts Stormwater Guidelines
requirements. Full detail of peak rate attenuation along with supplemental stormwater
calculations utilizing HydroCAD as well as pre and post drainage site plans can be found
in the appendix of this report. The details of this report show that the peak rates of runoff
for the 2-year, 10-year and 100 year events have been matched or reduced from pre to
post conditions.
The hydrologic calculations from HydroCAD has been included in the “Stormwater
Analysis & Calculations Report”.
Proposed Design Point and Subcatchment Areas
The proposed project is comprised of the development of a solar electric generating
facility, the construction of a gravel access road, water quality swales, sedimentation
basins, inverter/transformer stations, interconnection equipment, electrical conduit, new
utility poles and risers, fencing, gates, and associated seeding and stabilization. The
existing runoff patterns will be maintained with limited selective grading. The proposed
solar facility will be installed using a screw and/or post system which minimizes impact
on the existing topography and reduces the need for excess earthwork.
A drainage system consisting of water quality swales and sedimentation basins are
proposed to provide water quality treatment for the gravel access drive as well as nitrogen
removal. Additionally, peak rates of stormwater runoff in the proposed conditions will
not result in an increase in the 2, 10, and 100-year storm events at the selected design
points.
The proposed site has been broken into subcatchments as depicted on the Post-
Development Drainage Plan. The following summarizes the various hydraulic conditions
and areas comprising the post-hydrologic model.
• Subcatchment S10 – This is denoted as S10 on the accompanying Pre-
Development Drainage Plan. The subcatchment area consists of wooded land,
meadow grass and “Solar Farm Seed Mix” grassed areas and “Wetmix” grassed
areas, portions of the gravel drive, water quality swale and sedimentation basin.
Stormwater runoff generated in this subcatchment flows to the existing resource
area to the north of the field and south of Estabrook Avenue. (DP10).
• Subcatchment S20 – This is denoted as S10 on the accompanying Pre-
Development Drainage Plan. The subcatchment area consists of wooded land,
meadow grass and “Solar Farm Seed Mix” grassed areas and “Wetmix” grassed
areas, portions of the gravel drive, water quality swale and sedimentation basin.
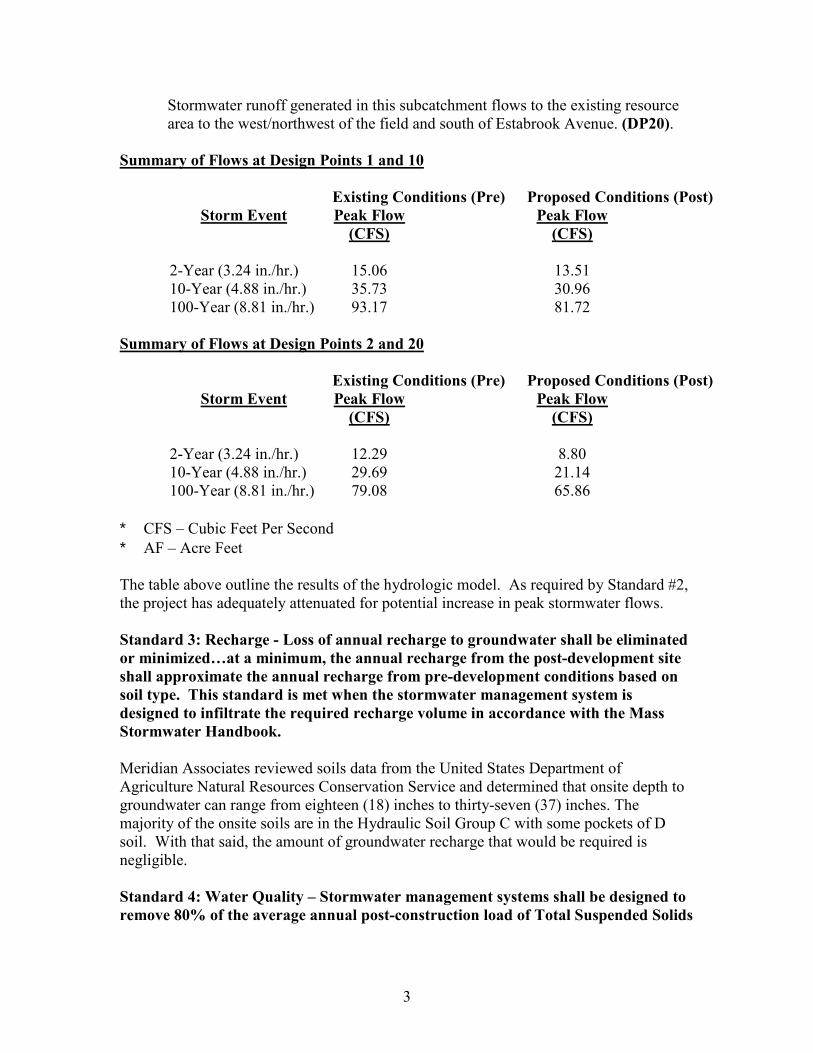
3
Stormwater runoff generated in this subcatchment flows to the existing resource
area to the west/northwest of the field and south of Estabrook Avenue. (DP20).
Summary of Flows at Design Points 1 and 10
Existing Conditions (Pre) Proposed Conditions (Post)
Storm Event Peak Flow
(CFS)
Peak Flow
(CFS)
2-Year (3.24 in./hr.)
15.06
13.51
10-Year (4.88 in./hr.) 35.73 30.96
100-Year (8.81 in./hr.) 93.17 81.72
Summary of Flows at Design Points 2 and 20
Existing Conditions (Pre) Proposed Conditions (Post)
Storm Event Peak Flow
(CFS)
Peak Flow
(CFS)
2-Year (3.24 in./hr.)
12.29
8.80
10-Year (4.88 in./hr.) 29.69 21.14
100-Year (8.81 in./hr.) 79.08 65.86
∗ CFS – Cubic Feet Per Second
∗ AF – Acre Feet
The table above outline the results of the hydrologic model. As required by Standard #2,
the project has adequately attenuated for potential increase in peak stormwater flows.
Standard 3: Recharge - Loss of annual recharge to groundwater shall be eliminated
or minimized…at a minimum, the annual recharge from the post-development site
shall approximate the annual recharge from pre-development conditions based on
soil type. This standard is met when the stormwater management system is
designed to infiltrate the required recharge volume in accordance with the Mass
Stormwater Handbook.
Meridian Associates reviewed soils data from the United States Department of
Agriculture Natural Resources Conservation Service and determined that onsite depth to
groundwater can range from eighteen (18) inches to thirty-seven (37) inches. The
majority of the onsite soils are in the Hydraulic Soil Group C with some pockets of D
soil. With that said, the amount of groundwater recharge that would be required is
negligible.
Standard 4: Water Quality – Stormwater management systems shall be designed to
remove 80% of the average annual post-construction load of Total Suspended Solids

4
(TSS). The standard is met with pollution prevention plans, stormwater BMP’s
sized to capture required water quality volume, and pretreatment measures.
The project proposes a minimal amount of impervious area (1,500 s.f.) for the concrete
equipment pads. Therefore, with the stormwater traveling over hundreds of feet of
naturally vegetated land cover prior to discharging to the existing wetlands will
accommodate for any minor TSS needed to be removed. The amount of TSS removal that
would be required is negligible.
Standard 5: Land Uses with Higher Potential Pollutant Loads (LUHPPLs) – Source
control and pollution prevention shall be implemented in accordance with the
Stormwater Handbook to eliminate or reduce the discharge of stormwater runoff
from such land uses to the maximum extent practicable.
Stormwater Standard 5 is not applicable to this project. The proposed development will
not subject the site to higher potential pollutant loads as defined in the Massachusetts
Department of Environmental Protection Wetlands and Water Quality Regulations.
LUHPPLs are identified in 310 CMR 22.20B(2) and C(2)(a)-(k) and (m) and CMR
22.21(2)(a)(1)-(8) and (b)(1)-(6), areas within a site that are the location of activities that
are subject to an individual National Pollutant Discharge Elimination System (NPDES)
permit or the NPDES Multi-sector General Permit; auto fueling facilities, exterior fleet
storage areas, exterior vehicle service and equipment cleaning areas; marinas and
boatyards; parking lots with high-intensity-use; confined disposal facilities and disposal
sites.
Standard 6: Critical Areas – Stormwater discharges to critical areas require the use
of specific source control and pollution prevention measures and specific structural
stormwater best management practices determined by the Department to be
suitable for managing discharges to such areas.
Stormwater Standard 6 is not applicable to this project given that proposed stormwater
does not discharge near a critical area. Critical areas being Outstanding Resource Waters
and Special Resource Waters as designated in 314 CMR 4.0, recharge areas for public
water supplies as defined in 310 CMR 22.02, bathing beaches as defined in 105 CMR
445.000, cold-water fisheries and shellfish growing areas as defined in 314 CMR 9.02
and 310 CMR 10.04. The existing wetlands and river are not considered critical areas
therefore Standard #6 does not apply to this project.
Standard 7: Redevelopments – A redevelopment project is required to meet
Standards 1-6 only to the maximum extent practicable. Remaining standards shall
be met as well as the project shall improve the existing conditions.
Stormwater Standard 7 is not applicable to this project. Within the Stormwater
Management Handbook (volume 1 chapter 1 page 20), the definition of a redevelopment
project includes, “development, rehabilitation, expansion and phased projects on

5
previously developed sites, provided the redevelopment results in no net increase in
impervious area”.
This project will not result in a reduction of impervious area in the proposed conditions.
Standard 8: Construction Period Pollution Prevention and Erosion and
Sedimentation Control Plan shall be implemented.
An Operation and Maintenance Program is included with this report. The program
details the construction period operation and maintenance plan and sequencing for
pollution prevention measures and erosion and sedimentation controls. Locations of
erosion control measures for the project are depicted on the site plan set accompanying
this report.
Standard 9: A long term Operation and Maintenance Plan shall be implemented.
An Operation and Maintenance Program for a Proposed Stormwater Management
System is included with this report. The long term operation and maintenance section of
the program provides details and the schedule for routine and non-routine maintenance
tasks to be implemented at the completion of the project.
Standard 10: Prohibition of Illicit Discharges – Illicit discharges to the stormwater
management system are prohibited.
Illicit discharges to the stormwater management system are discharges that are not
entirely comprised of stormwater. Discharges to the stormwater management system
from the following activities or facilities are permissible: Firefighting, water line
flushing, landscape irrigation, uncontaminated groundwater, potable water sources,
foundation drains, air conditioning condensation, footing drains, individual resident car
washing, flows from riparian habitats and wetlands, dechlorinated water from swimming
pools, water used for street washing and water used to clean residential buildings without
detergents. All other illicit discharges are prohibited.
There are no known illicit discharges anticipated through the completion of this project.
During construction and post construction procedures are provided to dissipate the
potential for illicit discharges to the drainage system. Post construction preventions of
illicit discharges are described in the Operation and Maintenance Program under the
Good Housekeeping Practices section of the report.
P:\6108_Estabrook_Grafton_Phase3\ADMIN\Reports\Stormwater\SWM Report\6108-SMgt_Rpt.doc

CHECKLIST FOR
STORMWATER REPORT


swcheck • 04/01/08 Stormwater Report Checklist • Page 1 of 8
Massachusetts Department of Environmental Protection Bureau of Resource Protection - Wetlands Program
Checklist for Stormwater Report
A. Introduction
Important: When filling out forms on the computer, use only the tab key to move your cursor - do not use the return key.
A Stormwater Report must be submitted with the Notice of Intent permit application to document compliance with the Stormwater Management Standards. The following checklist is NOT a substitute for the Stormwater Report (which should provide more substantive and detailed information) but is offered here as a tool to help the applicant organize their Stormwater Management documentation for their Report and for the reviewer to assess this information in a consistent format. As noted in the Checklist, the Stormwater Report must contain the engineering computations and supporting information set forth in Volume 3 of the Massachusetts Stormwater Handbook. The Stormwater Report must be prepared and certified by a Registered Professional Engineer (RPE) licensed in the Commonwealth. The Stormwater Report must include:
• The Stormwater Checklist completed and stamped by a Registered Professional Engineer (see page 2) that certifies that the Stormwater Report contains all required submittals.1 This Checklist is to be used as the cover for the completed Stormwater Report.
• Applicant/Project Name
• Project Address
• Name of Firm and Registered Professional Engineer that prepared the Report
• Long-Term Pollution Prevention Plan required by Standards 4-6
• Construction Period Pollution Prevention and Erosion and Sedimentation Control Plan required by Standard 82
• Operation and Maintenance Plan required by Standard 9 In addition to all plans and supporting information, the Stormwater Report must include a brief narrative describing stormwater management practices, including environmentally sensitive site design and LID techniques, along with a diagram depicting runoff through the proposed BMP treatment train. Plans are required to show existing and proposed conditions, identify all wetland resource areas, NRCS soil types, critical areas, Land Uses with Higher Potential Pollutant Loads (LUHPPL), and any areas on the site where infiltration rate is greater than 2.4 inches per hour. The Plans shall identify the drainage areas for both existing and proposed conditions at a scale that enables verification of supporting calculations.
As noted in the Checklist, the Stormwater Management Report shall document compliance with each of the Stormwater Management Standards as provided in the Massachusetts Stormwater Handbook. The soils evaluation and calculations shall be done using the methodologies set forth in Volume 3 of the Massachusetts Stormwater Handbook. To ensure that the Stormwater Report is complete, applicants are required to fill in the Stormwater Report Checklist by checking the box to indicate that the specified information has been included in the Stormwater Report. If any of the information specified in the checklist has not been submitted, the applicant must provide an explanation. The completed Stormwater Report Checklist and Certification must be submitted with the Stormwater Report.
1 The Stormwater Report may also include the Illicit Discharge Compliance Statement required by Standard 10. If not included in the Stormwater Report, the Illicit Discharge Compliance Statement must be submitted prior to the discharge of stormwater runoff to the post-construction best management practices. 2 For some complex projects, it may not be possible to include the Construction Period Erosion and Sedimentation Control Plan in the Stormwater Report. In that event, the issuing authority has the discretion to issue an Order of Conditions that approves the project and includes a condition requiring the proponent to submit the Construction Period Erosion and Sedimentation Control Plan before commencing any land disturbance activity on the site.


swcheck • 04/01/08 Stormwater Report Checklist • Page 3 of 8
Massachusetts Department of Environmental Protection Bureau of Resource Protection - Wetlands Program
Checklist for Stormwater Report
Checklist (continued)
LID Measures: Stormwater Standards require LID measures to be considered. Document what environmentally sensitive design and LID Techniques were considered during the planning and design of the project:
No disturbance to any Wetland Resource Areas
Site Design Practices (e.g. clustered development, reduced frontage setbacks)
Reduced Impervious Area (Redevelopment Only)
Minimizing disturbance to existing trees and shrubs
LID Site Design Credit Requested:
Credit 1
Credit 2
Credit 3
Use of “country drainage” versus curb and gutter conveyance and pipe
Bioretention Cells (includes Rain Gardens)
Constructed Stormwater Wetlands (includes Gravel Wetlands designs)
Treebox Filter
Water Quality Swale
Grass Channel
Green Roof
Other (describe):
Low Impact Design screw & post racking system
Standard 1: No New Untreated Discharges
No new untreated discharges
Outlets have been designed so there is no erosion or scour to wetlands and waters of the Commonwealth
Supporting calculations specified in Volume 3 of the Massachusetts Stormwater Handbook included.

swcheck • 04/01/08 Stormwater Report Checklist • Page 4 of 8
Massachusetts Department of Environmental Protection Bureau of Resource Protection - Wetlands Program
Checklist for Stormwater Report
Checklist (continued)
Standard 2: Peak Rate Attenuation
Standard 2 waiver requested because the project is located in land subject to coastal storm flowage and stormwater discharge is to a wetland subject to coastal flooding.
Evaluation provided to determine whether off-site flooding increases during the 100-year 24-hour storm.
Calculations provided to show that post-development peak discharge rates do not exceed pre-
development rates for the 2-year and 10-year 24-hour storms. If evaluation shows that off-site flooding increases during the 100-year 24-hour storm, calculations are also provided to show that post-development peak discharge rates do not exceed pre-development rates for the 100-year 24-hour storm.
Standard 3: Recharge
Soil Analysis provided.
Required Recharge Volume calculation provided.
Required Recharge volume reduced through use of the LID site Design Credits.
Sizing the infiltration, BMPs is based on the following method: Check the method used.
Static Simple Dynamic Dynamic Field1
Runoff from all impervious areas at the site discharging to the infiltration BMP.
Runoff from all impervious areas at the site is not discharging to the infiltration BMP and calculations
are provided showing that the drainage area contributing runoff to the infiltration BMPs is sufficient to generate the required recharge volume.
Recharge BMPs have been sized to infiltrate the Required Recharge Volume.
Recharge BMPs have been sized to infiltrate the Required Recharge Volume only to the maximum extent practicable for the following reason:
Site is comprised solely of C and D soils and/or bedrock at the land surface
M.G.L. c. 21E sites pursuant to 310 CMR 40.0000
Solid Waste Landfill pursuant to 310 CMR 19.000
Project is otherwise subject to Stormwater Management Standards only to the maximum extent practicable.
Calculations showing that the infiltration BMPs will drain in 72 hours are provided.
Property includes a M.G.L. c. 21E site or a solid waste landfill and a mounding analysis is included.
1 80% TSS removal is required prior to discharge to infiltration BMP if Dynamic Field method is used.

swcheck • 04/01/08 Stormwater Report Checklist • Page 5 of 8
Massachusetts Department of Environmental Protection Bureau of Resource Protection - Wetlands Program
Checklist for Stormwater Report
Checklist (continued)
Standard 3: Recharge (continued)
The infiltration BMP is used to attenuate peak flows during storms greater than or equal to the 10-
year 24-hour storm and separation to seasonal high groundwater is less than 4 feet and a mounding analysis is provided.
Documentation is provided showing that infiltration BMPs do not adversely impact nearby wetland resource areas.
Standard 4: Water Quality
The Long-Term Pollution Prevention Plan typically includes the following:
• Good housekeeping practices;
• Provisions for storing materials and waste products inside or under cover;
• Vehicle washing controls;
• Requirements for routine inspections and maintenance of stormwater BMPs;
• Spill prevention and response plans;
• Provisions for maintenance of lawns, gardens, and other landscaped areas;
• Requirements for storage and use of fertilizers, herbicides, and pesticides;
• Pet waste management provisions;
• Provisions for operation and management of septic systems;
• Provisions for solid waste management;
• Snow disposal and plowing plans relative to Wetland Resource Areas;
• Winter Road Salt and/or Sand Use and Storage restrictions;
• Street sweeping schedules;
• Provisions for prevention of illicit discharges to the stormwater management system;
• Documentation that Stormwater BMPs are designed to provide for shutdown and containment in the event of a spill or discharges to or near critical areas or from LUHPPL;
• Training for staff or personnel involved with implementing Long-Term Pollution Prevention Plan;
• List of Emergency contacts for implementing Long-Term Pollution Prevention Plan.
A Long-Term Pollution Prevention Plan is attached to Stormwater Report and is included as an attachment to the Wetlands Notice of Intent.
Treatment BMPs subject to the 44% TSS removal pretreatment requirement and the one inch rule for calculating the water quality volume are included, and discharge:
is within the Zone II or Interim Wellhead Protection Area
is near or to other critical areas
is within soils with a rapid infiltration rate (greater than 2.4 inches per hour)
involves runoff from land uses with higher potential pollutant loads.
The Required Water Quality Volume is reduced through use of the LID site Design Credits.
Calculations documenting that the treatment train meets the 80% TSS removal requirement and, if applicable, the 44% TSS removal pretreatment requirement, are provided.

swcheck • 04/01/08 Stormwater Report Checklist • Page 6 of 8
Massachusetts Department of Environmental Protection Bureau of Resource Protection - Wetlands Program
Checklist for Stormwater Report
Checklist (continued)
Standard 4: Water Quality (continued)
The BMP is sized (and calculations provided) based on:
The ½” or 1” Water Quality Volume or
The equivalent flow rate associated with the Water Quality Volume and documentation is provided showing that the BMP treats the required water quality volume.
The applicant proposes to use proprietary BMPs, and documentation supporting use of proprietary
BMP and proposed TSS removal rate is provided. This documentation may be in the form of the propriety BMP checklist found in Volume 2, Chapter 4 of the Massachusetts Stormwater Handbook and submitting copies of the TARP Report, STEP Report, and/or other third party studies verifying performance of the proprietary BMPs.
A TMDL exists that indicates a need to reduce pollutants other than TSS and documentation showing
that the BMPs selected are consistent with the TMDL is provided.
Standard 5: Land Uses With Higher Potential Pollutant Loads (LUHPPLs)
The NPDES Multi-Sector General Permit covers the land use and the Stormwater Pollution
Prevention Plan (SWPPP) has been included with the Stormwater Report.
The NPDES Multi-Sector General Permit covers the land use and the SWPPP will be submitted prior
to the discharge of stormwater to the post-construction stormwater BMPs.
The NPDES Multi-Sector General Permit does not cover the land use.
LUHPPLs are located at the site and industry specific source control and pollution prevention measures have been proposed to reduce or eliminate the exposure of LUHPPLs to rain, snow, snow melt and runoff, and been included in the long term Pollution Prevention Plan.
All exposure has been eliminated.
All exposure has not been eliminated and all BMPs selected are on MassDEP LUHPPL list.
The LUHPPL has the potential to generate runoff with moderate to higher concentrations of oil and grease (e.g. all parking lots with >1000 vehicle trips per day) and the treatment train includes an oil grit separator, a filtering bioretention area, a sand filter or equivalent.
Standard 6: Critical Areas
The discharge is near or to a critical area and the treatment train includes only BMPs that MassDEP
has approved for stormwater discharges to or near that particular class of critical area.
Critical areas and BMPs are identified in the Stormwater Report.

swcheck • 04/01/08 Stormwater Report Checklist • Page 7 of 8
Massachusetts Department of Environmental Protection Bureau of Resource Protection - Wetlands Program
Checklist for Stormwater Report
Checklist (continued)
Standard 7: Redevelopments and Other Projects Subject to the Standards only to the maximum extent practicable
The project is subject to the Stormwater Management Standards only to the maximum Extent
Practicable as a:
Limited Project
Small Residential Projects: 5-9 single family houses or 5-9 units in a multi-family development
provided there is no discharge that may potentially affect a critical area.
Small Residential Projects: 2-4 single family houses or 2-4 units in a multi-family development with a discharge to a critical area
Marina and/or boatyard provided the hull painting, service and maintenance areas are protected
from exposure to rain, snow, snow melt and runoff
Bike Path and/or Foot Path
Redevelopment Project
Redevelopment portion of mix of new and redevelopment.
Certain standards are not fully met (Standard No. 1, 8, 9, and 10 must always be fully met) and an
explanation of why these standards are not met is contained in the Stormwater Report.
The project involves redevelopment and a description of all measures that have been taken to
improve existing conditions is provided in the Stormwater Report. The redevelopment checklist found in Volume 2 Chapter 3 of the Massachusetts Stormwater Handbook may be used to document that the proposed stormwater management system (a) complies with Standards 2, 3 and the pretreatment and structural BMP requirements of Standards 4-6 to the maximum extent practicable and (b) improves existing conditions.
Standard 8: Construction Period Pollution Prevention and Erosion and Sedimentation Control
A Construction Period Pollution Prevention and Erosion and Sedimentation Control Plan must include the following information:
• Narrative;
• Construction Period Operation and Maintenance Plan;
• Names of Persons or Entity Responsible for Plan Compliance;
• Construction Period Pollution Prevention Measures;
• Erosion and Sedimentation Control Plan Drawings;
• Detail drawings and specifications for erosion control BMPs, including sizing calculations;
• Vegetation Planning;
• Site Development Plan;
• Construction Sequencing Plan;
• Sequencing of Erosion and Sedimentation Controls;
• Operation and Maintenance of Erosion and Sedimentation Controls;
• Inspection Schedule;
• Maintenance Schedule;
• Inspection and Maintenance Log Form.
A Construction Period Pollution Prevention and Erosion and Sedimentation Control Plan containing
the information set forth above has been included in the Stormwater Report.

swcheck • 04/01/08 Stormwater Report Checklist • Page 8 of 8
Massachusetts Department of Environmental Protection Bureau of Resource Protection - Wetlands Program
Checklist for Stormwater Report
Checklist (continued)
Standard 8: Construction Period Pollution Prevention and Erosion and Sedimentation Control (continued)
The project is highly complex and information is included in the Stormwater Report that explains why it is not possible to submit the Construction Period Pollution Prevention and Erosion and Sedimentation Control Plan with the application. A Construction Period Pollution Prevention and Erosion and Sedimentation Control has not been included in the Stormwater Report but will be submitted before land disturbance begins.
The project is not covered by a NPDES Construction General Permit.
The project is covered by a NPDES Construction General Permit and a copy of the SWPPP is in the
Stormwater Report.
The project is covered by a NPDES Construction General Permit but no SWPPP been submitted.
The SWPPP will be submitted BEFORE land disturbance begins.
Standard 9: Operation and Maintenance Plan
The Post Construction Operation and Maintenance Plan is included in the Stormwater Report and
includes the following information:
Name of the stormwater management system owners;
Party responsible for operation and maintenance;
Schedule for implementation of routine and non-routine maintenance tasks;
Plan showing the location of all stormwater BMPs maintenance access areas;
Description and delineation of public safety features;
Estimated operation and maintenance budget; and
Operation and Maintenance Log Form.
The responsible party is not the owner of the parcel where the BMP is located and the Stormwater
Report includes the following submissions:
A copy of the legal instrument (deed, homeowner’s association, utility trust or other legal entity) that establishes the terms of and legal responsibility for the operation and maintenance of the project site stormwater BMPs;
A plan and easement deed that allows site access for the legal entity to operate and maintain
BMP functions.
Standard 10: Prohibition of Illicit Discharges
The Long-Term Pollution Prevention Plan includes measures to prevent illicit discharges;
An Illicit Discharge Compliance Statement is attached;
NO Illicit Discharge Compliance Statement is attached but will be submitted prior to the discharge of
any stormwater to post-construction BMPs.