Embed Size (px)
Citation preview


i
Table of contents
Table of contents .............................................................................................................. i
List of figures ................................................................................................................... v
List of tables ................................................................................................................. xiii
Glossary ......................................................................................................................... xv
Nomenclature of the formulations ............................................................................ xvii
Abstract ......................................................................................................................... xix
Estratto in lingua italiana ............................................................................................ xxi
Aim of the thesis .......................................................................................................... xxv
1. Introduction ........................................................................................................... 1
1.1. Overview on additive manufacturing ................................................................. 1
1.1.1. Definition and classification of additive manufacturing ............................. 1
1.1.2. Generalized additive manufacturing process chain .................................... 6
1.1.3. Past, present and future of additive manufacturing .................................... 7
1.2. Additive manufacturing of cementitious and ceramic materials ........................ 9
1.2.1. Building and construction ........................................................................... 9
1.2.2. Other fields of application ........................................................................ 15
1.3. Geopolymers .................................................................................................... 17
1.3.1. Geopolymerization .................................................................................... 17
1.3.2. Factors affecting geopolymer properties .................................................. 19
1.3.3. Geopolymer as alternative to Portland cement ......................................... 21
1.4. The use of waste materials for filler purposes ................................................. 24
1.4.1. Microalgae for wastewater treatment ....................................................... 24
1.4.2. Lignin from wood pulping processes ........................................................ 28
1.4.3. Recycled glass fibres ................................................................................ 29
2. Materials and methods ........................................................................................ 31
2.1. Materials ........................................................................................................... 31
2.1.1. Metakaolin ................................................................................................ 31

ii
2.1.2. Alkaline activator ...................................................................................... 32
2.1.3. Bentonite ................................................................................................... 32
2.1.4. Biomass ..................................................................................................... 32
2.1.5. Recycled fibres .......................................................................................... 34
2.2. Formulations ..................................................................................................... 35
2.2.1. Formulations for 3D printing .................................................................... 35
2.2.2. Formulations for casting ............................................................................ 38
2.2.3. Formulations to study the effect of bentonite ............................................ 39
2.3. 3D printing setup .............................................................................................. 40
2.3.1. 3DRag ........................................................................................................ 40
2.3.2. Scale-up setup ........................................................................................... 42
2.4. Preparation of the samples ................................................................................ 46
2.4.1. Preparation of the pastes ........................................................................... 46
2.4.2. Casting ....................................................................................................... 46
2.4.3. 3D printing ................................................................................................ 47
2.5. Characterization techniques .............................................................................. 49
2.5.1. Characterization techniques adopted in preliminary studies ..................... 49
2.5.1.1. Thermogravimetric analysis (TGA) ...................................................... 49
2.5.1.2. X-ray diffraction (XRD) ........................................................................ 49
2.5.1.3. Fourier Transform Infra-Red Spectroscopy .......................................... 50
2.5.2. Rheology ................................................................................................... 50
2.5.3. Compression tests ...................................................................................... 54
2.5.4. Scanning electron microscope (SEM) and Energy-dispersive X-ray
spectroscopy (EDS) .................................................................................................. 55
3. Results and discussion ......................................................................................... 57
3.1. Preliminary studies ........................................................................................... 57
3.2. Unfilled geopolymer ......................................................................................... 58
3.2.1. Metakaolin and activator ........................................................................... 58
3.2.2. Effect of bentonite addition ....................................................................... 59
iii
3.2.3. Effect of bentonite type ............................................................................. 63
3.3. Geopolymers filled with microalgae ................................................................ 65
3.3.1. High-bentonite formulation ...................................................................... 65
3.3.1.1. Rheological behaviour of the pastes ..................................................... 65
3.3.1.2. Compression tests on fresh specimens .................................................. 67
3.3.1.3. Compression tests on hardened specimens ........................................... 69
3.3.1.4. SEM and EDS analyses ......................................................................... 80
3.3.2. Low-bentonite formulation ....................................................................... 92
3.3.2.1. Rheological behaviour of the pastes ..................................................... 92
3.3.2.2. Compression tests on hardened specimens ........................................... 99
3.3.2.3. SEM and EDS analyses ....................................................................... 104
3.3.3. High concentration of biomass ............................................................... 109
3.4. Feasibility study on the use of recycled glass fibres as filler ......................... 112
3.4.1. Rheological behaviour of the pastes ....................................................... 112
3.4.2. Compression tests on hardened specimens ............................................. 115
3.4.3. SEM and EDS analyses .......................................................................... 117
3.5. Scale-up .......................................................................................................... 121
3.5.1. Materials for scale-up ............................................................................. 121
3.5.2. Scale-up process and results ................................................................... 123
4. Conclusions and future developments ............................................................. 129
4.1. Conclusions .................................................................................................... 129
4.2. Future developments ...................................................................................... 131
Appendix ...................................................................................................................... 133
Results of preliminary studies ................................................................................... 133
Estimation of maximum height of printed structures ................................................ 137
Bibliography ................................................................................................................ 139
Ringraziamenti ............................................................................................................ 147

iv
v
List of figures
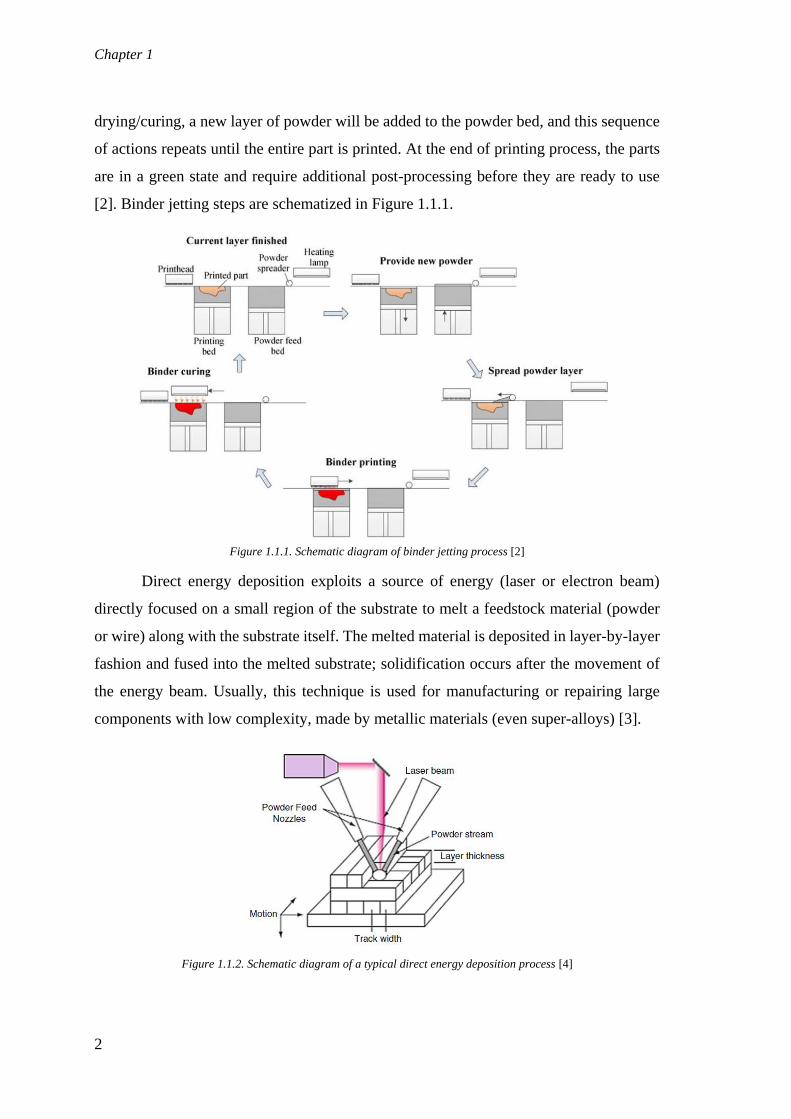
Figure 1.1.1. Schematic diagram of binder jetting process [2] ......................................... 2
Figure 1.1.2. Schematic diagram of a typical direct energy deposition process [4] ......... 2
Figure 1.1.3. Schematic representation of FDM (a) and DW (b) systems [7] .................. 3
Figure 1.1.4. Scheme of material jetting process [8] ........................................................ 4
Figure 1.1.5. Schematic representation of powder bed fusion AM process [7] ............... 4
Figure 1.1.6. Scheme of sheet lamination AM process [7] ............................................... 5
Figure 1.1.7. Shematic representation of SLA [7] ............................................................ 5
Figure 1.1.8. Scheme of a general AM process [7] .......................................................... 7
Figure 1.1.9. Examples of objects which are impossible to produce (in one piece) by
traditional manufacturing techniques [17] ................................................................ 9
Figure 1.2.1. Schematic representation of large- scale Contour Crafting [23] ............... 10
Figure 1.2.2. Schematic representation of D-shape processes [23] ................................ 11
Figure 1.2.3. Castle printed in-situ by Andrey Rudenko [25] ........................................ 12
Figure 1.2.4. Structures printed by WinSun: house (a) and five-story apartment (b) [25]
................................................................................................................................ 12
Figure 1.2.5. (a) BigDelta machine by WASP and (b) 3D printed structure [27] .......... 13
Figure 1.2.6. Crane by WASP: (a) blueprint of the modular structure, (b) printing
process, (c) final printed structure (Gaia), with added windows and roof [27] ...... 13
Figure 1.2.7. Structures obtained by D-shape technique: (a) project fo the city hall of
Pondera, (b) complete house, (c) CAD and actual printed part of a structural block
designed for a lunar outpost .................................................................................... 14
Figure 1.3.1. Different steps of geopolymerization, divided in two groups: dissolution
(in black box) and condensation/gel formation (in red box). Adapted from [44] and
[43] .......................................................................................................................... 18
Figure 1.3.2. Types of poly-sialates and their structures. Adapted from [37] and [44] .. 19
Figure 1.4.1. Scheme of eutrophication process [68] ..................................................... 25
Figure 1.4.2. Configurations for suspension cultures: (a) open pond in raceway
configuration; (b) tubular closed photobioreactor; (c) air-lift flat panel [71] ......... 27
Figure 1.4.3. Structure of lignin [77] .............................................................................. 28

vi
Figure 2.1.1. Particle size distribution (cumulative fraction in black, distribution fraction
in red) of metakaolin Mefisto L05, provided by the supplier ................................. 32
Figure 2.3.1. 3DRag in (a) FDM and (b) LDM configuration ........................................ 40
Figure 2.3.2. Schematic representation of LDM syringe extruder, designed by Dr.
Gabriele Natale [88] ................................................................................................ 41
Figure 2.3.3. Delta WASP 40100 Clay ........................................................................... 42
Figure 2.3.4. (a) STL model and (b) rendering of the machine toolpath of the pipe for
scale-up printing ...................................................................................................... 43
Figure 2.3.5. (a) Pirelli skyscraper; (b) STL model; (c) rendering of machine toolpath,
evidencing the infill ................................................................................................. 44
Figure 2.3.6. (a) STL model and (b) rendering of machine toolpath, evidencing the
spiral mode, of the hollow twisted structure selected for scaled-up printing .......... 45
Figure 2.4.1. PDMS moulds used for casting ................................................................. 46
Figure 2.4.2. PLA 3D printed mould used for fresh samples .......................................... 47
Figure 2.4.3. Hardened samples. From left to right: 3D printed hollow cylinder, casted
cylinder, casted cube ............................................................................................... 48
Figure 2.4.4. 3D printed full specimens .......................................................................... 48
Figure 2.5.1. Rotational rheometer Kinexus Pro+. ......................................................... 51
Figure 2.5.2. Fitting with Herschel-Bulkley model performed on flow curves of the
formulation HB-GEO .............................................................................................. 52
Figure 2.5.3. Model of a creep and recovery curve, in which the three different
responses are highlighted. Adapted from [91] ........................................................ 54
Figure 2.5.4. (a) ZwickRoell Z010 dynamometer equipped with square plates for
compression test; (b) plates during the test of a sample .......................................... 54
Figure 2.5.5. Scanning electron microscope EVO 50 Extended Pressure ...................... 56
Figure 3.2.1. Viscosity curve of the alkaline activator (a) and of geopolymer (only
metakaolin and alkaline activator) (b) ..................................................................... 58
Figure 3.2.2. Yield stress and compression strength plotted against the amount of
bentonite .................................................................................................................. 60
Figure 3.2.3. SEM micrograph and EDS analysis of sample C-GEO ............................. 61
Figure 3.2.4. Flow curves of geopolymer pastes (low-bentonite formulation) containing
different kinds of commercial bentonites ................................................................ 63
vii
Figure 3.2.5. Compression strength of 3d-printed specimens after 7 days of ambient
curing. Comparison between different bentonites and formulations ...................... 64
Figure 3.3.1. Flow curves of high-bentonite printable pastes, containing Spirulina ...... 65
Figure 3.3.2. Flow curves of high-bentonite printable pastes, containing Tetraselmis .. 66
Figure 3.3.3. Yield stress against biomass amount added to geopolymer pastes with HB
formulation .............................................................................................................. 67
Figure 3.3.4. Stress-strain curves of fresh specimens (HB formulation, containing
different amount of Spirulina), tested in compression ............................................ 68
Figure 3.3.5. Compressive strength of geopolymers (high-bentonite formulation,
containing biomass), tested on 3D printed hollow cylinders after 7 days of ambient
curing ...................................................................................................................... 70
Figure 3.3.6. Compressive strength of geopolymers (high-bentonite formulation,
containing biomass), tested on 3D printed hollow cylinders after 28 days of
ambient curing ........................................................................................................ 71
Figure 3.3.7. Compressive strength of geopolymers (high-bentonite formulation,
containing biomass), tested on 3D printed hollow cylinders after 7 days of ambient
curing and 4 hours of annealing at 800°C............................................................... 72
Figure 3.3.8. Compressive strength of geopolymers (high-bentonite formulation,
containing biomass), tested on 3D printed hollow cylinders after 28 days of
ambient curing and 4 hours of annealing at 800°C ................................................. 73
Figure 3.3.9. Compressive strength of geopolymers (high-bentonite formulation,
containing biomass), measured on cubic casted samples after 28 days of ambient
curing, annealed or not ............................................................................................ 74
Figure 3.3.10. Comparison between compressive strength values of 3D printed and
casted samples, evaluated at 28 days of curing at ambient temperature ................. 75
Figure 3.3.11. Comparison between compressive strength values of 3D printed and
casted samples, evaluated at 28 days of curing at ambient temperature and 4 hours
of annealing at 800°C ............................................................................................. 76
Figure 3.3.12. Example of an annealed cylindric casted specimen. Cracks are evident
before testing (a) and a burning in the central region can be observed from the
fracture surface (b) .................................................................................................. 77

viii
Figure 3.3.13. Compressive strength of geopolymers (high-bentonite formulation,
containing microalgal biomass residues), tested on 3D printed hollow cylinders
after 7 days of ambient curing ................................................................................. 78
Figure 3.3.14. Compressive strength of geopolymers (high-bentonite formulation,
containing microalgal biomass residues), tested on 3D printed hollow cylinders
after 28 days of ambient curing ............................................................................... 78
Figure 3.3.15. Compressive strength of geopolymers (high-bentonite formulation,
containing microalgal biomass residues), tested on 3D printed hollow cylinders
after 7 days of ambient curing and 4 hours of annealing at 800°C ......................... 79
Figure 3.3.16. Compressive strength of geopolymers (high-bentonite formulation,
containing microalgal biomass residues), tested on 3D printed hollow cylinders
after 28 days of ambient curing and 4 hours of annealing at 800°C ....................... 79
Figure 3.3.17. SEM imaging and EDS spectra of the sample HB-GEO ......................... 80
Figure 3.3.18. SEM micrographs of sample HB-GEO at different magnifications ........ 81
Figure 3.3.19. SEM imaging and EDS spectra of the sample HB-GSP5 ........................ 81
Figure 3.3.20. SEM micrographs of sample HB-GSP5 at different magnifications ....... 82
Figure 3.3.21. SEM imaging and EDS spectra of the sample HB-GTT5 ....................... 82
Figure 3.3.22. SEM micrographs of sample HB-GTT5 at different magnifications ...... 83
Figure 3.3.23. SEM imaging and EDS spectra of the sample HB-GLI5 ........................ 83
Figure 3.3.24. SEM micrographs of sample HB-GLI5 at different magnifications ........ 84
Figure 3.3.25. SEM imaging and EDS spectra of the sample HB-GEO (annealed) ....... 84
Figure 3.3.26. SEM imaging of annealed sample HB-GEO (magnified) ....................... 85
Figure 3.3.27. SEM imaging and EDS spectra of the sample HB-GSP5 (annealed) ...... 85
Figure 3.3.28. SEM imaging of annealed sample HB-GSP5 (magnified) ...................... 86
Figure 3.3.29. SEM imaging and EDS spectra of the sample HB-GTT5 (annealed) ..... 86
Figure 3.3.30. SEM imaging of annealed sample HB-GTT5 (magnified) ...................... 87
Figure 3.3.31. SEM imaging and EDS spectra of the sample HB-GLI5 (annealed) ...... 87
Figure 3.3.32. SEM imaging of annealed sample HB-GLI5 (magnified) ....................... 88
Figure 3.3.33. Compressive strength against average pore area (HB formulations) ...... 91
Figure 3.3.34. Flow curves of low-bentonite printable pastes, containing Spirulina ...... 92
Figure 3.3.35. Flow curves of low-bentonite printable pastes, containing Tetraselmis .. 92

ix
Figure 3.3.36. Yield stress against biomass amount added to geopolymer pastes with LB
formulation .............................................................................................................. 94
Figure 3.3.37. Plots resulting from dynamic rheological analyses performed in stress
sweep, at constant frequency. The linear region and the crossover point are always
visible. ..................................................................................................................... 95
Figure 3.3.38. Creep and recovery curves of geopolymer pastes containing Spirulina . 97
Figure 3.3.39. Comparison between printable and non-printable pastes ........................ 97
Figure 3.3.40. Compressive strength of geopolymers (low-bentonite formulation,
containing biomass), tested on 3D printed hollow cylinders after 7 days of ambient
curing .................................................................................................................... 100
Figure 3.3.41. Compressive strength of geopolymers (low-bentonite formulation,
containing biomass), tested on 3D printed hollow cylinders after 28 days of
ambient curing ...................................................................................................... 100
Figure 3.3.42. Compressive strength of geopolymers (low-bentonite formulation,
containing biomass), tested on 3D printed hollow cylinders after 7 days of ambient
curing and 4 hours of annealing at 800°C............................................................. 101
Figure 3.3.43. Compressive strength of geopolymers (low-bentonite formulation,
containing biomass), tested on 3D printed hollow cylinders after 28 days of
ambient curing and 4 hours of annealing at 800°C ............................................... 101
Figure 3.3.44. Comparison between compressive strength of formulations LB-GEO and
LB-GSP5, measured at 28 days on samples thermally treated or not ................... 103
Figure 3.3.45. SEM micrograph and EDS spectra of sample LB-GEO ....................... 104
Figure 3.3.46. SEM micrographs at different magnifications (sample LB-GEO) ........ 104
Figure 3.3.47. SEM micrograph and EDS spectra of sample LB-GSP5 ...................... 105
Figure 3.3.48. SEM micrographs at different magnifications (sample LB-GSP5) ....... 105
Figure 3.3.49. SEM micrograph and EDS spectra of sample LB-GEO (annealed) ..... 106
Figure 3.3.50. SEM micrographs at different magnifications (sample LB-GEO
(annealed)) ............................................................................................................ 106
Figure 3.3.51. SEM micrograph and EDS spectra of sample LB-GSP5 (annealed) .... 107
Figure 3.3.52. SEM micrographs at different magnifications (sample LB-
GSP5(annealed)) ................................................................................................... 107

x
Figure 3.3.53. Mixture obtained with an addition of 7 php of biomass to geopolymer
paste containing bentonite. The paste appears discontinuous, even with the addition
of supplementary water. ........................................................................................ 109
Figure 3.3.54. SEM micrograph and EDS spectra of sample C-GSP30 ....................... 110
Figure 3.3.55. SEM micrograph and EDS spectra of sample C-GSP30 (annealed) ..... 110
Figure 3.4.1. Flow curves (a) and viscosity curves (b) of pastes containing fibres ...... 112
Figure 3.4.2. Dynamic moduli of specimens containing fibres .................................... 113
Figure 3.4.3. Creep and recovery of geopolymer pastes containing fibres ................... 114
Figure 3.4.4. Compressive strength of geopolymers (low-bentonite formulation,
containing recycled glass fibres), tested on 3D printed hollow cylinders after 7
days of ambient curing .......................................................................................... 116
Figure 3.4.5. Compressive strength of geopolymers (low-bentonite formulation,
containing recycled glass fibres), tested on casted cylinders after 28 days of
ambient curing ....................................................................................................... 117
Figure 3.4.6. SEM micrograph and EDS spectra of sample C-GVF26 ........................ 118
Figure 3.4.7. SEM micrographs of C-GVF26 at different magnifications ................... 118
Figure 3.4.8. SEM micrograph and EDS spectra of sample C-GRR26; a large crack can
be noticed near the aggregate ................................................................................ 119
Figure 3.4.9. SEM micrograph and EDS spectra of sample C-GWR13 ....................... 119
Figure 3.4.10. Magnification of sample C-GWR13, showing a crack .......................... 119
Figure 3.4.11. SEM micrograph and EDS spectra of sample LB-GRR5 ...................... 120
Figure 3.4.12. SEM micrographs of sample LB-GRR5 at different magnifications .... 120
Figure 3.5.1. Flow curves of formulations containing bentonite B3 ............................. 122
Figure 3.5.2. SEM micrograph of LB-GSP5 for scale-up, containing B3 (a) and
formulated with B1 (b) .......................................................................................... 122
Figure 3.5.3. (a) Printing process of the pipe; (b) final structure, showing a bent shape
because of the structural failure occurred ............................................................. 124
Figure 3.5.4. Close-up on the failure point: as can be observed, the failure started in the
discontinuity due to the change of layer ................................................................ 125
Figure 3.5.5. (a) Printing process of Pirelli skyscraper model; (b) result of the printing
............................................................................................................................... 126
Figure 3.5.6. (a) Printing process of the hollow twisted structure; (b) final result ....... 127
xi
Figure A 1. TGA of the alkaline activator solution ...................................................... 133
Figure A 2. TGA of Spirulina ....................................................................................... 133
Figure A 3. TGA of Tetraselmis ................................................................................... 134
Figure A 4. TGA of red recycled glass fibres, performed on two batches ................... 134
Figure A 5. TGA of white recycled glass fibres, performed on three batches ............. 135
Figure A 6. XRD spectrum of metakaolin powder ....................................................... 135
Figure A 7. FT-IR spectrum of microalgae .................................................................. 136
Figure A 8. FT-IR spectra of microalgae and geopolymer before geopolymerization . 136
Figure A 9. FT-IR spectra of geopolymer and microalgae after geopolymerization ... 137

xii
xiii
List of tables
Table 1.2.1. Comparison between Contour Crafting and D-shape AM processes [23] . 11
Table 1.2.2. Comparison between AM technologies for ceramic materials [36] ........... 16
Table 2.1.1. Guaranteed composition of metakaolin Mefisto L05 ................................. 31
Table 2.1.2. Composition of Spirulina Platensis and Tetraselmis Suecida after
centrifugation .......................................................................................................... 33
Table 2.1.3. Composition of residues of Spirulina and Tetraselmis ............................... 33
Table 2.2.1. Formulations of pastes for LDM 3D printing, containing biomass ............ 36
Table 2.2.2. Formulations of pastes for LDM 3D printing, containing fibres ................ 37
Table 2.2.3. Formulations of pastes for casting .............................................................. 38
Table 2.2.4. Formulations prepared to study the effect of bentonite .............................. 39
Table 2.3.1. Printing parameters used with 3DRag LDM printer ................................... 42
Table 2.3.2. Printing parameters used with Delta WASP 40100 Clay ........................... 45
Table 2.5.1. Heating ramps adopted in thermogravimetric analyses .............................. 49
Table 3.2.1. Effect of bentonite addition on rheological properties ............................... 59
Table 3.2.2. Effect of bentonite amount on compression strength of hardened cubic
specimens, after 7 days of ambient curing .............................................................. 60
Table 3.2.3. Comparison between samples without and with bentonite: SEM
micrographs and ImageJ analyses of porosity ........................................................ 62
Table 3.2.4. Parameters of Herschel-Bulkley’s model fitted on the flow curves of
geopolymer pastes, containing different types of bentonite ................................... 63
Table 3.3.1. Parameters of Herschel-Bulkley's model for HB formulations, containing
biomass ................................................................................................................... 66
Table 3.3.2. Compressive strength values of hardened specimens with HB formulation
................................................................................................................................ 69
Table 3.3.3. Compressive strength of geopolymers containing microalgal biomass,
measured on cubic casted specimens after 28 days of ambient curing, annealed or
not ........................................................................................................................... 73
Table 3.3.4. Compressive strength of geopolymers (HB, containing biomass) tested on
different kinds of samples at 28 days ...................................................................... 74
Table 3.3.5. Surface and volume of geopolymer samples, having different geometries 75
xiv
Table 3.3.6. Compressive strength values of hardened specimens with HB formulation,
containing residues of Spirulina and Tetraselmis ................................................... 77
Table 3.3.7. ImageJ analyses of non-annealed samples with HB formulation ............... 89
Table 3.3.8. ImageJ analyses of annealed samples with HB formulation ....................... 90
Table 3.3.9. Parameters of Herschel-Bulkley's model for LB formulations, containing
biomass .................................................................................................................... 93
Table 3.3.10. Cross-over points and estimation of yield stress compared to yield stress
found from flow curves ........................................................................................... 96
Table 3.3.11. Instantaneous, retarded and total recovery of pastes containing microalgal
biomass (Spirulina) ................................................................................................. 98
Table 3.3.12. Compressive strength values of 3D printed hardened specimens with LB
formulation, containing Spirulina (from 1 to 5 php) and Tetraselmis (5 php) ........ 99
Table 3.3.13. Compressive strength of geopolymers (LB, containing biomass) tested on
different kinds of samples at 28 days .................................................................... 102
Table 3.3.14. Comparison between casted and 3D printed samples, having the same
geometry ................................................................................................................ 103
Table 3.3.15. ImageJ analyses of LB samples .............................................................. 108
Table 3.3.16. Compressive strength of sample with high microalgal biomass
concentration (30 php) .......................................................................................... 109
Table 3.3.17. Density of samples C-GEO and C-GSP30 .............................................. 111
Table 3.4.1. Effect of fibre addition on the rheological properties (flow) of geopolymer
pastes. Parameters of Herschel-Bulkley’s model are reported .............................. 113
Table 3.4.2. Instantaneous, retarded and total recovery of pastes containing fibres ..... 114
Table 3.4.3. Compressive strength values of 3D printed hardened specimens containing
recycled glass fibres, tested after 7 days of ambient curing .................................. 115
Table 3.4.4. Compressive strength values of cylindrical casted hardened specimens
containing recycled glass fibres, tested after 28 days of ambient curing .............. 116
Table 3.5.1. Composition of the formulation selected for the scale-up ........................ 121
Table 3.5.2. Flow parameters of the formulation chosen for the scale-up printing, fitted
according to Herschel-Bulkley's model................................................................. 122
Table 3.5.3. Formulation actually used in the scale-up printing. The composition is
slightly changed to adapt to the screw-extrusion printing process ........................ 123

xv
Glossary
#
3DP Three-dimensional Printing
A
AM Additive Manufacturing
C
CAD Computer-Aided Design
D
DIW Direct Ink Writing
DLP Direct Light Processing
DM Dry Matter
DW Direct Writing
E
EDS Energy-Dispersive X-ray Spectroscopy
ESA European Space Agency
F
FA Fly Ash
FDM Fused Deposition Modelling
FT-IR Fourier Transform Infra-Red spectroscopy
G
GBFS Granulated Blast Furnace Slag
I
ICT Information and Communication Technology

xvi
L
LCA Life Cycle Assessment
LDM Liquid Deposition Modelling
LOM Laminated Object Manufacturing
M
MK Metakaolin
O
OPC Ordinary Portland Cement
P
php per hundred parts
PLA Polylactic acid
R
RP Rapid Prototyping
S
SEM Scanning Electron Microscope
SLA Stereo Lithographic Apparatus
SLM Selective Laser Melting
SLS Selective Laser Sintering
T
TGA Thermogravimetric Analysis
U
UV Ultra-Violet
W
WASP World's Advanced Saving Project
XRD X-ray Diffraction

xvii
Nomenclature of the formulations
Each formulation prepared for 3D printing is identified by an acronym, which can
be generalized as XB – GYZN:
• XB represents the approach used. Specifically, it can be:
o HB for high-bentonite formulations
o LB for low-bentonite formulations
• G indicates that the material is a geopolymer
• YZ addresses the filler present in the mixture. It can be:
o SP, i.e. Spirulina
o TT, i.e. Tetraselmis
o LI, i.e. lignin
o RS, i.e. residues of Spirulina
o RT, i.e. residues of Tetraselmis
o VF, i.e. virgin glass fibre
o RR, i.e. red recycled glass fibre
o WR, i.e. white recycled glass fibre
o EO, if no additive is present
• N is a number indicating the amount of filler present in the mixture, expressed
per hundred parts by weight with respect to the amount of powders.
Formulations prepared for casting follow almost the same nomenclature rule,
except for the XB term, that is always substituted with a C.
Formulations prepared to study the effect of bentonite follow a different
nomenclature, which is simply B – x:
• B indicated that the formulation is used for the study of the effect of bentonite
• x is a number, indicating the amount of bentonite present in the formulation,
expressed in weight percentage with respect to the whole mass of the mixture.
Further details on formulations are reported in § 2.2.

xviii
xix
Abstract
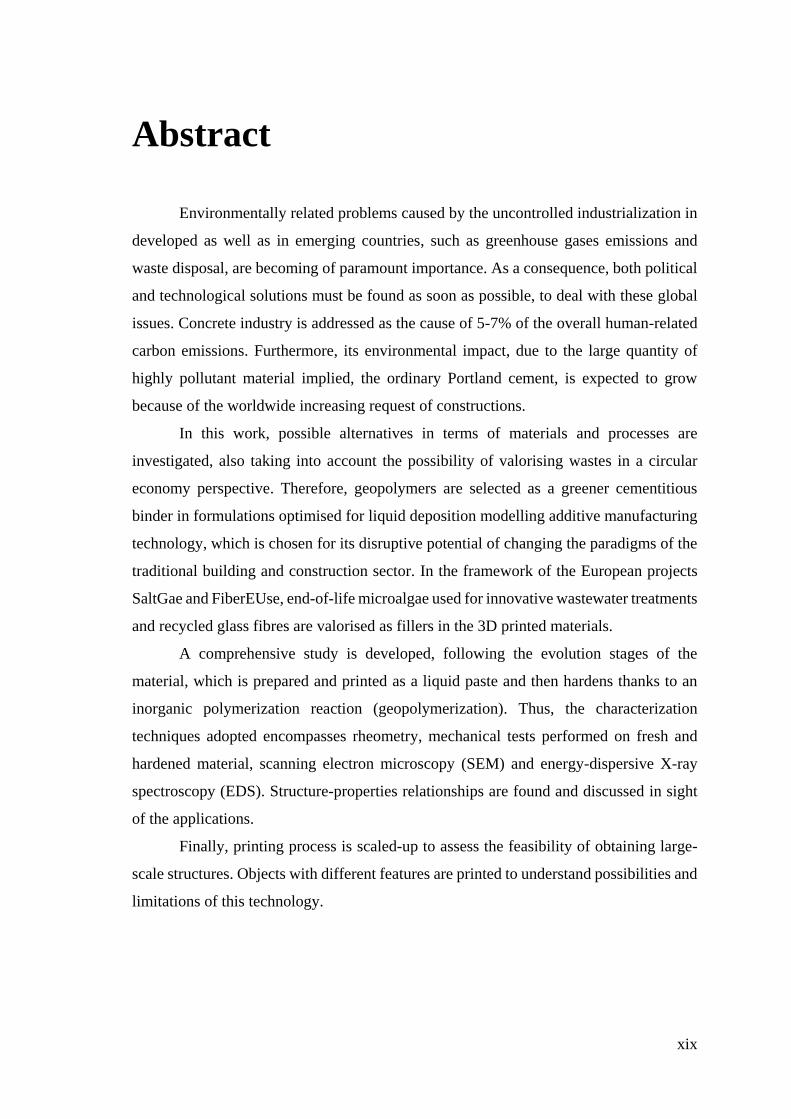
Environmentally related problems caused by the uncontrolled industrialization in
developed as well as in emerging countries, such as greenhouse gases emissions and
waste disposal, are becoming of paramount importance. As a consequence, both political
and technological solutions must be found as soon as possible, to deal with these global
issues. Concrete industry is addressed as the cause of 5-7% of the overall human-related
carbon emissions. Furthermore, its environmental impact, due to the large quantity of
highly pollutant material implied, the ordinary Portland cement, is expected to grow
because of the worldwide increasing request of constructions.
In this work, possible alternatives in terms of materials and processes are
investigated, also taking into account the possibility of valorising wastes in a circular
economy perspective. Therefore, geopolymers are selected as a greener cementitious
binder in formulations optimised for liquid deposition modelling additive manufacturing
technology, which is chosen for its disruptive potential of changing the paradigms of the
traditional building and construction sector. In the framework of the European projects
SaltGae and FiberEUse, end-of-life microalgae used for innovative wastewater treatments
and recycled glass fibres are valorised as fillers in the 3D printed materials.
A comprehensive study is developed, following the evolution stages of the
material, which is prepared and printed as a liquid paste and then hardens thanks to an
inorganic polymerization reaction (geopolymerization). Thus, the characterization
techniques adopted encompasses rheometry, mechanical tests performed on fresh and
hardened material, scanning electron microscopy (SEM) and energy-dispersive X-ray
spectroscopy (EDS). Structure-properties relationships are found and discussed in sight
of the applications.
Finally, printing process is scaled-up to assess the feasibility of obtaining large-
scale structures. Objects with different features are printed to understand possibilities and
limitations of this technology.

xx
xxi
Estratto in lingua italiana
Temi come il cambiamento climatico e il problema dello smaltimento dei rifiuti
sono sempre più al centro di ogni agenda politica e del dibattito pubblico, poiché la
necessità di trovare soluzioni per salvaguardare l’intero pianeta sta promuovendo azioni
legislative, iniziative sociali ed avanzamenti tecnologici. Uno dei settori maggiormente
d’impatto sulle emissioni di gas serra è l’industria del cemento, che da sola è responsabile
del 5-7% delle emissioni di carbonio legate ad attività umane. Il processo di produzione
del cemento tradizionale Portland presenta intrinsecamente l’emissione di grandi quantità
di CO2, che va moltiplicata per la sempre crescente quantità di materiale richiesto per
applicazioni edili ed infrastrutturali.
In questa tesi vengono proposte ed analizzate delle alternative agli schemi
tradizionali dell’industria del cemento sia in termini di materiali, sia per quanto riguarda
i processi. In sostituzione al cemento Portland è stato scelto un cemento geopolimerico a
base metacaolino, più ecosostenibile, formulato per l’uso nella stampa 3D da liquido
(LDM – Liquid Deposition Modelling), tecnologia che ha le potenzialità di rivoluzionare
i paradigmi dei processi industriali tradizionali. Inoltre, materiali a fine vita, considerati
rifiuti, sono stati impiegati come filler. In particolare, nel contesto dei progetti europei
SaltGae e FiberEUse, diversi tipi di microalghe usate per il trattamento di acque reflue e
di fibre di vetro riciclate sono stati forniti e valorizzati all’interno delle formulazioni
preparate.
L’applicazione di materiali cementizi, in particolare geopolimeri, nella stampa
LDM presenta vari aspetti da controllare ed ingegnerizzare. Di fondamentale importanza
è il comportamento reologico della miscela fresca, che deve essere pseudoplastico con
soglia di scorrimento per garantire la regolarità del flusso, il recupero della deformazione
applicata durante l’estrusione e la possibilità di sostenere i layer che vengono
progressivamente depositati. In seguito alla deposizione, il materiale evolve nel tempo,
andando ad indurirsi grazie alla reazione di geopolimerizzazione, che porta alla
formazione di un network amorfo basato su strutture di alluminosilicati. Il tempo di
indurimento è pertanto un altro fattore critico nel considerare processi che impiegano

xxii
questo tipo di materiali. Infine, le proprietà meccaniche del materiale indurito sono
condizionate sia dalla composizione chimica che dalla microstruttura che viene ottenuta.
Pertanto, al fine di studiare in modo completo questo tipo di materiali e l’effetto
degli additivi utilizzati su tutte le proprietà sopraelencate, varie formulazioni sono state
preparate e caratterizzate.
Per quanto riguarda le proprietà reologiche, sono state svolte analisi di diverso
tipo sia in regime statico sia in regime oscillatorio. Le curve di flusso ottenute in regime
statico, hanno mostrato che il comportamento delle formulazioni preparate per stampa 3D
è effettivamente pseudoplastico con soglia di scorrimento ed è stato modellato con
successo con l’equazione di Herschel-Bulkley. Mentre il comportamento pseudoplastico
è dovuto all’aggiunta della polvere di metacaolino alla soluzione dell’attivatore alcalino,
di per sé newtoniana, la comparsa della soglia di scorrimento è riconducibile unicamente
all’aggiunta della bentonite, utilizzata in questo studio come modificatore di reologia. La
presenza di biomassa algale incide principalmente sulla soglia di scorrimento, la quale
viene ridotta fino al 60% con l’aggiunta di biomassa al 3% in peso rispetto alle polveri.
Di conseguenza, la stabilità del flusso risulta migliorata, pur mantenendo valori
accettabili per sostenere il peso dei layer sovrastanti. Il trend di riduzione della soglia di
scorrimento, con un minimo corrispondente al 3%, è stato confermato anche dall’analisi
del punto di intersezione delle curve del modulo elastico e viscoso, ottenute in regime
oscillatorio. L’effetto delle fibre riciclate sulla reologia è invece diverso: la soglia di
scorrimento resta pressoché invariata, ma il comportamento è più vicino a quello
newtoniano e la viscosità apparente inferiore. Infine, le prove di creep e rilassamento
hanno mostrato l’esistenza di una finestra di stampabilità definita dalla quantità di
recupero della deformazione imposta: le formulazioni stampabili mostrano infatti un
recupero istantaneo della deformazione attorno al 10%, mentre quelle non stampabili si
attestano fra lo 0% e il 5%.
Il materiale fresco è stato testato anche mediante prove di compressione, per
analizzare l’evoluzione delle proprietà meccaniche nei primi stadi dell’indurimento. Si è
osservato che i campioni contenenti biomassa induriscono più velocemente della
formulazione di riferimento senza filler. Sottraendo acqua alla soluzione dell’attivatore,
la biomassa agisce pertanto da accelerante della reazione di geopolimerizzazione.
xxiii
Le proprietà meccaniche dei campioni induriti stampati in 3D e ottenuti per
casting sono state testate dopo 7 e 28 giorni di curing a temperatura ambiente. Il processo
di stampa non incide direttamente sulle proprietà meccaniche, ma l’aggiunta di bentonite
necessaria per ottenere le proprietà reologiche desiderate va ad influire negativamente
sulla resistenza a compressione, ridotta di oltre il 50%. Formulazioni con minore
contenuto di bentonite hanno infatti mostrato proprietà meccaniche migliori, tutte
all’interno dell’intervallo normativo per applicazioni ordinarie di 16 MPa – 45 MPa. Il
valore di 45 MPa è stato superato da alcune formulazioni, applicando un trattamento
termico a temperatura costante di 800 °C per 4 ore. Inoltre, nella maggior parte dei casi
si è dimostrato che il plateau di massime proprietà meccaniche viene già ottenuto dopo 7
giorni. L’aggiunta di biomassa algale come di fibre riciclate non risulta influenzare in
modo significativo le proprietà meccaniche; il lieve calo del valor medio di resistenza a
compressione osservabile per i campioni contenenti microalghe è infatti compreso
all’interno dell’intervallo di deviazione standard. Pertanto, tali materiali possono essere
efficacemente usati come filler fino ad aggiunte rispettivamente di 5 php e 10 php in
impasti per stampa 3D. Concentrazioni maggiori portano a riduzioni più significative
delle proprietà meccaniche o a difficoltà nell’ottenere impasti omogenei e stampabili.
L’utilizzo della lignina come filler, utilizzata come biomassa di confronto, ha invece
portato ad una riduzione molto più accentuata dei valori di resistenza a compressione.
Il principale effetto della biomassa sulla microstruttura è la creazione di pori e la
conseguente riduzione della densità, come dimostrato dalle immagini ottenute mediante
microscopia elettronica a scansione (SEM). Tali analisi hanno anche dimostrato che i
campioni sono in generale omogenei e non mostrano segni dovuti al processo di stampa
né aggregazioni riconducibili agli additivi utilizzati. Inoltre, il confronto fra provini
trattati termicamente e non, ha permesso di capire che l’effetto della cottura è
principalmente quello di ridurre le porosità ed uniformare ulteriormente la matrice.
Tramite l’analisi microstrutturale è stato quindi possibile legare le variazioni delle
proprietà meccaniche principalmente a due fattori, ovvero la porosità e la minore
resistenza della bentonite, che causano la presenza di punti di debolezza nella struttura
solida ottenuta.
La maggior parte delle stampe, tramite cui sono stati prodotti i campioni per le
prove meccaniche, è stata condotta utilizzando una stampante desktop 3DRag (volume di

xxiv
stampa 20 cm x 20 cm x 20 cm), adattata alla tecnologia LDM. Una volta ottimizzato il
processo, si è proceduto ad uno scale-up con una stampante WASP Delta 40100 (volume
di stampa 40 cm x 40 cm x 100 cm), per verificare la fattibilità di stampare strutture a
scala maggiore. Sono stati stampati tre oggetti dalle caratteristiche differenti, al fine di
verificare i pregi e le limitazioni della tecnologia LDM. I risultati hanno dimostrato che
possono essere stampate strutture dalle forme complesse, al patto che siano leggere e con
sbalzi non eccessivamente pronunciati. L’ottenimento di una buona rifinitura superficiale
e la resa dei dettagli è legata alla scelta dell’ugello rispetto alle dimensioni della struttura.
La principale limitazione della stampante utilizzata è la l’alimentazione a serbatoio, che,
unita al progressivo indurimento del materiale, ha imposto pause durante la stampa, con
conseguenti errori visibili anche nei pezzi finiti.

xxv
Aim of the thesis
In the framework of the European Union’s projects SaltGae and FiberEUse, the
aim of this work is to prepare and characterize geopolymer formulations for 3D printing
applications, loaded with recycled materials.
SaltGae project is developing an economically and technologically viable solution
to treat saline wastewaters with algal biomass. Dealing with end-of-life biomass is an
important part of the project, which is addressed in this work. Microalgal biomass is
compared in this thesis with lignin. Lignin is another biomass which represents a waste
in pulping industry.
FiberEUse is focused on the recycle of glass fibre components. The recycled fibres
are used in this work as fillers and their effect is compared to that of virgin glass fibres.
The characterization of the materials encompasses the study of rheology,
mechanical properties and microstructure, to give a comprehensive description useful for
the final applications mainly in building and construction industry

xxvi
.
1
1. Introduction
1.1. Overview on additive manufacturing
1.1.1. Definition and classification of additive manufacturing
The functionality of a manufactured object is derived from the combination of
geometry and materials’ properties. According to ISO/ASTM 52900:2015(E) [1], the
shaping of materials into objects can be achieved by one, or by a combination of three
basic principles:
• Formative shaping: the shape is obtained by the application of pressure to a
body of raw material;
• Subtractive shaping: the shape is acquired by the selective removal of
material;
• Additive shaping: the shape is given by successive addition of material.
Manufacturing processes based on additive shaping are included in the category
of additive manufacturing (AM), also designated as solid freeform fabrication (SFF),
Rapid Prototyping (RP), or, popularly, 3D printing.
Many 3D printing processes have been developed starting from the 1980s, and
several different classifications of them have been proposed. In the aforementioned
ISO/ASTM standard, additive manufacturing processes are sorted in seven categories:
binder jetting, direct energy deposition, material extrusion, material jetting, powder bed
fusion, sheet lamination and vat photopolymerization.
Binder jetting consists in selectively spreading a binding agent onto a ceramic or
metal powder bed to build a part one layer at a time. The most famous technique following
this approach is called three-dimensional printing (3DP). For the fabrication of each layer,
a layer of powder material is spread on top of the build platform and a printhead
selectively deposits certain amount of binder droplets at designated locations of the
powder bed. After binder deposition, the entire powder bed surface can be subjected to
external heating applied via a radiation heat source in order to partially cure the binder
and ensure adequate mechanical strength for consequent printing processes. After the
Chapter 1
2
drying/curing, a new layer of powder will be added to the powder bed, and this sequence
of actions repeats until the entire part is printed. At the end of printing process, the parts
are in a green state and require additional post-processing before they are ready to use
[2]. Binder jetting steps are schematized in Figure 1.1.1.
Figure 1.1.1. Schematic diagram of binder jetting process [2]
Direct energy deposition exploits a source of energy (laser or electron beam)
directly focused on a small region of the substrate to melt a feedstock material (powder
or wire) along with the substrate itself. The melted material is deposited in layer-by-layer
fashion and fused into the melted substrate; solidification occurs after the movement of
the energy beam. Usually, this technique is used for manufacturing or repairing large
components with low complexity, made by metallic materials (even super-alloys) [3].
Figure 1.1.2. Schematic diagram of a typical direct energy deposition process [4]
Introduction
3
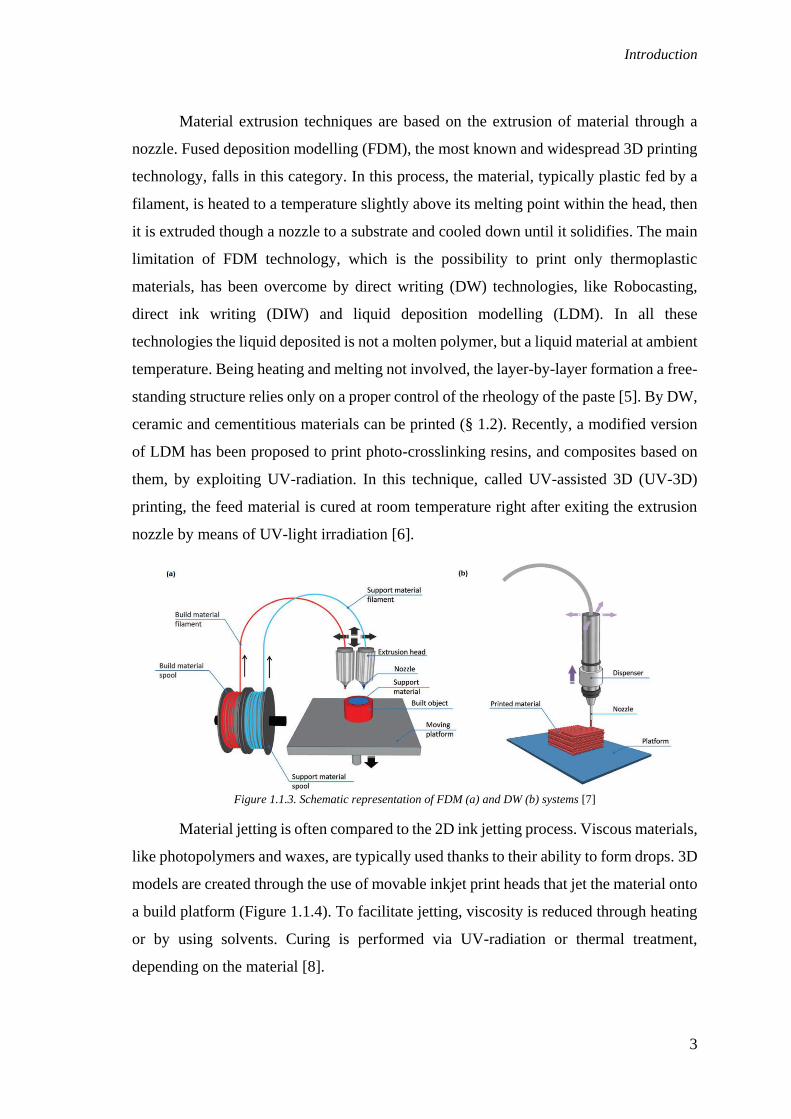
Material extrusion techniques are based on the extrusion of material through a
nozzle. Fused deposition modelling (FDM), the most known and widespread 3D printing
technology, falls in this category. In this process, the material, typically plastic fed by a
filament, is heated to a temperature slightly above its melting point within the head, then
it is extruded though a nozzle to a substrate and cooled down until it solidifies. The main
limitation of FDM technology, which is the possibility to print only thermoplastic
materials, has been overcome by direct writing (DW) technologies, like Robocasting,
direct ink writing (DIW) and liquid deposition modelling (LDM). In all these
technologies the liquid deposited is not a molten polymer, but a liquid material at ambient
temperature. Being heating and melting not involved, the layer-by-layer formation a free-
standing structure relies only on a proper control of the rheology of the paste [5]. By DW,
ceramic and cementitious materials can be printed (§ 1.2). Recently, a modified version
of LDM has been proposed to print photo-crosslinking resins, and composites based on
them, by exploiting UV-radiation. In this technique, called UV-assisted 3D (UV-3D)
printing, the feed material is cured at room temperature right after exiting the extrusion
nozzle by means of UV-light irradiation [6].
Figure 1.1.3. Schematic representation of FDM (a) and DW (b) systems [7]
Material jetting is often compared to the 2D ink jetting process. Viscous materials,
like photopolymers and waxes, are typically used thanks to their ability to form drops. 3D
models are created through the use of movable inkjet print heads that jet the material onto
a build platform (Figure 1.1.4). To facilitate jetting, viscosity is reduced through heating
or by using solvents. Curing is performed via UV-radiation or thermal treatment,
depending on the material [8].

Chapter 1
4
Figure 1.1.4. Scheme of material jetting process [8]
Powder bed fusion processes consist in a bed of powder, typically metallic, which
is selectively sintered or melted by a high energy source (laser or electron beam). To form
the 3D object, layers of powder are subsequently rolled on the previous one and fused
together. Size distribution and packing of the powder bed are the most important
parameters which determine the density of the printed part. Depending on the powder
material, different techniques can be used: while selective laser melting (SLM) is carried
out on metals with low melting temperature, typically aluminium and some steels,
selective laser sintering (SLS) is adopted for a variety of polymers, metals and alloy,
which can be sintered in the same range of temperatures [3].
Figure 1.1.5. Schematic representation of powder bed fusion AM process [7]
Sheet lamination, also known as laminated object manufacturing (LOM), involves
the stacking of laminated materials on top of one another after a layer contour definition
has been achieved by cutting tools. For each layer, a sheet of material is loaded onto a
stage and then undergoes the cutting process, done by laser or blade, which defines the
contour according to the CAD model. After the removal of the excess of material, the
process is repeated for the subsequent layer. Each layer is bonded to the previous one by
Introduction
5
using adhesives or welding techniques. Every material which is available in sheets can be
processed by this technique [7].
Figure 1.1.6. Scheme of sheet lamination AM process [7]
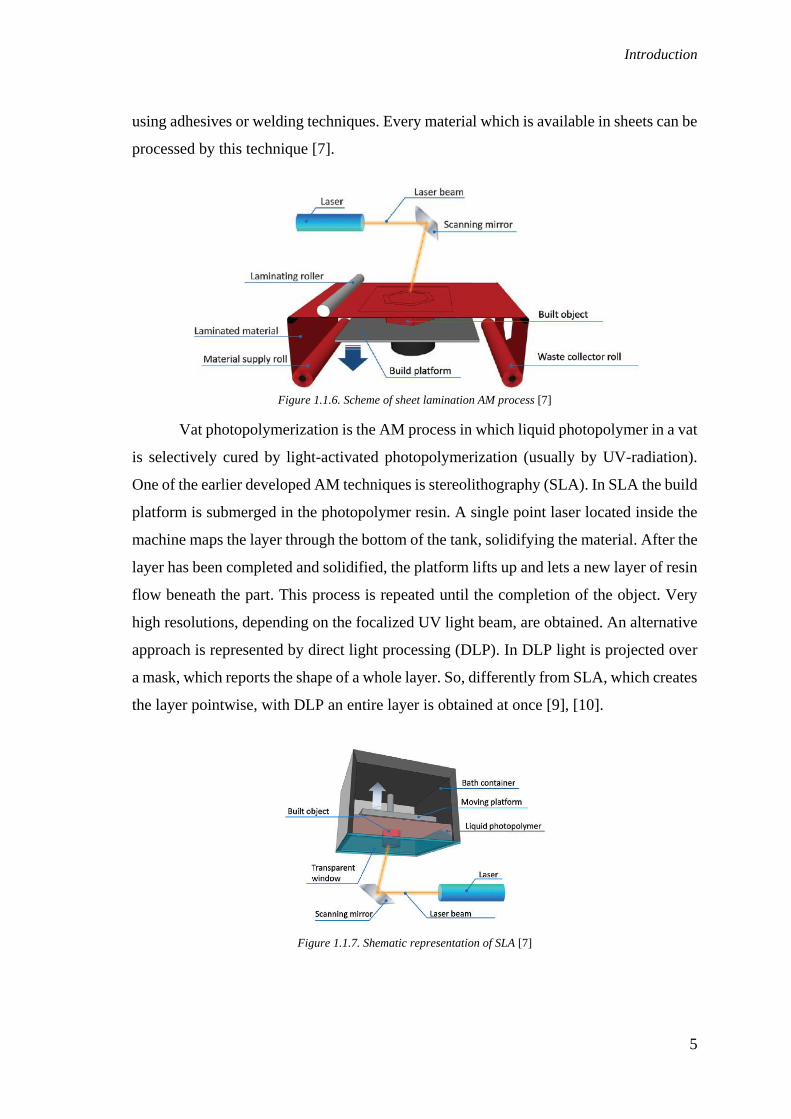
Vat photopolymerization is the AM process in which liquid photopolymer in a vat
is selectively cured by light-activated photopolymerization (usually by UV-radiation).
One of the earlier developed AM techniques is stereolithography (SLA). In SLA the build
platform is submerged in the photopolymer resin. A single point laser located inside the
machine maps the layer through the bottom of the tank, solidifying the material. After the
layer has been completed and solidified, the platform lifts up and lets a new layer of resin
flow beneath the part. This process is repeated until the completion of the object. Very
high resolutions, depending on the focalized UV light beam, are obtained. An alternative
approach is represented by direct light processing (DLP). In DLP light is projected over
a mask, which reports the shape of a whole layer. So, differently from SLA, which creates
the layer pointwise, with DLP an entire layer is obtained at once [9], [10].
Figure 1.1.7. Shematic representation of SLA [7]
Chapter 1
6
1.1.2. Generalized additive manufacturing process chain
Additive manufacturing is a digital technology, since a designed object can be
directly manufactured without passing through the production of a mould. This process
can be always schematized in eight steps [9]:
• 3D modelling
• conversion to STL
• transfer to AM machine and STL file manipulation
• machine setup
• build
• removal
• post-processing
• application
A 3D solid model is the starting point for the production of any AM part. It can
be obtained by computer aided design software (CAD) or by reverse engineering
equipment, such as 3D scanning and photogrammetry.
The conversion to STL file removes construction data and modelling history and
approximates the outer surfaces with a series of triangles (mesh). This process introduces
a certain degree of inaccuracy, which is directly proportional to the size of the mesh.
The STL file is then sliced, transforming the continuous contour into discrete stair
steps. Then, once sliced, the file is converted in a G-Code, which is composed by the
series of commands (tool path) the machine has to follow to perform the printing. G-Code
can include some machine setups, which in some cases can be also manually controlled
directly from the user interface.
At this point, after having set the machine and charged the material, printing
process can take place. The subsequent steps listed are highly dependent on materials and
technology implied, as well as on the final application. Post-processing can include the
removal of supports, thermal or chemical treatments, surface machining, application of
glazes, coating etc. [7], [9], [11].

Introduction
7
Figure 1.1.8. Scheme of a general AM process [7]
1.1.3. Past, present and future of additive manufacturing
Although 3D printing is commonly considered as a recent technology, the first
patent was filed in 1986 by Charles Hull, who invented the SLA system and then co-
founded the company “3D System” [7].
Starting from that moment, 3D printing has undergone a three-phase evolution
process. At the beginning, AM was intended just as rapid prototyping, to produce
prototypes and mockups of new designs in a quicker and cheaper way. Thanks to the low
costs of modifying prototypes, marketers could more easily test different product versions
based on customer and design feedback. In the second evolutionary phase, 3D printing
became an instrument used to create finished goods, rather than just prototypes.
According to Terry Wohlers, manager of a market resource firm specializing in 3d
printing, over 20% of the output of 3D printers is now in final products as opposed to
prototypes, and this ratio will rise to 50% by 2020. In the third phase, which is at its
beginning, 3D printers are owned by final consumers, just like personal computers or
traditional “2D” printers [12].
The last passage has been made possible by the low-cost and the relatively ease
of use of the most recent 3D printing technologies, especially FDM. A vibrant community
of 3D printing enthusiasts started sharing ideas and improving low-cost technologies,
both online and “offline”, in the so called “hackerspaces”, “makerspaces” and “fab labs”
[13]. Projects such as RepRap and Fab@home paved the way, starting from the beginning
of 2000s, to an open-source culture related to 3D printing, which moved the market,

Chapter 1
8
reducing furtherly the costs of the entry-level machines, as well as people’s attention and
expectations on this technology [4].
This phenomenon can be perfectly inserted in the larger framework of frugal
innovation. Frugal innovation is defined as the process by which “luxury” features are
obtained at low cost [14]. The term, coined in India, is directly linked to the ability of
making high value-added goods even with scarce resources, to meet the needs of low-
income customers. Redefining traditional manufacturing, 3D printing has the potential to
improve lives and to integrate those who were previously excluded from the formal
economy. By integrating the poor into the formal economy it can improve their standard
of living, leading to a positive and sustainable impact on economic empowerment, social
development and democratization [15].
Along with all these benefits, relatable to a socioeconomic perspective, there are
also many technical advantages of additive manufacturing with respect to traditional
manufacturing technologies. In comparison to traditional formative and subtractive
shaping techniques, such as injection moulding, casting and stamping, higher part
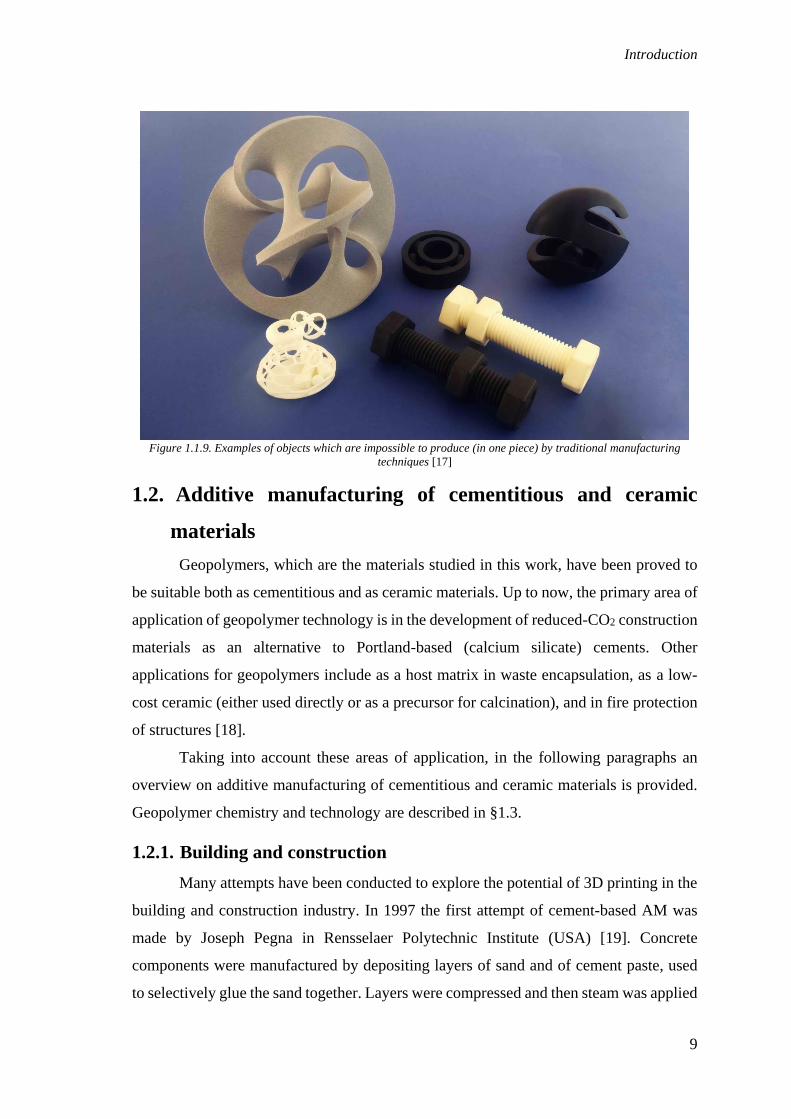
complexity can be achieved, obtaining shapes that are impossible or very difficult to
produce traditionally, as well as built-in interlocked object with no need of assembly
(Figure 1.1.9). While in metal casting and injection moulding, each new product requires
a new mould and in machining several tool changes are needed to create the finished
product, AM is a “single tool” process. Thanks to this aspect, AM is perfect to create
objects with customized and complex geometries. Moreover, since material is added
layer-by-layer, wastes are dramatically reduced [16].
Nonetheless, some intrinsic limitations of AM processes make them not suitable
for certain applications. The low speed to produce similar products in series, if compared
for example to injection moulding, makes it unsuitable for large standardized production.
Fine dimensional control and the possibility to manufacture a large variety of materials
were limitations that are now going to be overcome by research on materials and
optimization of machines [16].
Introduction
9
Figure 1.1.9. Examples of objects which are impossible to produce (in one piece) by traditional manufacturing
techniques [17]
1.2. Additive manufacturing of cementitious and ceramic
materials
Geopolymers, which are the materials studied in this work, have been proved to
be suitable both as cementitious and as ceramic materials. Up to now, the primary area of
application of geopolymer technology is in the development of reduced-CO2 construction
materials as an alternative to Portland-based (calcium silicate) cements. Other
applications for geopolymers include as a host matrix in waste encapsulation, as a low-
cost ceramic (either used directly or as a precursor for calcination), and in fire protection
of structures [18].
Taking into account these areas of application, in the following paragraphs an
overview on additive manufacturing of cementitious and ceramic materials is provided.
Geopolymer chemistry and technology are described in §1.3.
1.2.1. Building and construction
Many attempts have been conducted to explore the potential of 3D printing in the
building and construction industry. In 1997 the first attempt of cement-based AM was
made by Joseph Pegna in Rensselaer Polytechnic Institute (USA) [19]. Concrete
components were manufactured by depositing layers of sand and of cement paste, used
to selectively glue the sand together. Layers were compressed and then steam was applied

Chapter 1
10
to obtain rapid curing. In 1998, professor Berokh Khoshnevis [20] at the University of
Southern California (USA) developed a cementitious material AM process called
“Contour Crafting”, which later has become an effective method to print real-life houses.
Contour crafting is a direct writing AM technique, that can construct large scale
components (even buildings) by extruding cementitious materials through a gantry-driven
nozzle without using extra formworks. Smooth planar surfaces can be obtained by using
a top and a side-trowel attached to the extruder [21]. In general, four key parameters has
to be taken into account when dealing with cement extrusion-based processes [22]:
• pumpability: the ease and reliability with which material is moved through the
delivery system;
• printability: the ease and reliability of depositing material through a deposition
device;
• buildability: the resistance of deposited wet material to deformation under
load;
• open time: the period where the above properties are consistent within
acceptable tolerances.
Figure 1.2.1. Schematic representation of large- scale Contour Crafting [23]
In 2007, the Italian engineer Enrico Dini invented and patented a largescale
powder-based 3D printer, named “D-shape”, which is based on the use of sand and an
inorganic binder with 5–10 mm of the layer depth [24].
Introduction
11
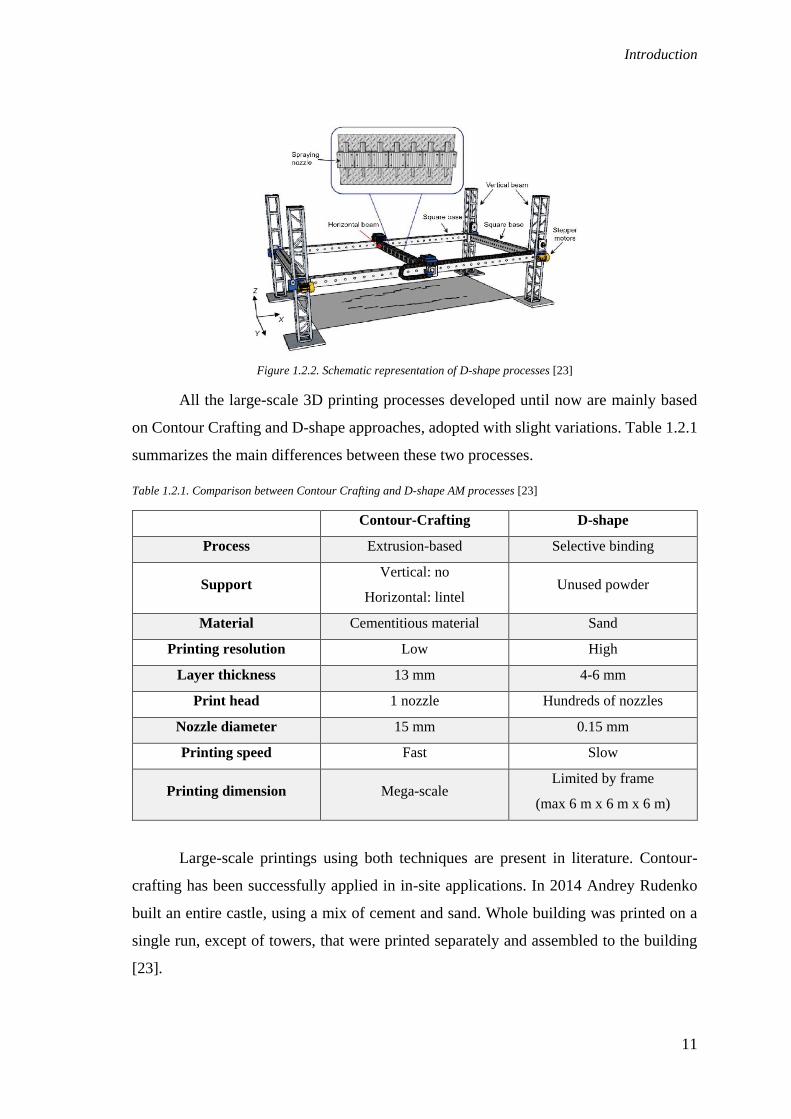
Figure 1.2.2. Schematic representation of D-shape processes [23]
All the large-scale 3D printing processes developed until now are mainly based
on Contour Crafting and D-shape approaches, adopted with slight variations. Table 1.2.1
summarizes the main differences between these two processes.
Table 1.2.1. Comparison between Contour Crafting and D-shape AM processes [23]
Contour-Crafting D-shape
Process Extrusion-based Selective binding
Support Vertical: no
Horizontal: lintel Unused powder
Material Cementitious material Sand
Printing resolution Low High
Layer thickness 13 mm 4-6 mm
Print head 1 nozzle Hundreds of nozzles
Nozzle diameter 15 mm 0.15 mm
Printing speed Fast Slow
Printing dimension Mega-scale Limited by frame
(max 6 m x 6 m x 6 m)
Large-scale printings using both techniques are present in literature. Contour-
crafting has been successfully applied in in-site applications. In 2014 Andrey Rudenko
built an entire castle, using a mix of cement and sand. Whole building was printed on a
single run, except of towers, that were printed separately and assembled to the building
[23].

Chapter 1
12
Figure 1.2.3. Castle printed in-situ by Andrey Rudenko [25]
In the same year, WinSun, a company in China, built ten houses in Shanghai using
a gigantic 3D printer (150 m×10 m×6.6 m) within 24 h. Each building (200 m2 floor area)
was entirely created by high-grade cement and glass fibres. After that, they built the
highest 3D printed building, a five-story apartment and the world’s first 3D printed villa,
whose parts were printed in a factory and then assembled together to create whole
construction [25].
Figure 1.2.4. Structures printed by WinSun: house (a) and five-story apartment (b) [25]
In 2015, the Italian company WASP (World’s Advanced Saving Project) created
a 12 m tall 3D printer (“BigDelta”) to study the possibility of producing houses with raw
materials available on the printing site, like clay and straws. A structure developed 2.7 m
in height and 5 m in diameter was printed, by an extrusion-based process (Figure 1.2.5).
In 2018 a new printing system, “Crane”, was introduced. Differently from “BigDelta”,
Crane is formed by printing moduli, each having a print volume of 6.60 m in diameter
and 3 m in height (Figure 1.2.6 a). With this configuration is theoretically possible to
cover any surface just by adding ties and print arms to the module, so making feasible the
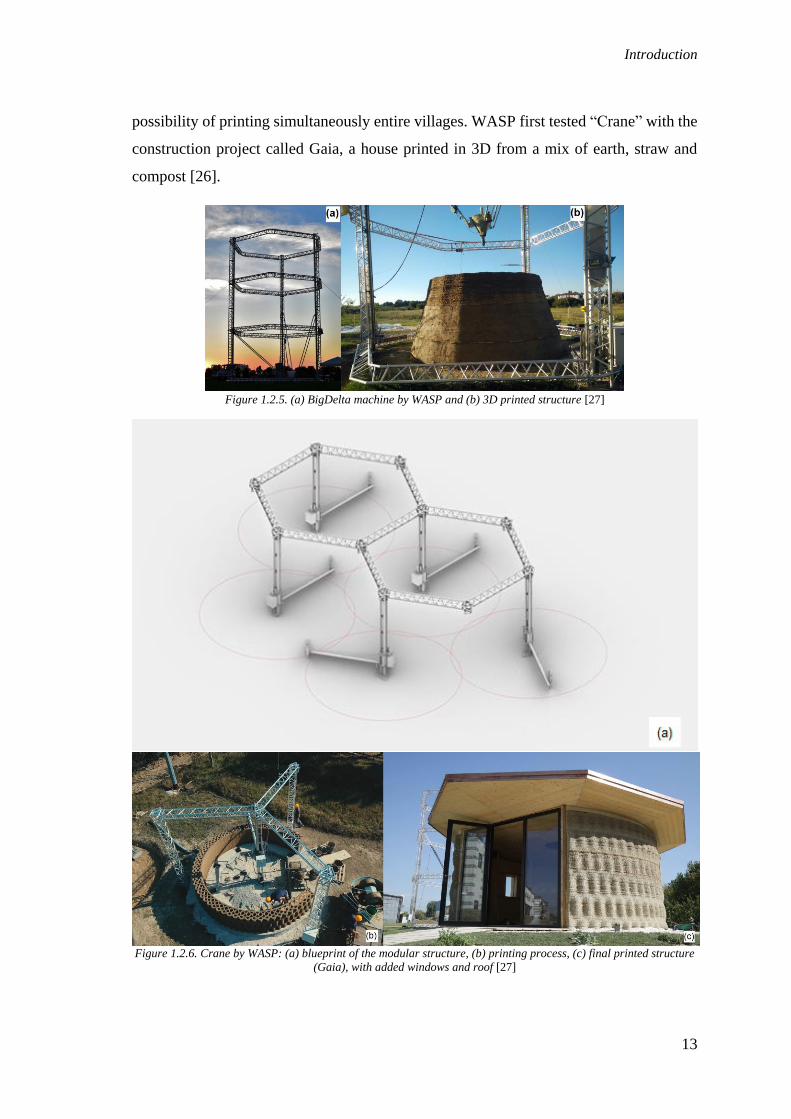
Introduction
13
possibility of printing simultaneously entire villages. WASP first tested “Crane” with the
construction project called Gaia, a house printed in 3D from a mix of earth, straw and
compost [26].
Figure 1.2.5. (a) BigDelta machine by WASP and (b) 3D printed structure [27]
Figure 1.2.6. Crane by WASP: (a) blueprint of the modular structure, (b) printing process, (c) final printed structure
(Gaia), with added windows and roof [27]
Chapter 1
14
WASP trial of using materials alternative to Portland cement is the only one
reported in literature for large-scale structures. Studies on 3D printing of greener building
materials are at their first stage. One example is represented by the group of Biranchi
Panda and his co-workers, who published many papers on 3D printed fly ash-based
geopolymers for building and construction applications [28]–[31].
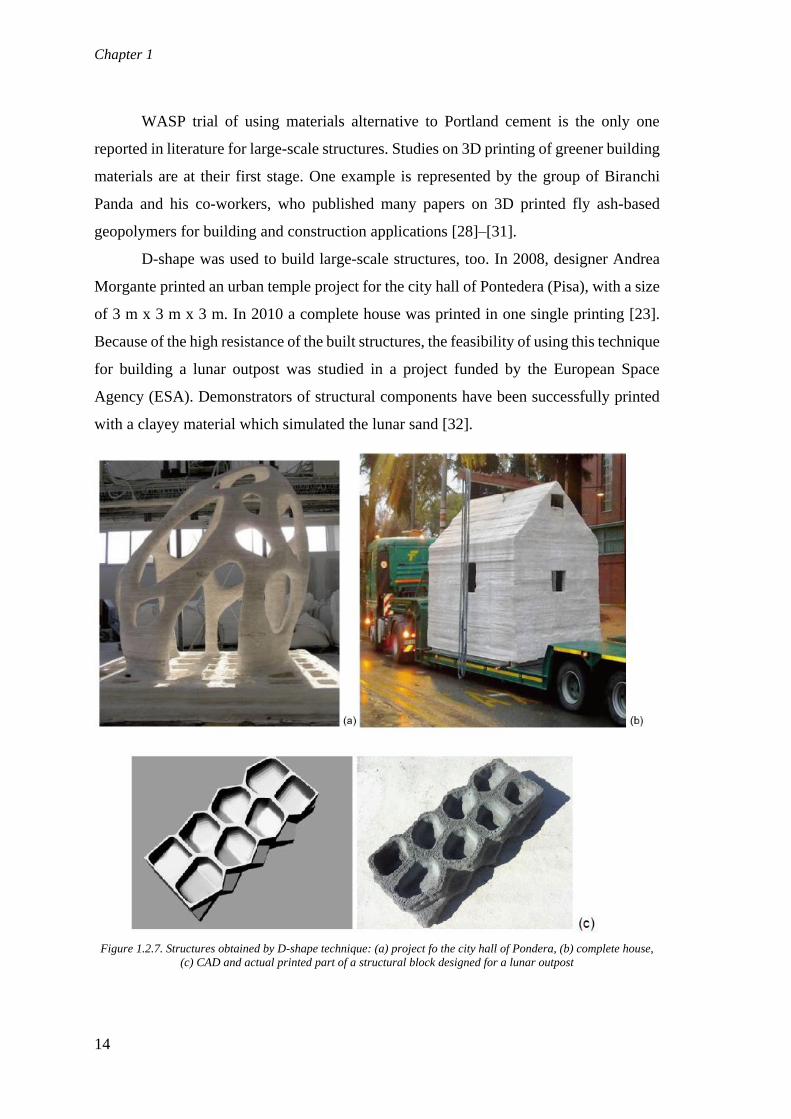
D-shape was used to build large-scale structures, too. In 2008, designer Andrea
Morgante printed an urban temple project for the city hall of Pontedera (Pisa), with a size
of 3 m x 3 m x 3 m. In 2010 a complete house was printed in one single printing [23].
Because of the high resistance of the built structures, the feasibility of using this technique
for building a lunar outpost was studied in a project funded by the European Space
Agency (ESA). Demonstrators of structural components have been successfully printed
with a clayey material which simulated the lunar sand [32].
Figure 1.2.7. Structures obtained by D-shape technique: (a) project fo the city hall of Pondera, (b) complete house,
(c) CAD and actual printed part of a structural block designed for a lunar outpost

Introduction
15
Large-scale 3D printed structures can be also obtained by printing small parts,
which can be assembled in situ afterwards. This approach, sometimes called “concrete
printing”, enables higher freedom of design and precision of manufacturing, better
foreseeing functional integrations like reinforcements [22].
Several benefits can come from large-scale 3D printing of cementitious materials.
As all AM technologies, since material is added layer-by-layer, wastes are reduced to the
minimum and self-standing structures can be obtained without the need of formworks.
Being an automated technology, lower manpower is needed, so costs can be potentially
reduced. Moreover, a high degree of flexibility in design can be introduced in a sector
which traditionally is characterized by standardization. On the other hand, since this
technology is at its infancy stage, some issues are yet to be overcome. Life cycle
performances of built structures are still unclear, as well as market response to this
technology [33]. In addition, reinforcements must be completely redesigned with respect
to traditional concrete technology, since no casting is performed. The direct in-print
entrainment of reinforcement cable into the concrete filament during printing is still at a
research level [34].
1.2.2. Other fields of application
Enabling the fabrication of very complex shapes, AM can make a breakthrough
in ceramic and concrete industry, which has been technologically underdeveloped for
many years [35]. Applications of AM of ceramics different from building and
construction can be divided mainly in two classes: production of porous structures and of
dense monolithic bodies. It is well-known that most of the AM technologies successfully
applied to the manufacture of ceramics have been used to fabricate porous structures, for
example, scaffolds for biological applications, filters, lightweight structures etc. In these
cases, a certain amount of random and residual porosity in the solid ceramic part is
tolerated or even desired, as it provides further functionality to the component. On the
other hand, there are very few AM technologies on the market capable of generating fully
dense monolithic ceramic bodies. AM of monolithic ceramics, enabling the components
to fully retain their superior physico-chemical properties, is still a challenge and remains
the most important task that needs to be solved to promote AM of ceramics to more than
a niche technology [36].
Chapter 1
16
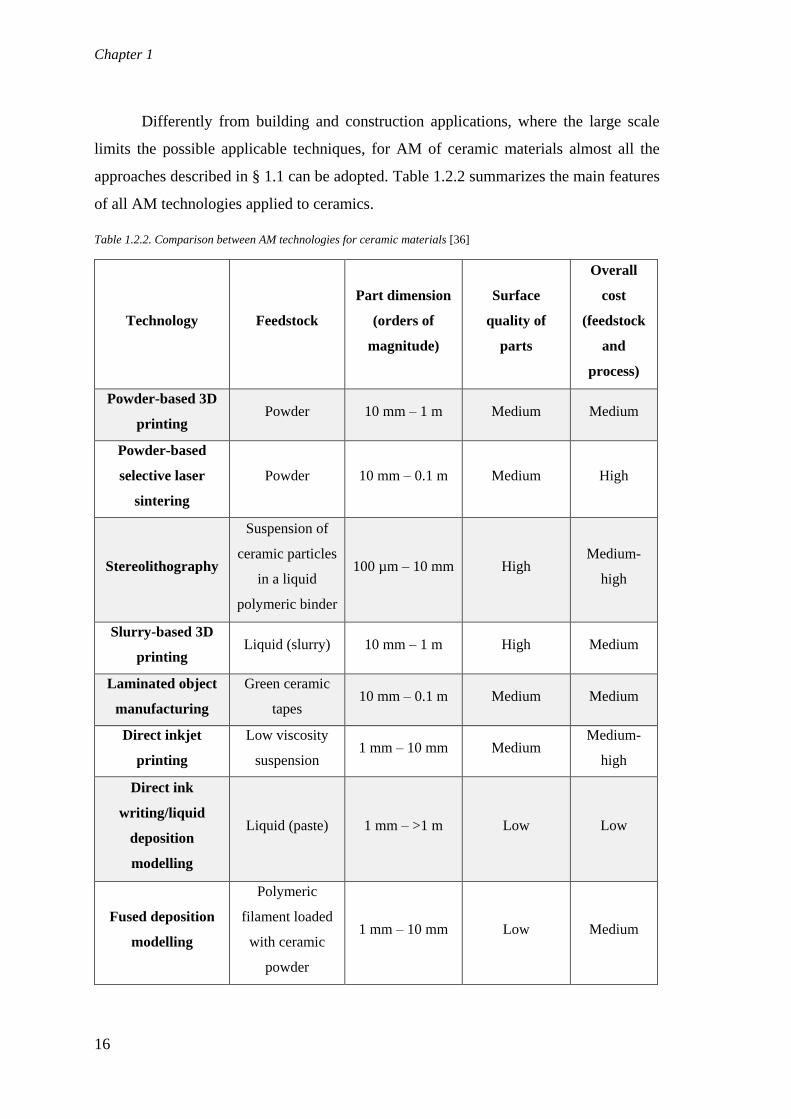
Differently from building and construction applications, where the large scale
limits the possible applicable techniques, for AM of ceramic materials almost all the
approaches described in § 1.1 can be adopted. Table 1.2.2 summarizes the main features
of all AM technologies applied to ceramics.
Table 1.2.2. Comparison between AM technologies for ceramic materials [36]
Technology Feedstock
Part dimension
(orders of
magnitude)
Surface
quality of
parts
Overall
cost
(feedstock
and
process)
Powder-based 3D
printing Powder 10 mm – 1 m Medium Medium
Powder-based
selective laser
sintering
Powder 10 mm – 0.1 m Medium High
Stereolithography
Suspension of
ceramic particles
in a liquid
polymeric binder
100 µm – 10 mm High Medium-
high
Slurry-based 3D
printing Liquid (slurry) 10 mm – 1 m High Medium
Laminated object
manufacturing
Green ceramic
tapes 10 mm – 0.1 m Medium Medium
Direct inkjet
printing
Low viscosity
suspension 1 mm – 10 mm Medium
Medium-
high
Direct ink
writing/liquid
deposition
modelling
Liquid (paste) 1 mm – >1 m Low Low
Fused deposition
modelling
Polymeric
filament loaded
with ceramic
powder
1 mm – 10 mm Low Medium
Introduction
17
1.3. Geopolymers
Inorganic polymers, more commonly referred to as “geopolymers” or alkali-
activated cements, are alumino-silicate materials which exhibit excellent physical and
chemical properties and a diverse range of potential applications, including precast
structures and non-structural elements, concrete pavements and products, containment
and immobilisation of toxic, hazardous and radioactive wastes, advanced structural
tooling and refractory ceramics, and fire resistant composites used in buildings,
aeroplanes, shipbuilding, racing cars, and the nuclear power industry [37].
The name “geopolymer” was coined in 1972 by the French chemist Davidovits to
identify ceramic materials which are formed by inorganic polymerization of mineral raw
materials typically coming from geological sources [38]. The principal means of
synthesising geopolymers is to combine an alkaline solution with a reactive
aluminosilicate powder. This results in the formation of a disordered alkali
aluminosilicate gel phase, known as the geopolymeric gel binder phase [18].
Raw materials can be natural (alumino-silicate) minerals or industrial wastes such
as fly ash, slag, waste glass [39] and rice husk [40]. In particular, metakaolin (MK) is a
thermally treated product from kaolin, which is one of the naturally occurring abundant
minerals in the earth's crust [41].
In the following paragraphs, the most important aspects of geopolymer chemistry
and the technology, as well as the future perspectives, are presented and discussed.
1.3.1. Geopolymerization
The reaction leading to the formation of the geopolymer network is a
polycondensation, occurring in different steps, by a still controversial reaction scheme.
The basic steps of geopolymerization involve dissolution in alkaline environment of solid
alumino-silicate oxides in MOH solution (where M is an alkali metal), diffusion or
transportation of dissolved Al and Si complexes from the particle surface to the inter-
particle space, formation of a gel phase resulting from the polymerization between added
silicate solution and Al and Si complexes and finally hardening of the gel phase [42]. The
separation between these steps is not clear: the reactions probably occur simultaneously
once the solid material is mixed with liquid activator. Therefore, the aforementioned

Chapter 1
18
separation has just a thermodynamic meaning [43]. Figure 1.3.1 reports the chemical
equations related to the different steps of geopolymerization.
Figure 1.3.1. Different steps of geopolymerization, divided in two groups: dissolution (in black box) and
condensation/gel formation (in red box). Adapted from [44] and [43]
The result of geopolymerization is a sialate (silicon-oxo-aluminate) network
consisting of SiO4 and AlO4 tetrahedra linked alternately by sharing all oxygen atoms.
Positive ions such as Na+, K+ and Ca2+ must be present in the framework cavities to
balance the negative charge of Al3+. Poly(sialates) are chain and ring polymers with Si4+
and Al3+ in 4-fold coordination with oxygen and their empirical formula is displayed as
Mn (– (SiO2)z – AlO2)n ∙ wH2O, where z is 1, 2 or 3, M is a monovalent cation such as K+
or Na+ and n is the degree of polycondensation. The overall structure can be amorphous
or semi-crystalline, consisting of chains, sheet-like and three-dimensional networks [37],
[45]. Figure 1.3.2 shows the three types of polysialates identified by Davidovits [46] and
sketches of the possible 3D networks that can be formed in the geopolymer structure.

Introduction
19
Figure 1.3.2. Types of poly-sialates and their structures. Adapted from [37] and [44]
1.3.2. Factors affecting geopolymer properties
The setting process and the final microstructural and mechanical properties of
geopolymers are affected by the chemical composition and by external parameters, such
as pH and temperature.
Setting time is mainly controlled by the alumina content and increases with
increasing SiO2/Al2O3 ratios in the initial mixtures [47]. SiO2/Al2O3 ratio affects also
mechanical properties: mixtures containing high content of alumina (i.e. low SiO2/Al2O3
ratio) display lower mechanical properties in general. Duxson et al. found that
compressive strength of metakaolin based geopolymers linearly increases by
approximately 400% from Si/Al = 1.15 to Si/Al = 1.90. Higher Si/Al ratios shows lower
mechanical properties because of unreacted raw material, which acts as weaker points
[48].
Alkali cations have an important role, as well. According to Van Jaarsveld, alkali
metal cations control and affect almost all stages of geopolymerization and in particular
during gel hardening and crystal formation, cations contribute to the structure formation
of geopolymers [49]. In geopolymerization, the alkali metal content of reacting minerals
could have a significant effect on strength development in contrast to concrete
manufacture where the presence of alkali metals is undesirable due to stresses developed
by alkali activation [42]. The size of the cation also affects the eventual crystal
morphology. Na+, having a smaller size than K+, displays strong pair formation with

Chapter 1
20
smaller silicate oligomers (such as monomers). The larger size of K+ favours the
formation of larger silicate oligomers with which Al(OH)4− prefers to bind. Therefore, in
KOH solutions more geopolymer precursors exist resulting thus in better setting and
stronger compressive strength compared to geopolymers synthesised in NaOH solutions.
K+ is seemingly responsible for a higher degree of condensation when compared to Na+
under the same conditions. Matrices containing K+ exhibited higher compressive strength
and specific surface area, but lower degree of crystallinity and resistance to attack by HCl
[39].
The presence of calcium is beneficial in geopolymer network, since it can form
amorphously structured Ca-Al-Si gel, which reduces porosity and enhance mechanical
properties [37]. Moreover, it was found that both the rate and the extent of metakaolin
dissolution were enhanced. Accelerating dissolution increases the Al concentration in
solution, thus reducing Si/Al available for geopolymer gel formation and further
accelerating the gel formation to cause faster setting [50].
Being a reactant in the first stage and a product in the second stage of
geopolymerization, water plays a very important role in the reaction. Since alkali
solutions of high concentration can activate the reactive raw material in a quicker and
stronger way, the presence of too much water will reduce the geopolymerization rate at
first stage because of its dilution effect. At the beginning of condensation stage, too high
concentration of water can hinder polycondensation kinetically. However, at the end of
polycondensation, residual water can cause an increase of reaction rate. This strange
phenomenon may be caused by the continuous dissolution of residual solid particles and
hydrolysis of generated Al3+ and Si4+ [43]. Moreover, once the geopolymer network is
formed, the evaporation of residual water contained in the pores can cause shrinkage, due
to the contraction of the gel [51].
Alkali also affect pH, which is one of the main parameters to control mechanical
properties. pH in the range of 13-14 is found to be the most suitable for the achievement
of optimal mechanical properties [45].
Geopolymerization is an exothermal reaction, occurring spontaneously even at
room temperature. Curing at higher temperatures, keeping constant the humidity, leads to
an increasing rate and extent of reaction, improving mechanical properties. The beneficial

Introduction
21
effect of temperature is subjected to a proper control of water evaporation, because of the
aforementioned motivations [41], [51].
1.3.3. Geopolymer as alternative to Portland cement
During the last 50 years, geopolymers have proved to be a valid alternative to
Portland cement (OPC). Along with interesting engineering properties, equal or even
higher than OPC, and the effective passivation of steel rebars, geopolymers have many
peculiar properties:
• Fire resistance [52]
• Fast hardening [53]
• Encapsulation of heavy metals and mine tailings [49], [54]–[56]
• Possibility to obtain highly porous inorganic foams [57]
• Synthesis also from wastes, such as fly ashes, blast furnace slag [58]
• Possibility of using organic waste materials as filler [59]
• Low permeability and high resistance to chloride ingress and freeze-thaw [49]
• Acid resistance [42]
• Low CO2 footprint [60]
Thanks to these properties, geopolymers are finding their applications in niche
market sectors, like wastewater treatment, thermal insulation, refractory and nuclear
waste storage.
However, relatively little progress has been made towards commercial utilisation
in concrete industry. The poor acceptance by the concrete industry is mainly due to the
entrenched position of OPC concrete, and it is well known that the industry is quite
conservative in adopting new and innovative technologies and products that will replace
existing ones [37].
Along with this attitude problem, legislative and technical issues must be solved,
which are respectively related to the need for standards in each governmental jurisdiction
and to the unanswerable question on durability of geopolymer concrete, given a standard
requirement for structural concretes to last for at least several decades. In the developed
world, there are very specific standards for what is considered “acceptable” performance
for a cementitious binder, which have clearly been developed over many years in
collaboration with input from the cement manufacturing companies with the chemistry

Chapter 1
22
and behaviour of OPC-based concretes in mind. Despite this, standards containing
constraints, like the minimum cement content, are beginning to be seen as prohibitive,
even for cement-based systems. High cement content essentially allows and encourages
mix design favouring poor quality aggregates and high water content. Products such as
geopolymer concrete, or other non-cementitious and even high-performance cementitious
based systems, may not simply be an evolution of existing OPC technology but instead
may require an entirely different chemical paradigm to understand their behaviour, and
may perform acceptably even without conforming exactly to the established regulatory
standards [61].
Provided that a practical mechanism can be put in place to achieve regulatory
acceptance of geopolymer concrete in the market, the question still remains over
durability. A material that has been subjected to detailed investigation only recently
cannot possibly have decades’ worth of durability data to prove its long-term stability.
Most standard methods of testing cement and concrete durability involve exposing small
samples to very extreme conditions – like highly concentrated acid or salt solutions – for
short periods of time. These results are then used to predict how the material will perform
in normal environmental conditions over a period of decades or more. The major problem
with this approach to prove durability is that it can only give indications of the expected
performance, rather than definitive proof. Therefore, there has been a process of very
slow adoption of new materials, as one may need to wait up to 20–30 years for real-world
verification. Adoption of fly ash and slag in concretes is the prime example, where the
use of these supplementary materials was resisted for decades [18].
The propellent for the evolution of concrete industry should be the need of a
greener technology. Concrete is the most widely used construction material. Current
average consumption of concrete is about 1 t/year per every living human being, second
only to water consumption. Due to its large consumption, even small reductions of
greenhouse gas emissions per ton of manufactured concrete can make a significant global
impact. Manufacture of OPC requires the mining of limestone and releasing of carbon
dioxide, according to the following reaction [45]:
For each ton of limestone mined, one-third is released as carbon dioxide.
Emissions of greenhouse gases through industrial activities have a major impact on global

Introduction
23
warming and it is believed that at least 5–7% of CO2 released to the atmosphere is due to
the production of OPC. The demand for worldwide cement production is increasing by
approximately 30% per decade as of 2016, and the need for new infrastructure
construction in developing nations is projected to force the demand up for cement in the
coming years. Manufacture of Portland cement is the fourth largest contributor to
worldwide carbon emissions and is only behind petroleum, coal, and natural gas in
releasing carbon dioxide that has been locked beneath the earth’s surface for millions of
years. The new cement factories that are being built mostly in developing nations to meet
this forthcoming demand are unsustainable in the long term for three main reasons:
• Cement factories are extremely capital-intensive developments. Once the
capital is invested, the investor is committed to cement-production tonnages
to recoup their capital investments. Cement manufacturers are notoriously
well connected in the construction industry and are resistant to any new low-
carbon technologies to protect their investments. Once capital investments are
locked into new cement factories, there is little incentive for the cement
manufacturers to embrace low-carbon technologies.
• Since cement manufacture is largely automated employments are low with
respect to investments: a modern plant usually employs less than 150 people.
• OPC production process is highly energy intensive: each ton of cement
produced requires 60–130 kg of fuel oil or its equivalent, depending on the
cement variety and the process used, and about 110 kWh of electricity [62].
Geopolymerization has definitely a good potential for the production of “green”
concrete and construction materials with lower carbon footprint. In order to accurately
assess this potential, the environmental impact of geopolymers has to be quantified by
considering also the impact of the by-products (or wastes) used through Life Cycle
Assessment (LCA) studies. From the analysis of works present in literature, geopolymer
concrete made from fly ash (FA) and granulated blast furnace slag (GBFS) results in
lower CO2 emissions than OPC concrete. The environmental impact of geopolymer
concrete is related with the use of sodium silicate solution as activator that results in
pollution transfer within all other environmental impact categories. Nowadays, the
production of sodium silicate utilizes pure glass cullet, but discarded glass cullet could be
Chapter 1
24
easily used as alternative silicate source. Concerning instead metakaolin-based
geopolymer concrete, it has been shown that due to the low Si/Al ratio in metakaolin a
high amount of sodium silicate is required, causing thus a higher environmental impact
with respect to fly ash and slag-based geopolymers, but still lower than OPC [63]–[65].
Therefore, the best way for the concrete industry to reach its current CO2
objectives, would be to produce geopolymer concrete from raw material with a suitable
Si/Al molar ratio which is recognised as industrial waste and does not have an allocation
impact [60].
1.4. The use of waste materials for filler purposes
As previously discussed, geopolymers can be filled with organic and inorganic
additives, in some cases even improving in their properties. In this thesis, different wastes,
both organic (microalgal biomass and lignin) and inorganic (recycled glass fibres), are
used as filler of 3D printed geopolymers.
In the following paragraphs, the applications and the end-of-life management of
the materials used as filler in this work are presented.
1.4.1. Microalgae for wastewater treatment
Nowadays, although the strategic importance of fresh water is universally
recognized more than ever before, and although issues concerning sustainable water
management can be found almost in every scientific, social, or political agenda all over
the world, water resources seem to face severe quantitative and qualitative threats. The
pollution increase, industrialization and rapid economic development, impose severe
risks to availability and quality of water resources in many areas worldwide.
Watercourses receive pollution from many different sources, from towns and villages,
consisting of discharges from manufacturing or industrial plants, run-off from agricultural
land and leachates from solid waste disposal sites. The composition of wastewater is a
complex mixture of natural organic and inorganic materials as well as man-made
compounds. Three quarters of organic carbon in sewage are present as carbohydrates,
fats, proteins, amino acids, and volatile acids. The inorganic constituents include large
concentrations of sodium, calcium, potassium, magnesium, chlorine, sulphur, phosphate,
bicarbonate, ammonium salts and heavy metals [66].

Introduction
25
One of the main consequences of discharge of these saline waters containing lots
of nutrients in seas, lakes and rivers is the phenomenon of eutrophication (Figure 1.4.1).
Eutrophication occurs when a dense bloom of algae grows in water due to presence of
high concentrations of nitrogen and phosphorus, the main nutrients of concern. This
reduces the level of oxygen in the aquatic system to less than the natural level that is
required by other aquatic organisms causing their death [67].
Figure 1.4.1. Scheme of eutrophication process [68]
The ability of microalgae to grow quickly in water that is rich in nutrients can be
positively used in wastewater treatment to remove the nutrients from wastewater before
discharge to the river. Thus, microalgae have the potential for alternative wastewater
treatment systems with almost zero concentration of final nutrients [69].
The aim of wastewater treatment is to convert the waste materials present in
wastewaters into stable oxidised end products which can be safely discharged to inland
or coastal waters without any adverse ecological effects. A wastewater treatment plant is
a combination of separate treatment processes or units designed to produce an effluent of
specified quality from a wastewater influent of known composition and flow rate. Unit
treatment processes can be classified into five stages [70]:

Chapter 1
26
• Preliminary treatment consists in the removal and disintegration of gross
solids and grits, and in the separation of storm water. Oil and grease are also
removed at this stage if present in large amounts;
• Primary (sedimentation) treatment usually involves the removal of settleable
solids which are separated as sludge;
• Secondary (biological) treatment consists in the oxidation of the dissolved and
colloidal organics by the action of micro-organisms;
• Tertiary treatment is a further treatment of a biologically treated effluent to
eliminate the organic content (expressed by the parameter BOD5), bacteria,
suspended solids, specific toxic compounds or nutrients to enable the final
effluent to comply with standards;
• Sludge treatment, finally, consists in the dewatering, stabilisation and disposal
of sludge.
Microalgae growth in waste waters is inserted in the secondary and tertiary
treatment. There are mainly two approaches to grow microalgae: suspended cultures and
immobilized cultures.
In suspended cultures, algae are grown in a continuously agitated water to keep
them in suspension. Open and closed photobioreactor systems can be adopted. The most
commonly used open system is the so-called raceway pond (Figure 1.4.2a), which is made
of a closed loop recirculation channel, no more than 0.3 m deep in order to provide enough
sunlight to allow photosynthesis by microalgae. Raceways are relatively inexpensive to
build and operate, but often suffer low productivity. A less expensive, but more
productive alternative is given by closed suspension systems. Several configurations of
closed photobioreactor can be found: in tubular arrays (Figure 1.4.2b) water containing
biomass is moved by pressure, while in air-lift panels (Figure 1.4.2c) water movement is
promoted by bubbling. Also for these systems, the dimension of the channels containing
algae is selected to promote sunlight arrival and photosynthesis [71]–[73].

Introduction
27
Figure 1.4.2. Configurations for suspension cultures: (a) open pond in raceway configuration; (b) tubular closed
photobioreactor; (c) air-lift flat panel [71]
Immobilized cultures, also known as attached cultures, are based on microalgae
growing in the form of biofilm on the surface of substrates. Attached microalgae
cultivation could overcome the issues of high energy, high cost and difficult harvesting
of traditional suspended systems because it shows higher microalgae biomass
productivity, requires less space and water consumption, and it can be easily scaled-up at
industrial level. However, with this technique the culture control is low. This is why, up
to now, the most used cultivation techniques remain the suspended ones [74].
Institutions are increasing their attention through the problem of wastewater
treatment and to economic viable alternatives to tackle it. European Union, along with
legislation activity, promoted the project SaltGae in the framework of Horizon 2020
research and innovation programme. The aim of the project is to implement and
demonstrate at large scale the long-term technological and economic feasibility of an
innovative, sustainable and efficient solution for the treatment of high salinity wastewater
based on the use of microalgae. In addition to an effective and ecological solution for
wastewater treatment, SaltGae includes in its workplan the valorisation of end-of-life
algal biomass into different by-products for high value-added applications, including
extraction of compounds, animal feed, synthesis of platform chemicals, preparation of
edible coatings and fillers for bioplastics and ceramics. This view of end-of-life
management of microalgae is supposed to furtherly reduce the economic and
environmental impact of the treatment [75].
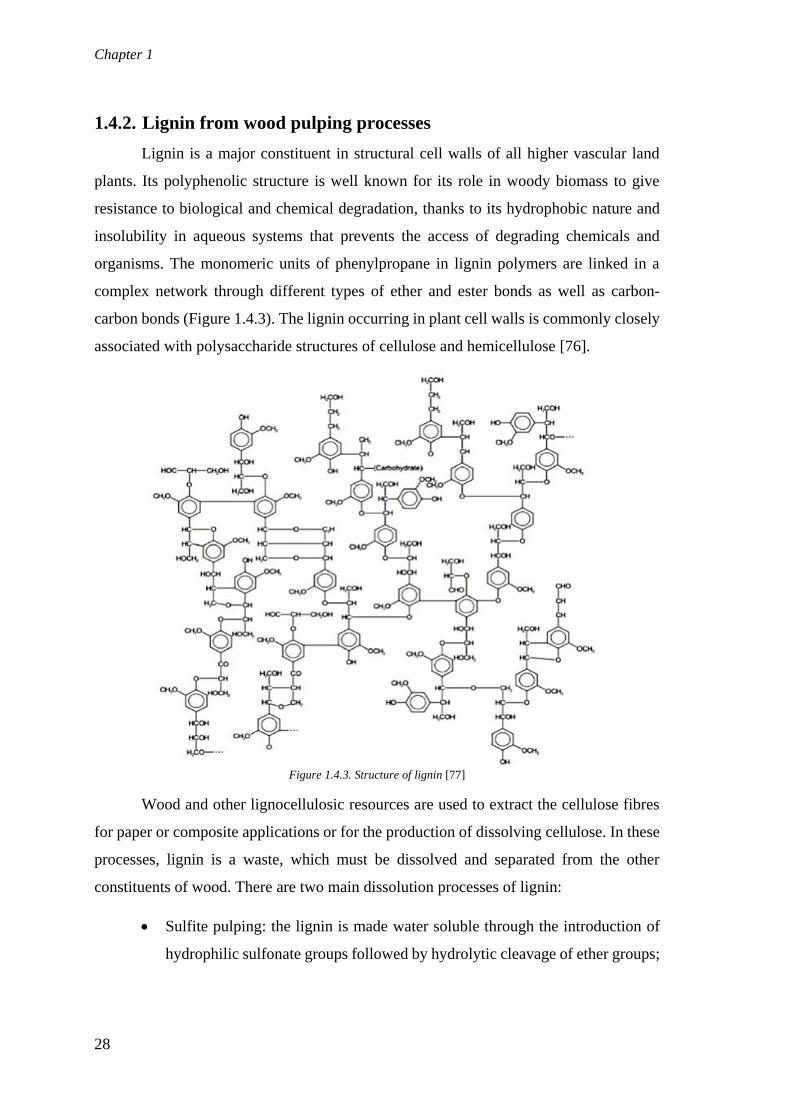
Chapter 1
28
1.4.2. Lignin from wood pulping processes
Lignin is a major constituent in structural cell walls of all higher vascular land
plants. Its polyphenolic structure is well known for its role in woody biomass to give
resistance to biological and chemical degradation, thanks to its hydrophobic nature and
insolubility in aqueous systems that prevents the access of degrading chemicals and
organisms. The monomeric units of phenylpropane in lignin polymers are linked in a
complex network through different types of ether and ester bonds as well as carbon-
carbon bonds (Figure 1.4.3). The lignin occurring in plant cell walls is commonly closely
associated with polysaccharide structures of cellulose and hemicellulose [76].
Figure 1.4.3. Structure of lignin [77]
Wood and other lignocellulosic resources are used to extract the cellulose fibres
for paper or composite applications or for the production of dissolving cellulose. In these
processes, lignin is a waste, which must be dissolved and separated from the other
constituents of wood. There are two main dissolution processes of lignin:
• Sulfite pulping: the lignin is made water soluble through the introduction of
hydrophilic sulfonate groups followed by hydrolytic cleavage of ether groups;
Introduction
29
• Kraft (and soda) pulping: the lignin structure is modified and depolymerized
through the action of strong aqueous alkali with simultaneous presence of
hydrosulfide ions [78].
Today, around 95% of the worldwide production of lignin is mainly applied as
fuel for biorefinery plants, while just the 5% is commercialized for the production of
adhesives, dispersants for dyes, surfactants, pesticides, fertilizers, additives for concrete
[79].
Rapidly increasing concentration of carbon dioxide in the atmosphere resulting in
successive global warming has created a growing awareness that the future society must
rely much more on renewable resources both for energy production and in material
systems. In this development, biomass will play important roles. Consequently, several
initiatives have been taken to develop new and simplified separation processes for
biomass polymers and many laboratories are also working on the development of new
products and material combinations in which lignin is involved, as an alternative to
burning [80].
1.4.3. Recycled glass fibres
As the thermoset and thermoplastic composite technology evolves, more and more
materials are being replaced by glass fibre composites, which can provide high
performing products in several applications. The need to find a way to recycle these
composites is a real concern, urged by the gradually stricter environmental legislation.
Several recycling techniques for glass fibre components exist:
• Mechanical recycling: this recycling approach (also called “grinding”)
consists in the shredding of the composite into powder of finer or coarser
dimension. The process starts with low-speed cutting or crushing of the
material to a size of 50-100 mm, which is further reduced to 10 mm – 50 μm.
The hammer mill process is a common method that reduces the size of the
material through impact and shear action until it can pass through a defined
size of milling screening holes [81].
• Thermal processes: the general principle of thermal processes is that the
composite is heated in a furnace with operative temperatures between 450°C
and 700°C based on the resin type. Polyester resins require a lower

Chapter 1
30
temperature than epoxy and thermoplastic ones. The resin is volatilised into
lower-weight molecules while releasing mainly gases, such as hydrogen,
methane and carbon dioxide. Oil fraction can be used for combustion, but it
leaves char on the fibres, thus requiring additional purification steps that might
further lower the properties of the material [82], [83].
• Solvolysis: this technique is based on nucleophilic substitution or elimination,
where the nucleophile is a solvent molecule. During the process, a reactive
solvent, alone or mixed with reactive or not co-solvent, diffuses inside the
material and cleaves specific bonds, such ester bonds in polyesters. This
implies that it is possible to recover monomers from the polymeric matrix
while leaving the fibres clean from residual material [84]. To degrade the
polymeric matrix, solvolysis needs temperatures lower than pyrolysis, hence
it is advantageous. However, to reach supercritical conditions of the liquids,
the reactor has to sustain severe temperature and pressure conditions, as well
as the corrosion caused by the modified properties of the solvent. As a
consequence, the machinery has high maintenance costs and few industries
adopted this technique [85].
European Union is promoting glass fibre recycling, in compliance with the waste
treatment legislation. In the framework of the already mentioned Horizon 2020
programme, the project FiberEUse aims at integrating different innovation actions
through a holistic approach to enhance profitability of composite recycling and reuse in
value-added products. Through new cloud-based ICT solutions for value-chain
integration, scouting of new markets, analysis of legislation barriers, life cycle assessment
for different reverse logistic options, FiberEUse wants to support industry in the transition
to a circular economy model for composites [86].

31
2. Materials and methods
2.1. Materials
The geopolymer formulations present in this study are based on the following
components:
• Metakaolin
• Alkaline activator
• Bentonite
• Filler (biomass or fibre)
All formulations contain metakaolin and the activator in a fixed ratio of 5/4. The
presence and the amount of other components may vary (formulations are reported in §
2.2).
2.1.1. Metakaolin
The raw material (Mefisto L05) is provided by České lupkové závody a.s.. The
composition guaranteed by the supplier is reported in Table 2.1.1.
Table 2.1.1. Guaranteed composition of metakaolin Mefisto L05
Al2O3
(wt%)
SiO2
(wt%)
K2O
(wt%)
Fe2O3
(wt%)
TiO2
(wt%)
MgO
(wt%)
CaO
(wt%)
41.1 54.1 0.8 1.1 1.8 0.18 0.13
The specific surface of the powder is 12.69 m2/g and the average particle size d50
is 3 µm. Figure 2.1.1 shows the particle size distribution curves.

Chapter 2
32
Figure 2.1.1. Particle size distribution (cumulative fraction in black, distribution fraction in red) of metakaolin
Mefisto L05, provided by the supplier
2.1.2. Alkaline activator
A commercial alkaline activator based on Na2SiO3 and NaOH, provided by České
lupkové závody a.s., is used. From thermogravimetric analysis (TGA) performed on the
activator, the residual solid part is 38% by weight of the total solution (refer to § 2.5.1 for
the experimental procedure and to Appendix for the results). pH, measured by litmus
paper, is 12.
2.1.3. Bentonite
Bentonite is an absorbent aluminium phyllosilicate clay consisting mostly of
montmorillonite. It is used in geopolymer pastes as a rheology modifier, to increase
plasticity and to obtain a proper viscosity.
Three different kinds of sodium bentonite are used:
• Bentonite, provided by Sigma Aldrich Inc., named B1 in the nomenclature of
this work;
• Nanoclay, provided by Sigma Aldrich Inc., named B2;
• Mapeproof Seal, provided by Mapei S.p.A., named B3.
2.1.4. Biomass
Since the framework of the thesis is SaltGae project, one of the main focus is on
the valorisation of microalgal biomass used for wastewater treatment. Two different
species of microalgae, provided by Archimede Ricerche S.r.l., are added to geopolymer
pastes:

Materials and methods
33
• Spirulina Platensis, named SP in the nomenclature of this work;
• Tetraselmis Suecida, named TT.
Table 2.1.2 reports the results of the compositional analysis on microalgae performed
by Extractis. The pH of microalgae in water ranges from 7 to 8.
Table 2.1.2. Composition of Spirulina Platensis and Tetraselmis Suecida after centrifugation
Spirulina Platensis Tetraselmis Suecica
Dry Matter (DM) (%) 97.49 95.16
Ash (%/DM) 9.12 17.05
Proteins (%/DM) 67.78 37.89
Total sugars (%/DM) 9.31 14.49
Total free sugars (%/DM) 2.79 4.19
Lipids (%/DM) 6.26 12.82
Other (%/DM) 4.74 13.56
Proteins and other nutrients can be extracted from microalgal biomass. The
possibility to use low-protein residues of biomass after the extraction as filler is very
interesting, since these materials, which are effectively wastes, have an even lower value
than pristine microalgae. Residues of Spirulina (named RS in this work) and of
Tetraselmis (named RT in this work) were obtained by Extractis, from microalge
provided by Archimede Ricerche. Only data about ash % and protein % are available and
reported in Table 2.1.3.
Table 2.1.3. Composition of residues of Spirulina and Tetraselmis
Residue of Spirulina Residue of Tetraselmis
Dry Matter (DM) (%) > 99.5 > 99.5
Ash (%/DM) 22.6 16.9
Proteins (%/DM) 35.7 20.6
The effect of microalgae on the mechanical behaviour of geopolymers has been
compared to that of lignin (named LI in this work). Lignin used in this work has been
extracted from wood through Kraft process, which is based on the action of sodium
hydroxide and sodium sulphide.
Chapter 2
34
2.1.5. Recycled fibres
Glass fibres are commonly used as reinforcing materials for geopolymer concrete
[87]. Feasibility tests on the use of recycled glass fibres as additives for geopolymers have
been performed in the framework of the European project FiberEUse. Recycled glass
fibres, provided by Rivierasca S.p.A., are obtained by mechanical crushing of end-of-life
glass fibre structures (e.g. windmill blades, canoe, etc.). As a consequence of this process,
the fibres are surrounded by residual polymer binder; the average glass content of these
recycled materials was estimated in previous works by TGA (refer to § 2.5.1 for the
experimental procedure and Appendix for the results). Two types of recycled glass fibres
are used:
• white recycled (named WR in the nomenclature of this work); glass content =
11.9 ± 0.1%, average dimension = 3 µm;
• red recycled (named RR), containing iron oxides impurities; glass content =
32.0 ± 2.0%, average dimension = 4 µm.
Virgin chopped glass fibres (Fill 100, series FM04, named VF in this work),
provided by Italdry S.r.l., having diameter of 15 μm and a fibre-length of 200 μm, are
used as a benchmark.
Materials and methods
35
2.2. Formulations
Several geopolymer formulations have been prepared and tested. They are divided
in formulations for 3d-printing, containing bentonite, and formulations for casting,
without bentonite. Notice that some casted samples are prepared with recipes for 3D
printing, but not vice versa (§ 3.2, 3.3 and 3.4). If not explicitly specified, the bentonite
used is B1.
2.2.1. Formulations for 3D printing
Two approaches are followed to prepare pastes suitable for LDM 3D printing:
• adding to the slurry made of metakaolin and activator a high amount of
bentonite and then distilled water to adjust viscosity (high-bentonite
formulation, HB in the nomenclature of this work);
• adding to the same slurry a lower amount of bentonite, without the further
addition of water (low-bentonite formulation, LB in the nomenclature of this
work).
The addition of biomass and fibre is computed by weight over the sum of the
powders and is indicated per hundred parts (php) with respect to metakaolin and
bentonite. In Table 2.2.1 and Table 2.2.2 the compositions are reported both in weight
percentage, with respect to the total mass of the paste, and in grams, considering the
typical weighing to fill a 20 mL syringe.
Each formulation is named with an acronym, generally XB-GYZN. XB stands for
the approach the formulation is based on, i.e. HB (high-bentonite) or LB (low-bentonite).
GYZ indicates the additive present, e.g. GSP is used for samples containing Spirulina. N
is a number, which indicates the amount of additive per hundred parts. If no additive is
present, the sample is called XB-GEO.
Water to solid ratio is computed taking into account that the concentration of
sodium silicate in the activator is 38% by weight.
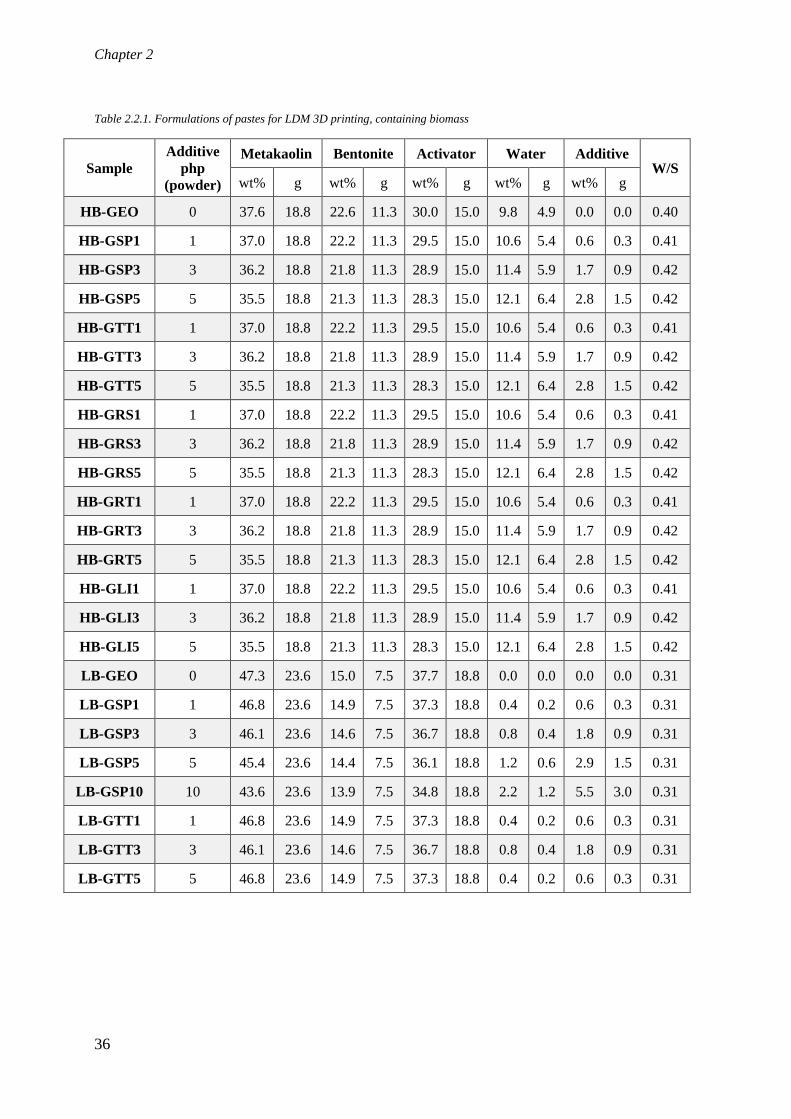
Chapter 2
36
Table 2.2.1. Formulations of pastes for LDM 3D printing, containing biomass
Sample
Additive
php
(powder)
Metakaolin Bentonite Activator Water Additive W/S
wt% g wt% g wt% g wt% g wt% g
HB-GEO 0 37.6 18.8 22.6 11.3 30.0 15.0 9.8 4.9 0.0 0.0 0.40
HB-GSP1 1 37.0 18.8 22.2 11.3 29.5 15.0 10.6 5.4 0.6 0.3 0.41
HB-GSP3 3 36.2 18.8 21.8 11.3 28.9 15.0 11.4 5.9 1.7 0.9 0.42
HB-GSP5 5 35.5 18.8 21.3 11.3 28.3 15.0 12.1 6.4 2.8 1.5 0.42
HB-GTT1 1 37.0 18.8 22.2 11.3 29.5 15.0 10.6 5.4 0.6 0.3 0.41
HB-GTT3 3 36.2 18.8 21.8 11.3 28.9 15.0 11.4 5.9 1.7 0.9 0.42
HB-GTT5 5 35.5 18.8 21.3 11.3 28.3 15.0 12.1 6.4 2.8 1.5 0.42
HB-GRS1 1 37.0 18.8 22.2 11.3 29.5 15.0 10.6 5.4 0.6 0.3 0.41
HB-GRS3 3 36.2 18.8 21.8 11.3 28.9 15.0 11.4 5.9 1.7 0.9 0.42
HB-GRS5 5 35.5 18.8 21.3 11.3 28.3 15.0 12.1 6.4 2.8 1.5 0.42
HB-GRT1 1 37.0 18.8 22.2 11.3 29.5 15.0 10.6 5.4 0.6 0.3 0.41
HB-GRT3 3 36.2 18.8 21.8 11.3 28.9 15.0 11.4 5.9 1.7 0.9 0.42
HB-GRT5 5 35.5 18.8 21.3 11.3 28.3 15.0 12.1 6.4 2.8 1.5 0.42
HB-GLI1 1 37.0 18.8 22.2 11.3 29.5 15.0 10.6 5.4 0.6 0.3 0.41
HB-GLI3 3 36.2 18.8 21.8 11.3 28.9 15.0 11.4 5.9 1.7 0.9 0.42
HB-GLI5 5 35.5 18.8 21.3 11.3 28.3 15.0 12.1 6.4 2.8 1.5 0.42
LB-GEO 0 47.3 23.6 15.0 7.5 37.7 18.8 0.0 0.0 0.0 0.0 0.31
LB-GSP1 1 46.8 23.6 14.9 7.5 37.3 18.8 0.4 0.2 0.6 0.3 0.31
LB-GSP3 3 46.1 23.6 14.6 7.5 36.7 18.8 0.8 0.4 1.8 0.9 0.31
LB-GSP5 5 45.4 23.6 14.4 7.5 36.1 18.8 1.2 0.6 2.9 1.5 0.31
LB-GSP10 10 43.6 23.6 13.9 7.5 34.8 18.8 2.2 1.2 5.5 3.0 0.31
LB-GTT1 1 46.8 23.6 14.9 7.5 37.3 18.8 0.4 0.2 0.6 0.3 0.31
LB-GTT3 3 46.1 23.6 14.6 7.5 36.7 18.8 0.8 0.4 1.8 0.9 0.31
LB-GTT5 5 46.8 23.6 14.9 7.5 37.3 18.8 0.4 0.2 0.6 0.3 0.31
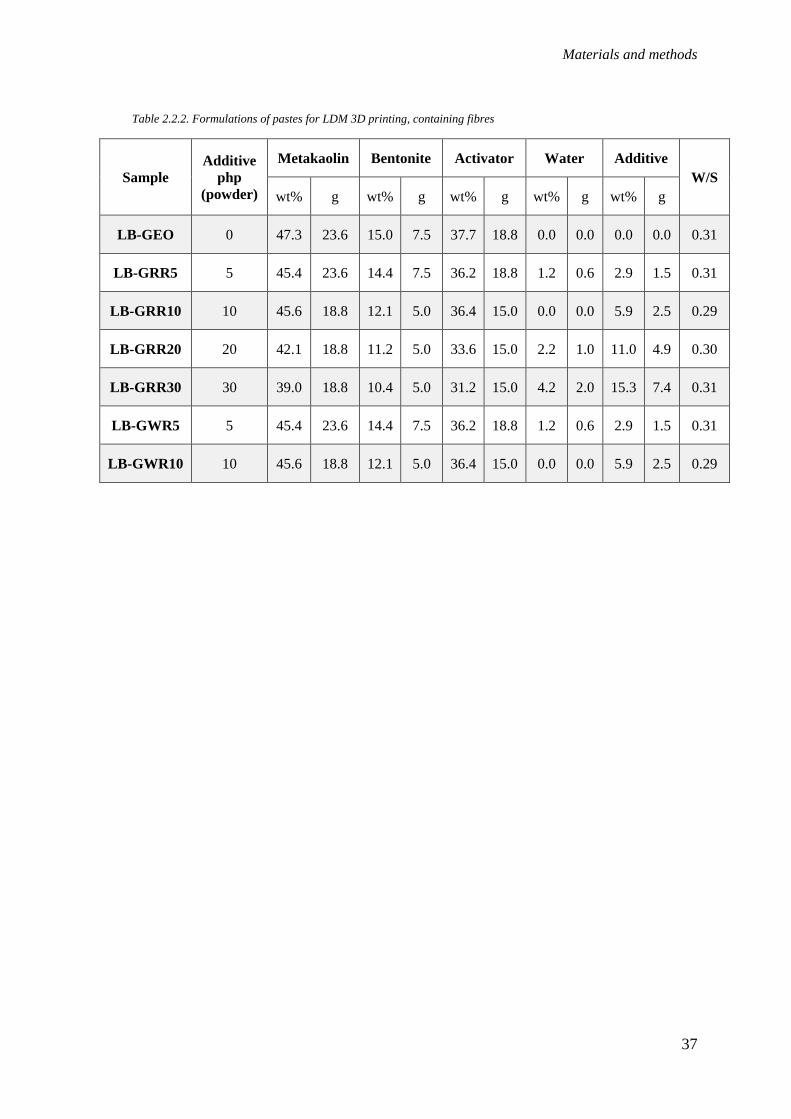
Materials and methods
37
Table 2.2.2. Formulations of pastes for LDM 3D printing, containing fibres
Sample
Additive
php
(powder)
Metakaolin Bentonite Activator Water Additive
W/S
wt% g wt% g wt% g wt% g wt% g
LB-GEO 0 47.3 23.6 15.0 7.5 37.7 18.8 0.0 0.0 0.0 0.0 0.31
LB-GRR5 5 45.4 23.6 14.4 7.5 36.2 18.8 1.2 0.6 2.9 1.5 0.31
LB-GRR10 10 45.6 18.8 12.1 5.0 36.4 15.0 0.0 0.0 5.9 2.5 0.29
LB-GRR20 20 42.1 18.8 11.2 5.0 33.6 15.0 2.2 1.0 11.0 4.9 0.30
LB-GRR30 30 39.0 18.8 10.4 5.0 31.2 15.0 4.2 2.0 15.3 7.4 0.31
LB-GWR5 5 45.4 23.6 14.4 7.5 36.2 18.8 1.2 0.6 2.9 1.5 0.31
LB-GWR10 10 45.6 18.8 12.1 5.0 36.4 15.0 0.0 0.0 5.9 2.5 0.29

Chapter 2
38
2.2.2. Formulations for casting
Formulations prepared exclusively for casting are reported Table 2.2.3. A “C” in
the nomenclature denotes that the formulations are for casting, then the same
nomenclature rules explained in § 2.2.1 are applied. The amount of additive is calculated
over the powders, so just over metakaolin in this case. Mass values showed in the table
refer to the typical weighing to fill a set of eight cubic samples. Supplementary water is
added only to the sample containing high concentration of biomass (C-GSP30).
Table 2.2.3. Formulations of pastes for casting
Sample
Additive
php
(powder)
Metakaolin Activator Water Additive W/S
wt% g wt% g wt% g wt% g
C-GEO 0 55.6 18.8 44.4 15.0 0.0 0.0 0.0 0.0 0.38
C-GSP30 30 45.3 18.8 36.1 15.0 5.1 2.1 13.5 5.6 0.38
C-GRR13 13 51.9 18.8 41.4 15.0 0.0 0.0 6.8 2.5 0.35
C-GRR19 19 50.3 18.8 40.1 15.0 0.0 0.0 9.6 3.6 0.33
C-GRR26 26 48.6 18.8 38.8 15.0 0.0 0.0 12.7 4.9 0.32
C-GRR39 39 45.7 18.8 36.5 15.0 0.0 0.0 17.9 7.4 0.29
C-GRR57 57 42.2 18.8 33.7 15.0 0.0 0.0 24.1 10.7 0.27
C-GWR13 13 51.9 18.8 41.4 15.0 0.0 0.0 6.8 2.5 0.35
C-GVF13 13 51.9 18.8 41.4 15.0 0.0 0.0 6.8 2.5 0.35
C-GVF26 26 48.6 18.8 38.8 15.0 0.0 0.0 12.7 4.9 0.32
C-GVF39 39 45.7 18.8 36.5 15.0 0.0 0.0 17.9 7.4 0.29
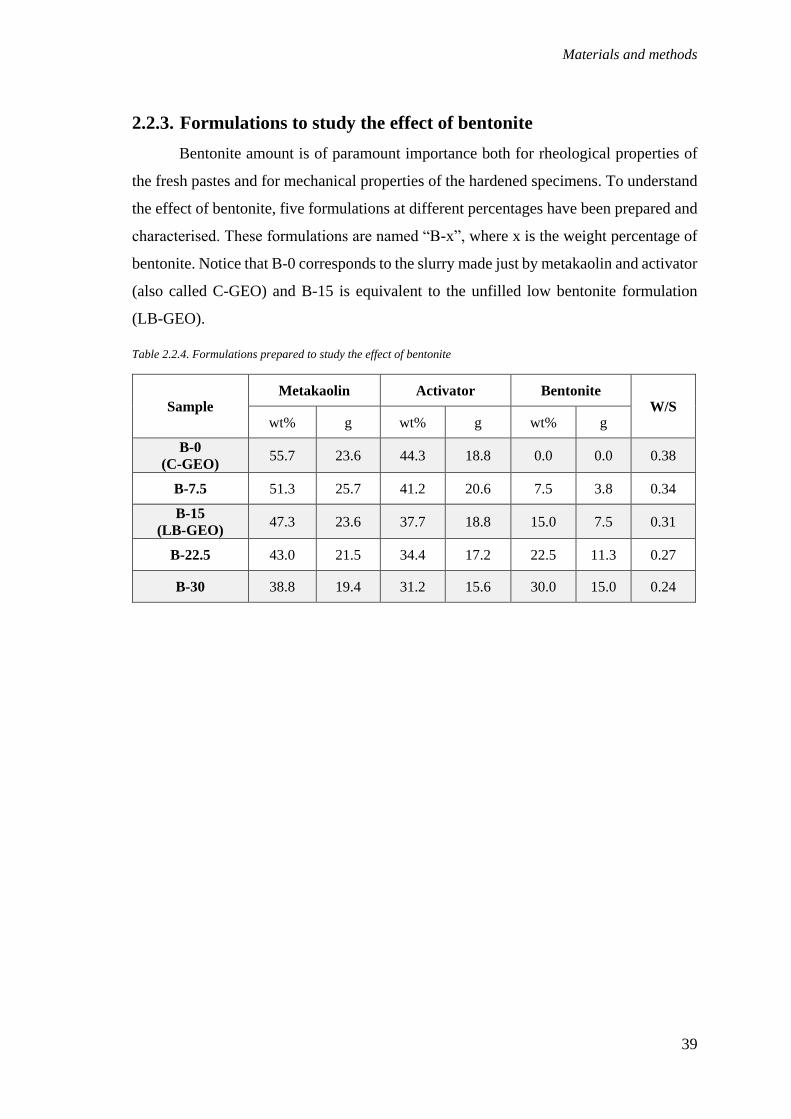
Materials and methods
39
2.2.3. Formulations to study the effect of bentonite
Bentonite amount is of paramount importance both for rheological properties of
the fresh pastes and for mechanical properties of the hardened specimens. To understand
the effect of bentonite, five formulations at different percentages have been prepared and
characterised. These formulations are named “B-x”, where x is the weight percentage of
bentonite. Notice that B-0 corresponds to the slurry made just by metakaolin and activator
(also called C-GEO) and B-15 is equivalent to the unfilled low bentonite formulation
(LB-GEO).
Table 2.2.4. Formulations prepared to study the effect of bentonite
Sample Metakaolin Activator Bentonite
W/S wt% g wt% g wt% g
B-0
(C-GEO) 55.7 23.6 44.3 18.8 0.0 0.0 0.38
B-7.5 51.3 25.7 41.2 20.6 7.5 3.8 0.34
B-15
(LB-GEO) 47.3 23.6 37.7 18.8 15.0 7.5 0.31
B-22.5 43.0 21.5 34.4 17.2 22.5 11.3 0.27
B-30 38.8 19.4 31.2 15.6 30.0 15.0 0.24
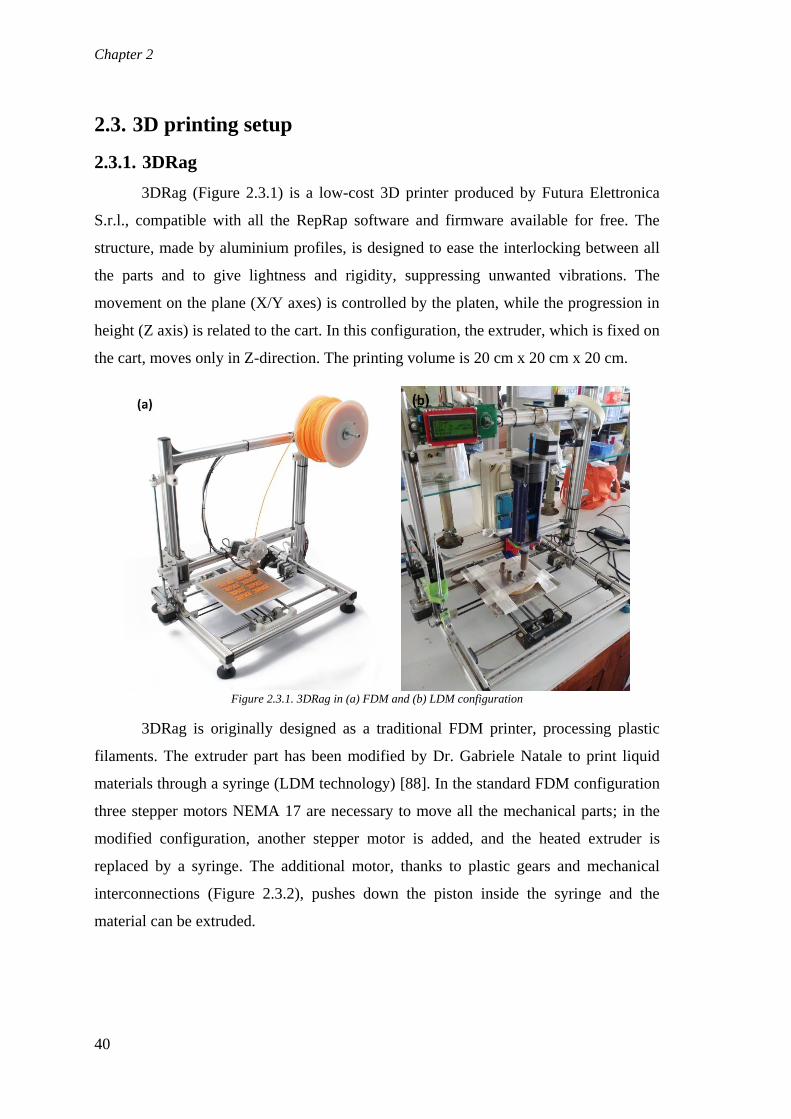
Chapter 2
40
2.3. 3D printing setup
2.3.1. 3DRag
3DRag (Figure 2.3.1) is a low-cost 3D printer produced by Futura Elettronica
S.r.l., compatible with all the RepRap software and firmware available for free. The
structure, made by aluminium profiles, is designed to ease the interlocking between all
the parts and to give lightness and rigidity, suppressing unwanted vibrations. The
movement on the plane (X/Y axes) is controlled by the platen, while the progression in
height (Z axis) is related to the cart. In this configuration, the extruder, which is fixed on
the cart, moves only in Z-direction. The printing volume is 20 cm x 20 cm x 20 cm.
Figure 2.3.1. 3DRag in (a) FDM and (b) LDM configuration
3DRag is originally designed as a traditional FDM printer, processing plastic
filaments. The extruder part has been modified by Dr. Gabriele Natale to print liquid
materials through a syringe (LDM technology) [88]. In the standard FDM configuration
three stepper motors NEMA 17 are necessary to move all the mechanical parts; in the
modified configuration, another stepper motor is added, and the heated extruder is
replaced by a syringe. The additional motor, thanks to plastic gears and mechanical
interconnections (Figure 2.3.2), pushes down the piston inside the syringe and the
material can be extruded.

Materials and methods
41
Figure 2.3.2. Schematic representation of LDM syringe extruder, designed by Dr. Gabriele Natale [88]
This setup is used in this work to produce samples for mechanical tests. The
majority of printed samples are made in spiral mode, which is a printing technique that
converts the subsequent layers in a continuous spiral. In this way, hollow structures can
be obtained from bulky CAD models, since only the outer perimeter is printed. The
printing parameters, kept constant for all the printings performed, are listed in Table 2.3.1.
Since in LDM configuration no filament is present, the diameter of the syringe is taken
as filament diameter.

Chapter 2
42
Table 2.3.1. Printing parameters used with 3DRag LDM printer
Layer
height
Shell
thickness
speed
Filament
diameter Flow
Nozzle
size
Travel
speed Infill
0.6 mm 2.25 mm 20 mm/s 18.6 mm 130 % 2.25 mm 140 mm/s
0 %
(spiral
mode)
2.3.2. Scale-up setup
To print bigger parts, a Delta WASP 40100 Clay (Figure 2.3.3), produced by
WASP S.r.l., and rent by the makerspace Superforma (Milano) is employed. This printer
has a printing volume of 40 cm x 40 cm x 100 cm.
Figure 2.3.3. Delta WASP 40100 Clay
Differently from 3DRag, whose movements are based on three Cartesian axes,
Delta machines move according to polar coordinates. The extrusion system is different,
as well: the material is charged in a close container (with capacity ranging from 3L to
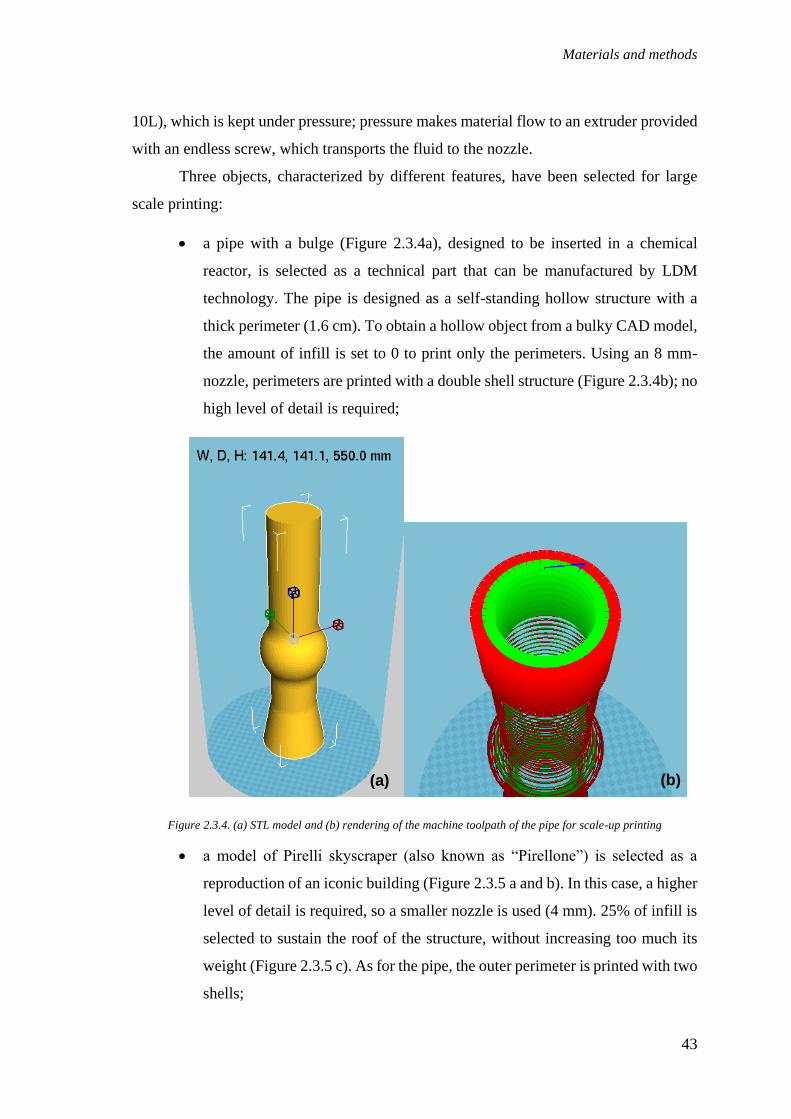
Materials and methods
43
10L), which is kept under pressure; pressure makes material flow to an extruder provided
with an endless screw, which transports the fluid to the nozzle.
Three objects, characterized by different features, have been selected for large
scale printing:
• a pipe with a bulge (Figure 2.3.4a), designed to be inserted in a chemical
reactor, is selected as a technical part that can be manufactured by LDM
technology. The pipe is designed as a self-standing hollow structure with a
thick perimeter (1.6 cm). To obtain a hollow object from a bulky CAD model,
the amount of infill is set to 0 to print only the perimeters. Using an 8 mm-
nozzle, perimeters are printed with a double shell structure (Figure 2.3.4b); no
high level of detail is required;
Figure 2.3.4. (a) STL model and (b) rendering of the machine toolpath of the pipe for scale-up printing
• a model of Pirelli skyscraper (also known as “Pirellone”) is selected as a
reproduction of an iconic building (Figure 2.3.5 a and b). In this case, a higher
level of detail is required, so a smaller nozzle is used (4 mm). 25% of infill is
selected to sustain the roof of the structure, without increasing too much its
weight (Figure 2.3.5 c). As for the pipe, the outer perimeter is printed with two
shells;
(a) (b)
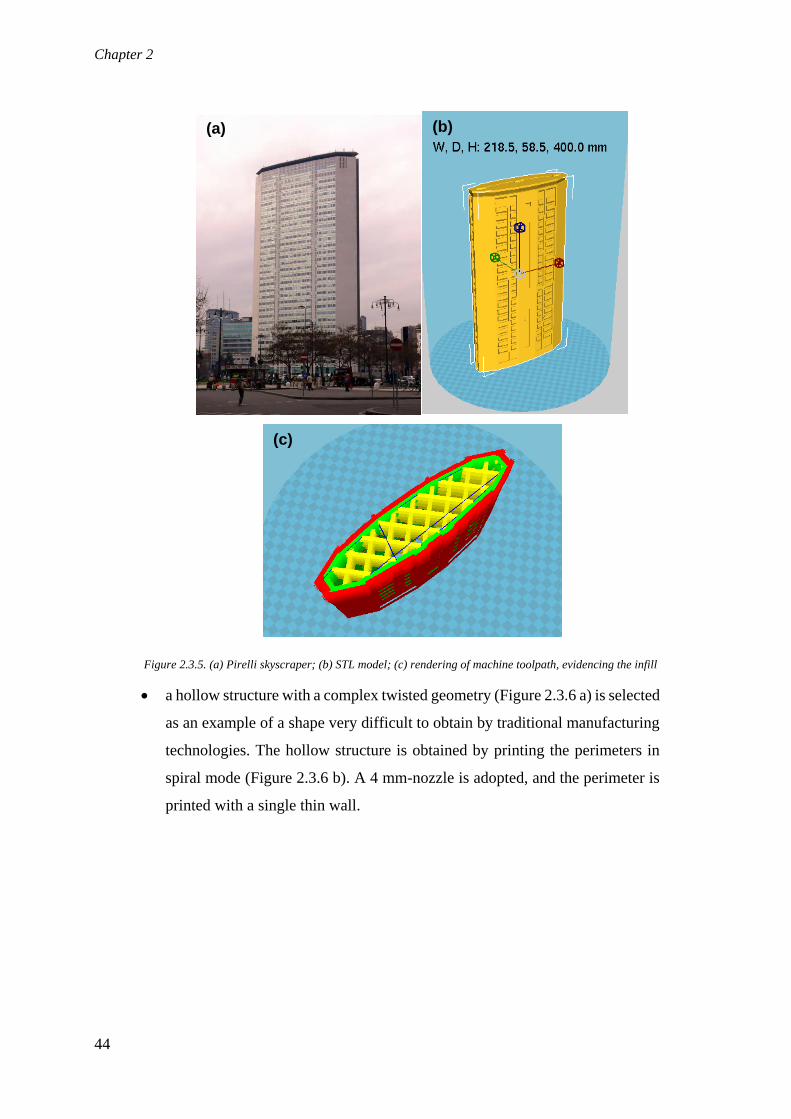
Chapter 2
44
Figure 2.3.5. (a) Pirelli skyscraper; (b) STL model; (c) rendering of machine toolpath, evidencing the infill
• a hollow structure with a complex twisted geometry (Figure 2.3.6 a) is selected
as an example of a shape very difficult to obtain by traditional manufacturing
technologies. The hollow structure is obtained by printing the perimeters in
spiral mode (Figure 2.3.6 b). A 4 mm-nozzle is adopted, and the perimeter is
printed with a single thin wall.
(a) (b)
(c)
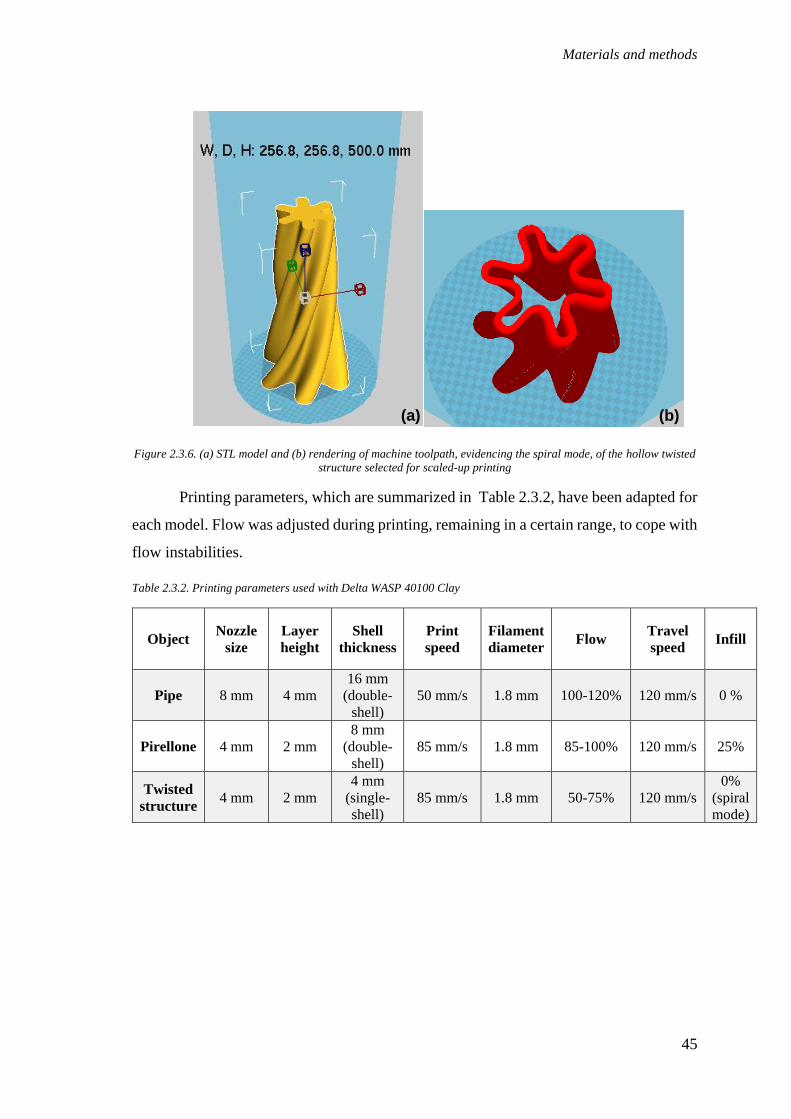
Materials and methods
45
Figure 2.3.6. (a) STL model and (b) rendering of machine toolpath, evidencing the spiral mode, of the hollow twisted
structure selected for scaled-up printing
Printing parameters, which are summarized in Table 2.3.2, have been adapted for
each model. Flow was adjusted during printing, remaining in a certain range, to cope with
flow instabilities.
Table 2.3.2. Printing parameters used with Delta WASP 40100 Clay
Object Nozzle
size
Layer
height
Shell
thickness
speed
Filament
diameter Flow
Travel
speed Infill
Pipe 8 mm 4 mm
16 mm
(double-
shell)
50 mm/s 1.8 mm 100-120% 120 mm/s 0 %
Pirellone 4 mm 2 mm
8 mm
(double-
shell)
85 mm/s 1.8 mm 85-100% 120 mm/s 25%
Twisted
structure 4 mm 2 mm
4 mm
(single-
shell)
85 mm/s 1.8 mm 50-75% 120 mm/s
0%
(spiral
mode)
(a) (b)
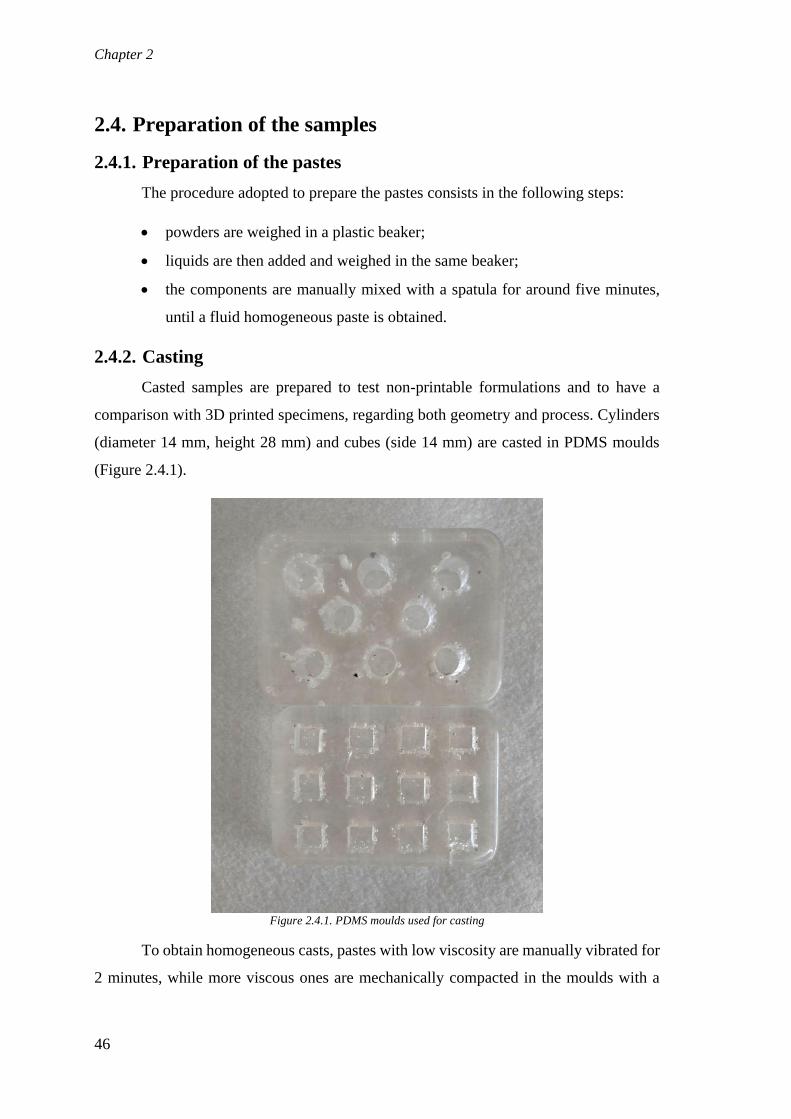
Chapter 2
46
2.4. Preparation of the samples
2.4.1. Preparation of the pastes
The procedure adopted to prepare the pastes consists in the following steps:
• powders are weighed in a plastic beaker;
• liquids are then added and weighed in the same beaker;
• the components are manually mixed with a spatula for around five minutes,
until a fluid homogeneous paste is obtained.
2.4.2. Casting
Casted samples are prepared to test non-printable formulations and to have a
comparison with 3D printed specimens, regarding both geometry and process. Cylinders
(diameter 14 mm, height 28 mm) and cubes (side 14 mm) are casted in PDMS moulds
(Figure 2.4.1).
Figure 2.4.1. PDMS moulds used for casting
To obtain homogeneous casts, pastes with low viscosity are manually vibrated for
2 minutes, while more viscous ones are mechanically compacted in the moulds with a

Materials and methods
47
piston. After two days, the specimens are removed from the moulds and kept at ambient
temperature under a plastic film for 7 or 28 days. At the end of the ambient curing period,
some specimens are annealed at 800 °C for 4 hours in a muffle oven (model 10-D1418/A,
produced by Controls S.p.A.).
Casting is used also to prepare cylindrical specimens to be tested when still fresh.
PLA 3D printed (by FDM) moulds, which are designed to be easily opened without
damaging the fresh material, are used (Figure 2.4.2). The dimensions of these specimens
are the same as the other casted samples.
Figure 2.4.2. PLA 3D printed mould used for fresh samples
2.4.3. 3D printing
3D printing with 3DRag adapted to LDM is used to prepare specimens for
mechanical compression tests. Since one of the main advantages of additive
manufacturing is the possibility to easily obtain empty lightweight structures, most of the
printed specimens are hollow cylinders (diameter 15 mm, height 28 mm). A full cylinder
has been modelled on SolidWorks (developed by Dassault Systèmes) and the STL file
has been exported to the slicing software Cura (by Ultimaker) to create the G-Code. By
adopting spiral mode, only the perimeters of the model are printed, and the hollow
structure is obtained. For each batch, six specimens are printed on an metallic support;
then they are kept at ambient temperature under a plastic film for 7 or 28 days. At the end
of the ambient curing period, some specimens are annealed at 800 °C for 4 hours in a
muffle oven (model 10-D1418/A, produced by Controls S.p.A.).
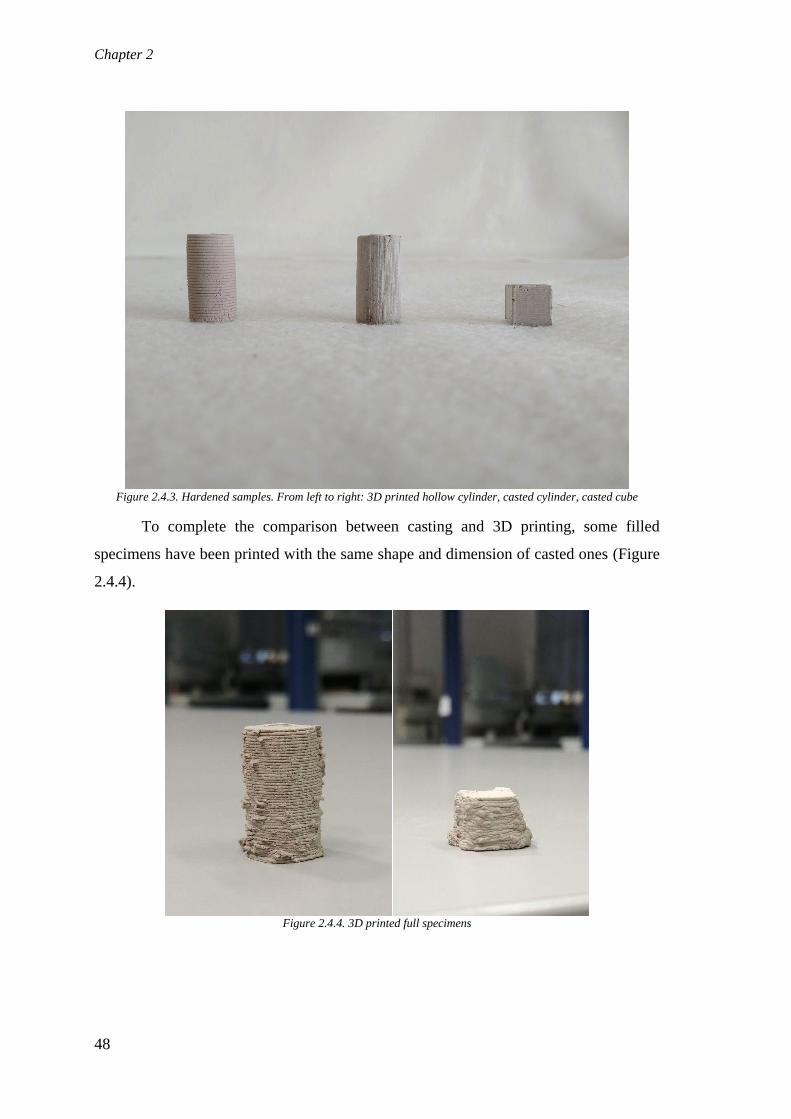
Chapter 2
48
Figure 2.4.3. Hardened samples. From left to right: 3D printed hollow cylinder, casted cylinder, casted cube
To complete the comparison between casting and 3D printing, some filled
specimens have been printed with the same shape and dimension of casted ones (Figure
2.4.4).
Figure 2.4.4. 3D printed full specimens
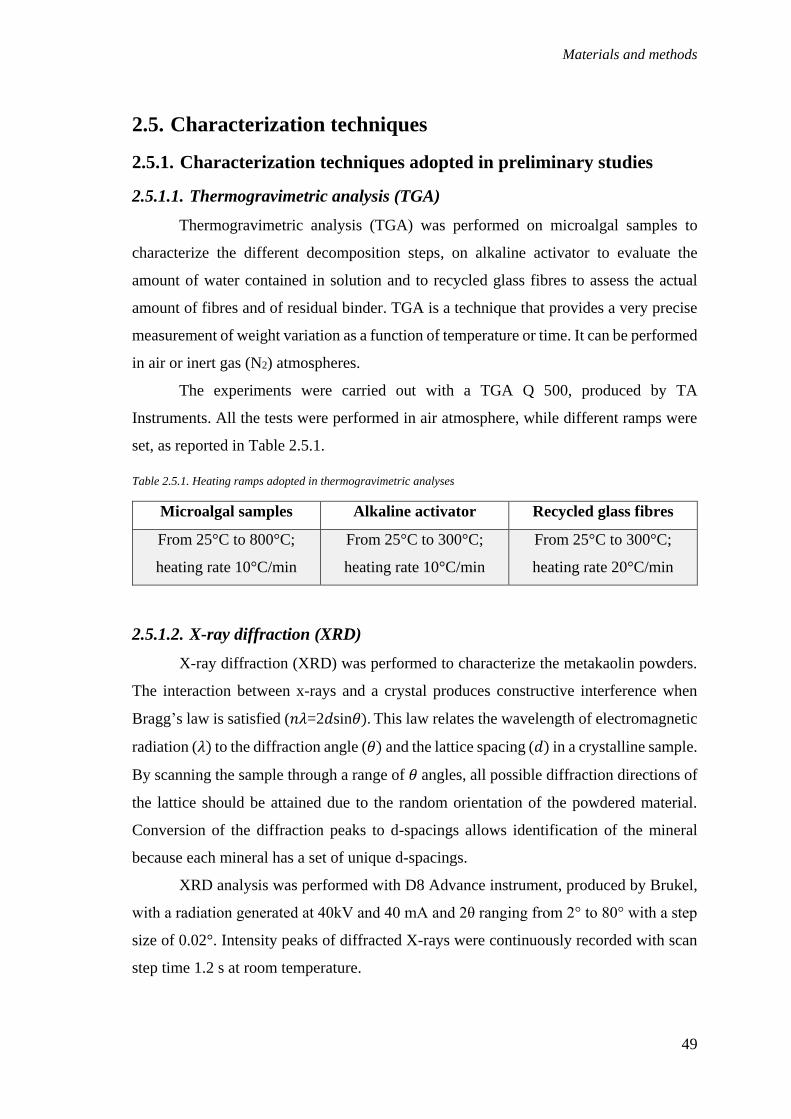
Materials and methods
49
2.5. Characterization techniques
2.5.1. Characterization techniques adopted in preliminary studies
2.5.1.1. Thermogravimetric analysis (TGA)
Thermogravimetric analysis (TGA) was performed on microalgal samples to
characterize the different decomposition steps, on alkaline activator to evaluate the
amount of water contained in solution and to recycled glass fibres to assess the actual
amount of fibres and of residual binder. TGA is a technique that provides a very precise
measurement of weight variation as a function of temperature or time. It can be performed
in air or inert gas (N2) atmospheres.
The experiments were carried out with a TGA Q 500, produced by TA
Instruments. All the tests were performed in air atmosphere, while different ramps were
set, as reported in Table 2.5.1.
Table 2.5.1. Heating ramps adopted in thermogravimetric analyses
Microalgal samples Alkaline activator Recycled glass fibres
From 25°C to 800°C;
heating rate 10°C/min
From 25°C to 300°C;
heating rate 10°C/min
From 25°C to 300°C;
heating rate 20°C/min
2.5.1.2. X-ray diffraction (XRD)
X-ray diffraction (XRD) was performed to characterize the metakaolin powders.
The interaction between x-rays and a crystal produces constructive interference when
Bragg’s law is satisfied (𝑛𝜆=2𝑑sin𝜃). This law relates the wavelength of electromagnetic
radiation (𝜆) to the diffraction angle (𝜃) and the lattice spacing (𝑑) in a crystalline sample.
By scanning the sample through a range of 𝜃 angles, all possible diffraction directions of
the lattice should be attained due to the random orientation of the powdered material.
Conversion of the diffraction peaks to d-spacings allows identification of the mineral
because each mineral has a set of unique d-spacings.
XRD analysis was performed with D8 Advance instrument, produced by Brukel,
with a radiation generated at 40kV and 40 mA and 2θ ranging from 2° to 80° with a step
size of 0.02°. Intensity peaks of diffracted X-rays were continuously recorded with scan
step time 1.2 s at room temperature.

Chapter 2
50
2.5.1.3. Fourier Transform Infra-Red Spectroscopy
Fourier transform infrared spectroscopy (FT-IR) was performed on different
samples to evaluate whether microalgae chemically link with the geopolymer network or
not. This is possible, thanks to the fact that the absorption of IR radiation can excite
specific vibrational modes of molecules. Therefore, by knowing the absorption spectrum,
it is possible to reconstruct the chemical structure of the sample.
Thermo Nicolet NEXUS 470 FTIR, produced by GMI Inc., was used. The
analysed powders were blended with potassium bromide (KBr) powder, ground together
and then pressed with a hydraulic press into thin disks of diameter 13 mm under 8 tons
for 3 min. Then, IR spectra region 4000 – 400 cm-1 were recorded at room temperature.
Each spectrum was an average of 64 scans at a resolution of 4 cm-1. Spectra analysis was
done using OMNIC Spectra Software (by Thermo Scientific).
2.5.2. Rheology
Rheological characterization is carried out to understand the behaviour of the
pastes during the extrusion and how this is influenced by the additives. Moreover,
rheological properties of the material, such as yield stress and recovery ability, can be
related to printability and to the development of printed objects in Z-direction.
All measurements have been performed with the stress-controlled rotational
rheometer Kinexus Pro+, produced by Malvern Panalytical Ltd (Figure 2.5.1). For low
viscosity fluids, the geometry selected is 40 mm plate-plate, while for more viscous ones
20 mm plate-plate geometry is preferred, to apply higher values of stress.

Materials and methods
51
Figure 2.5.1. Rotational rheometer Kinexus Pro+.
For each test a sample has been prepared. If not explicitly specified, the test is
carried out immediately after the paste preparation. Temperature was always set at 25°C.
Several types of test are performed:
• Shear stress ramp applied on highly viscous pastes: after a preshear at rate 100
s-1 for 25 seconds and a 60 second rest, a ramp at 125 Pa/s is applied. Preshear
and consequent rest is used to normalize the starting condition of all samples;
• Shear stress ramp applied on lowly viscous pastes and fluids: a ramp at rate
lower than 10 Pa/s is applied, without preshear;
• Creep and recovery: a constant stress is applied until the steady state for creep
compliance is reached; recovery phase is programmed to last 10% more than
the creep one. The applied stress depends on the specific sample and it is
selected in the range of stable flow;
• Dynamic stress sweep: after a preshear at rate 100 s-1 for 25 seconds and a 60
second rest, a stress ramp from 10 to 105 Pa is applied at constant frequency
of 1 Hz. Preshear and consequent rest is used to normalize the starting
condition of all highly viscous samples, while they are not applied on lowly
viscous ones;

Chapter 2
52
The curves obtained by shear stress ramps in steady state are then fitted with
rheological models. Herschel-Bulkley model is adopted for pseudoplastic fluids showing
a yield stress, according to the following equation:
𝜏 = 𝜏𝑦 + 𝐾�̇�𝑛 (1)
in which 𝜏 is the shear stress, 𝜏𝑦 is the yield stress, 𝐾 is the consistency, �̇� is the
shear rate, and 𝑛 is the flow index [89].
For pastes and fluids which does not exhibit a yield stress, a slightly different
approach is followed: a power-law fitting on the linear region of viscosity curves (in
double logarithmic plot) is performed, according to the relation:
𝜂 = 𝐾�̇�𝑛−1 (2)
which, passing to the logarithms, becomes
log 𝜂 = log 𝐾 + (𝑛 − 1) log �̇� (3)
in which 𝜂 is the apparent viscosity, 𝐾 is the consistency, �̇� is the shear rate, and
𝑛 is the flow index [89].
Each formulation is tested on more than one specimen, to verify the experimental
reproducibility of the results. Fitting is performed on the average curve obtained from all
the tested pastes for the same formulation. The software Origin (developed by Originlab
Corporation) is used to compute the fitting. Figure 2.5.2 shows an example of the fitting
procedure.
Figure 2.5.2. Fitting with Herschel-Bulkley model performed on flow curves of the formulation HB-GEO

Materials and methods
53
Fitting is used to eliminate any kind of subjectivity from the extrapolation of data
from the curve.
Concerning creep and recovery, creep compliance is reported as a function of
time. Shear deformation (𝛾), which is the actual response of the material, and creep
compliance (J) are proportional, according to the relation
𝐽(𝑡) =𝛾(𝑡)
�̅� (4)
in which �̅� is the applied constant stress [90].
All recovery tests comprise three essentially separate parts once the source of
stress is removed [91] (Figure 2.5.3):
• an instantaneous elastic recover (Ji);
• a retarded viscoelastic recover (Jr);
• a non-recoverable level of deformation, which is represented by a plateau of
shear compliance (J∞)
Instantaneous (Xi), retarded (Xr) and total recovery (Xtot) are computed as
percentages, with respect to the maximum shear compliance reached:
𝑋𝑖 = (𝐽𝑖
𝐽𝑡𝑜𝑡) ∙ 100% (5a)
𝑋𝑟 = (𝐽𝑟
𝐽𝑡𝑜𝑡) ∙ 100% (5b)
𝑋𝑡𝑜𝑡 = (𝐽𝑖 + 𝐽𝑟
𝐽𝑡𝑜𝑡) ∙ 100% (5c)
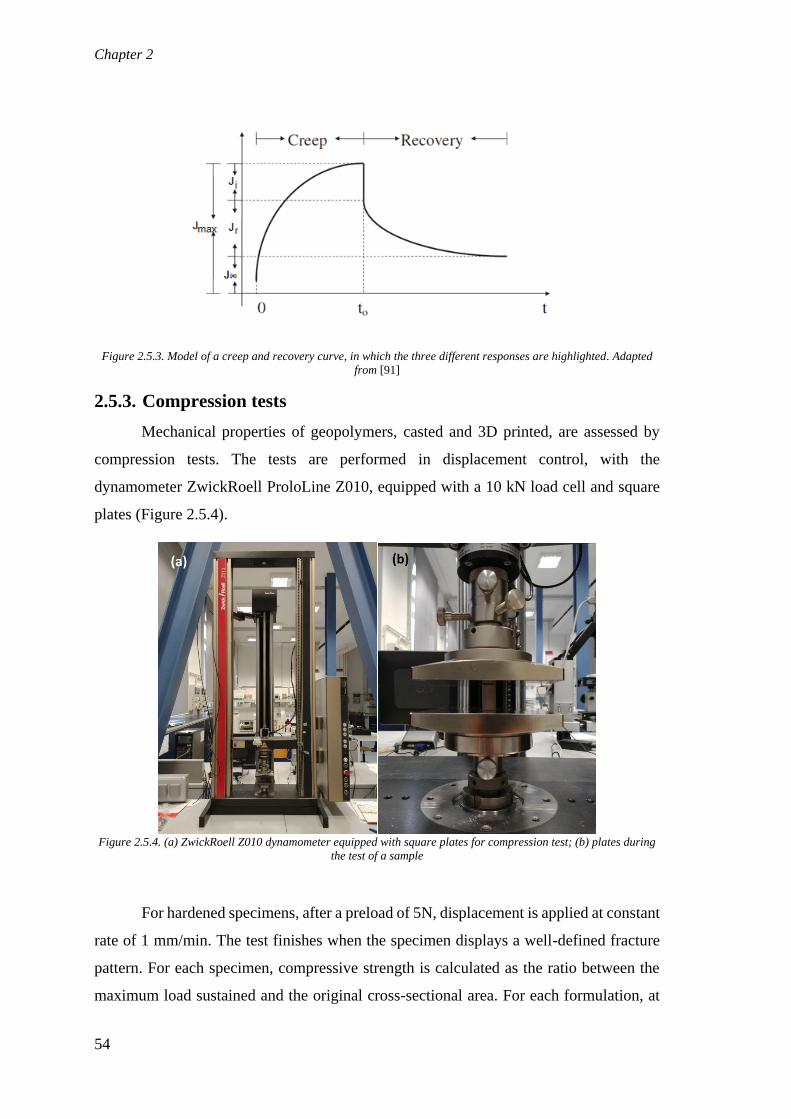
Chapter 2
54
Figure 2.5.3. Model of a creep and recovery curve, in which the three different responses are highlighted. Adapted
from [91]
2.5.3. Compression tests
Mechanical properties of geopolymers, casted and 3D printed, are assessed by
compression tests. The tests are performed in displacement control, with the
dynamometer ZwickRoell ProloLine Z010, equipped with a 10 kN load cell and square
plates (Figure 2.5.4).
Figure 2.5.4. (a) ZwickRoell Z010 dynamometer equipped with square plates for compression test; (b) plates during
the test of a sample
For hardened specimens, after a preload of 5N, displacement is applied at constant
rate of 1 mm/min. The test finishes when the specimen displays a well-defined fracture
pattern. For each specimen, compressive strength is calculated as the ratio between the
maximum load sustained and the original cross-sectional area. For each formulation, at
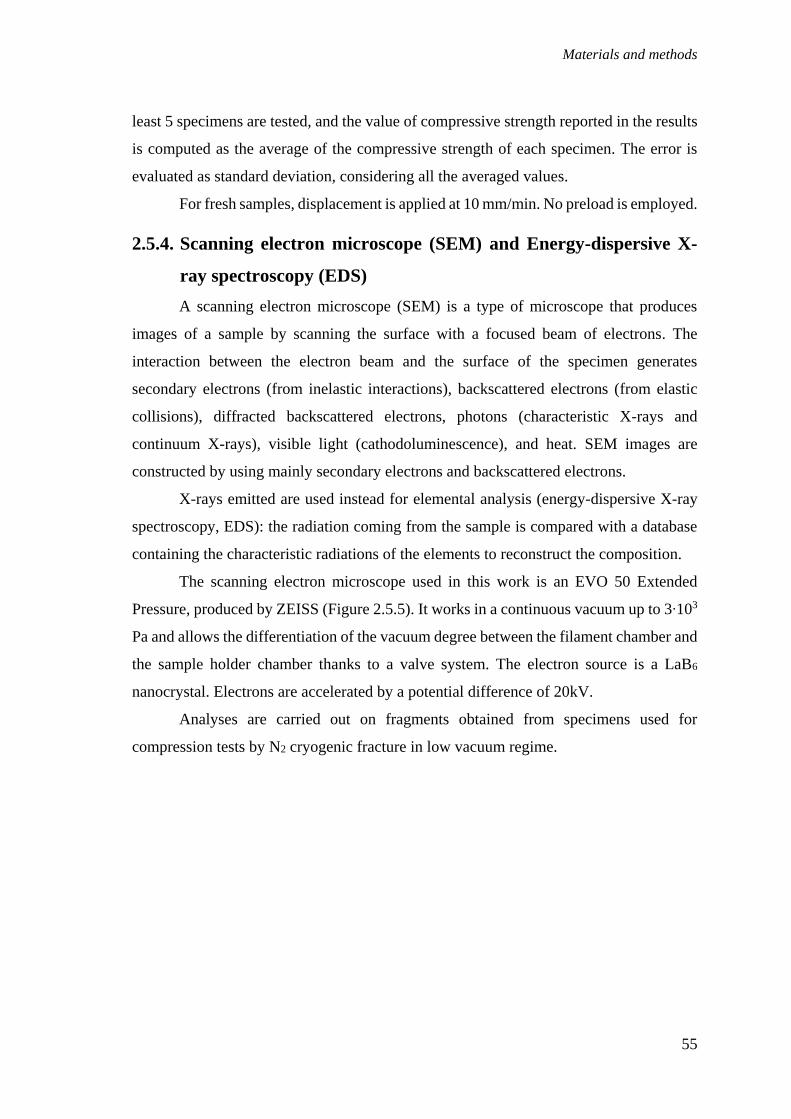
Materials and methods
55
least 5 specimens are tested, and the value of compressive strength reported in the results
is computed as the average of the compressive strength of each specimen. The error is
evaluated as standard deviation, considering all the averaged values.
For fresh samples, displacement is applied at 10 mm/min. No preload is employed.
2.5.4. Scanning electron microscope (SEM) and Energy-dispersive X-
ray spectroscopy (EDS)
A scanning electron microscope (SEM) is a type of microscope that produces
images of a sample by scanning the surface with a focused beam of electrons. The
interaction between the electron beam and the surface of the specimen generates
secondary electrons (from inelastic interactions), backscattered electrons (from elastic
collisions), diffracted backscattered electrons, photons (characteristic X-rays and
continuum X-rays), visible light (cathodoluminescence), and heat. SEM images are
constructed by using mainly secondary electrons and backscattered electrons.
X-rays emitted are used instead for elemental analysis (energy-dispersive X-ray
spectroscopy, EDS): the radiation coming from the sample is compared with a database
containing the characteristic radiations of the elements to reconstruct the composition.
The scanning electron microscope used in this work is an EVO 50 Extended
Pressure, produced by ZEISS (Figure 2.5.5). It works in a continuous vacuum up to 3∙103
Pa and allows the differentiation of the vacuum degree between the filament chamber and
the sample holder chamber thanks to a valve system. The electron source is a LaB6
nanocrystal. Electrons are accelerated by a potential difference of 20kV.
Analyses are carried out on fragments obtained from specimens used for
compression tests by N2 cryogenic fracture in low vacuum regime.

Chapter 2
56
Figure 2.5.5. Scanning electron microscope EVO 50 Extended Pressure
Micrographs from SEM are processed with the software ImageJ, to quantify the
average size of the pores. To highlight pores with respect to the matrix, the colour
threshold is adjusted. The average size of the pores is found with “Analyse particles”
option; a minimum and a maximum cut-off area (1 and 500 µm2, respectively) are set to
reduce errors during image elaboration and eliminate noise.
57
3. Results and discussion
3.1. Preliminary studies
Some of the results achieved by the research group before the beginning of this
work are necessary to complete the characterization of the raw materials and to
understand the whole discussion. The following list provides a brief overview of these
results. Detailed graphs are reported in the Appendix.
• TGA performed on the alkaline activator showed that the residual solid is
about 38% with respect to the total weight of the solution;
• TGA of Spirulina Platensis and Tetraselmis Suecida showed a similar trend,
in which three decomposition steps can be identified: at temperature lower
than 180°C, dehydration occurs; between 180°C and 540°C a massive weight
loss is related to the decomposition of proteins, carbohydrates and lipids; after
540°C the residual carbonaceous matter continues to decompose with a very
slow rate, until solid residue reaches a plateau;
• TGA of recycled glass fibres demonstrated that glass fibre content in the
recycled material is quite low (32 ± 2 % for the red recycled and 11.9 ± 0.1 %
for the white recycled);
• XRD on metakaolin showed a background without a well-defined baseline,
which is typical of amorphous structures. The crystalline peaks found can be
attributed to muscovite impurities;
• FT-IR spectra of microalgae evidenced a very complex structure. Functional
groups typical of proteins, saccharides, lipids and other nutrients are found.
FT-IR of geopolymer are characterized by Si-O-Si and Si-O-Al stretching
vibrations. The addition of microalgae to geopolymer was investigated before
and after geopolymerization and no new peaks appeared. This result
demonstrates that no chemical bonds are formed between microalgae and
geopolymer network.
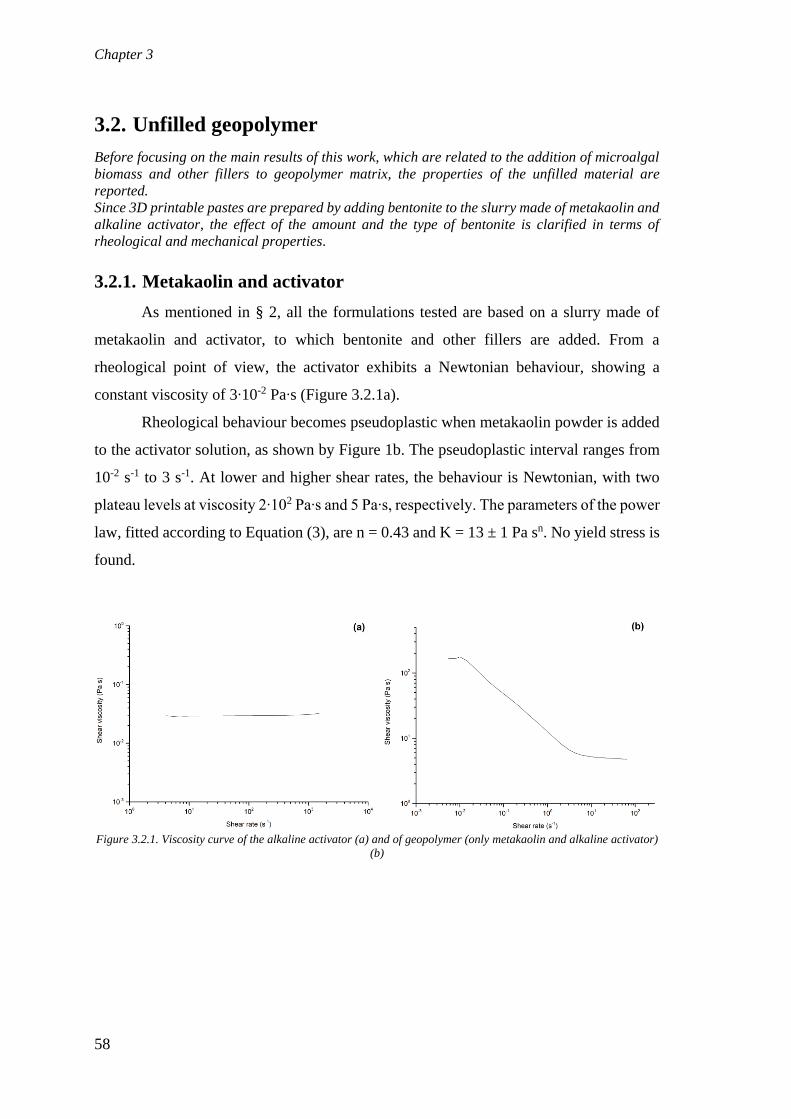
Chapter 3
58
3.2. Unfilled geopolymer
Before focusing on the main results of this work, which are related to the addition of microalgal
biomass and other fillers to geopolymer matrix, the properties of the unfilled material are
reported.
Since 3D printable pastes are prepared by adding bentonite to the slurry made of metakaolin and
alkaline activator, the effect of the amount and the type of bentonite is clarified in terms of
rheological and mechanical properties.
3.2.1. Metakaolin and activator
As mentioned in § 2, all the formulations tested are based on a slurry made of
metakaolin and activator, to which bentonite and other fillers are added. From a
rheological point of view, the activator exhibits a Newtonian behaviour, showing a
constant viscosity of 3∙10-2 Pa∙s (Figure 3.2.1a).
Rheological behaviour becomes pseudoplastic when metakaolin powder is added
to the activator solution, as shown by Figure 1b. The pseudoplastic interval ranges from
10-2 s-1 to 3 s-1. At lower and higher shear rates, the behaviour is Newtonian, with two
plateau levels at viscosity 2∙102 Pa∙s and 5 Pa∙s, respectively. The parameters of the power
law, fitted according to Equation (3), are n = 0.43 and K = 13 ± 1 Pa sn. No yield stress is
found.
Figure 3.2.1. Viscosity curve of the alkaline activator (a) and of geopolymer (only metakaolin and alkaline activator)
(b)

Results and discussion
59
3.2.2. Effect of bentonite addition
The addition of bentonite affects the rheological properties of the paste as well as
the mechanical properties of hardened specimens. Table 3.2.1 summarises the rheological
parameters obtained fitting the flow curves according to Equations (1) and (3); the
absence of data for 30 wt% of bentonite is due to the impossibility to obtain a
homogeneous mix at that concentration.
Table 3.2.1. Effect of bentonite addition on rheological properties
Sample Bentonite wt% Yield stress (Pa) K
(Pa sn) n R2
B-0 0 0 ± 0 13 ± 1 0.43 ± 0.00 0.999
B-7.5 7.5 167 ± 16 2183 ± 18 0.62 ± 0.01 0.965
B-15 15 2864 ± 241 2444 ± 212 0.53 ± 0.03 0.984
B-22.5 22.5 3371 ± 7 4264 ± 4 0.62 ± 0.00 0.999
B-30 30 - - - -
From the data, it is evident that bentonite addition increases the viscosity of the
paste, in terms of consistency, flow index and yield stress. Particularly important is the
increase of yield stress, which has a twofold effect. From one hand, it can be related to
the buildability of a 3D printed object, that is the ability to sustain the weight of the
structure, increased layer by layer, without any other support. Expressing buildability as
the maximum height of a structure (H), the relation with yield stress (𝜏𝑦) is the following:
𝐻 =𝛼
𝜌𝑔𝜏𝑦 (6)
in which 𝛼 is a geometrical parameter, 𝜌 is the density, and 𝑔 is the gravity
acceleration. Therefore, from this perspective, the increase of yield stress is beneficial, as
it leads to the improvement of buildability [92], [93].
Nevertheless, since the flow begins when the yield stress is exceeded, a fluid with
high yield stress may be too difficult to extrude, causing phenomena like plugging and
rupture of the syringe, due the high pressure build-up. So, even though a yield stress is
necessary to build a self-standing structure, it should be not higher than the maximum
shear stress that the extrusion system can provide.

Chapter 3
60
Regarding mechanical properties, the addition of bentonite was demonstrated to
reduce compression strength, according to literature [94]. Data obtained from
compression tests of casted cubes after 7 days of ambient curing are reported in Table
3.2.2.
Table 3.2.2. Effect of bentonite amount on compression strength of hardened cubic specimens, after 7 days of ambient
curing
Sample Bentonite wt% Compression strength (MPa)
B-0 (C-GEO) 0 40.9 ± 6.8
B-7.5 7.5 22.8 ± 1.1
B-15 (LB-GEO) 15 21.9 ± 2.5
B-22.5 22.5 21.7 ± 3.6
B-30 30 14.8 ± 2.5
The main reductions of mechanical properties occur passing from 0 wt% to 7.5
wt% amount of bentonite and for the sample at 30 wt%. In between, a sort of plateau is
found.
Yield stress and compression strength, changing with respect to bentonite wt%,
are plotted in Figure 3.2.2. An optimum point, in which shear yield stress is sufficiently
high and compressive strength is not too low, is found at 15 wt% of bentonite.
Figure 3.2.2. Yield stress and compression strength plotted against the amount of bentonite
Despite the lower mechanical properties at 7 days, bentonite acts as a fine
aggregate in geopolymer mortars, lessening the effects of drying shrinkage [43]. The
reduction in volume due to the progressive setting of the material and to the evaporation
of residual water, in fact, can lead to the formation of cracks, which worsen the durability.
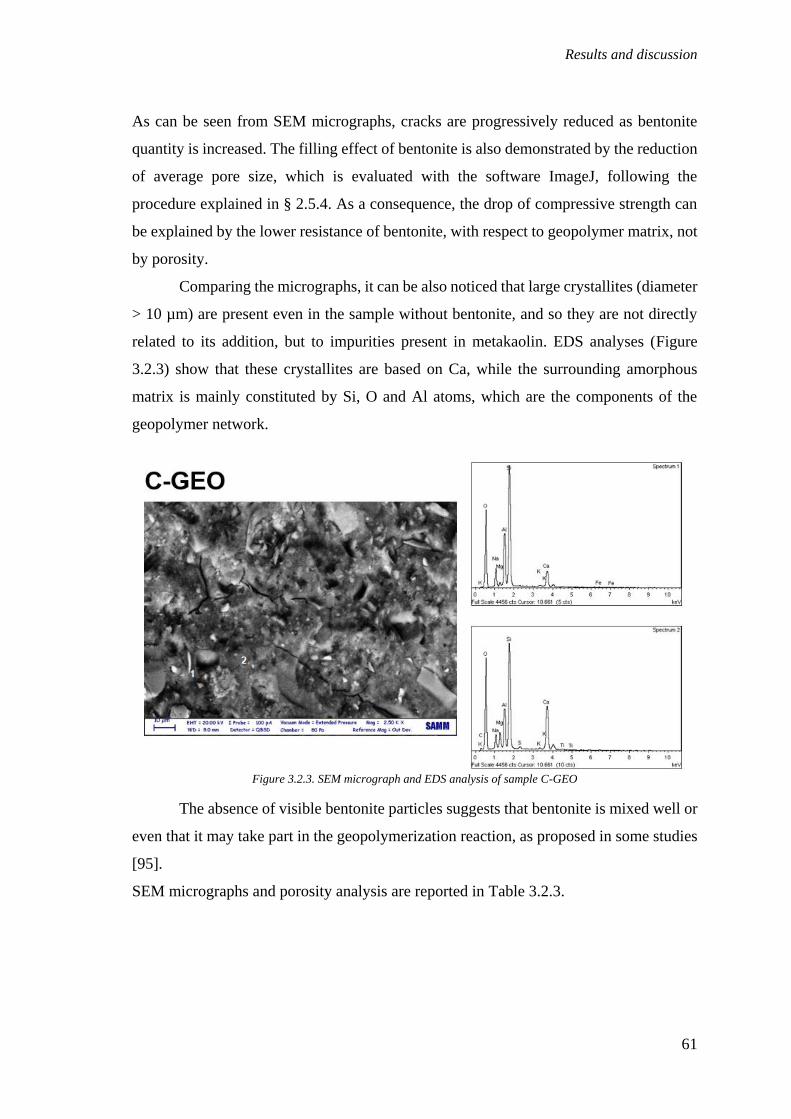
Results and discussion
61
As can be seen from SEM micrographs, cracks are progressively reduced as bentonite
quantity is increased. The filling effect of bentonite is also demonstrated by the reduction
of average pore size, which is evaluated with the software ImageJ, following the
procedure explained in § 2.5.4. As a consequence, the drop of compressive strength can
be explained by the lower resistance of bentonite, with respect to geopolymer matrix, not
by porosity.
Comparing the micrographs, it can be also noticed that large crystallites (diameter
> 10 µm) are present even in the sample without bentonite, and so they are not directly
related to its addition, but to impurities present in metakaolin. EDS analyses (Figure
3.2.3) show that these crystallites are based on Ca, while the surrounding amorphous
matrix is mainly constituted by Si, O and Al atoms, which are the components of the
geopolymer network.
Figure 3.2.3. SEM micrograph and EDS analysis of sample C-GEO
The absence of visible bentonite particles suggests that bentonite is mixed well or
even that it may take part in the geopolymerization reaction, as proposed in some studies
[95].
SEM micrographs and porosity analysis are reported in Table 3.2.3.

Chapter 3
62
Table 3.2.3. Comparison between samples without and with bentonite: SEM micrographs and ImageJ analyses of
porosity
Sample C-GEO
(0 wt% bentonite)
LB-GEO
(15 wt% bentonite)
SEM
micrograph
Processed image
Average pore
size (µm2) 12.36 10.74
The beneficial filling effect of bentonite is also evident upon annealing. Annealing
performed on cylindrical casted samples of unfilled geopolymer provoked the formation
of cracks and an unwanted reduction of mechanical properties from 40.1 ± 9.3 MPa to
25.3 ± 6.5 MPa. Samples containing bentonite, on the other hand, took advantage of
thermal treatment, since the action of bentonite as filler prevented embrittlement and
uncontrolled shrinkage. The beneficial effect of annealing on samples containing
bentonite and its effect on mechanical properties are deeply discussed in § 3.3.

Results and discussion
63
3.2.3. Effect of bentonite type
Three different commercial bentonites were tested. The effect of the type of
bentonite on rheological behaviour of the pastes is reported in Figure 3.2.4, and Herschel-
Bulkley’s model parameters, computed from fitting according to Equation (1), in Table
3.2.4.
Figure 3.2.4. Flow curves of geopolymer pastes (low-bentonite formulation) containing different kinds of commercial
bentonites
Table 3.2.4. Parameters of Herschel-Bulkley’s model fitted on the flow curves of geopolymer pastes, containing
different types of bentonite
Sample Yield stress (Pa) K (Pa sn) n R2
C-GEO 0 ± 0 13 ± 1 0.43 ± 0.00 0.999
LB-GEO_B1 2864 ± 241 2444 ± 212 0.53 ± 0.03 0.984
LB-GEO_B2 1471 ± 17 2513 ± 21 0.44 ± 0.00 0.988
LB-GEO_B3 380 ± 15 2660 ± 17 0.48 ± 0.00 0.989
In all the cases, when bentonite is present, a yield stress is found. While
consistency and flow index are similar, the value of yield stress is different. This result

Chapter 3
64
suggests that the formulation should be slightly changed according to the bentonite used,
particularly in the case of B3, whose value of yield stress is very low.
Mechanical properties are much less affected by the different kind of bentonite.
Compression tests, carried out on 3D printed hollow cylinders made of unfilled
geopolymer with LB formulations, showed that the value of compression strength after 7
days of ambient curing is practically the same (Figure 3.2.5).
Figure 3.2.5. Compression strength of 3d-printed specimens after 7 days of ambient curing. Comparison between
different bentonites and formulations
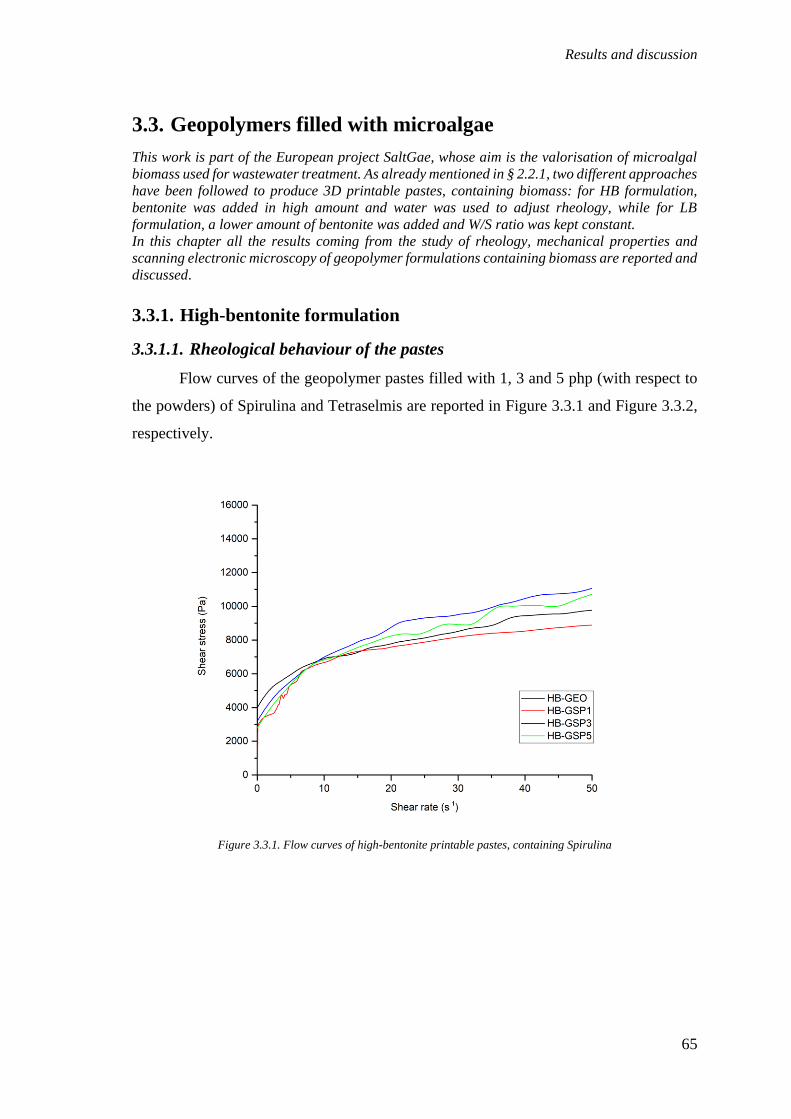
Results and discussion
65
3.3. Geopolymers filled with microalgae
This work is part of the European project SaltGae, whose aim is the valorisation of microalgal
biomass used for wastewater treatment. As already mentioned in § 2.2.1, two different approaches
have been followed to produce 3D printable pastes, containing biomass: for HB formulation,
bentonite was added in high amount and water was used to adjust rheology, while for LB
formulation, a lower amount of bentonite was added and W/S ratio was kept constant.
In this chapter all the results coming from the study of rheology, mechanical properties and
scanning electronic microscopy of geopolymer formulations containing biomass are reported and
discussed.
3.3.1. High-bentonite formulation
3.3.1.1. Rheological behaviour of the pastes
Flow curves of the geopolymer pastes filled with 1, 3 and 5 php (with respect to
the powders) of Spirulina and Tetraselmis are reported in Figure 3.3.1 and Figure 3.3.2,
respectively.
Figure 3.3.1. Flow curves of high-bentonite printable pastes, containing Spirulina

Chapter 3
66
Figure 3.3.2. Flow curves of high-bentonite printable pastes, containing Tetraselmis
Qualitatively, the rheological behaviour of the pastes is not highly affected by the
type and by the amount microalgae added. A more complete description comes from the
fitting of the curves with Herschel-Bulkley’s model (Table 3.3.1).
Table 3.3.1. Parameters of Herschel-Bulkley's model for HB formulations, containing biomass
Sample Biomass php (powder) Yield stress (Pa) K (Pa sn) n R2
HB-GEO 0 2984 ± 55 1717 ± 42 0.35 ± 0.00 0.993
HB-GSP1 1 1195 ± 29 2479 ± 40 0.25 ± 0.00 0.952
HB-GSP3 3 1040 ± 75 2847 ± 56 0.32 ± 0.00 0.996
HB-GSP5 5 1022 ± 85 2605 ± 63 0.34 ± 0.00 0.994
HB-GTT1 1 1737 ± 98 2658 ± 78 0.32 ± 0.01 0.992
HB-GTT3 3 1424 ± 72 3034 ± 54 0.33 ± 0.00 0.997
HB-GTT5 5 2670 ± 123 1733 ± 100 0.42 ± 0.01 0.984
Herschel-Bulkley’s model fitted very well with all formulations. Therefore, the
rheological behaviour of all the pastes is pseudoplastic (n < 1) with yield stress.
The most interesting result is the appreciable reduction of yield stress (plotted in
Figure 3.3.3) in presence of biomass. The easier interpretation in this case is to relate this
phenomenon to the higher presence of water (higher W/S ratio) in formulations
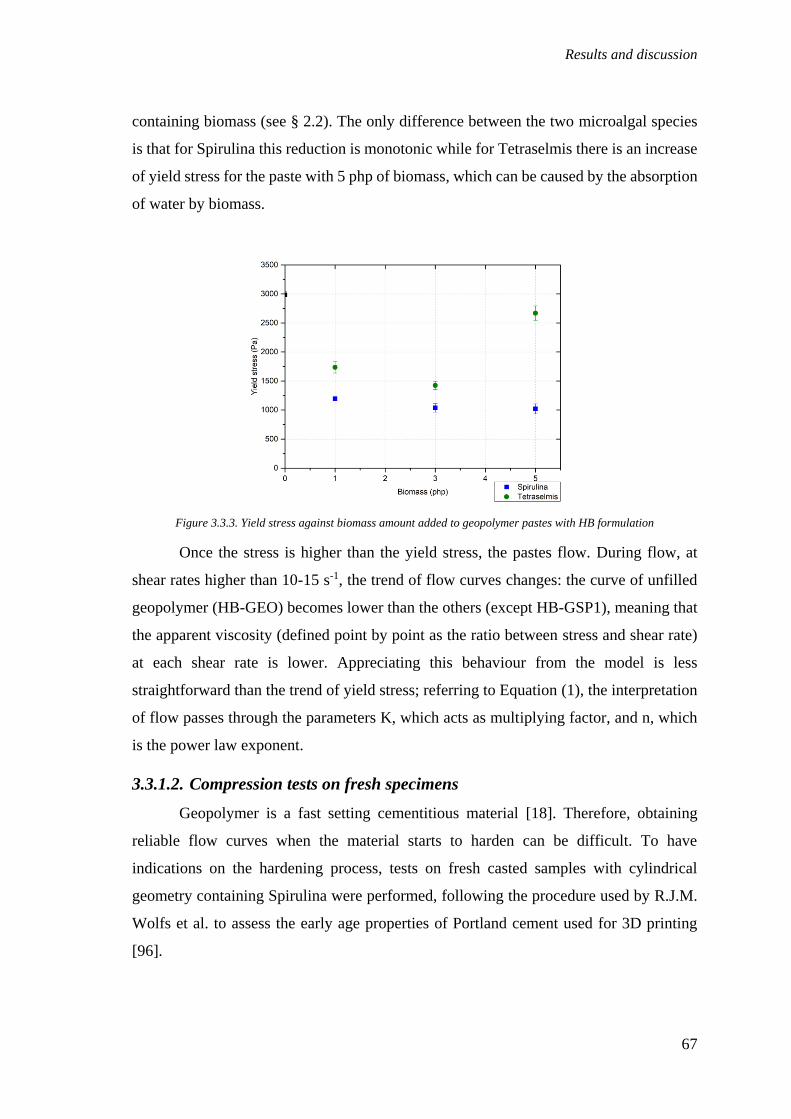
Results and discussion
67
containing biomass (see § 2.2). The only difference between the two microalgal species
is that for Spirulina this reduction is monotonic while for Tetraselmis there is an increase
of yield stress for the paste with 5 php of biomass, which can be caused by the absorption
of water by biomass.
Figure 3.3.3. Yield stress against biomass amount added to geopolymer pastes with HB formulation
Once the stress is higher than the yield stress, the pastes flow. During flow, at
shear rates higher than 10-15 s-1, the trend of flow curves changes: the curve of unfilled
geopolymer (HB-GEO) becomes lower than the others (except HB-GSP1), meaning that
the apparent viscosity (defined point by point as the ratio between stress and shear rate)
at each shear rate is lower. Appreciating this behaviour from the model is less
straightforward than the trend of yield stress; referring to Equation (1), the interpretation
of flow passes through the parameters K, which acts as multiplying factor, and n, which
is the power law exponent.
3.3.1.2. Compression tests on fresh specimens
Geopolymer is a fast setting cementitious material [18]. Therefore, obtaining
reliable flow curves when the material starts to harden can be difficult. To have
indications on the hardening process, tests on fresh casted samples with cylindrical
geometry containing Spirulina were performed, following the procedure used by R.J.M.
Wolfs et al. to assess the early age properties of Portland cement used for 3D printing
[96].
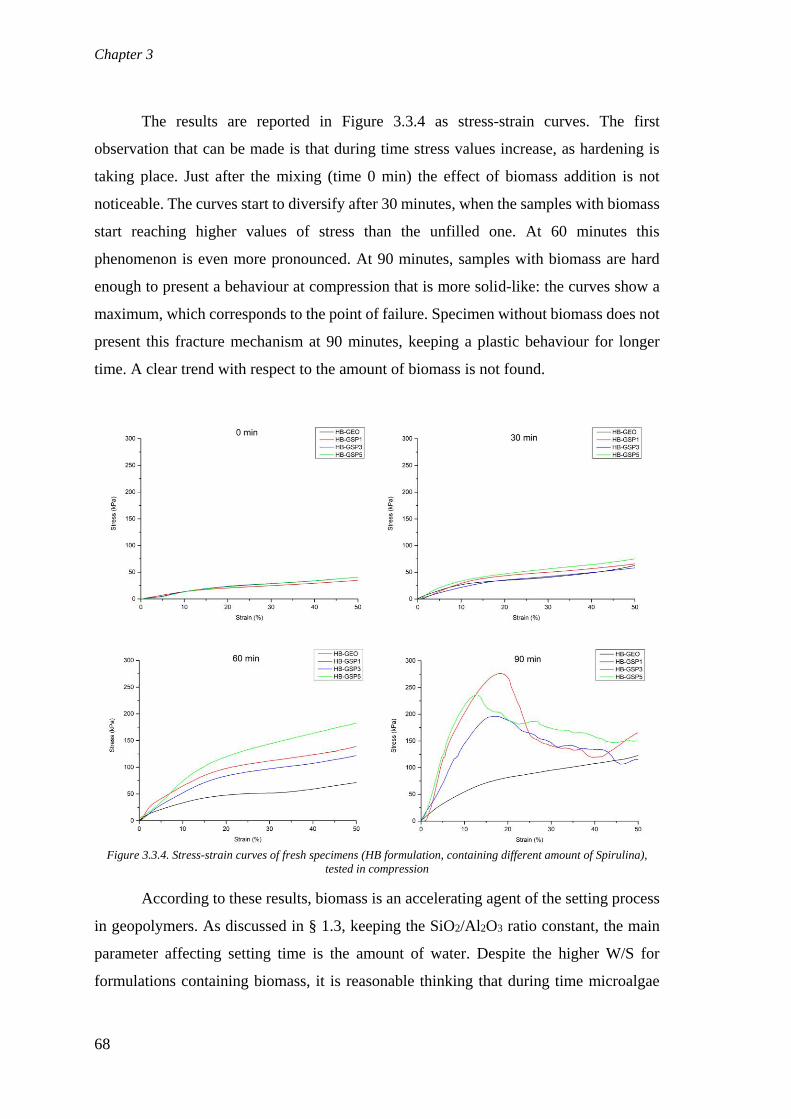
Chapter 3
68
The results are reported in Figure 3.3.4 as stress-strain curves. The first
observation that can be made is that during time stress values increase, as hardening is
taking place. Just after the mixing (time 0 min) the effect of biomass addition is not
noticeable. The curves start to diversify after 30 minutes, when the samples with biomass
start reaching higher values of stress than the unfilled one. At 60 minutes this
phenomenon is even more pronounced. At 90 minutes, samples with biomass are hard
enough to present a behaviour at compression that is more solid-like: the curves show a
maximum, which corresponds to the point of failure. Specimen without biomass does not
present this fracture mechanism at 90 minutes, keeping a plastic behaviour for longer
time. A clear trend with respect to the amount of biomass is not found.
Figure 3.3.4. Stress-strain curves of fresh specimens (HB formulation, containing different amount of Spirulina),
tested in compression
According to these results, biomass is an accelerating agent of the setting process
in geopolymers. As discussed in § 1.3, keeping the SiO2/Al2O3 ratio constant, the main
parameter affecting setting time is the amount of water. Despite the higher W/S for
formulations containing biomass, it is reasonable thinking that during time microalgae
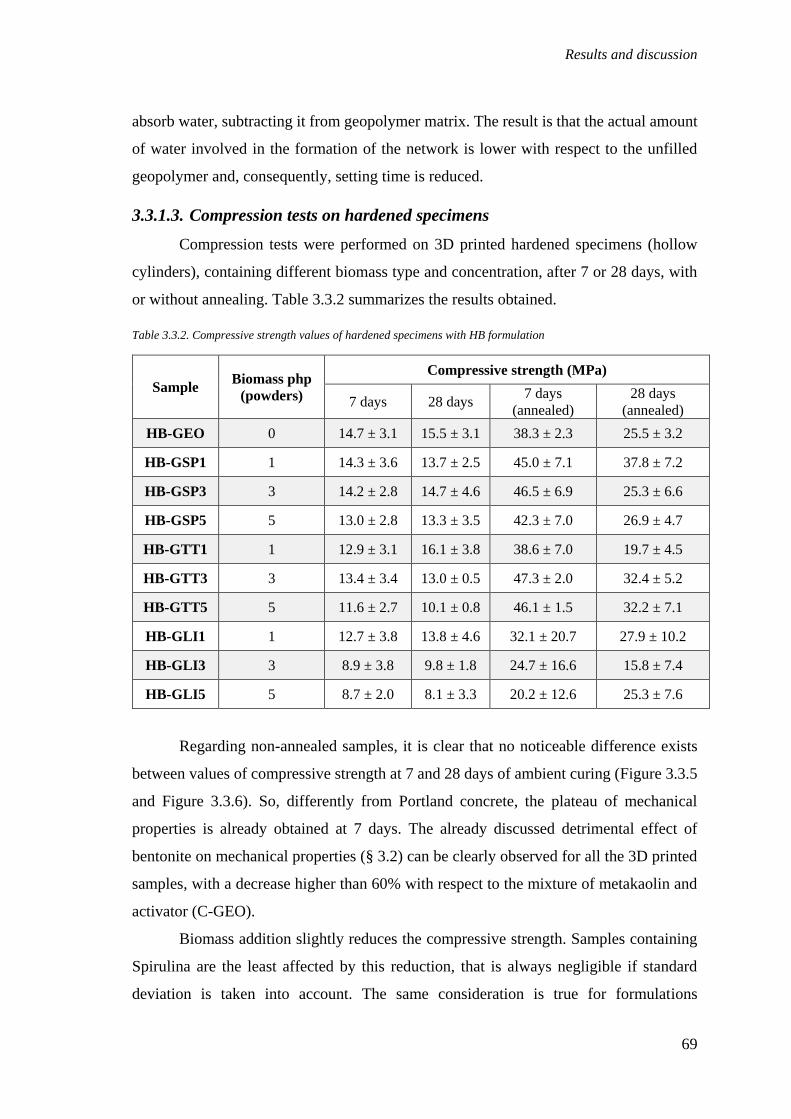
Results and discussion
69
absorb water, subtracting it from geopolymer matrix. The result is that the actual amount
of water involved in the formation of the network is lower with respect to the unfilled
geopolymer and, consequently, setting time is reduced.
3.3.1.3. Compression tests on hardened specimens
Compression tests were performed on 3D printed hardened specimens (hollow
cylinders), containing different biomass type and concentration, after 7 or 28 days, with
or without annealing. Table 3.3.2 summarizes the results obtained.
Table 3.3.2. Compressive strength values of hardened specimens with HB formulation
Sample Biomass php
(powders)
Compressive strength (MPa)
7 days 28 days 7 days
(annealed)
28 days
(annealed)
HB-GEO 0 14.7 ± 3.1 15.5 ± 3.1 38.3 ± 2.3 25.5 ± 3.2
HB-GSP1 1 14.3 ± 3.6 13.7 ± 2.5 45.0 ± 7.1 37.8 ± 7.2
HB-GSP3 3 14.2 ± 2.8 14.7 ± 4.6 46.5 ± 6.9 25.3 ± 6.6
HB-GSP5 5 13.0 ± 2.8 13.3 ± 3.5 42.3 ± 7.0 26.9 ± 4.7
HB-GTT1 1 12.9 ± 3.1 16.1 ± 3.8 38.6 ± 7.0 19.7 ± 4.5
HB-GTT3 3 13.4 ± 3.4 13.0 ± 0.5 47.3 ± 2.0 32.4 ± 5.2
HB-GTT5 5 11.6 ± 2.7 10.1 ± 0.8 46.1 ± 1.5 32.2 ± 7.1
HB-GLI1 1 12.7 ± 3.8 13.8 ± 4.6 32.1 ± 20.7 27.9 ± 10.2
HB-GLI3 3 8.9 ± 3.8 9.8 ± 1.8 24.7 ± 16.6 15.8 ± 7.4
HB-GLI5 5 8.7 ± 2.0 8.1 ± 3.3 20.2 ± 12.6 25.3 ± 7.6
Regarding non-annealed samples, it is clear that no noticeable difference exists
between values of compressive strength at 7 and 28 days of ambient curing (Figure 3.3.5
and Figure 3.3.6). So, differently from Portland concrete, the plateau of mechanical
properties is already obtained at 7 days. The already discussed detrimental effect of
bentonite on mechanical properties (§ 3.2) can be clearly observed for all the 3D printed
samples, with a decrease higher than 60% with respect to the mixture of metakaolin and
activator (C-GEO).
Biomass addition slightly reduces the compressive strength. Samples containing
Spirulina are the least affected by this reduction, that is always negligible if standard
deviation is taken into account. The same consideration is true for formulations
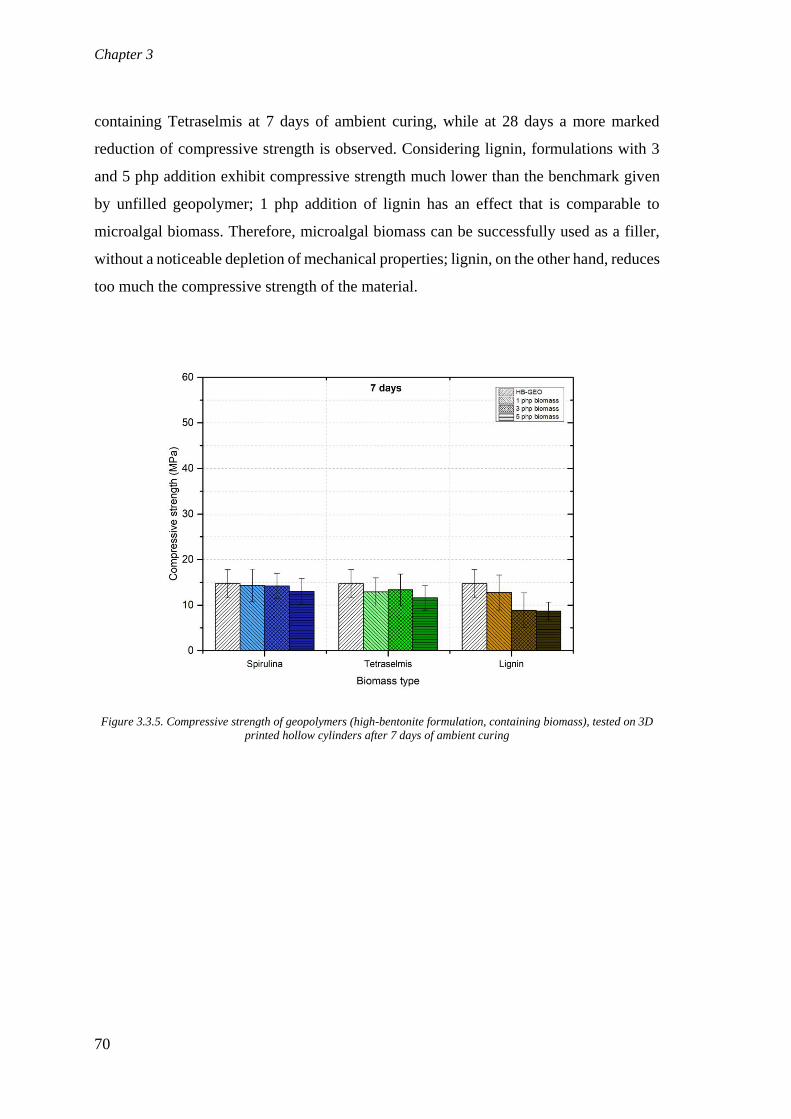
Chapter 3
70
containing Tetraselmis at 7 days of ambient curing, while at 28 days a more marked
reduction of compressive strength is observed. Considering lignin, formulations with 3
and 5 php addition exhibit compressive strength much lower than the benchmark given
by unfilled geopolymer; 1 php addition of lignin has an effect that is comparable to
microalgal biomass. Therefore, microalgal biomass can be successfully used as a filler,
without a noticeable depletion of mechanical properties; lignin, on the other hand, reduces
too much the compressive strength of the material.
Figure 3.3.5. Compressive strength of geopolymers (high-bentonite formulation, containing biomass), tested on 3D
printed hollow cylinders after 7 days of ambient curing

Results and discussion
71
Figure 3.3.6. Compressive strength of geopolymers (high-bentonite formulation, containing biomass), tested on 3D
printed hollow cylinders after 28 days of ambient curing
Annealing always improved the compressive strength of HB samples: considering
the unfilled reference (HB-GEO), compressive strength grows from 14.7 ± 3.1 MPa to
38.3 ± 2.3 MPa at 7 days and from 15.5 ± 3.1 MPa to 25.5 ± 3.2 MPa at 28 days. Thermal
treatment is reported to induce structural and phase composition changes in the material
[18], [44]. The former ones are mainly related to sintering effects, which affect size,
volume and interconnectivity of pores; the latter to melting and crystal growth or
modifications in crystal structure. At the temperatures attained for thermal treatments
performed in this work, only sintering processes can occur. Sintering of the geopolymer
results in a closer porosity and allows for more uniform stress gradients during the
application of loads, improving mechanical strength. Moreover, other beneficial effects
are the improved bonding between the particles and crack healing. SEM analyses,
reported in the next paragraph, are performed to have an experimental verification of
these theoretical considerations.
Thermal treatment was more effective on specimens cured for 7 days than 28 days,
probably because after 7 days there is still some residual mobility in the network, which
eases the fast hardening induced by heat. In general, standard deviations are higher than
for non-annealed specimens, meaning that the effect of annealing can change significantly
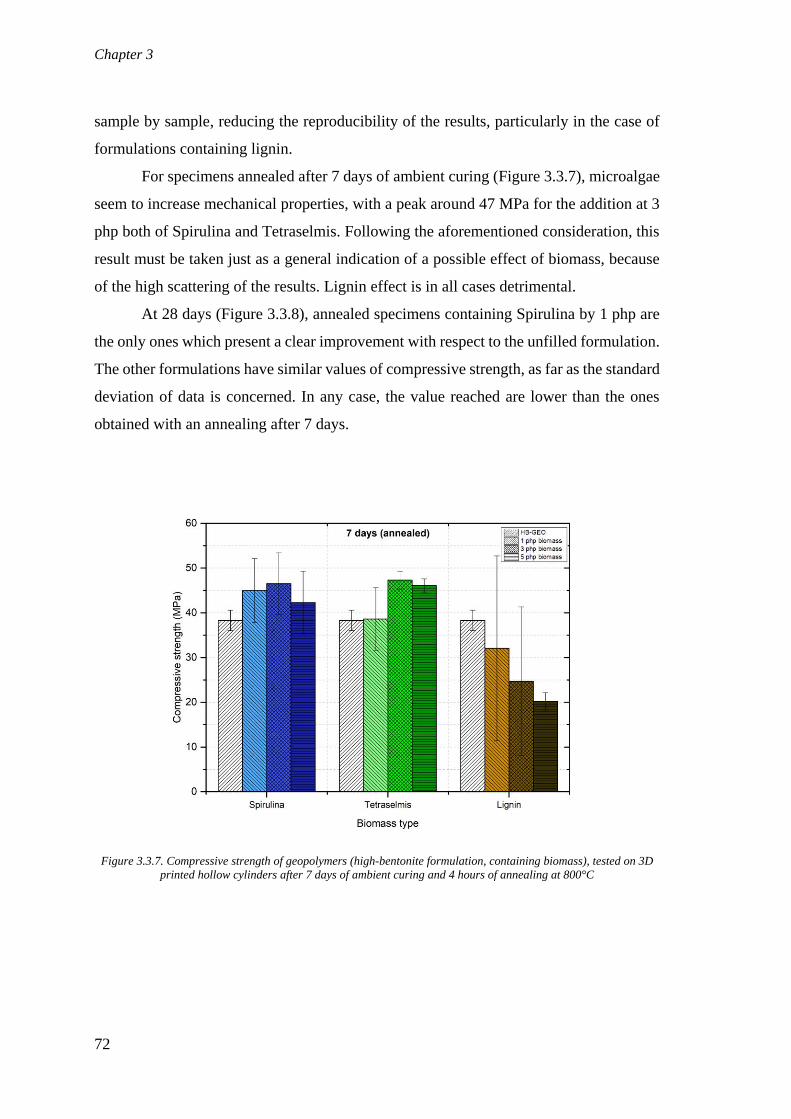
Chapter 3
72
sample by sample, reducing the reproducibility of the results, particularly in the case of
formulations containing lignin.
For specimens annealed after 7 days of ambient curing (Figure 3.3.7), microalgae
seem to increase mechanical properties, with a peak around 47 MPa for the addition at 3
php both of Spirulina and Tetraselmis. Following the aforementioned consideration, this
result must be taken just as a general indication of a possible effect of biomass, because
of the high scattering of the results. Lignin effect is in all cases detrimental.
At 28 days (Figure 3.3.8), annealed specimens containing Spirulina by 1 php are
the only ones which present a clear improvement with respect to the unfilled formulation.
The other formulations have similar values of compressive strength, as far as the standard
deviation of data is concerned. In any case, the value reached are lower than the ones
obtained with an annealing after 7 days.
Figure 3.3.7. Compressive strength of geopolymers (high-bentonite formulation, containing biomass), tested on 3D
printed hollow cylinders after 7 days of ambient curing and 4 hours of annealing at 800°C

Results and discussion
73
Figure 3.3.8. Compressive strength of geopolymers (high-bentonite formulation, containing biomass), tested on 3D
printed hollow cylinders after 28 days of ambient curing and 4 hours of annealing at 800°C
Compressive strength of 3D printed hollow cylinders was compared to cubic and
cylindric casted samples, to understand whether the printing process influences
mechanical properties or not. A complete characterization for all formulations containing
Spirulina and Tetraselmis was performed on cubic specimens after 28 days of ambient
curing, with or without annealing (Table 3.3.3).
Table 3.3.3. Compressive strength of geopolymers containing microalgal biomass, measured on cubic casted specimens
after 28 days of ambient curing, annealed or not
Sample Biomass php (powder) Compressive strength at 28 days (MPa)
Non-annealed Annealed
HB-GEO 0 12.9 ± 1.8 39.8 ± 1.7
HB-GSP1 1 13.7 ± 2.2 40.2 ± 5.9
HB-GSP3 3 16.7 ± 4.4 42.4 ± 0.9
HB-GSP5 5 12.9 ± 1.6 36.7 ± 6.2
HB-GTT1 1 10.9 ± 2.9 28.5 ± 5.2
HB-GTT3 3 11.9 ± 1.4 41.4 ± 2.5
HB-GTT5 5 9.5 ± 0.5 41.5 ± 4.1
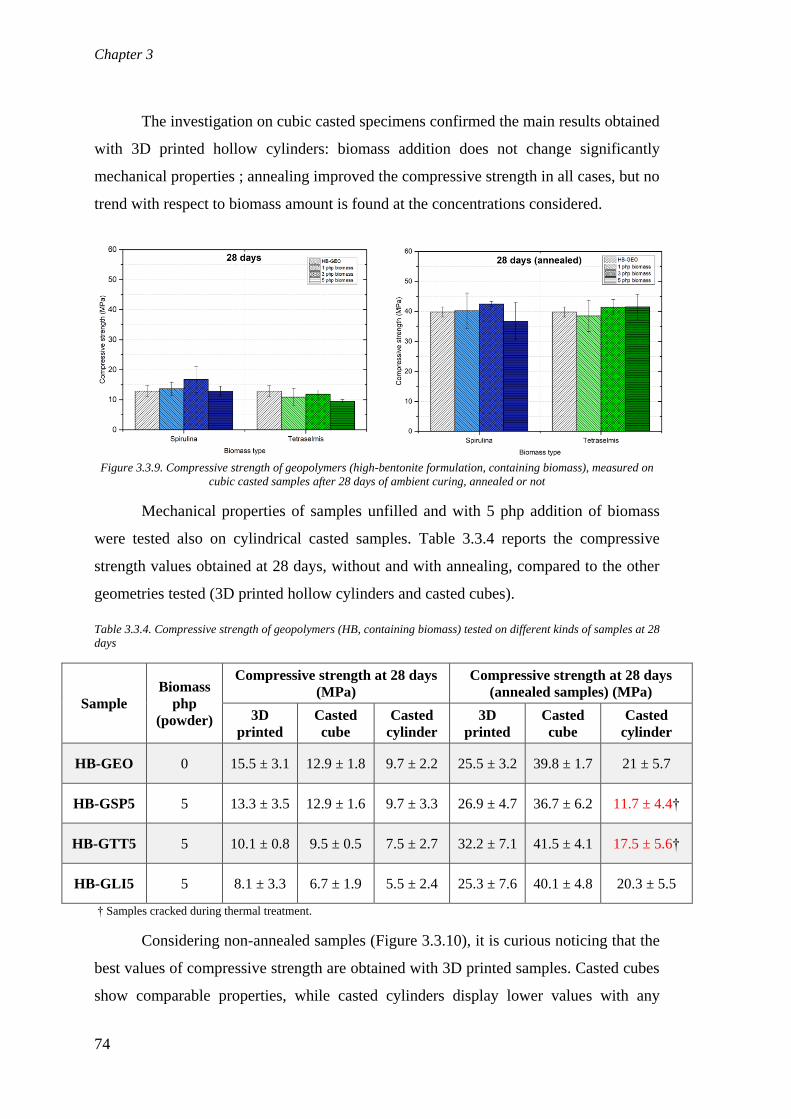
Chapter 3
74
The investigation on cubic casted specimens confirmed the main results obtained
with 3D printed hollow cylinders: biomass addition does not change significantly
mechanical properties ; annealing improved the compressive strength in all cases, but no
trend with respect to biomass amount is found at the concentrations considered.
Figure 3.3.9. Compressive strength of geopolymers (high-bentonite formulation, containing biomass), measured on
cubic casted samples after 28 days of ambient curing, annealed or not
Mechanical properties of samples unfilled and with 5 php addition of biomass
were tested also on cylindrical casted samples. Table 3.3.4 reports the compressive
strength values obtained at 28 days, without and with annealing, compared to the other
geometries tested (3D printed hollow cylinders and casted cubes).
Table 3.3.4. Compressive strength of geopolymers (HB, containing biomass) tested on different kinds of samples at 28
days
Sample
Biomass
php
(powder)
Compressive strength at 28 days
(MPa)
Compressive strength at 28 days
(annealed samples) (MPa)
3D
printed
Casted
cube
Casted
cylinder
3D
printed
Casted
cube
Casted
cylinder
HB-GEO 0 15.5 ± 3.1 12.9 ± 1.8 9.7 ± 2.2 25.5 ± 3.2 39.8 ± 1.7 21 ± 5.7
HB-GSP5 5 13.3 ± 3.5 12.9 ± 1.6 9.7 ± 3.3 26.9 ± 4.7 36.7 ± 6.2 11.7 ± 4.4†
HB-GTT5 5 10.1 ± 0.8 9.5 ± 0.5 7.5 ± 2.7 32.2 ± 7.1 41.5 ± 4.1 17.5 ± 5.6†
HB-GLI5 5 8.1 ± 3.3 6.7 ± 1.9 5.5 ± 2.4 25.3 ± 7.6 40.1 ± 4.8 20.3 ± 5.5
† Samples cracked during thermal treatment.
Considering non-annealed samples (Figure 3.3.10), it is curious noticing that the
best values of compressive strength are obtained with 3D printed samples. Casted cubes
show comparable properties, while casted cylinders display lower values with any
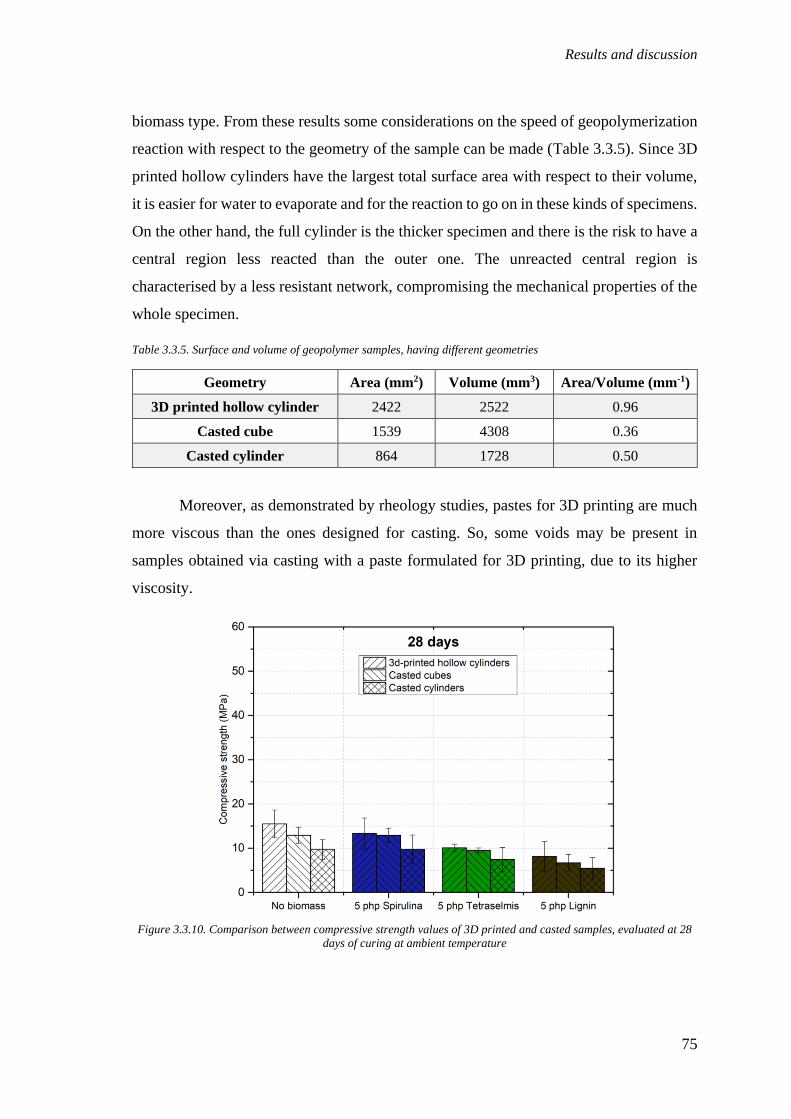
Results and discussion
75
biomass type. From these results some considerations on the speed of geopolymerization
reaction with respect to the geometry of the sample can be made (Table 3.3.5). Since 3D
printed hollow cylinders have the largest total surface area with respect to their volume,
it is easier for water to evaporate and for the reaction to go on in these kinds of specimens.
On the other hand, the full cylinder is the thicker specimen and there is the risk to have a
central region less reacted than the outer one. The unreacted central region is
characterised by a less resistant network, compromising the mechanical properties of the
whole specimen.
Table 3.3.5. Surface and volume of geopolymer samples, having different geometries
Geometry Area (mm2) Volume (mm3) Area/Volume (mm-1)
3D printed hollow cylinder 2422 2522 0.96
Casted cube 1539 4308 0.36
Casted cylinder 864 1728 0.50
Moreover, as demonstrated by rheology studies, pastes for 3D printing are much
more viscous than the ones designed for casting. So, some voids may be present in
samples obtained via casting with a paste formulated for 3D printing, due to its higher
viscosity.
Figure 3.3.10. Comparison between compressive strength values of 3D printed and casted samples, evaluated at 28
days of curing at ambient temperature
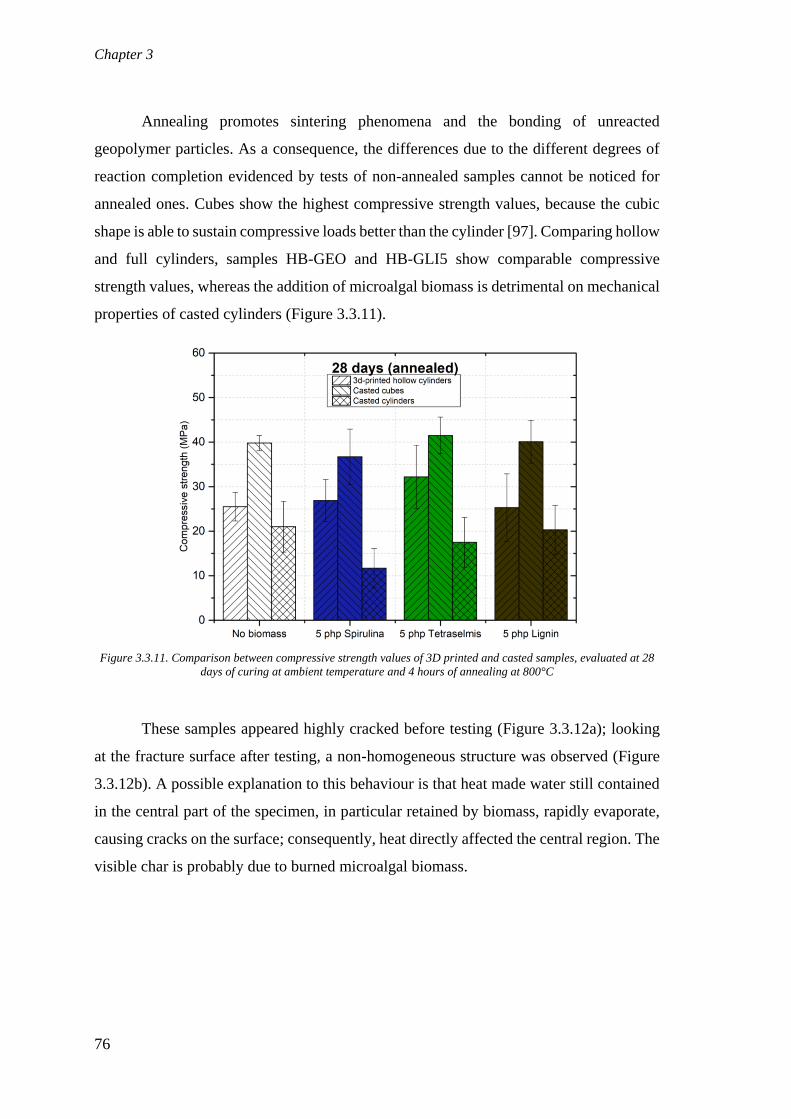
Chapter 3
76
Annealing promotes sintering phenomena and the bonding of unreacted
geopolymer particles. As a consequence, the differences due to the different degrees of
reaction completion evidenced by tests of non-annealed samples cannot be noticed for
annealed ones. Cubes show the highest compressive strength values, because the cubic
shape is able to sustain compressive loads better than the cylinder [97]. Comparing hollow
and full cylinders, samples HB-GEO and HB-GLI5 show comparable compressive
strength values, whereas the addition of microalgal biomass is detrimental on mechanical
properties of casted cylinders (Figure 3.3.11).
Figure 3.3.11. Comparison between compressive strength values of 3D printed and casted samples, evaluated at 28
days of curing at ambient temperature and 4 hours of annealing at 800°C
These samples appeared highly cracked before testing (Figure 3.3.12a); looking
at the fracture surface after testing, a non-homogeneous structure was observed (Figure
3.3.12b). A possible explanation to this behaviour is that heat made water still contained
in the central part of the specimen, in particular retained by biomass, rapidly evaporate,
causing cracks on the surface; consequently, heat directly affected the central region. The
visible char is probably due to burned microalgal biomass.
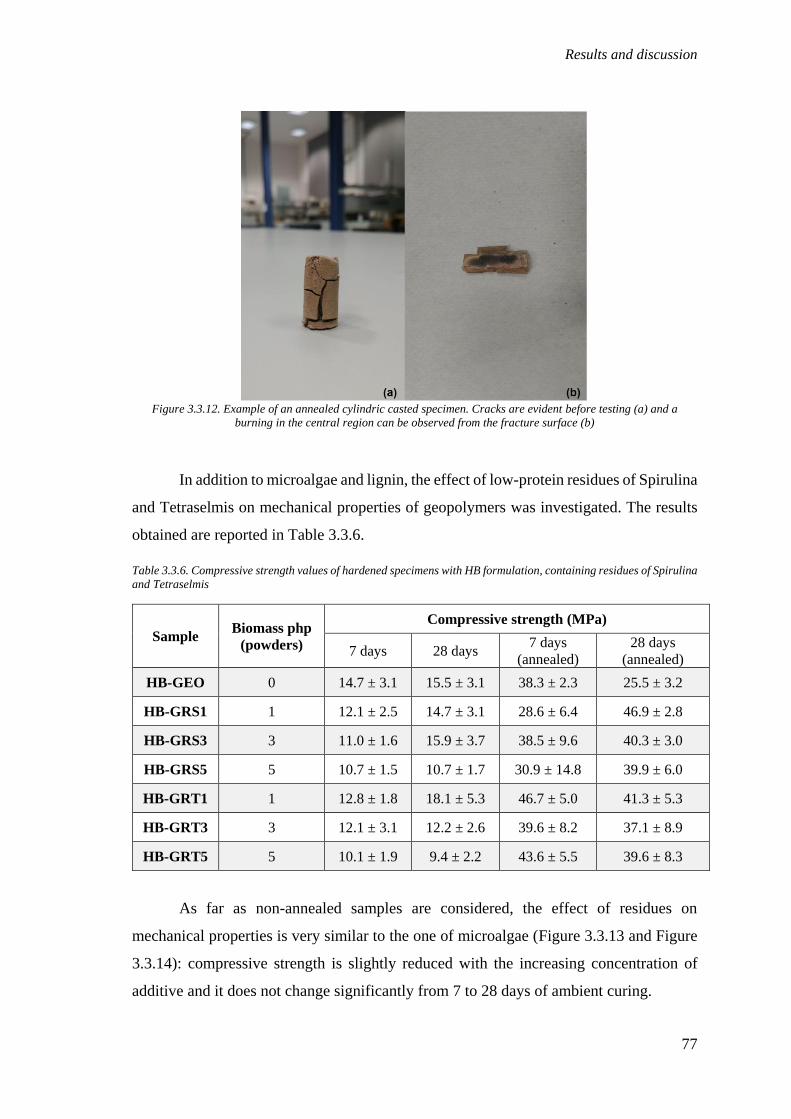
Results and discussion
77
Figure 3.3.12. Example of an annealed cylindric casted specimen. Cracks are evident before testing (a) and a
burning in the central region can be observed from the fracture surface (b)
In addition to microalgae and lignin, the effect of low-protein residues of Spirulina
and Tetraselmis on mechanical properties of geopolymers was investigated. The results
obtained are reported in Table 3.3.6.
Table 3.3.6. Compressive strength values of hardened specimens with HB formulation, containing residues of Spirulina
and Tetraselmis
Sample Biomass php
(powders)
Compressive strength (MPa)
7 days 28 days 7 days
(annealed)
28 days
(annealed)
HB-GEO 0 14.7 ± 3.1 15.5 ± 3.1 38.3 ± 2.3 25.5 ± 3.2
HB-GRS1 1 12.1 ± 2.5 14.7 ± 3.1 28.6 ± 6.4 46.9 ± 2.8
HB-GRS3 3 11.0 ± 1.6 15.9 ± 3.7 38.5 ± 9.6 40.3 ± 3.0
HB-GRS5 5 10.7 ± 1.5 10.7 ± 1.7 30.9 ± 14.8 39.9 ± 6.0
HB-GRT1 1 12.8 ± 1.8 18.1 ± 5.3 46.7 ± 5.0 41.3 ± 5.3
HB-GRT3 3 12.1 ± 3.1 12.2 ± 2.6 39.6 ± 8.2 37.1 ± 8.9
HB-GRT5 5 10.1 ± 1.9 9.4 ± 2.2 43.6 ± 5.5 39.6 ± 8.3
As far as non-annealed samples are considered, the effect of residues on
mechanical properties is very similar to the one of microalgae (Figure 3.3.13 and Figure
3.3.14): compressive strength is slightly reduced with the increasing concentration of
additive and it does not change significantly from 7 to 28 days of ambient curing.
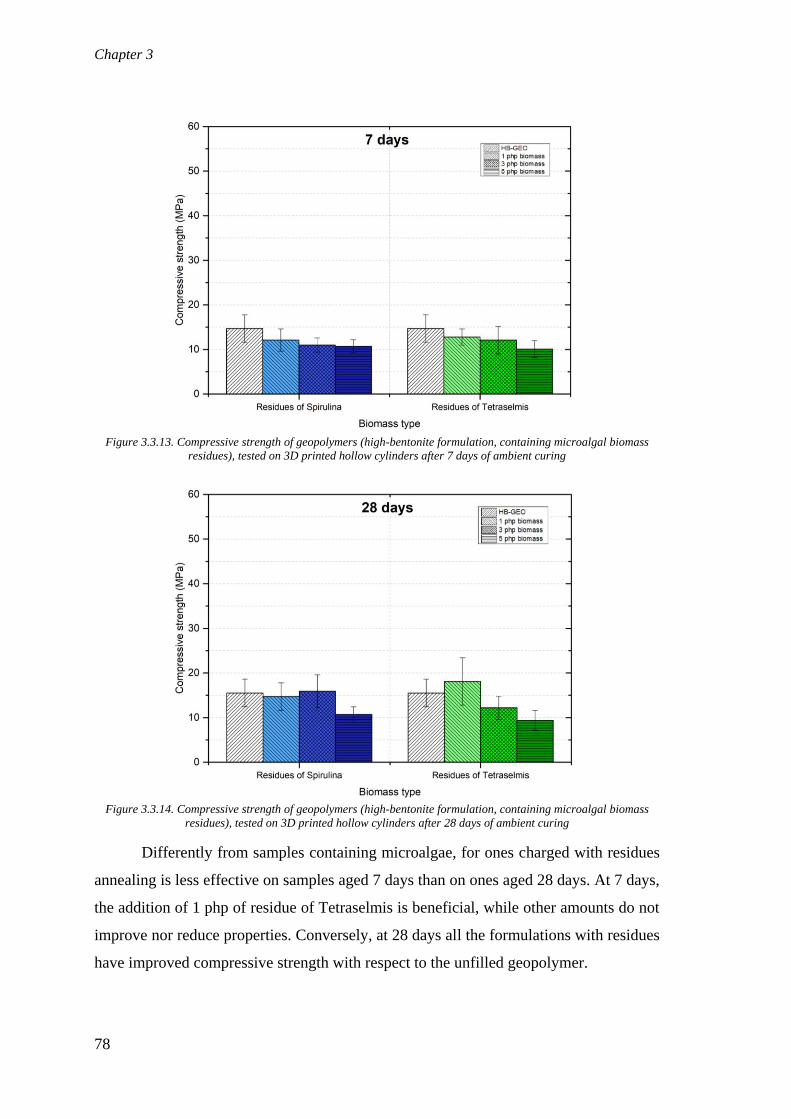
Chapter 3
78
Figure 3.3.13. Compressive strength of geopolymers (high-bentonite formulation, containing microalgal biomass
residues), tested on 3D printed hollow cylinders after 7 days of ambient curing
Figure 3.3.14. Compressive strength of geopolymers (high-bentonite formulation, containing microalgal biomass
residues), tested on 3D printed hollow cylinders after 28 days of ambient curing
Differently from samples containing microalgae, for ones charged with residues
annealing is less effective on samples aged 7 days than on ones aged 28 days. At 7 days,
the addition of 1 php of residue of Tetraselmis is beneficial, while other amounts do not
improve nor reduce properties. Conversely, at 28 days all the formulations with residues
have improved compressive strength with respect to the unfilled geopolymer.

Results and discussion
79
Figure 3.3.15. Compressive strength of geopolymers (high-bentonite formulation, containing microalgal biomass
residues), tested on 3D printed hollow cylinders after 7 days of ambient curing and 4 hours of annealing at 800°C
Figure 3.3.16. Compressive strength of geopolymers (high-bentonite formulation, containing microalgal biomass
residues), tested on 3D printed hollow cylinders after 28 days of ambient curing and 4 hours of annealing at 800°C
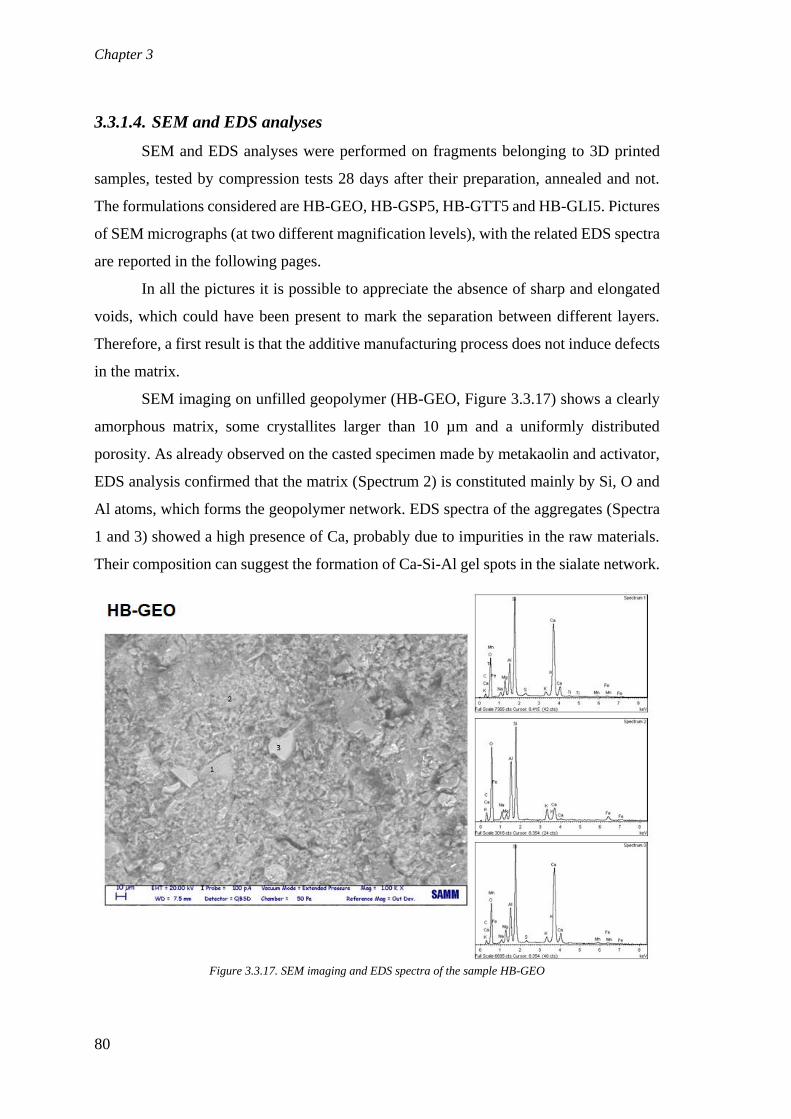
Chapter 3
80
3.3.1.4. SEM and EDS analyses
SEM and EDS analyses were performed on fragments belonging to 3D printed
samples, tested by compression tests 28 days after their preparation, annealed and not.
The formulations considered are HB-GEO, HB-GSP5, HB-GTT5 and HB-GLI5. Pictures
of SEM micrographs (at two different magnification levels), with the related EDS spectra
are reported in the following pages.
In all the pictures it is possible to appreciate the absence of sharp and elongated
voids, which could have been present to mark the separation between different layers.
Therefore, a first result is that the additive manufacturing process does not induce defects
in the matrix.
SEM imaging on unfilled geopolymer (HB-GEO, Figure 3.3.17) shows a clearly
amorphous matrix, some crystallites larger than 10 µm and a uniformly distributed
porosity. As already observed on the casted specimen made by metakaolin and activator,
EDS analysis confirmed that the matrix (Spectrum 2) is constituted mainly by Si, O and
Al atoms, which forms the geopolymer network. EDS spectra of the aggregates (Spectra
1 and 3) showed a high presence of Ca, probably due to impurities in the raw materials.
Their composition can suggest the formation of Ca-Si-Al gel spots in the sialate network.
Figure 3.3.17. SEM imaging and EDS spectra of the sample HB-GEO

Results and discussion
81
Figure 3.3.18. SEM micrographs of sample HB-GEO at different magnifications
SEM micrograph of the sample containing Spirulina (HB-GSP5, Figure 3.3.19)
looks similar to the unfilled one, but more porous. EDS demonstrated the absence of
carbon-based aggregates, which would have been the evidence of biomass aggregation.
Thus, biomass is well mixed in the matrix, but it causes porosities, probably because it
interferes in the formation of the geopolymer network. Also in this case, the matrix
(Spectrum 2) is predominantly formed by Si, O and Al, while the crystallites present a
high Ca concentration.
Figure 3.3.19. SEM imaging and EDS spectra of the sample HB-GSP5

Chapter 3
82
Figure 3.3.20. SEM micrographs of sample HB-GSP5 at different magnifications
The same general considerations hold also for sample containing Tetraselmis
(HB-GTT5, Figure 3.3.21). Large crystallites are not found in this case, and the visible
flocs are constituted mainly by metallic elements (Fe and Ni).
Figure 3.3.21. SEM imaging and EDS spectra of the sample HB-GTT5
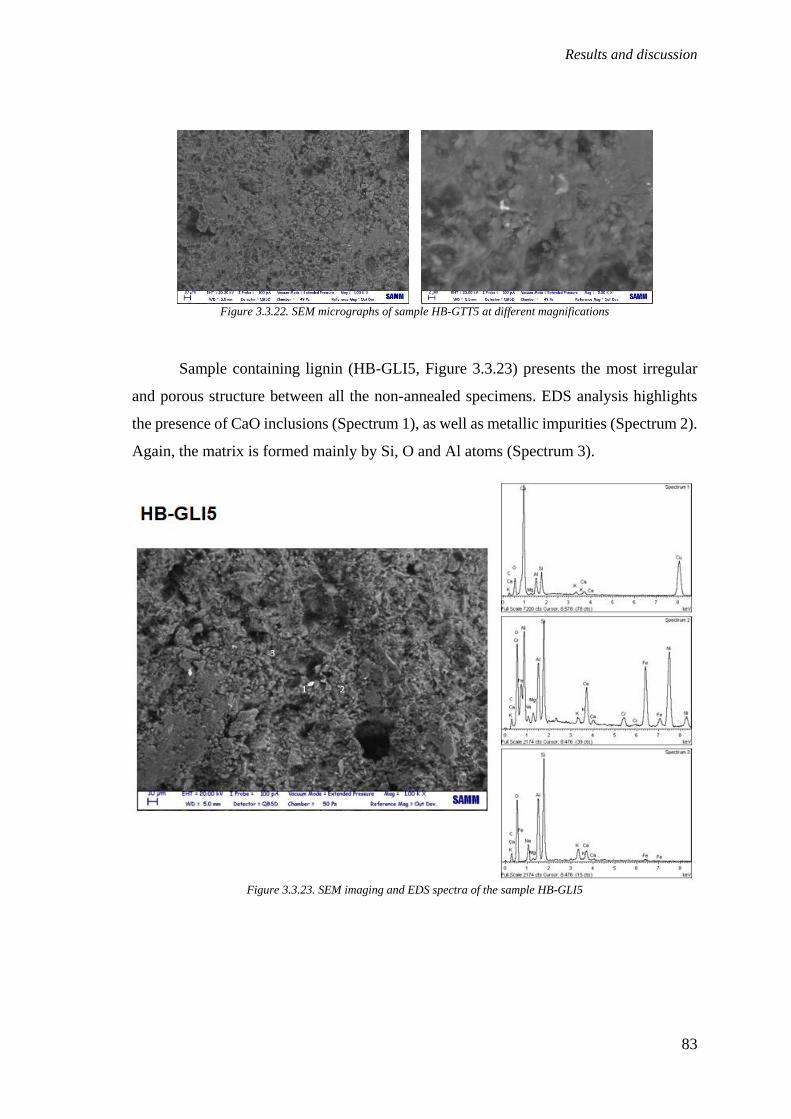
Results and discussion
83
Figure 3.3.22. SEM micrographs of sample HB-GTT5 at different magnifications
Sample containing lignin (HB-GLI5, Figure 3.3.23) presents the most irregular
and porous structure between all the non-annealed specimens. EDS analysis highlights
the presence of CaO inclusions (Spectrum 1), as well as metallic impurities (Spectrum 2).
Again, the matrix is formed mainly by Si, O and Al atoms (Spectrum 3).
Figure 3.3.23. SEM imaging and EDS spectra of the sample HB-GLI5
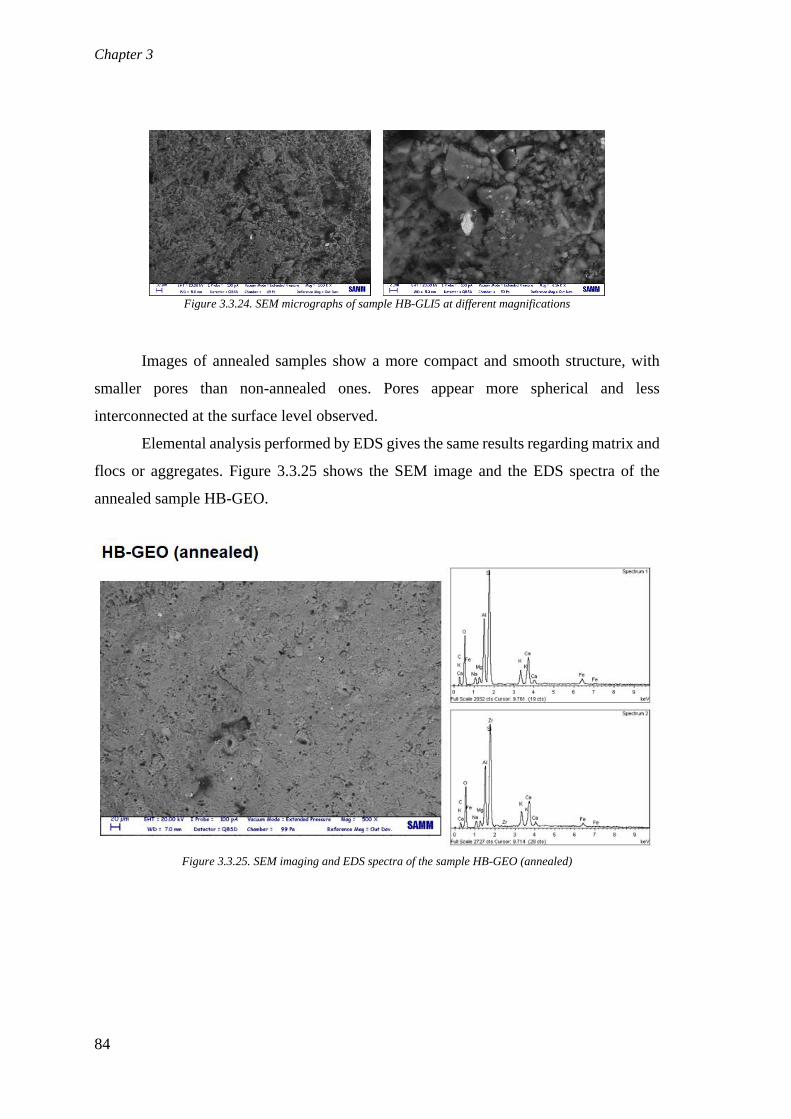
Chapter 3
84
Figure 3.3.24. SEM micrographs of sample HB-GLI5 at different magnifications
Images of annealed samples show a more compact and smooth structure, with
smaller pores than non-annealed ones. Pores appear more spherical and less
interconnected at the surface level observed.
Elemental analysis performed by EDS gives the same results regarding matrix and
flocs or aggregates. Figure 3.3.25 shows the SEM image and the EDS spectra of the
annealed sample HB-GEO.
Figure 3.3.25. SEM imaging and EDS spectra of the sample HB-GEO (annealed)
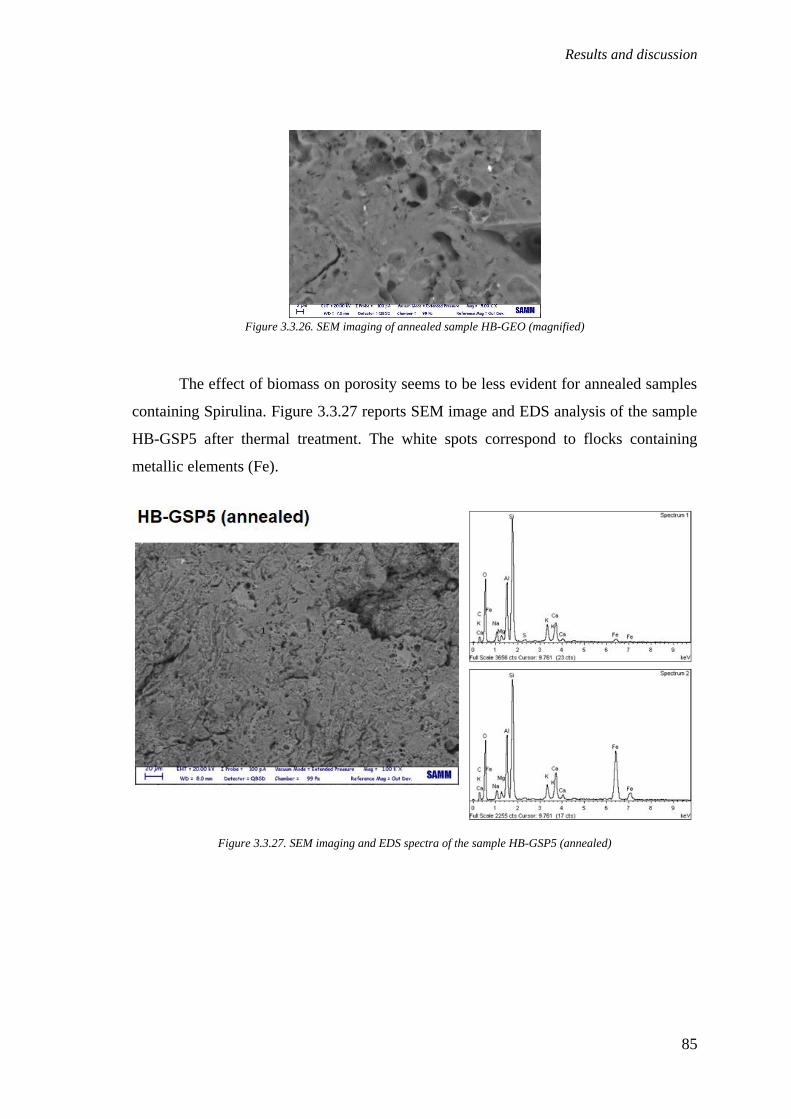
Results and discussion
85
Figure 3.3.26. SEM imaging of annealed sample HB-GEO (magnified)
The effect of biomass on porosity seems to be less evident for annealed samples
containing Spirulina. Figure 3.3.27 reports SEM image and EDS analysis of the sample
HB-GSP5 after thermal treatment. The white spots correspond to flocks containing
metallic elements (Fe).
Figure 3.3.27. SEM imaging and EDS spectra of the sample HB-GSP5 (annealed)
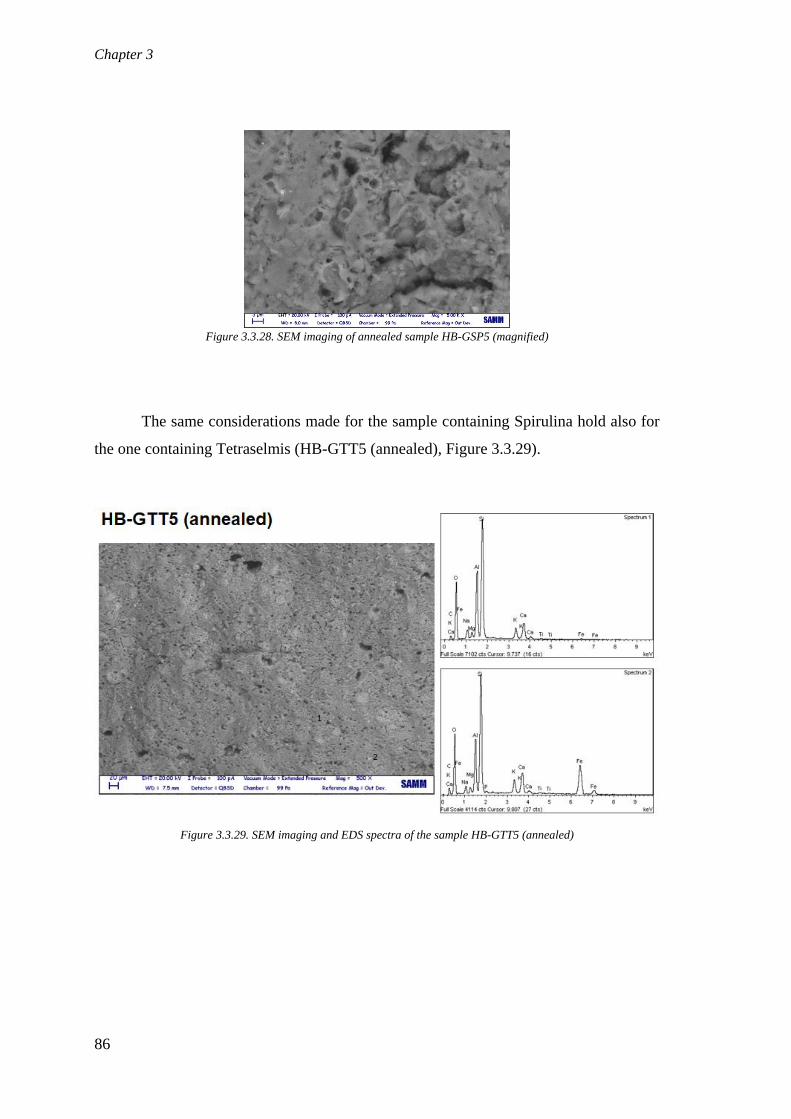
Chapter 3
86
Figure 3.3.28. SEM imaging of annealed sample HB-GSP5 (magnified)
The same considerations made for the sample containing Spirulina hold also for
the one containing Tetraselmis (HB-GTT5 (annealed), Figure 3.3.29).
Figure 3.3.29. SEM imaging and EDS spectra of the sample HB-GTT5 (annealed)

Results and discussion
87
Figure 3.3.30. SEM imaging of annealed sample HB-GTT5 (magnified)
The difference between algal biomass and lignin that was found in non-annealed
samples is not so evident in the thermal-treated ones. Both SEM imaging and EDS spectra
of the sample HB-GLI5 (annealed), reported in Figure 3.3.31, are comparable to the
previous two, containing Spirulina and Tetraselmis, respectively.
Figure 3.3.31. SEM imaging and EDS spectra of the sample HB-GLI5 (annealed)

Chapter 3
88
Figure 3.3.32. SEM imaging of annealed sample HB-GLI5 (magnified)
SEM micrographs were elaborated with the software ImageJ to analyse porosity
(see § 2.2 for the details of the procedure adopted). In Table 3.3.7 and Table 3.3.8 the
processing of the images and the results obtained are reported in terms of pore area, for
specimens non-annealed and annealed, respectively. For non-annealed specimen, it is
clear the increase of porosity with the addition of biomass. The same effect is not
appreciable for the annealed ones.

Results and discussion
89
Table 3.3.7. ImageJ analyses of non-annealed samples with HB formulation
Sample Original image Processed image
Average
pore size
(µm2)
HB-
GEO
10.79
HB-
GSP5
13.26
HB-
GTT5
17.69
HB-
GLI5
18.79
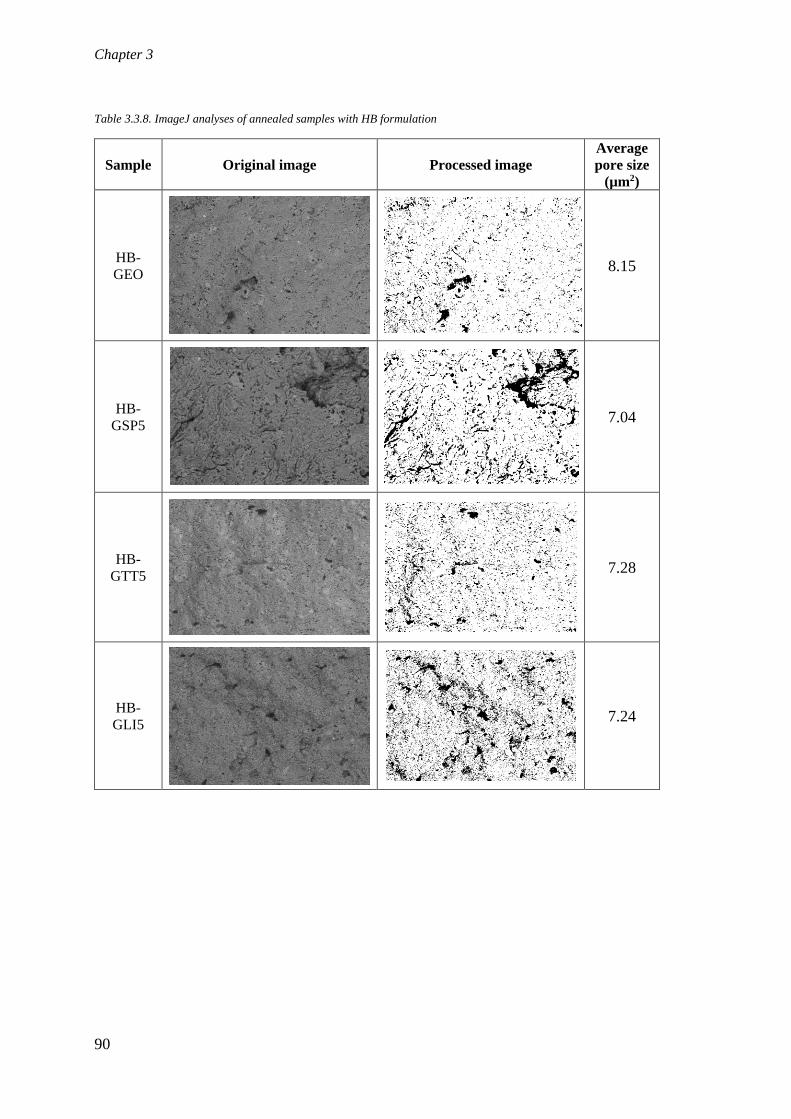
Chapter 3
90
Table 3.3.8. ImageJ analyses of annealed samples with HB formulation
Sample Original image Processed image
Average
pore size
(µm2)
HB-
GEO
8.15
HB-
GSP5
7.04
HB-
GTT5
7.28
HB-
GLI5
7.24
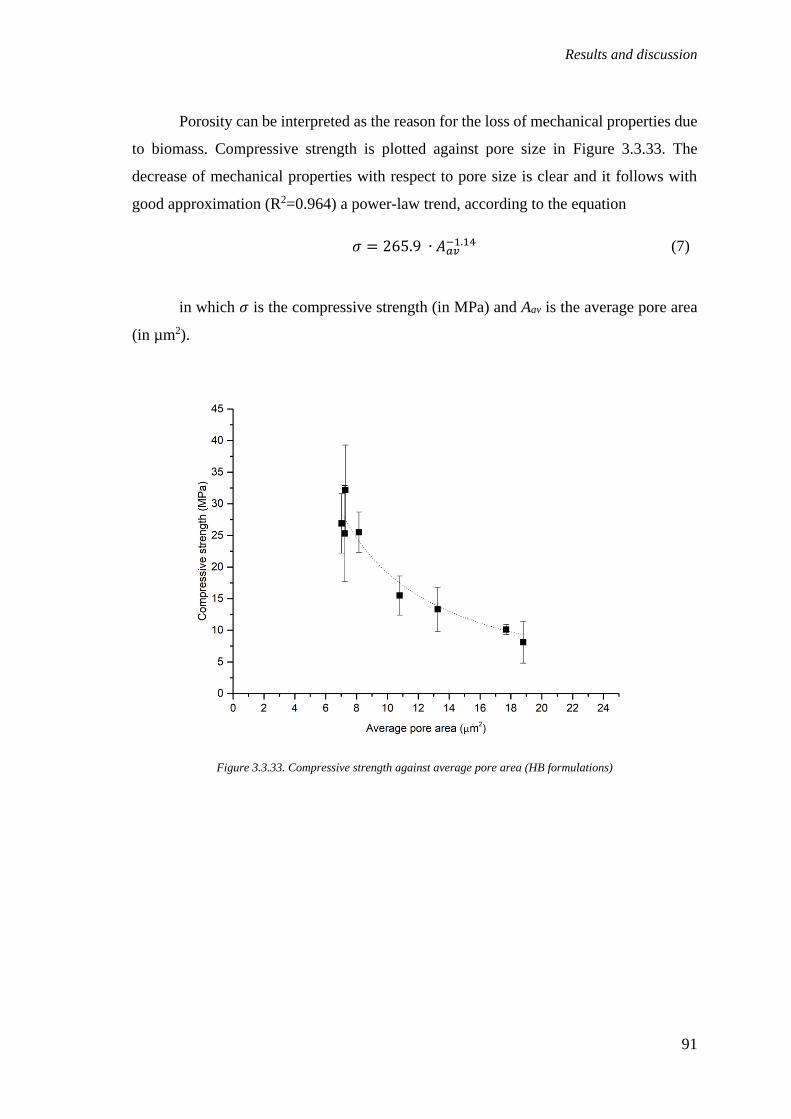
Results and discussion
91
Porosity can be interpreted as the reason for the loss of mechanical properties due
to biomass. Compressive strength is plotted against pore size in Figure 3.3.33. The
decrease of mechanical properties with respect to pore size is clear and it follows with
good approximation (R2=0.964) a power-law trend, according to the equation
𝜎 = 265.9 ∙ 𝐴𝑎𝑣
−1.14 (7)
in which 𝜎 is the compressive strength (in MPa) and Aav is the average pore area
(in µm2).
Figure 3.3.33. Compressive strength against average pore area (HB formulations)

Chapter 3
92
3.3.2. Low-bentonite formulation
3.3.2.1. Rheological behaviour of the pastes
Flow curves of the geopolymer pastes filled with 1, 3 and 5 php (with respect to
the powders) of Spirulina and Tetraselmis are reported in Figure 3.3.34 and Figure 3.3.35,
respectively.
Figure 3.3.34. Flow curves of low-bentonite printable pastes, containing Spirulina
Figure 3.3.35. Flow curves of low-bentonite printable pastes, containing Tetraselmis

Results and discussion
93
The shape of the flow curves is similar, but the curve of unfilled geopolymer (LB-
GEO) is higher than the other ones, except LB-GTT3. This result means that unfilled
geopolymer has higher apparent viscosity than almost all the pastes containing biomass
in the whole shear rate range considered.
The curves were fitted according to Herschel-Bulkley’s model (Equation (1)). The
resulting parameters are reported in Table 3.3.9.
Table 3.3.9. Parameters of Herschel-Bulkley's model for LB formulations, containing biomass
Sample Biomass php (powder) Yield stress (Pa) K (Pa sn) n R2
LB-GEO 0 2864 ± 241 244 ± 212 0.53 ± 0.03 0.984
LB-GSP1 1 1715 ± 93 2750 ± 91 0.31 ± 0.01 0.988
LB-GSP3 3 1027 ± 17 3091 ± 21 0.35 ± 0.00 0.989
LB-GSP5 5 1545 ± 135 1894 ± 135 0.43 ± 0.02 0.980
LB-GTT1 1 2035 ± 114 2078 ± 113 0.61 ± 0.02 0.988
LB-GTT3 3 1311 ± 214 3723 ± 196 0.45 ± 0.01 0.991
LB-GTT5 5 1906 ± 135 2054 ± 124 0.57 ± 0.02 0.991
As already observed for high-bentonite formulation, also in the case of low-
bentonite formulation the fitting with Herschel-Bulkley’s model is good, meaning that
the pastes behave as pseudoplastic fluids with a yield stress. The reduction of yield stress
for the specimens with biomass addition is observed, as well. Differently to HB
formulations, in LB ones the W/S ratio is constant. Therefore, this phenomenon can be
directly related to the action of microalgae, not to the higher amount of water. Both for
Spirulina and Tetraselmis, the reduction in yield stress shows a trend with a minimum at
3 php (Figure 3.3.36).

Chapter 3
94
Figure 3.3.36. Yield stress against biomass amount added to geopolymer pastes with LB formulation
Dynamic tests in stress sweep are performed on the same formulations to assess
the limit of linear behaviour and to look for a crossover point between the storage modulus
(G’) and the loss modulus (G”). From the crossover point, an estimation of the yield stress
can be found, according to the following relation [98]:
𝜏𝑦 = (𝐺′2 + 𝐺′′2)0.5𝛾𝑐𝑟𝑜𝑠𝑠𝑜𝑣𝑒𝑟 (8)
in which 𝜏𝑦 is the yield stress, G’ is the storage modulus, G” is the loss modulus,
and 𝛾𝑐𝑟𝑜𝑠𝑠𝑜𝑣𝑒𝑟 is the strain, evaluated at the crossover point.
Results of dynamic rheological analyses are reported in Figure 3.3.37. The trends
that can be observed are similar for all the formulations tested; in the linear region G’ is
in the order of 106 Pa and G” in the order of 105 Pa.
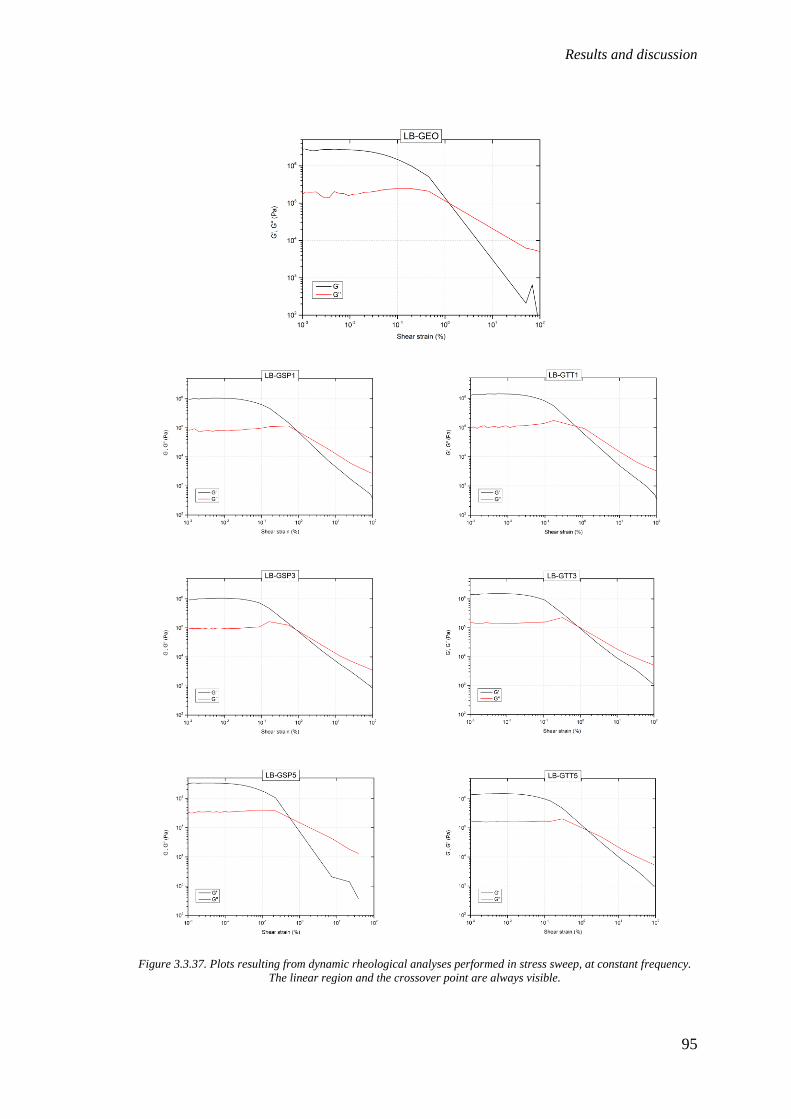
Results and discussion
95
Figure 3.3.37. Plots resulting from dynamic rheological analyses performed in stress sweep, at constant frequency.
The linear region and the crossover point are always visible.

Chapter 3
96
According to Equation (8), the yield stress is estimated for all the formulations
(Table 3.3.10). Although the values are different with respect to the ones found by fitting
the flow curves, the reduction of yield stress with biomass addition, showing a minimum
at concentration of 3 php, is confirmed also with this analysis.
Table 3.3.10. Cross-over points and estimation of yield stress compared to yield stress found from flow curves
Sample Biomass php
(powder)
Crossover Estimated yield
stress from
dynamic tests
(Pa)
Yield stress
from flow
curves (Pa) Shear strain
(%)
G' = G''
(Pa)
LB-GEO 0 1.22 100042 1721 2864
LB-GSP1 1 0.90 78043 997 1715
LB-GSP3 3 0.84 87848 1040 1027
LB-GSP5 5 0.55 216074 1670 1545
LB-GTT1 1 0.68 110012 1052 2035
LB-GTT3 3 0.84 113639 1346 1311
LB-GTT5 5 1.46 81706 1687 1906
One of the most important features of an ideal paste for LDM 3D printing is the
ability to retain the shape after each filament is deposited. From the rheological point of
view, this corresponds to a quick recovery of deformation when no shear stress is applied
[99]. To assess this property, creep and recovery tests were performed on some printable
and non-printable pastes. Figure 3.3.38 reports the creep and recovery curves of
formulations containing Spirulina, from 1 to 5 php, while a comparison between printable
and non-printable formulations is shown in Figure 3.3.39.
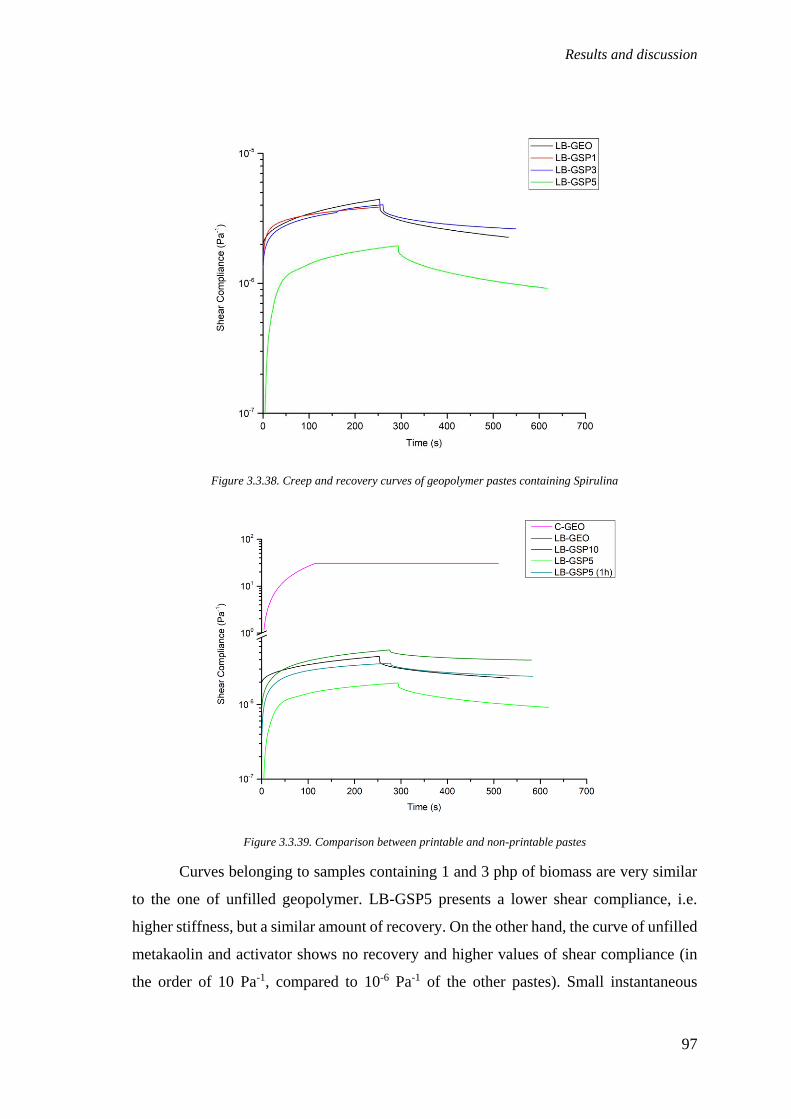
Results and discussion
97
Figure 3.3.38. Creep and recovery curves of geopolymer pastes containing Spirulina
Figure 3.3.39. Comparison between printable and non-printable pastes
Curves belonging to samples containing 1 and 3 php of biomass are very similar
to the one of unfilled geopolymer. LB-GSP5 presents a lower shear compliance, i.e.
higher stiffness, but a similar amount of recovery. On the other hand, the curve of unfilled
metakaolin and activator shows no recovery and higher values of shear compliance (in
the order of 10 Pa-1, compared to 10-6 Pa-1 of the other pastes). Small instantaneous

Chapter 3
98
recovery is shown also by curves of the sample containing 10 php of biomass (LB-
GSP10) and of LB-GSP5 tested 1 hour after the mixing of the components. The
quantification of the amount of recovery is done according to the procedure explained in
§ 2.5.2 (Equations (5a), (5b) and (5c)). Results are reported in Table 3.3.11.
Table 3.3.11. Instantaneous, retarded and total recovery of pastes containing microalgal biomass (Spirulina)
Sample Jmax (Pa-1) Xi (%) Xr (%) Xtot (%) Printable
C-GEO 3.07E+01 0 0 0 No
LB-GEO 2.26E-06 10 53 63 Yes
LB-GSP1 3.87E-06 8 28 36 Yes
LB-GSP3 4.02E-06 10 25 35 Yes
LB-GSP5 1.95E-06 11 42 53 Yes
LB-GSP5 (1h) 3.59E-06 5 28 33 No
LB-GSP10 5.40E-06 5 22 27 No
The results confirm that printability is related to the instantaneous recovery of
deformation, according to literature. Three different cases are identified:
• no recovery, neither instantaneous nor retarded. This behaviour is shown by
C-GEO, the slurry made only of metakaolin and activator, which is a low
viscosity fluid without yield stress. This kind of pastes can be extruded, but
they are not able to keep a defined shape and sustain a structure when printed;
• printable pastes all show an instantaneous recovery around 10% (the lowest
value is the one of LB-GSP1, 8%), which are the higher values measured in
all tests performed;
• lower instantaneous recovery (5%) is shown by the formulation with higher
amount of biomass (LB-GSP10) and by the paste containing 5 php of Spirulina
tested 1 hour after the mixing. These mixtures are less cohesive because water
is absorbed by the high amount of biomass (in the former case) or has already
evaporated and/or taken part in the hardening process (in the latter case). As a
result, during the printing process the extruded filament, being less capable to
recover the deformation due to extrusion, breaks, creating a discontinuous
layer. This phenomenon is known in literature as “tearing” [100], [101].
Retarded recovery is meaningless as far as printability is concerned.
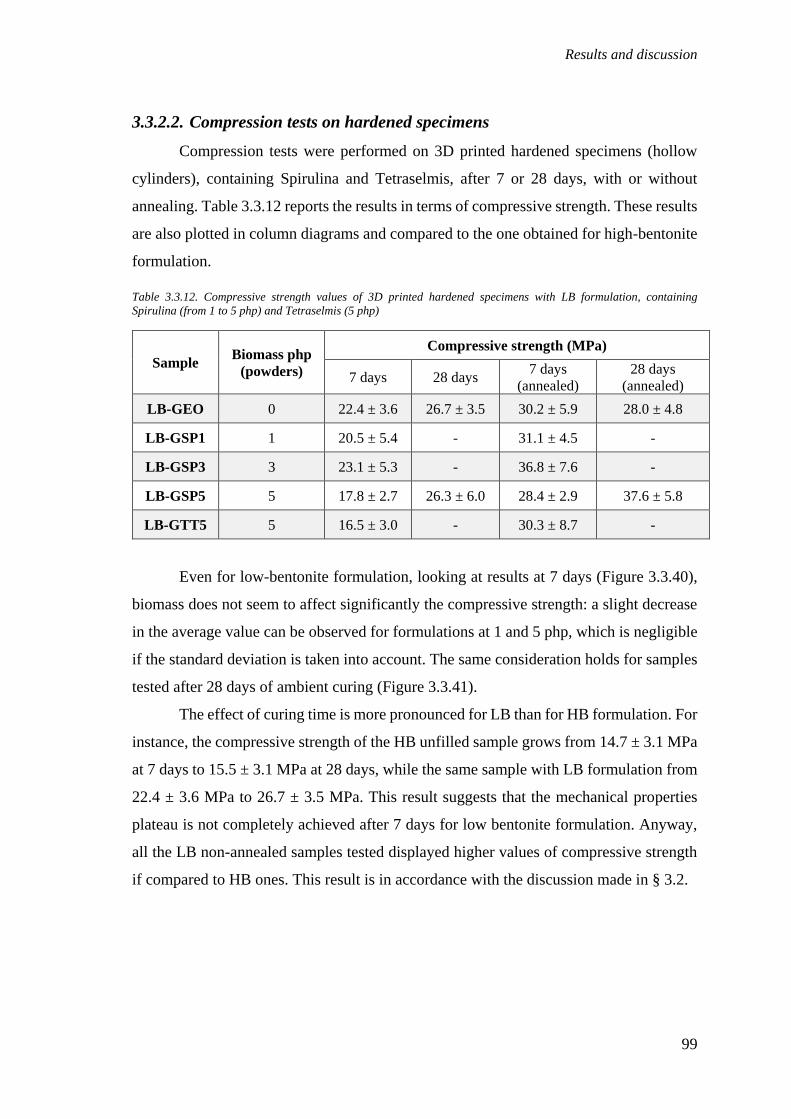
Results and discussion
99
3.3.2.2. Compression tests on hardened specimens
Compression tests were performed on 3D printed hardened specimens (hollow
cylinders), containing Spirulina and Tetraselmis, after 7 or 28 days, with or without
annealing. Table 3.3.12 reports the results in terms of compressive strength. These results
are also plotted in column diagrams and compared to the one obtained for high-bentonite
formulation.
Table 3.3.12. Compressive strength values of 3D printed hardened specimens with LB formulation, containing
Spirulina (from 1 to 5 php) and Tetraselmis (5 php)
Sample Biomass php
(powders)
Compressive strength (MPa)
7 days 28 days 7 days
(annealed)
28 days
(annealed)
LB-GEO 0 22.4 ± 3.6 26.7 ± 3.5 30.2 ± 5.9 28.0 ± 4.8
LB-GSP1 1 20.5 ± 5.4 - 31.1 ± 4.5 -
LB-GSP3 3 23.1 ± 5.3 - 36.8 ± 7.6 -
LB-GSP5 5 17.8 ± 2.7 26.3 ± 6.0 28.4 ± 2.9 37.6 ± 5.8
LB-GTT5 5 16.5 ± 3.0 - 30.3 ± 8.7 -
Even for low-bentonite formulation, looking at results at 7 days (Figure 3.3.40),
biomass does not seem to affect significantly the compressive strength: a slight decrease
in the average value can be observed for formulations at 1 and 5 php, which is negligible
if the standard deviation is taken into account. The same consideration holds for samples
tested after 28 days of ambient curing (Figure 3.3.41).
The effect of curing time is more pronounced for LB than for HB formulation. For
instance, the compressive strength of the HB unfilled sample grows from 14.7 ± 3.1 MPa
at 7 days to 15.5 ± 3.1 MPa at 28 days, while the same sample with LB formulation from
22.4 ± 3.6 MPa to 26.7 ± 3.5 MPa. This result suggests that the mechanical properties
plateau is not completely achieved after 7 days for low bentonite formulation. Anyway,
all the LB non-annealed samples tested displayed higher values of compressive strength
if compared to HB ones. This result is in accordance with the discussion made in § 3.2.
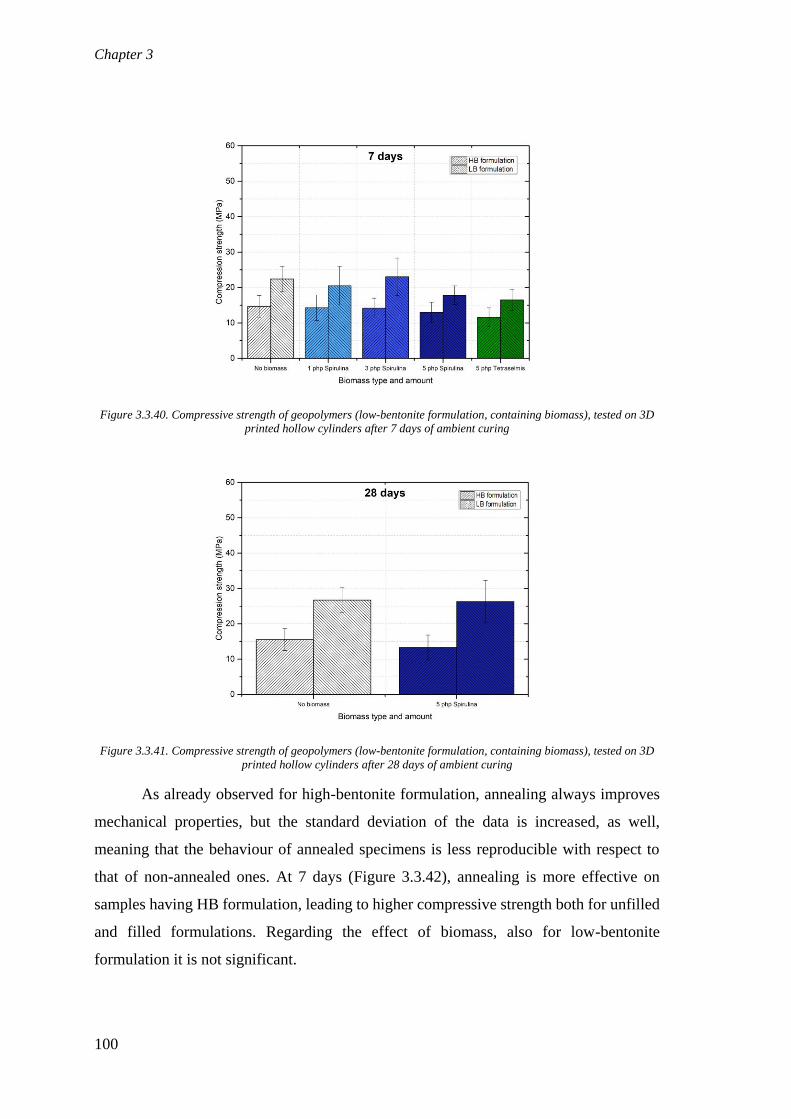
Chapter 3
100
Figure 3.3.40. Compressive strength of geopolymers (low-bentonite formulation, containing biomass), tested on 3D
printed hollow cylinders after 7 days of ambient curing
Figure 3.3.41. Compressive strength of geopolymers (low-bentonite formulation, containing biomass), tested on 3D
printed hollow cylinders after 28 days of ambient curing
As already observed for high-bentonite formulation, annealing always improves
mechanical properties, but the standard deviation of the data is increased, as well,
meaning that the behaviour of annealed specimens is less reproducible with respect to
that of non-annealed ones. At 7 days (Figure 3.3.42), annealing is more effective on
samples having HB formulation, leading to higher compressive strength both for unfilled
and filled formulations. Regarding the effect of biomass, also for low-bentonite
formulation it is not significant.

Results and discussion
101
Low-bentonite samples annealed after 28 days of ambient curing (Figure 3.3.43).
show higher compressive strength values than the high-bentonite ones, in accordance with
the results obtained for non-annealed geopolymer. In general, considering only LB
formulation, both at 7 and at 28 days, annealing leads to improvements of mechanical
properties, higher for samples filled with biomass than for the unfilled one. However,
only in the case of LB-GSP5 annealed at 28 days the compressive strength is actually
higher with respect to the unfilled samples (37.6 ± 5.8 MPa versus 28.0 ± 4.8 MPa).
Figure 3.3.42. Compressive strength of geopolymers (low-bentonite formulation, containing biomass), tested on 3D
printed hollow cylinders after 7 days of ambient curing and 4 hours of annealing at 800°C
Figure 3.3.43. Compressive strength of geopolymers (low-bentonite formulation, containing biomass), tested on 3D
printed hollow cylinders after 28 days of ambient curing and 4 hours of annealing at 800°C

Chapter 3
102
Summarizing, if thermal treatment is not performed, higher values of compressive
strength are obtained with low-bentonite formulation, which are all comprised in the
interval of normal strength concrete applications (16 MPa – 45 MPa) defined by the
standard UNI-EN 206-2013 [97]. On the contrary, annealing (at 7 days) leads to better
results on high-bentonite formulation, even higher than 45 MPa.
In addition to the results discussed before, a comparison with casted samples has
been carried out also for LB formulation (Table 3.3.13).
Table 3.3.13. Compressive strength of geopolymers (LB, containing biomass) tested on different kinds of samples at 28
days
Sample
Biomass
php
(powder)
Compressive strength at 28 days
(MPa)
Compressive strength at 28 days
(annealed samples) (MPa)
3D
printed
Casted
cube
Casted
cylinder
3D
printed Casted cube
Casted
cylinder
LB-GEO 0 26.7 ± 3.5 23.5 ± 3.6 19.4 ± 4.2 28.0 ± 4.8 31.6 ± 4.5 19.7 ± 5.5
LB-GSP5 5 26.3 ± 6.0 15.9 ± 2.6 18.2 ± 5.0 37.6 ± 5.8 19.2 ± 5.0 † 20.8 ± 4.4 †
† Samples cracked during thermal treatment.
Regarding non-thermally treated samples, 3D printed hollow cylinders are more
resistant than casted samples, in accordance with the results already discussed in § 3.3.1.3.
Considering annealed samples, a discussion for formulations containing biomass
cannot be made in a reliable way, since both casted cubes and cylinders suffered cracking
during thermal treatment, as described in § 3.3.1.3 for HB formulation containing
microalgal biomass. So, just examining the unfilled samples (LB-GEO), similar values
of compressive stress are attained for 3D printed hollow cylinders and casted cubes, while
casted cylinders displayed lower strength. This different behaviour can be referred to a
different homogeneity of the thermal treatment, depending on the geometry.
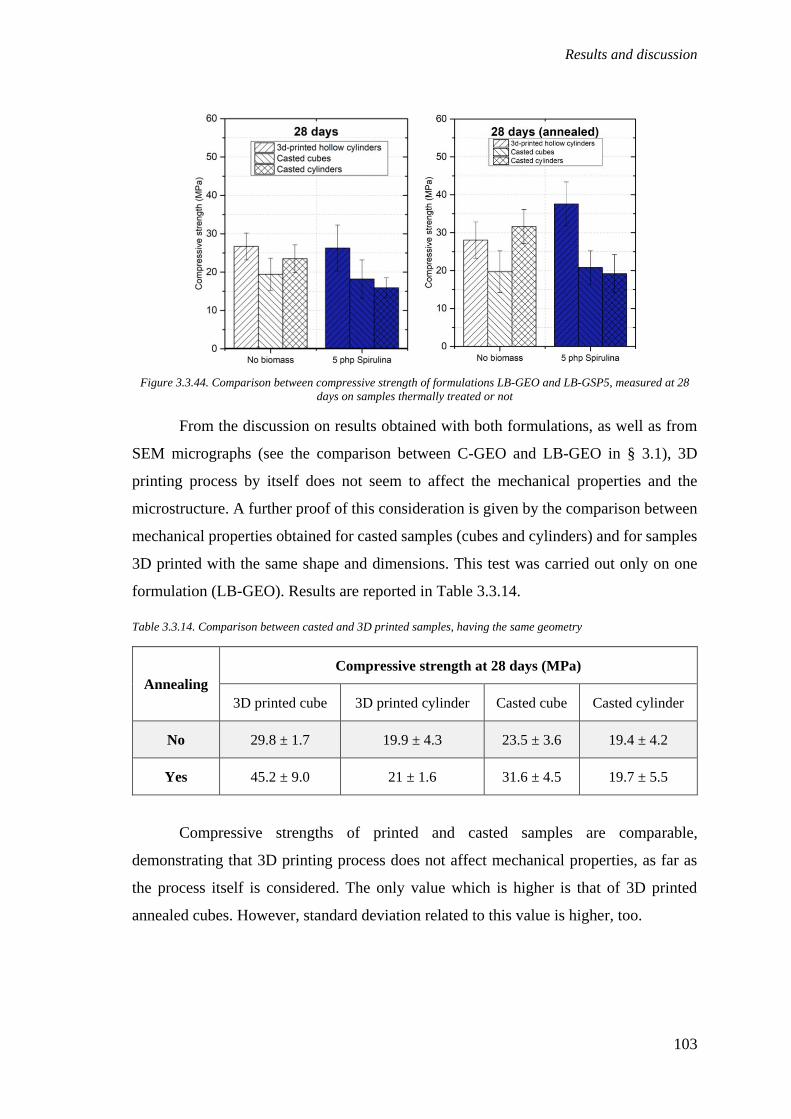
Results and discussion
103
Figure 3.3.44. Comparison between compressive strength of formulations LB-GEO and LB-GSP5, measured at 28
days on samples thermally treated or not
From the discussion on results obtained with both formulations, as well as from
SEM micrographs (see the comparison between C-GEO and LB-GEO in § 3.1), 3D
printing process by itself does not seem to affect the mechanical properties and the
microstructure. A further proof of this consideration is given by the comparison between
mechanical properties obtained for casted samples (cubes and cylinders) and for samples
3D printed with the same shape and dimensions. This test was carried out only on one
formulation (LB-GEO). Results are reported in Table 3.3.14.
Table 3.3.14. Comparison between casted and 3D printed samples, having the same geometry
Annealing
Compressive strength at 28 days (MPa)
3D printed cube 3D printed cylinder Casted cube Casted cylinder
No 29.8 ± 1.7 19.9 ± 4.3 23.5 ± 3.6 19.4 ± 4.2
Yes 45.2 ± 9.0 21 ± 1.6 31.6 ± 4.5 19.7 ± 5.5
Compressive strengths of printed and casted samples are comparable,
demonstrating that 3D printing process does not affect mechanical properties, as far as
the process itself is considered. The only value which is higher is that of 3D printed
annealed cubes. However, standard deviation related to this value is higher, too.
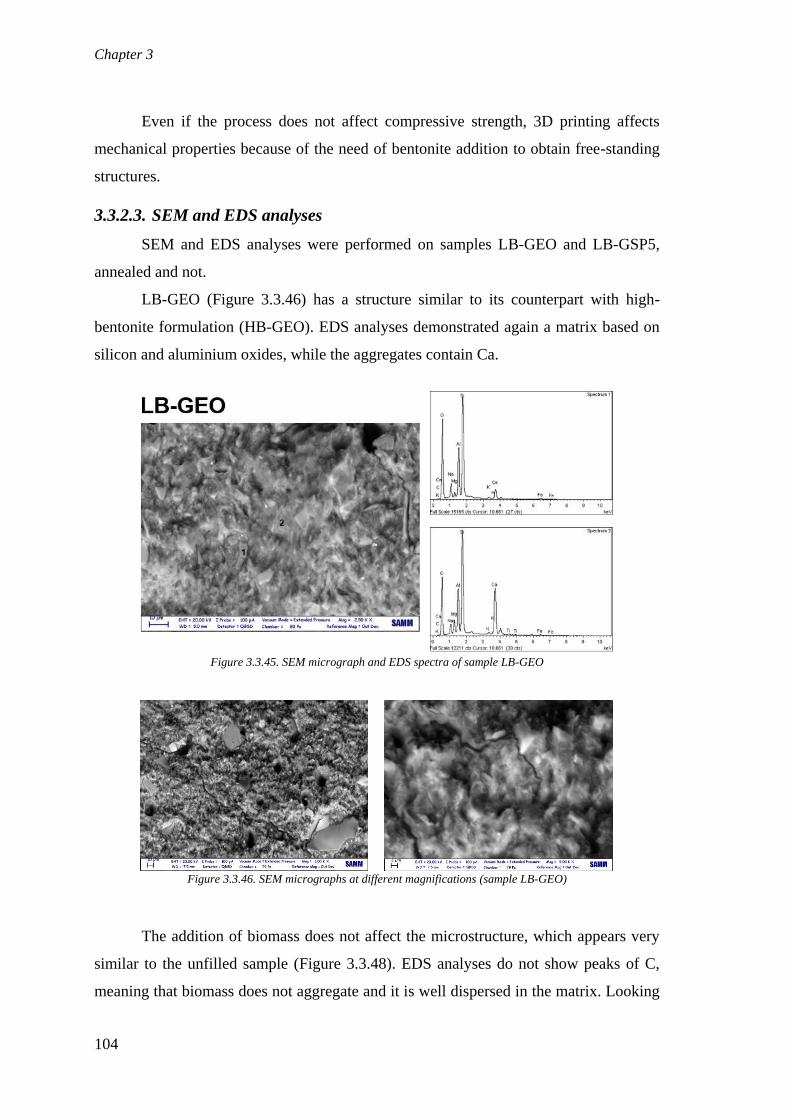
Chapter 3
104
Even if the process does not affect compressive strength, 3D printing affects
mechanical properties because of the need of bentonite addition to obtain free-standing
structures.
3.3.2.3. SEM and EDS analyses
SEM and EDS analyses were performed on samples LB-GEO and LB-GSP5,
annealed and not.
LB-GEO (Figure 3.3.46) has a structure similar to its counterpart with high-
bentonite formulation (HB-GEO). EDS analyses demonstrated again a matrix based on
silicon and aluminium oxides, while the aggregates contain Ca.
Figure 3.3.45. SEM micrograph and EDS spectra of sample LB-GEO
Figure 3.3.46. SEM micrographs at different magnifications (sample LB-GEO)
The addition of biomass does not affect the microstructure, which appears very
similar to the unfilled sample (Figure 3.3.48). EDS analyses do not show peaks of C,
meaning that biomass does not aggregate and it is well dispersed in the matrix. Looking
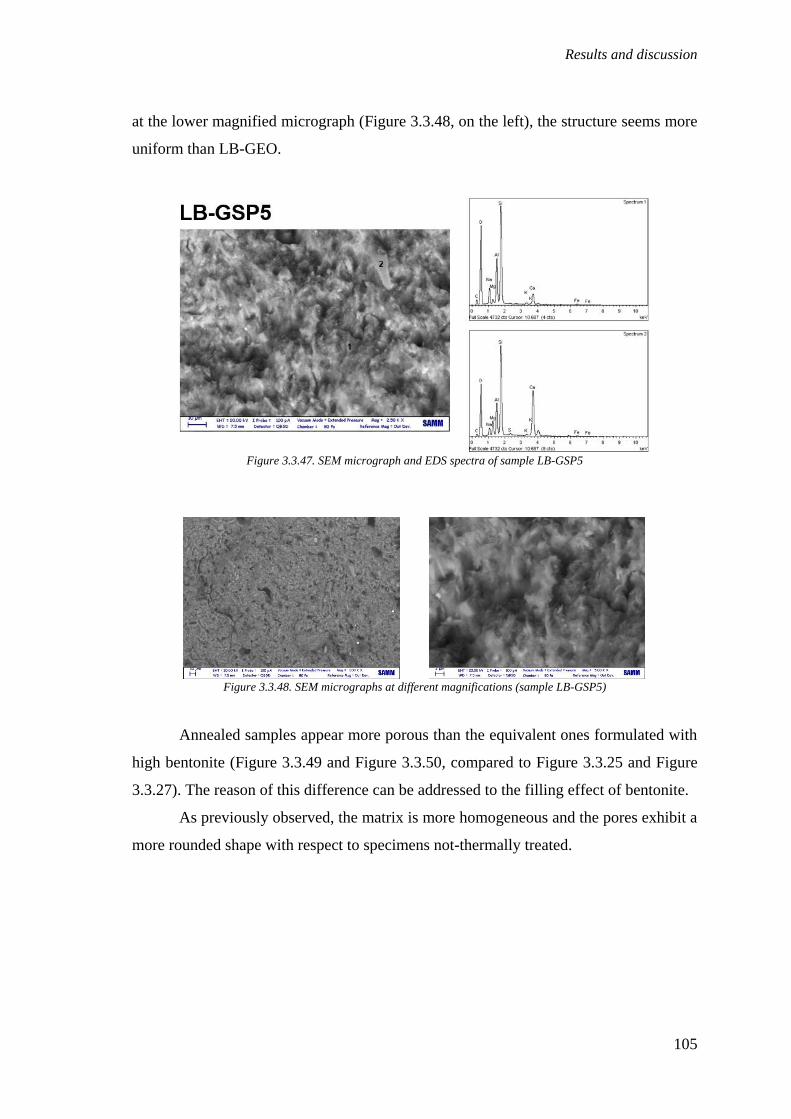
Results and discussion
105
at the lower magnified micrograph (Figure 3.3.48, on the left), the structure seems more
uniform than LB-GEO.
Figure 3.3.47. SEM micrograph and EDS spectra of sample LB-GSP5
Figure 3.3.48. SEM micrographs at different magnifications (sample LB-GSP5)
Annealed samples appear more porous than the equivalent ones formulated with
high bentonite (Figure 3.3.49 and Figure 3.3.50, compared to Figure 3.3.25 and Figure
3.3.27). The reason of this difference can be addressed to the filling effect of bentonite.
As previously observed, the matrix is more homogeneous and the pores exhibit a
more rounded shape with respect to specimens not-thermally treated.
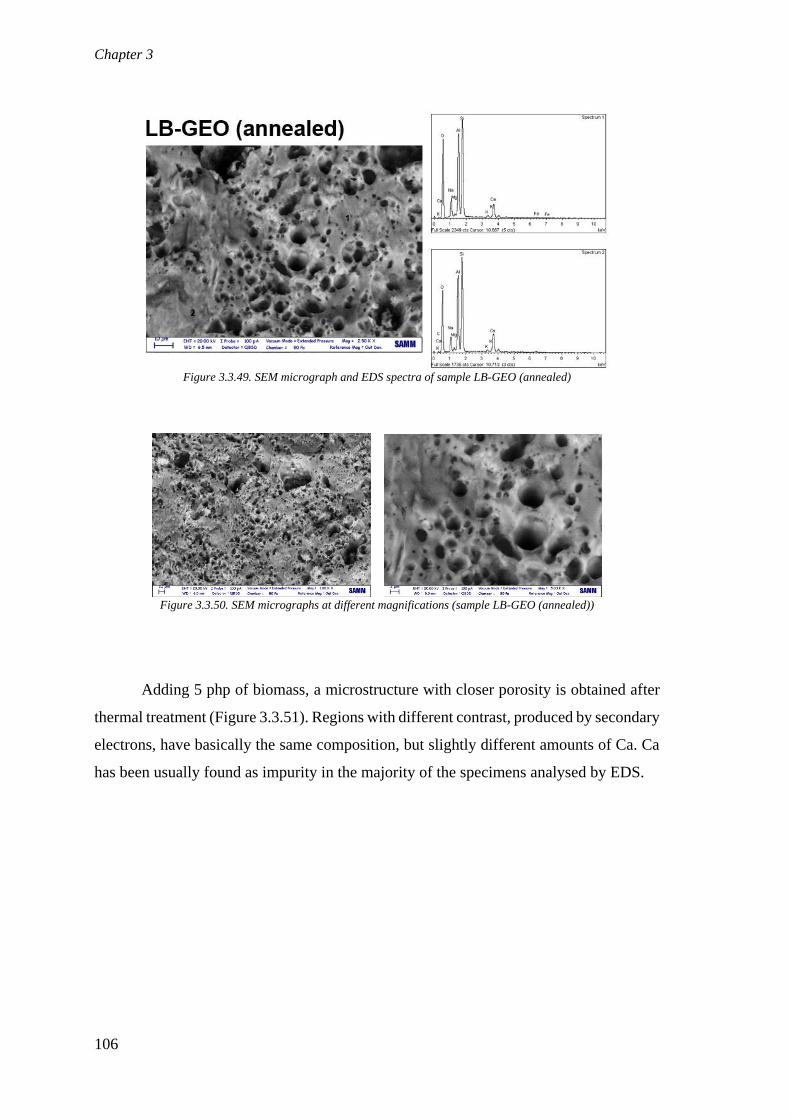
Chapter 3
106
Figure 3.3.49. SEM micrograph and EDS spectra of sample LB-GEO (annealed)
Figure 3.3.50. SEM micrographs at different magnifications (sample LB-GEO (annealed))
Adding 5 php of biomass, a microstructure with closer porosity is obtained after
thermal treatment (Figure 3.3.51). Regions with different contrast, produced by secondary
electrons, have basically the same composition, but slightly different amounts of Ca. Ca
has been usually found as impurity in the majority of the specimens analysed by EDS.

Results and discussion
107
Figure 3.3.51. SEM micrograph and EDS spectra of sample LB-GSP5 (annealed)
Figure 3.3.52. SEM micrographs at different magnifications (sample LB-GSP5(annealed))
The average pore area was evaluated by using the software ImageJ, following the
procedure explained in § 2.2 and already applied for HB samples. Results are reported in
Table 3.3.15. Despite the higher mechanical properties measured for LB samples,
porosity values are comparable (in the case of non-annealed specimens) or higher (for
annealed ones) with respect to HB. Therefore, the improvement in mechanical properties
at 28 days achieved with LB formulation can be addressed to the higher resistance of
metakaolin geopolymer matrix compared to bentonite, rather than to larger pore size.

Chapter 3
108
Table 3.3.15. ImageJ analyses of LB samples
Sample Original image Processed image
Average
pore
size
(µm2)
LB-GEO
10.7
LB-GSP5
10.3
LB-GEO
(annealed)
13.1
LB-GSP5
(annealed)
10.8
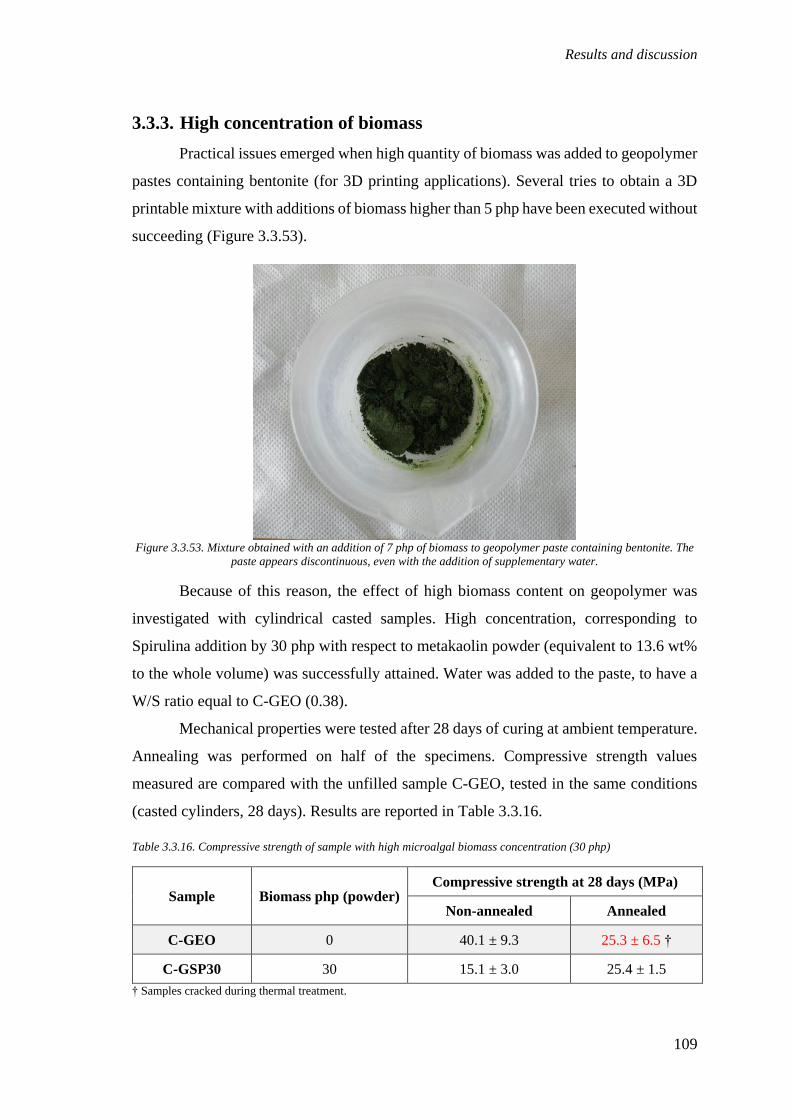
Results and discussion
109
3.3.3. High concentration of biomass
Practical issues emerged when high quantity of biomass was added to geopolymer
pastes containing bentonite (for 3D printing applications). Several tries to obtain a 3D
printable mixture with additions of biomass higher than 5 php have been executed without
succeeding (Figure 3.3.53).
Figure 3.3.53. Mixture obtained with an addition of 7 php of biomass to geopolymer paste containing bentonite. The
paste appears discontinuous, even with the addition of supplementary water.
Because of this reason, the effect of high biomass content on geopolymer was
investigated with cylindrical casted samples. High concentration, corresponding to
Spirulina addition by 30 php with respect to metakaolin powder (equivalent to 13.6 wt%
to the whole volume) was successfully attained. Water was added to the paste, to have a
W/S ratio equal to C-GEO (0.38).
Mechanical properties were tested after 28 days of curing at ambient temperature.
Annealing was performed on half of the specimens. Compressive strength values
measured are compared with the unfilled sample C-GEO, tested in the same conditions
(casted cylinders, 28 days). Results are reported in Table 3.3.16.
Table 3.3.16. Compressive strength of sample with high microalgal biomass concentration (30 php)
Sample Biomass php (powder) Compressive strength at 28 days (MPa)
Non-annealed Annealed
C-GEO 0 40.1 ± 9.3 25.3 ± 6.5 †
C-GSP30 30 15.1 ± 3.0 25.4 ± 1.5
† Samples cracked during thermal treatment.

Chapter 3
110
Considering non-annealed samples, the addition of high amount of biomass is
detrimental as far as mechanical properties are considered. On the other hand,
compressive strengths of annealed samples are comparable. As already discussed in §
3.2.2, C-GEO suffered cracking during annealing. The sample containing Spirulina at 30
php concentration did not suffered from cracking, achieving an increase of mechanical
properties upon thermal treatment.
The reduction of mechanical properties of non-annealed samples can be related to
the high amount and large size of pores introduced by microalgal biomass at these
concentrations. SEM micrographs, reported in the following pictures, show that very high
porosity is introduced both in annealed and non-annealed samples.
Figure 3.3.54. SEM micrograph and EDS spectra of sample C-GSP30
Figure 3.3.55. SEM micrograph and EDS spectra of sample C-GSP30 (annealed)

Results and discussion
111
Average pore area, evaluated by ImageJ software, is 20.07 µm2 for the non-
annealed sample and 14.13 µm2 for the annealed one. So, as already observed for other
formulations containing biomass, annealing reduces porosity, improving the mechanical
properties. Porosity of these samples is higher, compared both to C-GEO and to the other
formulations for 3D printing.
EDS spectra (Figure 3.3.54 and Figure 3.3.55) show low carbon content, despite
the noticeable quantity of biomass. This result confirms that microalgal biomass is well
mixed in the geopolymer matrix and no aggregates are formed because of it; the main
effect of biomass is the introduction of pores.
The increased porosity is also evidenced by the reduction of density. Values of
density, evaluated dividing measured values of mass and volume of at least six specimens,
are reported in Table 3.3.17.
Table 3.3.17. Density of samples C-GEO and C-GSP30
Sample Density of non-annealed
samples (g/cm3)
Density of annealed
samples (g/cm3)
C-GEO 1.73 ± 0.04 1.78 ± 0.07
C-GSP30 1.41 ± 0.06 1.44 ± 0.01
Moreover, from density data, it can be observed that thermal treatment does not
affect density. During annealing, samples show mass reduction, due to complete drying,
along with volume reduction. In most cases, presented in the previous paragraphs and for
the sample containing high concentration of biomass, annealing lead to a rearrangement
of the internal structure and of porosity interconnection, which improved mechanical
properties. For sample C-GEO and for some casted samples containing bentonite and
biomass, the structural rearrangement of annealing was not so efficient and cracking
occurred.

Chapter 3
112
3.4. Feasibility study on the use of recycled glass fibres as filler
In this chapter, the feasibility of the use of glass fibres as fillers (or reinforcing materials) in 3D
printed metakaolin geopolymers is studied. Since the aim of the European project FiberEUse is
the valorisation of recycled glass fibres, the first try in this preliminary study is to embed as much
recycled material as possible.
Many formulations have been prepared both for casting and 3D printing. Results from
rheological, mechanical and microstructural characterizations are reported in the following
paragraphs.
3.4.1. Rheological behaviour of the pastes
Rheology of some formulations containing fibres was studied. Pastes with similar
(the same if the usual weighing is considered, see § 2.2) amount of red recycled (for
casting, C-GRR26, and for 3D printing, LB-GRR20) and virgin fibres were compared
with the slurry made by metakaolin and activator (C-GEO) and with the unfilled
geopolymer formulation for 3D printing (LB-GEO). Flow curves are reported in Figure
3.4.1a and viscosity curves of the formulations for casting in Figure 3.4.1b.
Figure 3.4.1. Flow curves (a) and viscosity curves (b) of pastes containing fibres
The addition of fibres increases the viscosity of the fluid, but it is not enough to
have a yield stress, as can be observed from flow and viscosity curves of casted samples.
Yield stress, which is necessary to obtain self-sustaining 3D printed structures, is present
only in mixtures containing bentonite.
Flow curves of pastes showing yield stress (LB-GEO and LB-GRR26) are fitted
according to Herschel-Bulkley’s model (Equation (1)). The behaviour of the other
formulations is modelled according to the power law model (Equation (2) and (3)) in the
linear range of the double-logarithmic plot.
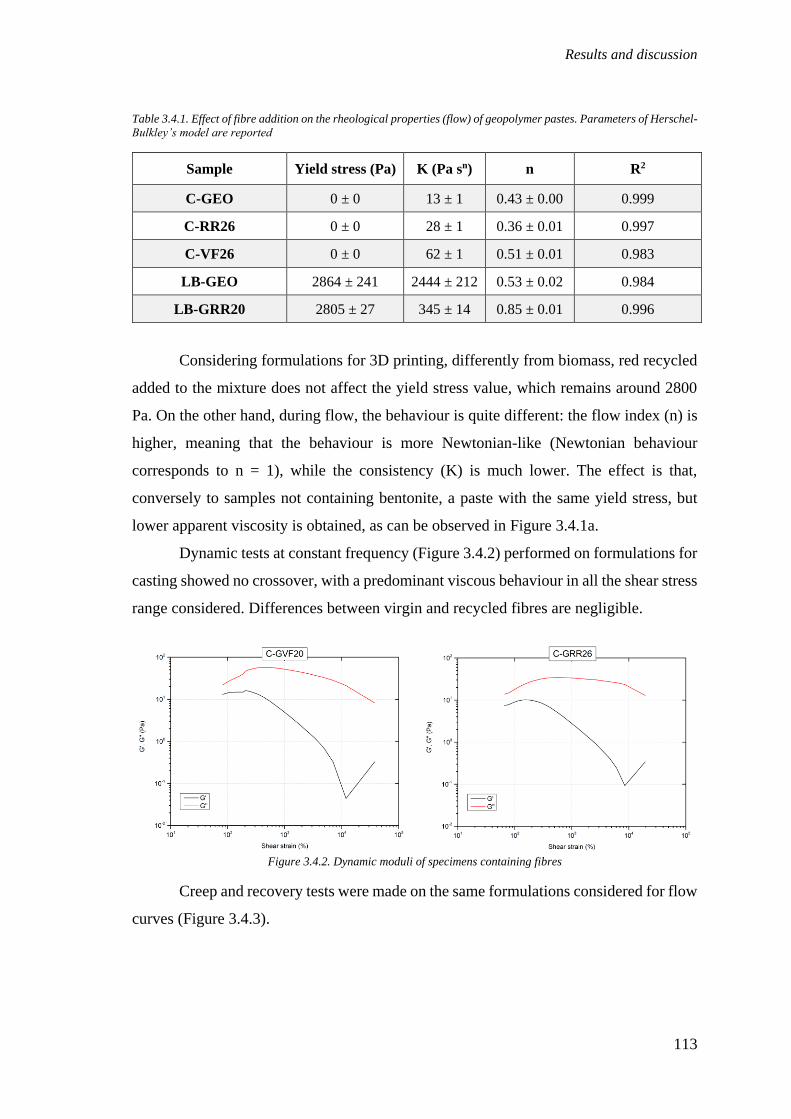
Results and discussion
113
Table 3.4.1. Effect of fibre addition on the rheological properties (flow) of geopolymer pastes. Parameters of Herschel-
Bulkley’s model are reported
Sample Yield stress (Pa) K (Pa sn) n R2
C-GEO 0 ± 0 13 ± 1 0.43 ± 0.00 0.999
C-RR26 0 ± 0 28 ± 1 0.36 ± 0.01 0.997
C-VF26 0 ± 0 62 ± 1 0.51 ± 0.01 0.983
LB-GEO 2864 ± 241 2444 ± 212 0.53 ± 0.02 0.984
LB-GRR20 2805 ± 27 345 ± 14 0.85 ± 0.01 0.996
Considering formulations for 3D printing, differently from biomass, red recycled
added to the mixture does not affect the yield stress value, which remains around 2800
Pa. On the other hand, during flow, the behaviour is quite different: the flow index (n) is
higher, meaning that the behaviour is more Newtonian-like (Newtonian behaviour
corresponds to n = 1), while the consistency (K) is much lower. The effect is that,
conversely to samples not containing bentonite, a paste with the same yield stress, but
lower apparent viscosity is obtained, as can be observed in Figure 3.4.1a.
Dynamic tests at constant frequency (Figure 3.4.2) performed on formulations for
casting showed no crossover, with a predominant viscous behaviour in all the shear stress
range considered. Differences between virgin and recycled fibres are negligible.
Figure 3.4.2. Dynamic moduli of specimens containing fibres
Creep and recovery tests were made on the same formulations considered for flow
curves (Figure 3.4.3).

Chapter 3
114
Figure 3.4.3. Creep and recovery of geopolymer pastes containing fibres
Formulations for casting present shear compliance values in the order of 10 Pa-1;
and the addition of fibres does not have significant effects. All these samples do not show
any recovery. On the contrary, the formulation for 3D printing (LB-GRR20) displays
lower shear compliance (in the order of 10-6 Pa-1), and deformation recovery
(instantaneous and retarded), in accordance with the considerations made for creep and
recovery tests on formulations containing biomass (§ 3.3.2.1). In particular, the
instantaneous recovery of the sample containing recycled fibres is equal to the unfilled
one and in the same range of the other printable formulations analysed in this work. Table
3.4.2 reports the different contributions to recovery, computed following Equations (5a),
(5b) and (5c).
Table 3.4.2. Instantaneous, retarded and total recovery of pastes containing fibres
Sample Jmax (Pa-1) Xi (%) Xr (%) Xtot (%) Printable
C-GEO 3.07E+01 0 0 0 No
C-GVF26 5.36E+01 0 0 0 No
C-GRR26 3.13E+01 0 0 0 No
LB-GEO 2.26E-06 10 53 63 Yes
LB-GRR20 5.48E-06 10 19 29 Yes

Results and discussion
115
3.4.2. Compression tests on hardened specimens
Compression tests are carried out on all formulations containing fibres, 3D printed
and prepared by casting. The maximum amount of white recycled is lower than virgin
fibres and red recycled, because problems in miscibility with geopolymer paste are
evident at concentrations higher than around 10 php.
Mixtures for 3D printing are based on low-bentonite formulation and hollow
cylinder specimens prepared are tested after 7 days of ambient curing. Compressive
strength values are reported in Table 3.4.3.
Table 3.4.3. Compressive strength values of 3D printed hardened specimens containing recycled glass fibres, tested
after 7 days of ambient curing
Sample Fibre php (powder) Compressive strength at 7 days (MPa)
LB-GEO 0 22.4 ± 3.6
LB-GRR5 5 25.8 ± 3.3
LB-GRR10 10 19.6 ± 1.1
LB-GRR20 20 23.4 ± 3.6
LB-GRR30 30 16.3 ± 1.3
LB-GWR5 5 19.5 ± 3.7
LB-GWR10 10 25.3 ± 5.5
The addition of fibres at these concentrations does not improve mechanical
properties (Figure 3.4.4). The best results, which are obtained at 5 php for red recycled
and at 10 php for white recycled, are just slight increase of compressive strength,
negligible taking into account the error bars. On the other hand, red recycled at 30 php
significantly lowers mechanical properties. This result suggests that the interaction
between recycled fibres and the matrix is not good enough to promote a reinforcing effect.
Anyway, up to 20 php of red recycled and 10 php of white recycled, recycled fibres can
be effectively used as a filler for 3D printing pastes.

Chapter 3
116
Figure 3.4.4. Compressive strength of geopolymers (low-bentonite formulation, containing recycled glass fibres),
tested on 3D printed hollow cylinders after 7 days of ambient curing
Higher concentrations of recycled fibres and a comparison with virgin glass fibres
are investigated with casted samples. Results of compression tests carried out on cylinder
casted samples after 28 days of ambient curing are reported in Table 3.4.4 and plotted in
Figure 3.4.5.
Table 3.4.4. Compressive strength values of cylindrical casted hardened specimens containing recycled glass fibres,
tested after 28 days of ambient curing
Sample Fibre php (powder) Compressive strength at 28 days (MPa)
C-GEO 0 40.1 ± 9.3
C-GRR13 13 26.7 ± 2.4
C-GRR19 19 38.3 ± 4.3
C-GRR26 26 25.6 ± 7.6
C-GRR39 39 24.6 ± 5.4
C-GRR57 57 24.9 ± 3.9
C-GWR13 13 28.9 ± 6.8
C-GVF13 13 40.1 ± 9.4
C-GVF26 26 26.3 ± 5.6
C-GVF39 39 32.4 ± 9.8
Analysing the values obtained, the same considerations made for 3D printed
samples hold: in general, the addition of fibres does not improve nor reduce the
mechanical properties. Considering red recycled, which has been investigated in more
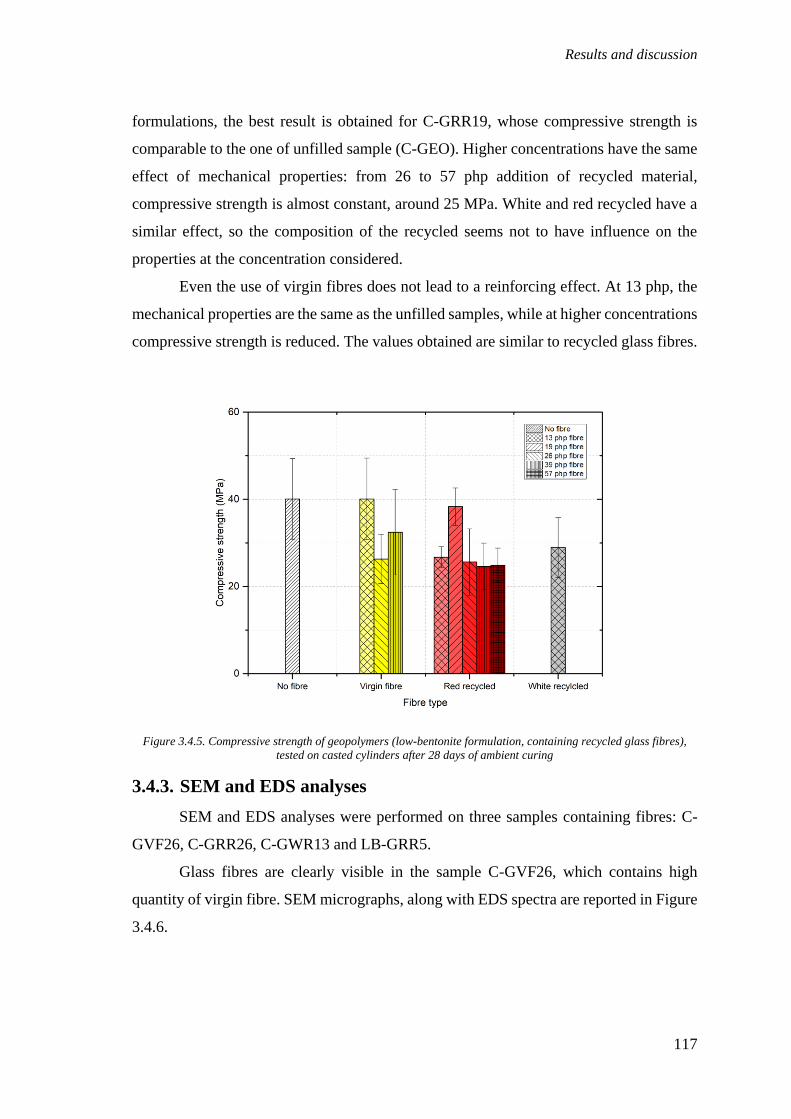
Results and discussion
117
formulations, the best result is obtained for C-GRR19, whose compressive strength is
comparable to the one of unfilled sample (C-GEO). Higher concentrations have the same
effect of mechanical properties: from 26 to 57 php addition of recycled material,
compressive strength is almost constant, around 25 MPa. White and red recycled have a
similar effect, so the composition of the recycled seems not to have influence on the
properties at the concentration considered.
Even the use of virgin fibres does not lead to a reinforcing effect. At 13 php, the
mechanical properties are the same as the unfilled samples, while at higher concentrations
compressive strength is reduced. The values obtained are similar to recycled glass fibres.
Figure 3.4.5. Compressive strength of geopolymers (low-bentonite formulation, containing recycled glass fibres),
tested on casted cylinders after 28 days of ambient curing
3.4.3. SEM and EDS analyses
SEM and EDS analyses were performed on three samples containing fibres: C-
GVF26, C-GRR26, C-GWR13 and LB-GRR5.
Glass fibres are clearly visible in the sample C-GVF26, which contains high
quantity of virgin fibre. SEM micrographs, along with EDS spectra are reported in Figure
3.4.6.

Chapter 3
118
Figure 3.4.6. SEM micrograph and EDS spectra of sample C-GVF26
Figure 3.4.7. SEM micrographs of C-GVF26 at different magnifications
Because of the high content of silicon and aluminium oxides both in the matrix
and in fibres, EDS spectra are very similar. Observing different magnification levels and
spots (Figure 3.4.7), the distribution of fibres appears homogeneous: neither preferential
orientations, nor clustering are visible.
Fibres are not visible in samples containing recycled glass fibres. Casted samples
containing high concentration of additive display noticeable cracks, which are probably
due to a poor interaction between recycled material and the geopolymer matrix (Figure
3.4.8, Figure 3.4.9 and Figure 3.4.10). The visible aggregates cannot be directly related
to recycled glass fibres, since the usual composition based on Ca is found. No great
differences can be appreciated between samples containing red and white recycled. Fe
impurities are detected in very low concentrations by EDS (Spectrum 1 of sample C-
GRR26).

Results and discussion
119
Figure 3.4.8. SEM micrograph and EDS spectra of sample C-GRR26; a large crack can be noticed near the
aggregate
Figure 3.4.9. SEM micrograph and EDS spectra of sample C-GWR13
Figure 3.4.10. Magnification of sample C-GWR13, showing a crack

Chapter 3
120
The formulation prepared for 3D printing, containing bentonite along with red
recycled glass fibre additive, has a more uniform appearance at SEM (Figure 3.4.11),
similar to other 3D printed samples. Despite the higher homogeneity, the poor interaction
between recycled glass fibres and the matrix is demonstrated by the presence of cracks
also in this sample at lower additive concentration (Figure 3.4.12). Therefore, the poor
interaction between fibres and matrix can be addressed as the cause of the missed
improvement in mechanical properties. Lowering even more the quantity of glass fibres,
approaching values present in literature (no more than 5 wt%) may be the key to obtain
the desired increase of compressive strength [87].
EDS spectra (Figure 3.4.11) does not show any relevant result for this sample.
Figure 3.4.11. SEM micrograph and EDS spectra of sample LB-GRR5
Figure 3.4.12. SEM micrographs of sample LB-GRR5 at different magnifications

Results and discussion
121
3.5. Scale-up
The possibility to 3D print objects made by geopolymer in large scale is very interesting in view
of the potential applications of this technology. A scale-up with a larger 3D printer has been
tried.
The preparatory analyses on the formulation used and the results of the process are reported in
the following paragraphs.
3.5.1. Materials for scale-up
The formulation chosen for the scale-up is based on low-bentonite approach, with
the addition of 5 php of Spirulina; this formulation is selected since a large volume of
biomass can be implied, with an acceptable reduction of mechanical properties. Bentonite
B3 is used, because of its lower cost compared to B1 and B2. Referring to the studies
reported in § 3.2.3, formulations containing B3 show lower yield stress than the ones with
B1 or B2. Therefore, no water is added to the mixture, which is reported in Table 3.5.1.
Table 3.5.1. Composition of the formulation selected for the scale-up
Metakaolin (wt%) Bentonite (wt%) Activator (wt%) Spirulina (wt%)
45.9 14.6 36.6 2.9
Rheology, mechanical properties and microstructure are studied for this
formulation. Flow curves (Figure 3.5.1) are fitted with Herschel-Bulkley’s model
(Equation (1)); flow parameters are comparable to that of other formulations containing
biomass, studied in the previous paragraph, using bentonite B1 in the mixture (Table
3.5.2).

Chapter 3
122
Figure 3.5.1. Flow curves of formulations containing bentonite B3
Table 3.5.2. Flow parameters of the formulation chosen for the scale-up printing, fitted according to Herschel-Bulkley's
model
Yield stress (Pa) K (Pa sn) n R2
1446 ± 3 1843 ± 59 0.55 ± 0.01 0.998
A compressive strength of 31.5 ± 3.3 MPa is measured on 3D printed hollow
cylinders, after 7 days of curing at ambient temperature. This value is higher than that
measured on the unfilled sample (containing B3), 23.0 ± 4.7 MPa, and on the same
formulation (containing B1), 17.8 ± 2.7 MPa. Probably, the combined action of biomass
and bentonite B3, without the addition of water, has an optimal filling effect, which
improves the mechanical resistance of the material.
The microstructure observed by SEM is comparable to that of the formulation LB-
GSP5, containing B1 (Figure 3.5.2).
Figure 3.5.2. SEM micrograph of LB-GSP5 for scale-up, containing B3 (a) and formulated with B1 (b)

Results and discussion
123
3.5.2. Scale-up process and results
Two main project constraints must be taken into account to tune process
parameters and procedures. From one hand, the printing speed must be selected with
respect to the ability of the material to sustain the weight of the layers subsequently
deposited. An estimation of the maximum height that could be reached by a printed
structure, considering the yield stress constant, is computed according to Equation (6).
From the calculations made (reported in Appendix), the structure could grow around 24
cm before failure. This value is highly underestimated, since the studies made on the early
age variation of properties (reported in § 3.3.1.2) showed that already after 30 minutes
geopolymer pastes become more resistant (higher stress values at the same deformation).
So, to work in safe conditions, the printing speed is selected for each object to have no
more than 25 cm of increase in height in 30 minutes.
On the other hand, the fast setting of geopolymers gives a strong limitation on the
amount of material that can be printed for each batch. From trial and error approach, it
was found that batches not larger than 2 kg of material should be used to avoid hardening
of the material in the pipes and plugging in the screw extruder. Since the designed objects
are more massive than 2 kg, it was not possible to print the whole part in one step and the
process is periodically stopped to refill the tank of geopolymer paste.
During the trial printings, performed to set printing parameters, the formulation
prepared and characterised was slightly changed to adapt to the screw extrusion system.
A paste with a lower viscosity was empirically found to flow more uniformly, so the
formulation has been changed reducing bentonite quantity and adding water (Table 3.5.3).
Table 3.5.3. Formulation actually used in the scale-up printing. The composition is slightly changed to adapt to the
screw-extrusion printing process
Metakaolin
(wt%)
Bentonite
(wt%)
Activator
(wt%)
Water
(wt%)
Spirulina
(wt%)
47.7 10.4 38.0 0.7 3.1
Three objects with different features were printed (§ 2.3.2): a hollow pipe with a
thick perimeter, a model of Pirelli skyscraper and a hollow structure with a complex
twisted geometry.

Chapter 3
124
Regarding the pipe, during printing some flow instability occurred, probably
caused by the too large diameter of the nozzle. The consequences of an instable flow are
a lower surface definition, as well as the introduction of unwanted voids in the structrure.
At around the 80% of execution of the printing, a structural failure occurred in the bulged
region, because of the excessive weight of the structure built above. The failure occurred
longitudinally in correspondence with the passage point between subsequent layers,
which is a region intrinsically characterized by the presence of voids (Figure 3.5.4). As a
consequence of this failure, the top layers were deposited in a tilted position with respect
to the original design and the final structure resulted to be visibly bent (Figure 3.5.3b).
Figure 3.5.3. (a) Printing process of the pipe; (b) final structure, showing a bent shape because of the structural
failure occurred
(a) (b)
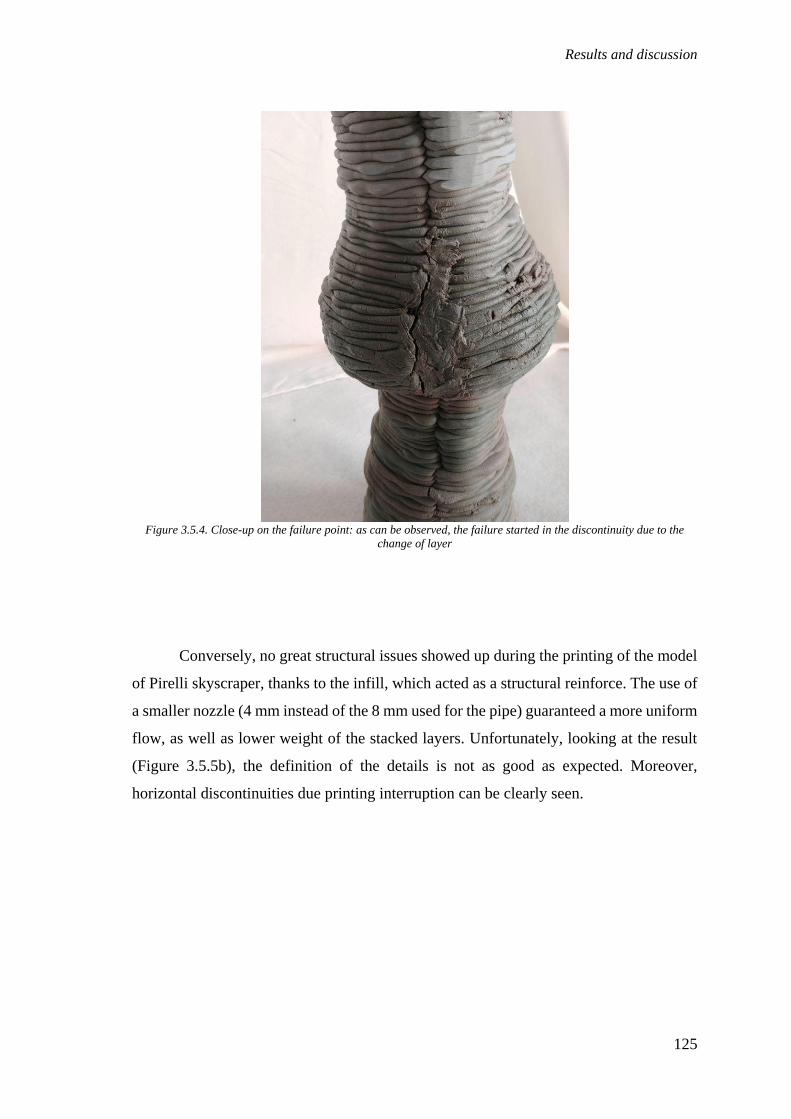
Results and discussion
125
Figure 3.5.4. Close-up on the failure point: as can be observed, the failure started in the discontinuity due to the
change of layer
Conversely, no great structural issues showed up during the printing of the model
of Pirelli skyscraper, thanks to the infill, which acted as a structural reinforce. The use of
a smaller nozzle (4 mm instead of the 8 mm used for the pipe) guaranteed a more uniform
flow, as well as lower weight of the stacked layers. Unfortunately, looking at the result
(Figure 3.5.5b), the definition of the details is not as good as expected. Moreover,
horizontal discontinuities due printing interruption can be clearly seen.
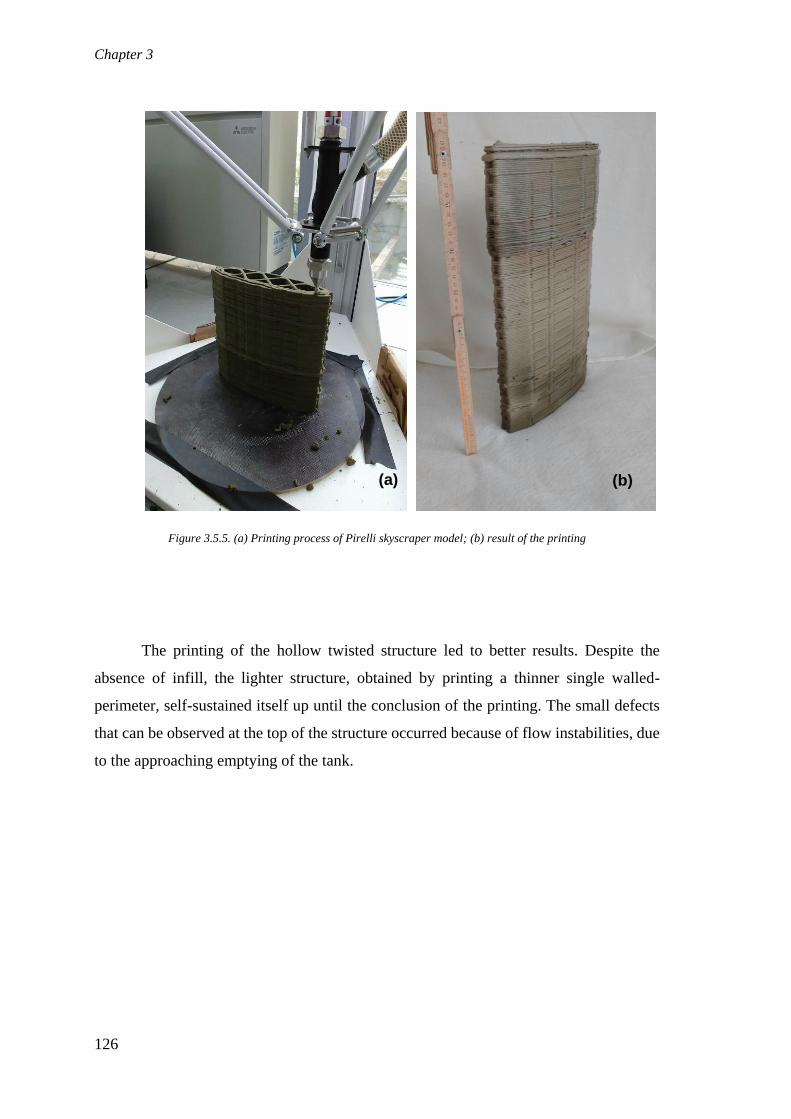
Chapter 3
126
Figure 3.5.5. (a) Printing process of Pirelli skyscraper model; (b) result of the printing
The printing of the hollow twisted structure led to better results. Despite the
absence of infill, the lighter structure, obtained by printing a thinner single walled-
perimeter, self-sustained itself up until the conclusion of the printing. The small defects
that can be observed at the top of the structure occurred because of flow instabilities, due
to the approaching emptying of the tank.
(a) (b)

Results and discussion
127
Figure 3.5.6. (a) Printing process of the hollow twisted structure; (b) final result
(a)
(b)

Chapter 3
128
Summarizing, the printing of larger structure is feasible, with some restrictions.
First of all, the change of formulation necessary to reduce viscosity, reduced also the
ability of the material to sustain stresses. In addition, the batch configuration of the
printing system entailed breaks of the printing, which caused visible discontinuities in the
printed parts. Finally, high degree of detail cannot be successfully achieved with this
technology at this scale for geopolymer cement.
The first two problems may be solved in principle by adopting a continuous
feeding system, like a hopper. Better definitions could be achieved by using smaller
nozzles or by printing larger structures.
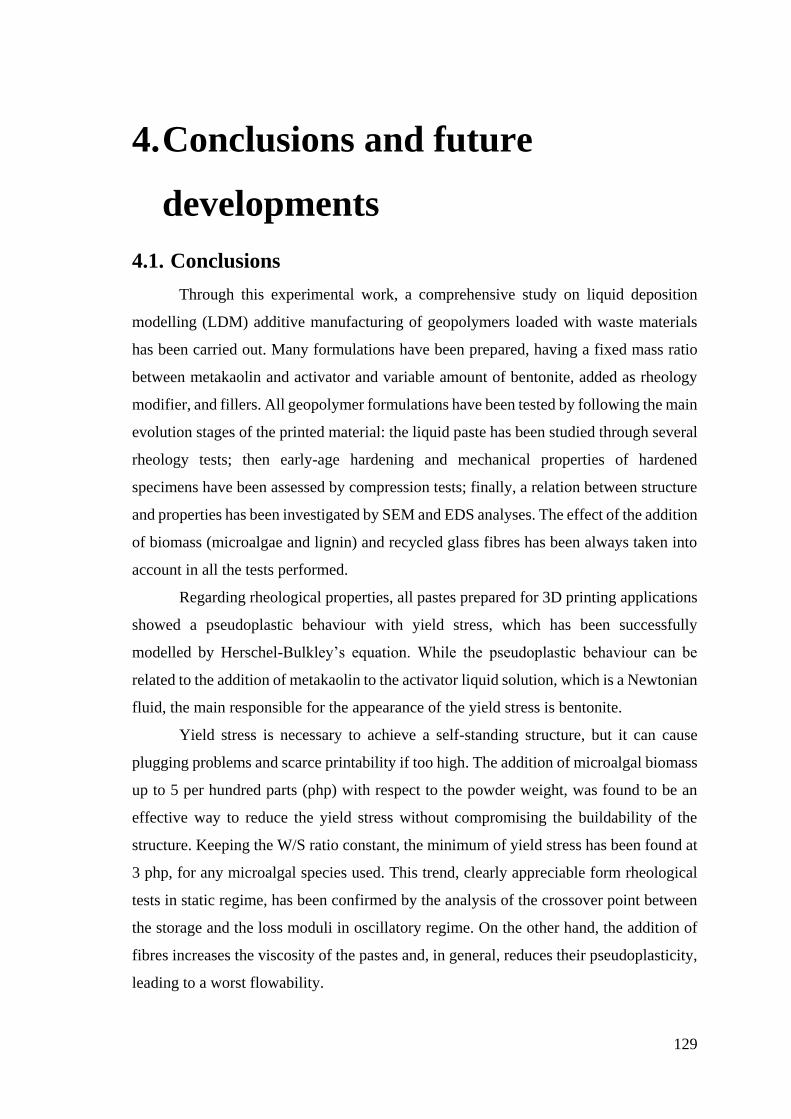
129
4. Conclusions and future
developments
4.1. Conclusions
Through this experimental work, a comprehensive study on liquid deposition
modelling (LDM) additive manufacturing of geopolymers loaded with waste materials
has been carried out. Many formulations have been prepared, having a fixed mass ratio
between metakaolin and activator and variable amount of bentonite, added as rheology
modifier, and fillers. All geopolymer formulations have been tested by following the main
evolution stages of the printed material: the liquid paste has been studied through several
rheology tests; then early-age hardening and mechanical properties of hardened
specimens have been assessed by compression tests; finally, a relation between structure
and properties has been investigated by SEM and EDS analyses. The effect of the addition
of biomass (microalgae and lignin) and recycled glass fibres has been always taken into
account in all the tests performed.
Regarding rheological properties, all pastes prepared for 3D printing applications
showed a pseudoplastic behaviour with yield stress, which has been successfully
modelled by Herschel-Bulkley’s equation. While the pseudoplastic behaviour can be
related to the addition of metakaolin to the activator liquid solution, which is a Newtonian
fluid, the main responsible for the appearance of the yield stress is bentonite.
Yield stress is necessary to achieve a self-standing structure, but it can cause
plugging problems and scarce printability if too high. The addition of microalgal biomass
up to 5 per hundred parts (php) with respect to the powder weight, was found to be an
effective way to reduce the yield stress without compromising the buildability of the
structure. Keeping the W/S ratio constant, the minimum of yield stress has been found at
3 php, for any microalgal species used. This trend, clearly appreciable form rheological
tests in static regime, has been confirmed by the analysis of the crossover point between
the storage and the loss moduli in oscillatory regime. On the other hand, the addition of
fibres increases the viscosity of the pastes and, in general, reduces their pseudoplasticity,
leading to a worst flowability.
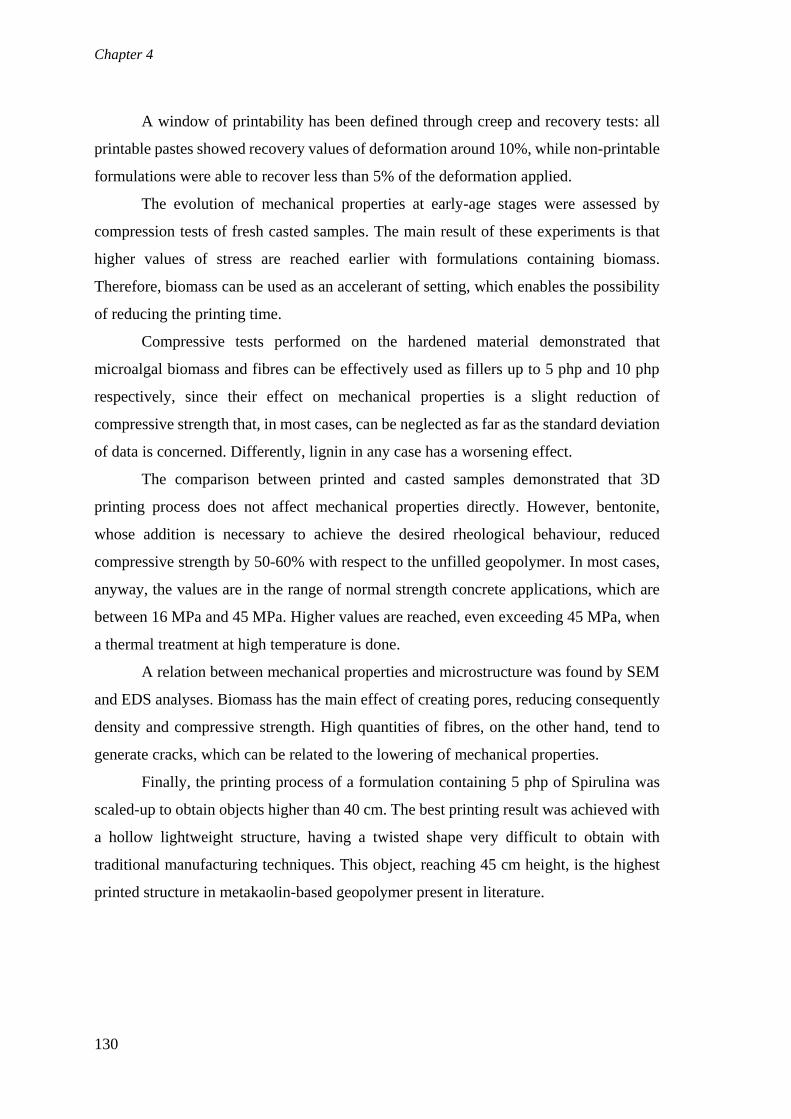
Chapter 4
130
A window of printability has been defined through creep and recovery tests: all
printable pastes showed recovery values of deformation around 10%, while non-printable
formulations were able to recover less than 5% of the deformation applied.
The evolution of mechanical properties at early-age stages were assessed by
compression tests of fresh casted samples. The main result of these experiments is that
higher values of stress are reached earlier with formulations containing biomass.
Therefore, biomass can be used as an accelerant of setting, which enables the possibility
of reducing the printing time.
Compressive tests performed on the hardened material demonstrated that
microalgal biomass and fibres can be effectively used as fillers up to 5 php and 10 php
respectively, since their effect on mechanical properties is a slight reduction of
compressive strength that, in most cases, can be neglected as far as the standard deviation
of data is concerned. Differently, lignin in any case has a worsening effect.
The comparison between printed and casted samples demonstrated that 3D
printing process does not affect mechanical properties directly. However, bentonite,
whose addition is necessary to achieve the desired rheological behaviour, reduced
compressive strength by 50-60% with respect to the unfilled geopolymer. In most cases,
anyway, the values are in the range of normal strength concrete applications, which are
between 16 MPa and 45 MPa. Higher values are reached, even exceeding 45 MPa, when
a thermal treatment at high temperature is done.
A relation between mechanical properties and microstructure was found by SEM
and EDS analyses. Biomass has the main effect of creating pores, reducing consequently
density and compressive strength. High quantities of fibres, on the other hand, tend to
generate cracks, which can be related to the lowering of mechanical properties.
Finally, the printing process of a formulation containing 5 php of Spirulina was
scaled-up to obtain objects higher than 40 cm. The best printing result was achieved with
a hollow lightweight structure, having a twisted shape very difficult to obtain with
traditional manufacturing techniques. This object, reaching 45 cm height, is the highest
printed structure in metakaolin-based geopolymer present in literature.

Conclusions and future developments
131
4.2. Future developments
The weakest aspect of all the formulations analysed for 3D printing applications
is the reduction of compressive strength due to bentonite. In sight of using LDM
technology to print buildings, an alternative to bentonite with a lower or no effect on
mechanical properties should be found.
The study of different formulations can be interesting also to develop strategies to
embed higher quantities of biomass or other waste materials in the geopolymer matrix.
On the contrary, more experiments should be done on recycled glass fibres addition lower
than 5 php, which may lead to reinforcing effects.
Large-scale printings, even larger than the ones already performed, are for sure a
very important aspect to be furtherly developed. A different printing system, based on
continuous instead that on batch feeding, should be used to avoid printing interruptions
and consequently surface and structural defects.

132
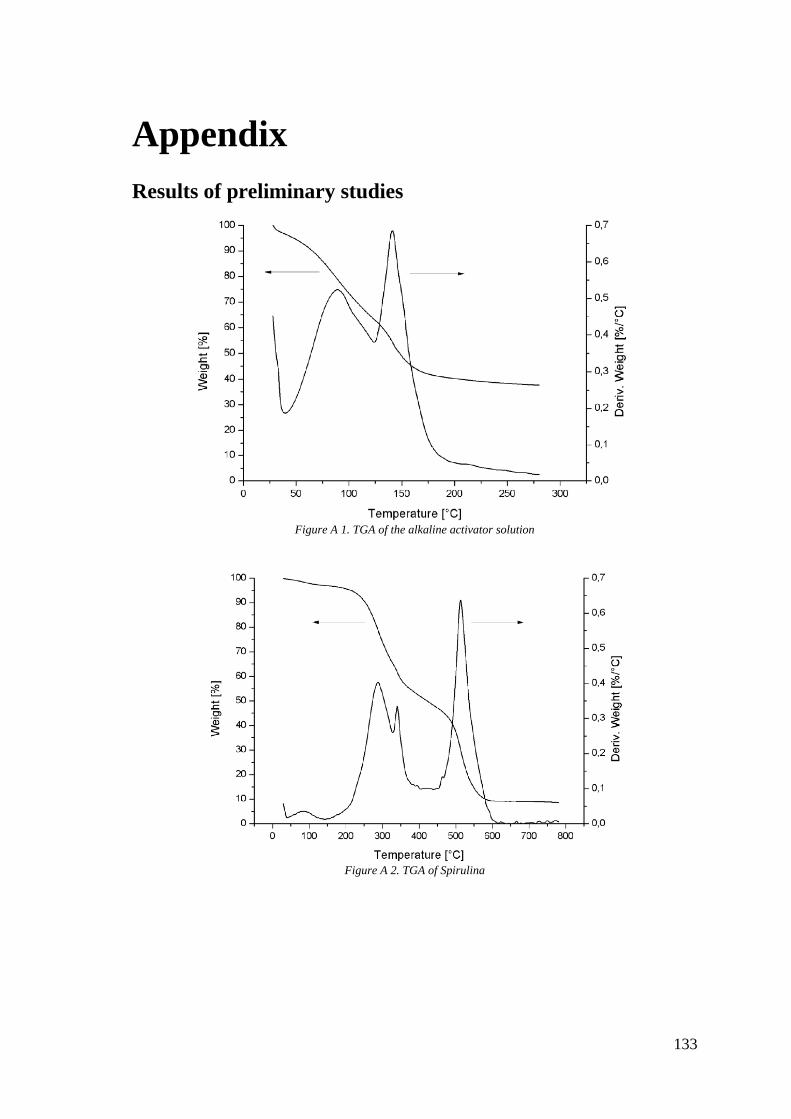
133
Appendix
Results of preliminary studies
Figure A 1. TGA of the alkaline activator solution
Figure A 2. TGA of Spirulina
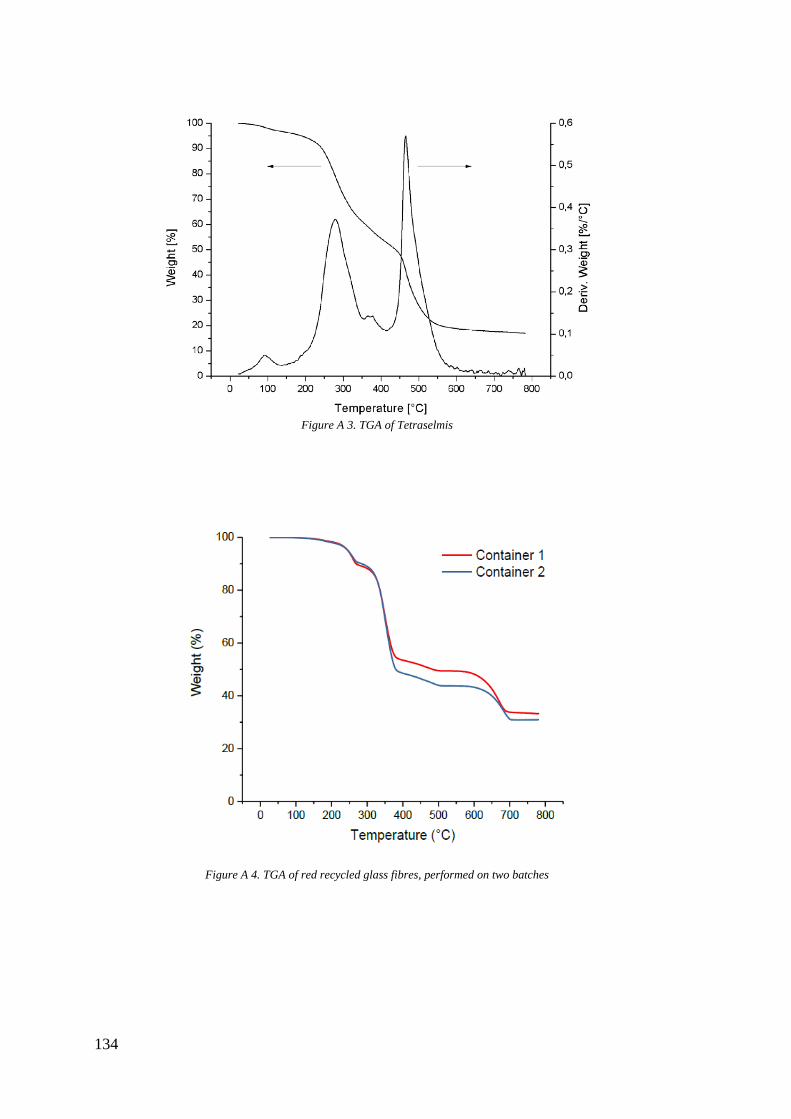
134
Figure A 3. TGA of Tetraselmis
Figure A 4. TGA of red recycled glass fibres, performed on two batches
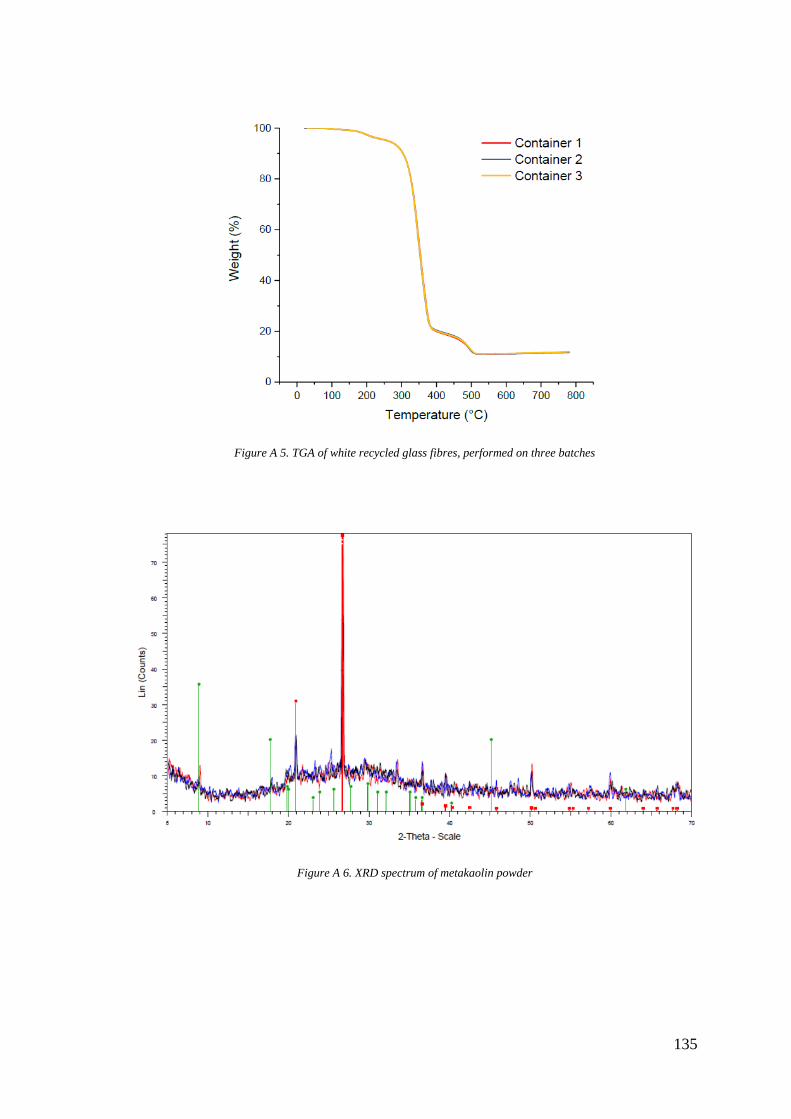
135
Figure A 5. TGA of white recycled glass fibres, performed on three batches
Figure A 6. XRD spectrum of metakaolin powder

136
Figure A 7. FT-IR spectrum of microalgae
Figure A 8. FT-IR spectra of microalgae and geopolymer before geopolymerization

137
Figure A 9. FT-IR spectra of geopolymer and microalgae after geopolymerization
Estimation of maximum height of printed structures
Following the approach of Weng et al. [92], the maximum height of a printed
structure is estimated according to Equation (6):
𝐻 =𝛼
𝜌𝑔𝜏𝑦
𝛼 is defined through the following expression:
𝛼 = (𝑅22 − 𝑅1
2)−1 (1
2+
𝐶𝛼
𝑅22)
−1
√3
4+
𝐶𝛼2
𝑅24
∙ {4
𝐻[𝑅2
3 − 𝑅13
6+ 𝐶𝛼(𝑅2 − 𝑅1)] + 2𝐶𝛼 (√
3𝑅24
4𝐶𝛼2
+ 1 − √3𝑅1
4
4𝐶𝛼2
+ 1)
− 2𝐶𝛼 [arcsinh (2𝐶𝛼
√3𝑅22
) − arcsinh (2𝐶𝛼
√3𝑅12
)]
− 2𝑅12 (
3
4+
𝐶𝛼2
𝑅14)
−0.5
(1
4−
𝐶𝛼2
𝑅14) − 2𝑅2
2 (3
4+
𝐶𝛼2
𝑅24)
−0.5
(1
4−
𝐶𝛼2
𝑅24)}
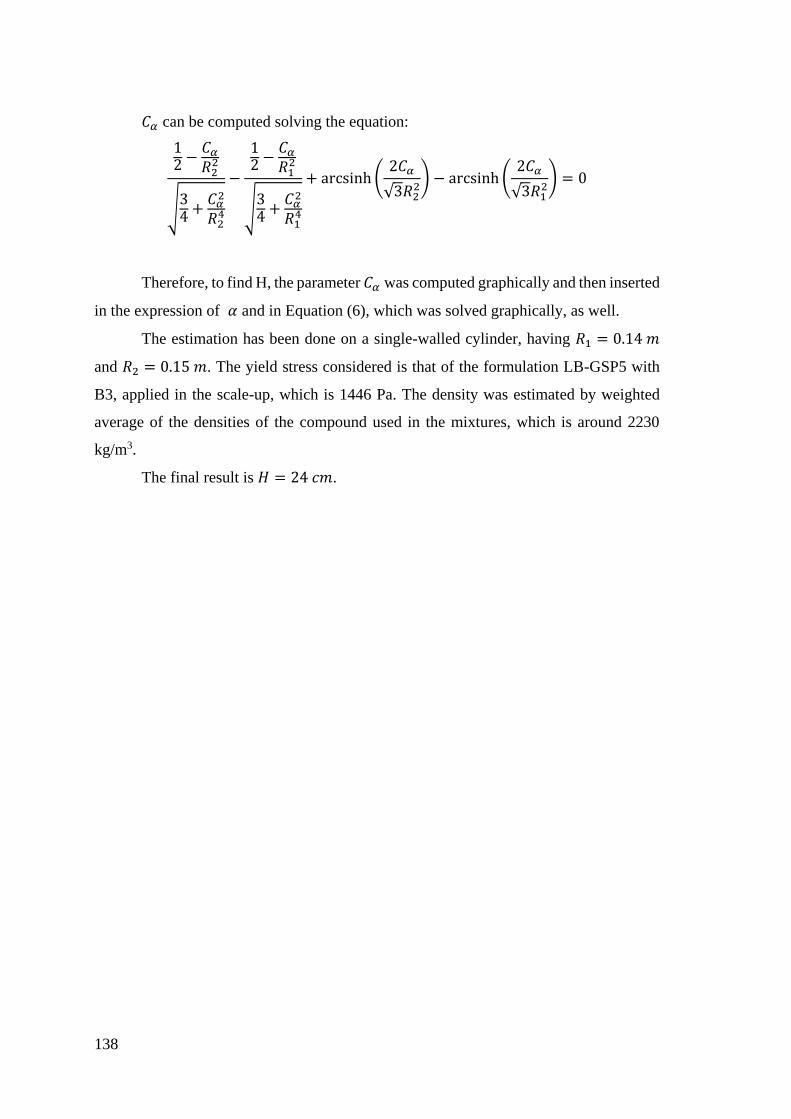
138
𝐶𝛼 can be computed solving the equation:
12 −
𝐶𝛼
𝑅22
√34
+𝐶𝛼
2
𝑅24
−
12 −
𝐶𝛼
𝑅12
√34
+𝐶𝛼
2
𝑅14
+ arcsinh (2𝐶𝛼
√3𝑅22
) − arcsinh (2𝐶𝛼
√3𝑅12
) = 0
Therefore, to find H, the parameter 𝐶𝛼 was computed graphically and then inserted
in the expression of 𝛼 and in Equation (6), which was solved graphically, as well.
The estimation has been done on a single-walled cylinder, having 𝑅1 = 0.14 𝑚
and 𝑅2 = 0.15 𝑚. The yield stress considered is that of the formulation LB-GSP5 with
B3, applied in the scale-up, which is 1446 Pa. The density was estimated by weighted
average of the densities of the compound used in the mixtures, which is around 2230
kg/m3.
The final result is 𝐻 = 24 𝑐𝑚.
139
Bibliography
[1] ASTM and ISO, “Standard Terminology for Additive Manufacturing – General
Principles – Terminology,” Iso/Astm, vol. 52900, p. 9, 2015.
[2] H. Miyanaji, M. Orth, J. M. Akbar, and L. Yang, “Process development for green
part printing using binder jetting additive manufacturing,” Front. Mech. Eng., vol.
13, no. 4, pp. 504–512, 2018.
[3] T. D. Ngo, A. Kashani, G. Imbalzano, K. T. Q. Nguyen, and D. Hui, “Additive
manufacturing (3D printing): A review of materials, methods, applications and
challenges,” Compos. Part B Eng., vol. 143, no. February, pp. 172–196, 2018.
[4] I. Gibson, D. Rosen, and B. Stucker, Additive Manufacturing Technologies: 3D
Printing, Rapid Prototyping, and Direct Digital Manufacturing. 2015.
[5] N. Guo and M. C. Leu, “Additive manufacturing : technology , applications and
research needs,” vol. 8, no. 3, pp. 215–243, 2013.
[6] M. Invernizzi, G. Natale, M. Levi, S. Turri, and G. Griffini, “UV-assisted 3D
printing of glass and carbon fiber-reinforced dual-cure polymer composites,”
Materials (Basel)., vol. 9, no. 7, 2016.
[7] A. Ambrosi and M. Pumera, “3D-printing technologies for electrochemical
applications,” Chem. Soc. Rev., vol. 45, no. 10, pp. 2740–2755, 2016.
[8] F. Calignano et al., “Overview on additive manufacturing technologies,” Proc.
IEEE, vol. 105, no. 4, pp. 593–612, 2017.
[9] I. Gibson, D. W. Rosen, and B. Stucker, Additive Manufacturing Technologies.
2010.
[10] “https://www.3dhubs.com/knowledge-base/additive-manufacturing-technologies-
overview#direct-energy-deposition.”, Accessed October 2018 .
[11] K. V. Wong and A. Hernandez, “A review of additive manufacturing,” ISRN Mech.
Eng., vol. 2012, p. 10, 2012.
[12] B. Berman, “3-D printing: The new industrial revolution,” Bus. Horiz., vol. 55, no.
2, pp. 155–162, 2012.
[13] J. Maric, F. Rodhain, and Y. Barlette, “Frugal innovations and 3D printing: insights
from the field,” J. Innov. Econ., vol. 21, no. 3, p. 57, 2016.
[14] N. Radjou, P. Jaideep, and A. Simone, Jugaad Innovation: Think Frugal, Be

140
Flexible, Generate Breakthrough Growth. 2012.
[15] J. Mair, I. Martì, and M. J. Ventresca, “Building inclusive markets in rural
Bangladesh: how intermediaries work institutional voids,” Acad. Manag. J., vol.
55, no. 4, pp. 819–850, 2012.
[16] T. Campbell, C. Williams, O. Ivanova, and B. Garrett, “Could 3D Printing Change
the World? Technologies, Potential, and Implications of Additive Manufacturing,”
Atl. Counc. Strateg. Foresight Rep., 2012.
[17] “https://www.sculpteo.com/blog/2017/01/18/3d-printing-benefits-impossible-
designs-and-internal-channels/.”, Accessed August 2018.
[18] J. L. Provis and J. S. J. van Deventer, Geopolymers. 2009.
[19] J. Pegna, “Exploratory investigation of solid freeform construction,” Autom.
Constr., vol. 5, no. 5, pp. 427–437, 1997.
[20] B. Khoshnevis and R. Dutton, “Innovative Rapid Prototyping Process Makes
Large Sized, Smooth Surfaced Complex Shapes in a Wide Variety of Materials,”
Mater. Technol., vol. 13, no. 2, pp. 53–56, 1998.
[21] B. Khoshnevis, D. Hwang, K.-T. Yao, and Z. Yeh, “Mega-scale fabrication by
contour crafting,” Int. J. Ind. Syst. Eng., vol. 1, no. 3, pp. 301–320, 2006.
[22] S. Lim, R. A. Buswell, T. T. Le, S. A. Austin, A. G. F. Gibb, and T. Thorpe,
“Developments in construction-scale additive manufacturing processes,” Autom.
Constr., vol. 21, no. 1, pp. 262–268, 2012.
[23] G. W. Ma, L. Wang, and Y. Ju, “State-of-the-art of 3D printing technology of
cementitious material—An emerging technique for construction,” Sci. China
Technol. Sci., pp. 1–21, 2017.
[24] E. Canessa, C. Fonda, and M. Zennaro, Low-cost 3D printing for science,
education & sustainable development. ICTP, 2013.
[25] I. Hager, A. Golonka, and R. Putanowicz, “3D Printing of Buildings and Building
Components as the Future of Sustainable Construction?,” Procedia Eng., vol. 151,
pp. 292–299, 2016.
[26] “https://www.3dnatives.com/en/crane-wasp-modular-3d-printer-construction-
industry-251020184/.”, Accessed November 2018
[27] “https://www.3dwasp.com/.”, Accessed October 2018.
[28] B. Panda, S. C. Paul, L. J. Hui, Y. W. D. Tay, and M. J. Tan, “Additive
141
manufacturing of geopolymer for sustainable built environment,” J. Clean. Prod.,
vol. 167, pp. 281–288, 2018.
[29] B. Panda, S. C. Paul, N. A. N. Mohamed, Y. W. D. Tay, and M. J. Tan,
“Measurement of tensile bond strength of 3D printed geopolymer mortar,” Meas.
J. Int. Meas. Confed., vol. 113, no. September 2017, pp. 108–116, 2018.
[30] B. Panda and M. J. Tan, “Experimental study on mix proportion and fresh
properties of fly ash based geopolymer for 3D concrete printing,” Ceram. Int., no.
March, 2018.
[31] B. Panda, M. Li, Y. W. D. Tay, S. C. Paul, and M. J. Tan, “Modeling Fly Ash
Based Geopolymer Flow for 3D Printing Applications,” Int. Conf. Adv. Constr.
Mater. Syst., no. September, pp. 9–16, 2017.
[32] G. Cesaretti, E. Dini, X. De Kestelier, V. Colla, and L. Pambaguian, “Building
components for an outpost on the Lunar soil by means of a novel 3D printing
technology,” Acta Astronaut., vol. 93, pp. 430–450, 2014.
[33] P. Wu, J. Wang, and X. Wang, “A critical review of the use of 3-D printing in the
construction industry,” Autom. Constr., vol. 68, pp. 21–31, 2016.
[34] D. Asprone, C. Menna, F. P. Bos, T. A. M. Salet, J. Mata-Falcón, and W.
Kaufmann, “Rethinking reinforcement for digital fabrication with concrete,” Cem.
Concr. Res., no. January, pp. 0–1, 2018.
[35] C. F. Revelo and H. A. Colorado, “3D printing of kaolinite clay ceramics using the
Direct Ink Writing (DIW) technique,” Ceram. Int., vol. 44, no. 5, pp. 5673–5682,
2017.
[36] A. Zocca, P. Colombo, C. M. Gomes, and J. Günster, “Additive Manufacturing of
Ceramics: Issues, Potentialities, and Opportunities,” J. Am. Ceram. Soc., vol. 98,
no. 7, pp. 1983–2001, 2015.
[37] K. Komnitsas and D. Zaharaki, “Geopolymerisation: A review and prospects for
the minerals industry,” Miner. Eng., vol. 20, no. 14, pp. 1261–1277, 2007.
[38] J. Davidovits, “Geopolymers and geopolymeric materials,” J. Therm. Anal., vol.
35, no. 2, pp. 429–441, 1989.
[39] J. W. Phair and J. S. J. Van Deventer, “Effect of the silicate activator pH on the
leaching and material characteristics of waste-based geopolymers,” Int. J. Miner.
Process., vol. 66, no. 1–4, pp. 121–143, 2002.

142
[40] M. . Villaquirán-Caicedo, R. Mejía de Gutiérrez, and N. C. Gallego, “A Novel
MK-based Geopolymer Composite Activated with Rice Husk Ash and KOH :
Performance at High Temperature,” Mater. Construcción, vol. 67, no. 326, pp. 1–
13, 2017.
[41] Z. H. Zhang, H. J. Zhu, C. H. Zhou, and H. Wang, “Geopolymer from kaolin in
China: An overview,” Appl. Clay Sci., vol. 119, pp. 31–41, 2016.
[42] H. Xu and J. S. J. Van Deventer, “The geopolymerisation of alumino-silicate
minerals,” 2000.
[43] Z. Zuhua, Y. Xiao, Z. Huajun, and C. Yue, “Role of water in the synthesis of
calcined kaolin-based geopolymer,” Appl. Clay Sci., vol. 43, no. 2, pp. 218–223,
2009.
[44] P. Duxson, A. Fernández-Jiménez, J. L. Provis, G. C. Lukey, A. Palomo, and J. S.
J. Van Deventer, “Geopolymer technology: The current state of the art,” J. Mater.
Sci., vol. 42, no. 9, pp. 2917–2933, 2007.
[45] D. Khale and R. Chaudhary, “Mechanism of geopolymerization and factors
influencing its development: A review,” J. Mater. Sci., vol. 42, no. 3, pp. 729–746,
2007.
[46] J. Davidovits, “Geopolymers: Ceramic-like inorganic polymers,” J. Ceram. Sci.
Technol., vol. 8, no. 3, pp. 335–350, 2017.
[47] P. De Silva, K. Sagoe-Crenstil, and V. Sirivivatnanon, “Kinetics of
geopolymerization: Role of Al2O3and SiO2,” Cem. Concr. Res., vol. 37, no. 4, pp.
512–518, 2007.
[48] P. Duxson, J. L. Provis, G. C. Lukey, S. W. Mallicoat, W. M. Kriven, and J. S. J.
Van Deventer, “Understanding the relationship between geopolymer composition,
microstructure and mechanical properties,” Colloids Surfaces A Physicochem.
Eng. Asp., vol. 269, no. 1–3, pp. 47–58, 2005.
[49] J. G. S. van Jaarsveld, G. C. Lukey, J. S. J. van Deventer, and A. Graham, “The
stabilisation of mine tailings by reactive geopolymerisation,” Minprex 2000 Int.
Congr. Miner. Process. Extr. Metall., no. September, pp. 363–371, 2000.
[50] X. Chen, A. Sutrisno, and L. J. Struble, “Effects of calcium on setting mechanism
of metakaolin-based geopolymer,” J. Am. Ceram. Soc., vol. 101, no. 2, pp. 957–
968, 2018.

143
[51] P. Duxson, G. C. Lukey, and J. S. J. Van Deventer, “Physical evolution of Na-
geopolymer derived from metakaolin up to 1000 °c,” J. Mater. Sci., vol. 42, no. 9,
pp. 3044–3054, 2007.
[52] T. W. Cheng and J. P. Chiu, “Fire-resistant geopolymer produce by granulated
blast furnace slag,” Miner. Eng., vol. 16, no. 3, pp. 205–210, 2003.
[53] P. Duan, C. Yan, and W. Luo, “A novel waterproof, fast setting and high early
strength repair material derived from metakaolin geopolymer,” Constr. Build.
Mater., vol. 124, pp. 69–73, 2016.
[54] P. Kinnunen et al., “Recycling mine tailings in chemically bonded ceramics – A
review,” J. Clean. Prod., vol. 174, pp. 634–649, 2018.
[55] Y. M. Liew, C. Y. Heah, A. B. Mohd Mustafa, and H. Kamarudin, “Structure and
properties of clay-based geopolymer cements: A review,” Prog. Mater. Sci., vol.
83, pp. 595–629, 2016.
[56] C. Fernández-Pereira et al., “Immobilization of heavy metals (Cd, Ni or Pb) using
aluminate geopolymers,” Mater. Lett.
[57] C. Bai et al., “High-porosity geopolymer foams with tailored porosity for thermal
insulation and wastewater treatment,” J. Mater. Res., vol. 32, no. 17, pp. 3251–
3259, 2017.
[58] L. N. Tchadjie and S. O. Ekolu, “Enhancing the reactivity of aluminosilicate
materials toward geopolymer synthesis,” J. Mater. Sci., vol. 53, no. 7, pp. 1–25,
2017.
[59] A. Sudagar et al., “A novel study on the influence of cork waste residue on
metakaolin-zeolite based geopolymers,” Appl. Clay Sci., vol. 152, no. November
2017, pp. 196–210, 2018.
[60] K. A. Komnitsas, “Potential of geopolymer technology towards green buildings
and sustainable cities,” Procedia Eng., vol. 21, pp. 1023–1032, 2011.
[61] R. D. Hooton, “Bridging the gap between research and standards,” Cem. Concr.
Res., vol. 38, no. 2, pp. 247–258, 2008.
[62] A. Nazari and J. G. Sanjayan, Handbook of Low Carbon Concrete. 2017.
[63] B. L. Damineli, F. M. Kemeid, P. S. Aguiar, and V. M. John, “Measuring the eco-
efficiency of cement use,” Cem. Concr. Compos., vol. 32, no. 8, pp. 555–562,
2010.

144
[64] C. Meyer, “The greening of the concrete industry,” Cem. Concr. Compos., vol. 31,
no. 8, pp. 601–605, 2009.
[65] P. Duxson, J. L. Provis, G. C. Lukey, and J. S. J. van Deventer, “The role of
inorganic polymer technology in the development of ‘green concrete,’” Cem.
Concr. Res., vol. 37, no. 12, pp. 1590–1597, 2007.
[66] N. Abdel-Raouf, A. A. Al-Homaidan, and I. B. M. Ibraheem, “Microalgae and
wastewater treatment,” Saudi J. Biol. Sci., vol. 19, no. 3, pp. 257–275, 2012.
[67] Z. K. Abdulsada, Evaluation of Microalgae for Secondary and Tertiary
Wastewater Treatment. 2014.
[68] “https://www.sciencelearn.org.nz/images/1023-eutrophication.”, Accessed
September 2018.
[69] J. Ruiz, P. Álvarez, Z. Arbib, C. Garrido, J. Barragán, and J. A. Perales, “Effect of
nitrogen and phosphorus concentration on their removal kinetic in treated urban
wastewater by Chlorella vulgaris,” Int. J. Phytoremediation, vol. 13, no. 9, pp.
884–896, 2011.
[70] N. F. Gray, Biology of wastewater treatment. 2004.
[71] L. Brandt, G. Sardina, and M. Ahmed, “Dispersion of swimming algae in laminar
and turbulent channel flows : theory and simulations,” 2013.
[72] S. Mobin and F. Alam, “Biofuel Production from Algae Utilizing Wastewater,”
no. December, 2014.
[73] M. A. Borowitzka, “Commercial production of microalgae: ponds, tanks, and
fermenters,” Prog. Ind. Microbiol., vol. 35, no. C, pp. 313–321, 1999.
[74] L. L. Zhuang et al., “The characteristics and influencing factors of the attached
microalgae cultivation: A review,” Renew. Sustain. Energy Rev., vol. 94, no. June,
pp. 1110–1119, 2018.
[75] “http://saltgae.eu/.”, Accessed October 2018.
[76] R. Johannes and A. Gosselink, Lignin as a Renewable Aromatic Resource for the
Chemical Industry Lignin as a renewable aromatic resource for the chemical
industry, no. May. 2016.
[77] L. P. Christopher, B. Yao, and Y. Ji, “Lignin biodegradation with laccase-mediator
systems,” vol. 2, no. March, pp. 1–13, 2014.
[78] G. Gellerstedt, “Softwood kraft lignin: Raw material for the future,” Ind. Crops

145
Prod., vol. 77, pp. 845–854, 2015.
[79] M. Naceur Belgacem and A. Gandini, Monomers , Polymers and Composites. .
[80] A. Duval, F. Vilaplana, C. Crestini, and M. Lawoko, “Solvent screening for the
fractionation of industrial kraft lignin,” vol. 70, no. 1, pp. 11–20, 2016.
[81] N. A. Shuaib and P. T. Mativenga, “Effect of Process Parameters on Mechanical
Recycling of Glass Fibre Thermoset Composites,” Procedia CIRP, vol. 48, pp.
134–139, 2016.
[82] K. Larsen, “Recycling wind turbine blades,” Renew. Energy Focus, vol. 9, no. 7,
pp. 70–73, 2009.
[83] S. J. Pickering, “Recycling Technologies For Thermoset Composite Materials,”
Adv. Polym. Compos. Struct. Appl. Constr. ACIC 2004, vol. 37, pp. 392–399, 2004.
[84] K. Yoon, A. DiBenedetto, and S. Huang, “Recycling of unsaturated polyester resin
using propylene glycol K. H. Yoon,” vol. 38, no. 9, pp. 2281–2285, 1997.
[85] G. Oliveux, J. L. Bailleul, and E. L. G. La Salle, “Chemical recycling of glass fibre
reinforced composites using subcritical water,” Compos. Part A Appl. Sci. Manuf.,
vol. 43, no. 11, pp. 1809–1818, 2012.
[86] “http://fibereuse.eu/.”, Accessed October 2018.
[87] M. Steinerova, L. Matulova, P. Vermach, and J. Kotas, “The brittleness and
chemical stability of optimized geopolymer composites,” Materials (Basel)., vol.
10, no. 4, 2017.
[88] G. Natale, “3D Composites Extrusion Project,” Politec. di Milano, 2014.
[89] Alexander Ya. Malkin and Avraam I. Isayev, Rheology. 2017.
[90] R. Suriano, G. Griffini, M. Chiari, M. Levi, and S. Turri, “Rheological and
mechanical behavior of polyacrylamide hydrogels chemically crosslinked with
allyl agarose for two-dimensional gel electrophoresis,” J. Mech. Behav. Biomed.
Mater., vol. 30, pp. 339–346, 2014.
[91] Y. Jia, K. Peng, X. L. Gong, and Z. Zhang, “Creep and recovery of
polypropylene/carbon nanotube composites,” Int. J. Plast., vol. 27, no. 8, pp.
1239–1251, 2011.
[92] Y. Weng, M. Li, M. J. Tan, and S. Qian, “Design 3D printing cementitious
materials via Fuller Thompson theory and Marson-Percy model,” Constr. Build.
Mater., vol. 163, pp. 600–610, 2018.
146
[93] A. Perrot, D. Rangeard, and A. Pierre, “Structural built-up of cement-based
materials used for 3D-printing extrusion techniques,” Mater. Struct. Constr., vol.
49, no. 4, pp. 1213–1220, 2016.
[94] C. ̧ Targan, A. Olgun, Y. Erdogan, and V. Sevinc, “Effects of supplementary
cementing materials on the properties of cement and concrete,” Cem. Concr. Res.,
vol. 32, no. 10, pp. 1551–1558, 2002.
[95] V. Živica, M. Palou, E. Kuzielová, and M. Žemlička, “Super High Strength
Metabentonite Based Geopolymer,” Procedia Eng., vol. 151, pp. 133–140, 2016.
[96] R. J. M. Wolfs, F. P. Bos, and T. A. M. Salet, “Early age mechanical behaviour of
3D printed concrete: Numerical modelling and experimental testing,” Cem. Concr.
Res., vol. 106, no. February, pp. 103–116, 2018.
[97] BS EN 206, “BSI Standards Publication Concrete — Specification , performance
, production and conformity,” Br. Stand., no. May, p. 30, 2013.
[98] D. Heath and T. F. Tadros, “Rheological investigations of the effect of addition of
free polymer to concentrated sterically stabilised polystyrene latex dispersions,”
Faraday Discuss. Chem. Soc., vol. 76, pp. 203–218, 1983.
[99] G. Franchin et al., “Direct ink writing of geopolymeric inks,” J. Eur. Ceram. Soc.,
vol. 37, no. 6, pp. 2481–2489, 2017.
[100] A. Kazemian, X. Yuan, E. Cochran, and B. Khoshnevis, “Cementitious materials
for construction-scale 3D printing: Laboratory testing of fresh printing mixture,”
Constr. Build. Mater., vol. 145, pp. 639–647, 2017.
[101] F. Bos, R. Wolfs, Z. Ahmed, and T. Salet, “Additive manufacturing of concrete in
construction: potentials and challenges of 3D concrete printing,” Virtual Phys.
Prototyp., vol. 11, no. 3, pp. 209–225, 2016.
147
Ringraziamenti
Siamo arrivati alla fine della tesi e della mia carriera da studente di ingegneria. È
giunto quindi il momento di ringraziare tutti coloro grazie ai quali è stato possibile
raggiungere questo importantissimo traguardo. Sarò sintetico, nel mio stile.
In primis, grazie ai professori Marinella Levi e Stefano Turri. Grazie per la
professionalità, la pazienza e per aver sempre creduto in me.
Restando in ambito accademico, non posso non ringraziare tutti i membri del ChIP
Lab e del +Lab, che sono stati sempre disponibili ad aiutarmi e a darmi preziosi consigli.
Oltre a Riccardo, che mi ha seguito fin dal primo giorno, vorrei ringraziare Gigliola,
Gianmarco, Raffaella, Alessio, Checco, Gilli, Andrea e Marta. Un ringraziamento
speciale va ai miei compagni di laboratorio, con cui ho condiviso questi lunghi ma
indimenticabili mesi di tesi. Fuori dalle mura del Dipartimento, ringrazio Maurizio di
Alfatest, per il fondamentale aiuto sulle prove di reologia, e Mattia di Superforma, senza
il quale lo scale-up non sarebbe stato possibile.
Il ringraziamento più grande però va ai miei genitori, che hanno sempre sostenuto
le mie scelte, permettendomi di dedicarmi allo studio fino ad ora. Senza di voi nulla di
tutto ciò sarebbe stato possibile. Ringrazio poi i cari zii, per avermi offerto la loro
ospitalità ed avermi trattato come un figlio per quattro lunghi anni.
Un grazie enorme va agli amici, che sono diventati di fatto la mia seconda
famiglia. Ringrazio gli amici di sempre, come quelli conosciuti da un po’ meno di
“sempre”; grazie per aver condiviso con me momenti belli, meno belli, sessioni d’esame,
ansie, gioie e le piccole cose di tutti i giorni. “Dalla Valle” ringrazio quindi Ale, il mio
fratello acquisito, Giulia, Linda e Daniel, mentre “da Milano” Balza, Vera, Tom, Matte,
Ciaglia, Marco, Anna, Prisca, Filo e Tob. Grazie anche a tutti coloro che non ho nominato,
ma che sono stati al mio fianco in questi anni.
Infine, grazie a Maria, semplicemente per aver reso tutto più bello, regalandomi il
primo e l’ultimo sorriso di ogni giorno.