Embed Size (px)
Citation preview

Table of Contents
City of Bellingham 2017-18 Preliminary Biennial Budget Page 1
Table of Contents
Mayor's Budget Message .............................................................................................................................. 5
City Structure and Services ........................................................................................................................... 8
Services Provided by the City .................................................................................................................... 8
Organizational Structure ........................................................................................................................... 8
City Organization Chart ............................................................................................................................. 9
Elected Officials ....................................................................................................................................... 10
Administrative Department Heads ......................................................................................................... 11
Budget Overview ......................................................................................................................................... 12
Preparing the Budget .............................................................................................................................. 12
Amending the Budget ............................................................................................................................. 12
Budget Control ........................................................................................................................................ 12
Fund Type Descriptions and Accountability ........................................................................................ 13
Changes in Estimated Reserve Balances Report ..................................................................................... 16
Balanced Budget ................................................................................................................................. 17
Reserves .............................................................................................................................................. 17
Summary of Estimated Revenues, Expenditures and Reserves by Account Type and Fund Type ......... 18
Account Type Category Definitions......................................................................................................... 19
Revenue Types .................................................................................................................................... 19
Expenditure Types............................................................................................................................... 19
Citywide Expenditures by Sub Type for All Funds ................................................................................... 21
Fund Budgets .............................................................................................................................................. 22
General Fund ........................................................................................................................................... 22
Street Funds ............................................................................................................................................ 23
Federal Building Fund ............................................................................................................................. 24
Library Gift Fund ..................................................................................................................................... 24
Olympic Pipeline Incident Fund .............................................................................................................. 25
Olympic-Whatcom Falls Park Fund ......................................................................................................... 25
Environmental Remediation Fund .......................................................................................................... 26
Real Estate Excise Tax Funds ................................................................................................................... 26
Police Special Revenue Funds ................................................................................................................. 27
Public Safety Dispatch Fund .................................................................................................................... 28

Table of Contents
City of Bellingham Page 2 2017-18 Preliminary Biennial Budget
Transportation Benefit District Fund ...................................................................................................... 29
Public, Education and Government Access TV Funds ............................................................................. 30
Greenways Funds .................................................................................................................................... 31
Park Impact Fee Fund ............................................................................................................................. 32
Sportsplex Fund ...................................................................................................................................... 32
Tourism Fund .......................................................................................................................................... 33
Low Income Housing Fund ...................................................................................................................... 33
Community Development Block Grant and HOME Funds ...................................................................... 34
Debt Funds .............................................................................................................................................. 35
LID Guaranty Fund .................................................................................................................................. 35
Construction Funds ................................................................................................................................. 36
Water Fund ............................................................................................................................................. 37
Watershed Sub-Fund .............................................................................................................................. 38
Wastewater Fund .................................................................................................................................... 39
Storm and Surface Water Utility Fund .................................................................................................... 40
Solid Waste Fund .................................................................................................................................... 41
Cemetery Fund ........................................................................................................................................ 42
Golf Course Fund..................................................................................................................................... 42
Parking Services Fund ............................................................................................................................. 43
Medic One Fund ...................................................................................................................................... 44
Development Services Fund ................................................................................................................... 45
Fleet Administration Fund ...................................................................................................................... 46
Radio Communications Sub-Fund ........................................................................................................... 46
Purchasing ............................................................................................................................................... 47
Facilities .................................................................................................................................................. 48
Technology and Telecom Fund ............................................................................................................... 49
Claims and Litigation Fund ...................................................................................................................... 50
Employee Benefits Funds ........................................................................................................................ 51
Public Works Administration & Engineering Fund .................................................................................. 52
Fire and Police Pension Funds ................................................................................................................ 52
Greenways Maintenance Endowment Fund .......................................................................................... 53
Natural Resources Protection and Restoration Fund ............................................................................. 53
Public Facilities District Fund .................................................................................................................. 54

Table of Contents
City of Bellingham 2017-18 Preliminary Biennial Budget Page 3
Citywide Total - All Funds ........................................................................................................................ 55
Department Budgets - Public Safety ........................................................................................................... 56
Police Department .................................................................................................................................. 56
Fire Department ...................................................................................................................................... 59
Municipal Court ...................................................................................................................................... 62
Department Budgets - Recreation and Culture .......................................................................................... 63
Parks and Recreation Department .......................................................................................................... 63
Library ..................................................................................................................................................... 66
Museum .................................................................................................................................................. 68
Department Budgets - Planning and Community Development ................................................................ 69
Planning & Community Development Department ................................................................................ 69
Hearing Examiner .................................................................................................................................... 72
Department Budgets - General Government ............................................................................................. 73
Human Resources Department ............................................................................................................... 73
Information Technology Services Department ....................................................................................... 75
Finance Department ............................................................................................................................... 78
Legal Department ................................................................................................................................... 80
Executive Department ............................................................................................................................ 82
Legislative Department ........................................................................................................................... 82
Non-Departmental .................................................................................................................................. 83
Department Budget - Discrete Component Unit ........................................................................................ 84
Public Facilities District ........................................................................................................................... 84
Department Budget - Public Works ............................................................................................................ 85
Public Works Department ....................................................................................................................... 85
Capital Plan ................................................................................................................................................. 87
Budgeted Positions - Public Safety ............................................................................................................. 94
Police Department .................................................................................................................................. 94
Fire Department ...................................................................................................................................... 95
Budgeted Positions - Planning and Community Development ................................................................... 96
Planning and Community Development Department ............................................................................ 96
Hearing Examiner .................................................................................................................................... 97
Budgeted Positions - Recreation and Culture ............................................................................................. 97
Parks and Recreation Department .......................................................................................................... 97

Table of Contents
City of Bellingham Page 4 2017-18 Preliminary Biennial Budget
Library and Museum ............................................................................................................................... 99
Budgeted Positions - General Government .............................................................................................. 100
Human Resources Department ............................................................................................................. 100
Information Technology Services Department ..................................................................................... 100
Finance Department ............................................................................................................................. 101
Legal Department ................................................................................................................................. 101
Executive Department - Mayor's Office ................................................................................................ 102
Legislative Department - Council Office ............................................................................................... 102
Budgeted Positions - Public Works ........................................................................................................... 103
Public Works Department ..................................................................................................................... 103

Mayor's Budget Message
City of Bellingham 2017-18 Preliminary Biennial Budget Page 5
Mayor's Budget Message
MAYOR’S OFFICE Kelli Linville, Mayor
City Hall, 210 Lottie Street Bellingham, WA 98225
Telephone (360) 778-8100 Fax (360) 778-8101
TO: Bellingham City Council and the Bellingham Community
FROM: Mayor Kelli Linville
DATE: October 5, 2016
RE: Preliminary 2017-2018 Biennial Budget
The City of Bellingham has a lot to be proud of. We keep our community safe with our police and fire
services and by providing clean drinking water and public transportation systems. We offer amazing
parks and trails, library services, the Whatcom Museum and the Mount Baker Theatre. We develop
plans for the current needs of our neighborhoods and for the future growth of our community.
The City's budget ensures that we can provide these important services. The following 2017-18 Biennial
Budget proposes that we continue our great services to the community and provide key strategic
investments to position us for the future. Our community is supportive of local government, and this
budget provides services that are above and beyond the basics as we continue to recover from the
Great Recession.
My number one priority is public safety, and one of the biggest investments in this proposal is to add
two additional police officers each year of the biennium. We are committed to a community policing
model that will allow our officers to spend more time preventing crime and allow them to interact more
with the community.
We are continuing to invest in many diverse new and ongoing programs over the next two years:
Public safety: Besides adding police officers, we are investing in community paramedicine, such
as our community paramedic; neighborhood police officers; and camp clean ups in our woods
and parks.

Mayor's Budget Message
City of Bellingham Page 6 2017-18 Preliminary Biennial Budget
Economy: We are investing in a retail strategy for downtown to keep our storefronts occupied,
as well as urban village implementation and incentive programs for growing our businesses. Our
work on the waterfront will support high-paying jobs and preserve industrial uses.
Environment: I'm excited to support all of the Energy Year efforts going on in Bellingham,
including competing in the $5 million Georgetown Energy Prize, installing LED streetlights
throughout the city, and putting solar panels on my roof. The City is also working to protect our
watersheds through programs such as the Homeowner Incentive Program, which provides
assistance to Lake Whatcom Watershed residents to help reduce runoff into our drinking water
supply, and the award-winning Squalicum Creek reroute project, which improves water quality
and habitat
Social services: The City continues to invest in the health and well-being of our community. With
the help of the voter-approved Bellingham Housing Levy, we're able to produce more supported
and affordable housing. We have also been providing a homeless outreach team and crisis
management.
Transportation and infrastructure: We have several important transportation projects,
including extending Orchard Street under the freeway to the Irongate area to decrease
congestion, construction of Granary Avenue to provide access to the central waterfront, and a
new state-of-the-art drinking water pretreatment plant. We're also investing in internal City
infrastructure, including replacing a 25-year-old financial system.
Parks and trails: Several important parks are slated for development in the next two years,
including the Cordata Community Park and the first park on the central waterfront along
Whatcom Waterway. The Bay to Baker Trail is also under construction.
These projects and programs are just a few of the many that the City will be working on in the next two
years. To do all of this important work, the City employs around 1,200 full- and part-time employees.
Salaries and benefits account for more than 70 percent of our general fund expenses, and our
employees are also our greatest asset. Through working with our bargaining groups, I am pleased that
we've reached agreements on all of our open labor contracts.
While the City is doing a lot, we can't do this alone, which is why our partnerships are so important. We
continue to work with Whatcom County and the Port of Bellingham on a joint legislative agenda, which
allows us to have a unified voice in Olympia on transportation and infrastructure, environmental clean
ups, housing and mental health investments. We are also working together on jail funding and
alternatives, our emergency medical services and protecting Lake Whatcom. Our community's
nonprofits and private companies are also key partners that allow us to expand our ability to provide a
wide range of essential services to our residents.

Mayor's Budget Message
City of Bellingham 2017-18 Preliminary Biennial Budget Page 7
Local governments across the country continue to struggle with balancing their budgets as expenses
grow faster than revenue, even as our economy continues to recover from the recession. This creates
unique challenges for our city. Key investments in services, programs and infrastructure continue to
position us well into the future, and although we must be careful and prudent as we move forward, I am
cautiously optimistic.
Thank you for your consideration of this budget proposal, and I look forward to working with you in the
months ahead.
Mayor Kelli Linville

City Organization and Directory
City of Bellingham Page 8 2017-18 Preliminary Biennial Budget
City Structure and Services
Services Provided by the City
The City provides a full range of municipal services that include public safety, culture and recreation
activities, economic development, street and multi-modal transportation infrastructure, parking,
utilities, and general administrative services.
Activities owned and / or operated by the City include water, wastewater, and storm water utilities;
municipal parking facilities; Lake Padden Golf Course; Bayview Cemetery; Whatcom Museum of History
and Art; Bellingham Public Library and Fairhaven Branch Library; nearly 100 parks; a civic stadium;
athletic fields, and the Arne Hannah Aquatic Center. The City, through a contract with Whatcom
County, operates Medic One units that provide emergency medical services in Bellingham and portions
of the county.
Organizational Structure
The City's charter establishes a council-mayor form of government. City management is led by the
elected Mayor in a strong-Mayor, weak-Council form of government. Six council members are elected
by wards and serve four-year terms. Three are elected every two years. The seventh council member is
elected every two years in an at-large capacity. The Mayor is elected for a four-year term.
State statute provides for an elected Municipal Court Judge. The Judge is elected for a four-year term at
the mid-point of the Mayor’s term of office.
The administrative department heads are appointed by and serve at the Mayor’s discretion, with the
following exceptions: The City Attorney and Finance Director require approval of the City Council for
appointment or removal, and the Library Director is appointed by the Library Board.
The City of Bellingham is structured into departments, which may be further divided into operating
divisions. Each department or division is broken down into its functional units or groups. The City
organization chart, on the following page, shows the elected officials, operating departments and some
of the citizen boards, committees, and commissions that assist the City to function.
The City also administers the Bellingham - Whatcom Public Facilities District.

City Organization and Directory
City of Bellingham 2017-18 Preliminary Biennial Budget Page 9
City Organization Chart
The City enlists volunteer boards and commissions to serve our community by advising policy makers.
For a complete list of Boards and Commissions, including current vacancies, visit the Bellingham Mayor’s
web page.

City Organization and Directory
City of Bellingham Page 10 2017-18 Preliminary Biennial Budget
Elected Officials
Kelli Linville, MAYOR Mayor's Office ........................................................................................................................ (360) 778-8100
Deputy Administrator, Brian Heinrich
Communications Director, Vanessa Blackburn
Email ........................................................................................................................... [email protected]
Debra Lev, MUNICIPAL COURT JUDGE Bellingham Municipal Court .................................................................................................. (360) 778-8150
2016 CITY COUNCIL
Council Office ......................................................................................................................... (360) 778-8200
Email ...................................................................................................................................... [email protected]
April Barker ....................................................................................................................................... 1st Ward
Gene Knutson .................................................................................................................................. 2nd Ward
Daniel Hammill ................................................................................................................................. 3rd Ward
Pinky Vargas ..................................................................................................................................... 4th Ward
Terry Bornemann ............................................................................................................................. 5th Ward
Michael Lilliquist .............................................................................................................................. 6th Ward
Roxanne Murphy ............................................................................................................................... At-Large
Biographical, contact information and committee assignments for council members can be found on
line. Also visit the Council web page for updated meeting announcements and schedules, meeting
agendas and minutes, and to view or hear recorded meetings. Meeting agendas, dates and times may
also be confirmed by calling the City Council office at (360) 778-8200.

City Organization and Directory
City of Bellingham 2017-18 Preliminary Biennial Budget Page 11
Administrative Department Heads
Police Chief, Clifford Cook ..................................................................................................... (360) 778-8600
Fire Chief, Bill Newbold ......................................................................................................... (360) 778-8400
Court Administrator, Darlene Peterson ................................................................................ (360) 778-8150
Parks and Recreation Director, Leslie Bryson ....................................................................... (360) 778-7000
Library Director, Pamela Kiesner ........................................................................................... (360) 778-7220
Museum Director, Patricia Leach .......................................................................................... (360) 778-8930
Planning and Community Development Director, Rick Sepler ............................................ (360) 778-8300
Hearing Examiner (contracted / Sharon Rice, pro-tem) ........................................................ (360) 778-8399
Human Resources (Finance Director and Deputy Administrator, jointly) ............................. (360) 778-8220
Finance Director, Brian Henshaw .......................................................................................... (360) 778-8010
Information Technology Services Department Director, Marty Mulholland ....................... (360) 778-8050
City Attorney, Peter Ruffatto ................................................................................................ (360) 778-8270
Public Works Director, Ted Carlson ...................................................................................... (360) 778-7900

Budget Overview
City of Bellingham Page 12 2017-18 Preliminary Biennial Budget
Budget Overview
Preparing the Budget
The Bellingham City Council adopted ordinance 2014-06-034, changing the City from an annual budget
cycle to a biennial budget cycle, beginning with the 2015-2016 biennium.
Preparation of the City’s budget is governed by the City Charter and Revised Code of Washington (RCW),
Chapter 35.34. The deadlines in the following narrative describe the state minimum requirements.
Amending the Budget
City Council can, by ordinance, increase or decrease the appropriations in any fund. Transfer of
appropriations within a single fund or within any single department in the General Fund can be made
with the Mayor’s authorization. Transfer of appropriations between funds or between departments in
the General Fund requires Council approval.
All appropriations in any fund lapse at the end of the biennium. Amounts authorized during the
biennium to pay for goods and services not received or completed by the end of that biennium may be
re-appropriated to the next biennium by ordinance.
Budget Control
The Finance Director presents a quarterly report to the Mayor and City Council, which compares
estimated and actual revenues and expenses to date. If revenues appear to be less than anticipated,
City Council may reduce appropriations by ordinance, to keep expenditures within the available
resources and to maintain appropriate reserves.

Budget Overview
City of Bellingham 2017-18 Preliminary Biennial Budget Page 13
Fund Type Descriptions and Accountability
The structure of the City’s accounting follows the system prescribed by the Budgeting, Accounting, and
Reporting System (BARS) required by the State of Washington.
Governmental Funds are generally used to account for tax supported activities. There are five different
types of governmental funds: the General Fund, Special Revenue Funds, Debt Service Funds, Capital
Projects Funds, and Permanent Funds.
Proprietary Funds focus on determination of operating income, changes in net assets (or cost recovery),
financial position, and cash flows. There are two types: Enterprise Funds and Internal Service Funds.
Discrete Component Units are legally separate municipal corporations for which the city is accountable.
These units have separate funds, and financial data is reported separately from the financial data of the
primary government.
The table on the following pages provides definitions of the fund types, and lists the individual funds.
The Mayor is ultimately responsible for all expenditures of City government, with day-to-day
responsibility for fund management delegated to Department Heads. In most cases, a specific
department has responsibility for a fund. More than one department may draw on the resources of the
General Fund and other shared funds. The table on the following pages demonstrates these
relationships. Funds with *Shared Budgetary Responsibility; Finance balances the fund and manages
reserves.
Fund # Fund Name Budgetary Responsibility
001 - General Fund: To account for financial resources not accounted for in other funds. The primary operating fund of the City, it supports general government activities, public safety, recreation, and planning and community development.
1 General Fund *Shared by most departments
100s - Special Revenue Funds: To account for the proceeds of specific revenue sources that are restricted or committed to expenditure for specific purposes other than debt service or capital.
111 Street Fund Public Works
113 Paths and Trails Reserve Fund Public Works
125 Federal Building Fund Public Works
126 Library Gift Fund Library
131 Olympic Pipeline Incident Fund Public Works
134 Olympic-Whatcom Falls Park Addition Fund Parks and Recreation
136 Environmental Remediation Fund *Shared by departments
141 First 1/4% Real Estate Excise Tax (REET) Fund *Shared by most departments
142 Second 1/4% REET Fund *Shared by most departments
151 Police Federal Equitable Sharing Fund Police
152 Asset Forfeiture/Drug Enforcement Fund Police

Budget Overview
City of Bellingham Page 14 2017-18 Preliminary Biennial Budget
Fund # Fund Name Budgetary Responsibility
153 Criminal Justice Fund Police
160 Public Safety Dispatch Fund Police and Fire
161 Transportation Benefit District Fund Finance
162 Public Ed & Govt. Access TV Fund Information Technology Services
163 Restricted Equipment – PEG PEG subfund for restricted revenues
173 Greenways III Fund Parks and Recreation
177 Park Impact Fee Fund Parks and Recreation
178 Sportsplex Fund Parks and Recreation
180 Tourism Fund Planning & Community Development
181 Low Income Housing Fund Planning & Community Development
190 Community Development Block Grant Fund Planning & Community Development
191 Home Investment Partnership Grant Fund Planning & Community Development
200s - Debt Service Funds: To account for financial resources that are restricted, committed or assigned for payment of principal and interest. Also to account for the accumulation of resources and payment of general long-term debt, principal, and interest.
211-235 General Obligation Debt Service Funds Finance
245 Local Improvement District (LID) Guaranty Fund
Finance
300s - Capital Projects Funds: To account for financial resources that are restricted, committed, or assigned for the acquisition or construction of major capital facilities or other capital assets, excluding those financed by proprietary funds or for assets that will be held in trust for others.
371 Waterfront Construction Fund *Shared by departments
400s - Enterprise Funds: To account for operations that are normally financed and operated similar to a private business, in which a fee is charged to external users for goods or services.
410 Water Fund Public Works
411 Watershed Subfund of Water Fund for Watershed
420 Wastewater Fund Public Works
421 Wastewater LID Spec Assess Wastewater subfund for LIDs
430 Storm and Surface Water Utility Fund Public Works
440 Solid Waste Fund Public Works
456 Cemetery Fund Parks and Recreation
460 Golf Course Fund Parks and Recreation
465 Parking Services Fund Public Works
470 Medic One Fund Fire
475 Development Services Fund Planning & Community Development
500s - Internal Service Funds: To account for the financing of goods or services provided by one department to another department, or to other governments, on a cost-reimbursement basis.
510 Fleet Administration Fund Public Works
511 Radio Communications Subfund of Fleet Fund for radio communication operation

Budget Overview
City of Bellingham 2017-18 Preliminary Biennial Budget Page 15
Fund # Fund Name Budgetary Responsibility
520 Purchasing & Materials Management Fund Public Works
530 Facilities Administration Fund Public Works
540 Telecommunication and Technology Fund Information Technology Services
541 Technology Replacement & Reserve Tech Replacement subfund
542 Computer Infrastructure Computer Replacement subfund
543 GIS Administration GIS Internal Services subfund
550 Claims and Litigation Fund Legal
561 Unemployment Compensation Fund Human Resources
562 Workers’ Compensation Fund Human Resources
565 Health Benefits Fund Human Resources
570 PW Admin and Engineering Fund Public Works
600s - Trust and Agency Funds: To account for resources that are required to be held in trust for the members and beneficiaries of defined benefit pension plans, defined contribution plans, and other employee benefit plans.
612 Firefighters Pension and Benefit Fund Human Resources
613 Police Officers Pension and Benefit Fund Human Resources
700s - Permanent Funds: To account for resources with legally restricted principal. Earnings on the principal may be used for designated programs.
701 Beyond Greenways Endowment Fund Parks and Recreation
702 Natural Resource Protection and Restoration Fund
Public Works
900s - Discrete Component Units: To account for legally separate organizations for which the city is legally or financially accountable.
965 Public Facilities District Fund PFD Board of Directors

Budget Overview
City of Bellingham Page 16 2017-18 Preliminary Biennial Budget
Changes in Estimated Reserve Balances Report
For each fund, estimated reserves at the start of the biennium, total budgeted revenues for the
biennium, total budgeted expenditures for the biennium, estimated ending reserve balances, and the
resulting estimated percentage and dollar change to the reserve balance for the biennium.
Fund Number and Name
(page 1 of 2)
Estimated
Beginning
Reserves
2017-18
Biennium
Revenues
2017-18
Biennium
Expenditures
Estimated
Ending
Reserves
Change in
Est. Ending
Balance
Percent
Change
001 General Fund 17,000,000 155,626,943 157,529,952 15,096,991 (1,903,009) -11.2%
111 Street Fund 3,820,000 33,938,072 36,025,290 1,732,782 (2,087,218) -54.6%
113 Paths & Trails Reserve Fund 82,232 16,028 1,003 97,257 15,025 18.3%
125 Federal Building Fund 758,507 705,180 1,463,687 - (758,507) -100.0%
126 Library Gift Fund 5,000 100,000 100,305 4,695 (305) -6.1%
131 Olympic Pipeline Incident Fund 482,225 10,944 92,813 400,356 (81,869) -17.0%
134 Olympic - Whatcom Fall Pk Addl Fund 242,248 - 1,052 241,196 (1,052) -0.4%
136 Environmental Remediation Fund 1,343,106 3,628,783 4,628,393 343,496 (999,610) -74.4%
141 1st 1/4% REET Fund 722,030 2,883,452 2,641,832 963,650 241,620 33.5%
142 2nd 1/4% REET Fund 2,018,077 5,658,480 5,157,853 2,518,704 500,627 24.8%
151 Police Federal Equitable Share Fund 96,995 103,378 146,818 53,555 (43,440) -44.8%
152 Asset Forfeiture /Drug Enforce. Fund 19,496 51,348 53,521 17,323 (2,173) -11.1%
153 Criminal Justice Fund 236,400 779,568 756,683 259,285 22,885 9.7%
160 Public Safety Dispatch Fund 1,584,384 11,505,999 10,990,117 2,100,266 515,882 32.6%
161 Transportation Benefit Dist Fund 2,787,961 9,503,178 11,322,847 968,291 (1,819,670) -65.3%
162 Publ Educ & Gov Acc TV Fund 648,000 636,502 1,177,450 107,052 (540,948) -83.5%
163 Restricted Equipment/PEG Fund 400,000 223,038 295,000 328,038 (71,962) -18.0%
173 Greenways III Fund 7,000,000 915,630 6,208,295 1,707,335 (5,292,665) -75.6%
177 Park Impact Fund 4,266,269 914,954 2,688,630 2,492,593 (1,773,676) -41.6%
178 Sportsplex Fund 46,343 3,210 - 49,553 3,210 6.9%
180 Tourism Fund 500,000 3,085,409 3,389,575 195,833 (304,167) -60.8%
181 Low Income Housing Fund 2,500,000 6,027,546 8,506,581 20,965 (2,479,035) -99.2%
190 Community Development Block Grant Fund - 3,202,018 3,202,019 - - 0.0%
191 Home Investment Partnership Grant Fund - 3,092,319 3,092,318 - - 0.0%
224 2004 Sportsplex Acq. LTGO Fund 24,500 578,074 533,126 69,448 44,948 183.5%
225 2004 PFD/Civic Field LTGO Fund - 2,751,411 2,751,826 (415) (415) 0.0%
226 2011 QEC Bond Fund 2,425,000 757,334 - 3,182,334 757,334 31.2%
227 2016 PFD Refunding Bonds Fund - 819,076 819,076 - - 0.0%
231 Drake Note Fund - 35,928 35,928 - - 0.0%
235 Governmental Debt Service Fund - 1,345,800 1,345,800 - - 0.0%
245 LID Guaranty Fund 506,000 5,682 500,000 11,682 (494,318) -97.7%
371 Waterfront Construction #1 Fund 3,900,000 2,372,226 500,000 5,772,226 1,872,226 48.0%
410 Water Fund 7,765,854 69,558,632 44,453,503 32,870,984 25,105,130 323.3%
411 Watershed Fund 2,302,117 10,750,589 12,031,955 1,020,751 (1,281,366) -55.7%
420 Wastewater Fund 16,187,907 47,372,196 54,677,098 8,883,005 (7,304,902) -45.1%
430 Storm Surface Water Util ity Fund 3,094,191 19,375,587 22,059,226 410,552 (2,683,639) -86.7%
440 Solid Waste Fund 6,438,180 7,113,396 5,698,813 7,852,763 1,414,583 22.0%
456 Cemetery Fund 240,115 1,074,250 1,121,061 193,304 (46,811) -19.5%
460 Golf Course Fund 257,605 344,932 235,474 367,063 109,458 42.5%
465 Parking Services Fund 1,324,613 4,733,225 4,695,002 1,362,836 38,223 2.9%
470 Medic One Fund 1,609,793 13,811,150 13,903,270 1,517,673 (92,120) -5.7%
475 Development Services Fund 3,256,709 5,102,100 6,434,513 1,924,296 (1,332,413) -40.9%

Budget Overview
City of Bellingham 2017-18 Preliminary Biennial Budget Page 17
Balanced Budget
Beginning Reserves + Revenues = Expenditures + Ending Reserves
In order to keep the equation in balance, any change in one of these components must be offset by an
equal change to the other side of the equation.
Reserves
For budget preparation and monitoring purposes, the City uses reserves rather than fund balances. The
reserve concept is used because it better defines the resources expected to be available at the
beginning of the year for expenditures. Ending reserves also better define what will be left at year-end
for use in the following year. The City defines budgetary reserves as the difference between:
assets that can reasonably be expected to be available for use within the year or shortly thereafter, and
liabilities that can reasonably be expected to be extinguished during the year.
Fund Number and Name
(Page 2 od 2)
Estimated
Beginning
Reserves
2017-18
Biennium
Revenues
2017-18
Biennium
Expenditures
Estimated
Ending
Reserves
Change in
Est. Ending
Balance
Percent
Change
510 Fleet Administration Fund 6,918,477 7,519,356 11,625,456 2,812,376 (4,106,101) -59.3%
511 Radio Communications Fund 353,437 3,466,162 3,209,892 609,707 256,270 72.5%
520 Purchasing Material Management Fund 163,037 7,325,942 7,177,486 311,493 148,456 91.1%
530 Facilities Administration Fund 356,491 10,964,670 11,112,664 208,498 (147,993) -41.5%
540 Tech and Telecom Fund 233,000 867,526 919,041 181,484 (51,516) -22.1%
541 Technology Repl and Reserve Fund 905,000 3,721,629 4,187,581 439,049 (465,951) -51.5%
542 Computer Infrastructure Repl Fund 250,000 1,559,892 1,641,258 168,634 (81,366) -32.5%
543 GIS Administration Fund 93,664 677,826 770,957 534 (93,130) -99.4%
550 Claims, Lit & Prop Loss Fund 4,754,013 2,310,944 2,425,488 4,639,470 (114,543) -2.4%
561 Unemployment compensation Fund 370,000 251,254 359,788 261,466 (108,534) -29.3%
562 Workers Comp Self-Insurance Fund 812,746 1,218,986 1,554,563 477,169 (335,577) -41.3%
565 Health Benefits Fund 2,100,000 30,370,751 31,860,398 610,353 (1,489,647) -70.9%
570 PW Admin & Engineering Fund 27,114 15,178,771 15,160,779 45,105 17,991 66.4%
612 Firefighter's Pensions Fund 9,800,000 5,306,610 3,740,215 11,366,395 1,566,395 16.0%
613 Police Officer's Pensions Fund 7,000,000 2,857,206 2,118,500 7,738,706 738,706 10.6%
701 Greenways Maintenance Endowmnt Fund 2,648,341 724,614 15,175 3,357,780 709,439 26.8%
702 Nat Res Protect & Restore Fund 3,000,000 371,053 513,011 2,858,043 (141,957) -4.7%
965 Public Facilities District Fund 1,650,000 2,801,588 3,447,067 1,004,521 (645,479) -39.1%
Grand Total 137,327,177 528,008,347 533,107,024 132,228,501 (5,098,676) -3.7%

Budget Overview
City of Bellingham Page 18 2017-18 Preliminary Biennial Budget
Summary of Estimated Revenues, Expenditures and Reserves by Account Type and Fund Type
Citywide biennial budget summarized by revenue and expenditure type for the General Fund, and for other funds aggregated by fund type.
General Special Debt Construction Enterprise Internal Pension Permanent PFD All Funds
Fund Revenue Funds Funds Funds Service Trust Funds Funds
BEGINNING RESERVE BALANCE 17,000,000 29,559,273 2,955,500 3,900,000 42,477,084 17,336,979 16,800,000 5,648,341 1,650,000 137,327,177
TAXES 126,939,334 39,784,675 - 2,071,306 4,039,812 1,460,000 4,030,000 - 2,750,000 181,075,127
LICENSES AND PERMITS 1,845,300 749,220 - - 2,797,472 - - - - 5,391,992
INTERGOVERNMENTAL REVENUE 5,635,916 30,040,230 - - - 507,758 240,000 - - 36,423,904
CHARGES FOR GOODS AND SERVICES 16,353,895 11,385,841 746,536 - 118,115,981 46,015,312 - - - 192,617,565
FINES AND PENALTIES 2,021,238 - - - 1,505,844 - - - - 3,527,082
MISCELLANEOUS REVENUE 1,541,260 1,325,070 2,639,446 50,920 5,671,693 33,850,171 3,449,816 164,335 51,588 48,744,299
GAINS LOSSES AND CAPITAL CONTRIB - PROP/TRST - - - - 1,256,789 - - - - 1,256,789
NON REVENUES - - 195,020 - - - 444,000 931,332 - 1,570,352
OTHER FINANCING SOURCES 1,290,000 3,700,000 2,712,303 250,000 45,848,467 3,600,468 - - - 57,401,238
TOTAL REVENUE 155,626,943 86,985,036 6,293,305 2,372,226 179,236,058 85,433,709 8,163,816 1,095,667 2,801,588 528,008,348
NON-EXPENDITURES 5,793,330 4,445,934 500,000 - 4,250,000 1,070,468 - - - 16,059,732
SALARIES AND WAGES 81,114,833 11,435,341 - - 27,806,943 15,870,799 40,706 - - 136,268,622
PERSONNEL BENEFITS 32,339,255 5,165,086 - - 11,735,942 7,362,020 4,102,760 - - 60,705,063
SUPPLIES 4,263,558 2,103,376 - - 8,535,607 7,712,470 98,680 - - 22,713,692
OTHER SERVICES AND CHARGES 29,356,079 41,754,141 - - 61,687,830 47,125,172 1,616,569 528,185 37,354 182,105,330
INTERGOVERNMENTAL SERVICES 4,654,698 240,149 - - 2,902,777 167,202 - - 28,888 7,993,714
CAPITAL OUTLAYS (6000 EXP OBJ) - 36,798,000 - 500,000 33,336,343 12,034,759 - - - 82,669,102
DEBT SERVICE PRINCIPAL - - 3,880,544 - 8,509,683 - - - 1,301,943 13,692,170
DEBT SERVICE INTEREST/COSTS 8,200 - 1,605,212 - 6,544,789 662,460 - - 2,078,882 10,899,543
TOTAL EXPENDITURE 157,529,952 101,942,028 5,985,756 500,000 165,309,914 92,005,351 5,858,715 528,185 3,447,067 533,106,967
Net Surplus/(Deficit) (1,903,008) (14,956,992) 307,549 1,872,226 13,926,143 (6,571,642) 2,305,101 567,481 (645,479) (5,098,619)
ESTIMATED ENDING RESERVE BALANCE 15,096,993 14,602,226 3,263,049 5,772,226 56,403,226 10,765,337 19,105,101 6,215,823 1,004,521 132,228,503

Budget Overview
City of Bellingham 2017-18 Preliminary Biennial Budget Page 19
Account Type Category Definitions
The following account categories are used throughout the budget document.
Revenue Types
Taxes: Compulsory charges levied by a government for the purpose of financing services performed for
the common benefit. This does not include specific charges made against particular persons or property
for current or permanent benefits such as special assessments, or charges for services rendered only to
those who pay for and use those services. Examples include Property, Sales, Utility, and Business Taxes.
Licenses and Permits: Charges for issuance of licenses and permits such as business licenses or building
permits. Does not include inspection charges, which are classified as services charges.
Intergovernmental Revenue: This revenue includes grants, entitlements, shared revenues, and
payments for goods and services provided by one government to another. One example is Community
Development Block Grants provided to the City from the Federal Government.
Goods and Services Charges: Charges for services rendered or goods sold by the city except to other
governments. Examples include water service, sewer service, and Medic One service.
Fines and Forfeitures: Fines are monetary judgments commonly imposed by the court; forfeitures are
penalties by which one loses rights and interest in property because of commission of an offense or
nonperformance of an obligation or duty. Examples include penalties collected for parking and traffic
tickets.
Miscellaneous Revenues: Includes operating revenues not classified elsewhere such as interest income,
rental income, and contributions from private sources.
Non-Revenues: These revenues are for items such as interfund loans and proceeds of long-term debt
for proprietary funds.
Other Financing Sources: These are changes in current financial resources that are reported separately
from revenues to avoid distorting revenue trends. Examples include sale of GO Bonds, proceeds from
the disposition of capital assets, and transfers.
Expenditure Types
Salaries and Wages: Expenditure category that includes amounts paid for services rendered by
employees in accordance with rates, hours, terms and conditions authorized by law or stated in
employment contracts. This category also includes overtime and temporary labor.
Benefits: Those benefits paid by the City as part of the conditions of employment. Examples include
health insurance, social security, and retirement system contributions.
Supplies: A basic classification of expenditures for articles and commodities purchased for consumption
or resale. Examples include office and operating supplies, fuel, inventory or resale items, small tools and
equipment. Includes Interfund purchases of materials and supplies from the Warehouse.

Budget Overview
City of Bellingham Page 20 2017-18 Preliminary Biennial Budget
Other Services and Charges: A basic classification for services other than personnel. Examples include
professional services, communication, travel, advertising, utilities, and insurance. Includes interfund
charges for services from other City funds.
Intergovernmental Services: Purchases of specialized services typically performed by local
governments. An example of this is jail services purchased from Whatcom County. Interfund Transfers,
or transfers within the City from one fund to another are also included in this category.
Capital Outlay: Expenditures for acquisition of, addition to, or qualifying improvements to assets such
as land, buildings, machinery and equipment. Improvement projects that extend the life of a building
such as re-roofing may also qualify. The cost threshold for such expenditures to be classified as capital is
designated by the City’s accounting department and currently ranges from $5,000 to $50,000,
depending on the asset category.
Debt Service: Payment of interest and principal to holders of the City’s indebtedness. Includes both
loan advances and loan payments from one fund to another fund within the City. Includes loan
advances of intergovernmental loans.

Budget Overview
City of Bellingham 2017-18 Preliminary Biennial Budget Page 21
Citywide Expenditures by Sub Type for All Funds
More detailed categories of expenditures, citywide.
EXPENDITURE TYPE
2013 Actual 2014 Actual 2015 Actual
2016 Revised
Budget
2017
Preliminary
Budget
2018
Preliminary
Budget
INVENTORY USED AND ADJUSTMENTS 717,804 (65,743) 239,960 - -
BAD DEBT EXPENSE - - 75,478 - - -
TRANSFERS OUT 7,640,149 6,706,742 5,410,319 5,045,246 7,092,203 7,723,529
INTERFUND LOANS PRINCIPAL 939,275 962,870 2,058,195 1,565,163 622,000 622,000
NON-EXPENDITURES 9,297,228 7,603,869 7,783,953 6,610,409 7,714,203 8,345,529
SALARIES AND WAGES 55,812,942 55,627,405 56,698,162 64,179,522 65,102,991 67,151,189
OVERTIME AND HAZARD DUTY 1,844,340 2,271,411 2,781,500 1,915,239 1,997,721 2,016,721
SALARIES AND WAGES 57,657,283 57,898,816 59,479,662 66,094,761 67,100,712 69,167,910
PERSONNEL BENEFITS 22,968,751 22,442,891 22,591,586 26,275,677 27,477,481 29,144,982
PENSION & DISABILITY PAYMENTS 2,467,816 2,350,764 1,829,234 3,373,800 1,990,800 2,091,800
PERSONNEL BENEFITS 25,436,567 24,793,655 24,420,820 29,649,477 29,468,281 31,236,782
OFFICE AND OPERATING SUPPLIES 5,078,113 5,458,163 5,254,290 6,094,807 6,054,216 5,847,115
FUEL CONSUMED 741,276 686,928 501,430 760,922 731,280 735,751
PURCHASES FOR RESALE 886,404 1,408,048 1,153,679 2,314,166 2,102,764 2,133,664
SMALL TOOLS AND MINOR EQUIPMENT 1,512,923 1,585,326 1,899,980 1,600,146 1,611,155 1,597,199
WAREHOUSE 1,559,633 1,310,499 1,335,571 1,623,049 1,053,469 847,109
SUPPLIES 9,778,348 10,448,964 10,144,950 12,393,090 11,552,884 11,160,838
PROFESSIONAL SERVICES 34,461,882 40,429,585 42,395,783 48,428,844 46,246,397 47,841,204
COMMUNICATION 2,753,507 799,397 998,937 2,286,262 1,160,477 1,163,956
TRAVEL 195,811 265,713 224,425 351,914 399,270 380,456
TAXES & OPERATING ASSESSMENTS 7,888,393 8,282,078 8,765,642 8,713,808 8,716,293 8,846,764
OPERATING RENTALS AND LEASES 4,580,844 6,053,274 6,442,376 6,447,270 7,578,160 7,896,431
INSURANCE 1,755,591 1,722,607 1,680,400 1,696,647 1,738,369 1,738,369
UTILITY SERVICE 4,456,854 4,823,227 4,645,858 5,075,022 4,713,893 4,770,897
REPAIRS & MAINTENANCE 8,154,063 8,490,047 13,658,733 17,103,791 16,684,981 9,570,625
MISCELLANEOUS 2,345,659 3,400,934 4,757,152 6,529,931 7,442,394 5,216,419
OTHER SERVICES AND CHARGES 66,592,603 74,266,859 83,569,306 96,633,489 94,680,234 87,425,121
INTERGOVERNMENTAL PROF SERVS 5,247,761 5,885,067 5,371,620 4,692,792 3,987,268 4,006,446
INTERGOVERNMENTAL PAYMENTS 1,176,877 - - - - -
INTERGOVERNMENTAL SERVICES 6,424,638 5,885,067 5,371,620 4,692,792 3,987,268 4,006,446
LAND 3,057,930 1,812,024 8,398,174 1,753,596 3,944,800 1,464,400
BUILDINGS AND STRUCTURES 20,105 74,750 - 1,825,000 1,000,000 2,500,000
OTHER IMPROVEMENTS 8,622,942 6,404,686 22,349,968 29,619,060 13,450,000 11,723,000
MACHINERY AND EQUIPMENT 1,326,332 2,706,216 5,443,599 8,056,647 7,124,151 5,797,858
CONSTRUCTION OF FIXED ASSETS 41,006,856 16,205,247 6,578,191 43,666,235 17,774,386 17,890,507
CAPITAL OUTLAYS (6000 EXP OBJ) 54,034,165 27,202,921 42,769,932 84,920,538 43,293,337 39,375,765
GENERAL OBLIGATION BONDS 1,450,000 1,935,000 1,570,000 1,649,705 1,760,000 2,055,000
REVENUE BONDS 1,930,000 1,995,000 6,048,328 1,920,000 3,310,500 3,385,500
SPECIAL ASSESSMENT BONDS 75,000 - - - - -
OTHER NOTES 269,450 270,117 3,039,392 567,577 855,667 922,075
INTERGOVERNMENTAL LOANS 397,520 534,237 497,717 540,218 582,840 820,588
DEBT SERVICE PRINCIPAL 4,121,970 4,734,354 11,155,437 4,677,500 6,509,007 7,183,163
INTEREST ON INTERFUND DEBT 62,650 66,577 34,187 12,995 5,100 3,100
INTEREST ON LT EXTERNAL DEBT 4,697,228 5,081,741 4,848,124 5,474,211 5,447,309 5,440,884
DEBT ISSUE COSTS 153,777 13,336 92,324 - - -
DEBT REGISTRATION COSTS 3,872 3,033 4,901 1,575 1,575 1,575
OTHER INTEREST AND DEBT SVC COSTS 8,000 - - - - -
DEBT SERVICE INTEREST/COSTS 4,925,527 5,164,687 4,979,536 5,488,781 5,453,984 5,445,559
TOTAL EXPENDITURE 238,268,330 217,999,191 249,675,217 311,160,837 269,759,910 263,347,112

Fund Budgets
City of Bellingham Page 22 2017-18 Preliminary Biennial Budget
Fund Budgets
General Fund
The primary operating fund of the City, used to support general government, public safety, culture and
recreation, and planning and community development.
001 General Fund ACTUAL ACTUAL ACTUAL REVISED PRELIMINARY PRELIMINARY
FY2013 FY2014 FY2015 FY2016 FY2017 FY2018
BEGINNING RESERVE BALANCE 16,200,070 17,069,127 17,725,097 18,137,940 17,000,000 16,291,508
TAXES 54,881,640 56,651,279 59,630,988 59,915,939 62,659,167 64,280,167
LICENSES AND PERMITS 801,609 722,435 852,969 910,571 922,400 922,900
INTERGOVERNMENTAL REVENUE 1,193,343 1,845,125 1,628,320 1,669,942 2,806,718 2,829,198
CHARGES FOR GOODS AND SERVICES 7,600,135 8,529,237 8,473,706 8,282,851 8,167,496 8,186,399
FINES AND PENALTIES 1,159,922 1,071,566 985,826 1,118,880 1,010,619 1,010,619
MISCELLANEOUS REVENUE 813,493 833,491 1,031,594 734,008 770,630 770,630
OTHER FINANCING SOURCES 1,272,053 290,000 150,000 150,000 640,000 650,000
TOTAL REVENUE 67,722,195 69,943,133 72,753,403 72,782,191 76,977,030 78,649,913
NON-EXPENDITURES 3,280,212 4,353,123 2,865,013 2,865,607 2,871,665 2,921,665
SALARIES AND WAGES 33,908,901 33,972,841 35,198,236 39,497,002 39,934,195 41,180,638
PERSONNEL BENEFITS 13,504,624 13,206,567 13,262,540 14,905,620 15,733,571 16,605,684
SUPPLIES 2,166,893 2,126,675 2,031,385 2,312,026 2,160,444 2,103,114
OTHER SERVICES AND CHARGES 10,922,410 12,067,530 12,775,897 14,449,873 14,653,200 14,702,879
INTERGOVERNMENTAL SERVICES 2,900,226 3,222,431 2,469,477 2,419,011 2,327,349 2,327,349
CAPITAL OUTLAYS (6000 EXP OBJ) 220,308 637,498 1,503,982 1,659 - -
DEBT SERVICE INTEREST/COSTS 14,651 21,850 8,293 6,495 5,100 3,100
TOTAL EXPENDITURE 66,918,226 69,608,514 70,114,825 76,457,293 77,685,523 79,844,429
Net Surplus/(Deficit) 803,969 334,619 2,638,578 (3,675,102) (708,493) (1,194,515)
ESTIMATED ENDING RESERVE BALANCE 17,004,039 17,403,746 20,363,675 14,462,838 16,291,507 15,096,993
001 General Fund ACTUAL ACTUAL ACTUAL REVISED PRELIMINARY PRELIMINARY
Expenditures by Department FY2013 FY2014 FY2015 FY2016 FY2017 FY2018
D000 GF - Shared and Non-Departmental 4,503,559 5,754,957 3,795,997 4,367,902 4,155,444 4,205,444
D110 GF - Mayor 1,016,648 1,143,410 860,919 874,208 927,147 955,014
D120 GF - City Council 476,973 457,770 492,697 551,845 571,843 584,472
D170 GF - Hearing Examiner 209,973 154,007 73,847 365,291 106,005 107,513
D180 GF - Museum 1,400,143 1,400,335 1,437,398 1,578,060 1,627,237 1,677,173
D190 GF - Library 3,784,429 4,010,206 4,176,841 4,580,213 4,500,742 4,587,681
D210 GF - Finance 2,081,410 1,961,578 2,051,684 2,358,027 2,360,321 2,445,626
D220 GF - Human Resources 1,114,516 1,128,221 1,155,827 1,257,720 1,369,446 1,389,167
D250 GF - Information Technology Services 2,376,596 2,544,315 2,610,134 2,917,559 3,132,405 3,311,715
D260 GF - Legal 1,410,490 1,537,303 1,553,833 1,933,803 1,882,077 1,939,733
D270 GF - Municipal Court 1,776,046 1,928,655 1,932,542 2,221,412 2,157,568 2,215,918
D400 GF - Parks and Recreation 7,353,072 7,195,921 7,220,506 8,127,511 8,295,765 8,511,382
D500 GF - Planning 2,414,491 2,554,475 2,778,004 3,284,333 3,176,767 3,201,495
D700 GF - Fire 14,865,010 15,366,752 16,753,382 17,859,734 18,314,215 18,781,688
D800 GF - Police 22,134,870 22,470,610 23,221,213 24,179,676 25,108,539 25,930,408
General Fund Total Expenditures 66,918,226 69,608,514 70,114,825 76,457,293 77,685,523 79,844,429

Fund Budgets
City of Bellingham 2017-18 Preliminary Biennial Budget Page 23
Street Funds
This report aggregates the Street Fund and the Paths & Trails Reserve Fund.
Street Fund: A special revenue fund designated for maintenance of all City Streets. The fund is
managed by the Public Works Department. Starting in 2015, administration, engineering and technical
functions allocated across all the funds in the department are moved from the Street Fund into a new
internal service fund, the Public Works Admin & Engineering Fund.
Paths and Trails Reserve Fund: Funded by motor vehicle fuel taxes, this special revenue fund is to establish and maintain paths and trails for transportation alternatives and is managed by the Public Works Department.
110 Street Funds ACTUAL ACTUAL ACTUAL REVISED PRELIMINARY PRELIMINARY
Street Fund, Paths & Trails Rsrv Fund FY2013 FY2014 FY2015 FY2016 FY2017 FY2018
BEGINNING RESERVE BALANCE 10,730,699 11,204,362 10,275,454 7,465,946 3,902,232 3,090,034
TAXES 8,449,232 7,838,654 7,745,314 7,725,500 7,800,000 7,850,000
LICENSES AND PERMITS 55,917 70,900 3,410 61,000 61,000 62,220
INTERGOVERNMENTAL REVENUE 4,967,623 4,488,917 8,207,197 14,735,845 8,124,750 7,324,750
CHARGES FOR GOODS AND SERVICES 7,837,044 7,330,664 1,577,118 1,468,180 1,220,157 1,224,029
MISCELLANEOUS REVENUE 256,182 181,426 160,306 239,990 143,597 143,597
OTHER FINANCING SOURCES - - 3,554,473 19,642 - -
TOTAL REVENUE 21,565,998 19,910,562 21,247,818 24,250,157 17,349,504 16,604,596
NON-EXPENDITURES 1,300,650 1,152,056 292,992 588,096 590,949 684,410
SALARIES AND WAGES 5,019,823 4,752,935 1,274,847 1,595,627 1,648,714 1,685,096
PERSONNEL BENEFITS 2,156,534 1,999,297 562,649 711,401 752,002 802,120
SUPPLIES 633,076 610,030 597,256 612,149 599,019 607,941
OTHER SERVICES AND CHARGES 6,666,144 8,709,724 11,376,538 8,765,387 7,396,018 7,354,200
INTERGOVERNMENTAL SERVICES 108,467 65,105 114,631 105,000 105,000 107,825
CAPITAL OUTLAYS (6000 EXP OBJ) 5,165,802 2,976,542 9,041,445 18,606,709 7,070,000 6,623,000
DEBT SERVICE INTEREST/COSTS - - 35,418 - - -
TOTAL EXPENDITURE 21,050,495 20,265,689 23,295,776 30,984,369 18,161,702 17,864,591
Net Surplus/(Deficit) 515,503 -355,127 (2,047,958) (6,734,212) -812,198 (1,259,995)
ESTIMATED ENDING RESERVE BALANCE 11,246,202 10,849,235 8,227,496 731,734 3,090,034 1,830,039

Fund Budgets
City of Bellingham Page 24 2017-18 Preliminary Biennial Budget
Federal Building Fund
Federal Building Fund: A Special Revenue Fund to account for grant revenues and the capital improvements to the Federal Building that these grants fund. Managed by Public Works and Finance. This fund is expected to close in 2017.
Library Gift Fund
Library Gift Fund: Accumulates donations to the Library which are generally used to purchase books
and materials. The fund is managed by the Library.
125 Federal Building Fund ACTUAL ACTUAL ACTUAL REVISED PRELIMINARY PRELIMINARY
FY2013 FY2014 FY2015 FY2016 FY2017 FY2018
BEGINNING RESERVE BALANCE 480,467 432,531 1,919,276 1,721,807 758,507 -
INTERGOVERNMENTAL REVENUE - - - - 700,000 -
MISCELLANEOUS REVENUE 3,973 10,615 8,727 3,828 5,180 -
OTHER FINANCING SOURCES - 1,888,045 1,002,000 80,267 - -
TOTAL REVENUE 3,973 1,898,660 1,010,727 84,095 705,180 -
SUPPLIES - 5,631 48,325 4,687 - -
OTHER SERVICES AND CHARGES 51,909 406,284 2,146,872 307,477 1,463,687 -
TOTAL EXPENDITURE 51,909 411,915 2,195,197 312,164 1,463,687 -
Net Surplus/(Deficit) (47,936) 1,486,745 (1,184,470) (228,069) (758,507) -
ESTIMATED ENDING RESERVE BALANCE 432,531 1,919,276 734,806 1,493,738 - -
126 Library Gift Fund ACTUAL ACTUAL ACTUAL REVISED PRELIMINARY PRELIMINARY
FY2013 FY2014 FY2015 FY2016 FY2017 FY2018
BEGINNING RESERVE BALANCE 44,912 63,739 81,630 45,880 5,000 4,823
INTERGOVERNMENTAL REVENUE 999 3,393 - - - -
MISCELLANEOUS REVENUE 69,942 70,947 57,567 71,000 50,000 50,000
TOTAL REVENUE 70,941 74,340 57,567 71,000 50,000 50,000
SUPPLIES 50,123 48,020 56,426 86,522 50,000 50,000
OTHER SERVICES AND CHARGES 1,990 8,429 4,320 30,000 177 128
TOTAL EXPENDITURE 52,113 56,449 60,747 116,522 50,177 50,128
Net Surplus/(Deficit) 18,827 17,891 (3,179) (45,522) (177) (128)
ESTIMATED ENDING RESERVE BALANCE 63,739 81,630 78,451 358 4,823 4,695

Fund Budgets
City of Bellingham 2017-18 Preliminary Biennial Budget Page 25
Olympic Pipeline Incident Fund
Olympic Pipeline Incident Fund: Accounts for funds dedicated to implementing maintenance and monitoring tasks pursuant to the Olympic Pipeline Whatcom Creek Restoration Plan; the fund is managed by the Public Works Department.
Olympic-Whatcom Falls Park Fund
Olympic Whatcom Falls Park Fund: Accounts for funds from the Olympic Pipeline - Whatcom Falls Addition property settlement; the fund is managed by the Parks and Recreation Department.
131 Olympic Pipeline Incident Fund ACTUAL ACTUAL ACTUAL REVISED PRELIMINARY PRELIMINARY
FY2013 FY2014 FY2015 FY2016 FY2017 FY2018
BEGINNING RESERVE BALANCE 601,643 521,997 504,373 492,653 482,225 441,717
MISCELLANEOUS REVENUE 4,853 4,020 4,383 3,353 5,472 5,472
OTHER FINANCING SOURCES - - 10,110 10,398 - -
TOTAL REVENUE 4,853 4,020 14,493 13,751 5,472 5,472
SALARIES AND WAGES - - 15,418 25,155 10,106 10,645
PERSONNEL BENEFITS - - 5,222 11,207 4,355 4,745
SUPPLIES 16,320 - 3,829 9,820 30,000 30,000
OTHER SERVICES AND CHARGES 66,857 21,643 714 669 1,519 1,443
TOTAL EXPENDITURE 84,499 21,643 25,183 46,851 45,980 46,833
Net Surplus/(Deficit) (79,646) (17,624) (10,690) (33,100) (40,508) (41,361)
ESTIMATED ENDING RESERVE BALANCE 521,997 504,373 493,683 459,553 441,717 400,356
134 Olympic - Whatcom Fall Pk Addl Fund ACTUAL ACTUAL ACTUAL REVISED PRELIMINARY PRELIMINARY
FY2013 FY2014 FY2015 FY2016 FY2017 FY2018
BEGINNING RESERVE BALANCE 265,392 265,204 250,834 242,715 242,248 241,718
MISCELLANEOUS REVENUE 2,326 2,068 2,159 2,198 - -
TOTAL REVENUE 2,326 2,068 2,159 2,198 - -
OTHER SERVICES AND CHARGES 2,514 506 588 587 530 522
CAPITAL OUTLAYS (6000 EXP OBJ) - 15,931 9,690 196,840 - -
TOTAL EXPENDITURE 2,514 16,437 10,279 197,427 530 522
Net Surplus/(Deficit) (188) (14,369) (8,119) (195,229) (530) (522)
ESTIMATED ENDING RESERVE BALANCE 265,204 250,835 242,715 47,486 241,718 241,196

Fund Budgets
City of Bellingham Page 26 2017-18 Preliminary Biennial Budget
Environmental Remediation Fund
Environmental Remediation Fund: A fund created to track costs associated with the environmental cleanup of the South State Street Gas Manufacturing Plant and the R.G. Haley sites.
Real Estate Excise Tax Funds
Real Estate Excise Tax (REET) Funds: Tax revenue collected on the transfer of property that is dedicated
to funding citywide capital projects, as authorized by State Laws. These funds may be used by any
department for the specified legal purposes and are managed by the Finance Department.
136 Environmental Remediation Fund ACTUAL ACTUAL ACTUAL REVISED PRELIMINARY PRELIMINARY
FY2013 FY2014 FY2015 FY2016 FY2017 FY2018
BEGINNING RESERVE BALANCE 1,090,538 392,028 343,109 1,085,039 1,343,106 301,362
INTERGOVERNMENTAL REVENUE 523,780 287,505 292,488 2,730,779 2,416,815 -
MISCELLANEOUS REVENUE 138,928 75,090 170,100 1,207,513 5,984 5,984
OTHER FINANCING SOURCES - 400,000 400,000 400,000 600,000 600,000
TOTAL REVENUE 662,708 762,595 862,589 4,338,292 3,022,799 605,984
SALARIES AND WAGES 4,589 6,271 6,090 4,824 - -
PERSONNEL BENEFITS - - - 1,856 - -
OTHER SERVICES AND CHARGES 1,208,582 674,859 783,427 4,910,091 4,064,543 563,850
INTERGOVERNMENTAL SERVICES 57,765 59,311 83,886 370,360 - -
TOTAL EXPENDITURE 1,270,936 740,441 873,402 5,287,131 4,064,543 563,850
Net Surplus/(Deficit) (608,228) 22,153 (10,813) (948,839) (1,041,744) 42,134
ESTIMATED ENDING RESERVE BALANCE 482,310 414,181 332,296 136,200 301,362 343,496
140 Real Estate Excise Tax Funds ACTUAL ACTUAL ACTUAL REVISED PRELIMINARY PRELIMINARY
141 - 1st Quarter, 142 - 2nd Quarter FY2013 FY2014 FY2015 FY2016 FY2017 FY2018
BEGINNING RESERVE BALANCE 4,861,544 6,143,786 7,345,371 3,848,189 2,740,107 2,476,276
TAXES 2,337,771 2,529,868 3,663,842 2,800,000 2,800,000 2,800,000
INTERGOVERNMENTAL REVENUE 1,197,918 292,923 144,999 20,000 265,000 20,000
CHARGES FOR GOODS AND SERVICES 65 - 32,318 - - -
MISCELLANEOUS REVENUE 49,693 53,765 75,486 46,951 78,466 78,466
OTHER FINANCING SOURCES - - - - - 2,500,000
TOTAL REVENUE 3,585,446 2,876,556 3,916,646 2,866,951 3,143,466 5,398,466
NON-EXPENDITURES 694,225 719,554 1,317,229 636,365 906,355 674,220
SALARIES AND WAGES 60,044 19,544 73,050 28,961 34,611 35,470
PERSONNEL BENEFITS - - - 12,000 14,366 15,378
SUPPLIES 5,858 - - - - -
OTHER SERVICES AND CHARGES 594,476 696,272 357,804 836,833 206,965 167,320
CAPITAL OUTLAYS (6000 EXP OBJ) 950,048 159,652 382,171 1,598,455 2,245,000 3,500,000
TOTAL EXPENDITURE 2,304,650 1,595,021 2,130,254 3,112,614 3,407,298 4,392,387
Net Surplus/(Deficit) 1,280,796 1,281,534 1,786,392 (245,663) (263,832) 1,006,079
ESTIMATED ENDING RESERVE BALANCE 6,142,340 7,425,320 9,131,763 3,602,526 2,476,275 3,482,355

Fund Budgets
City of Bellingham 2017-18 Preliminary Biennial Budget Page 27
Police Special Revenue Funds
The Police Department manages these funds.
(151) Police Federal Equitable Share Fund: Governed by an agreement between the City and the U.S.
Treasury Department that allows the City a share of property or proceeds forfeited to the Federal
Government.
(152) Asset Forfeiture / Drug Enforcement Fund: Proceeds from seizures are held in this fund and used
by the police department for drug enforcement.
(153) Criminal Justice Fund: Funded by State entitlements, this fund supplements staffing costs and
capital equipment purchases.
150 Police Special Revenue Funds ACTUAL ACTUAL ACTUAL REVISED PRELIMINARY PRELIMINARY
151, 152, 153 FY2013 FY2014 FY2015 FY2016 FY2017 FY2018
BEGINNING RESERVE BALANCE 1,145,668 960,402 472,625 422,488 352,891 337,702
INTERGOVERNMENTAL REVENUE 353,125 339,350 390,831 376,634 432,490 432,490
MISCELLANEOUS REVENUE 82,154 94,560 44,590 50,011 34,657 34,657
TOTAL REVENUE 435,279 433,910 435,420 426,645 467,147 467,147
NON-EXPENDITURES 365,000 140,000 - - - -
SUPPLIES 97,652 304,214 278,417 305,921 217,500 266,218
OTHER SERVICES AND CHARGES 157,894 360,142 96,137 92,449 229,836 188,468
CAPITAL OUTLAYS (6000 EXP OBJ) - 122,682 88,818 - 35,000 20,000
TOTAL EXPENDITURE 620,546 927,038 463,373 398,370 482,336 474,686
Net Surplus/(Deficit) (185,267) (493,128) (27,952) 28,275 (15,189) (7,539)
ESTIMATED ENDING RESERVE BALANCE 960,401 467,274 444,673 450,763 337,702 330,163

Fund Budgets
City of Bellingham Page 28 2017-18 Preliminary Biennial Budget
Public Safety Dispatch Fund
Public Safety Dispatch Fund: Accounts for the countywide 9-1-1 emergency dispatch for Fire, Medic One, Sheriff, and Police Departments. The Police Department manages this fund. Police Department and Fire Department use of dispatch funds for the two dispatch centers are shown in the departments’ budget summaries.
160 Public Safety Dispatch Fund ACTUAL ACTUAL ACTUAL REVISED PRELIMINARY PRELIMINARY
FY2013 FY2014 FY2015 FY2016 FY2017 FY2018
BEGINNING RESERVE BALANCE 2,353,562 2,931,306 3,714,220 3,910,607 1,584,384 2,025,523
INTERGOVERNMENTAL REVENUE 1,966,084 2,166,662 1,978,844 1,900,000 1,950,000 1,950,000
CHARGES FOR GOODS AND SERVICES 3,039,265 3,131,233 3,243,726 3,336,580 3,651,760 3,907,501
MISCELLANEOUS REVENUE 27,206 31,737 33,148 16,758 23,369 23,369
TOTAL REVENUE 5,032,555 5,329,631 5,255,719 5,253,338 5,625,129 5,880,870
NON-EXPENDITURES 12,629 - - - - -
SALARIES AND WAGES 2,815,868 2,889,719 3,074,302 3,122,630 3,188,784 3,269,586
PERSONNEL BENEFITS 1,164,521 1,145,995 1,184,452 1,332,301 1,370,988 1,458,847
SUPPLIES 33,562 24,187 39,151 94,177 109,919 94,919
OTHER SERVICES AND CHARGES 390,226 458,423 554,559 538,715 508,299 806,451
INTERGOVERNMENTAL SERVICES 21,324 21,324 21,324 21,324 6,000 21,324
CAPITAL OUTLAYS (6000 EXP OBJ) 45,728 - 87,319 2,745,634 - 155,000
TOTAL EXPENDITURE 4,483,856 4,539,648 4,961,106 7,854,781 5,183,990 5,806,127
Net Surplus/(Deficit) 548,699 789,983 294,613 (2,601,443) 441,139 74,743
ESTIMATED ENDING RESERVE BALANCE 2,902,261 3,721,289 4,008,833 1,309,164 2,025,523 2,100,266

Fund Budgets
City of Bellingham 2017-18 Preliminary Biennial Budget Page 29
Transportation Benefit District Fund
Transportation Benefit District Fund: Is funded from a voter approved 0.2% Sales Tax that began in April of 2011 and runs for ten years. Funds will be used to maintain and build transportation infrastructure and to pay for Sunday bus service in Bellingham. The fund is budgeted in the Public Works Department.
161 Transportation Benefit District Fund ACTUAL ACTUAL ACTUAL REVISED PRELIMINARY PRELIMINARY
FY2013 FY2014 FY2015 FY2016 FY2017 FY2018
BEGINNING RESERVE BALANCE 2,153,674 2,656,535 2,687,917 3,293,098 2,787,961 1,926,445
TAXES 4,655,993 4,700,864 4,903,512 4,728,800 4,728,800 4,728,800
INTERGOVERNMENTAL REVENUE - - 61,189 - - -
CHARGES FOR GOODS AND SERVICES 436,471 17,985 - - - -
MISCELLANEOUS REVENUE 28,068 27,747 31,434 12,244 22,789 22,789
TOTAL REVENUE 5,120,532 4,746,596 4,996,134 4,741,044 4,751,589 4,751,589
SALARIES AND WAGES 29,904 - - - - -
PERSONNEL BENEFITS 9,745 - - - - -
SUPPLIES 7,245 1,738 7,268 - - -
OTHER SERVICES AND CHARGES 532,137 394,588 345,045 57,246 613,105 609,743
INTERGOVERNMENTAL SERVICES 1,482,747 1,376,138 1,667,374 1,232,626 - -
CAPITAL OUTLAYS (6000 EXP OBJ) 2,540,116 3,150,106 2,264,750 6,509,487 5,000,000 5,100,000
TOTAL EXPENDITURE 4,601,894 4,922,570 4,284,437 7,799,359 5,613,105 5,709,743
Net Surplus/(Deficit) 518,638 (175,974) 711,697 (3,058,315) (861,516) (958,154)
ESTIMATED ENDING RESERVE BALANCE 2,672,312 2,480,561 3,399,614 234,783 1,926,445 968,291

Fund Budgets
City of Bellingham Page 30 2017-18 Preliminary Biennial Budget
Public, Education and Government Access TV Funds
Public, Education, & Government Access TV (PEG) Fund: This Fund was created in 2012 to account for a portion of cable franchise fees. It will be used to track revenue and expenditures associated with public, education, and government access television. Beginning in 2013, a separate equipment sub-fund was created to track funds reserved specifically for equipment purchases. The fund is managed by the Information Technology Services Department.
162 Public Educ & Govt Acc TV Fund ACTUAL ACTUAL ACTUAL REVISED PRELIMINARY PRELIMINARY
Including Equipment Subfund 163 FY2013 FY2014 FY2015 FY2016 FY2017 FY2018
BEGINNING RESERVE BALANCE 391,085 671,926 986,815 974,328 1,048,000 448,791
LICENSES AND PERMITS 443,027 464,673 428,238 292,000 313,000 313,000
CHARGES FOR GOODS AND SERVICES 1,065 1,035 1,950 2,112 2,210 2,210
MISCELLANEOUS REVENUE 113,836 124,685 131,067 120,863 114,560 114,560
TOTAL REVENUE 557,928 590,393 561,255 414,975 429,770 429,770
NON-EXPENDITURES 46,000 - - - 490,000 -
SALARIES AND WAGES 124,674 146,279 144,778 144,488 145,803 150,703
PERSONNEL BENEFITS 44,506 57,555 59,687 66,230 66,912 71,813
SUPPLIES 34,056 43,272 62,791 16,875 11,007 11,207
OTHER SERVICES AND CHARGES 38,007 68,761 98,125 146,658 115,256 114,748
CAPITAL OUTLAYS (6000 EXP OBJ) - - - 95,000 200,000 95,000
TOTAL EXPENDITURE 287,242 315,866 365,381 469,251 1,028,979 443,471
Net Surplus/(Deficit) 270,686 274,526 195,874 (54,276) (599,209) (13,701)
ESTIMATED ENDING RESERVE BALANCE 661,771 946,452 1,182,689 920,052 448,791 435,090

Fund Budgets
City of Bellingham 2017-18 Preliminary Biennial Budget Page 31
Greenways Funds
Greenways III Fund: Greenways funds are voter approved property tax levies (2007-16) that acquire land, make improvements, and help to maintain the Greenway areas. These funds are managed by the Parks and Recreation Department. Funds from Greenways levies prior to Greenways III have been expended and closed. Prior year actuals may be included in the All Funds report at the end of this section, but no remaining funds are budgeted for 2017-18.
173 Greenways III Fund ACTUAL ACTUAL ACTUAL REVISED PRELIMINARY PRELIMINARY
FY2013 FY2014 FY2015 FY2016 FY2017 FY2018
BEGINNING RESERVE BALANCE 5,887,854 8,238,188 8,212,551 5,780,813 7,000,000 2,169,619
TAXES 4,114,760 4,194,039 4,297,736 4,242,000 - -
INTERGOVERNMENTAL REVENUE - 492,611 367,512 830,000 400,000 400,000
FINES AND PENALTIES - 500 475 - - -
MISCELLANEOUS REVENUE 72,230 95,624 112,911 41,715 57,815 57,815
TOTAL REVENUE 4,186,990 4,782,775 4,778,634 5,113,715 457,815 457,815
NON-EXPENDITURES - 13,255 246,986 - 400,000 400,000
SALARIES AND WAGES 219,976 430,961 357,637 270,301 276,584 284,769
PERSONNEL BENEFITS - 68,870 65,870 129,709 130,874 140,102
SUPPLIES - 1,406 3,654 - - -
OTHER SERVICES AND CHARGES 13,282 19,673 30,030 28,063 100,739 95,228
CAPITAL OUTLAYS (6000 EXP OBJ) 1,566,952 4,201,440 6,056,238 10,279,931 4,380,000 -
DEBT SERVICE INTEREST/COSTS 33,613 48,837 25,459 - - -
TOTAL EXPENDITURE 1,833,824 4,784,443 6,785,874 10,708,004 5,288,196 920,099
Net Surplus/(Deficit) 2,353,167 (1,669) (2,007,240) (5,594,289) (4,830,381) (462,284)
ESTIMATED ENDING RESERVE BALANCE 8,241,021 8,236,519 6,205,311 186,524 2,169,619 1,707,335

Fund Budgets
City of Bellingham Page 32 2017-18 Preliminary Biennial Budget
Park Impact Fee Fund
Park Impact Fund: Impact Fees collected on new home construction are accumulated in this fund and used to expand the capacity of the city park system; the fund is managed by the Parks and Recreation Department.
Sportsplex Fund
Sportsplex Fund: Dedicated to accumulate funds for maintenance and repairs to the Sportsplex in accordance with the lease agreement between the City and the Whatcom Soccer Commission, this fund is managed by the Parks and Recreation Department.
177 Park Impact Fee Fund ACTUAL ACTUAL ACTUAL REVISED PRELIMINARY PRELIMINARY
FY2013 FY2014 FY2015 FY2016 FY2017 FY2018
BEGINNING RESERVE BALANCE 2,708,752 4,009,035 4,984,228 4,340,374 4,266,269 3,243,442
INTERGOVERNMENTAL REVENUE 765 749,887 687,548 - - -
CHARGES FOR GOODS AND SERVICES 1,633,576 1,838,454 2,443,718 424,360 424,360 424,360
MISCELLANEOUS REVENUE 30,770 35,024 51,041 23,288 33,117 33,117
TOTAL REVENUE 1,665,111 2,623,364 3,182,306 447,648 457,477 457,477
SALARIES AND WAGES 50,611 74,858 56,639 72,642 72,109 74,341
PERSONNEL BENEFITS - - - 30,756 31,317 33,597
SUPPLIES - 1,406 - - - -
OTHER SERVICES AND CHARGES 5,214 11,133 12,745 48,866 51,879 50,387
CAPITAL OUTLAYS (6000 EXP OBJ) 309,003 1,263,896 1,808,469 3,119,264 1,325,000 1,050,000
TOTAL EXPENDITURE 364,827 1,351,294 1,877,852 3,271,528 1,480,304 1,208,326
Net Surplus/(Deficit) 1,300,283 1,272,071 1,304,453 (2,823,880) (1,022,827) (750,849)
ESTIMATED ENDING RESERVE BALANCE 4,009,035 5,281,106 6,288,681 1,516,494 3,243,442 2,492,593
178 Sportsplex Fund ACTUAL ACTUAL ACTUAL REVISED PRELIMINARY PRELIMINARY
FY2013 FY2014 FY2015 FY2016 FY2017 FY2018
BEGINNING RESERVE BALANCE 41,532 43,601 44,930 46,357 46,343 47,948
MISCELLANEOUS REVENUE 2,069 1,329 1,296 1,427 1,605 1,605
TOTAL REVENUE 2,069 1,329 1,296 1,427 1,605 1,605
Net Surplus/(Deficit) 2,069 1,329 1,296 1,427 1,605 1,605
ESTIMATED ENDING RESERVE BALANCE 43,601 44,930 46,226 47,784 47,948 49,553

Fund Budgets
City of Bellingham 2017-18 Preliminary Biennial Budget Page 33
Tourism Fund
Tourism Fund: Funded by hotel/motel taxes, the Tourism Fund is used to promote tourism and support the operation of tourism-related facilities; the fund is managed by the Planning and Community Development Department.
Low Income Housing Fund
Low Income Housing Fund: In November 2012, Bellingham City voters approved a seven-year $21 million dollar levy to provide housing assistance for homeless and low income citizens. The fund is managed by the Planning and Community Development Department
180 Tourism Fund ACTUAL ACTUAL ACTUAL REVISED PRELIMINARY PRELIMINARY
FY2013 FY2014 FY2015 FY2016 FY2017 FY2018
BEGINNING RESERVE BALANCE 404,480 487,127 597,397 656,845 500,000 200,000
TAXES 1,159,012 1,319,092 1,474,376 1,515,800 1,515,800 1,561,275
MISCELLANEOUS REVENUE 3,760 3,971 6,032 3,014 4,167 4,167
TOTAL REVENUE 1,162,772 1,323,062 1,480,408 1,518,814 1,519,967 1,565,442
NON-EXPENDITURES 150,000 150,000 150,000 150,000 150,000 150,000
SALARIES AND WAGES 10,667 9,761 15,783 16,454 17,485 18,082
PERSONNEL BENEFITS 4,721 4,438 6,745 7,708 8,109 8,703
SUPPLIES 41 262 823 - - -
OTHER SERVICES AND CHARGES 914,643 1,048,334 1,130,215 1,909,079 1,644,373 1,392,824
TOTAL EXPENDITURE 1,080,071 1,212,795 1,303,566 2,083,241 1,819,967 1,569,609
Net Surplus/(Deficit) 82,701 110,267 176,842 (564,427) (300,000) (4,167)
ESTIMATED ENDING RESERVE BALANCE 487,181 597,394 774,239 92,418 200,000 195,833
181 Low Income Housing ACTUAL ACTUAL ACTUAL REVISED PRELIMINARY PRELIMINARY
FY2013 FY2014 FY2015 FY2016 FY2017 FY2018
BEGINNING RESERVE BALANCE - 2,784,798 4,285,755 2,223,790 2,500,000 138,957
TAXES 2,961,641 2,986,270 3,000,342 3,000,000 3,000,000 3,000,000
CHARGES FOR GOODS AND SERVICES - 132,000 128,250 - - -
MISCELLANEOUS REVENUE 11,049 25,941 42,373 20,057 13,773 13,773
TOTAL REVENUE 2,972,690 3,144,211 3,170,965 3,020,057 3,013,773 3,013,773
SALARIES AND WAGES 29,753 33,353 40,699 26,043 25,554 26,647
PERSONNEL BENEFITS 13,218 11,656 14,241 11,816 11,971 12,903
SUPPLIES 86 - 5,490 8,631 8,631 8,631
OTHER SERVICES AND CHARGES 141,644 1,599,139 3,427,235 3,239,570 5,328,660 3,083,584
CAPITAL OUTLAYS (6000 EXP OBJ) - - 1,594,357 - - -
TOTAL EXPENDITURE 184,701 1,644,148 5,082,022 3,286,060 5,374,816 3,131,765
Net Surplus/(Deficit) 2,787,989 1,500,063 (1,911,056) (266,003) (2,361,043) (117,992)
ESTIMATED ENDING RESERVE BALANCE 2,787,989 4,284,861 2,374,699 1,957,787 138,957 20,965

Fund Budgets
City of Bellingham Page 34 2017-18 Preliminary Biennial Budget
Community Development Block Grant and HOME Funds
These funds do not have reserves. Reserve amounts are for balancing when timing differences in
recognizing transaction leave unequal revenues and expenditures in a fiscal year.
The two funds are aggregated here.
Community Development Block Grant Fund: Accounts for the Federal Grant program used to upgrade neighborhoods, expand affordable housing choices, create employment opportunities for those with low to moderate incomes, and assist community social service agencies. The fund is managed by the Planning and Community Development Department. HOME Investment Partnership Grant Fund: Accounts for the Federal Housing and Urban Development (HUD) Grant program used to expand the supply of affordable housing for low and very low income households. The fund is managed by the Planning and Community Development Department.
190 HUD Grant Funds ACTUAL ACTUAL ACTUAL REVISED PRELIMINARY PRELIMINARY
190-CDBG, 191-HOME FY2013 FY2014 FY2015 FY2016 FY2017 FY2018
INTERGOVERNMENTAL REVENUE 1,248,938 842,370 1,234,117 3,808,041 2,806,112 2,817,823
CHARGES FOR GOODS AND SERVICES 378,425 367,264 278,074 267,174 264,627 264,627
MISCELLANEOUS REVENUE 117,600 84,164 125,584 70,495 70,574 70,574
TOTAL REVENUE 1,744,963 1,293,799 1,637,775 4,145,710 3,141,313 3,153,024
SALARIES AND WAGES 215,510 209,681 221,600 224,990 226,332 233,921
PERSONNEL BENEFITS 85,082 76,549 80,627 104,966 109,028 116,956
SUPPLIES 357 1,220 414 4,192 4,192 4,222
OTHER SERVICES AND CHARGES 1,375,679 1,085,387 1,348,889 3,811,562 2,801,761 2,797,925
TOTAL EXPENDITURE 1,676,628 1,372,837 1,651,530 4,145,710 3,141,313 3,153,024
Net Surplus/(Deficit) 68,335 (79,038) (13,755) - - -
ESTIMATED ENDING RESERVE BALANCE 68,335 (79,038) (13,755) - - -
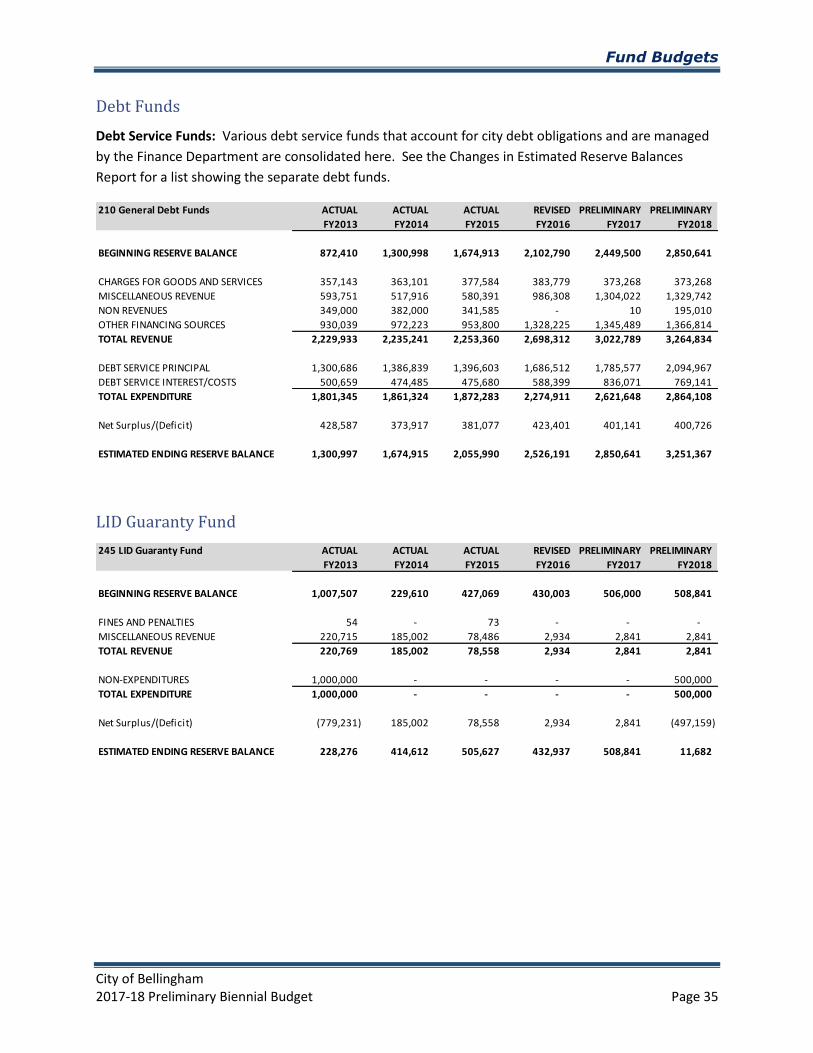
Fund Budgets
City of Bellingham 2017-18 Preliminary Biennial Budget Page 35
Debt Funds
Debt Service Funds: Various debt service funds that account for city debt obligations and are managed
by the Finance Department are consolidated here. See the Changes in Estimated Reserve Balances
Report for a list showing the separate debt funds.
LID Guaranty Fund
210 General Debt Funds ACTUAL ACTUAL ACTUAL REVISED PRELIMINARY PRELIMINARY
FY2013 FY2014 FY2015 FY2016 FY2017 FY2018
BEGINNING RESERVE BALANCE 872,410 1,300,998 1,674,913 2,102,790 2,449,500 2,850,641
CHARGES FOR GOODS AND SERVICES 357,143 363,101 377,584 383,779 373,268 373,268
MISCELLANEOUS REVENUE 593,751 517,916 580,391 986,308 1,304,022 1,329,742
NON REVENUES 349,000 382,000 341,585 - 10 195,010
OTHER FINANCING SOURCES 930,039 972,223 953,800 1,328,225 1,345,489 1,366,814
TOTAL REVENUE 2,229,933 2,235,241 2,253,360 2,698,312 3,022,789 3,264,834
DEBT SERVICE PRINCIPAL 1,300,686 1,386,839 1,396,603 1,686,512 1,785,577 2,094,967
DEBT SERVICE INTEREST/COSTS 500,659 474,485 475,680 588,399 836,071 769,141
TOTAL EXPENDITURE 1,801,345 1,861,324 1,872,283 2,274,911 2,621,648 2,864,108
Net Surplus/(Deficit) 428,587 373,917 381,077 423,401 401,141 400,726
ESTIMATED ENDING RESERVE BALANCE 1,300,997 1,674,915 2,055,990 2,526,191 2,850,641 3,251,367
245 LID Guaranty Fund ACTUAL ACTUAL ACTUAL REVISED PRELIMINARY PRELIMINARY
FY2013 FY2014 FY2015 FY2016 FY2017 FY2018
BEGINNING RESERVE BALANCE 1,007,507 229,610 427,069 430,003 506,000 508,841
FINES AND PENALTIES 54 - 73 - - -
MISCELLANEOUS REVENUE 220,715 185,002 78,486 2,934 2,841 2,841
TOTAL REVENUE 220,769 185,002 78,558 2,934 2,841 2,841
NON-EXPENDITURES 1,000,000 - - - - 500,000
TOTAL EXPENDITURE 1,000,000 - - - - 500,000
Net Surplus/(Deficit) (779,231) 185,002 78,558 2,934 2,841 (497,159)
ESTIMATED ENDING RESERVE BALANCE 228,276 414,612 505,627 432,937 508,841 11,682

Fund Budgets
City of Bellingham Page 36 2017-18 Preliminary Biennial Budget
Construction Funds
Waterfront Construction #1 Fund: To account for Local Infrastructure Financing Tool (LIFT) revenue
received from the state, to be spent on public infrastructure projects within the Revenue Development
Area – the Waterfront District. This is currently the only construction fund.
371 Waterfront Construction #1 ACTUAL ACTUAL ACTUAL REVISED PRELIMINARY PRELIMINARY
FY2013 FY2014 FY2015 FY2016 FY2017 FY2018
BEGINNING RESERVE BALANCE - 490,189 1,798,043 2,844,365 3,900,000 4,711,113
TAXES 490,189 1,298,901 1,072,726 1,055,653 1,035,653 1,035,653
MISCELLANEOUS REVENUE - 8,981 20,465 11,022 25,460 25,460
OTHER FINANCING SOURCES - - - - 250,000 -
TOTAL REVENUE 490,189 1,307,882 1,093,191 1,066,675 1,311,113 1,061,113
CAPITAL OUTLAYS (6000 EXP OBJ) - - - - 500,000 -
TOTAL EXPENDITURE - - - - 500,000 -
Net Surplus/(Deficit) 490,189 1,307,882 1,093,191 1,066,675 811,113 1,061,113
ESTIMATED ENDING RESERVE BALANCE 490,189 1,798,071 2,891,234 3,911,040 4,711,113 5,772,226

Fund Budgets
City of Bellingham 2017-18 Preliminary Biennial Budget Page 37
Water Fund
Water Fund: This enterprise fund accounts for revenues and expenditures of the water treatment plant
and water distribution utility; managed by the Public Works Department.
410 Water Fund ACTUAL ACTUAL ACTUAL REVISED PRELIMINARY PRELIMINARY
(Watershed excluded) FY2013 FY2014 FY2015 FY2016 FY2017 FY2018
BEGINNING RESERVE BALANCE 11,885,503 14,694,601 13,287,496 8,356,372 7,765,854 18,277,770
INTERGOVERNMENTAL REVENUE 49,432 245,601 133,477 - - -
CHARGES FOR GOODS AND SERVICES 22,574,135 22,020,727 18,778,269 18,811,324 18,739,224 18,850,494
FINES AND PENALTIES 51,441 50,083 54,848 47,895 47,895 48,853
MISCELLANEOUS REVENUE 321,741 476,313 265,564 294,916 359,588 362,578
GAINS LOSSES AND CAPITAL CONTRIB - PROP/TRST - 238,000 - - - -
OTHER FINANCING SOURCES 874,782 575,000 4,610,000 15,575,000 15,575,000 15,575,000
TOTAL REVENUE 23,871,531 23,605,724 23,842,159 34,729,135 34,721,707 34,836,925
NON-EXPENDITURES 768,226 738,800 108,745 81,077 60,000 240,000
SALARIES AND WAGES 2,340,119 2,552,262 2,690,748 2,979,332 3,016,620 3,067,687
PERSONNEL BENEFITS 1,054,283 1,103,231 1,136,700 1,355,343 1,408,009 1,486,275
SUPPLIES 2,295,756 2,325,649 1,925,445 2,088,384 1,722,510 1,349,091
OTHER SERVICES AND CHARGES 9,978,703 11,086,601 11,121,542 9,943,427 9,468,318 9,559,301
INTERGOVERNMENTAL SERVICES 576,807 353,711 245,354 341,500 296,500 300,902
CAPITAL OUTLAYS (6000 EXP OBJ) 1,341,842 2,884,854 592,098 17,550,000 6,550,000 2,550,000
DEBT SERVICE PRINCIPAL 1,717,283 1,792,283 4,615,611 674,784 1,450,284 1,495,284
DEBT SERVICE INTEREST/COSTS 602,119 526,775 293,067 305,806 237,551 195,170
TOTAL EXPENDITURE 20,675,137 23,364,165 22,729,311 35,319,653 24,209,791 20,243,712
Net Surplus/(Deficit) 3,196,393 241,559 1,112,848 (590,518) 10,511,916 14,593,214
ESTIMATED ENDING RESERVE BALANCE 15,081,896 14,936,160 14,400,344 7,765,854 18,277,770 32,870,984

Fund Budgets
City of Bellingham Page 38 2017-18 Preliminary Biennial Budget
Watershed Sub-Fund
A sub-fund of the Water fund.
411 Watershed Sub-Fund ACTUAL ACTUAL ACTUAL REVISED PRELIMINARY PRELIMINARY
FY2013 FY2014 FY2015 FY2016 FY2017 FY2018
BEGINNING RESERVE BALANCE - - 2,612,908 1,261,430 2,302,117 1,515,879
INTERGOVERNMENTAL REVENUE - - 384,749 - - -
CHARGES FOR GOODS AND SERVICES - 1,134,734 5,109,624 5,020,353 5,020,353 5,120,760
MISCELLANEOUS REVENUE - 1,400 41,992 35,564 19,246 19,246
GAINS LOSSES AND CAPITAL CONTRIB - PROP/TRST - - 210,160 371,686 570,984 -
NON REVENUES - - 1,350,000 - - -
TOTAL REVENUE - 1,136,135 7,096,526 5,427,603 5,610,583 5,140,006
NON-EXPENDITURES - - 248,122 1,350,000 1,000,000 1,000,000
SALARIES AND WAGES - - 811 75,063 229,051 249,830
PERSONNEL BENEFITS - - 115 36,957 107,163 123,325
SUPPLIES - 322 (764) 47,895 128,515 129,233
OTHER SERVICES AND CHARGES - 170,717 1,239,814 1,558,543 1,417,446 1,519,812
INTERGOVERNMENTAL SERVICES - - - - 450,000 450,000
CAPITAL OUTLAYS (6000 EXP OBJ) - - 958,455 1,145,582 1,866,112 964,400
DEBT SERVICE PRINCIPAL - - 3,935,000 1,047,500 1,047,500 1,047,500
DEBT SERVICE INTEREST/COSTS - 3,343 162,991 144,533 151,033 151,033
TOTAL EXPENDITURE - 174,382 6,544,545 5,406,073 6,396,821 5,635,134
Net Surplus/(Deficit) - 961,753 551,981 21,530 (786,238) (495,128)
ESTIMATED ENDING RESERVE BALANCE - 961,753 3,164,889 2,632,960 1,515,879 1,020,751

Fund Budgets
City of Bellingham 2017-18 Preliminary Biennial Budget Page 39
Wastewater Fund
Wastewater Fund: This enterprise fund accounts for revenues and expenditures of the wastewater
treatment plant and collection utility; managed by the Public Works Department.
420 Wastewater Fund ACTUAL ACTUAL ACTUAL REVISED PRELIMINARY PRELIMINARY
FY2013 FY2014 FY2015 FY2016 FY2017 FY2018
BEGINNING RESERVE BALANCE 44,758,031 25,871,363 22,362,449 22,426,165 16,187,907 13,666,236
INTERGOVERNMENTAL REVENUE 2,938 2,623 3,661 - - -
CHARGES FOR GOODS AND SERVICES 19,171,474 20,589,622 21,131,911 20,986,709 20,933,417 21,352,085
FINES AND PENALTIES 57,127 55,350 60,327 50,470 50,470 51,479
MISCELLANEOUS REVENUE 464,834 419,133 838,501 347,008 282,632 284,112
GAINS LOSSES AND CAPITAL CONTRIB - PROP/TRST - - 217,883 - - -
OTHER FINANCING SOURCES 16,039,500 - - 7,000,000 - 4,418,000
TOTAL REVENUE 35,735,873 21,066,728 22,252,284 28,384,187 21,266,519 26,105,677
NON-EXPENDITURES 37,214 - 88,869 62,400 60,000 240,000
SALARIES AND WAGES 2,656,033 2,675,941 2,563,041 2,891,462 2,846,266 2,964,117
PERSONNEL BENEFITS 1,187,030 1,165,160 1,102,189 1,304,895 1,330,664 1,437,774
SUPPLIES 1,290,565 1,162,308 1,331,106 1,533,375 1,426,294 1,447,718
OTHER SERVICES AND CHARGES 8,896,437 8,981,919 8,222,379 11,136,030 9,575,731 9,734,388
INTERGOVERNMENTAL SERVICES 15,152 19,652 18,818 85,000 85,000 86,275
CAPITAL OUTLAYS (6000 EXP OBJ) 37,864,249 7,868,885 3,919,939 9,109,488 4,852,000 11,373,000
DEBT SERVICE PRINCIPAL 315,000 305,000 300,000 305,963 915,000 945,000
DEBT SERVICE INTEREST/COSTS 2,394,438 2,707,285 2,707,586 2,804,192 2,697,236 2,660,636
TOTAL EXPENDITURE 54,656,118 24,886,148 20,253,927 29,232,804 23,788,190 30,888,908
Net Surplus/(Deficit) (18,920,245) (3,819,420) 1,998,357 (848,617) (2,521,671) (4,783,231)
ESTIMATED ENDING RESERVE BALANCE 25,837,786 22,051,943 24,360,806 21,577,548 13,666,236 8,883,005

Fund Budgets
City of Bellingham Page 40 2017-18 Preliminary Biennial Budget
Storm and Surface Water Utility Fund
Storm and Surface Water Fund: This enterprise fund accounts for revenues and expenditures of the surface and storm water drainage, collection, and treatment utility; managed by the Public Works Department.
430 Storm & Surface Water Utility ACTUAL ACTUAL ACTUAL REVISED PRELIMINARY PRELIMINARY
FY2013 FY2014 FY2015 FY2016 FY2017 FY2018
BEGINNING RESERVE BALANCE 4,592,436 4,846,887 4,734,352 3,866,024 3,094,191 2,205,782
LICENSES AND PERMITS 106,358 131,288 180,403 90,000 90,000 90,000
INTERGOVERNMENTAL REVENUE 369,849 122,611 850,085 705,627 - -
CHARGES FOR GOODS AND SERVICES 6,197,851 6,890,516 8,069,632 7,892,351 7,281,750 7,286,335
FINES AND PENALTIES 17,563 17,100 18,718 15,914 15,914 16,232
MISCELLANEOUS REVENUE 223,009 240,015 261,571 192,766 161,022 161,022
GAINS LOSSES AND CAPITAL CONTRIB - PROP/TRST - 1,139,627 6,338,769 3,643,519 685,805 -
OTHER FINANCING SOURCES 1,597,677 4,230 1,704,814 616,880 1,765,000 1,822,507
TOTAL REVENUE 8,512,307 8,545,386 17,423,992 13,157,057 9,999,491 9,376,096
NON-EXPENDITURES 16,601 - 103,736 73,763 60,000 240,000
SALARIES AND WAGES 1,086,786 1,105,653 1,258,594 1,662,411 1,537,332 1,591,847
PERSONNEL BENEFITS 510,309 499,121 553,526 775,009 754,666 809,569
SUPPLIES 203,182 203,716 349,085 354,709 370,941 375,039
OTHER SERVICES AND CHARGES 3,883,752 4,911,410 4,982,644 5,726,764 5,336,456 5,307,095
INTERGOVERNMENTAL SERVICES 12,144 21,062 1,277 - - -
CAPITAL OUTLAYS (6000 EXP OBJ) 2,385,816 1,750,285 11,043,459 8,153,897 2,431,074 2,432,507
DEBT SERVICE PRINCIPAL - - - 47,513 293,296 340,819
DEBT SERVICE INTEREST/COSTS - - - 37,365 104,135 74,449
TOTAL EXPENDITURE 8,098,590 8,491,247 18,292,320 16,831,431 10,887,900 11,171,326
Net Surplus/(Deficit) 413,717 54,139 (868,329) (3,674,374) (888,409) (1,795,230)
ESTIMATED ENDING RESERVE BALANCE 5,006,153 4,901,026 3,866,023 191,650 2,205,782 410,552

Fund Budgets
City of Bellingham 2017-18 Preliminary Biennial Budget Page 41
Solid Waste Fund
Solid Waste Fund: Accounts for revenues and expenditures associated with waste collection, transfer, and disposal in the City; managed by the Public Works Department. A private contractor handles garbage collection and billing in the City.
440 Solid Waste Fund ACTUAL ACTUAL ACTUAL REVISED PRELIMINARY PRELIMINARY
FY2013 FY2014 FY2015 FY2016 FY2017 FY2018
BEGINNING RESERVE BALANCE 7,526,597 7,694,420 7,334,194 5,626,701 6,438,180 6,377,796
TAXES 1,274,696 1,330,240 1,370,813 1,402,806 1,402,806 1,402,806
INTERGOVERNMENTAL REVENUE 6,034 23,791 1,156 - - -
CHARGES FOR GOODS AND SERVICES 209,055 236,187 193,843 144,993 103,216 103,216
MISCELLANEOUS REVENUE 68,448 59,129 67,831 71,418 50,676 50,676
NON REVENUES - - - 1,350,000 - -
OTHER FINANCING SOURCES - - - - 2,000,000 2,000,000
TOTAL REVENUE 1,558,233 1,649,347 1,633,643 2,969,217 3,556,698 3,556,698
NON-EXPENDITURES - 400,000 1,760,000 412,667 615,000 660,000
SALARIES AND WAGES 119,121 125,952 122,177 169,416 125,265 130,083
PERSONNEL BENEFITS 50,252 56,005 53,621 74,539 56,290 60,529
SUPPLIES 19,413 5,234 6,302 47,928 45,766 46,452
OTHER SERVICES AND CHARGES 490,752 510,883 457,119 541,959 2,149,786 560,997
INTERGOVERNMENTAL SERVICES 7,735 35,973 19,258 46 50 50
DEBT SERVICE PRINCIPAL 365,000 385,000 460,000 425,000 485,000 490,000
DEBT SERVICE INTEREST/COSTS 331,006 299,829 158,838 269,738 139,925 133,620
TOTAL EXPENDITURE 1,383,278 1,818,876 3,037,316 1,941,293 3,617,082 2,081,731
Net Surplus/(Deficit) 174,955 (169,528) (1,403,673) 1,027,924 (60,384) 1,474,967
ESTIMATED ENDING RESERVE BALANCE 7,701,552 7,524,892 5,930,521 6,654,625 6,377,796 7,852,763

Fund Budgets
City of Bellingham Page 42 2017-18 Preliminary Biennial Budget
Cemetery Fund
Cemetery Fund: This enterprise fund for Bayview Cemetery operations. The Other Financing Sources
Revenue represents a transfer to the cemetery from the General Fund. The cemetery is managed by the
Parks and Recreation Department.
Golf Course Fund
Golf Course Fund: Accounts for the revenue and expenditures associated with the oversight, repairs
and maintenance of the facilities and grounds of the golf course; operation is contracted to a private
vendor. The fund is managed by the Parks and Recreation Department.
456 Cemetery Fund ACTUAL ACTUAL ACTUAL REVISED PRELIMINARY PRELIMINARY
FY2013 FY2014 FY2015 FY2016 FY2017 FY2018
BEGINNING RESERVE BALANCE 308,584 258,510 224,403 244,787 240,115 222,516
CHARGES FOR GOODS AND SERVICES 275,520 281,132 318,234 343,540 311,535 311,535
FINES AND PENALTIES 24 33 7 - - -
MISCELLANEOUS REVENUE 3,766 4,479 3,396 2,893 4,110 4,110
OTHER FINANCING SOURCES 221,480 221,480 221,480 221,480 221,480 221,480
TOTAL REVENUE 500,790 507,125 543,117 567,913 537,125 537,125
NON-EXPENDITURES 510 - - - - -
SALARIES AND WAGES 212,979 206,043 199,558 244,750 215,718 221,165
PERSONNEL BENEFITS 108,889 97,103 89,926 132,976 108,121 115,513
SUPPLIES 61,988 55,493 60,952 61,588 62,165 62,165
OTHER SERVICES AND CHARGES 168,268 188,679 172,298 187,398 168,719 167,494
TOTAL EXPENDITURE 552,633 547,318 522,734 626,712 554,724 566,337
Net Surplus/(Deficit) (51,843) (40,194) 20,384 (58,799) (17,599) (29,212)
ESTIMATED ENDING RESERVE BALANCE 256,741 218,316 244,787 185,988 222,516 193,304
460 Golf Course Fund ACTUAL ACTUAL ACTUAL REVISED PRELIMINARY PRELIMINARY
FY2013 FY2014 FY2015 FY2016 FY2017 FY2018
BEGINNING RESERVE BALANCE 302,966 258,428 172,821 197,520 257,605 312,988
FINES AND PENALTIES - - 930 - - -
MISCELLANEOUS REVENUE 227,801 215,661 157,103 221,397 172,466 172,466
TOTAL REVENUE 227,801 215,661 158,033 221,397 172,466 172,466
SALARIES AND WAGES 31,522 82,519 40,173 34,647 27,669 28,293
PERSONNEL BENEFITS 13,568 14,483 15,788 17,554 12,035 12,858
SUPPLIES 6,818 6,311 11,958 2,546 2,546 2,546
OTHER SERVICES AND CHARGES 182,622 198,230 37,182 145,060 74,833 74,694
CAPITAL OUTLAYS (6000 EXP OBJ) 20,105 - - - - -
TOTAL EXPENDITURE 254,635 301,543 105,100 199,807 117,083 118,391
Net Surplus/(Deficit) (26,833) (85,882) 52,933 21,590 55,383 54,075
ESTIMATED ENDING RESERVE BALANCE 276,133 172,546 225,754 219,110 312,988 367,063

Fund Budgets
City of Bellingham 2017-18 Preliminary Biennial Budget Page 43
Parking Services Fund
Parking Services Fund: This enterprise fund accounts for revenues and expenditures of the municipal parking systems and is managed by the Public Works Department.
465 Parking Services Fund ACTUAL ACTUAL ACTUAL REVISED PRELIMINARY PRELIMINARY
FY2013 FY2014 FY2015 FY2016 FY2017 FY2018
BEGINNING RESERVE BALANCE 1,544,047 2,961,251 3,094,964 2,971,293 1,324,613 1,356,661
INTERGOVERNMENTAL REVENUE 1,176,877 24,000 - - - -
FINES AND PENALTIES 616,531 549,179 706,983 599,460 620,000 655,000
MISCELLANEOUS REVENUE 1,520,499 1,658,739 1,761,419 1,610,260 1,712,398 1,745,827
TOTAL REVENUE 3,313,907 2,231,917 2,468,402 2,209,720 2,332,398 2,400,827
NON-EXPENDITURES 726,721 - 20,162 15,200 15,000 60,000
SALARIES AND WAGES 239,695 256,132 175,102 198,451 199,890 208,067
PERSONNEL BENEFITS 136,072 130,761 98,172 114,015 116,592 124,906
SUPPLIES 192,869 95,023 70,718 357,981 271,955 276,034
OTHER SERVICES AND CHARGES 609,119 1,575,787 1,626,728 1,542,710 1,696,913 1,725,646
INTERGOVERNMENTAL SERVICES 6,000 10,200 49 - - -
CAPITAL OUTLAYS (6000 EXP OBJ) - - - 1,325,000 - -
DEBT SERVICE INTEREST/COSTS 53 - - 250,000 - -
TOTAL EXPENDITURE 1,910,530 2,067,903 1,990,930 3,803,357 2,300,350 2,394,653
Net Surplus/(Deficit) 1,403,377 164,015 477,472 (1,593,637) 32,048 6,175
ESTIMATED ENDING RESERVE BALANCE 2,947,424 3,125,266 3,572,436 1,377,656 1,356,661 1,362,836

Fund Budgets
City of Bellingham Page 44 2017-18 Preliminary Biennial Budget
Medic One Fund
Medic One Fund: Beginning in 2014, this fund accounts for revenues and expenditures associated with the City of Bellingham portion of the Medic One emergency medical transport service, pursuant to a new interlocal agreement between the City and Whatcom County. The fund is managed by the Fire Department.
470 Medic One Fund ACTUAL ACTUAL ACTUAL REVISED PRELIMINARY PRELIMINARY
FY2013 FY2014 FY2015 FY2016 FY2017 FY2018
BEGINNING RESERVE BALANCE 304,062 742,606 1,684,466 1,566,094 1,609,793 1,440,174
TAXES - 636,485 663,189 - 617,100 617,100
INTERGOVERNMENTAL REVENUE 1,208 1,473 - - - -
CHARGES FOR GOODS AND SERVICES 6,771,138 5,903,278 4,795,312 4,976,678 5,101,095 5,203,117
MISCELLANEOUS REVENUE 24,770 39,954 18,247 9,333 11,369 11,369
OTHER FINANCING SOURCES 1,067,774 1,125,000 1,190,453 1,125,000 1,125,000 1,125,000
TOTAL REVENUE 7,864,890 7,706,189 6,667,201 6,111,011 6,854,564 6,956,586
NON-EXPENDITURES 13,543 - 61 - - -
SALARIES AND WAGES 4,243,484 3,966,908 3,481,848 3,553,948 3,729,969 3,832,225
PERSONNEL BENEFITS 1,076,484 917,383 780,479 961,433 1,023,416 1,069,587
SUPPLIES 373,902 276,448 253,049 327,427 331,505 333,405
OTHER SERVICES AND CHARGES 1,715,862 1,033,205 1,047,740 1,043,535 1,020,043 1,011,870
INTERGOVERNMENTAL SERVICES 625 636,485 663,189 - 617,000 617,000
CAPITAL OUTLAYS (6000 EXP OBJ) - - - 115,000 302,250 15,000
TOTAL EXPENDITURE 7,423,899 6,830,430 6,226,367 6,001,343 7,024,183 6,879,087
Net Surplus/(Deficit) 440,991 875,760 440,834 109,668 (169,619) 77,499
ESTIMATED ENDING RESERVE BALANCE 745,053 1,618,366 2,125,300 1,675,762 1,440,174 1,517,673

Fund Budgets
City of Bellingham 2017-18 Preliminary Biennial Budget Page 45
Development Services Fund
Development Services Fund: This enterprise fund accounts for the operation of the Permit Center and building code enforcement; as well as administration of the new rental registration and inspection program. The fund is managed by the Planning and Community Development Department.
475 Development Services Fund ACTUAL ACTUAL ACTUAL REVISED PRELIMINARY PRELIMINARY
FY2013 FY2014 FY2015 FY2016 FY2017 FY2018
BEGINNING RESERVE BALANCE 1,987,171 2,686,823 3,644,103 3,133,079 3,256,709 2,621,610
LICENSES AND PERMITS 1,456,138 1,778,350 1,915,602 1,403,236 1,308,736 1,308,736
CHARGES FOR GOODS AND SERVICES 1,149,652 1,118,380 1,304,778 1,199,713 1,189,624 1,208,224
FINES AND PENALTIES 50 50 50 - - -
MISCELLANEOUS REVENUE 23,506 24,601 36,488 29,863 43,390 43,390
TOTAL REVENUE 2,629,345 2,921,382 3,256,917 2,632,812 2,541,750 2,560,350
NON-EXPENDITURES 72,223 - - - - -
SALARIES AND WAGES 1,077,849 1,028,417 1,516,697 1,814,332 1,760,879 1,824,968
PERSONNEL BENEFITS 449,448 412,497 568,218 787,506 762,141 816,508
SUPPLIES 14,233 16,588 14,698 76,130 94,576 57,151
OTHER SERVICES AND CHARGES 304,071 501,348 462,170 605,587 559,252 559,037
CAPITAL OUTLAYS (6000 EXP OBJ) - - - 42,000 - -
TOTAL EXPENDITURE 1,917,824 1,958,849 2,561,783 3,325,555 3,176,849 3,257,664
Net Surplus/(Deficit) 711,522 962,532 695,134 (692,743) (635,099) (697,314)
ESTIMATED ENDING RESERVE BALANCE 2,698,693 3,649,355 4,339,237 2,440,336 2,621,610 1,924,296

Fund Budgets
City of Bellingham Page 46 2017-18 Preliminary Biennial Budget
Fleet Administration Fund
Fleet Administration Fund and Subfund: This internal service fund accounts for acquisition, repair,
maintenance, and replacement of vehicles citywide. Revenues are from charges to departments for
their vehicle and equipment. The fund is managed by the Public Works Department. The Radio
Communications Fund is a subfund of the Fleet Fund.
Radio Communications Sub-Fund
510 Fleet Administration Fund ACTUAL ACTUAL ACTUAL REVISED PRELIMINARY PRELIMINARY
(Radio communication excluded) FY2013 FY2014 FY2015 FY2016 FY2017 FY2018
BEGINNING RESERVE BALANCE 6,224,386 6,761,344 7,909,931 6,658,871 6,918,477 5,425,963
CHARGES FOR GOODS AND SERVICES 3,209,879 3,640,195 3,538,897 3,658,185 3,654,886 3,654,886
FINES AND PENALTIES - - 11 - - -
MISCELLANEOUS REVENUE 79,933 68,236 66,165 54,874 64,792 64,792
GAINS LOSSES AND CAPITAL CONTRIB - PROP/TRST 8,055 - 11,913 - - -
NON REVENUES 731,062 738,800 247,846 - - -
OTHER FINANCING SOURCES 82,983 251,478 207,665 40,000 40,000 40,000
TOTAL REVENUE 4,111,911 4,698,708 4,072,498 3,753,059 3,759,678 3,759,678
NON-EXPENDITURES 6,729 - 11,843 40,000 160,000 240,000
SALARIES AND WAGES 553,863 553,539 577,150 694,310 666,096 683,382
PERSONNEL BENEFITS 258,401 250,595 261,496 291,998 303,832 324,582
SUPPLIES 564,778 596,323 572,239 631,035 635,024 644,549
OTHER SERVICES AND CHARGES 820,168 782,155 718,172 778,546 877,126 904,193
CAPITAL OUTLAYS (6000 EXP OBJ) 1,105,902 1,368,938 2,921,624 2,818,668 2,610,113 3,576,558
TOTAL EXPENDITURE 3,309,840 3,551,550 5,062,523 5,254,557 5,252,192 6,373,265
Net Surplus/(Deficit) 802,071 1,147,159 (990,025) (1,501,498) (1,492,514) (2,613,587)
ESTIMATED ENDING RESERVE BALANCE 7,026,457 7,908,503 6,919,906 5,157,373 5,425,963 2,812,376
511 Radio Communications Sub-Fund ACTUAL ACTUAL ACTUAL REVISED PRELIMINARY PRELIMINARY
FY2013 FY2014 FY2015 FY2016 FY2017 FY2018
BEGINNING RESERVE BALANCE - 251,428 276,893 274,286 353,437 390,228
TAXES - - 627,656 624,500 730,000 730,000
INTERGOVERNMENTAL REVENUE - - 5,000 36,000 7,500 7,650
CHARGES FOR GOODS AND SERVICES - 108,628 216,830 132,355 222,500 223,550
MISCELLANEOUS REVENUE - 1,514 43,541 67 1,497,481 47,481
OTHER FINANCING SOURCES - 584,760 - - - -
TOTAL REVENUE - 694,902 893,027 792,922 2,457,481 1,008,681
SALARIES AND WAGES - 238,494 271,257 307,598 331,866 344,904
PERSONNEL BENEFITS - 98,379 112,030 138,361 149,369 160,738
SUPPLIES - 87,535 69,638 139,960 140,307 142,412
OTHER SERVICES AND CHARGES - 240,601 149,123 635,878 349,149 141,148
CAPITAL OUTLAYS (6000 EXP OBJ) - - - - 1,450,000 -
TOTAL EXPENDITURE - 665,009 602,047 1,221,797 2,420,691 789,202
Net Surplus/(Deficit) - 29,892 290,980 (428,875) 36,791 219,479
ESTIMATED ENDING RESERVE BALANCE - 281,320 567,873 (154,589) 390,228 609,707

Fund Budgets
City of Bellingham 2017-18 Preliminary Biennial Budget Page 47
Purchasing
Purchasing / Materials Management Fund: This internal service fund consolidates the purchasing
function for all City Departments and some warehousing and distribution of supplies. Revenues are
from overhead charges and inventory sales to user departments. The fund is managed by the Public
Works Department.
520 Purchasing/Materials Mgmt Fund ACTUAL ACTUAL ACTUAL REVISED PRELIMINARY PRELIMINARY
FY2013 FY2014 FY2015 FY2016 FY2017 FY2018
BEGINNING RESERVE BALANCE 45,150 514,670 304,226 521,704 163,037 134,495
CHARGES FOR GOODS AND SERVICES 2,484,912 2,255,335 2,525,304 3,241,992 3,657,330 3,657,330
MISCELLANEOUS REVENUE 29,612 34,688 6,360 23,724 5,641 5,641
TOTAL REVENUE 2,514,525 2,290,023 2,531,663 3,265,716 3,662,971 3,662,971
NON-EXPENDITURES 725,987 (65,743) 239,960 - - -
SALARIES AND WAGES 493,434 427,394 518,308 638,691 636,647 660,281
PERSONNEL BENEFITS 224,501 204,415 241,069 278,380 308,840 331,498
SUPPLIES 859,773 1,385,039 1,113,815 2,276,794 2,068,751 2,099,738
OTHER SERVICES AND CHARGES 350,855 471,697 440,994 438,148 362,050 379,002
INTERGOVERNMENTAL SERVICES 2,590 - - 15,225 15,225 15,453
CAPITAL OUTLAYS (6000 EXP OBJ) - 12,482 - - 300,000 -
TOTAL EXPENDITURE 2,657,140 2,435,284 2,554,146 3,647,238 3,691,513 3,485,973
Net Surplus/(Deficit) (142,616) (145,262) (22,482) (381,522) (28,542) 176,998
ESTIMATED ENDING RESERVE BALANCE (97,466) 369,408 281,744 140,182 134,495 311,493

Fund Budgets
City of Bellingham Page 48 2017-18 Preliminary Biennial Budget
Facilities
Facilities Administration Fund: This internal service fund consolidates the majority of custodial and
facility maintenance functions for the city, with revenues coming from charges to user departments.
The fund is managed by the Public Works Department.
530 Facilities Administration Fund ACTUAL ACTUAL ACTUAL REVISED PRELIMINARY PRELIMINARY
FY2013 FY2014 FY2015 FY2016 FY2017 FY2018
BEGINNING RESERVE BALANCE 1,157,245 1,197,245 914,962 1,052,281 356,491 225,323
INTERGOVERNMENTAL REVENUE 226,724 221,753 214,935 246,304 246,304 246,304
CHARGES FOR GOODS AND SERVICES 2,739,276 2,980,765 3,578,799 3,627,150 3,684,353 3,791,356
FINES AND PENALTIES - - 214 - - -
MISCELLANEOUS REVENUE 98,313 89,003 107,033 71,680 73,177 73,177
OTHER FINANCING SOURCES 690,000 300,000 600,000 800,000 1,000,000 1,850,000
TOTAL REVENUE 3,754,313 3,591,522 4,500,981 4,745,134 5,003,834 5,960,837
NON-EXPENDITURES 10,116 2,824 - - - -
SALARIES AND WAGES 967,125 1,017,545 1,185,064 1,227,648 1,251,282 1,285,397
PERSONNEL BENEFITS 537,891 544,369 621,263 692,964 703,600 750,109
SUPPLIES 154,760 241,128 329,007 262,109 264,598 268,570
OTHER SERVICES AND CHARGES 1,639,894 1,351,022 1,880,368 2,708,644 2,583,593 3,341,645
INTERGOVERNMENTAL SERVICES - 1,278 1,060 700 700 711
CAPITAL OUTLAYS (6000 EXP OBJ) 56,102 - - - - -
DEBT SERVICE PRINCIPAL - 380,000 - - - -
DEBT SERVICE INTEREST/COSTS 352,514 361,003 332,055 351,864 331,230 331,230
TOTAL EXPENDITURE 3,718,402 3,899,169 4,348,816 5,243,929 5,135,002 5,977,662
Net Surplus/(Deficit) 35,911 (307,648) 152,165 (498,795) (131,168) (16,825)
ESTIMATED ENDING RESERVE BALANCE 1,193,156 889,597 1,067,127 553,486 225,323 208,498

Fund Budgets
City of Bellingham 2017-18 Preliminary Biennial Budget Page 49
Technology and Telecom Fund
Telecommunication and Technology Fund and Subfunds: An internal service fund comprised of four
subfunds that collects revenues from user departments to pay for telephone/telecom (540), major
technology replacement projects (541), computer replacements (542), and Geographic Information
System (543) expenditures citywide. The fund is managed by the Information Technology Services
Department.
540 Tech and Telecom Funds ACTUAL ACTUAL ACTUAL REVISED PRELIMINARY PRELIMINARY
540, 541, 542, 543 FY2013 FY2014 FY2015 FY2016 FY2017 FY2018
BEGINNING RESERVE BALANCE 1,945,302 1,987,378 2,381,710 2,162,308 1,481,664 863,940
INTERGOVERNMENTAL REVENUE - 8,811 9,685 - - -
CHARGES FOR GOODS AND SERVICES 772,221 2,157,813 1,914,919 1,625,269 2,922,920 3,179,573
MISCELLANEOUS REVENUE 20,791 26,981 22,123 27,752 26,956 26,956
OTHER FINANCING SOURCES 1,080,245 350,234 330,234 335,234 335,234 335,234
TOTAL REVENUE 1,873,257 2,543,838 2,276,962 1,988,255 3,285,110 3,541,763
NON-EXPENDITURES 19,890 - - - - -
SALARIES AND WAGES 285,366 295,698 307,796 329,719 339,418 347,802
PERSONNEL BENEFITS 114,001 113,968 117,169 130,663 137,907 147,650
SUPPLIES 596,681 690,623 659,669 502,285 618,809 571,409
OTHER SERVICES AND CHARGES 814,710 830,145 1,023,421 812,607 629,913 627,842
CAPITAL OUTLAYS (6000 EXP OBJ) - 210,187 237,053 1,507,924 2,176,788 1,921,300
TOTAL EXPENDITURE 1,830,648 2,140,620 2,345,108 3,283,198 3,902,834 3,616,002
Net Surplus/(Deficit) 42,609 403,219 (68,146) (1,294,943) (617,724) (74,239)
ESTIMATED ENDING RESERVE BALANCE 1,987,911 2,390,597 2,313,564 867,365 863,940 789,701

Fund Budgets
City of Bellingham Page 50 2017-18 Preliminary Biennial Budget
Claims and Litigation Fund
Claims and Litigation Fund: On behalf of all City departments, this internal service fund pays most insurance premiums as well as administrative expenses and other costs for claims, litigation, settlements, and judgments not covered by liability insurance. The fund is managed by the Legal Department.
550 Claims & Litigation Fund ACTUAL ACTUAL ACTUAL REVISED PRELIMINARY PRELIMINARY
FY2013 FY2014 FY2015 FY2016 FY2017 FY2018
BEGINNING RESERVE BALANCE 4,662,738 4,662,738 5,241,498 5,212,176 4,754,013 4,700,239
CHARGES FOR GOODS AND SERVICES 1,218,125 1,200,001 1,099,261 1,099,682 1,100,000 1,100,000
MISCELLANEOUS REVENUE 43,260 43,180 48,599 43,895 55,472 55,472
TOTAL REVENUE 1,261,384 1,243,181 1,147,860 1,143,577 1,155,472 1,155,472
SALARIES AND WAGES 118,547 126,844 134,390 134,862 142,042 146,729
PERSONNEL BENEFITS 46,453 49,649 50,935 55,558 58,582 62,947
SUPPLIES 5,391 3,158 2,225 5,197 5,197 5,197
OTHER SERVICES AND CHARGES 759,191 775,023 791,422 978,472 1,003,425 1,001,368
INTERGOVERNMENTAL SERVICES - 74 228 - - -
TOTAL EXPENDITURE 929,581 954,749 979,200 1,174,089 1,209,246 1,216,241
Net Surplus/(Deficit) 331,803 288,433 168,660 (30,512) (53,774) (60,769)
ESTIMATED ENDING RESERVE BALANCE 4,994,541 4,951,171 5,410,158 5,181,664 4,700,239 4,639,470

Fund Budgets
City of Bellingham 2017-18 Preliminary Biennial Budget Page 51
Employee Benefits Funds
(561) Unemployment Compensation Fund: The City of Bellingham is self-insured for unemployment benefits. (562) Workers’ Compensation Self Insurance Fund: The City of Bellingham is self-insured for worker’s compensation benefits. (565) Health Benefits Fund: Collects funds for payment of employee health care benefits including: medical, dental, and vision. These internal service funds are aggregated above. The funds are managed by the Human Resources Department.
560 Employee Benefits Funds ACTUAL ACTUAL ACTUAL REVISED PRELIMINARY PRELIMINARY
561, 562, 565 FY2013 FY2014 FY2015 FY2016 FY2017 FY2018
BEGINNING RESERVE BALANCE 3,694,583 4,568,350 4,506,562 4,714,863 3,282,746 2,861,316
MISCELLANEOUS REVENUE 13,931,399 13,083,593 12,784,981 16,111,714 15,912,316 15,928,675
TOTAL REVENUE 13,931,399 13,083,593 12,784,981 16,111,714 15,912,316 15,928,675
NON-EXPENDITURES 9,700 - - - - -
SALARIES AND WAGES 629,348 670,269 658,712 633,425 731,792 765,929
PERSONNEL BENEFITS 202,925 211,725 186,318 275,366 252,318 270,285
SUPPLIES 34,332 35,666 34,374 42,410 46,452 46,552
OTHER SERVICES AND CHARGES 12,139,037 12,159,150 12,629,816 15,465,137 15,243,183 16,298,238
INTERGOVERNMENTAL SERVICES 39,811 32,861 28,478 60,000 60,000 60,000
TOTAL EXPENDITURE 13,055,153 13,109,672 13,537,699 16,476,338 16,333,745 17,441,003
Net Surplus/(Deficit) 876,246 (26,079) (752,718) (364,624) (421,429) (1,512,328)
ESTIMATED ENDING RESERVE BALANCE 4,570,829 4,542,271 3,753,844 4,350,239 2,861,317 1,348,988

Fund Budgets
City of Bellingham Page 52 2017-18 Preliminary Biennial Budget
Public Works Administration & Engineering Fund
PW Admin & Engineering Fund: This fund was created to track and distribute the costs of management and engineering services in the Public Works Department that are shared by multiple funds that operate within the department. This internal service fund is managed by the Public Works Department.
Fire and Police Pension Funds
Pension and Benefit Funds: These trust funds are resources held in trust to provide pension and long-term care benefits for Police and Firefighters hired prior to October 1, 1977. The funds are managed by the Human Resources Department.
570 PW Admin & Engineering Fund ACTUAL ACTUAL ACTUAL REVISED PRELIMINARY PRELIMINARY
FY2013 FY2014 FY2015 FY2016 FY2017 FY2018
BEGINNING RESERVE BALANCE - - - 27,114 27,114 207,481
LICENSES AND PERMITS - - 57,245 - - -
CHARGES FOR GOODS AND SERVICES - - 6,490,447 7,402,337 7,582,274 7,584,355
MISCELLANEOUS REVENUE - - 4,792 - 6,071 6,071
OTHER FINANCING SOURCES - - 23,640 - - -
TOTAL REVENUE - - 6,576,124 7,402,337 7,588,345 7,590,426
NON-EXPENDITURES - - 330,234 335,234 335,234 335,234
SALARIES AND WAGES - - 3,294,629 3,475,579 3,712,507 3,824,725
PERSONNEL BENEFITS - - 1,360,539 1,526,591 1,640,687 1,759,078
SUPPLIES - - 168,082 70,775 76,920 77,984
OTHER SERVICES AND CHARGES - - 1,518,500 1,904,185 1,635,129 1,748,168
INTERGOVERNMENTAL SERVICES - - 4,046 7,500 7,500 7,613
CAPITAL OUTLAYS (6000 EXP OBJ) - - 6,028 - - -
TOTAL EXPENDITURE - - 6,682,059 7,319,864 7,407,978 7,752,802
Net Surplus/(Deficit) - - (105,935) 82,473 180,367 (162,376)
ESTIMATED ENDING RESERVE BALANCE - - (105,935) 109,587 207,481 45,105
611 Fire and Police Pension Funds ACTUAL ACTUAL ACTUAL REVISED PRELIMINARY PRELIMINARY
FY2013 FY2014 FY2015 FY2016 FY2017 FY2018
BEGINNING RESERVE BALANCE 11,975,695 12,946,873 14,053,528 14,050,372 16,800,000 18,003,647
TAXES 1,887,194 1,922,274 2,000,754 1,915,000 2,015,000 2,015,000
INTERGOVERNMENTAL REVENUE 129,799 140,638 127,180 130,000 120,000 120,000
MISCELLANEOUS REVENUE 1,516,270 1,631,500 1,717,053 1,694,411 1,725,908 1,723,908
NON REVENUES 208,213 210,815 213,363 221,657 222,000 222,000
TOTAL REVENUE 3,741,476 3,905,226 4,058,351 3,961,068 4,082,908 4,080,908
SALARIES AND WAGES - - - - 20,126 20,580
PERSONNEL BENEFITS 2,465,065 2,350,764 1,829,234 3,373,800 2,000,557 2,102,203
SUPPLIES 56,264 92,652 38,122 108,532 49,340 49,340
OTHER SERVICES AND CHARGES 237,649 357,631 534,513 728,144 809,238 807,331
TOTAL EXPENDITURE 2,758,979 2,801,047 2,401,869 4,210,476 2,879,261 2,979,454
Net Surplus/(Deficit) 982,497 1,104,180 1,656,481 (249,408) 1,203,647 1,101,454
ESTIMATED ENDING RESERVE BALANCE 12,958,192 14,051,053 15,710,009 13,800,964 18,003,647 19,105,101

Fund Budgets
City of Bellingham 2017-18 Preliminary Biennial Budget Page 53
Greenways Maintenance Endowment Fund
Greenways Maintenance Endowment Fund: Portions of the first and third Greenway levies were dedicated to provide for maintenance of properties acquired. The fund is managed by the Parks and Recreation Department. This is a permanent fund, legally restricted to the extent that only earnings, not principal, may be used.
Natural Resources Protection and Restoration Fund
Natural Resource Protection and Restoration Fund: Created to account for funds received as part of the Olympic Pipeline Settlement; managed by the Public Works Department. This is a permanent fund, legally restricted to the extent that only earnings, not principal, may be used.
701 Greenways Maintenance Endowmnt ACTUAL ACTUAL ACTUAL REVISED PRELIMINARY PRELIMINARY
FY2013 FY2014 FY2015 FY2016 FY2017 FY2018
BEGINNING RESERVE BALANCE 1,017,791 1,421,678 1,905,739 2,667,011 2,648,341 3,002,948
TAXES 406,954 414,795 425,051 454,500 - -
MISCELLANEOUS REVENUE 44,186 48,837 - 18,720 12,307 12,307
NON REVENUES - 13,255 246,986 350,000 350,000 350,000
TOTAL REVENUE 451,141 476,887 672,037 823,220 362,307 362,307
NON-EXPENDITURES 41,052 - - - - -
OTHER SERVICES AND CHARGES 6,080 6,127 7,448 7,057 7,700 7,474
TOTAL EXPENDITURE 47,132 6,127 7,448 7,057 7,700 7,474
Net Surplus/(Deficit) 404,008 470,760 664,588 816,163 354,607 354,832
ESTIMATED ENDING RESERVE BALANCE 1,421,799 1,892,438 2,570,327 3,483,174 3,002,948 3,357,780
702 Nat Res Protect & Restore ACTUAL ACTUAL ACTUAL REVISED PRELIMINARY PRELIMINARY
FY2013 FY2014 FY2015 FY2016 FY2017 FY2018
BEGINNING RESERVE BALANCE 2,663,018 2,596,167 2,763,149 2,528,944 3,000,000 2,673,021
MISCELLANEOUS REVENUE 41,607 78,024 78,952 69,724 71,738 67,983
NON REVENUES - 103,232 106,637 110,155 113,789 117,543
TOTAL REVENUE 41,607 181,255 185,589 179,879 185,527 185,526
OTHER SERVICES AND CHARGES 122,072 658 2,084 565,978 512,506 504
TOTAL EXPENDITURE 122,072 658 2,084 565,978 512,506 504
Net Surplus/(Deficit) (80,466) 180,597 183,505 (386,099) (326,979) 185,022
ESTIMATED ENDING RESERVE BALANCE 2,582,552 2,776,764 2,946,654 2,142,845 2,673,021 2,858,043

Fund Budgets
City of Bellingham Page 54 2017-18 Preliminary Biennial Budget
Public Facilities District Fund
Public Facilities District Fund: The Bellingham-Whatcom Public Facilities District (BWPFD) was formed by the Bellingham City Council and the Whatcom County Council in 2002 to build a regional center in Bellingham. The Public Facilities District is a discrete component unit of the City. Tax revenue is a special rebate from State Sales Tax.
965 Public Facilities District ACTUAL ACTUAL ACTUAL REVISED PRELIMINARY PRELIMINARY
FY2013 FY2014 FY2015 FY2016 FY2017 FY2018
BEGINNING RESERVE BALANCE 1,466,193 1,621,990 1,625,952 1,608,952 1,650,000 1,510,617
TAXES 1,190,697 1,219,238 1,276,979 1,224,000 1,355,000 1,395,000
MISCELLANEOUS REVENUE 37,801 23,283 19,474 25,986 25,794 25,794
TOTAL REVENUE 1,228,499 1,242,521 1,296,453 1,249,986 1,380,794 1,420,794
SALARIES AND WAGES 6,073 - - - - -
PERSONNEL BENEFITS 2,185 - - - - -
SUPPLIES - 29 - 1,030 - -
OTHER SERVICES AND CHARGES 7,497 6,406 4,533 6,555 19,180 18,174
INTERGOVERNMENTAL SERVICES 15,047 29,462 33,171 34,500 16,944 11,944
DEBT SERVICE PRINCIPAL 349,000 485,232 448,222 490,228 532,350 769,593
DEBT SERVICE INTEREST/COSTS 691,740 721,280 780,149 730,389 951,703 1,127,179
TOTAL EXPENDITURE 1,071,543 1,242,409 1,266,074 1,262,702 1,520,177 1,926,890
Net Surplus/(Deficit) 156,956 112 30,379 (12,716) (139,383) (506,096)
ESTIMATED ENDING RESERVE BALANCE 1,623,149 1,622,102 1,656,331 1,596,236 1,510,617 1,004,521

Fund Budgets
City of Bellingham 2017-18 Preliminary Biennial Budget Page 55
Citywide Total - All Funds
The following funds have been closed, and do not appear individually in the Fund Budgets Report. They
have no budget for 2017-2018, but any prior year's data will still be aggregated in this Citywide - All
Funds section of the report.
(123) Park-site Acquisition Fund
(132) Squalicum Park Olympic Fund
(135) Little Squalicum Oeser Settlement Fund
(172) Beyond Greenways Fund
(970) Public Development Authority Fund
Total All Funds ACTUAL ACTUAL ACTUAL REVISED PRELIMINARY PRELIMINARY
FY2013 FY2014 FY2015 FY2016 FY2017 FY2018
BEGINNING RESERVE BALANCE 162,174,048 160,389,165 169,636,156 151,194,374 137,327,177 129,453,090
TAXES 83,809,780 87,041,999 92,153,278 90,604,498 89,659,326 91,415,801
LICENSES AND PERMITS 2,863,049 3,167,646 3,437,866 2,756,807 2,695,136 2,696,856
INTERGOVERNMENTAL REVENUE 13,665,437 12,720,507 16,722,975 27,189,172 20,275,689 16,148,215
CHARGES FOR GOODS AND SERVICES 88,056,426 92,228,287 95,622,503 94,327,667 95,608,355 97,009,210
FINES AND PENALTIES 1,904,140 1,743,860 1,828,461 1,832,619 1,744,898 1,782,184
MISCELLANEOUS REVENUE 21,403,667 20,743,378 21,120,809 24,626,942 25,062,628 23,681,671
GAINS LOSSES AND CAPITAL CONTRIB - PROP/TRST 8,055 1,377,626 6,778,726 4,015,205 1,256,789 -
NON REVENUES 1,288,275 1,448,101 2,506,417 2,031,812 685,799 884,553
OTHER FINANCING SOURCES 23,856,534 6,962,449 14,958,670 27,702,126 24,897,203 32,504,035
TOTAL REVENUE 236,855,363 227,433,855 255,129,705 275,086,848 261,885,823 266,122,525
NON-EXPENDITURES 9,297,228 7,603,869 7,783,953 6,610,409 7,714,203 8,345,529
SALARIES AND WAGES 57,657,283 57,898,816 59,479,662 66,094,761 67,100,712 69,167,910
PERSONNEL BENEFITS 25,436,567 24,793,655 24,420,820 29,649,477 29,468,281 31,236,782
SUPPLIES 9,778,348 10,448,964 10,144,950 12,393,090 11,552,884 11,160,838
OTHER SERVICES AND CHARGES 66,592,603 74,266,859 83,569,306 96,633,489 94,680,234 87,425,121
INTERGOVERNMENTAL SERVICES 6,424,638 5,885,067 5,371,620 4,692,792 3,987,268 4,006,446
CAPITAL OUTLAYS (6000 EXP OBJ) 54,034,165 27,202,921 42,769,932 84,920,538 43,293,337 39,375,765
DEBT SERVICE PRINCIPAL 4,121,970 4,734,354 11,155,437 4,677,500 6,509,007 7,183,163
DEBT SERVICE INTEREST/COSTS 4,925,527 5,164,687 4,979,536 5,488,781 5,453,984 5,445,559
TOTAL EXPENDITURE 238,268,330 217,999,191 249,675,217 311,160,837 269,759,910 263,347,112
Net Surplus/(Deficit) (1,412,967) 9,434,663 5,454,488 (36,073,989) (7,874,087) 2,775,413
ESTIMATED ENDING RESERVE BALANCE 160,761,081 169,823,828 175,090,644 116,470,385 129,453,090 132,228,503

Department Budgets
City of Bellingham Page 56 2017-18 Preliminary Biennial Budget
Department Budgets - Public Safety
Police Department
Includes the Bellingham Police Department and WhatComm Dispatch.
Funding includes General Fund, Police Special Revenue Funds, and the Public Safety Dispatch Fund.
Police Department ACTUAL ACTUAL ACTUAL REVISED PRELIMINARY PRELIMINARY
All Funds FY2013 FY2014 FY2015 FY2016 FY2017 FY2018
TAXES 270,300 279,485 1,665,686 1,621,200 1,663,000 1,668,000
LICENSES AND PERMITS 44,804 43,422 50,011 38,000 36,000 36,000
INTERGOVERNMENTAL REVENUE 2,585,874 2,717,625 2,527,316 2,386,514 2,554,826 2,542,826
CHARGES FOR GOODS AND SERVICES 3,850,711 4,201,361 4,062,174 3,984,199 4,259,202 4,530,024
FINES AND PENALTIES 11,178 8,900 9,900 10,609 10,609 10,609
MISCELLANEOUS REVENUE 116,405 169,109 95,673 66,769 58,026 58,026
OTHER FINANCING SOURCES 368,042 - - - - -
TOTAL REVENUE 7,247,314 7,419,901 8,410,759 8,107,291 8,581,663 8,845,485
NON-EXPENDITURES 375,004 140,000 9,285 - - -
SALARIES AND WAGES 13,790,119 13,743,164 14,814,727 15,400,360 16,060,269 16,630,022
PERSONNEL BENEFITS 5,480,145 5,499,060 5,673,350 6,201,437 6,416,814 6,756,574
SUPPLIES 779,718 1,069,137 1,056,890 1,077,366 940,929 967,323
OTHER SERVICES AND CHARGES 3,415,237 3,841,393 3,627,056 3,889,807 4,178,150 4,487,695
INTERGOVERNMENTAL SERVICES 2,020,039 2,159,422 1,806,559 1,616,469 1,587,865 1,603,189
CAPITAL OUTLAYS (6000 EXP OBJ) 65,764 165,869 257,116 2,747,293 35,000 175,000
TOTAL EXPENDITURE 25,926,026 26,618,045 27,244,983 30,932,732 29,219,027 30,619,804
Police Department ACTUAL ACTUAL ACTUAL REVISED PRELIMINARY PRELIMINARY
Expenditures, Fund, Group FY2013 FY2014 FY2015 FY2016 FY2017 FY2018
001-811 Police Administration 5,504,830 5,966,495 5,572,357 5,742,203 6,036,722 6,110,029
001-821 Patrol/Traffic Operations 10,680,319 10,494,156 11,497,323 12,186,396 12,438,397 13,006,624
001-822 Police Special Operations 458,364 423,667 356,284 411,260 395,679 387,217
001-823 Police Investigations Operations 3,146,006 3,066,387 3,264,544 3,026,706 3,281,254 3,371,544
001-824 Police Off of Prof Responsibil 448,973 451,759 598,288 573,245 594,345 610,694
001-825 Police Records Operations 1,061,762 1,155,983 1,101,551 1,295,096 1,413,906 1,478,857
001-826 Police Proactive Operations 834,615 912,162 830,866 944,770 948,236 965,443
General Fund Expenditures 22,134,869 22,470,609 23,221,213 24,179,676 25,108,539 25,930,408
151-811 Police Administration 52,515 45,253 48,612 53,650 12,472 7,346
151-821 Patrol/Traffic Operations 20,567 - 55,745 28,644 36,000 36,000
151-823 Police Investigations Operations - 94,477 53,608 - 35,000 20,000
152-811 Police Administration 6,255 6,431 6,602 6,579 6,681 6,642
152-823 Police Investigations Operations 35,159 47,919 42,734 50,686 20,099 20,099
153-811 Police Administration 506,050 676,369 208,348 207,311 320,084 332,599
153-821 Patrol/Traffic Operations - 56,589 47,724 51,500 52,000 52,000
Police Sp Rev Funds Expenditures 620,546 927,038 463,373 398,370 482,336 474,686
160-829 Police Dispatch Operations 3,170,610 3,220,397 3,560,397 6,354,687 3,628,152 4,214,709
Public Safety Dispach Fund Exp 3,170,610 3,220,397 3,560,397 6,354,687 3,628,152 4,214,709
TOTAL EXPENDITURE 25,926,025 26,618,044 27,244,983 30,932,733 29,219,027 30,619,803

Department Budgets
City of Bellingham 2017-18 Preliminary Biennial Budget Page 57
Police Department ACTUAL ACTUAL ACTUAL REVISED PRELIMINARY PRELIMINARY
General Fund Expenditures FY2013 FY2014 FY2015 FY2016 FY2017 FY2018
BAD DEBT EXPENSE - - 9,285 - - -
NON-EXPENDITURES - - 9,285 - - -
SALARIES AND WAGES 11,215,981 11,064,303 12,074,888 12,665,203 13,250,086 13,759,400
OVERTIME AND HAZARD DUTY 643,325 692,831 605,466 614,396 639,641 639,641
SALARIES AND WAGES 11,859,306 11,757,134 12,680,355 13,279,599 13,889,727 14,399,041
PERSONNEL BENEFITS 4,675,093 4,700,247 4,840,405 5,246,341 5,428,372 5,697,973
PERSONNEL BENEFITS 4,675,093 4,700,247 4,840,405 5,246,341 5,428,372 5,697,973
OFFICE AND OPERATING SUPPLIES 236,152 237,715 243,264 218,249 211,565 209,741
FUEL CONSUMED 186,565 170,197 131,362 156,789 147,414 147,414
SMALL TOOLS AND MINOR EQUIPMENT 234,214 340,400 370,210 318,459 270,760 265,260
SUPPLIES 656,931 748,312 744,836 693,497 629,739 622,415
PROFESSIONAL SERVICES 693,451 1,415,517 1,465,191 692,208 1,605,236 1,689,630
COMMUNICATION 883,246 118,365 141,472 1,002,909 175,830 175,830
TRAVEL 40,356 42,070 39,797 47,970 65,628 63,628
TAXES & OPERATING ASSESSMENTS 6 82 63 - - -
OPERATING RENTALS AND LEASES 635,820 745,365 726,655 888,022 1,029,600 988,486
INSURANCE 180,917 178,840 166,499 167,082 131,976 131,976
UTILITY SERVICE 7,641 13,647 15,213 34,367 29,708 29,708
REPAIRS & MAINTENANCE 417,706 474,503 444,018 432,440 449,187 449,187
MISCELLANEOUS 65,646 95,242 81,212 98,437 91,670 100,670
OTHER SERVICES AND CHARGES 2,924,789 3,083,631 3,080,119 3,363,435 3,578,835 3,629,114
INTERGOVERNMENTAL PROF SERVS 1,998,715 2,138,098 1,785,235 1,595,145 1,581,865 1,581,865
INTERGOVERNMENTAL SERVICES 1,998,715 2,138,098 1,785,235 1,595,145 1,581,865 1,581,865
MACHINERY AND EQUIPMENT 20,036 43,188 80,979 1,659 - -
CAPITAL OUTLAYS (6000 EXP OBJ) 20,036 43,188 80,979 1,659 - -
TOTAL EXPENDITURE 22,134,870 22,470,610 23,221,213 24,179,676 25,108,539 25,930,408
Police Department ACTUAL ACTUAL ACTUAL REVISED PRELIMINARY PRELIMINARY
Special Revenue Fund Expenditures FY2013 FY2014 FY2015 FY2016 FY2017 FY2018
TRANSFERS OUT 365,000 140,000 - - - -
NON-EXPENDITURES 365,000 140,000 - - - -
OFFICE AND OPERATING SUPPLIES 35,667 107,446 138,080 180,446 138,000 103,000
FUEL CONSUMED - 3,539 55 3,090 - -
SMALL TOOLS AND MINOR EQUIPMENT 61,984 193,229 140,282 122,385 79,500 163,218
SUPPLIES 97,652 304,214 278,417 305,921 217,500 266,218
PROFESSIONAL SERVICES 135,993 222,701 57,512 51,543 71,475 101,475
COMMUNICATION - - - - 747 747
TRAVEL 4,941 36,868 11,855 10,300 55,000 39,000
OPERATING RENTALS AND LEASES - - 1,070 698 1,347 979
REPAIRS & MAINTENANCE 16,360 90,883 13,428 13,428 96,268 41,268
MISCELLANEOUS 600 9,690 12,273 16,480 5,000 5,000
OTHER SERVICES AND CHARGES 157,894 360,142 96,137 92,449 229,836 188,468
MACHINERY AND EQUIPMENT - 122,682 88,818 - 35,000 20,000
CAPITAL OUTLAYS (6000 EXP OBJ) - 122,682 88,818 - 35,000 20,000
TOTAL EXPENDITURE 620,546 927,038 463,373 398,370 482,336 474,686

Department Budgets
City of Bellingham Page 58 2017-18 Preliminary Biennial Budget
Police Department ACTUAL ACTUAL ACTUAL REVISED PRELIMINARY PRELIMINARY
Dispatch Fund Expenditures FY2013 FY2014 FY2015 FY2016 FY2017 FY2018
TRANSFERS OUT 10,004 - - - - -
NON-EXPENDITURES 10,004 - - - - -
SALARIES AND WAGES 1,727,969 1,694,501 1,752,063 1,920,841 1,970,622 2,031,061
OVERTIME AND HAZARD DUTY 202,844 291,529 382,310 199,920 199,920 199,920
SALARIES AND WAGES 1,930,813 1,986,030 2,134,373 2,120,761 2,170,542 2,230,981
PERSONNEL BENEFITS 805,052 798,813 832,945 955,096 988,442 1,058,601
PERSONNEL BENEFITS 805,052 798,813 832,945 955,096 988,442 1,058,601
OFFICE AND OPERATING SUPPLIES 8,734 4,645 6,751 44,296 44,990 44,990
FUEL CONSUMED 1,596 916 1,233 1,800 1,800 1,800
SMALL TOOLS AND MINOR EQUIPMENT 14,774 11,049 25,654 31,852 46,900 31,900
WAREHOUSE 32 - - - - -
SUPPLIES 25,136 16,610 33,637 77,948 93,690 78,690
PROFESSIONAL SERVICES 137,604 164,514 196,973 152,046 140,688 140,688
COMMUNICATION 15,610 15,884 18,772 18,078 29,553 29,553
TRAVEL 18,786 23,565 24,286 3,351 3,300 3,300
TAXES & OPERATING ASSESSMENTS 22 - - - - -
OPERATING RENTALS AND LEASES 37,778 56,519 70,544 62,455 105,805 100,147
INSURANCE 16,695 17,281 19,321 19,321 18,663 18,663
UTILITY SERVICE 25,388 24,965 24,665 33,548 33,619 33,619
REPAIRS & MAINTENANCE 69,000 78,546 81,002 129,760 20,640 326,933
MISCELLANEOUS 11,672 16,347 15,237 15,365 17,210 17,210
OTHER SERVICES AND CHARGES 332,554 397,620 450,799 433,924 369,478 670,113
INTERGOVERNMENTAL PROF SERVS 21,324 21,324 21,324 21,324 6,000 21,324
INTERGOVERNMENTAL SERVICES 21,324 21,324 21,324 21,324 6,000 21,324
MACHINERY AND EQUIPMENT 45,728 - 87,319 2,745,634 - 155,000
CAPITAL OUTLAYS (6000 EXP OBJ) 45,728 - 87,319 2,745,634 - 155,000
TOTAL EXPENDITURE 3,170,610 3,220,397 3,560,397 6,354,687 3,628,152 4,214,709

Department Budgets
City of Bellingham 2017-18 Preliminary Biennial Budget Page 59
Fire Department
Includes the Bellingham Fire Department, Prospect Fire Dispatch, and the portion of Whatcom Medic
One provided by Bellingham's Fire Department.
Funding includes General Fund, Medic One Fund, and the Public Safety Dispatch Fund.
Fire Department ACTUAL ACTUAL ACTUAL REVISED PRELIMINARY PRELIMINARY
All Funds FY2013 FY2014 FY2015 FY2016 FY2017 FY2018
TAXES - 636,485 663,189 - 617,100 617,100
LICENSES AND PERMITS 6,980 3,450 1,140 - - -
INTERGOVERNMENTAL REVENUE 82,182 629,442 375,379 888,582 1,427,253 1,461,733
CHARGES FOR GOODS AND SERVICES 7,428,212 6,929,454 5,936,463 6,026,275 5,712,653 5,814,675
MISCELLANEOUS REVENUE 102,950 106,205 51,131 71,943 35,869 35,869
OTHER FINANCING SOURCES 1,067,774 1,125,000 1,190,453 1,125,000 1,125,000 1,125,000
TOTAL REVENUE 8,688,098 9,430,037 8,217,756 8,111,800 8,917,875 9,054,377
NON-EXPENDITURES 224,381 225,635 316,286 326,163 332,221 332,221
SALARIES AND WAGES 14,595,246 14,202,090 14,179,984 16,265,220 16,319,073 16,761,292
PERSONNEL BENEFITS 4,664,763 4,252,667 4,150,856 4,767,806 5,340,740 5,565,651
SUPPLIES 729,760 596,908 511,099 721,433 658,120 659,914
OTHER SERVICES AND CHARGES 3,348,389 2,900,235 3,050,446 3,154,454 3,315,133 3,293,415
INTERGOVERNMENTAL SERVICES 4,693 729,910 765,388 4,600 621,600 621,600
CAPITAL OUTLAYS (6000 EXP OBJ) 20,272 587,138 1,398,105 115,000 302,250 15,000
DEBT SERVICE INTEREST/COSTS 14,651 21,850 8,293 6,495 5,100 3,100
TOTAL EXPENDITURE 23,602,156 23,516,433 24,380,457 25,361,171 26,894,237 27,252,192
Fire Department ACTUAL ACTUAL ACTUAL REVISED PRELIMINARY PRELIMINARY
Expenditures, Fund - Group FY2013 FY2014 FY2015 FY2016 FY2017 FY2018
001-711 Fire Administration 1,410,287 1,660,326 1,815,749 1,902,639 1,934,314 1,941,149
001-721 Fire Operations 12,221,747 12,467,238 13,663,799 14,657,128 14,972,130 15,400,123
001-722 Fire Life Safety Operations 507,919 483,652 405,460 400,200 428,866 444,249
001-723 Fire Dept Training Operations 438,187 451,245 503,276 471,174 514,183 522,361
001-726 Emergency Management 286,870 304,292 365,097 428,592 464,723 473,805
General Fund Expenditures 14,865,010 15,366,753 16,753,381 17,859,733 18,314,216 18,781,687
160-729 Fire/EMS Dispatch Operations 1,313,246 1,319,251 1,400,709 1,500,094 1,555,838 1,591,418
Public Safety Dispach Fund Exp 1,313,246 1,319,251 1,400,709 1,500,094 1,555,838 1,591,418
470-724 Emergency Medical Services 7,423,899 6,830,430 6,226,619 6,001,343 7,024,183 6,879,087
Medic One Fund Expenditures 7,423,899 6,830,430 6,226,619 6,001,343 7,024,183 6,879,087
TOTAL EXPENDITURE 14,865,010 15,366,752 16,753,382 17,859,734 18,314,215 18,781,688

Department Budgets
City of Bellingham Page 60 2017-18 Preliminary Biennial Budget
Fire Department ACTUAL ACTUAL ACTUAL REVISED PRELIMINARY PRELIMINARY
General Fund Expenditures FY2013 FY2014 FY2015 FY2016 FY2017 FY2018
TRANSFERS OUT - 14,820 102,862 111,000 110,221 110,221
INTERFUND LOANS PRINCIPAL 208,213 210,815 213,363 215,163 222,000 222,000
NON-EXPENDITURES 208,213 225,635 316,225 326,163 332,221 332,221
SALARIES AND WAGES 9,095,619 8,681,109 8,846,671 11,123,473 10,984,932 11,304,532
OVERTIME AND HAZARD DUTY 371,088 650,383 911,536 585,930 585,930 585,930
SALARIES AND WAGES 9,466,708 9,331,492 9,758,207 11,709,403 11,570,862 11,890,462
PERSONNEL BENEFITS 3,228,810 2,988,102 3,018,870 3,429,168 3,934,778 4,095,817
PERSONNEL BENEFITS 3,228,810 2,988,102 3,018,870 3,429,168 3,934,778 4,095,817
OFFICE AND OPERATING SUPPLIES 186,439 154,719 130,801 150,389 128,485 128,485
FUEL CONSUMED 76,956 71,839 50,656 92,954 93,950 93,950
SMALL TOOLS AND MINOR EQUIPMENT 84,038 86,325 71,080 134,434 87,951 87,845
SUPPLIES 347,433 312,883 252,537 377,777 310,386 310,280
PROFESSIONAL SERVICES 180,832 570,883 573,967 256,704 657,098 671,714
COMMUNICATION 377,401 72,338 108,864 532,531 131,315 134,389
TRAVEL 8,555 14,261 11,762 18,079 18,019 16,009
TAXES & OPERATING ASSESSMENTS 3,007 3,070 430 - - -
OPERATING RENTALS AND LEASES 587,220 655,930 665,695 661,673 774,458 751,365
INSURANCE 96,487 97,283 89,574 89,574 90,328 90,328
UTILITY SERVICE 24 17,272 27,022 43,797 44,997 43,797
REPAIRS & MAINTENANCE 288,160 326,071 382,245 352,906 399,430 399,430
MISCELLANEOUS 33,169 49,119 39,388 50,864 40,624 38,175
OTHER SERVICES AND CHARGES 1,574,855 1,806,228 1,898,946 2,006,128 2,156,269 2,145,207
INTERGOVERNMENTAL PROF SERVS 4,068 93,425 102,199 4,600 4,600 4,600
INTERGOVERNMENTAL SERVICES 4,068 93,425 102,199 4,600 4,600 4,600
MACHINERY AND EQUIPMENT 20,272 587,138 1,398,105 - - -
CAPITAL OUTLAYS (6000 EXP OBJ) 20,272 587,138 1,398,105 - - -
INTEREST ON INTERFUND DEBT 14,651 11,513 8,293 6,495 5,100 3,100
DEBT ISSUE COSTS - 10,336 - - - -
DEBT SERVICE INTEREST/COSTS 14,651 21,850 8,293 6,495 5,100 3,100
TOTAL EXPENDITURE 14,865,010 15,366,752 16,753,382 17,859,734 18,314,215 18,781,688
Fire Department ACTUAL ACTUAL ACTUAL REVISED PRELIMINARY PRELIMINARY
Public Safety Dispatch Fund Expenditures FY2013 FY2014 FY2015 FY2016 FY2017 FY2018
TRANSFERS OUT 2,625 - - - - -
NON-EXPENDITURES 2,625 - - - - -
SALARIES AND WAGES 817,729 835,684 888,783 921,349 937,722 958,084
OVERTIME AND HAZARD DUTY 67,326 68,005 51,146 80,520 80,520 80,520
SALARIES AND WAGES 885,055 903,690 939,929 1,001,869 1,018,242 1,038,604
PERSONNEL BENEFITS 359,469 347,182 351,506 377,205 382,546 400,247
PERSONNEL BENEFITS 359,469 347,182 351,506 377,205 382,546 400,247
OFFICE AND OPERATING SUPPLIES 4,226 2,485 3,245 4,111 4,111 4,111
SMALL TOOLS AND MINOR EQUIPMENT 4,200 5,092 2,268 12,118 12,118 12,118
SUPPLIES 8,426 7,577 5,513 16,229 16,229 16,229
PROFESSIONAL SERVICES 27,403 25,928 63,009 61,124 44,695 44,695
COMMUNICATION 2,279 2,331 2,693 2,415 24,366 24,366
TRAVEL 3,127 8,242 6,672 8,174 8,174 8,174
OPERATING RENTALS AND LEASES 6,582 6,616 16,494 12,940 33,448 30,965
REPAIRS & MAINTENANCE 15,162 15,050 12,482 17,080 25,080 25,080
MISCELLANEOUS 3,118 2,635 2,409 3,058 3,058 3,058
OTHER SERVICES AND CHARGES 57,671 60,802 103,760 104,791 138,821 136,338
TOTAL EXPENDITURE 1,313,246 1,319,251 1,400,709 1,500,094 1,555,838 1,591,418

Department Budgets
City of Bellingham 2017-18 Preliminary Biennial Budget Page 61
Fire Department ACTUAL ACTUAL ACTUAL REVISED PRELIMINARY PRELIMINARY
Medic One Fund Expenditures FY2013 FY2014 FY2015 FY2016 FY2017 FY2018
BAD DEBT EXPENSE - - 61 - - -
TRANSFERS OUT 13,543 - - - - -
NON-EXPENDITURES 13,543 - 61 - - -
SALARIES AND WAGES 4,014,526 3,712,020 3,155,253 3,366,949 3,488,348 3,571,604
OVERTIME AND HAZARD DUTY 228,958 254,888 326,595 186,999 241,621 260,621
SALARIES AND WAGES 4,243,484 3,966,908 3,481,848 3,553,948 3,729,969 3,832,225
PERSONNEL BENEFITS 1,076,484 917,383 780,479 961,433 1,023,416 1,069,587
PERSONNEL BENEFITS 1,076,484 917,383 780,479 961,433 1,023,416 1,069,587
OFFICE AND OPERATING SUPPLIES 283,788 224,152 213,062 242,587 240,969 240,969
FUEL CONSUMED 59,152 50,041 37,276 54,986 54,986 54,986
SMALL TOOLS AND MINOR EQUIPMENT 30,962 2,256 2,712 29,854 35,550 37,450
SUPPLIES 373,902 276,448 253,049 327,427 331,505 333,405
PROFESSIONAL SERVICES 491,903 680,939 706,933 665,932 590,347 590,346
COMMUNICATION 913,999 25,666 25,347 33,490 35,258 35,258
TRAVEL 1,736 4,856 539 3,809 3,809 3,809
TAXES & OPERATING ASSESSMENTS 11,969 1,494 19 - 20 20
OPERATING RENTALS AND LEASES 28,187 50,138 110,042 112,008 152,386 144,213
INSURANCE 44,016 15,591 13,698 13,698 10,060 10,060
UTILITY SERVICE 21,588 24,544 8,510 2,547 3,814 3,814
REPAIRS & MAINTENANCE 162,059 196,253 180,717 195,519 206,152 206,152
MISCELLANEOUS 40,405 33,725 1,936 16,532 18,197 18,197
OTHER SERVICES AND CHARGES 1,715,862 1,033,205 1,047,740 1,043,535 1,020,043 1,011,870
INTERGOVERNMENTAL PROF SERVS 625 636,485 663,189 - 617,000 617,000
INTERGOVERNMENTAL SERVICES 625 636,485 663,189 - 617,000 617,000
MACHINERY AND EQUIPMENT - - - 115,000 302,250 15,000
CAPITAL OUTLAYS (6000 EXP OBJ) - - - 115,000 302,250 15,000
TOTAL EXPENDITURE 7,423,899 6,830,430 6,226,367 6,001,343 7,024,183 6,879,087

Department Budgets
City of Bellingham Page 62 2017-18 Preliminary Biennial Budget
Municipal Court
Bellingham's Municipal Court operates entirely out of the General Fund. Transfers from the Parking
Services Fund that support Municipal Court operations are shown as revenue.
Municipal Court ACTUAL ACTUAL ACTUAL REVISED PRELIMINARY PRELIMINARY
FY2013 FY2014 FY2015 FY2016 FY2017 FY2018
INTERGOVERNMENTAL REVENUE 9,900 90,250 72,200 - - -
CHARGES FOR GOODS AND SERVICES 272,860 817,175 760,236 791,701 700,000 700,000
FINES AND PENALTIES 996,526 880,598 865,551 954,175 845,914 845,914
MISCELLANEOUS REVENUE 34,467 46,997 88,394 25,000 25,000 25,000
OTHER FINANCING SOURCES 350,800 - - - - -
TOTAL REVENUE 1,664,553 1,835,020 1,786,381 1,770,876 1,570,914 1,570,914
SALARIES AND WAGES 816,944 864,251 880,853 949,392 952,936 980,846
PERSONNEL BENEFITS 370,798 387,646 392,739 442,356 448,895 480,547
SUPPLIES 42,278 22,066 24,488 50,415 45,779 45,779
OTHER SERVICES AND CHARGES 260,603 320,003 349,719 431,987 382,959 381,746
INTERGOVERNMENTAL SERVICES 285,421 334,689 284,743 347,262 327,000 327,000
TOTAL EXPENDITURE 1,776,046 1,928,655 1,932,542 2,221,412 2,157,568 2,215,918

Department Budgets
City of Bellingham 2017-18 Preliminary Biennial Budget Page 63
Department Budgets - Recreation and Culture
Parks and Recreation Department
Parks and Recreation Department ACTUAL ACTUAL ACTUAL REVISED PRELIMINARY PRELIMINARY
All Funds FY2013 FY2014 FY2015 FY2016 FY2017 FY2018
TAXES 4,554,879 4,638,751 4,753,130 4,733,311 30,500 30,500
INTERGOVERNMENTAL REVENUE 33,781 1,378,810 1,110,066 1,143,964 645,000 400,000
CHARGES FOR GOODS AND SERVICES 3,258,685 3,217,741 3,766,745 1,844,104 1,743,992 1,747,814
FINES AND PENALTIES 24 550 1,530 - - -
MISCELLANEOUS REVENUE 951,133 935,946 1,025,679 1,963,218 751,999 751,999
NON REVENUES - 13,255 246,986 350,000 350,000 350,000
OTHER FINANCING SOURCES 221,480 621,480 221,480 221,480 221,480 221,480
TOTAL REVENUE 9,019,981 10,806,532 11,125,615 10,256,077 3,742,971 3,501,793
NON-EXPENDITURES 41,562 13,255 246,986 - 400,000 400,000
SALARIES AND WAGES 3,829,774 3,959,913 3,849,599 4,479,576 4,241,663 4,362,932
PERSONNEL BENEFITS 1,679,516 1,643,169 1,605,480 1,919,140 1,892,723 2,024,201
SUPPLIES 482,155 495,858 443,603 556,205 545,900 545,900
OTHER SERVICES AND CHARGES 2,827,451 2,844,882 2,872,298 3,938,658 3,209,735 3,163,088
INTERGOVERNMENTAL SERVICES 20,148 23,277 30,264 370,360 - -
CAPITAL OUTLAYS (6000 EXP OBJ) 2,571,206 6,477,636 8,624,860 14,194,490 6,450,000 1,050,000
DEBT SERVICE INTEREST/COSTS 33,613 48,837 25,459 - - -
TOTAL EXPENDITURE 11,485,426 15,506,826 17,698,548 25,458,429 16,740,021 11,546,121

Department Budgets
City of Bellingham Page 64 2017-18 Preliminary Biennial Budget
Parks and Recreation Department ACTUAL ACTUAL ACTUAL REVISED PRELIMINARY PRELIMINARY
Expenditures , Fund - Group FY2013 FY2014 FY2015 FY2016 FY2017 FY2018
001-411 Parks and Recreation Admin 747,700 723,045 752,786 783,176 958,038 963,581
001-421 Parks Operations Management 376,318 403,558 412,268 471,461 474,873 489,369
001-422 Parks Grounds 1,526,010 1,465,874 1,440,792 1,775,312 1,610,434 1,665,006
001-423 Parks Buildings 1,682,097 1,755,592 1,767,330 1,846,604 1,719,029 1,767,530
001-431 Recreation Management 241,822 251,213 265,093 290,205 142,014 142,014
001-435 Recreation Aquatics 1,148,780 1,208,206 1,147,844 1,210,046 1,500,532 1,543,295
001-436 Sports and Enrichment 1,235,369 1,227,071 1,270,190 1,384,771 1,622,359 1,660,914
001-471 Parks Design & Development 214,976 161,362 164,203 365,937 268,486 279,674
001-472 Parks Capital Improvement 180,000 - - - - -
General Fund Expenditures 7,353,072 7,195,921 7,220,506 8,127,512 8,295,765 8,511,383
123-471 Parks Design & Development 2,514 506 185 - - -
123-472 Parks Capital Improvement 100,000 55,986 143,915 - - -
Parksite Acq (closed) Fund Expenditures 102,514 56,492 144,100 - - -
132-472 Parks Capital Improvement 15,515 - - - - -
134-471 Parks Design & Development 2,514 506 588 587 530 522
134-472 Parks Capital Improvement - 15,931 9,690 196,840 - -
135-472 Parks Capital Improvement 6,154 - - - - -
136-471 Parks Design & Development 29,906 16,449 16,601 16,601 16,741 16,741
136-472 Parks Capital Improvement 172,683 113,290 227,757 1,524,365 - -
Enviro Remediation Funds Expenditures 226,772 146,176 254,636 1,738,393 17,271 17,263
141-422 Parks Grounds 15,761 35,248 34,422 40,000 16,000 16,000
141-423 Parks Buildings 15,705 45,189 18,236 60,000 144,000 105,000
141-472 Parks Capital Improvement 67,749 179,195 449,689 40,961 42,016 43,636
142-423 Parks Buildings 122,665 58,179 41,030 40,000 25,000 25,000
142-472 Parks Capital Improvement - - 26,545 598,455 251,961 7,211
REET Funds Expenditures 221,880 317,811 569,922 779,416 478,977 196,847
161-472 Parks Capital Improvement - 250,000 89,356 - - -
TBD Fund Expenditures - 250,000 89,356 - - -
172-471 Parks Design & Development 8,283 6,523 9,971 - - -
172-472 Parks Capital Improvement 519,853 543,178 114,653 - - -
173-422 Parks Grounds - 203,493 169,831 202,966 208,039 216,779
173-423 Parks Buildings - 15,985 55,495 16,563 17,308 18,388
173-471 Parks Design & Development 13,282 17,566 29,343 28,063 100,739 95,228
173-472 Parks Capital Improvement 1,820,542 4,547,399 6,527,601 10,460,412 4,962,110 589,705
Greenways Funds Expenditures 2,361,960 5,334,144 6,906,894 10,708,004 5,288,196 920,100
177-471 Parks Design & Development 5,214 8,583 10,495 10,238 30,661 29,169
177-472 Parks Capital Improvement 359,613 1,342,711 1,867,357 3,261,290 1,449,643 1,179,156
Park Impact Fee Fund Expenditures 364,827 1,351,294 1,877,852 3,271,528 1,480,304 1,208,325
371-472 Parks Design and Development - - - - 500,000 -
Waterfront Constr Fund Expenditures - - - - 500,000 -
456-425 Parks Cemetery 552,633 547,318 522,734 626,712 554,724 566,337
Cemetery Fund Expenditures 552,633 547,318 522,734 626,712 554,724 566,337
460-426 Parks Golf Course 254,635 301,543 105,100 199,807 117,083 118,391
Golf Course Fund Expenditures 254,635 301,543 105,100 199,807 117,083 118,391
701-471 Parks Design & Development 6,080 6,127 7,448 7,057 7,700 7,474
701-472 Parks Capital Improvement 41,052 - - - - -
Greenways Maint Endowmnt Fund Exp 47,132 6,127 7,448 7,057 7,700 7,474
TOTAL EXPENDITURE 11,485,425 15,506,826 17,698,548 25,458,429 16,740,020 11,546,120

Department Budgets
City of Bellingham 2017-18 Preliminary Biennial Budget Page 65
Parks and Recreation Department ACTUAL ACTUAL ACTUAL REVISED PRELIMINARY PRELIMINARY
General Fund Expenditures FY2013 FY2014 FY2015 FY2016 FY2017 FY2018
SALARIES AND WAGES 3,157,167 3,092,005 3,074,443 3,800,015 3,591,536 3,695,458
OVERTIME AND HAZARD DUTY 26,257 30,563 37,480 23,436 23,436 23,436
SALARIES AND WAGES 3,183,424 3,122,568 3,111,923 3,823,451 3,614,972 3,718,894
PERSONNEL BENEFITS 1,557,024 1,462,713 1,433,896 1,594,289 1,596,010 1,706,752
PERSONNEL BENEFITS 1,557,024 1,462,713 1,433,896 1,594,289 1,596,010 1,706,752
OFFICE AND OPERATING SUPPLIES 276,894 270,616 260,919 310,520 313,036 313,036
FUEL CONSUMED 84,952 83,616 57,088 94,936 93,251 93,251
PURCHASES FOR RESALE 4,026 4,203 1,789 6,047 6,047 6,047
SMALL TOOLS AND MINOR EQUIPMENT 34,289 64,035 47,786 63,501 62,228 62,228
WAREHOUSE 9,372 8,771 3,061 17,067 6,627 6,627
SUPPLIES 409,534 431,241 370,643 492,071 481,189 481,189
PROFESSIONAL SERVICES 270,621 268,898 340,715 273,182 271,632 271,632
COMMUNICATION 24,676 27,228 35,764 37,402 40,107 40,107
TRAVEL 1,488 2,702 3,141 4,484 4,484 4,484
TAXES & OPERATING ASSESSMENTS 16,276 15,745 15,296 14,276 16,727 16,727
OPERATING RENTALS AND LEASES 350,418 383,319 528,598 599,264 978,482 980,782
INSURANCE 240,647 227,597 236,650 236,650 227,979 227,979
UTILITY SERVICE 618,617 724,003 618,572 547,165 538,619 539,119
REPAIRS & MAINTENANCE 458,291 476,336 454,997 439,086 462,132 462,132
MISCELLANEOUS 40,504 44,848 44,462 66,191 63,433 61,586
OTHER SERVICES AND CHARGES 2,021,539 2,170,676 2,278,196 2,217,700 2,603,594 2,604,548
INTERGOVERNMENTAL PROF SERVS 1,551 1,551 950 - - -
INTERGOVERNMENTAL SERVICES 1,551 1,551 950 - - -
MACHINERY AND EQUIPMENT - 7,172 24,898 - - -
CONSTRUCTION OF FIXED ASSETS 180,000 - - - - -
CAPITAL OUTLAYS (6000 EXP OBJ) 180,000 7,172 24,898 - - -
TOTAL EXPENDITURE 7,353,072 7,195,921 7,220,506 8,127,511 8,295,765 8,511,382

Department Budgets
City of Bellingham Page 66 2017-18 Preliminary Biennial Budget
Library
Library ACTUAL ACTUAL ACTUAL REVISED PRELIMINARY PRELIMINARY
General Fund and Library Gift Fund FY2013 FY2014 FY2015 FY2016 FY2017 FY2018
INTERGOVERNMENTAL REVENUE 999 3,393 - - - -
CHARGES FOR GOODS AND SERVICES 170,232 175,559 178,595 181,087 180,532 180,532
FINES AND PENALTIES 118,654 144,567 102,315 118,450 118,450 118,450
MISCELLANEOUS REVENUE 116,553 151,033 103,975 116,000 95,000 95,000
TOTAL REVENUE 406,438 474,553 384,886 415,537 393,982 393,982
NON-EXPENDITURES - - 60 - - -
SALARIES AND WAGES 1,775,276 1,899,301 1,948,130 2,138,306 2,155,779 2,231,261
PERSONNEL BENEFITS 751,586 767,445 791,063 952,740 948,680 1,018,588
SUPPLIES 552,380 513,731 557,362 613,071 586,249 536,249
OTHER SERVICES AND CHARGES 748,816 879,132 937,518 986,118 853,710 845,211
INTERGOVERNMENTAL SERVICES 8,484 7,045 3,454 6,500 6,500 6,500
TOTAL EXPENDITURE 3,836,543 4,066,654 4,237,588 4,696,735 4,550,918 4,637,809
Library ACTUAL ACTUAL ACTUAL REVISED PRELIMINARY PRELIMINARY
Expenditures, Fund - Group FY2013 FY2014 FY2015 FY2016 FY2017 FY2018
001-191 Library Administration 474,196 498,363 567,574 593,165 819,075 811,758
001-193 Library Services 2,746,738 2,878,741 2,947,901 3,319,954 3,224,564 3,306,711
001-195 Library Facilities 563,495 633,102 661,366 667,094 457,103 469,212
General Fund Expenditures 3,784,429 4,010,206 4,176,841 4,580,213 4,500,742 4,587,681
126-191 Library Administration 3,119 16,225 6,320 30,000 177 128
126-193 Library Services 48,994 40,224 54,426 86,522 50,000 50,000
Library Gift Fund Expenditures 52,113 56,449 60,746 116,522 50,177 50,128
TOTAL EXPENDITURE 3,836,542 4,066,655 4,237,587 4,696,735 4,550,919 4,637,809
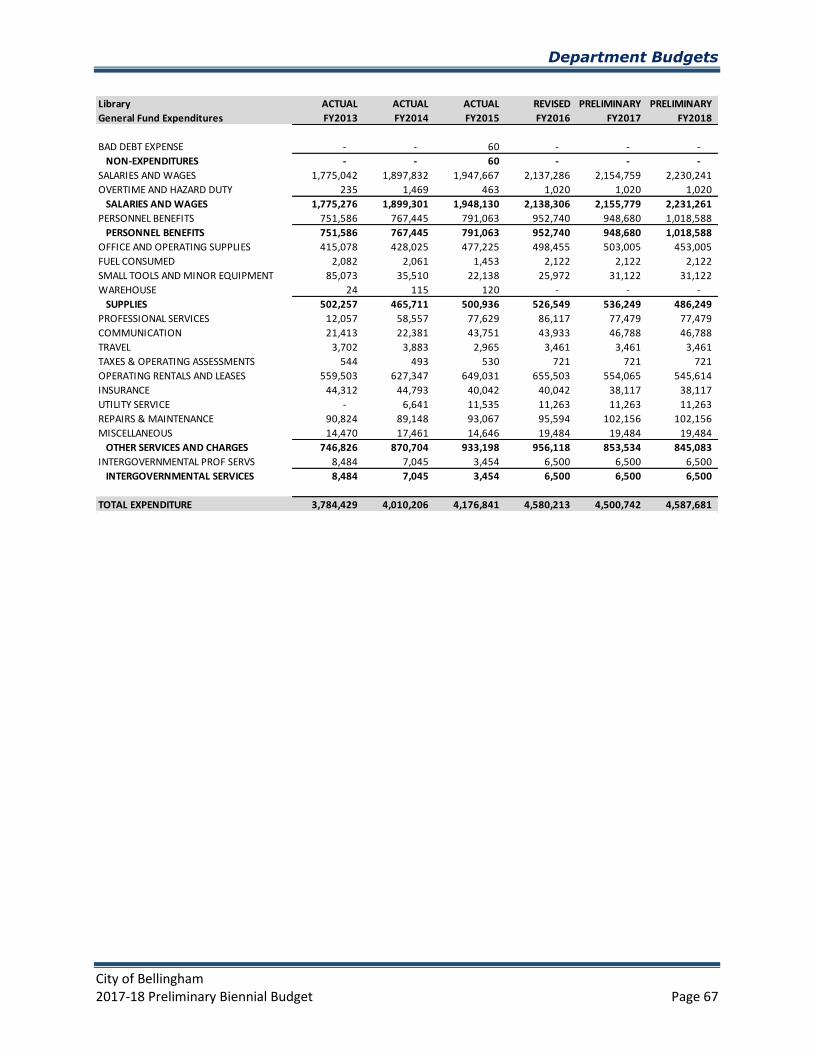
Department Budgets
City of Bellingham 2017-18 Preliminary Biennial Budget Page 67
Library ACTUAL ACTUAL ACTUAL REVISED PRELIMINARY PRELIMINARY
General Fund Expenditures FY2013 FY2014 FY2015 FY2016 FY2017 FY2018
BAD DEBT EXPENSE - - 60 - - -
NON-EXPENDITURES - - 60 - - -
SALARIES AND WAGES 1,775,042 1,897,832 1,947,667 2,137,286 2,154,759 2,230,241
OVERTIME AND HAZARD DUTY 235 1,469 463 1,020 1,020 1,020
SALARIES AND WAGES 1,775,276 1,899,301 1,948,130 2,138,306 2,155,779 2,231,261
PERSONNEL BENEFITS 751,586 767,445 791,063 952,740 948,680 1,018,588
PERSONNEL BENEFITS 751,586 767,445 791,063 952,740 948,680 1,018,588
OFFICE AND OPERATING SUPPLIES 415,078 428,025 477,225 498,455 503,005 453,005
FUEL CONSUMED 2,082 2,061 1,453 2,122 2,122 2,122
SMALL TOOLS AND MINOR EQUIPMENT 85,073 35,510 22,138 25,972 31,122 31,122
WAREHOUSE 24 115 120 - - -
SUPPLIES 502,257 465,711 500,936 526,549 536,249 486,249
PROFESSIONAL SERVICES 12,057 58,557 77,629 86,117 77,479 77,479
COMMUNICATION 21,413 22,381 43,751 43,933 46,788 46,788
TRAVEL 3,702 3,883 2,965 3,461 3,461 3,461
TAXES & OPERATING ASSESSMENTS 544 493 530 721 721 721
OPERATING RENTALS AND LEASES 559,503 627,347 649,031 655,503 554,065 545,614
INSURANCE 44,312 44,793 40,042 40,042 38,117 38,117
UTILITY SERVICE - 6,641 11,535 11,263 11,263 11,263
REPAIRS & MAINTENANCE 90,824 89,148 93,067 95,594 102,156 102,156
MISCELLANEOUS 14,470 17,461 14,646 19,484 19,484 19,484
OTHER SERVICES AND CHARGES 746,826 870,704 933,198 956,118 853,534 845,083
INTERGOVERNMENTAL PROF SERVS 8,484 7,045 3,454 6,500 6,500 6,500
INTERGOVERNMENTAL SERVICES 8,484 7,045 3,454 6,500 6,500 6,500
TOTAL EXPENDITURE 3,784,429 4,010,206 4,176,841 4,580,213 4,500,742 4,587,681

Department Budgets
City of Bellingham Page 68 2017-18 Preliminary Biennial Budget
Museum
Support for the Whatcom Museum is provided out of the General Fund.
Other Financing Sources is a transfer in from the Tourism Fund. This took place in 2014 and prior, but
coding was change so the revenue would be reflected in department reports.
Museum ACTUAL ACTUAL ACTUAL REVISED PRELIMINARY PRELIMINARY
FY2013 FY2014 FY2015 FY2016 FY2017 FY2018
INTERGOVERNMENTAL REVENUE 50,686 3,540 4,076 5,000 5,000 5,000
MISCELLANEOUS REVENUE 1,504 208 - - - -
OTHER FINANCING SOURCES - - 150,000 150,000 150,000 150,000
TOTAL REVENUE 52,190 3,748 154,076 155,000 155,000 155,000
SALARIES AND WAGES 714,152 750,100 667,555 752,678 718,698 741,224
PERSONNEL BENEFITS 334,466 338,833 289,246 329,590 331,579 355,372
SUPPLIES 43,350 16,367 13,691 21,427 12,732 12,732
OTHER SERVICES AND CHARGES 309,750 295,035 466,907 474,365 564,229 567,846
TOTAL EXPENDITURE 1,401,718 1,400,335 1,437,398 1,578,060 1,627,237 1,677,173

Department Budgets
City of Bellingham 2017-18 Preliminary Biennial Budget Page 69
Department Budgets - Planning and Community Development
Planning & Community Development Department
Planning & Community Development ACTUAL ACTUAL ACTUAL REVISED PRELIMINARY PRELIMINARY
Department - All Funds FY2013 FY2014 FY2015 FY2016 FY2017 FY2018
TAXES 4,120,653 4,305,362 4,474,718 4,515,800 4,515,800 4,561,275
LICENSES AND PERMITS 1,457,709 1,779,921 1,917,093 1,404,807 1,310,136 1,310,136
INTERGOVERNMENTAL REVENUE 1,268,563 855,370 1,215,804 3,831,059 2,821,112 2,832,823
CHARGES FOR GOODS AND SERVICES 1,535,402 1,630,024 1,719,285 1,484,392 1,461,851 1,480,451
FINES AND PENALTIES 50 50 50 - - -
MISCELLANEOUS REVENUE 158,189 141,129 212,236 126,009 131,904 131,904
TOTAL REVENUE 8,540,566 8,711,857 9,539,187 11,362,067 10,240,803 10,316,589
NON-EXPENDITURES 222,223 150,000 150,000 150,000 150,000 150,000
SALARIES AND WAGES 2,547,698 2,572,917 3,061,563 3,474,184 3,444,240 3,558,951
PERSONNEL BENEFITS 1,083,538 1,055,020 1,202,518 1,497,563 1,502,351 1,610,154
SUPPLIES 38,192 32,242 35,630 101,379 119,825 82,430
OTHER SERVICES AND CHARGES 3,382,064 4,932,831 7,332,838 10,859,772 11,473,296 8,912,021
INTERGOVERNMENTAL SERVICES - 94 - - - -
CAPITAL OUTLAYS (6000 EXP OBJ) - - 1,594,357 42,000 - -
TOTAL EXPENDITURE 7,273,715 8,743,104 13,376,905 16,124,898 16,689,711 14,313,557
Planning and Community Development ACTUAL ACTUAL ACTUAL REVISED PRELIMINARY PRELIMINARY
Expenditures, Fund - Group FY2013 FY2014 FY2015 FY2016 FY2017 FY2018
001-521 Community Development 503,566 602,158 639,578 989,683 784,944 792,796
001-526 City Center Development 15,441 5,757 340,508 376,504 494,948 472,635
001-531 Planning Services 1,895,485 1,946,559 1,797,918 1,918,146 1,896,875 1,936,064
General Fund Expenditures 2,414,492 2,554,474 2,778,004 3,284,333 3,176,767 3,201,495
180-522 Tourism Activities and Facilities 1,080,071 1,212,795 1,303,566 2,083,241 1,819,967 1,569,609
Tourism Fund Expenditures 1,080,071 1,212,795 1,303,566 2,083,241 1,819,967 1,569,609
181-521 Community Development 184,701 1,644,148 5,082,022 3,286,060 5,374,816 3,131,765
Low Income Housing Fund Expenditures 184,701 1,644,148 5,082,022 3,286,060 5,374,816 3,131,765
190-521 Community Development 922,127 759,098 994,938 1,597,090 1,597,090 1,604,928
191-521 Community Development 754,501 613,739 656,593 2,548,620 1,544,223 1,548,096
CDBG/HOME Grant Funds Expenditures 1,676,628 1,372,837 1,651,531 4,145,710 3,141,313 3,153,024
475-541 Building Services 1,917,824 1,958,849 2,486,635 2,774,658 2,801,338 2,869,128
475-542 Rental Services - - 75,148 550,897 375,510 388,536
Development Svcs Fund Expenditures 1,917,824 1,958,849 2,561,783 3,325,555 3,176,848 3,257,664
TOTAL EXPENDITURE 7,273,716 8,743,103 13,376,906 16,124,899 16,689,711 14,313,557

Department Budgets
City of Bellingham Page 70 2017-18 Preliminary Biennial Budget
The transfer out of the Tourism Fund goes into the General Fund and is shown as revenue for the
Museum.
The Permit Center and Building Inspections, as well as the new Rental Registration and Inspection
program are operated out of the Development Services Fund
Planning and Community Development ACTUAL ACTUAL ACTUAL REVISED PRELIMINARY PRELIMINARY
Tourism Fund FY2013 FY2014 FY2015 FY2016 FY2017 FY2018
TRANSFERS OUT 150,000 150,000 150,000 150,000 150,000 150,000
NON-EXPENDITURES 150,000 150,000 150,000 150,000 150,000 150,000
SALARIES AND WAGES 10,667 9,761 15,783 16,454 17,485 18,082
SALARIES AND WAGES 10,667 9,761 15,783 16,454 17,485 18,082
PERSONNEL BENEFITS 4,721 4,438 6,745 7,708 8,109 8,703
PERSONNEL BENEFITS 4,721 4,438 6,745 7,708 8,109 8,703
OFFICE AND OPERATING SUPPLIES 41 262 823 - - -
SUPPLIES 41 262 823 - - -
PROFESSIONAL SERVICES 914,355 1,048,274 1,128,368 1,908,095 1,640,835 1,390,235
OPERATING RENTALS AND LEASES 288 45 1,507 984 3,538 2,589
MISCELLANEOUS - 15 340 - - -
OTHER SERVICES AND CHARGES 914,643 1,048,334 1,130,215 1,909,079 1,644,373 1,392,824
TOTAL EXPENDITURE 1,080,071 1,212,795 1,303,566 2,083,241 1,819,967 1,569,609
Planning and Community Development ACTUAL ACTUAL ACTUAL REVISED PRELIMINARY PRELIMINARY
General Fund Expenditures FY2013 FY2014 FY2015 FY2016 FY2017 FY2018
SALARIES AND WAGES 1,213,816 1,291,706 1,266,784 1,390,167 1,411,791 1,453,135
OVERTIME AND HAZARD DUTY 103 - - 2,198 2,198 2,198
SALARIES AND WAGES 1,213,919 1,291,706 1,266,784 1,392,365 1,413,989 1,455,333
PERSONNEL BENEFITS 531,070 549,880 532,686 585,567 611,102 655,084
PERSONNEL BENEFITS 531,070 549,880 532,686 585,567 611,102 655,084
OFFICE AND OPERATING SUPPLIES 12,349 12,110 12,930 9,940 9,940 9,940
FUEL CONSUMED 115 177 33 - - -
PURCHASES FOR RESALE - 139 - - - -
SMALL TOOLS AND MINOR EQUIPMENT 10,921 1,570 1,243 2,486 2,486 2,486
WAREHOUSE 88 176 - - - -
SUPPLIES 23,475 14,172 14,206 12,426 12,426 12,426
PROFESSIONAL SERVICES 265,474 463,749 698,236 1,031,646 809,557 754,557
COMMUNICATION 10,995 11,270 28,384 27,657 28,880 28,880
TRAVEL 5,839 3,402 1,347 10,839 10,839 10,839
TAXES & OPERATING ASSESSMENTS 2 5 8 - - -
OPERATING RENTALS AND LEASES 68,136 75,814 77,211 77,236 114,711 109,113
INSURANCE 71,066 117,831 122,321 122,321 146,122 146,122
UTILITY SERVICE 2,471 3,129 2,982 3,156 2,925 2,925
REPAIRS & MAINTENANCE 13,599 14,062 26,846 13,806 18,901 18,901
MISCELLANEOUS 208,447 9,360 6,993 7,314 7,314 7,314
OTHER SERVICES AND CHARGES 646,028 698,623 964,328 1,293,975 1,139,250 1,078,651
INTERGOVERNMENTAL PROF SERVS - 94 - - - -
INTERGOVERNMENTAL SERVICES - 94 - - - -
TOTAL EXPENDITURE 2,414,491 2,554,475 2,778,004 3,284,333 3,176,767 3,201,495

Department Budgets
City of Bellingham 2017-18 Preliminary Biennial Budget Page 71
Planning and Community Development ACTUAL ACTUAL ACTUAL REVISED PRELIMINARY PRELIMINARY
Development Services Fund FY2013 FY2014 FY2015 FY2016 FY2017 FY2018
TRANSFERS OUT 72,223 - - - - -
NON-EXPENDITURES 72,223 - - - - -
SALARIES AND WAGES 1,077,849 1,022,200 1,395,308 1,814,332 1,760,879 1,824,968
OVERTIME AND HAZARD DUTY - 6,217 121,389 - - -
SALARIES AND WAGES 1,077,849 1,028,417 1,516,697 1,814,332 1,760,879 1,824,968
PERSONNEL BENEFITS 449,448 412,497 568,218 787,506 762,141 816,508
PERSONNEL BENEFITS 449,448 412,497 568,218 787,506 762,141 816,508
OFFICE AND OPERATING SUPPLIES 8,746 6,523 9,547 67,140 48,161 48,161
FUEL CONSUMED 5,210 4,850 3,837 6,415 6,415 6,415
PURCHASES FOR RESALE - 62 - - - -
SMALL TOOLS AND MINOR EQUIPMENT 184 5,153 1,314 2,575 40,000 2,575
WAREHOUSE 93 - - - - -
SUPPLIES 14,233 16,588 14,698 76,130 94,576 57,151
PROFESSIONAL SERVICES 163,728 173,246 207,029 305,288 262,469 262,469
COMMUNICATION 11,779 10,763 19,462 14,148 19,952 19,952
TRAVEL 1,005 4,261 5,607 12,189 12,189 12,189
TAXES & OPERATING ASSESSMENTS - 5 2 - - -
OPERATING RENTALS AND LEASES 64,847 248,908 153,192 86,635 123,135 117,919
INSURANCE 17,357 16,398 15,112 15,112 14,324 14,324
REPAIRS & MAINTENANCE 40,506 40,857 39,112 90,874 83,805 83,805
MISCELLANEOUS 4,849 6,910 22,653 81,341 43,378 48,378
OTHER SERVICES AND CHARGES 304,071 501,348 462,170 605,587 559,252 559,037
MACHINERY AND EQUIPMENT - - - 42,000 - -
CAPITAL OUTLAYS (6000 EXP OBJ) - - - 42,000 - -
TOTAL EXPENDITURE 1,917,824 1,958,849 2,561,783 3,325,555 3,176,849 3,257,664

Department Budgets
City of Bellingham Page 72 2017-18 Preliminary Biennial Budget
Hearing Examiner
The Hearing Examiner's office operates entirely out of the General Fund.
The City now contracts out hearing examiner services rather than employing a full-time hearing
examiner.
Hearing Examiner ACTUAL ACTUAL ACTUAL REVISED PRELIMINARY PRELIMINARY
FY2013 FY2014 FY2015 FY2016 FY2017 FY2018
CHARGES FOR GOODS AND SERVICES 28,660 28,707 22,097 29,458 22,000 22,000
TOTAL REVENUE 28,660 28,707 22,097 29,458 22,000 22,000
SALARIES AND WAGES 145,752 86,766 27,707 151,953 28,159 28,794
PERSONNEL BENEFITS 54,731 35,032 13,013 59,199 14,890 15,932
SUPPLIES 611 1,116 181 1,592 1,720 1,720
OTHER SERVICES AND CHARGES 8,879 31,094 32,946 152,547 61,236 61,067
TOTAL EXPENDITURE 209,973 154,007 73,847 365,291 106,005 107,513

Department Budgets
City of Bellingham 2017-18 Preliminary Biennial Budget Page 73
Department Budgets - General Government
Human Resources Department
Human Resources Department ACTUAL ACTUAL ACTUAL REVISED PRELIMINARY PRELIMINARY
All Funds FY2013 FY2014 FY2015 FY2016 FY2017 FY2018
TAXES 1,887,194 1,922,274 2,000,754 1,915,000 2,015,000 2,015,000
INTERGOVERNMENTAL REVENUE 129,799 140,638 127,180 130,000 120,000 120,000
CHARGES FOR GOODS AND SERVICES 554,895 554,213 624,632 627,136 672,618 672,618
MISCELLANEOUS REVENUE 15,447,669 14,715,153 14,502,141 17,806,125 17,638,224 17,652,583
NON REVENUES 208,213 210,815 213,363 221,657 222,000 222,000
TOTAL REVENUE 18,227,771 17,543,092 17,468,071 20,699,918 20,667,842 20,682,201
NON-EXPENDITURES 9,700 - - - - -
SALARIES AND WAGES 1,194,530 1,255,244 1,231,703 1,286,371 1,490,362 1,533,624
PERSONNEL BENEFITS 2,923,871 2,812,968 2,265,221 3,925,239 2,602,154 2,735,184
SUPPLIES 113,783 148,177 84,515 178,008 118,615 118,715
OTHER SERVICES AND CHARGES 12,642,956 12,786,015 13,481,058 16,490,016 16,306,421 17,357,201
INTERGOVERNMENTAL SERVICES 43,809 36,536 32,898 64,900 64,900 64,900
TOTAL EXPENDITURE 16,928,649 17,038,940 17,095,395 21,944,534 20,582,452 21,809,624
Human Resources Department ACTUAL ACTUAL ACTUAL REVISED PRELIMINARY PRELIMINARY
Expenditures, Fund - Group FY2013 FY2014 FY2015 FY2016 FY2017 FY2018
001-221 Human Resources Svcs and Admin 1,114,516 1,128,221 1,155,827 1,257,720 938,999 976,985
001-231 HR Personnel, Benefits and Budget - - - - 430,447 412,182
General Fund Expenditures 1,114,516 1,128,221 1,155,827 1,257,720 1,369,446 1,389,167
561-244 Unemployment Benefits Services 113,619 118,361 114,236 179,744 179,793 179,995
562-245 Workers Comp Benefits Services 580,073 609,470 577,706 796,020 776,450 778,113
565-246 Health Benefits Services 12,361,462 12,381,841 12,845,756 15,500,574 15,377,503 16,482,895
Benefits Funds Expenditures 13,055,154 13,109,672 13,537,698 16,476,338 16,333,746 17,441,003
612-247 Pension Benefits Services 1,790,681 1,803,413 1,488,299 2,602,857 1,840,423 1,899,791
613-247 Pension Benefits Services 968,298 997,634 913,570 1,607,619 1,038,838 1,079,662
Pension Trust Funds Expenditures 2,758,979 2,801,047 2,401,869 4,210,476 2,879,261 2,979,453
TOTAL EXPENDITURE 16,928,649 17,038,940 17,095,394 21,944,534 20,582,453 21,809,623

Department Budgets
City of Bellingham Page 74 2017-18 Preliminary Biennial Budget
Human Resources Department ACTUAL ACTUAL ACTUAL REVISED PRELIMINARY PRELIMINARY
General Fund Expenditures FY2013 FY2014 FY2015 FY2016 FY2017 FY2018
SALARIES AND WAGES 565,182 584,974 572,991 652,334 737,832 746,504
OVERTIME AND HAZARD DUTY - - - 612 612 612
SALARIES AND WAGES 565,182 584,974 572,991 652,946 738,444 747,116
PERSONNEL BENEFITS 255,881 250,479 249,669 276,073 349,279 362,696
PERSONNEL BENEFITS 255,881 250,479 249,669 276,073 349,279 362,696
OFFICE AND OPERATING SUPPLIES 15,853 11,559 8,118 22,063 17,820 17,820
SMALL TOOLS AND MINOR EQUIPMENT 7,333 8,295 3,901 5,003 5,003 5,003
WAREHOUSE - 5 - - - -
SUPPLIES 23,186 19,859 12,018 27,066 22,823 22,823
PROFESSIONAL SERVICES 121,780 138,275 224,032 186,943 129,895 129,895
COMMUNICATION 5,708 6,212 7,566 7,716 7,060 7,060
TRAVEL 8,492 7,282 4,759 16,480 16,480 16,480
OPERATING RENTALS AND LEASES 33,149 36,194 37,728 36,011 47,573 45,205
INSURANCE 7,908 8,236 13,596 13,596 10,305 10,305
REPAIRS & MAINTENANCE 19,054 23,930 22,534 24,379 31,076 31,076
MISCELLANEOUS 70,179 49,105 6,514 11,610 11,610 11,610
OTHER SERVICES AND CHARGES 266,270 269,234 316,729 296,735 254,000 251,632
INTERGOVERNMENTAL PROF SERVS 3,997 3,675 4,420 4,900 4,900 4,900
INTERGOVERNMENTAL SERVICES 3,997 3,675 4,420 4,900 4,900 4,900
TOTAL EXPENDITURE 1,114,516 1,128,221 1,155,827 1,257,720 1,369,446 1,389,167

Department Budgets
City of Bellingham 2017-18 Preliminary Biennial Budget Page 75
Information Technology Services Department
Information Technology Services ACTUAL ACTUAL ACTUAL REVISED PRELIMINARY PRELIMINARY
Department - All Funds FY2013 FY2014 FY2015 FY2016 FY2017 FY2018
LICENSES AND PERMITS 443,027 464,673 428,238 292,000 313,000 313,000
INTERGOVERNMENTAL REVENUE - 8,811 9,685 - - -
CHARGES FOR GOODS AND SERVICES 1,388,505 2,799,007 2,576,973 2,288,159 3,665,260 3,921,913
MISCELLANEOUS REVENUE 134,653 151,813 153,193 148,615 141,516 141,516
OTHER FINANCING SOURCES 1,080,245 350,234 330,234 335,234 335,234 335,234
TOTAL REVENUE 3,046,430 3,774,537 3,498,323 3,064,008 4,455,010 4,711,663
NON-EXPENDITURES 65,890 - - - - -
SALARIES AND WAGES 1,665,207 1,781,542 1,807,860 1,937,874 2,102,351 2,160,936
PERSONNEL BENEFITS 656,842 690,580 694,921 803,086 864,284 926,824
SUPPLIES 665,662 761,168 753,278 544,202 653,053 605,953
OTHER SERVICES AND CHARGES 1,440,045 1,557,325 1,827,512 1,780,742 1,577,743 1,661,175
INTERGOVERNMENTAL SERVICES 840 - - 1,180 - -
CAPITAL OUTLAYS (6000 EXP OBJ) - 210,187 237,053 1,602,924 2,376,788 2,016,300
TOTAL EXPENDITURE 4,494,486 5,000,801 5,320,624 6,670,008 7,574,218 7,371,189
Information Technology Svcs Department ACTUAL ACTUAL ACTUAL REVISED PRELIMINARY PRELIMINARY
Expenditures, Fund - Group FY2013 FY2014 FY2015 FY2016 FY2017 FY2018
001-253 ITSD Services 2,376,596 2,544,315 2,610,134 2,917,559 3,132,405 3,311,715
General Fund Expenditures 2,376,596 2,544,315 2,610,134 2,917,559 3,132,405 3,311,715
162-254 Government and Ed Access TV 212,518 244,188 227,127 252,549 338,979 348,471
162-256 PEG Access TV 46,000 46,784 83,369 121,702 490,000 -
163-251 Equipment/PEG 28,724 24,894 54,885 95,000 200,000 95,000
BTV / PEG TV Funds Expenditures 287,242 315,866 365,381 469,251 1,028,979 443,471
540-255 Telecommunication 487,178 420,723 382,516 415,493 487,919 431,122
541-252 Technology Replacements 722,464 742,989 977,019 1,683,958 2,215,465 1,972,117
542-258 Computer Infrastructure Replace 279,001 646,969 652,527 808,923 820,629 820,629
543-257 GIS Administration 342,005 329,938 333,045 374,824 378,822 392,134
Telecom / Tech Funds Expenditures 1,830,648 2,140,619 2,345,107 3,283,198 3,902,835 3,616,002
TOTAL EXPENDITURE 4,494,486 5,000,800 5,320,622 6,670,008 8,064,219 7,371,188

Department Budgets
City of Bellingham Page 76 2017-18 Preliminary Biennial Budget
Information Technology Svcs Department ACTUAL ACTUAL ACTUAL REVISED PRELIMINARY PRELIMINARY
General Fund Expenditures FY2013 FY2014 FY2015 FY2016 FY2017 FY2018
SALARIES AND WAGES 1,249,043 1,332,430 1,353,681 1,461,117 1,611,629 1,656,932
OVERTIME AND HAZARD DUTY 6,125 7,134 1,605 2,550 5,500 5,500
SALARIES AND WAGES 1,255,168 1,339,564 1,355,286 1,463,667 1,617,129 1,662,432
PERSONNEL BENEFITS 498,335 519,058 518,065 606,193 659,465 707,361
PERSONNEL BENEFITS 498,335 519,058 518,065 606,193 659,465 707,361
OFFICE AND OPERATING SUPPLIES 12,822 10,502 25,294 18,980 18,265 18,365
FUEL CONSUMED 243 66 212 467 467 467
SMALL TOOLS AND MINOR EQUIPMENT 21,861 16,704 5,312 5,595 4,505 4,505
SUPPLIES 34,926 27,273 30,818 25,042 23,237 23,337
PROFESSIONAL SERVICES 27,960 45,019 47,879 47,470 46,366 46,366
COMMUNICATION 9,463 9,933 11,507 12,703 11,886 11,886
TRAVEL 7,190 8,983 10,286 8,947 8,947 8,947
TAXES & OPERATING ASSESSMENTS - - - - - -
OPERATING RENTALS AND LEASES 235,718 251,237 264,169 267,700 300,503 295,167
INSURANCE 10,134 9,854 9,105 9,105 9,057 9,057
UTILITY SERVICE 1,670 2,884 3,466 3,986 3,395 3,595
REPAIRS & MAINTENANCE 290,465 320,528 348,835 453,095 436,286 527,433
MISCELLANEOUS 4,728 9,982 10,719 18,471 16,134 16,134
OTHER SERVICES AND CHARGES 587,328 658,419 705,966 821,477 832,574 918,585
INTERGOVERNMENTAL PROF SERVS 840 - - 1,180 - -
INTERGOVERNMENTAL SERVICES 840 - - 1,180 - -
TOTAL EXPENDITURE 2,376,596 2,544,315 2,610,134 2,917,559 3,132,405 3,311,715
Information Technology Svcs Department ACTUAL ACTUAL ACTUAL REVISED PRELIMINARY PRELIMINARY
Public / Ed / Govt TV Funds Expenditures FY2013 FY2014 FY2015 FY2016 FY2017 FY2018
TRANSFERS OUT 46,000 - - - 490,000 -
NON-EXPENDITURES 46,000 - - - 490,000 -
SALARIES AND WAGES 124,674 146,279 144,778 144,488 145,803 150,703
SALARIES AND WAGES 124,674 146,279 144,778 144,488 145,803 150,703
PERSONNEL BENEFITS 44,506 57,555 59,687 66,230 66,912 71,813
PERSONNEL BENEFITS 44,506 57,555 59,687 66,230 66,912 71,813
OFFICE AND OPERATING SUPPLIES 4,890 5,121 4,643 7,106 7,106 7,106
SMALL TOOLS AND MINOR EQUIPMENT 29,166 38,150 58,148 9,769 3,901 4,101
SUPPLIES 34,056 43,272 62,791 16,875 11,007 11,207
PROFESSIONAL SERVICES 16,791 40,044 73,684 119,655 84,988 84,988
COMMUNICATION 1,264 1,434 1,370 1,385 1,347 1,347
TRAVEL 613 528 - 1,231 1,231 1,231
TAXES & OPERATING ASSESSMENTS - 2 - - - -
OPERATING RENTALS AND LEASES 18,571 26,097 22,697 22,274 25,131 24,623
REPAIRS & MAINTENANCE 562 269 274 1,486 1,486 1,486
MISCELLANEOUS 206 387 100 627 1,073 1,073
OTHER SERVICES AND CHARGES 38,007 68,761 98,125 146,658 115,256 114,748
MACHINERY AND EQUIPMENT - - - 95,000 200,000 95,000
CAPITAL OUTLAYS (6000 EXP OBJ) - - - 95,000 200,000 95,000
TOTAL EXPENDITURE 287,242 315,866 365,381 469,251 1,028,979 443,471
Department Budgets
City of Bellingham 2017-18 Preliminary Biennial Budget Page 77
Information Technology Svcs Department ACTUAL ACTUAL ACTUAL REVISED PRELIMINARY PRELIMINARY
Telecom / Tech Funds Expenditures FY2013 FY2014 FY2015 FY2016 FY2017 FY2018
TRANSFERS OUT 19,890 - - - - -
NON-EXPENDITURES 19,890 - - - - -
SALARIES AND WAGES 285,366 295,684 307,796 329,719 339,418 347,802
OVERTIME AND HAZARD DUTY - 14 - - - -
SALARIES AND WAGES 285,366 295,698 307,796 329,719 339,418 347,802
PERSONNEL BENEFITS 114,001 113,968 117,169 130,663 137,907 147,650
PERSONNEL BENEFITS 114,001 113,968 117,169 130,663 137,907 147,650
OFFICE AND OPERATING SUPPLIES 219,884 255,761 263,625 174,666 183,614 183,614
SMALL TOOLS AND MINOR EQUIPMENT 376,796 434,862 396,044 327,619 435,195 387,795
SUPPLIES 596,681 690,623 659,669 502,285 618,809 571,409
PROFESSIONAL SERVICES 418,774 265,634 454,638 187,747 116,393 116,393
COMMUNICATION 176,296 185,533 206,012 202,482 225,768 225,768
TRAVEL 4,750 5,429 4,033 4,429 4,429 4,429
TAXES & OPERATING ASSESSMENTS - 96 262 - - -
OPERATING RENTALS AND LEASES - 77,242 90,819 99,154 8,352 6,281
REPAIRS & MAINTENANCE 210,063 294,502 259,258 314,175 270,351 270,351
MISCELLANEOUS 4,827 1,708 8,400 4,620 4,620 4,620
OTHER SERVICES AND CHARGES 814,710 830,145 1,023,421 812,607 629,913 627,842
MACHINERY AND EQUIPMENT - 210,187 237,053 1,507,924 2,176,788 1,921,300
CAPITAL OUTLAYS (6000 EXP OBJ) - 210,187 237,053 1,507,924 2,176,788 1,921,300
TOTAL EXPENDITURE 1,830,648 2,140,620 2,345,108 3,283,198 3,902,834 3,616,002

Department Budgets
City of Bellingham Page 78 2017-18 Preliminary Biennial Budget
Finance Department
Finance Department ACTUAL ACTUAL ACTUAL REVISED PRELIMINARY PRELIMINARY
All Funds FY2013 FY2014 FY2015 FY2016 FY2017 FY2018
CHARGES FOR GOODS AND SERVICES 2,099,915 2,079,082 2,080,228 2,088,276 2,246,787 2,246,787
FINES AND PENALTIES 1,583 506 278 - - -
MISCELLANEOUS REVENUE 832,260 705,171 660,063 989,242 1,306,863 1,332,583
NON REVENUES 349,000 382,000 341,585 - 10 195,010
OTHER FINANCING SOURCES 930,039 972,223 953,800 1,328,225 1,345,489 1,366,814
TOTAL REVENUE 4,212,798 4,138,982 4,035,955 4,405,743 4,899,149 5,141,194
NON-EXPENDITURES 1,000,000 - - - - 500,000
SALARIES AND WAGES 1,164,341 1,137,541 1,191,561 1,318,506 1,316,337 1,359,949
PERSONNEL BENEFITS 532,102 504,606 525,703 624,031 627,669 673,033
SUPPLIES 26,924 21,576 14,756 43,541 43,541 43,541
OTHER SERVICES AND CHARGES 253,901 197,616 213,273 229,055 246,291 242,618
INTERGOVERNMENTAL SERVICES 104,141 100,239 106,390 142,894 126,484 126,484
DEBT SERVICE PRINCIPAL 1,375,686 1,386,839 1,396,603 1,686,512 1,785,577 2,094,967
DEBT SERVICE INTEREST/COSTS 505,393 474,485 475,680 588,399 836,071 769,141
TOTAL EXPENDITURE 4,962,490 3,822,902 3,923,967 4,632,938 4,981,969 5,809,734
Finance Department ACTUAL ACTUAL ACTUAL REVISED PRELIMINARY PRELIMINARY
Expenditures, Fund - Group FY2013 FY2014 FY2015 FY2016 FY2017 FY2018
001-211 Finance Administration 486,215 381,772 377,998 384,106 399,378 411,893
001-213 Finance Services 1,384,045 1,480,733 1,572,863 1,856,293 1,846,671 1,915,566
001-214 Records, Microfilm 211,151 99,073 100,823 117,628 114,273 118,167
General Fund Expenditures 2,081,411 1,961,578 2,051,684 2,358,027 2,360,322 2,445,626
224-911 Debt Service Administration 257,938 257,613 261,335 266,838 265,063 268,063
225-911 Debt Service Administration 1,307,592 1,353,866 1,274,377 1,316,213 1,355,413 1,396,413
227-911 Debt Service Administration - - - - 312,038 507,038
231-911 Debt Service Administration 17,963 17,963 17,963 17,964 17,964 17,964
235-911 Debt Service Administration 217,852 231,882 318,608 673,896 671,170 674,630
245-911 Debt Service Administration 1,000,000 - - - - 500,000
270-911 Debt Service Administration 79,734 - - - - -
Debt Service Funds Expenditures 2,881,079 1,861,324 1,872,283 2,274,911 2,621,648 3,364,108
TOTAL EXPENDITURE 4,962,490 3,822,902 3,923,967 4,632,938 4,981,970 5,809,734

Department Budgets
City of Bellingham 2017-18 Preliminary Biennial Budget Page 79
Finance Department ACTUAL ACTUAL ACTUAL REVISED PRELIMINARY PRELIMINARY
General Fund Expenditures FY2013 FY2014 FY2015 FY2016 FY2017 FY2018
SALARIES AND WAGES 1,164,005 1,136,120 1,188,356 1,315,344 1,313,175 1,356,787
OVERTIME AND HAZARD DUTY 337 1,421 3,205 3,162 3,162 3,162
SALARIES AND WAGES 1,164,341 1,137,541 1,191,561 1,318,506 1,316,337 1,359,949
PERSONNEL BENEFITS 529,352 504,606 525,703 624,031 627,669 673,033
PENSION & DISABILITY PAYMENTS 2,750 - - - - -
PERSONNEL BENEFITS 532,102 504,606 525,703 624,031 627,669 673,033
OFFICE AND OPERATING SUPPLIES 14,949 20,692 9,625 38,010 38,010 38,010
FUEL CONSUMED 1,529 - - - - -
SMALL TOOLS AND MINOR EQUIPMENT 10,446 884 5,085 5,531 5,531 5,531
WAREHOUSE - - 46 - - -
SUPPLIES 26,924 21,576 14,756 43,541 43,541 43,541
PROFESSIONAL SERVICES 46,713 54,546 68,187 53,799 46,401 46,401
COMMUNICATION 61,476 10,785 21,994 19,990 21,068 21,068
TRAVEL 3,982 963 1,770 5,392 5,392 5,392
TAXES & OPERATING ASSESSMENTS 9 1 - - - -
OPERATING RENTALS AND LEASES 88,282 76,151 78,681 82,070 106,834 103,162
INSURANCE 12,466 11,882 10,189 10,189 9,227 9,227
UTILITY SERVICE - - 18 - - -
REPAIRS & MAINTENANCE 29,823 32,913 23,189 41,177 40,931 40,931
MISCELLANEOUS 11,149 10,374 9,245 16,438 16,438 16,438
OTHER SERVICES AND CHARGES 253,901 197,616 213,273 229,055 246,291 242,618
INTERGOVERNMENTAL PROF SERVS 104,141 100,239 106,390 142,894 126,484 126,484
INTERGOVERNMENTAL SERVICES 104,141 100,239 106,390 142,894 126,484 126,484
TOTAL EXPENDITURE 2,081,410 1,961,578 2,051,684 2,358,027 2,360,321 2,445,626

Department Budgets
City of Bellingham Page 80 2017-18 Preliminary Biennial Budget
Legal Department
Legal Department ACTUAL ACTUAL ACTUAL REVISED PRELIMINARY PRELIMINARY
All Funds FY2013 FY2014 FY2015 FY2016 FY2017 FY2018
INTERGOVERNMENTAL REVENUE 8,620 11,861 25,532 15,876 12,129 12,129
CHARGES FOR GOODS AND SERVICES 1,683,365 1,643,689 1,541,618 1,504,849 1,566,459 1,566,459
FINES AND PENALTIES 32,803 37,360 7,891 35,646 35,646 35,646
MISCELLANEOUS REVENUE 43,260 43,180 48,649 43,895 55,472 55,472
TOTAL REVENUE 1,768,048 1,736,090 1,623,689 1,600,266 1,669,706 1,669,706
SALARIES AND WAGES 1,015,475 1,073,922 1,080,534 1,178,798 1,199,728 1,233,385
PERSONNEL BENEFITS 395,954 407,063 400,889 469,161 481,491 516,211
SUPPLIES 26,930 26,235 21,533 25,715 25,715 25,715
OTHER SERVICES AND CHARGES 901,463 984,758 1,029,765 1,434,218 1,384,390 1,380,663
INTERGOVERNMENTAL SERVICES 249 74 312 - - -
TOTAL EXPENDITURE 2,340,071 2,492,052 2,533,033 3,107,892 3,091,324 3,155,974
Legal Department ACTUAL ACTUAL ACTUAL REVISED PRELIMINARY PRELIMINARY
Expenditures, Fund - Group FY2013 FY2014 FY2015 FY2016 FY2017 FY2018
001-261 Legal Services 1,390,742 1,520,496 1,538,870 1,918,840 1,867,649 1,925,305
001-263 Claims, Litigation & Insurance 19,748 16,807 14,963 14,963 14,428 14,428
General Fund Expenditures 1,410,490 1,537,303 1,553,833 1,933,803 1,882,077 1,939,733
550-263 Claims, Litigation & Insurance 929,581 954,749 979,200 1,174,089 1,209,246 1,216,241
Claims & Litigation Fund Expenditures 929,581 954,749 979,200 1,174,089 1,209,246 1,216,241
TOTAL EXPENDITURE 2,340,071 2,492,052 2,533,033 3,107,892 3,091,323 3,155,974
Legal Department ACTUAL ACTUAL ACTUAL REVISED PRELIMINARY PRELIMINARY
General Fund Exenditures FY2013 FY2014 FY2015 FY2016 FY2017 FY2018
SALARIES AND WAGES 896,928 947,078 946,145 1,043,936 1,057,686 1,086,656
SALARIES AND WAGES 896,928 947,078 946,145 1,043,936 1,057,686 1,086,656
PERSONNEL BENEFITS 349,501 357,414 349,954 413,603 422,909 453,264
PERSONNEL BENEFITS 349,501 357,414 349,954 413,603 422,909 453,264
OFFICE AND OPERATING SUPPLIES 15,360 21,223 18,814 18,943 18,943 18,943
SMALL TOOLS AND MINOR EQUIPMENT 6,179 1,854 493 1,575 1,575 1,575
SUPPLIES 21,539 23,076 19,307 20,518 20,518 20,518
PROFESSIONAL SERVICES 22,836 88,199 112,091 319,071 228,028 231,263
COMMUNICATION 5,904 6,581 10,622 10,809 10,196 10,196
TRAVEL 4,434 5,951 3,257 5,551 6,086 5,551
OPERATING RENTALS AND LEASES 68,468 74,482 77,471 77,415 85,800 84,129
INSURANCE 26,664 25,398 24,815 24,815 29,840 29,840
REPAIRS & MAINTENANCE 4,711 4,743 4,646 5,326 5,556 5,556
MISCELLANEOUS 9,255 4,382 5,440 12,759 15,459 12,759
OTHER SERVICES AND CHARGES 142,272 209,735 238,343 455,746 380,965 379,295
INTERGOVERNMENTAL PROF SERVS 249 - 84 - - -
INTERGOVERNMENTAL SERVICES 249 - 84 - - -
TOTAL EXPENDITURE 1,410,490 1,537,303 1,553,833 1,933,803 1,882,077 1,939,733

Department Budgets
City of Bellingham 2017-18 Preliminary Biennial Budget Page 81
Legal Department ACTUAL ACTUAL ACTUAL REVISED PRELIMINARY PRELIMINARY
Claims & Litigation Fund Exenditures FY2013 FY2014 FY2015 FY2016 FY2017 FY2018
SALARIES AND WAGES 118,547 126,844 134,390 134,862 142,042 146,729
SALARIES AND WAGES 118,547 126,844 134,390 134,862 142,042 146,729
PERSONNEL BENEFITS 46,453 49,649 50,935 55,558 58,582 62,947
PERSONNEL BENEFITS 46,453 49,649 50,935 55,558 58,582 62,947
OFFICE AND OPERATING SUPPLIES 2,937 3,137 2,170 4,667 4,667 4,667
FUEL CONSUMED - - 55 - - -
SMALL TOOLS AND MINOR EQUIPMENT 2,454 22 - 530 530 530
SUPPLIES 5,391 3,158 2,225 5,197 5,197 5,197
PROFESSIONAL SERVICES 140,199 154,285 127,682 236,941 253,752 253,752
COMMUNICATION - - 20 - - -
TRAVEL 874 991 3,077 3,306 3,306 3,306
OPERATING RENTALS AND LEASES 18,260 18,562 21,187 20,813 28,955 26,898
INSURANCE 467,269 481,827 515,544 551,282 551,282 551,282
REPAIRS & MAINTENANCE 1,461 2,117 1,471 2,122 2,122 2,122
MISCELLANEOUS 131,128 117,242 122,440 164,008 164,008 164,008
OTHER SERVICES AND CHARGES 759,191 775,023 791,422 978,472 1,003,425 1,001,368
INTERGOVERNMENTAL PROF SERVS - 74 228 - - -
INTERGOVERNMENTAL SERVICES - 74 228 - - -
TOTAL EXPENDITURE 929,581 954,749 979,200 1,174,089 1,209,246 1,216,241

Department Budgets
City of Bellingham Page 82 2017-18 Preliminary Biennial Budget
Executive Department
The Mayor's office operates entirely out of the General Fund.
Legislative Department
The City Council office operates entirely out of the General Fund.
Executive Department - ACTUAL ACTUAL ACTUAL REVISED PRELIMINARY PRELIMINARY
Mayor's Office FY2013 FY2014 FY2015 FY2016 FY2017 FY2018
CHARGES FOR GOODS AND SERVICES 429,174 446,789 562,000 561,325 645,335 645,335
MISCELLANEOUS REVENUE 750 525 37 - - -
TOTAL REVENUE 429,924 447,314 562,037 561,325 645,335 645,335
SALARIES AND WAGES 569,045 584,265 492,254 496,829 531,948 547,303
PERSONNEL BENEFITS 226,510 219,420 176,732 194,431 206,998 220,762
SUPPLIES 21,071 14,759 23,732 12,621 12,621 12,621
OTHER SERVICES AND CHARGES 200,023 324,965 168,201 170,327 175,580 174,328
TOTAL EXPENDITURE 1,016,648 1,143,410 860,919 874,208 927,147 955,014
Legislative Department - ACTUAL ACTUAL ACTUAL REVISED PRELIMINARY PRELIMINARY
City Council Office FY2013 FY2014 FY2015 FY2016 FY2017 FY2018
CHARGES FOR GOODS AND SERVICES 239,685 272,720 286,993 286,993 337,312 337,312
MISCELLANEOUS REVENUE 11 - - - - -
TOTAL REVENUE 239,696 272,720 286,993 286,993 337,312 337,312
SALARIES AND WAGES 282,755 276,100 298,487 323,971 327,529 331,330
PERSONNEL BENEFITS 138,716 125,693 130,500 152,039 152,945 162,502
SUPPLIES 13,379 8,263 9,236 7,484 7,484 7,484
OTHER SERVICES AND CHARGES 42,122 47,714 54,475 68,351 83,885 83,157
TOTAL EXPENDITURE 476,973 457,770 492,697 551,845 571,843 584,472

Department Budgets
City of Bellingham 2017-18 Preliminary Biennial Budget Page 83
Non-Departmental
Non-Departmental ACTUAL ACTUAL ACTUAL REVISED PRELIMINARY PRELIMINARY
All Funds FY2013 FY2014 FY2015 FY2016 FY2017 FY2018
CHARGES FOR GOODS AND SERVICES 255,914 227,214 273,782 243,784 294,894 294,894
TOTAL REVENUE 255,914 227,214 273,782 243,784 294,894 294,894
NON-EXPENDITURES 3,766,224 4,847,042 3,856,673 3,175,809 3,445,799 3,263,664
OTHER SERVICES AND CHARGES 954,688 1,127,761 1,115,889 1,552,313 1,361,965 1,361,320
INTERGOVERNMENTAL SERVICES 492,759 543,615 182,003 316,530 276,000 276,000
TOTAL EXPENDITURE 5,213,671 6,518,418 5,154,564 5,044,652 5,083,764 4,900,984
Non-Departmental ACTUAL ACTUAL ACTUAL REVISED PRELIMINARY PRELIMINARY
Expenditures, Fund - Group FY2013 FY2014 FY2015 FY2016 FY2017 FY2018
001-951 Non-Departmental 4,503,559 5,754,957 3,795,997 4,367,902 4,155,444 4,205,444
Claims & Litigation Fund Expenditures 4,503,559 5,754,957 3,795,997 4,367,902 4,155,444 4,205,444
141-951 Non-Departmental 8,083 23,638 16,576 16,444 262,805 12,374
142-951 Non-Departmental 702,030 739,823 1,341,990 660,306 665,515 683,165
REET Funds Expenditures 710,113 763,461 1,358,566 676,750 928,320 695,539
TOTAL EXPENDITURE 5,213,672 6,518,418 5,154,563 5,044,652 5,083,764 4,900,983

Department Budgets
City of Bellingham Page 84 2017-18 Preliminary Biennial Budget
Department Budget - Discrete Component Unit
Public Facilities District
Public Facilities District ACTUAL ACTUAL ACTUAL REVISED PRELIMINARY PRELIMINARY
Distinct Component Unit FY2013 FY2014 FY2015 FY2016 FY2017 FY2018
TAXES 1,190,697 1,219,238 1,276,979 1,224,000 1,355,000 1,395,000
MISCELLANEOUS REVENUE 37,801 23,283 19,474 25,986 25,794 25,794
TOTAL REVENUE 1,228,499 1,242,521 1,296,453 1,249,986 1,380,794 1,420,794
SALARIES AND WAGES 6,073 - - - - -
PERSONNEL BENEFITS 2,185 - - - - -
SUPPLIES - 29 - 1,030 - -
OTHER SERVICES AND CHARGES 7,497 6,406 4,533 6,555 19,180 18,174
INTERGOVERNMENTAL SERVICES 15,047 29,462 33,171 34,500 16,944 11,944
DEBT SERVICE PRINCIPAL 349,000 485,232 448,222 490,228 532,350 769,593
DEBT SERVICE INTEREST/COSTS 691,740 721,280 780,149 730,389 951,703 1,127,179
TOTAL EXPENDITURE 1,071,543 1,242,409 1,266,074 1,262,702 1,520,177 1,926,890

Department Budgets
City of Bellingham 2017-18 Preliminary Biennial Budget Page 85
Department Budget - Public Works
Public Works Department
Public Works Department ACTUAL ACTUAL ACTUAL REVISED PRELIMINARY PRELIMINARY
All Funds FY2013 FY2014 FY2015 FY2016 FY2017 FY2018
TAXES 14,379,921 13,869,758 14,647,295 14,481,606 14,661,606 14,711,606
LICENSES AND PERMITS 162,275 202,188 241,058 151,000 151,000 152,220
INTERGOVERNMENTAL REVENUE 8,419,186 5,553,412 10,253,532 18,140,591 11,495,369 7,578,704
CHARGES FOR GOODS AND SERVICES 64,860,162 67,205,359 71,210,673 72,385,929 72,099,460 72,848,396
FINES AND PENALTIES 742,661 671,330 840,946 713,739 734,279 771,565
MISCELLANEOUS REVENUE 3,141,073 3,347,924 3,747,385 3,031,416 4,481,500 3,060,464
GAINS LOSSES AND CAPITAL CONTRIB - PROP/TRST 8,055 1,377,626 6,778,726 4,015,205 1,256,789 -
NON REVENUES 731,062 842,032 1,704,483 1,460,155 113,789 117,543
OTHER FINANCING SOURCES 19,284,942 1,715,467 11,712,703 24,142,187 20,380,000 28,205,507
TOTAL REVENUE 111,729,336 94,785,096 121,136,801 138,521,828 125,373,792 127,446,005
NON-EXPENDITURES 3,592,244 2,227,937 3,204,663 2,958,437 2,896,183 3,699,644
SALARIES AND WAGES 13,505,903 13,705,848 13,947,145 15,940,743 16,211,642 16,706,062
PERSONNEL BENEFITS 6,125,018 6,051,332 6,108,590 7,311,659 7,636,069 8,175,248
SUPPLIES 6,239,780 6,719,675 6,591,351 8,437,601 7,780,601 7,494,762
OTHER SERVICES AND CHARGES 35,589,923 40,702,555 47,004,874 51,014,203 49,486,332 43,434,394
INTERGOVERNMENTAL SERVICES 2,252,130 1,920,704 2,126,439 1,787,597 959,975 968,829
CAPITAL OUTLAYS (6000 EXP OBJ) 51,376,923 19,762,092 30,658,441 66,218,831 34,129,299 36,119,465
DEBT SERVICE PRINCIPAL 2,397,283 2,862,283 9,310,611 2,500,760 4,191,080 4,318,603
DEBT SERVICE INTEREST/COSTS 3,680,130 3,898,235 3,689,955 4,163,498 3,661,110 3,546,139
TOTAL EXPENDITURE 124,759,334 97,850,661 122,642,071 160,333,329 126,952,290 124,463,145
Public Works Department ACTUAL ACTUAL ACTUAL REVISED PRELIMINARY PRELIMINARY
Expenditures by Fund FY2013 FY2014 FY2015 FY2016 FY2017 FY2018
111 Street Fund 21,047,983 20,265,183 23,295,188 30,983,783 18,161,199 17,864,090
113 Paths & Trails Reserve Fund 2,514 506 588 587 502 501
125 Federal Building Fund 51,909 411,915 2,195,197 312,164 1,463,687 -
131 Olympic Pipeline Incident Fund 84,499 21,643 25,183 46,851 45,980 46,833
136 Environmental Remediation Fund 1,068,347 610,703 629,044 3,746,165 4,047,802 547,108
140 REET Funds (141 & 142) 1,371,082 513,751 201,768 1,656,448 2,000,000 3,500,000
161 Transportation Benefit Distr Fund 4,601,894 4,672,569 4,195,080 7,799,359 5,613,105 5,709,743
410 Water Funds (410 & 411) 20,675,137 23,538,547 29,273,857 40,725,726 30,606,612 25,878,846
420 Wastewater Fund 54,656,119 24,886,149 20,253,927 29,232,805 23,788,190 30,888,907
430 Storm & Surface Water Util ity Fund 8,098,591 8,491,247 18,292,321 16,831,432 10,887,900 11,171,327
440 Solid Waste Fund 1,383,278 1,818,875 3,037,315 1,941,293 3,617,082 2,081,732
465 Parking Services Fund 1,910,530 2,067,903 1,990,930 3,803,357 2,300,350 2,394,653
510 Fleet Admin Funds (510 & 511) 3,309,840 4,216,559 5,664,570 6,476,354 7,672,883 7,162,467
520 Purchasing & Material Mgmt Fd 2,657,140 2,435,284 2,554,146 3,647,238 3,691,513 3,485,973
530 Facilities Fund 3,718,402 3,899,169 4,348,816 5,243,929 5,135,002 5,977,661
570 PW Admin & Engineering Fund - - 6,682,059 7,319,864 7,407,978 7,752,802
702 Natural Resrc Protect & Restore Fund 122,072 658 2,084 565,978 512,506 504
TOTAL EXPENDITURE 124,759,337 97,850,661 122,642,073 160,333,333 126,952,291 124,463,147

Department Budgets
City of Bellingham Page 86 2017-18 Preliminary Biennial Budget
Public Works Department ACTUAL ACTUAL ACTUAL REVISED PRELIMINARY PRELIMINARY
Expenditures by Group FY2013 FY2014 FY2015 FY2016 FY2017 FY2018
611G Public Works Administration 2,077,550 2,232,575 1,986,211 2,149,356 2,298,584 2,428,517
628G Natural Resources 2,792,586 3,315,019 3,407,686 7,045,710 6,342,317 6,455,446
632G PW Treatment Plants Operations 10,832,336 11,085,537 9,327,632 13,962,602 12,101,504 12,468,429
634G PW Water/Wastewater Util ity Ops 16,816,846 17,203,248 17,892,332 18,399,866 17,730,631 17,951,996
636G Public Works Maintenance Ops 7,821,482 8,564,149 10,030,445 10,022,102 11,248,753 11,795,090
638G PW Transportation Management 4,707,096 5,281,979 8,297,225 8,889,632 7,281,321 5,796,044
642G Purchasing and Material Mgmt Ops 2,657,140 2,435,284 2,554,146 3,647,238 3,691,513 3,485,973
643G Public Works Financial Mgmt 4,522,459 5,409,582 8,786,267 5,676,757 6,883,376 6,899,388
644G PW Supervision and Technology 1,341,606 1,233,140 1,041,251 1,157,046 1,252,996 1,284,504
645G Public Works Fleet Operations 3,309,840 3,551,550 5,062,381 5,254,557 5,252,192 6,373,265
646G Public Works Facilities Ops 2,848,711 2,856,239 3,592,022 3,582,060 3,810,642 3,942,163
647G PW Solid Waste Remediation 1,103,983 1,128,703 2,420,483 4,235,665 6,367,302 1,267,951
648G Facilities Capital Maintenance 334,512 299,403 412,346 1,298,993 1,940,000 4,150,000
649G QECB Bond 460,505 743,827 330,103 351,864 331,230 331,230
661G Public Works Engineering Svcs 5,438,979 5,447,157 6,539,633 6,683,133 4,983,798 5,179,406
663G PW Capital Improvements 42,915,059 13,075,744 18,097,328 34,351,280 13,718,074 16,240,507
664G Public Works Construction 11,227,570 8,753,120 14,076,099 27,656,134 14,789,500 13,792,500
668G PW Watershed Acquisition/Mgmt 3,377,376 4,795,930 6,544,545 5,412,573 5,316,362 4,469,657
671G Commercial Leasing 173,699 438,475 2,243,937 556,761 1,612,197 151,079
TOTAL EXPENDITURE 124,759,335 97,850,661 122,642,072 160,333,329 126,952,292 124,463,145

Capital Plan
City of Bellingham 2017-18 Preliminary Biennial Budget Page 87
Capital Plan
DEPARTMENT 2017 2018 2019 2020 2021 2022 TOTAL
ITSD 2,376,788 2,043,300 410,628 467,803 740,486 537,895 6,576,900
Fire 302,250 15,000 1,693,800 1,807,550 15,000 15,000 3,848,600
NonDepart 1,275,543 1,343,823 710,000 1,360,000 1,410,000 1,460,000 7,559,366
Park 6,470,000 1,276,000 3,656,000 2,146,000 8,207,000 1,781,000 23,536,000
Police 35,000 175,000 191,000 155,000 155,000 155,000 866,000
PW Engineering 22,351,800 19,227,400 15,643,000 30,933,480 11,837,678 6,950,000 106,943,358
PW Nat. Resource 1,480,597 2,910,000 3,150,000 3,850,000 3,525,000 9,525,000 24,440,597
PW Operations 6,055,113 3,321,558 2,852,042 3,563,918 3,090,000 3,090,000 21,972,631
Grand Total 40,347,091 30,312,081 28,306,470 44,283,751 28,980,164 23,513,895 195,743,452
FUND 2017 2018 2019 2020 2021 2022 TOTAL
General 600,000 650,000 2,210,000 2,345,000 676,000 650,000 7,131,000
Street 3,570,000 3,423,000 2,515,000 2,740,000 2,600,000 2,700,000 17,548,000
Remediation 8,000,000 8,000,000
REET 1 1,421,228 1,132,228 1,656,000 2,066,000 2,056,000 2,106,000 10,437,456
REET 2 1,689,315 707,595 55,000 55,000 55,000 55,000 2,616,910
Fed. Sharing 35,000 20,000 36,000 91,000
Dispatch 155,000 155,000 155,000 155,000 155,000 775,000
TBD 5,000,000 5,100,000 4,794,000 4,889,880 4,987,678 - 24,771,558
PEG Equip 200,000 122,000 70,000 70,000 70,000 70,000 602,000
Green III 4,380,000 4,380,000
Impact 1,325,000 1,050,000 3,075,000 1,775,000 1,600,000 8,825,000
LIFT 250,000 250,000
WATER 6,550,000 2,550,000 4,100,000 18,000,000 1,000,000 1,000,000 33,200,000
WATER SHED 1,370,128 1,149,400 2,084,000 1,703,600 6,307,128
SEWER 4,852,000 6,955,000 2,115,000 4,115,000 3,100,000 3,100,000 24,237,000
STORM 1,605,269 2,225,000 2,150,000 3,350,000 3,525,000 9,525,000 22,380,269
SOLID 1,630,000 30,000 - 1,660,000
MEDIC 1 302,250 15,000 233,800 242,550 15,000 15,000 823,600
GOLF 80,000 80,000 80,000 80,000 80,000 80,000 480,000
PARKING 200,000 200,000 400,000
FLEET 2,310,113 2,376,558 1,787,042 1,448,918 1,340,000 1,340,000 10,602,631
PURCHASING 300,000 300,000
TECH 2,164,648 1,921,300 340,628 397,803 670,486 467,895 5,962,760
FACILITIES 700,000 650,000 650,000 650,000 650,000 650,000 3,950,000
TELECOM 12,140 12,140
Grand Total 40,347,091 30,312,081 28,306,470 44,283,751 28,980,164 23,513,895 195,743,452

Capital Plan
City of Bellingham Page 88 2017-18 Preliminary Biennial Budget
Capital Item or Project Name Division Fund# Fund 2017 BUD 2018 BUD 2019 Est. 2020 Est. 2021 Est. 2022 Est.
Telephone System Equipment Replacements Telecomm 540 TELECOM 12,140
Network/Infrastructure - High priority Technology 541 TECH 67,500 15,000
Hansen Work Management System Replacement Technology 541 TECH 100,000 700,000
GIS Data Update - LIDAR Processing GIS 541 TECH 26,000
Financial System Replacement Technology 541 TECH 1,500,000 1,000,000
Computer Applications - High Priority Technology 541 TECH 227,500 120,000
Chambers Equipment BTV 163 PEG Equip 130,000 25,000
BTV10 and Access Bellingham Equipment BTV 163 PEG Equip 70,000 97,000 70,000 70,000 70,000 70,000
Annual Network Infrastructure Replacements Technology 541 TECH 243,648 86,300 130,628 217,803 340,486 267,895
Annual Computer Applications - Forecast Technology 541 TECH 210,000 180,000 330,000 200,000
Staff Vehicles Operations 001 General 60,000 65,000
Ladder Truck Operations 001 General 1,500,000
Fire Engines (2) Operations 001 General 1,400,000
EMS Vehicle Ambulance 470 MEDIC 1 85,000
Annual Miscellaneous Equipment Ambulance 470 MEDIC 1 15,000 15,000 15,000 15,000 15,000 15,000
Ambulance Replacement Ambulance 470 MEDIC 1 202,250 218,800 227,550
Mt. Baker Theatre and Children's Museum Debt Service PFD
Bond
141 REET 1 650,000 700,000 750,000
Indirect Cost Allocation Plan FINANCE 142 REET 2 8,375 8,375 30,000 30,000 30,000 30,000
Indirect Cost Allocation Plan FINANCE 141 REET 1 11,228 11,228 30,000 30,000 30,000 30,000
Debt Service Civic Field Debt Service PFD
Bond
142 REET 2 655,940 674,220
Annual Facilities Maintenance Program Transfer to Reserve GF 001 General 600,000 650,000 650,000 650,000 650,000 650,000
Woodstock Gates House Boiler Replacement Operations 141 REET 1 70,000
Whatcom Waterway Park D&D 177 Impact 1,000,000
Van Wyck Park D&D 177 Impact 1,000,000
Three Quarter Ton Super Duty Pickup Truck Operations 001 General 26,000
Sports Field Lighting Relamping Operations 141 REET 1 24,000 15,000 15,000 15,000 15,000 15,000
Sidewalk and Curb Replacement Operations 141 REET 1 25,000 25,000 25,000 25,000 25,000 25,000
Samish Crest Trail D&D 177 Impact 400,000
Roof Replacement Operations 141 REET 1 20,000 20,000
Restroom at Little Squalicum Park D&D 141 REET 1 200,000
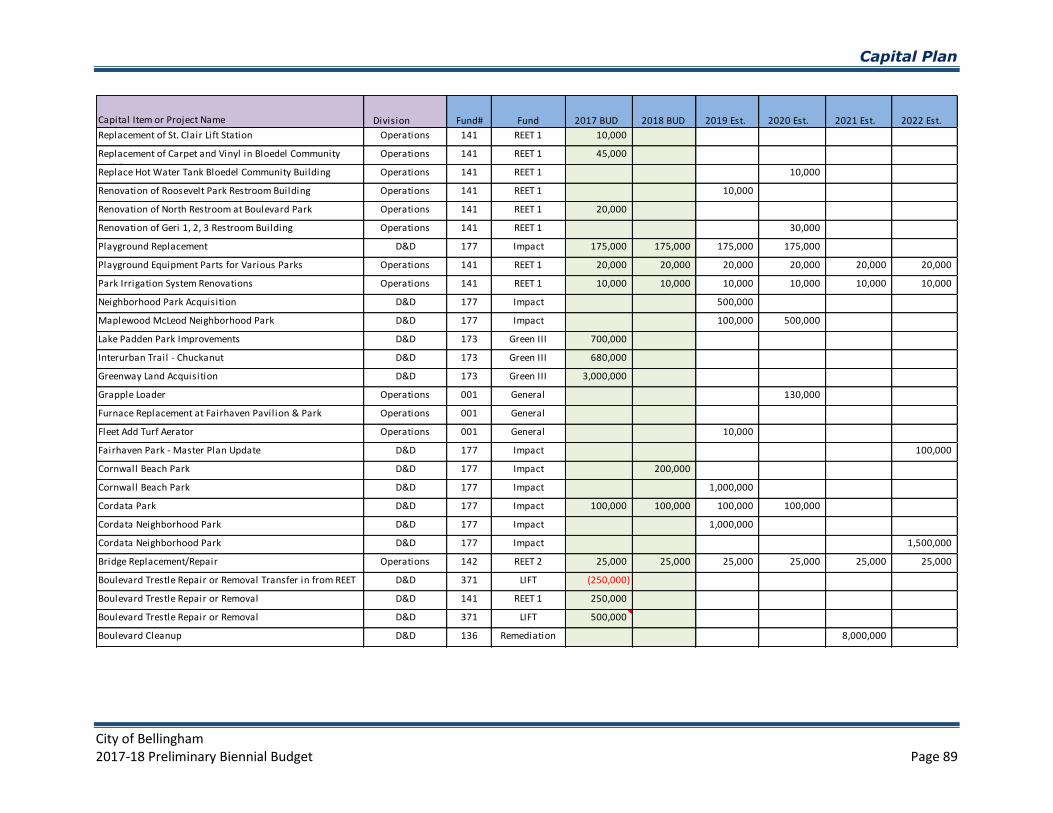
Capital Plan
City of Bellingham 2017-18 Preliminary Biennial Budget Page 89
Capital Item or Project Name Division Fund# Fund 2017 BUD 2018 BUD 2019 Est. 2020 Est. 2021 Est. 2022 Est.
Replacement of St. Clair Lift Station Operations 141 REET 1 10,000
Replacement of Carpet and Vinyl in Bloedel Community
Building
Operations 141 REET 1 45,000
Replace Hot Water Tank Bloedel Community Building Operations 141 REET 1 10,000
Renovation of Roosevelt Park Restroom Building Operations 141 REET 1 10,000
Renovation of North Restroom at Boulevard Park Operations 141 REET 1 20,000
Renovation of Geri 1, 2, 3 Restroom Building Operations 141 REET 1 30,000
Playground Replacement D&D 177 Impact 175,000 175,000 175,000 175,000
Playground Equipment Parts for Various Parks Operations 141 REET 1 20,000 20,000 20,000 20,000 20,000 20,000
Park Irrigation System Renovations Operations 141 REET 1 10,000 10,000 10,000 10,000 10,000 10,000
Neighborhood Park Acquisition D&D 177 Impact 500,000
Maplewood McLeod Neighborhood Park D&D 177 Impact 100,000 500,000
Lake Padden Park Improvements D&D 173 Green III 700,000
Interurban Trail - Chuckanut D&D 173 Green III 680,000
Greenway Land Acquisition D&D 173 Green III 3,000,000
Grapple Loader Operations 001 General 130,000
Furnace Replacement at Fairhaven Pavilion & Park
Operations Office
Operations 001 General
Fleet Add Turf Aerator Operations 001 General 10,000
Fairhaven Park - Master Plan Update D&D 177 Impact 100,000
Cornwall Beach Park D&D 177 Impact 200,000
Cornwall Beach Park D&D 177 Impact 1,000,000
Cordata Park D&D 177 Impact 100,000 100,000 100,000 100,000
Cordata Neighborhood Park D&D 177 Impact 1,000,000
Cordata Neighborhood Park D&D 177 Impact 1,500,000
Bridge Replacement/Repair Operations 142 REET 2 25,000 25,000 25,000 25,000 25,000 25,000
Boulevard Trestle Repair or Removal Transfer in from REET D&D 371 LIFT (250,000)
Boulevard Trestle Repair or Removal D&D 141 REET 1 250,000
Boulevard Trestle Repair or Removal D&D 371 LIFT 500,000
Boulevard Cleanup D&D 136 Remediation 8,000,000

Capital Plan
City of Bellingham Page 90 2017-18 Preliminary Biennial Budget
Capital Item or Project Name Division Fund# Fund 2017 BUD 2018 BUD 2019 Est. 2020 Est. 2021 Est. 2022 Est.
Bloedel Boat Launch Floats D&D 142 REET 2 (245,000)
Bloedel Boat Launch Floats D&D 142 REET 2 245,000
Birchwood Neighborhood Park Restroom D&D 177 Impact 175,000
Big Rock Garden Park Fence Replacement Operations 141 REET 1 45,000
Bay to Baker Trail D&D 177 Impact 50,000
Bay to Baker Trail D&D 177 Impact 200,000
Backyard Lifts Operations 001 General 90,000
Annual Golf Course Capital Improvements Operations 460 GOLF 80,000 80,000 80,000 80,000 80,000 80,000
Annual Boundary Surveys Operations 141 REET 1 6,000 6,000 6,000 6,000 6,000 6,000
Dispatch CAD project Dispatch 160 Dispatch 155,000 155,000 155,000 155,000 155,000
Annual Undercover Vehicles 151 Fed. Sharing 35,000 20,000 36,000
WTP Improvements - Screening Relocation Water 410 WATER 3,000,000
WTP Improvements - Dissolved Air Flotation (DAF) Water 410 WATER 3,500,000
WTP - Energy Conservation - Solar 410 WATER 2,000,000
Whatcom Creek Tunnel Wastewater 420 SEWER 4,890,000
Whatcom Creek Sewer Wastewater 420 SEWER 2,000,000
West Horton Road Corridor Improvements Street 111 Street (500,000)
West Horton Road Corridor Improvements Street 111 Street (2,700,000)
West Horton Road Corridor Improvements Street 111 Street 3,200,000
West Horton Road Corridor Improvements Street 161 TBD 400,000
West Bakerview Lift Station Wastewater 420 SEWER 854,000
TBD Annual Pavement Resurfacing Street 161 TBD 2,500,000 2,550,000 2,601,000 2,653,020 2,706,080
TBD Annual NON-Motorized Projects Street 161 TBD 2,500,000 2,150,000 2,193,000 2,236,860 2,281,597
Storm for Annual Pavement Resurfacing Stormwater 430 STORM 50,000
Sewer Inflow and Infiltration Projects Wastewater 420 SEWER 5,000,000
Sewer Inflow and Infiltration Projects Wastewater 420 SEWER (5,000,000)
Sehome Tower Replacement Communications 511 FLEET (1,450,000)
Sehome Tower Replacement Communications 511 FLEET 1,450,000
Roeder Lift Station Replacement Wastewater 420 SEWER 4,418,000 8,582,000
Roeder Lift Station Replacement Wastewater 420 SEWER (4,418,000) (8,582,000)

Capital Plan
City of Bellingham 2017-18 Preliminary Biennial Budget Page 91
Capital Item or Project Name Division Fund# Fund 2017 BUD 2018 BUD 2019 Est. 2020 Est. 2021 Est. 2022 Est.
Quiet Zone Improvements Street 141 REET 1 250,000 250,000 250,000 250,000 250,000 250,000
Orchard Drive Extension (Bay-Baker Trail) Street 111 Street (3,500,000) (6,500,000)
Orchard Drive Extension (Bay-Baker Trail) Street 111 Street 3,500,000 6,500,000
Mahogany/Arctic Arterial-Water Mains Water 410 WATER 500,000
Mahogany/Arctic Arterial-Storm Mains Stormwater 430 STORM 500,000
Mahogany/Arctic Arterial-Sewer Mains Wastewater 420 SEWER 1,000,000
Mahogany/Arctic Arterial Street 111 Street 1,000,000
Kearney Road Pump Station (Cordata) Water 410 WATER 300,000
Horton Lift Station Wastewater 420 SEWER 833,000
Donovan Water Water 410 WATER 500,000
Cordata Stuart RAB Street 111 Street 200,000 133,000
Cordata STRS Street 111 Street 200,000
Bellingham Waterfront Wet Weather Peak Flow Facility Wastewater 420 SEWER 1,000,000
Bellingham Waterfront District Infrastructure Street 141 REET 1 750,000 750,000 1,000,000 1,000,000 1,000,000 1,000,000
Annual Watershed Land Acquisitions Watershed 411 WATER SHED 944,800 964,400 1,084,000 1,203,600
Annual Water Main Replacement Program Water 410 WATER 2,000,000 2,000,000 2,000,000 2,000,000
Annual Sewer System Improvements Wastewater 420 SEWER 100,000 1,000,000 1,000,000 1,000,000 1,000,000
Annual Sewer Main Replacement Program Wastewater 420 SEWER 2,000,000 1,000,000 2,000,000 2,000,000 2,000,000
Annual Pavement Resurfacing Street 111 Street 2,370,000 2,440,000 2,515,000 2,590,000 2,600,000 2,700,000
Nooksack Diversion Dam and Pipeline Improvements Water 410 WATER 200,000 10,000,000
Nooksack Diversion Dam and Pipeline Improvements Water 410 WATER 2,000,000
Willow Spring Culvert Removal SSWU 430 STORM 25,000 75,000
Whatcom Waterway Between Holly and Roeder Restoration 430 STORM 100,000 1,000,000
Whatcom Cr Gabions Restoration 430 STORM 1,000,000
West Cemetery Creek Sediment SWWU 430 STORM 125,000 250,000
Vehicle Restoration 411 WATER SHED 35,000
Sunset (EV 0144 ) match (25%) SSWU 430 STORM 115,269
Sunset (EV 0144 ) grant revenue (75% TPC) SSWU 430 STORM (345,805)
Sunset (EV 0144 ) grant funding (75% TPC) SSWU 430 STORM 345,805
Summit Street Water Quality Improvements Watershed 411 WATER SHED 100,000

Capital Plan
City of Bellingham Page 92 2017-18 Preliminary Biennial Budget
Capital Item or Project Name Division Fund# Fund 2017 BUD 2018 BUD 2019 Est. 2020 Est. 2021 Est. 2022 Est.
Squalicum Creek Phases 4 and 5 Restoration 430 STORM 300,000 2,500,000
Squalicum Creek Creosote Bridge Removal Restoration 430 STORM 125,000 250,000
Squal Cr Reroute Phase 3 Restoration 430 STORM 1,322,507
Squal Cr Reroute Phase 3 Restoration 430 STORM (500,000)
Squal Cr Reroute Phase 3 Restoration 430 STORM (822,507)
Shoreline Treatment System Design Watershed 430 STORM 100,000
Park Place Facility Improvement- match Watershed 411 WATER SHED 500,000
Park Place Facility Improvement- match Watershed 411 WATER SHED 75,000 185,000
Park Place Facility Improvement- grant revenue Watershed 411 WATER SHED (1,500,000)
Park Place Facility Improvement- Watershed 411 WATER SHED 1,500,000
Padden Creek 24th -30th Habitat and Water Quality
Improvements
Restoration 430 STORM 100,000 1,500,000
Oregon and Alice West of Britton Watershed 430 STORM 100,000 200,000
Land Acquisition funding for wetland mitigation program Restoration 111 Street 500,000
Huntington/ E. Silverbeach Water Quality Improvements Watershed 411 WATER SHED 200,000
Hayward Drive Water Quality Improvements Watershed 411 WATER SHED 200,000
E. Oregon match (25%) Watershed 411 WATER SHED 89,539
E. Oregon grant revenue (75% TPC) Watershed 411 WATER SHED (268,617)
E. Oregon grant funding (75% TPC) Watershed 411 WATER SHED 268,617
E. North (EV 125) match (25%) Watershed 411 WATER SHED 100,789
E. North (EV 125) grant revenue (75% TPC) Watershed 411 WATER SHED (302,367)
E. North (EV 125) grant funding (75% TPC) Watershed 411 WATER SHED 302,367
Columbia/Roosevelt (EV 120) loan funded SSWU 430 STORM 765,000
Columbia/Roosevelt (EV 120) loan SSWU 430 STORM (765,000)
Columbia/Roosevelt (EV 120) grant revenue (75% TPC) SSWU 430 STORM (340,000)
Columbia / Roosevelt (EV 120) grant match (25%) SSWU 430 STORM 115,000
Columbia / Roosevelt (EV 120) grant funding (75% TPC) SSWU 430 STORM 340,000
Citywide LID Implementation SSWU 430 STORM 200,000 200,000 200,000 200,000
Birchwood Retrofits SSWU 430 STORM 100,000 750,000
Annual WQ Retrofits SSWU 430 STORM 500,000 500,000 500,000 500,000 500,000 500,000
Annual Watershed Water Quality Improvements Projects Watershed 430 STORM 200,000 600,000 850,000 950,000

Capital Plan
City of Bellingham 2017-18 Preliminary Biennial Budget Page 93
Capital Item or Project Name Division Fund# Fund 2017 BUD 2018 BUD 2019 Est. 2020 Est. 2021 Est. 2022 Est.
Annual Storm Replacements SSWU 430 STORM 200,000 800,000 1,000,000 1,000,000 1,000,000 1,000,000
Annual Fish Passage Improvements (EV 80) SSWU 430 STORM 800,000 800,000
Anderson Creek Habitat and Water Quality Improvements Restoration 411 WATER SHED 125,000 500,000
Whatcomm Building Replacement Facilities 142 REET 2 1,000,000 2,500,000
Whatcomm Building Replacement Facilities 142 REET 2 (2,500,000)
Warehouse and Training Facility 520 PURCHASING 300,000
Radio 800 Digital Communications 511 FLEET (1,450,000)
Radio 800 Digital Communications 511 FLEET 1,450,000
Pacific Street Stormwater Retrofit-Resurfacing 530 FACILITIES (240,000) (1,000,000)
Pacific Street Stormwater Retrofit-Resurfacing Facilities 530 FACILITIES 240,000 1,000,000
Line Repair Kit Wastewater 420 SEWER 15,000 15,000 15,000 15,000
Lighting Systems Street 111 Street 150,000 150,000
Fleet Replacements Transportation Equipment Fleet 510 FLEET 711,195 927,640 338,124
Fleet Replacements Other Machinery and Equipment Fleet 510 FLEET 124,900 124,900 124,900 124,900
Fleet Replacements Heavy Duty Work Equipment Fleet 510 FLEET 130,000 130,000 130,000 130,000 140,000 140,000
Fleet Replacements Heavy Duty Work Equipment Fleet 510 FLEET 1,194,018 1,194,018 1,194,018 1,194,018 1,200,000 1,200,000
Fleet Hoist replacement, fueling station, improvements Fleet 510 FLEET 150,000
Eldridge Municipal Landfil l Monitoring 440 SOLID 30,000 30,000
Cornwall Beach Remediation Solid Waste 440 SOLID 1,600,000 4,000,000
Cornwall Beach Remediation Solid Waste 440 SOLID (4,000,000)
Commercial Street Parking Garage Facilities 465 PARKING 200,000 200,000
City Hall Generator Facilities 530 FACILITIES 100,000
Annual Facilities Maintenance Program (includes ADA
Facilities Maintenance)
Cap Maint 530 FACILITIES 600,000 650,000 650,000 650,000 650,000 650,000
Annual Emergency Water Repairs Plants 410 WATER 50,000 50,000 100,000 1,000,000 1,000,000 1,000,000
Annual Emergency Sewer Repairs Plants 420 SEWER 50,000 50,000 100,000 100,000 100,000 100,000
Div Fund 40,347,091 30,262,081 28,206,470 44,183,751 28,880,164 23,413,895

Budgeted Positions
City of Bellingham Page 94 2017-18 Preliminary Biennial Budget
Budgeted Positions - Public Safety
Police Department
DEPARTMENT/DIVISION REVISED Employee
2016 2017 2018 Group
POLICE DEPARTMENT
Police Operations and Administration:
Accounting Technician 1.0 1.0 1.0 B
Neighborhood Code Compl iance Officer 1.0 1.0 1.0 B
Parking Enforcement Officer 4.0 4.0 4.0 B
Pol ice Support Services Specia l i s t 2.0 2.0 2.0 B
Tech Support/Appl ications Specia l i s t 1.0 0.0 0.0 B
Warrant Officer 2.0 2.0 2.0 B
Crime Scene Investigators 4.0 4.0 4.0 D
Detectives 9.0 9.0 9.0 D
Evidence and ID Officer 2.0 2.0 2.0 D
Patrol Officers (includes temp CSIs and Detectives ) 70.0 72.0 74.0 D
Sergeants 15.0 15.0 15.0 D
Traffic Officers 6.0 6.0 6.0 D
Deputy Chief of Pol ice 1.8 1.8 1.8 E
Pol ice Chief 1.0 1.0 1.0 E
Lieutenants 6.0 6.0 6.0 O
Department System Specia l i s t 0.0 1.0 1.0 S
Program Specia l i s t 3.0 3.0 3.0 S
Program Technician 1.0 1.0 1.0 E
Subtotal Regular Employees 129.8 131.8 133.8
Temporary Labor 0.4 0.4 0.4 T
Total: 130.2 132.2 134.2
Police Records:
Pol ice Support Services Specia l i s t 13.0 13.0 13.0 B
Program Manager 1 1.0 1.0 1.0 S
Support and Services Supervisor 1.0 1.0 1.0 S
Total: 15.0 15.0 15.0
Police Dispatch:
Accounting Technician 1.0 1.0 1.0 B
Tech Support & Appl ications Specia l i s t 1.0 1.0 1.0 B
Deputy Chief of Pol ice 0.2 0.2 0.2 E
What-Comm Deputy Director 1.0 1.0 1.0 E
WHAT-COMM Dispatcher-In-Tra ining, Ca l l
Receiver, Dispatcher, Dispatch Supervisor 26.0 26.0 26.0 P
GIS Analyst 1.0 1.0 1.0 S
Systems Analyst 1 1.0 1.0 1.0 S
Total: 31.2 31.2 31.2
TOTAL POLICE DEPARTMENT 176.4 178.4 180.4
STAFFING SUMMARY BY BARGAINING UNIT:
Non-Uniformed Employee Group 26.0 25.0 25.0 B
Uniformed Employee Group 106.0 108.0 110.0 D
Non-Represented Employee Group 5.0 5.0 5.0 E
Police Lieutenants Employee Group 6.0 6.0 6.0 O
Public Safety Dispatch Group 26.0 26.0 26.0 P
Supervisor/Professional Employee Group 7.0 8.0 8.0 S
Temporary Labor Employee Group 0.4 0.4 0.4 T
PRELIMINARY

Budgeted Positions
City of Bellingham 2017-18 Preliminary Biennial Budget Page 95
Fire Department
DEPARTMENT/DIVISION REVISED Employee
2016 2017 2018 Group
FIRE DEPARTMENT
Fire:
Accounting Technician 1.0 1.0 1.0 B
Ambulance Bi l l ing and Reimburse Spec 1,2 2.0 0.0 0.0 B
Office Ass is tant 2 2.0 2.0 2.0 B
Permit Technician 1.0 1.0 1.0 B
Tech Support/Tra ining Specia l i s t 0.0 1.0 1.0 B
Captains 30.0 38.0 38.0 C
Fire Inspectors 3.0 3.0 3.0 C
Firefighters , FF/Paramedics , FF/Inspectors 88.0 88.0 88.0 C
Ass is tant Fi re Chief 2.0 2.0 2.0 E
Program Manager 1 1.0 1.0 1.0 S
Fire Chief 1.0 1.0 1.0 E
Program Manager 1 1.0 1.0 1.0 E
Batta l ion Chiefs 4.0 4.0 4.0 F
Divis ion Chief 2.0 2.0 2.0 F
Fire Marshal 1.0 1.0 1.0 F
Fire/EMS Dispatcher, Dispatcher in Trng 12.0 12.0 12.0 M
Communications Operations Officer 1.0 1.0 1.0 M
Program Coordinator 1.0 1.0 1.0 S
Systems Analyst 2 1.0 1.0 1.0 S
TOTAL FIRE DEPARTMENT 154.0 161.0 161.0
STAFFING SUMMARY BY BARGAINING UNIT:
Non-Uniformed Employee Group 6.0 5.0 5.0 B
Fire Uniformed Employee Group 121.0 129.0 129.0 C
Non-Represented Employee Group 4.0 4.0 4.0 E
Fire Staff Officers Group 7.0 7.0 7.0 F
EMS Dispatch Group 13.0 13.0 13.0 M
Supervisor/Professional Employee Group 3.0 3.0 3.0 S
PRELIMINARY
DEPARTMENT/DIVISION REVISED Employee
2016 2017 2018 Group
JUDICIAL SERVICES DEPARTMENT
Municipal Court:
Accounting Technician 1.0 1.0 1.0 B
Court Process Specia l i s t 7.0 6.0 6.0 B
Lead Court Process Specia l i s t 1.0 2.0 2.0 B
Court Adminis trator 1.0 1.0 1.0 E
Court Commiss ioner 1.0 1.0 1.0 E
Program Technician 1.0 1.0 1.0 E
Municipal Court Judge 1.0 1.0 1.0 O
Divis ion Supervisor 1.0 1.0 1.0 S
TOTAL JUDICIAL SERVICES 14.0 14.0 14.0
STAFFING SUMMARY BY BARGAINING UNIT:
Municipal Court Judge 1.0 1.0 1.0 O
Non-Uniformed Employee Group 9.0 9.0 9.0 B
Non-Represented Employee Group 3.0 3.0 3.0 E
Supervisor/Professional Employee Group 1.0 1.0 1.0 S
PRELIMINARY

Budgeted Positions
City of Bellingham Page 96 2017-18 Preliminary Biennial Budget
Budgeted Positions - Planning and Community Development
Planning and Community Development Department
DEPARTMENT/DIVISION REVISED Employee
2016 2017 2018 Group
PLANNING AND COMMUNITY DEVELOPMENT
Planning:
Office Ass is tant 2 1.0 1.0 1.0 B
Secretary 3 1.0 1.0 1.0 B
Permit Technician 0.0 1.0 1.0 B
Department Manager 2 1.0 1.3 1.3 E
Planning & Comm. Dev. Director 1.0 1.0 1.0 E
Program Specia l i s t 1.0 1.0 1.0 E
GIS Analyst 1.0 1.0 1.0 S
GIS Analyst, Senior 1.0 1.0 1.0 S
Planner 1, 2 7.0 4.0 4.0 S
Planner, Senior 4.0 1.5 1.5 S
Total: 18.0 13.8 13.8
Community Development:
Adminis trative Secretary 1.0 1.0 1.0 B
Contract Accounting Specia l i s t 1.0 1.0 1.0 B
Hous ing Rehab. Specia l i s t 1.0 1.0 1.0 B
Economic Development Manager 1.0 1.0 1.0 E
Development Specia l i s t 2 1.0 1.0 1.0 S
Planner, Senior 0.0 1.0 1.0 S
Program Manager 1 1.0 1.0 1.0 S
Program Specia l i s t 1.0 1.0 1.0 S
Total: 7.0 8.0 8.0
Development Services:
Inspectors 5.0 5.0 5.0 B
Office Ass is tant 2 3.0 3.0 3.0 B
Permit Technician 3.0 2.0 2.0 B
Plans Examiner 2.0 2.0 2.0 B
Senior Bui lding Inspector 1.0 1.0 1.0 B
Department Manager 2 1.0 0.7 0.7 E
Bui lding Officia l 1.0 1.0 1.0 S
Divis ion Supervisor 1.0 1.0 1.0 S
Planner 1, Planner 2 1.0 4.0 4.0 S
Program Coordinator 1.0 1.0 1.0 S
Planner, Senior 0.0 1.5 1.5 S
Subtotal Regular Employees 19.0 22.2 22.2
Temporary Labor 1.5 1.5 1.5 T
Total: 20.5 23.7 23.7
TOTAL PLANNING DEPARTMENT 45.5 45.5 45.5
STAFFING SUMMARY BY BARGAINING UNIT:
Non-Uniformed Employee Group 19.0 19.0 19.0 B
Non-Represented Employee Group 5.0 5.0 5.0 E
Supervisor/Professional Employee Group 20.0 20.0 20.0 S
Temporary Labor Employee Group 1.5 1.5 1.5 T
PRELIMINARY

Budgeted Positions
City of Bellingham 2017-18 Preliminary Biennial Budget Page 97
Hearing Examiner
Budgeted Positions - Recreation and Culture
Parks and Recreation Department
DEPARTMENT/DIVISION REVISED Employee
2016 2017 2018 Group
HEARING EXAMINER
Administrative Ass is tant - PT 0.5 0.5 0.5 E
Hearing Examiner 1.0 0.0 0.0 E
TOTAL HEARING EXAMINER DEPT. 1.5 0.5 0.5
STAFFING SUMMARY BY BARGAINING UNIT:
Non-Represented Employee Group 1.5 0.5 0.5 E
PRELIMINARY
DEPARTMENT/DIVISION REVISED Employee
2016 2017 2018 Group
PARKS AND RECREATION
Administration:
Accounting Ass is tant 2 1.0 1.0 1.0 B
Office Ass is tant 2 2.0 2.0 2.0 B
Parks & Recreation Director 1.0 1.0 1.0 E
Program Coordinator 1.0 1.0 1.0 S
Subtotal Regular Employees 5.0 5.0 5.0
Temporary Labor 0.2 0.2 0.2 T
Total: 5.2 5.2 5.2
Design and Development:
Park Project Specia l i s t 1.0 1.0 1.0 B
Department Manager 1 1.0 1.0 1.0 E
Landscape Architect 1.0 1.0 1.0 S
Program Coordinator 1.0 1.0 1.0 S
Project Engineer 1.0 1.0 1.0 S
Total: 5.0 5.0 5.0
Recreation Services:
Aquatic Center Main Cashier - PT 1.5 1.5 1.5 B
Aquatic Leader - PT 0.8 0.8 0.8 B
Ed Programs/Activi ties Coordinator 4.7 4.7 4.7 B
Park Specia l i s t 1.0 1.0 1.0 B
Park Worker 2.0 2.0 2.0 B
Parks Maintenance Aide 3 2.3 2.3 2.3 B
Recreation Instructor 2.0 2.0 2.0 B
Department Manager 1 1.0 1.0 1.0 E
Program Manager 1 2.0 2.0 2.0 S
Subtotal Regular Employees 17.3 17.3 17.3
Temporary Labor 15.3 15.2 15.2 T
Total: 32.6 32.5 32.5
PRELIMINARY

Budgeted Positions
City of Bellingham Page 98 2017-18 Preliminary Biennial Budget
DEPARTMENT/DIVISION REVISED Employee
2016 2017 2018 Group
PARKS AND RECREATION (continued)
Park Operations:
Park Volunteer Coordinator 1.0 1.0 1.0 B
Office Ass is tant 3 1.0 1.0 1.0 B
Park Arboris t 1.0 1.0 1.0 B
Park Specia l i s t 6.0 6.0 6.0 B
Park Technician 12.0 12.0 12.0 B
Park Worker 1.0 1.0 1.0 B
Parks Maintenance Aide 2 1.2 1.2 1.2 B
Parks Maintenance Aide 3 5.3 5.3 5.3 B
Department Manager 1 0.9 0.9 0.9 E
Divis ion Supervisor 2.0 2.0 2.0 S
Subtotal Regular Employees 31.4 31.4 31.4
Temporary Labor 6.7 6.7 6.7 T
Total: 38.1 38.1 38.1
Cemetery:
Office Ass is tant 1 1.0 1.0 1.0 B
Park Technician 1.0 1.0 1.0 B
Park Worker 1.0 1.0 1.0 B
Parks Maintenance Aide 3 1.5 1.5 1.5 B
Department Manager 1 0.1 0.1 0.1 E
Program Coordinator 0.7 0.7 0.7 S
Total: 5.3 5.3 5.3
Golf Course:
Program Coordinator 0.3 0.3 0.3 S
Total: 0.3 0.3 0.3
Note: maintenance service i s contracted.
TOTAL PARKS AND RECREATION 86.5 86.4 86.4
STAFFING SUMMARY BY BARGAINING UNIT:
Non-Uniformed Employee Group 51.3 51.3 51.3 B
Non-Represented Employee Group 4.0 4.0 4.0 E
Supervisor/Professional Employee Group 9.0 9.0 9.0 S
Temporary Labor Employee Group 22.2 22.1 22.1 T
PRELIMINARY

Budgeted Positions
City of Bellingham 2017-18 Preliminary Biennial Budget Page 99
Library and Museum
DEPARTMENT/DIVISION REVISED Employee
2016 2017 2018 Group
LIBRARY
Cataloging Technician - GF 1.0 1.0 1.0 B
Cataloging Technician - GF PT 0.5 0.5 0.5 B
Library Ass is tant 1, 2 - GF 2.0 2.0 2.0 B
Library Clerk 2 3.0 3.0 3.0 B
Library Clerk - PT 6.2 6.2 6.2 B
Library Coordinator 1.0 1.0 1.0 B
Library Specia l i s t 1 1.0 1.0 1.0 B
Library Specia l i s t 2 - PT 1.0 1.0 1.0 B
Library Specia l i s t 2 2.0 2.0 2.0 B
Library Specia l i s t 3 1.0 1.0 1.0 B
Securi ty Info Attendant - PT 1.5 1.5 1.5 B
Adminis trative Ass is tant 1.0 1.0 1.0 E
Library Communications/Programming Mgr 1.0 1.0 1.0 E
Library Director 1.0 1.0 1.0 E
Librarian 1 - PT 0.5 0.5 0.5 L
Librarian 2 4.0 4.0 4.0 L
Librarian 3 3.0 3.0 3.0 L
Divis ion Supervisor 1.0 1.0 1.0 S
Subtotal Regular Employees 31.7 31.7 31.7
Temporary Labor 13.9 13.9 13.9 T
TOTAL LIBRARY 45.6 45.6 45.6
STAFFING SUMMARY BY BARGAINING UNIT:
Non-Uniformed Employee Group 20.2 20.2 20.2 B
Non-Represented Employee Group 3.0 3.0 3.0 E
Professional Librarians Employee Group 7.5 7.5 7.5 L
Supervisor/Professional Employee Group 1.0 1.0 1.0 S
Temporary Labor Employee Group 13.9 13.9 13.9 T
PRELIMINARY
DEPARTMENT/DIVISION REVISED Employee
2016 2017 2018 Group
MUSEUM
Ass is t. Ed/Publ ic Programs Coordinator 2.0 2.0 2.0 B
Exhibi ts Ass is tant 1.0 1.0 1.0 B
Museum Technician 1.0 1.0 1.0 B
Office Ass is tant 3 1.0 1.0 1.0 B
Securi ty Information Attendants - PT 2.2 2.2 2.2 B
Museum Director 1.0 1.0 1.0 E
Exhibi ts Des igner 1.0 1.0 1.0 S
Museum Curator 2.0 2.0 2.0 S
Subtotal Regular Employees 11.2 11.2 11.2
Temporary Labor 2.7 1.8 1.8 T
TOTAL MUSEUM 13.9 13.0 13.0
STAFFING SUMMARY BY BARGAINING UNIT:
Non-Uniformed Employee Group 7.2 7.2 7.2 B
Non-Represented Employee Group 1.0 1.0 1.0 E
Supervisor/Professional Employee Group 3.0 3.0 3.0 S
Temporary Labor Employee Group 2.7 1.8 1.8 T
PRELIMINARY

Budgeted Positions
City of Bellingham Page 100 2017-18 Preliminary Biennial Budget
Budgeted Positions - General Government
Human Resources Department
Information Technology Services Department
DEPARTMENT/DIVISION REVISED Employee
2016 2017 2018 Group
HUMAN RESOURCES DEPARTMENT
Human Resources:
Financia l Technician 2.0 2.0 2.0 E
Human Resources Analyst 3.0 3.0 3.0 E
Human Resources Analyst, Senior 2.0 2.0 2.0 E
Human Resources Ass is tant 0.0 0.5 0.5 E
Human Resources General is t 1.0 2.0 2.0 E
Office Technician 0.0 0.5 0.5 E
Payrol l Lead 1.0 1.0 1.0 E
Program Manager 2 2.0 2.0 2.0 E
Program Specia l i s t 1.0 1.0 1.0 E
Subtotal Regular Employees 12.0 14.0 14.0
Temporary Labor 0.7 0.5 0.5 T
TOTAL HUMAN RESOURCES DEPT. 12.7 14.5 14.5
STAFFING SUMMARY BY BARGAINING UNIT:
Non-Represented Employee Group 12.0 14.0 14.0 E
Temporary Labor Employee Group 0.7 0.5 0.5 T
PRELIMINARY
DEPARTMENT/DIVISION REVISED Employee
2016 2017 2018 Group
INFORMATION TECHNOLOGY SERVICES DEPARTMENT
Accounting Technician 1.0 1.0 1.0 B
Network Technician 2 1.0 1.0 1.0 B
Office Ass is tant 2 0.6 0.6 0.6 B
Tech. Support & Appl ications Spec. 1.0 1.0 1.0 B
Tech. Support & Tra ining Spec. 5.0 4.6 4.6 B
Televis ion Production Ass is tant 1.0 1.0 1.0 B
Appl ications Manager 1.0 1.0 1.0 B
Information Tech. Serv. Director 1.0 1.0 1.0 E
GIS Analyst Senior 2.0 2.0 2.0 S
Network Adminis trator 1.0 1.0 1.0 S
Program Coordinator 1.0 1.0 1.0 S
Program Manager 2 1.0 1.0 1.0 S
Systems Analyst 2 8.0 9.0 9.0 S
TOTAL INFO TECH SERVICES DEPT. 24.6 25.2 25.2
STAFFING SUMMARY BY BARGAINING UNIT:
Non-Uniformed Employee Group 9.6 9.2 9.2 B
Non-Represented Employee Group 2.0 2.0 2.0 E
Supervisor/Professional Employee Group 13.0 14.0 14.0 S
PRELIMINARY

Budgeted Positions
City of Bellingham 2017-18 Preliminary Biennial Budget Page 101
Finance Department
Legal Department
DEPARTMENT/DIVISION REVISED Employee
2016 2017 2018 Group
FINANCE DEPARTMENT
Accounting Ass is tant 1 1.0 1.0 1.0 B
Accounting Ass is tant 2 2.0 2.0 2.0 B
Accounting Technician 4.0 4.0 4.0 B
Office Ass is tant 2 2.0 2.0 2.0 B
Records Management Coordinator 1.0 1.0 1.0 B
Secretary 3 1.0 1.0 1.0 B
Adminis trative Ass is tant 1.0 1.0 1.0 E
Budget Analyst 2.0 1.0 1.0 E
Finance Director 1.0 1.0 1.0 E
Program Manager 2 2.0 3.0 3.0 E
Accountant 1, 2 3.0 3.0 3.0 S
Program Coordinator 1.0 1.0 1.0 S
TOTAL FINANCE DEPARTMENT 21.0 21.0 21.0
STAFFING SUMMARY BY BARGAINING UNIT:
Non-Uniformed Employee Group 11.0 11.0 11.0 B
Non-Represented Employee Group 6.0 6.0 6.0 E
Supervisor/Professional Employee Group 4.0 4.0 4.0 S
PRELIMINARY
DEPARTMENT/DIVISION REVISED Employee
2016 2017 2018 Group
LEGAL DEPARTMENT
Ass is tant Ci ty Attorney 2.0 2.0 2.0 E
Ass is tant Ci ty Attorney, Senior 4.8 4.8 4.8 E
City Attorney 1.0 1.0 1.0 E
Deputy Ci ty Attorney 1.0 1.0 1.0 E
Legal Adminis trative Ass is tant 0.7 0.7 0.7 E
Legal Ass is tant 1.0 1.0 1.0 E
Legal Program Technician 1.0 1.0 1.0 E
Program Specia l i s t 1.0 1.0 1.0 E
Subtotal Regular Employees 12.5 12.5 12.5
Temporary Labor 0.3 0.4 0.4 T
TOTAL LEGAL 12.8 12.9 12.9
STAFFING SUMMARY BY BARGAINING UNIT:
Non-Represented Employee Group 12.5 12.5 12.5 E
Temporary Labor Employee Group 0.3 0.4 0.4 T
PRELIMINARY

Budgeted Positions
City of Bellingham Page 102 2017-18 Preliminary Biennial Budget
Executive Department - Mayor's Office
Legislative Department - Council Office
DEPARTMENT/DIVISION REVISED Employee
2016 2017 2018 Group
EXECUTIVE DEPARTMENT
Communications Director 1.0 1.0 1.0 E
Deputy Administrator 1.0 1.0 1.0 E
Executive Ass is tant 2.0 2.0 2.0 E
Office Ass is tant 1.0 1.0 1.0 E
Mayor 1.0 1.0 1.0 O
TOTAL EXECUTIVE 6.0 6.0 6.0
STAFFING SUMMARY BY BARGAINING UNIT:
Mayor 1.0 1.0 1.0 O
Non-Represented Employee Group 5.0 5.0 5.0 E
PRELIMINARY
DEPARTMENT/DIVISION REVISED Employee
2016 2017 2018 Group
LEGISLATIVE
Counci l Members 7.0 7.0 7.0 O
Program Technician 1.0 1.0 1.0 E
Senior Legis lative Pol icy Analyst 1.0 1.0 1.0 E
Subtotal Regular Employees 9.0 9.0 9.0
Temporary Labor 0.2 0.2 0.2 T
TOTAL LEGISLATIVE 9.2 9.2 9.2
STAFFING SUMMARY BY BARGAINING UNIT:
Council Members 7.0 7.0 7.0 O
Non-Represented Employee Group 2.0 2.0 2.0 E
Temporary Labor Employee Group 0.2 0.2 0.2 T
PRELIMINARY

Budgeted Positions
City of Bellingham 2017-18 Preliminary Biennial Budget Page 103
Budgeted Positions - Public Works
Public Works Department
DEPARTMENT/DIVISION REVISED Employee
2016 2017 2018 Group
PUBLIC WORKS
P.W. Administration:
Accounting Ass is tant 2 1.0 1.0 1.0 B
Accounting Technician 2.5 2.5 2.5 B
Adminis trative Secretary 1.0 1.0 1.0 B
Contract Specia l i s t (estimate) 1.0 0.0 0.0 B
Office Ass is tant 2 2.0 2.0 2.0 B
Office Ass is tant 3 1.0 1.0 1.0 B
Safety Specia l i s t 1.0 1.0 1.0 B
Ass is tant Director 1.0 1.0 1.0 E
Director of Publ ic Works 1.0 1.0 1.0 E
Program Coordinator 2.0 2.0 2.0 S
Program Manager 1 1.0 1.0 1.0 S
Program Specia l i s t 0.5 1.0 1.0 S
Support and Services Supervisor 1.0 1.0 1.0 S
Systems Analyst 1 1.0 1.0 1.0 S
Subtotal Regular Employees 17.0 16.5 16.5
Temporary Labor 0.2 0.0 0.0 T
Total: 17.2 16.5 16.5
Natural Resources:
Adminis trative Secretary 0.7 1.0 1.0 B
Aquatic Invas ive Species Prevention Prog Staff 2.1 3.1 3.1 B
Ed Programs/Activi ties Coordinator - PT 1.0 2.8 2.8 B
Engineering Technician 3.0 3.0 3.0 B
Laboratory Technician 0.0 0.4 0.4 B
Senior Surface Water Technician 1.0 0.0 0.0 B
Source Control Technician - PT 1.0 1.0 1.0 B
Ass is tant Director/Natura l Resources 1.0 1.0 1.0 E
Program Manager 2 1.8 1.8 1.8 E
Program Coordinator 2.0 3.0 3.0 S
Program Manager 1 1.0 1.0 1.0 S
Program Specia l i s t 0.5 0.0 0.0 S
Project Engineer 1.0 1.0 1.0 S
Program Coordinator - PT 1.3 0.6 0.6 S
Subtotal Regular Employees 17.4 19.7 19.7
Temporary Labor 7.9 5.7 5.7 T
Total: 25.3 25.4 25.4
Watershed Acquisition and Management
Ski l led Worker 2 1.0 1.0 1.0 B
Program Manager 2 0.2 0.2 0.2 E
Total: 1.2 1.2 1.2
PRELIMINARY

Budgeted Positions
City of Bellingham Page 104 2017-18 Preliminary Biennial Budget
DEPARTMENT/DIVISION REVISED Employee
2016 2017 2018 Group
PUBLIC WORKS (continued)
Treatment Plants:
Incinerator Operator 1 2.0 2.0 2.0 B
Lab Technician 4.0 3.7 3.7 B
Maintenance Specia l i s t 3.0 3.0 3.0 B
Maintenance Technician 7.0 7.0 7.0 B
Maintenance Worker 3 2.0 2.0 2.0 B
Plant Operator In Tra ining 4.0 4.0 4.0 B
Plant Operator 1 & 2 10.0 10.0 10.0 B
Maint Instrumentation/SCADA Technician 1.0 1.0 1.0 B
Uti l i ty Worker 1 & 2, Ski l led Worker 1 2.0 2.0 2.0 B
Department Manager 2 1.0 1.0 1.0 E
Program Manager 1 4.0 4.0 4.0 S
Water Qual i ty Specia l i s t 2.0 1.8 1.8 S
Subtotal Regular Employees 42.0 41.5 41.5
Temporary Labor 4.4 4.4 4.4 T
Total: 46.4 45.9 45.9
Utilities:
Office Ass is tant 3 1.0 1.0 1.0 B
Uti l i ty Locator 1.0 1.0 1.0 B
Uti l i ty Worker 1, 2 4.0 6.0 6.0 B
Uti l i ty Worker 1, 2; Ski l led Worker 1, 2 9.0 9.0 9.0 B
Water Dis tribution Specia l i s t 2, 3, 4, 5 14.0 12.0 12.0 B
Department Manager 2 0.4 0.4 0.4 E
Divis ion Supervisor 3.0 3.0 3.0 S
Uti l i ty Operations Engineer 1.0 0.8 0.8 S
Subtotal Regular Employees 33.4 33.2 33.2
Temporary Labor 2.7 2.5 2.5 T
Total: 36.1 35.7 35.7
Maintenance:
Uti l i ty Worker 1, 2; Ski l led Worker 1, 2 22.0 22.0 22.0 B
Department Manager 2 0.6 0.6 0.6 E
Divis ion Supervisor 2.0 2.0 2.0 S
Uti l i ty Operations Engineer 0.0 0.2 0.2 S
Subtotal Regular Employees 24.6 24.8 24.8
Temporary Labor 2.8 4.0 4.0 T
Total: 27.4 28.8 28.8
Purchasing & Materials Management:
Buyer 2.0 2.0 2.0 B
Contract Accounting Specia l i s t 0.0 1.0 1.0 B
Lead Buyer 1.0 1.0 1.0 B
Warehouse Worker 4.0 4.0 4.0 B
Divis ion Supervisor 1.0 1.0 1.0 S
Program Manager 2 1.0 1.0 1.0 S
Subtotal Regular Employees 9.0 10.0 10.0
Temporary Labor 0.6 0.0 0.0 T
Total: 9.6 10.0 10.0
PRELIMINARY

Budgeted Positions
City of Bellingham 2017-18 Preliminary Biennial Budget Page 105
DEPARTMENT/DIVISION REVISED Employee
2016 2017 2018 Group
PUBLIC WORKS (continued)
Supervision & Technology:
GIS Technician, Senior 3.0 3.0 3.0 B
Operations Data Ass is tant 1.0 1.0 1.0 B
Senior Surface Water Technician 0.0 1.0 1.0 B
Service Representative 1, 2 3.0 3.0 3.0 B
Program Manager 1 1.0 1.0 1.0 S
Subtotal Regular Employees 8.0 9.0 9.0
Temporary Labor 0.5 0.0 0.0 T
Total: 8.5 9.0 9.0
Fleet Administration:
Fleet Maint. Mechanic 3, 4 5.0 5.0 5.0 B
Fleet Maint. Mechanic 5 2.0 2.0 2.0 B
Service Writer 1.0 1.0 1.0 B
Department Manager 2 0.2 0.2 0.2 E
Divis ion Supervisor 1.0 1.0 1.0 S
Subtotal Regular Employees 9.2 9.2 9.2
Temporary Labor 0.5 0.5 0.5 T
Total: 9.7 9.7 9.7
Facilities:
Aquatics Faci l i ty Technician 1.0 1.0 1.0 B
Custodia l Maint. Worker 1 14.0 14.0 14.0 B
Custodia l Maint. Worker 1 - PT 0.5 0.5 0.5 B
Custodia l Maint. Worker 2 1.0 1.0 1.0 B
Maintenance Worker 3 5.0 5.0 5.0 B
Department Manager 2 0.2 0.2 0.2 E
Divis ion Supervisor 1.0 1.0 1.0 S
Program Coordinator 0.5 0.0 0.0 S
Program Manager 2 1.0 1.0 1.0 S
Project Manager 1.0 1.0 1.0 S
Total: 25.2 24.7 24.7
Temporary Labor 1.0 1.0 1.0 T
Total: 26.2 25.7 25.7
PRELIMINARY

Budgeted Positions
City of Bellingham Page 106 2017-18 Preliminary Biennial Budget
DEPARTMENT/DIVISION REVISED Employee
2016 2017 2018 Group
PUBLIC WORKS (continued)
Engineering:
Associate Engineering Technician 1.0 1.0 1.0 B
Engineering Ass is tant 1.0 1.0 1.0 B
Engineering Technician 2.0 2.0 2.0 B
Project Records Coordinator 1.0 1.0 1.0 B
Property Acquis i tion Specia l i s t 1.0 1.0 1.0 B
Senior Construction Inspector 4.0 4.0 4.0 B
Senior Construction Inspector - PT 0.8 0.8 0.8 B
Senior Permits Reviewer 3.0 3.0 3.0 B
Senior Surveyor 1.0 1.0 1.0 B
Ass is tant Director 1.0 1.0 1.0 E
Department Manager 2 1.0 1.0 1.0 E
Program Coordinator 1.0 1.0 1.0 S
Program Manager 1 2.0 2.0 2.0 S
Program Specia l i s t 1.0 1.0 1.0 S
Project Engineer 5.0 6.0 6.0 S
Project Engineer - LT 1.0 0.0 0.0 S
Uti l i ty Engineer 1.0 1.0 1.0 S
Subtotal Regular Employees 27.8 27.8 27.8
Temporary Labor 1.0 1.0 1.0 T
Total: 28.8 28.8 28.8
Transportation:
Associate Engineering Technician 1.0 1.0 1.0 B
Electronics Tech, Electronics Spec 5.0 5.0 5.0 B
Parking Controls Technician 1 2.0 0.0 0.0 B
Parking Controls Technician 2 1.0 0.0 0.0 B
Signal Systems Specia l i s t 1.0 1.0 1.0 B
Ski l led Worker 2 2.0 2.0 2.0 B
Uti l i ty Worker 1, Uti l i ty Worker 2 0.0 3.0 3.0 B
Uti l i ty 2, Ski l led Worker 1 3.0 3.0 3.0 B
Department Manager 2 0.6 0.6 0.6 E
Planner 2 1.0 1.0 1.0 S
Program Manager 2 1.0 1.0 1.0 S
Traffic Operations Engineer 1.0 1.0 1.0 S
Subtotal Regular Employees 18.6 18.6 18.6
Temporary Labor 2.5 3.3 3.3 T
Total: 21.1 21.9 21.9
TOTAL PUBLIC WORKS 257.5 258.6 258.6
STAFFING SUMMARY BY BARGAINING UNIT:
Non-Uniformed Employee Group 178.6 181.8 181.8 B
Non-Represented Employee Group 10.0 10.0 10.0 E
Supervisor/Professional Employee Group 44.8 44.4 44.4 S
Temporary Labor Employee Group 24.1 22.4 22.4 T
PRELIMINARY