Embed Size (px)
Citation preview

2
WATERLOO REGION COMMUNTY PROFILE 2018
Region of Waterloo Economic Development
Table of Contents CHAPTER 1: Demographics .................................................................................................................................. 6
1.1 General Population ............................................................................................................................. 7
1.1.1 Population Growth ....................................................................................................................... 7
1.1.2 Median Age .................................................................................................................................. 8
1.2 Language ............................................................................................................................................. 8
1.2.1 Languages Spoken at Home ......................................................................................................... 9
1.3 Diversity ............................................................................................................................................ 10
1.3.1 Visible Minorities ....................................................................................................................... 10
1.3.2 Immigrant Population ................................................................................................................ 11
1.4 Income Earners ................................................................................................................................. 12
1.4.1 Low Income Measure (LIM) ....................................................................................................... 12
1.4.2 Income Distribution ................................................................................................................... 13
1.5 Crime ................................................................................................................................................. 14
CHAPTER 2: Workforce ..................................................................................................................................... 15
2.1 Labour Force Statistics ...................................................................................................................... 16
2.1.1 Labour Force and Participation Rate ......................................................................................... 16
2.1.2 Unemployment Rate .................................................................................................................. 17
2.2 Highly Skilled Workforce ................................................................................................................... 18
2.2.1 Educational Attainment ............................................................................................................. 18
2.2.2 Major Field of Study ................................................................................................................... 19
2.2.3 Tech Talent in Waterloo Region ................................................................................................. 20
2.2.4 Employment by Industry ............................................................................................................ 22
2.2.5 Employment by Occupation ....................................................................................................... 23
CHAPTER 3: Education ....................................................................................................................................... 24
3.1 Wilfrid Laurier University .................................................................................................................. 25
3.2 University of Waterloo ...................................................................................................................... 26
3.3 Conestoga College ............................................................................................................................. 27
3.4 Business Support Organizations and Research Centre ..................................................................... 28
CHAPTER 4: Resilient Economy .......................................................................................................................... 30
4.1 Innovation Culture ............................................................................................................................ 31
4.1.1 Start-up Culture ......................................................................................................................... 31

Region of Waterloo Economic Development
4.2 Local Economy .................................................................................................................................. 34
4.2.1 An Overview of Business Environment ...................................................................................... 34
4.3 Key Industries .................................................................................................................................... 35
4.3.1 Advanced Manufacturing Sector ............................................................................................... 35
4.3.2 Information Technology Sector ................................................................................................. 36
4.3.3 Aerospace Sector ....................................................................................................................... 38
4.4 Key Economic Indicators ................................................................................................................... 41
4.4.1 GDP Growth ............................................................................................................................... 41
4.4.2 Consumer Price Index ................................................................................................................ 42
4.4.3 Employment Growth .................................................................................................................. 43
4.5 Building Development ....................................................................................................................... 44
4.5.1 Total Value of New Building Permits ......................................................................................... 44
4.5.2 Housing Starts ............................................................................................................................ 45
4.5.3 Development in the Built Up Area (BUA) ................................................................................... 46
4.5.4 Total New Square Footage, Non-Residential ............................................................................. 47
4.6 Standard of Living ............................................................................................................................. 48
4.6.1 Residential Prices and Rental Market ........................................................................................ 48
4.6.2 Median Household Income ........................................................................................................ 50
CHAPTER 5: Transportation ............................................................................................................................... 52
5.1 Market Access ................................................................................................................................... 53
5.2 Rail Access to Toronto ....................................................................................................................... 53
5.3 Local Transit Network ....................................................................................................................... 54
5.3.1 Grand River Transit .................................................................................................................... 54
5.3.2 Rapid Transit .............................................................................................................................. 55
5.4 New Transit Investments .................................................................................................................. 56
5.4.1 The King-Victoria Transit Hub .................................................................................................... 56
5.4.2 High Speed Rail .......................................................................................................................... 56
5.5 Region of Waterloo International Airport......................................................................................... 57
CHAPTER 6: Cost Competitiveness ...................................................................................................................... 58
6.1 National and Provincial Cost Advantages ......................................................................................... 59
6.1.1 Property Tax Rates in Waterloo Region ..................................................................................... 59
6.1.2 Corporate Tax Rates ................................................................................................................... 60
6.1.3 Exchange Rate ............................................................................................................................ 61

4
WATERLOO REGION COMMUNTY PROFILE 2018
Region of Waterloo Economic Development
6.1.4 National and Provincial Incentives ............................................................................................. 62
6.2 Regional Incentives ........................................................................................................................... 66
6.2.1 Brownfield Financial Incentive Program .................................................................................... 66
6.2.2 Other Incentives ......................................................................................................................... 66
List of Figures
Figure 1: Projections of population growth .................................................................................................. 7 Figure 2: Average age in selected regions, 2016 .......................................................................................... 8 Figure 3: Mother tongue compared to home language in Waterloo Region, 2011 and 2016 ..................... 9 Figure 4: Visible minority groups in Waterloo Region, 2006-2016 ............................................................. 10 Figure 5: Place of birth for total immigrant population in Waterloo Region, 2016 ................................... 11 Figure 6: Percentage of low income (after-tax) families by selected Region ............................................. 12 Figure 7: Income distribution by age cohort in Kitchener-Cambridge-Waterloo, 2015 ............................. 13 Figure 8: Total Criminal code violations (excluding traffic) per 100,000 people (rate) .............................. 14 Figure 9: Total violent criminal code violations per 100,000 people (rate) ................................................ 14 Figure 10: Regional labour force and participation rates ........................................................................... 16 Figure 11: Unemployment Rate .................................................................................................................. 17 Figure 12: Educational attainment by age cohort for Waterloo Region, 2016 ........................................... 18 Figure 13: University field of study for individuals aged 25 to 34 with a Bachelor’s degree or above, 2006 and 2016 ..................................................................................................................................................... 19 Figure 14: Waterloo Region Top Tech Office Deals (2017) ........................................................................ 20 Figure 15: Momentum of Top Tech Talent Labour Pools 2014-2016 (Top 5) ............................................. 21 Figure 17: Employment by Industry in Kitchener-Cambridge-Waterloo, 2017 .......................................... 22 Figure 18: Employment by Occupation in Kitchener-Cambridge-Waterloo, 2017 ..................................... 23 Figure 19: Student enrollment and Co-op/Apprenticeship, 2016-2017 ..................................................... 27 Figure 20: Average Annual Salary of Software Engineers ........................................................................... 31 Figure 21: Market Reach Percentage of Foreign Customers ...................................................................... 32 Figure 22: Exit Value Growth Index (13/14 vs. 14/15) ................................................................................ 33 Figure 23: Output Growth Index ('10-'12 vs. '13-'15) ................................................................................. 33 Figure 24: Number of Businesses by Employment Range in Waterloo Region .......................................... 34 Figure 25: Information Technology and Analytical Instruments Location Quotient by CMA, 2016 ........... 37 Figure 26: Aerospace Vehicles and Defense Location Quotient by CMAs in Ontario (2016) ..................... 38 Figure 27: GDP Growth and Levels ............................................................................................................. 41 Figure 28: GDP per Capita Kitchener-Cambridge-Waterloo vs. Ontario and Canada, 2017 ....................... 42 Figure 29: CPI (2002=1.0) and Inflation ...................................................................................................... 42 Figure 30: Employment Growth in Kitchener-Cambridge-Waterloo .......................................................... 43 Figure 31: Total Value of New Building Permits (2008-2017) ..................................................................... 44 Figure 32: Housing Starts in Kitchener-Cambridge-Waterloo .................................................................... 45 Figure 33: Units Constructed Inside the Build Up Area (BUA) Percentage (2006-2017) ............................ 46 Figure 34: Total New Non-Residential Floor Space by Sector (2008-2017) ................................................ 47 Figure 35: Average Real Estate Prices, 2017 Q4 ......................................................................................... 48 Figure 36: Private apartment average rents ($) by bedroom type, 2017 ................................................... 49

Region of Waterloo Economic Development
Figure 37: Median household income for Waterloo Region, 2005 and 2015 ............................................ 50 Figure 38: Total median household income in Southwestern Ontario, 2015 ............................................. 51 Figure 39: Go Train Map ............................................................................................................................. 53 Figure 40: GRT ridership, revenue hours, and municipal population ......................................................... 54 Figure 41: Toronto-Waterloo Corridor ....................................................................................................... 56 Figure 42: Property tax rates in Waterloo Region ...................................................................................... 59 Figure 43: Average Total Tax and Contribution Rate for Small-Medium Companies in G7 Countries ....... 60 Figure 44: Value of the Loonie .................................................................................................................... 61 Figure 45: Cost of Research and Development Index ................................................................................. 62 Figure 46: Various Incentive Programs ....................................................................................................... 63

Demographics
CHAPTER 1:

7
CHAPTER 1: DEMOGRAPHICS
Region of Waterloo Economic Development
1.1 General Population
1.1.1 Population Growth Waterloo Region is one of the largest and fastest growing regions in Ontario. This area has the 10th largest population in Canada and the 4th largest in Ontario. Between 2011 and 2016, Waterloo Region’s growth rate was 5.5 per cent, which exceeded both provincial and national growth rates of 4.6 per cent and 5 per cent respectively. Waterloo Region also attracts a large number of students to study at its post-secondary institutions, resulting in a total year-end population of 583,500. The Province of Ontario’s Growth Plan1 projects that Waterloo Region’s population will grow by 185,000 people over the next 15 years. The high projected population growth rate was one of the main reasons for the construction of the ION LRT, which aims to provide efficient travel within the high density Central Transit Corridor.
Figure 1: Projections of population growth
Source: Region of Waterloo Planning & Analytics
1 Places to Grow; Growth Plan for the Greater Golden Horseshoe (2017)
0
100,000
200,000
300,000
400,000
500,000
600,000
700,000
800,000
900,000
1991 1996 2001 2006 2011 2016 2021 2026 2031 2036 2041
Regional Population
Places to Grow (initialforecast)
Places to Grow (new forecast)

8
WATERLOO REGION COMMUNTY PROFILE 2018
Region of Waterloo Economic Development
1.1.2 Median Age Waterloo Region’s population is younger than most municipalities in Canada. In 2016, the average age of an individual in Waterloo Region was 39.1 years old, which was lower than the 41 year old average in both Ontario and Canada. The Region’s youthful population is an essential component of its innovative labour force.
Figure 2: Average age in selected regions, 2016
Geographic Area Average Age 2016 Peel Region 38.3 Waterloo Region 39.1 Toronto (City) 40.6 Durham Region 39.6 Ottawa (City) 40.1 York Region 39.9 Halton Region 39.4 Wellington County 40.2 Ontario 41.0 Canada 41.0 Hamilton (City) 41.3 Simcoe County 41.8 Niagara Region 43.8
Source: Statistics Canada, 2016 Census Profile
1.2 Language In total, the 2016 Census recorded over 120 mother tongues in Waterloo Region. English was the most prevalent mother tongue of people in the region, representing three out of four residents. However, there were also 129,930 people whose mother tongue was not English, an increase of 9.6 per cent from 2011. German and Portuguese remained the top two mother tongues after English, representing three per cent (15,400 residents) and 1.9 per cent (9,780 residents) of the total population respectively. Individuals with mother tongues other than English, notably Mandarin and Cantonese, are growing quickly, representing the shifting demographics of new waves of Canadians. While in 2011, Mandarin was the twelfth most common mother tongue in Waterloo Region, by 2016, it had become the fourth most common.2
2 2016 Region of Waterloo Census Bulletin #4 – Language
9
CHAPTER 1: DEMOGRAPHICS
Region of Waterloo Economic Development
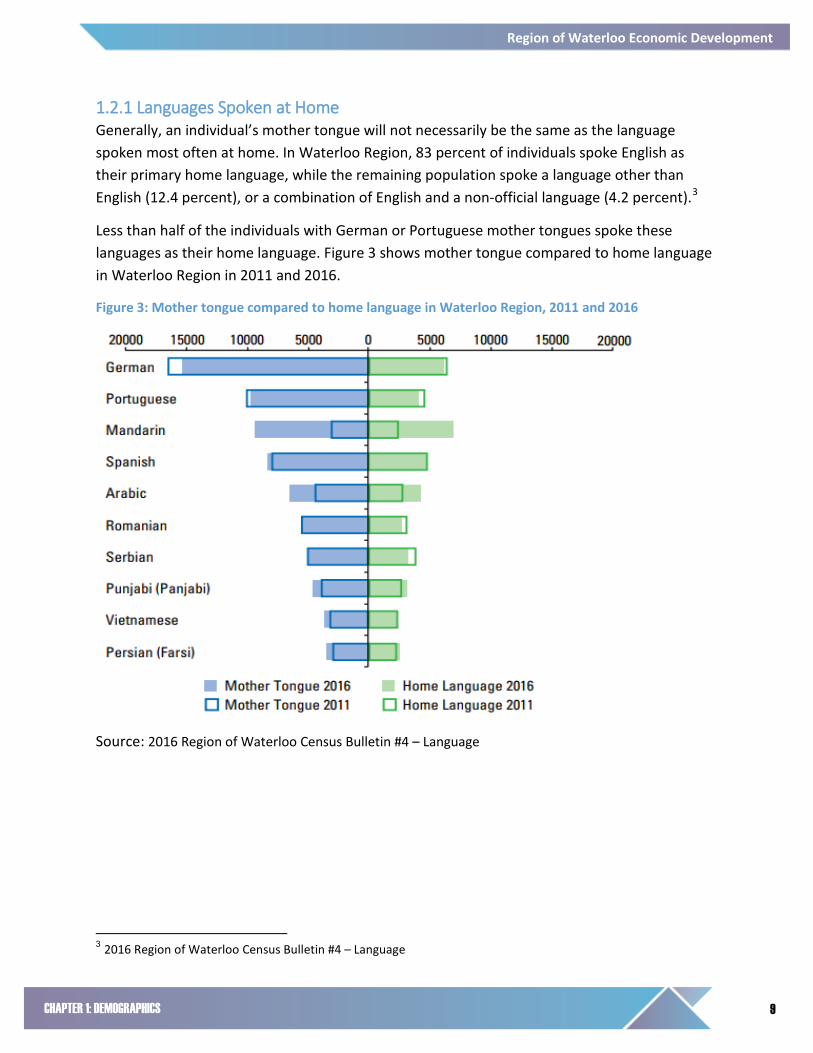
1.2.1 Languages Spoken at Home Generally, an individual’s mother tongue will not necessarily be the same as the language spoken most often at home. In Waterloo Region, 83 percent of individuals spoke English as their primary home language, while the remaining population spoke a language other than English (12.4 percent), or a combination of English and a non-official language (4.2 percent).3
Less than half of the individuals with German or Portuguese mother tongues spoke these languages as their home language. Figure 3 shows mother tongue compared to home language in Waterloo Region in 2011 and 2016.
Figure 3: Mother tongue compared to home language in Waterloo Region, 2011 and 2016
Source: 2016 Region of Waterloo Census Bulletin #4 – Language
3 2016 Region of Waterloo Census Bulletin #4 – Language

10
WATERLOO REGION COMMUNTY PROFILE 2018
Region of Waterloo Economic Development
1.3 Diversity
1.3.1 Visible Minorities In 2016, there were 100,025 individuals in Waterloo Region who identified themselves as a visible minority. In total, visible minorities made up 19.0 per cent of the total population. This marks a 6 per cent point increase compared to 2006. According to 2016 Census, Waterloo Region had the 7th largest proportion of visible minorities in Ontario, and the second largest outside of the GTA.4
In Waterloo Region, over a quarter of the region’s visible minority population identified as South Asian. Following South Asian, the second and third most commonly reported visible minority groups were Chinese (16 per cent of the visible minority population) and Black (15.1 per cent of the visible minority population). Between 2006 and 2016, the number of people reporting these visible minorities increased substantially.
Figure 4: Visible minority groups in Waterloo Region, 2006-2016
Source: 2016 Region of Waterloo Census Bulletin #7 – Ethnic Origins, Visible Minorities and Aboriginal Peoples
4 2016 Region of Waterloo Census Bulletin #7 – Ethnic Origins, Visible Minorities and Aboriginal Peoples
0
5,000
10,000
15,000
20,000
25,000
30,000
South Asian Chinese Black LatinAmerican
SoutheastAsian
Arab West Asian
2006
2011
2016

11
CHAPTER 1: DEMOGRAPHICS
Region of Waterloo Economic Development
1.3.2 Immigrant Population Waterloo Region is increasingly attractive to international immigrants, with almost one in four residents born outside Canada. Between 2006 and 2016, the number of immigrants in Waterloo Region increased by 13 per cent. In 2016, Europe was the most common birth place reported by immigrants in Waterloo Region. Compared to past years, the numbers of European immigrants living in the region are declining. On the other hand, the numbers of immigrants born in Asia are growing in numbers and make up over a third of the total immigrant population, compared to just a quarter in 2006.5 Figure 5 depicts the proportion of the region’s immigrant population by place of origin.
Figure 5: Place of birth for total immigrant population in Waterloo Region, 2016
Source: 2016 Region of Waterloo Census Bulletin #8 – Mobility, Migration and Immigration
5 2016 Region of Waterloo Census Bulletin #8 – Mobility, Migration and Immigration

12
WATERLOO REGION COMMUNTY PROFILE 2018
Region of Waterloo Economic Development
1.4 Income Earners
1.4.1 Low Income Measure (LIM) The LIM6 is an income measure used by Statistics Canada to track families and individuals considered low income. LIM is defined as a fixed percentage of median adjusted household income. The adjusting is based on different family characteristics that change the needs of a family. The Region of Waterloo has consistently had one of the lowest percentages of families below the LIM cut-off. Figure 6 below depicts the percent of all families in selected census metropolitan areas (CMAs) who are under the LIM cut-off (after-tax) from 2011 to 2015.
Figure 6: Percentage of low income (after-tax) families by selected Region
Source: Statistics Canada, CANSIM Table 111-0015
Note: Axis for figure starts from 14.0%
6 The low-income measure that is used here is the Low Income Measure After Tax (LIM-AT) calculated based on 50 per cent of the median after-tax household income.
14.7% 15.2%
15.7% 15.5%
15.2%
14.0%
15.0%
16.0%
17.0%
18.0%
19.0%
20.0%
21.0%
22.0%
23.0%
2011 2012 2013 2014 2015
Toronto
Ontario
London
Canada
St. Catharines-Niagara
Hamilton
Kitchener-Cambridge-Waterloo

13
CHAPTER 1: DEMOGRAPHICS
Region of Waterloo Economic Development
1.4.2 Income Distribution Figure 7 depicts the distribution of after-tax income in 2015 for the income earners aged between 25 and 64 in Waterloo Region.
Figure 7: Income distribution by age cohort in Kitchener-Cambridge-Waterloo, 2015
Source: Statistics Canada, CANSIM Table 111-0008
0.00%
2.00%
4.00%
6.00%
8.00%
10.00%
12.00%
14.00%
16.00%
Perc
ent o
f All
Inco
me
Earn
ers
55 to 64 years
45 to 54 years
35 to 44 years
25 to 34 years

14
WATERLOO REGION COMMUNTY PROFILE 2018
Region of Waterloo Economic Development
1.5 Crime Crime rates have declined steadily since 2006 and rates are well below the Canadian average. Figure 8 below depicts the total criminal code violations (excluding traffic) and Figure 9 the total violent criminal code violations per 100,000 people for the time period of 2006 to 2016.
Figure 8: Total Criminal code violations (excluding traffic) per 100,000 people (rate)
Source: Statistics Canada, CANSIM Table 252-0051
Note: Axis for figure starts from 4,000
Figure 9: Total violent criminal code violations per 100,000 people (rate)
Source: Statistics Canada, CANSIM Table 252-0051
Note: Axis for figure starts from 700
4,000
4,500
5,000
5,500
6,000
6,500
7,000
7,500
2006 2007 2008 2009 2010 2011 2012 2013 2014 2015 2016National Average Kitchener-Cambridge-Waterloo
700
800
900
1,000
1,100
1,200
1,300
1,400
1,500
2006 2007 2008 2009 2010 2011 2012 2013 2014 2015 2016
National Average Kitchener-Cambridge-Waterloo

WORKFORCE
CHAPTER 2:

16
WATERLOO REGION COMMUNTY PROFILE 2018
Region of Waterloo Economic Development
2.1 Labour Force Statistics
2.1.1 Labour Force and Participation Rate The Kitchener-Cambridge-Waterloo’s labour force consisted of 303,400 people in 2017. Growth rates for the labour force are expected to be high in the medium to long term as strong growth and affordable living attract new residents and businesses to the area. Figure 10 below depicts the region’s labour force, as well as the participation rate compared to the provincial and national average. Participation rates in the Kitchener-Cambridge-Waterloo have consistently been higher than Ontario and Canada’s rates since 2011, which means the region’s residents are highly engaged in the workforce.
Figure 10: Regional labour force and participation rates
Source: Statistics Canada, CANSIM Table 282-0129 & 282-0002
Note: Axis for figure starts from 280,000
289,900 290,900
299,700
302,600
297,100 298,000
303,400
50.0%
55.0%
60.0%
65.0%
70.0%
75.0%
80.0%
280,000
285,000
290,000
295,000
300,000
305,000
2011 2012 2013 2014 2015 2016 2017
Part
icip
atio
n Ra
te
Labo
ur F
orce
Siz
e
Kitchener-Cambridge-Waterloo Labour Force Kitchener-Cambridge-Waterloo
Ontario Canada

17
CHAPTER 2: WORKFORCE
Region of Waterloo Economic Development
2.1.2 Unemployment Rate Consistent job growth and demand for the region’s highly skilled labour force has resulted in low unemployment. In 2017, Kitchener-Waterloo-Cambridge CMA’s unemployment rate was 5.1 per cent. The CMA’s unemployment rate dropped by almost half a per cent in 2017, and has dropped by 4.6 per cent since the height of the recession in 2009. Figure 11 below depicts the unemployment rates for Kitchener-Cambridge-Waterloo, Ontario and Canada from 2011 to 2017. Over this period, the CMA’s unemployment rate has remained below the provincial and national rates.
Figure 11: Unemployment Rate
Source: Statistics Canada, CANSIM Table 282-0129 & 282-0002
6.7 6.6 6.9 6.5
5.9 5.5
5.1
0.0
1.0
2.0
3.0
4.0
5.0
6.0
7.0
8.0
2011 2012 2013 2014 2015 2016 2017
Une
mpl
oym
ent R
ate
Kitchener-Cambridge-Waterloo Ontario Canada
18
WATERLOO REGION COMMUNTY PROFILE 2018
Region of Waterloo Economic Development
2.2 Highly Skilled Workforce
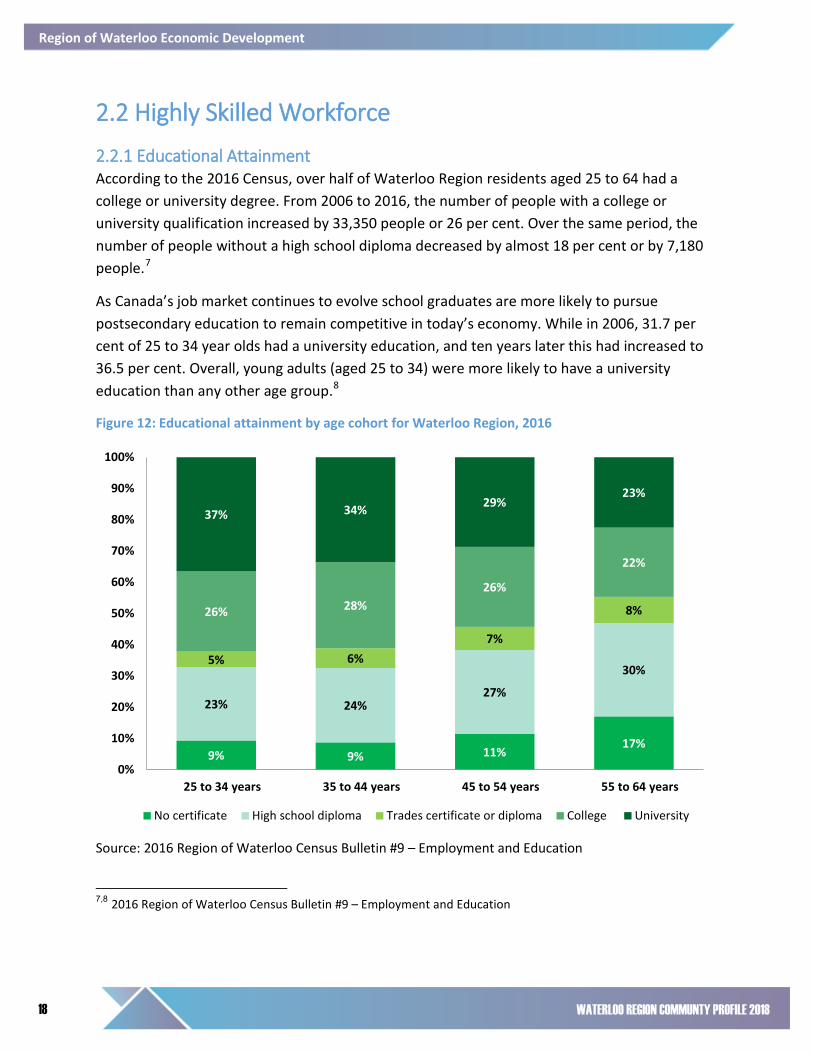
2.2.1 Educational Attainment According to the 2016 Census, over half of Waterloo Region residents aged 25 to 64 had a college or university degree. From 2006 to 2016, the number of people with a college or university qualification increased by 33,350 people or 26 per cent. Over the same period, the number of people without a high school diploma decreased by almost 18 per cent or by 7,180 people.7
As Canada’s job market continues to evolve school graduates are more likely to pursue postsecondary education to remain competitive in today’s economy. While in 2006, 31.7 per cent of 25 to 34 year olds had a university education, and ten years later this had increased to 36.5 per cent. Overall, young adults (aged 25 to 34) were more likely to have a university education than any other age group.8
Figure 12: Educational attainment by age cohort for Waterloo Region, 2016
Source: 2016 Region of Waterloo Census Bulletin #9 – Employment and Education
7,8 2016 Region of Waterloo Census Bulletin #9 – Employment and Education
9% 9% 11% 17%
23% 24% 27%
30% 5% 6%
7%
8% 26% 28% 26%
22%
37% 34% 29% 23%
0%
10%
20%
30%
40%
50%
60%
70%
80%
90%
100%
25 to 34 years 35 to 44 years 45 to 54 years 55 to 64 years
No certificate High school diploma Trades certificate or diploma College University

19
CHAPTER 2: WORKFORCE
Region of Waterloo Economic Development
2.2.2 Major Field of Study As in 2006, young university graduates (aged 25 to 34) living in Waterloo Region in 2016 were more likely to have degrees in social sciences, behavioural sciences or law than any other degrees (Figure 13). Between 2006 and 2016, the number of those with business, management and public administration degrees increased more than the number of graduates in any other field. In 2016, there were 4,155 young graduates who had chosen this area of study, an increase of 1,430 compared to 2006. Over this same decade, the number of graduates in health and related fields increased at a faster rate than for any other field, going from the eighth most common degree in 2006 to fourth in 2016, an increase of 1,400 graduates.9
Graduates living in the Kitchener-Cambridge-Waterloo were more likely to have studied a Science, Technology, Engineering and Mathematics (STEM) subject than anywhere else in Canada, tied with Calgary.10
Figure 13: University field of study for individuals aged 25 to 34 with a Bachelor’s degree or above, 2006 and 2016
Source: 2016 Region of Waterloo Census Bulletin #9 – Employment and Education 9 10 2016 Region of Waterloo Census Bulletin #9 – Employment and Education
0
1,000
2,000
3,000
4,000
5,000
6,000
Num
ber o
f gra
duat
es a
ged
25 to
34
2006
2016

20
WATERLOO REGION COMMUNTY PROFILE 2018
Region of Waterloo Economic Development
2.2.3 Tech Talent in Waterloo Region Waterloo Region is home to two of the world’s largest quantum computing research facilities, the Mike & Ophelia Lazaridis Quantum-Nano centre at the University of Waterloo and the Institutefor Quantum Computing, drawing talent from nearby major post-secondary institutions. The incubators and innovation labs including Communitech, Velocity, the Accelerator Centre, the Innovation District and the Idea Quarter are hotspots for tech companies in the area which help a large number of entrepreneurs and tech talents to start businesses.
In 2017, CBRE Research analyzed 10 of Canada’s largest cities to create a scorecard which ranks their tech talent offerings. The tech talent cities offer a range of technology applications, the software and cybersecurity were highlighted in Waterloo Region. The CBRE Research reveals that Waterloo Region has significant concentrations of quality tech workers. It was the fastest growing tech labour pool in Canada and the second fastest in North America between 2011 and 2016, with a 65.6 per cent increase in tech jobs.11
Waterloo Region Primary Tech Industries
Source: CBRE Research, 2017
Figure 14: Waterloo Region Top Tech Office Deals (2017)
Source: CBRE Research, 2017 11 CBRE Research 2017 Scoring Canadian Tech Talent
Software app/development
Hardware Cybersecurity

21
CHAPTER 2: WORKFORCE
Region of Waterloo Economic Development
Canada Tech Ranking - Waterloo Region
CBRE Research conducted labour quality assessment for software developers by the number and concentration of software engineers with three or more years of experience and who have graduated from one of the top 25 computer science programs in the U.S and Canada.12 While being amongst the highest cost tech labour markets, Waterloo Region also offers the highest concentration of quality tech talent. Between 2014 and 2016, Waterloo Region had the fastest growing tech labour pool in Canada, with a 53.6 per cent increase in tech jobs (more than 7,400 tech jobs added).
Figure 15: Momentum of Top Tech Talent Labour Pools 2014-2016 (Top 5)
Source: CBRE Research, 2017 & Statistics Canada LFS (NOCs), June 2017
12 CBRE Research 2017 Scoring Canadian Tech Talent
5.0%
11.2%
13.4%
16.1%
53.6%
0% 20% 40% 60% 80% 100%
Montreal
Edmonton
Vancouver
Toronto
Waterloo Region

22
WATERLOO REGION COMMUNTY PROFILE 2018
Region of Waterloo Economic Development
2.2.4 Employment by Industry Waterloo Region’s economy has adapted to Canada’s changing economic environment. While manufacturing remains the region’s largest industry in terms of employment, the economy is increasingly diverse. The emergence of a strong technology sector is supporting innovation and prosperity in various sectors. Figure 16 and 17 shows the portion of people employed by industry and occupation.
Figure 16: Employment by Industry in Kitchener-Cambridge-Waterloo, 2017
*Based on 2012 North American Industry Classification
Source: Statistics Canada, CANSIM Table 282-0131

23
CHAPTER 2: WORKFORCE
Region of Waterloo Economic Development
2.2.5 Employment by Occupation Occupations, which represent type of work done rather than the industry in which the job falls, are split into 10 classes for employment. ‘Sales and services occupations’ is the largest class in the CMA with 22.9 per cent of employment, as shown in Figure 17. This class also experienced the most growth since 2001, with an additional 15,800 people. ‘Sales and services occupations’, combined with ‘Business, finance and administrative occupations’, and ‘Trades, transport and equipment operators and related occupations’ represent over one half of employment.
Figure 17: Employment by Occupation in Kitchener-Cambridge-Waterloo, 2017
*Based on 2016 National Occupation Classification – Statistics (NOC)
Source: Statistics Canada, CANSIM Table 282-0159
The Kitchener-Cambridge-Waterloo had the third highest proportion of computer and information systems professionals in Canada. This occupation includes jobs such as computer programmers and web designers.

EDUCATION
CHAPTER 3:
25
CHAPTER 3: EDUCATION
Region of Waterloo Economic Development
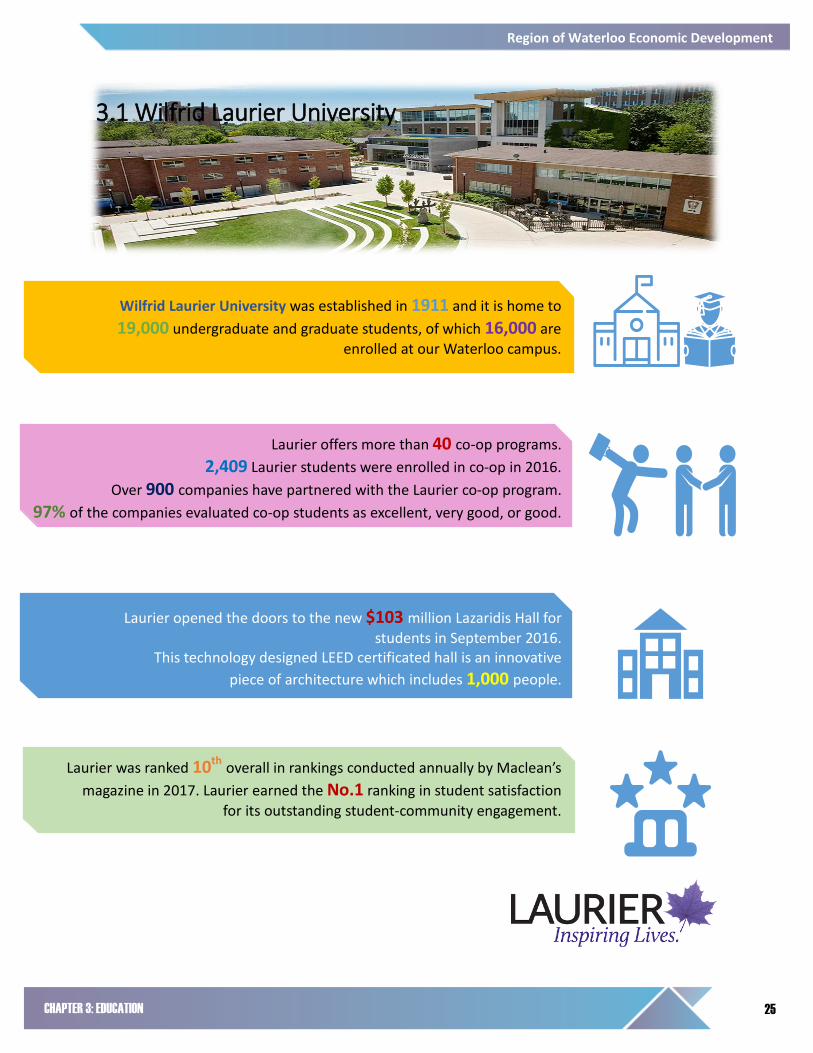
3.1 Wilfrid Laurier University
Wilfrid Laurier University was established in 1911 and it is home to 19,000 undergraduate and graduate students, of which 16,000 are
enrolled at our Waterloo campus.
Laurier offers more than 40 co-op programs. 2,409 Laurier students were enrolled in co-op in 2016.
Over 900 companies have partnered with the Laurier co-op program. 97% of the companies evaluated co-op students as excellent, very good, or good.
Laurier opened the doors to the new $103 million Lazaridis Hall for students in September 2016.
This technology designed LEED certificated hall is an innovative piece of architecture which includes 1,000 people.
Laurier was ranked 10th overall in rankings conducted annually by Maclean’s magazine in 2017. Laurier earned the No.1 ranking in student satisfaction
for its outstanding student-community engagement.

26
WATERLOO REGION COMMUNTY PROFILE 2018
Region of Waterloo Economic Development
3.2 University of Waterloo
University of Waterloo students are in high demand globally. In the 2014 Engineering Candidate Marketplace review by Riviera Partners, the University of Waterloo produced the second most frequently hired candidates by Sillicon Valley companies. Statistically, the University attracts some of the brightest students in the country. In 2015, 56 per cent of students entered UW with an average between 90 and 100 per cent, which was the largest portion of all Ontario Universities.13 As well, the University boasted an 80 per cent degree completion rate in 2015.
13 Data from Common University Data Ontario, https://cudo.ouac.on.ca/
University of Waterloo was established in 1957 and is home to over 35,000 full-time and part-time students.
It is a pioneer in cooperative learning and currently has the world’s largest co-op program with over 19,800 coop students, and over 6,700 employer partners.
University of Waterloo is acclaimed for its innovation and research, as well as its world renowned engineering, mathematics and science programs. It has been ranked the most innovative university in Canada for 25 straight years, as well as Top Comprehensive Research University in Canada for eight consecutive years by Research Infosource.
Its science programs are also highly respected internationally. It is one of only 14 schools in the world to be ranked five stars for research, teaching, employability, facilities and innovation by QS World University Ranking.

27
CHAPTER 3: EDUCATION
Region of Waterloo Economic Development
3.3 Conestoga College
Figure 18: Student enrollment and Co-op/Apprenticeship, 2016-2017
Source: Student numbers provided by each University and College identified
19,000
37,932
16,094
2,409
21,166
3,750
Wilfrid Laurier University University of Waterloo Conestoga College
Num
ber o
f Stu
dent
s
Student Enrollment Co-op/Apprenticeship
Conestoga College was established in 1967 and served approximately
15,500 full time students in 2016-2017.
Following graduation, 65 per cent of students remain in the Region and
contribute approximately $2.3 billion annually to the local economy.
In 2016, 86.9 per cent of students found employment within 6 months
and 90.8 per cent had satisfactory approval from their employer.
In 2015-2016, approximately 1,500 students and 130 faculty members
took part in applied research projects. Programs prepare students
adequately for employment in their field.

28
WATERLOO REGION COMMUNTY PROFILE 2018
Region of Waterloo Economic Development
3.4 Business Support Organizations and Research Centre Home to more than 150 leading research institutes, business incubators and hubs, Waterloo Region has a robust network of industry support organizations. Three notable examples include, Communitech, Accelerator Centre and Waterloo Institute for Nanotechnology.
Communitech
Communitech is a world leading tech hub founded in 1997. Communitech is a main contributor to the emergence of Waterloo Region’s tech sector which committed to helping individual tech firms grow and realize their commercial value, while maintaining their bigger vision of contributing to the creation of a global tech ecosystem in the Waterloo Region. They offer a wide range of services and events to their clients to help them grow into competitive tech firms. They help with the development of products by offering hands-on mentoring and support, advice on how to remain innovative and ahead of the curve, as well as providing access to a 19,000 square foot data hub dedicated to the data driven tech community. They are committed to helping their clients with commerce work by providing access to business services like financing and legal services, and teaching companies how to scale effectively and expand into new markets. Communitech provides all the services that are needed for small-medium tech enterprises to become global competitors.
Accelerator Center
Accelerator Center is a leading innovation hub dedicated to building and scaling sustainably, creating globally competitive tech firms, commercializing research technologies and enabling corporations to pursue innovation initiatives efficiently and effectively. In partnership with FedDev Ontario, they provide a two year mentorship program for eligible startup
tech firms. The program includes $30,000 in seed capital, $10,000 of in-kind mentorship from in-house experts and provides access to market research and investors. They are also preparing to implement a Startup Visa program in June 2017 for international startup companies who want to operate in Waterloo Region.

29
CHAPTER 3: EDUCATION
Region of Waterloo Economic Development
Accelerator Center has an impressive list of graduates including Axonify and Kik. In total, there have been 55 graduate companies from the Accelerator Center with a 93 per cent survival rate. With over 1,500 jobs created as a result of their program, the Accelerator Center is an important contributor to fostering growth of the Region’s startup and tech industry.
Waterloo Institute for Nanotechnology
The Waterloo Institute for Nanotechnology (WIN) is a University Research Centre, founded in 2008. The institute’s research is about science and engineering at the atomic scale. That is the design, fabrication and exploitation of materials and structures where dimensions are measured in billionths of a meter (10-9 m), a nanometer.14
14 https://uwaterloo.ca/institute-nanotechnology/
400 estimated total number of graduate students
241 occupants in the QNC
31 distinguished lectures
109 graudate student seminars
20 research chairs
88 members

CHAPTER 4: DIVERSE RESILIENT ECONOMY
31
CHAPTER 4: DIVERSE RESILIENT ECONOMY
Region of Waterloo Economic Development
4.1 Innovation Culture
4.1.1 Start-up Culture As economies transition from manufacturing to services, innovation and science become increasingly important for regions looking to remain competitive in an era of digital disruption.
The Toronto-Waterloo corridor is recognized as a single startup ecosystem, with between 2,100 and 2,700 startups. In 2016, The Startup Genome Project ranked this corridor as the 16th best startup ecosystem in the world in the Global Startup Ecosystem Report 2017. The corridor’s startups thrive as a result of a strong entrepreneurial culture, market reach, access to resources and the cost-competitiveness. With support from private and public investment, the average available funding for a startup in Toronto-Waterloo Region is $443,000, compared to a global average of $252,000.
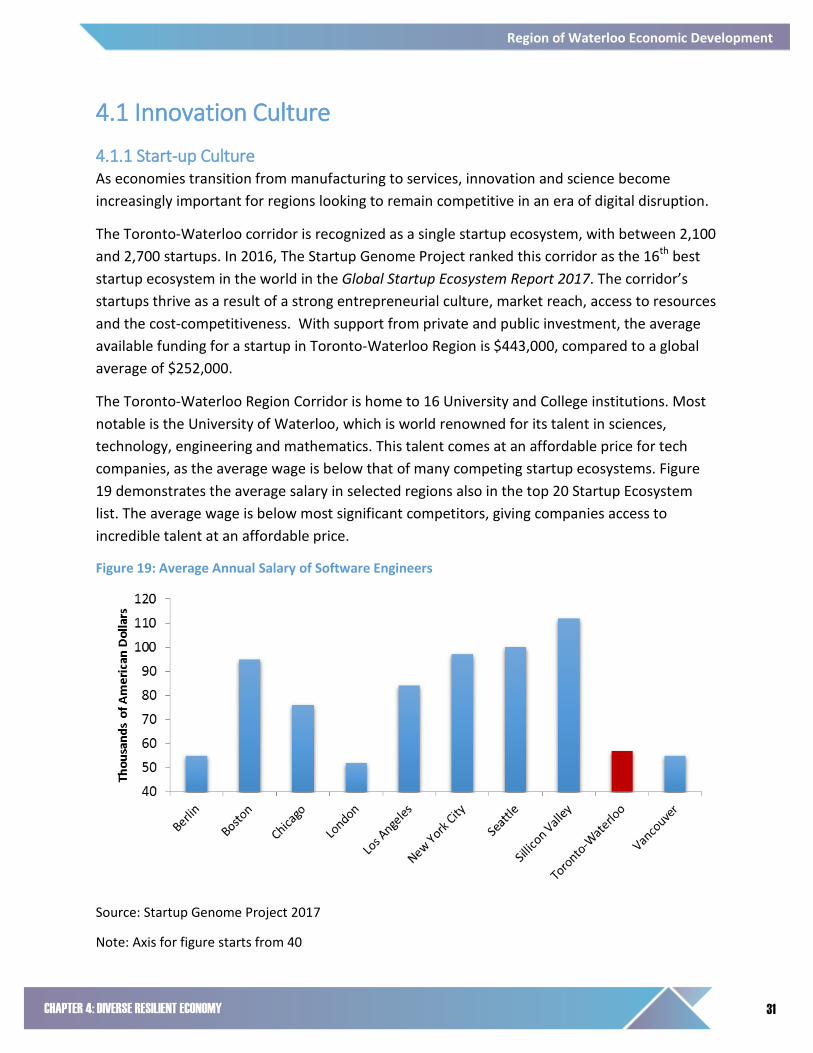
The Toronto-Waterloo Region Corridor is home to 16 University and College institutions. Most notable is the University of Waterloo, which is world renowned for its talent in sciences, technology, engineering and mathematics. This talent comes at an affordable price for tech companies, as the average wage is below that of many competing startup ecosystems. Figure 19 demonstrates the average salary in selected regions also in the top 20 Startup Ecosystem list. The average wage is below most significant competitors, giving companies access to incredible talent at an affordable price.
Figure 19: Average Annual Salary of Software Engineers
Source: Startup Genome Project 2017
Note: Axis for figure starts from 40

32
WATERLOO REGION COMMUNTY PROFILE 2018
Region of Waterloo Economic Development
The region’s strategic location in the heart of southwestern Ontario is another reason for the thriving startup ecosystem. Access to key global markets, which results from proximity to the United States, Toronto’s financial district and four international airports, provides the region’s ecosystem with one of the highest percentages of foreign customers. Figure 20 displays foreign customers as a percent of the total customer base for selected startup ecosystems. Reaching out to global markets is vital for innovation, as it allows companies and economies to create global connections which they can use to tap into an array of ideas, knowledge, talent and capital.15
Figure 20: Market Reach Percentage of Foreign Customers
Source: Startup Genome Project 2017
While the Toronto-Waterloo corridor is yet to reach the heights of Silicon Valley, the startup ecosystem is one of the fastest growing. Measured in terms of total exit value16, growth from 2013/14 to 2014/15 was 5.5 per cent, and output growth17 from 2010-2012 to 2013-2015 was 4.5 per cent, which were among the highest growth rates of globally tech ecosystems. Large exits are important to an ecosystem as they signal a thriving economy with access to the necessary resources to be successful. This can result in talent and resource leakage from other
15 Startup Genome, 2017. Startup Genome Report 2017 16 Exit value is the income received if an asset or business were sold 17 The growth of goods or services produced in a given time period, by the startup ecosystem

33
CHAPTER 4: DIVERSE RESILIENT ECONOMY
Region of Waterloo Economic Development
ecosystems which is more conducive to growth.18 Figure 21 and 22 below show exit value growth and output growth for comparable tech ecosystems.
Figure 21: Exit Value Growth Index (13/14 vs. 14/15)
Source: Startup Genome Project 2017
Figure 22: Output Growth Index ('10-'12 vs. '13-'15)
Source: Startup Genome Project 2017
18 Startup Genome, 2017. Startup Genome Report 2017

34
WATERLOO REGION COMMUNTY PROFILE 2018
Region of Waterloo Economic Development
4.2 Local Economy
4.2.1 An Overview of Business Environment Waterloo Region has a vibrant and diverse economy, with large manufacturing, food and beverage, insurance and technology sectors. Domestic and foreign companies have access to necessary physical, financial and human capital. fDi Intelligence19 ranks Waterloo as the ninth best small North American city for business friendliness, and the seventh best for economic potential in the 2017/2018 American Cities of the Future report. The City of Cambridge ranked sixth on the same list for business friendliness. The 2017 Global Startup Ecosystem report also ranked the Toronto-Waterloo corridor as the world’s 16th best startup ecosystem. This exciting business environment is why companies of all sizes decide to make Waterloo Region their home.
As of December 2017, 52,664 businesses (business with employees and self-employers) called Waterloo Region home. The number of businesses by employment size is displayed in Figure 23. The region’s economy is comprised of many small and medium sized enterprises and startups, which helps to achieve the region’s sustainable growth and contributes significantly to the region’s GDP. There are several large multinational firms in our region including Toyota Motor Manufacturing Canada Incorporated; Loblaw Companies Limited and Home Hardware Stores Limited.
Figure 23: Number of Businesses by Employment Range in Waterloo Region
Source: Statistics Canada, Canadian Business Counts, December 2017
19 fDi Intelligence is a division of the Financial Times Limited

35
CHAPTER 4: DIVERSE RESILIENT ECONOMY
Region of Waterloo Economic Development
4.3 Key Industries
4.3.1 Advanced Manufacturing Sector The Kitchener-Cambridge-Waterloo remains one of the top areas in Canada for manufacturing. The region is currently the fourth largest in Canada by percentage of manufacturing employees, over 17 per cent of residents working in that sector. The number of residents working in the sector was estimated at over 51,300 people in 2017.20
In close proximity to the Greater Toronto Area and within a three hour drive of five Canadian-US borders, Waterloo Region is strategically located for manufacturing. The University of Waterloo’s engineering program provides a good source of talent with 14 five-year undergraduate programs in core disciplines such as chemical, electrical, software engineering, systems design, nanotechnology and mechatronics. Conestoga College provides engineering degrees and technician programs specifically tailored to Waterloo Region’s manufacturing sector.
A new innovation complex, named Catalyst 137, is poised to further stimulate startups focusing on the Internet Of Things, and will be the future home of the tech firm Miovision. Some other leading research institutions dedicated to innovation in manufacturing, include:
Waterloo Centre for Automotive Research (WatCAR)
Centre for Smart Manufacturing
Centre for Advanced Materials Joining (CAMJ)
Waterloo Institute for Nanotechnology (WIN)
Institute for Polymer Research (IPR)
Centre for Intelligent Antenna and Radio Systems
Manufacturing Innovation Network (MIN)
Several of the region’s large employers are also part of the manufacturing sector. The list below shows the companies that employ more than 500 people in this sector.21
Toyota Motor Manufacturing Canada Inc.
Rimowa North America Inc.
Frito-Lay Canada
Mitchell Plastics
20 Statistics Canada, CANSIM Table 282-0131 21 2016 Region of Waterloo Workplace Count & Area Municipalities

36
WATERLOO REGION COMMUNTY PROFILE 2018
Region of Waterloo Economic Development
Canadian General-Tower Ltd.
Honeywell Aerospace
Rockwell Automation Canada Control Systems
ATS Automation Tooling Systems
Christie Digital Systems Canada, Inc.
BWXT Canada Ltd.
Bend All Automotive Inc.
Ultra Manufacturing
4.3.2 Information and Communications Technology Sector Innovation and entrepreneurship are foundational elements of Waterloo Region’s economy, and few industries exemplify them like the region’s tech sector.
In the fiscal year 2017, Communitech (an industry-led innovation centre) served 1,266 tech-related companies and Waterloo Region tech companies attracted $291.1M in venture capital, a 14 per cent increase from the 2016 fiscal year.22 Waterloo Region is increasingly recognized as having one of the world’s fastest growing tech industries, ranking among the top 25 startup ecosystems globally. With approximately 1,100 start-ups for a population of 583,500 people (including students), the region has the second highest startup density after Silicon Valley.23
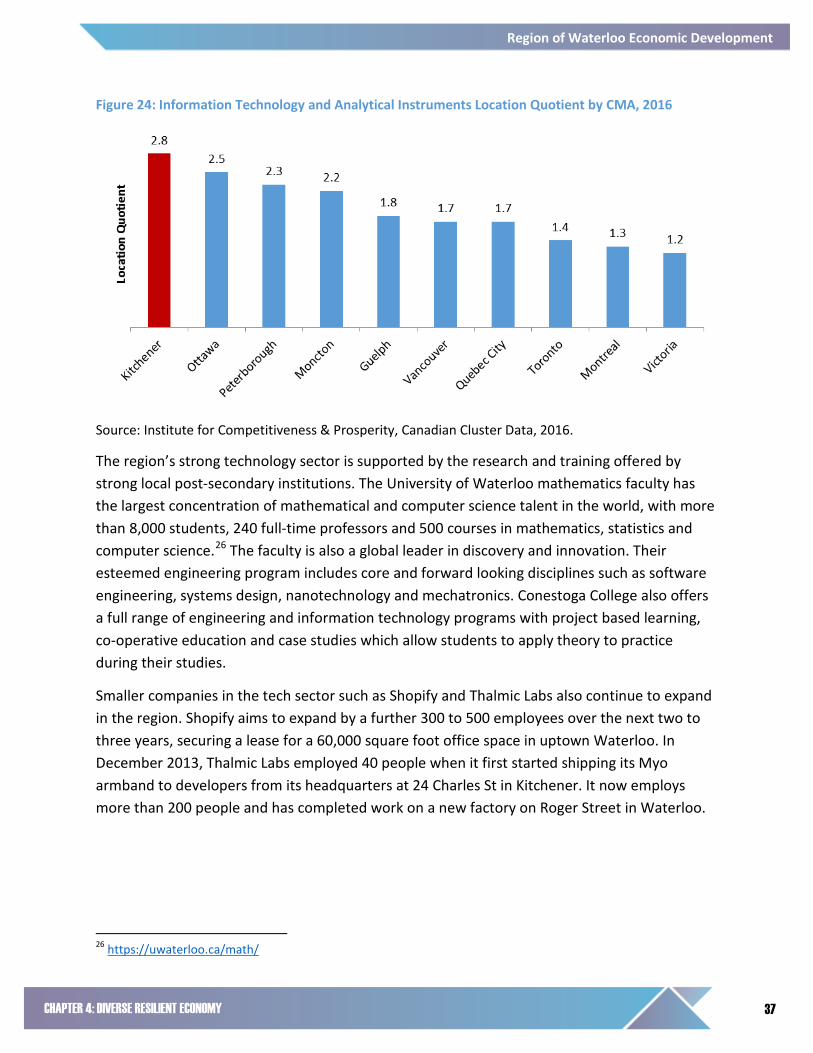
The Toronto-Waterloo Corridor stretches from Toronto, Canada’s largest city and financial centre to the Waterloo Region. The Toronto-Waterloo Corridor benefits from multicultural talent drawn from sixteen academic institutions most notably the University of Toronto and the University of Waterloo, alongside generous tax credits, government grants and favorable currency exchange. The 2017 Waterloo Startup Ecosystem Report indicated the integrated Toronto-Waterloo innovation corridor was ranked the 16th largest in the world.24 As of 2016, data from the Institute of Competitiveness and Prosperity indicated that the region had the largest location quotient25 of all Canadian CMA’s in terms of the cluster in Information Technology and Analytical Instruments.
22 Communitech Annual Report FY2017 23 Compass, 2015 Waterloo Startup Ecosystem Report
24 Compass, 2017 Waterloo Startup Ecosystem Report
25 Note: The Location Quotient is a ratio measure of the concentration of a cluster in a particular location relative to the national average. So, the LQ is a measure of an industry’s level of concentration within a location, with an LQ > 1.25 indicating higher than average concentration in that location.
37
CHAPTER 4: DIVERSE RESILIENT ECONOMY
Region of Waterloo Economic Development
Figure 24: Information Technology and Analytical Instruments Location Quotient by CMA, 2016
Source: Institute for Competitiveness & Prosperity, Canadian Cluster Data, 2016.
The region’s strong technology sector is supported by the research and training offered by strong local post-secondary institutions. The University of Waterloo mathematics faculty has the largest concentration of mathematical and computer science talent in the world, with more than 8,000 students, 240 full-time professors and 500 courses in mathematics, statistics and computer science.26 The faculty is also a global leader in discovery and innovation. Their esteemed engineering program includes core and forward looking disciplines such as software engineering, systems design, nanotechnology and mechatronics. Conestoga College also offers a full range of engineering and information technology programs with project based learning, co-operative education and case studies which allow students to apply theory to practice during their studies.
Smaller companies in the tech sector such as Shopify and Thalmic Labs also continue to expand in the region. Shopify aims to expand by a further 300 to 500 employees over the next two to three years, securing a lease for a 60,000 square foot office space in uptown Waterloo. In December 2013, Thalmic Labs employed 40 people when it first started shipping its Myo armband to developers from its headquarters at 24 Charles St in Kitchener. It now employs more than 200 people and has completed work on a new factory on Roger Street in Waterloo.
26 https://uwaterloo.ca/math/

38
WATERLOO REGION COMMUNTY PROFILE 2018
Region of Waterloo Economic Development
4.3.3 Aerospace Sector The region’s aerospace industry is the fourth largest in Ontario in terms of total companies (more than 80 companies) and the third largest in terms of employment (more than 2,880 employed).27 As of 2016, information from the Institute for Competitiveness and Prosperity indicated that the region had the highest aerospace location quotient of all CMA’s in Ontario (Figure 25). Waterloo Region is home to diverse aerospace talent, with nine colleges and universities within commuting distance that offer 23 aerospace-related programs combined. The region’s aerospace industry is supported by some of Canada’s premier engineering and aviation programs. The Waterloo Wellington Flight Center is one of Canada’s largest flight training centers, with hundreds of members and a large base of instructors. Conestoga College offers an aviation program with a science fast track option. The University of Waterloo offers a Geography and Aviation Program with options to major in earth sciences or physics. Students gain over 200 hours of flying experience and have the choice to specialize in different fields within earth or physical sciences.
Figure 25: Aerospace Vehicles and Defense Location Quotient by CMAs in Ontario (2016)
Source: Institute for Competitiveness & Prosperity, Canadian Cluster Data, 2016.
27 Statistics Canada, Canadian Business Counts December 2017
Kitchener CMA
#1 in Ontario

39
CHAPTER 4: DIVERSE RESILIENT ECONOMY
Region of Waterloo Economic Development
Some major corporations in aerospace sector (employee 500+) in Waterloo Region include:
Honeywell Aerospace Rockwell Automation Christie Digital Systems Canada, Inc.
4.3.4 Automotive Sector Waterloo Region is an unparalleled holisitc global hub of technology and advanced manufacturing expertise. It is home to one of the world’s first test tracks for autonomous vehicles, local labs are focusing on cyber security for connected cars and exciting companies. The leading companies in automotive sector in the region include Toyota, General Motors (GM), Eclipse Automation and Rockwell Automation. General Motors (GM) has collaborated with Communitech – an 80,000 square foot workspace dedicated to technology and entrepreneurship – to launch Waterloo’s Innovation Research Zone. There are dozens of vehicle supportive organization located in the community which significantly contribute the automotive sector in the region. These organizations include:
Waterloo Centre for Automotive Research (WatCAR) Waterloo Institute for Nanotechnology Waterloo Institute for Sustainable Energy (WISE) Institue for Quantum Computing Conestoga College’s Centre for Smart Manufacturing (CSM)
4.3.5 Business and Financial Services Sector Toronto-Waterloo Corridor is North America’s second largest sector after New York City for Fintech, with 170+ Fintech companies and 13+ incubators/accelerators located in the corridor. Waterloo Region has a strong and vital business and financial services ecosystem which embraces rich density of financial hubs and incubators including Communitech, Waterloo Research Institute in Insurance and Securities and Quantitative Finance (WatRisq). Some renowned innovation labs related to financial services including CIBC Data Studio, Manulife RED Lab, Thomson Reuters Lab, and Scotiabank FactoryU. These labs make the region as a leader in ongoing convergence of the financial and technology sectors. In terms of the talents in the field, three academic institutions - Conestoga College, Wilfrid Laurier University and the University of Waterloo provide a future-proof talent pool of well educated and highly skilled business and financial professionals.

40
WATERLOO REGION COMMUNTY PROFILE 2018
Region of Waterloo Economic Development
4.3.6 Food Processing Sector Waterloo Region has a robust food processing sector which is supported by nearly 1,400 farms and more than 130 regional food manufacturers.28 Several food processing industries were very strong in the community including crop and animal production, snack foods, confectionery, baking and beverage product manufacturing as well as distribution. The food processing sector in the region is reinforced by more than 150 research institutions and innovation hubs, including Conestoga College’s Institute of Food Processing Technology and the Ontario Agriculture College.
Farms in Waterloo Region earn two times more in revenue than the provincial average per acre. The average age of region’s farmers is 49 years old, which is the youngest in Ontario.
Some renowned corporations in food processing sector in Waterloo Region include:
Grand River Foods Conestoga Meats Elmira Pet Products Dare Foods Limited Piller’s Fine Foods Frito-Lay Canada Weston Foods
28 WaterlooEDC: A Taste of Waterloo’s Food Processing Cluster
41
CHAPTER 4: DIVERSE RESILIENT ECONOMY
Region of Waterloo Economic Development
4.4 Key Economic Indicators
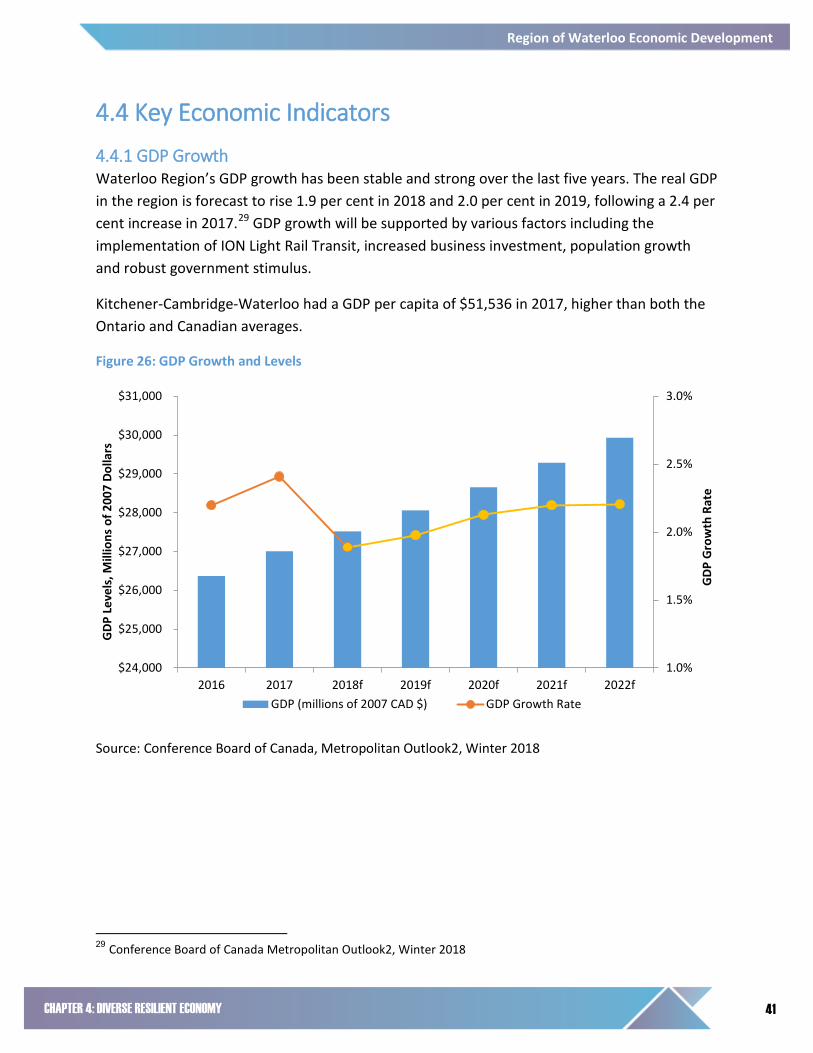
4.4.1 GDP Growth Waterloo Region’s GDP growth has been stable and strong over the last five years. The real GDP in the region is forecast to rise 1.9 per cent in 2018 and 2.0 per cent in 2019, following a 2.4 per cent increase in 2017.29 GDP growth will be supported by various factors including the implementation of ION Light Rail Transit, increased business investment, population growth and robust government stimulus.
Kitchener-Cambridge-Waterloo had a GDP per capita of $51,536 in 2017, higher than both the Ontario and Canadian averages.
Figure 26: GDP Growth and Levels
Source: Conference Board of Canada, Metropolitan Outlook2, Winter 2018
29 Conference Board of Canada Metropolitan Outlook2, Winter 2018
1.0%
1.5%
2.0%
2.5%
3.0%
$24,000
$25,000
$26,000
$27,000
$28,000
$29,000
$30,000
$31,000
2016 2017 2018f 2019f 2020f 2021f 2022f
GDP
Gro
wth
Rat
e
GDP
Lev
els,
Mill
ions
of 2
007
Dolla
rs
GDP (millions of 2007 CAD $) GDP Growth Rate

42
WATERLOO REGION COMMUNTY PROFILE 2018
Region of Waterloo Economic Development
Figure 27: GDP per Capita Kitchener-Cambridge-Waterloo vs. Ontario and Canada, 2017
Source: Conference Board of Canada, Metropolitan Outlook2, Winter 2018
4.4.2 Consumer Price Index Waterloo Region is one of the most affordable CMA’s to live in Ontario. Upside risks to inflation in the short to medium term include strong local economic growth and faster than expected US growth.
Figure 28: CPI (2002=1.0) and Inflation
Source: Conference Board of Canada, Metropolitan Outlook2, Winter 2018
1.2%
1.8% 1.6%
2.1% 2.2%
2.1% 2.1% 2.1%
0.0%
0.5%
1.0%
1.5%
2.0%
2.5%
1.15
1.2
1.25
1.3
1.35
1.4
1.45
1.5
2015 2016 2017 2018f 2019f 2020f 2021f 2022f
Infla
tion
Rate
CPI (
2002
= 1
.0)
CPI (2002 Base) Inflation
Kitchener-Cambridge-Waterloo

43
CHAPTER 4: DIVERSE RESILIENT ECONOMY
Region of Waterloo Economic Development
4.4.3 Employment Growth Kitchener-Cambridge-Waterloo had total labour force of 303,400 and 287,800 employed people in 2017 according to annualized data gathered from the Labour Force Survey of Canada. As the region’s population continues increasing, the working age population (15 years old and over) has also maintained steady growth. Figure 29 depicts employment growth in Waterloo Region since 2004.
Figure 29: Employment Growth in Kitchener-Cambridge-Waterloo
Source: Statistics Canada CANSIM Table 282-0129
-6.0%
-4.0%
-2.0%
0.0%
2.0%
4.0%
6.0%
230,000
240,000
250,000
260,000
270,000
280,000
290,000
300,000
310,000
2004 2005 2006 2007 2008 2009 2010 2011 2012 2013 2014 2015 2016 2017
Empl
oym
ent G
row
th R
ate
Tota
l Em
ploy
men
t
Total Employment Employment Growth Rate 0 Percent

44
WATERLOO REGION COMMUNTY PROFILE 2018
Region of Waterloo Economic Development
4.5 Building Development
4.5.1 Total Value of New Building Permits The total building activity in Waterloo Region remains strong and much of the growth is attributed to the ION LRT project, which is supporting development in the region’s core areas.30 Building permit construction value for new residential units and new employment floor space between 2011 and 2016 in the CTC was $2.1 billion.31
The total value of new residential and non-residential buildings for which building permits were issued in 2017 was $1.03 billion, a decrease of 26 per cent from 2016, but only 5 per cent lower than the 10 year average value of $1.09 billion. The residential sector represented $670 million of the $1.03 billion in building permits in 2017. The industrial, commercial and institutional sectors contributed $366.5 million.32
Figure 30: Total Value of New Building Permits (2008-2017)
Source: Region of Waterloo 2017 Building Activity Report
30The ION story from http://rapidtransit.regionofwaterloo.ca/en/ suggests that the increase in development is a result of the LRT construction. 31 Region of Waterloo 2016 Monitoring Change in the CTC report 32 Region of Waterloo 2017 Building Activity Report

45
CHAPTER 4: DIVERSE RESILIENT ECONOMY
Region of Waterloo Economic Development
4.5.2 Housing Starts The number of housing starts in Waterloo Region is trending upwards and a growing percentage is apartments and townhouses, rather than single detached units. Canada Mortgage and Housing Corporation (CMHC) reported 3,850 housing units were started in 2017 in the Kitchener-Cambridge-Waterloo, which covers Kitchener, Waterloo, Cambridge, Woolwich and North Dumfries. Figure 31 displays annual housing starts since 2011.
Figure 31: Housing Starts in Kitchener-Cambridge-Waterloo
Source: Statistics Canada, CANSIM Table 027-0048 & 2016 Region of Waterloo Building Activity Report
1,1
86
871
690
869
995
1,3
92
1,0
95
1,7
68
2,0
29
1,1
50
3,5
81
2,2
17
2,6
82
2,7
55
2,954 2,900
1,840
4,450
3,212
4,074 3,850
2011 2012 2013 2014 2015 2016 2017
Hous
ing
Star
ts
Single-detached units Apartment and other unit types Total units

46
WATERLOO REGION COMMUNTY PROFILE 2018
Region of Waterloo Economic Development
4.5.3 Development in the Built Up Area (BUA) In May 2017, the Province of Ontario released its new Growth Plan for the Greater Golden Horseshoe. This update to provincial planning policy continues to prioritize intensification and higher densities to make efficient use of land, infrastructure and transit. The previous Growth Plan (2006) set a minimum target that 40 per cent of new residential units are to be constructed within the Built Up Area (BUA), which is the extent of the area that was already developed in 2006. The Region of Waterloo Official Plan’s target is 45 per cent.
Although the targets were to be achieved by 2015, both targets have been exceeded each year since 2010. In 2017, 51 per cent (1,659 units) of residential building permits were issued in the built-up area (BUA).
The introduction of the ION LRT is helping support residential growth and intensification from north Waterloo to south Cambridge. The intensification targets are compared to the actual percentage of residential units constructed in the Built Up Area in Figure 32.
Figure 32: Units Constructed Inside the Build Up Area (BUA) Percentage (2006-2017)
Source: Region of Waterloo 2017 Building Activity Report

47
CHAPTER 4: DIVERSE RESILIENT ECONOMY
Region of Waterloo Economic Development
4.5.4 Total New Square Footage, Non-Residential The value of non-residential permits issued in 2017 was $366.5 million, an increase of 48 per cent from the value in 2016. Increases were experienced in all sectors, specifically, an increase of $45.5 million in permit values in industrial, $6.5 million in commercial, and $66.1 million in institutional sectors.
Over 2 million square feet of new non-residential floor space is to be created through these building permits, an increase of almost 20 per cent compared to 2016.
Compared to 2016, industrial square footage on building permits increased 28 per cent to almost one million (978,749) square feet. Commercial square footage (consisting of a mix of office, recreational, and retail) decreased by 15 per cent to 643,500 square feet. The institutional sector increased 77 per cent compared to last year, with 573,082 square feet. Figure 33 illustrates the ten-year historical variation in non-residential floor space.
Figure 33: Total New Non-Residential Floor Space by Sector (2008-2017)
Source: Region of Waterloo 2017 Building Activity Report

48
WATERLOO REGION COMMUNTY PROFILE 2018
Region of Waterloo Economic Development
4.6 Standard of Living
4.6.1 Residential Prices and Rental Market The spillover effects of the housing market boom in Toronto and the Greater Toronto Area (GTA) have supported recent increases in Waterloo Region’s residential prices. However, these prices remain moderate when compared to other CMAs. For instance, average house prices by dwelling type for Kitchener-Cambridge-Waterloo are below both the GTA and the 53 city composite averages.33 Figure 34 depicts average prices by home type for the Kitchener-Cambridge-Waterloo, the GTA, and the 53 city composite measure.
Figure 34: Average Real Estate Prices, 2017 Q4
Source: Royal LePage National House Price Composite Q4, 2017
33 A weighted average of Canada’s 53 largest housing markets, conducted by Royal LePage

49
CHAPTER 4: DIVERSE RESILIENT ECONOMY
Region of Waterloo Economic Development
Waterloo Region’s overall private apartment rental prices are also below provincial averages. Figure 35 demonstrates the private apartment average rents by bedroom type for Kitchener-Cambridge-Waterloo and Ontario, as well as the vacancy rate by bedroom type for Kitchener-Cambridge-Waterloo. While demand is projected to increase slightly more than supply in the rental market, the vacancy rate and rental price growth rates are expected to remain stable.34
Figure 35: Private apartment average rents ($) by bedroom type, 2017
Source: CMHC, 2017 Rental Market Report Ontario Highlights, Table 1.1.1 & 1.1.2
34 CMHC Fall 2016 Kitchener-Cambridge-Waterloo Housing Market Outlook

50
WATERLOO REGION COMMUNTY PROFILE 2018
Region of Waterloo Economic Development
4.6.2 Median Household Income In 2015, the total (before-tax) median household income in Waterloo Region was $77,530, or $67,887 after tax. Household income, which includes the income of families as well as people living alone, was higher than both that of Ontario ($74,287) and Canada ($70,336). Within southwestern Ontario, Waterloo Region, along with the areas surrounding Toronto, all had incomes that were higher than the provincial median.35
Figure 36: Median household income for Waterloo Region, 2005 and 2015
Name Median total income of household ($)
Per cent change (%)
Median after-tax income of household ($)
Per cent change (%)
2005 2015 2005 2015 Waterloo Region 76,327 77,530 1.6 65,286 67,887 4 Ontario 71,534 74,287 3.8 61,659 65,285 5.9 Canada 63,457 70,336 10.8 55,118 61,348 11.3
Source: 2016 Region of Waterloo Census Bulletin #5 - Income
Between 2005 and 2015, the total (before tax) median household income in Waterloo Region increased by 1.6 per cent from $76,327 in 2005 to $77,530 in 2015. This growth was lower than that of Ontario (3.8 per cent) and of Canada as a whole (10.8 per cent). While the Canadian resource sector boomed between 2005 and 2015 and resulted in significant income growth for resource rich provinces and territories, Ontario saw a loss of 318,000 manufacturing jobs over this same ten year period and experienced the lowest income growth rate in Canada. Although Waterloo Region also had a large proportion of its workforce in manufacturing, the region’s diverse economy has contributed to its overall positive income growth over this ten year span. Figure 37 below shows the 2015 total median income in Southwestern Ontario.36
35 Region of Waterloo Census Bulletin #5 - Income 36 Region of Waterloo Census Bulletin #5 - Income

51
CHAPTER 4: DIVERSE RESILIENT ECONOMY
Region of Waterloo Economic Development
Figure 37: Total median household income in Southwestern Ontario, 2015
Source: 2016 Region of Waterloo Census Bulletin #5 - Income

TRANSPORTATION
CHAPTER 5:
53
CHAPTER 5: TRANSPORTATION
Region of Waterloo Economic Development
5.1 Market Access Waterloo Region is located in southwestern Ontario on highway 401 and is within a three hour drive of five Canadian-US border crossings, as well as within a two hour drive of four international airports. The Region’s rail system includes freight service from CN and CP.
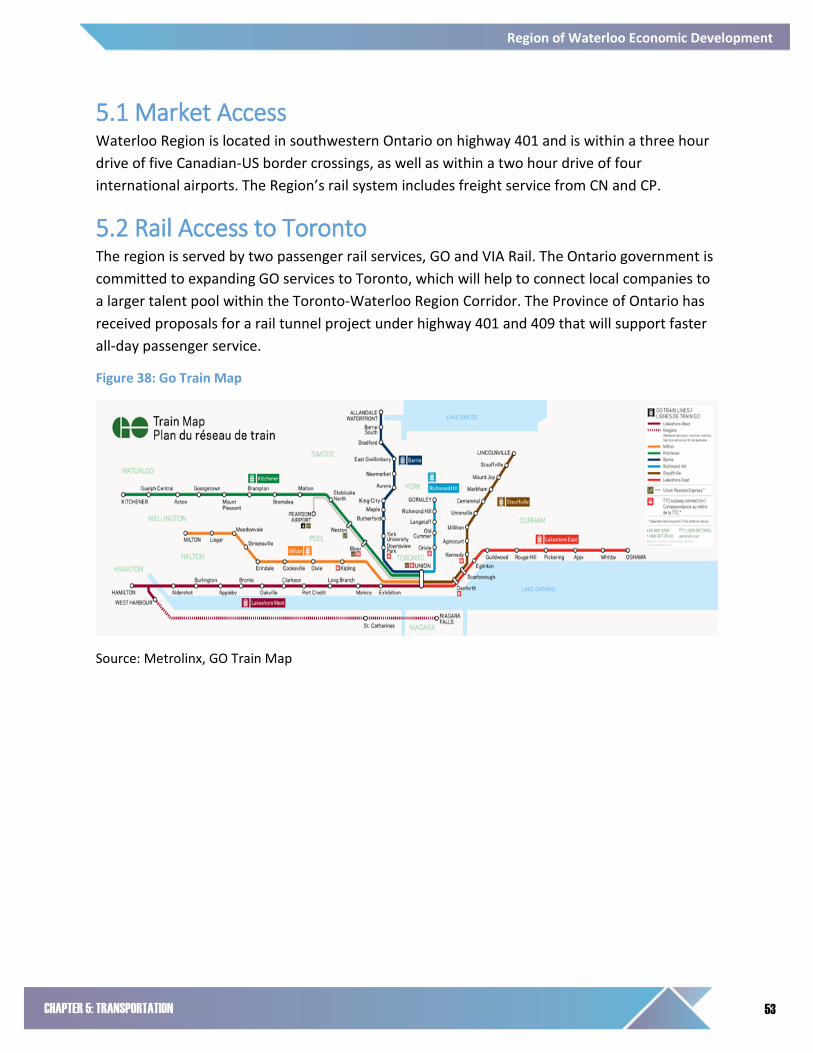
5.2 Rail Access to Toronto The region is served by two passenger rail services, GO and VIA Rail. The Ontario government is committed to expanding GO services to Toronto, which will help to connect local companies to a larger talent pool within the Toronto-Waterloo Region Corridor. The Province of Ontario has received proposals for a rail tunnel project under highway 401 and 409 that will support faster all-day passenger service.
Figure 38: Go Train Map
Source: Metrolinx, GO Train Map

54
WATERLOO REGION COMMUNTY PROFILE 2018
Region of Waterloo Economic Development
300,000
350,000
400,000
450,000
500,000
550,000
600,000
650,000
700,000
750,000
8,000,000
10,000,000
12,000,000
14,000,000
16,000,000
18,000,000
20,000,000
22,000,000
24,000,000
1991 1993 1995 1997 1999 2001 2003 2005 2007 2009 2011 2013 2015
Popu
latio
n an
d Re
venu
e Ho
urs
Ride
rshi
p
Ridership Revenue Hours Municipal Population
5.3 Local Transit Network
5.3.1 Grand River Transit Grand River Transit (GRT) provides transit service to communities in Waterloo Region, including Kitchener, Waterloo, Cambridge, Elmira, St. Jacobs and New Hamburg. GRT operates conventional buses, an express bus network, busPLUS service for community routes, and door-to-door transit service for riders with disabilities using specialized vehicles. Today, GRT operates 70 routes and covers more than 16 million kilometres every year and serves 20.3 million riders annually.
Figure 39 displays the change in ridership and service hours. There is a clear change in the ridership trend starting when the Region assumed transit responsibilities and increased service hours. Wider economic benefits will come from the increased mobility within the region. Increased mobility enhances the movement of people, goods and services. Consequently, firms and consumers will have greater access to the resources they need and desire.
Figure 39: GRT ridership, revenue hours, and municipal population
Source: Region of Waterloo, GRT Ridership
GRT's service is expanding with the construction of a rapid transit network consisting of ION light rail and ION bus rapid transit.
Region takes over Transit
Services

55
CHAPTER 5: TRANSPORTATION
Region of Waterloo Economic Development
5.3.2 Rapid Transit ION is the Region of Waterloo’s rapid transit system and is made up of light rail transit and bus rapid transit. ION light rail consists of a 19-kilometre route from north Waterloo to south Kitchener, with 19 stops in between.
Waterloo Region’s population is expected to grow by 200,000 people in the next two decades, and add over 80,000 jobs. ION is part of the Region of Waterloo’s plan to manage congestion and reduce urban expansion on valuable farmland. Regional Council approved light rail transit as the preferred rapid transit technology in 2009. Nine years later, in partnership with the Federal and Provincial government, ION construction is complete and is preparing to take its first passengers in 2018.
LRT has two main goals:
1. Move people by providing an efficient, attractive travel option for residents. The ION LRT is a faster, quieter and more comfortable experience for riders than buses. It can also carry more people than a bus and avoids congestion by travelling in its own protected right-of-way. The Region of Waterloo has purchased fourteen Light Rail Vehicles (LRV’s) from Bombardier, each with the ability to comfortably hold 200 people.
2. Build community by encouraging development in the region’s core areas. By building up instead of out, the Region is reducing the amount of farmland needed for urban uses such as new housing. This improves overall air and water quality, as well as ensuring lower per capita costs for municipal services. Recent patterns suggest that the LRT is succeeding in attracting development. From 2003 to 2016, the percentage of new residential development constructed in the built up area grew from 15 per cent to 54 per cent (see Figure 26).
The median commute time for Waterloo Region residents was 22.8 minutes each way.37
37 Region of Waterloo Census Bulletion #10: Place of Work and Commuting to Work

56
WATERLOO REGION COMMUNTY PROFILE 2018
Region of Waterloo Economic Development
5.4 New Transit Investments
5.4.1 The King-Victoria Transit Hub On June 14, 2016, Premier Kathleen Wynne announced the Province of Ontario is committing $43 million to build a transit hub in downtown Kitchener. Located in Downtown Kitchener, the transit hub will provide a centralized transit facility with seamless connections between walking, cycling, GRT, inter-city busses, GO Transit and VIA Rail.
The transit hub is more than a train station; the Region is working to find a developer who will integrate transit with retail, high-density office and residential uses.
The transit hub complements the ongoing revitalization of downtown Kitchener and the Region’s broader economic development objectives connecting to the Toronto-Waterloo Region Innovation Corridor (theCorridor.ca).
Figure 40: Toronto-Waterloo Corridor
Source: TheCorridor.ca
5.4.2 High Speed Rail The Provincial Government has started a $15 million environmental assessment for a high speed rail project connecting southwestern Ontario from Windsor to Toronto, through Kitchener. Phase one of the projects will include a line from London to Union Station, and has a goal of being completed by 2025. The top speed of one of these trains is 250 km/h.
Transportation Minister Steve Del Duca has stated that a trip from Kitchener to Pearson International would be 32 minutes, and it would take 16 minutes more to reach Union Station.38
38 Flanagan, Ryan; 12 Things to know about Ontario’s high-speed rail proposal. Kitchener: CTV News

57
CHAPTER 5: TRANSPORTATION
Region of Waterloo Economic Development
The Region will see significant advantages in being more connected to southwestern Ontario, as it will increase access to essential talent, and the Toronto-Waterloo Corridor.
5.5 Region of Waterloo International Airport The Region of Waterloo International Airport (YKF) is located 19 minutes north of Highway 401, approximately 85 kilometres from Toronto. With approximately 1,000 acres of land, YKF is home to over 250 charter aircraft, 25 businesses, over 300 employees, and generates approximately $90.1 million in economic impact to the local economy.
Daily scheduled air service is provided by WestJet, offering daily non-stop service to Calgary year-round with connections to other great destinations. Sunwing Airlines offers weekly direct service to Punta Cana, Dominican Republic from December through March. FlyGTA Airlines also offers several flights a day to Toronto Island Airport.
The Region of Waterloo is committed to expanding air service and is prepared to invest up to $375 million in the airport with its federal & provincial partners.
COST COMPETITIVENESS CHAPTER 6:

59
CHAPTER 6: COST COMPETITIVENESS
6.1 National and Provincial Cost Advantages
6.1.1 Property Tax Rates in Waterloo Region Property tax rates vary by municipality in Waterloo Region, and are based on the class of property. Figure 41 summarizes the residential, industrial, commercial and office tax rates. These are based on classifications taxable at full rates, and include the various City, Region and Education tax rates.
Figure 41: Property tax rates in Waterloo Region
Source: Compiled by the Region of Waterloo Office of Economic Development, 2017
0.0%
0.5%
1.0%
1.5%
2.0%
2.5%
3.0%
3.5%
4.0%
City ofKitchener
City ofWaterloo
City ofCambridge
Township ofWellesley
Township ofWilmot
Township ofWoolwich
Township ofNorth
Dumfries
Prop
erty
Tax
Rat
e
Residential Multi-Residential Commercial Industrial

60
WATERLOO REGION COMMUNTY PROFILE 2018
Region of Waterloo Economic Development
6.1.2 Corporate Tax Rates Canada’s tax rates are among the lowest in the world. PwC, The World Bank, and the IMF release an annual report called Paying Taxes, in which they compare the tax rates and the administrative burden placed on small-medium companies by 190 tax regimes throughout the world. Canada had an average total tax and contribution rate of 20.9 per cent, including a 3.8 per cent profit tax rate, 12.9 per cent labour tax rate and 4.2 per cent other tax rate. This ranks Canada as the 2nd lowest total tax regime amongst OECD countries and 1st lowest amongst G7 countries for small-medium enterprises.39 Figure 42 demonstrates the total tax rates of G7 countries, partitioned by the components of corporate tax, labour tax, and other taxes.
Figure 42: Average Total Tax and Contribution Rate for Small-Medium Companies in G7 Countries
Source: Paying Taxes 2018: PwC & the World Bank Group
39 Paying Taxes 2018, PwC Interactive tax data explorer
0.0% 10.0% 20.0% 30.0% 40.0% 50.0% 60.0% 70.0%
France
Germany
Italy
Japan
United States
United Kingdom
Canada
Tax & Contribution Rate
Prfit TTCR
Labour TTCR
Other taxes TTCR

61
CHAPTER 6: COST COMPETITIVENESS
0.9
1.1
1.3
1.5
1.7
1.9
2.1
Exch
ange
Rat
e
Value of the Loonie
Can-US Exchange CERI Exchange Euro Exchange
Uk Pound Exchange ParDe
prec
iatio
n
6.1.3 Exchange Rate Held against some of its main trading partners, the Canadian dollar presents foreign companies with a superior cost advantage. Figure 43 depicts exchange rates for the UK pound, the Euro, the American dollar and the Canadian effective exchange rate index (CERI40). These exchange rates are foreign dollars in terms of Canadian dollars, so that an increase in their value represents a depreciation of the Canadian dollar. The Canadian dollar presents a large cost advantage to foreign investors. Its value is expected to remain low in the short to medium term.
Figure 43: Value of the Loonie
Source: Bank of Canada, Historical Noon and Closing Rates
40 CERI is a comprehensive, weighted average exchange rate measure used by the Bank of Canada. Weights are placed based on the proportion of Canada’s total trade with that country.

62
WATERLOO REGION COMMUNTY PROFILE 2018
Region of Waterloo Economic Development
6.1.4 National and Provincial Incentives Canada and Ontario offer a variety of incentives to reduce the cost and risk associated with conducting Research and Development (R&D). Figure 44 demonstrates the low cost of conducting R&D in Canada as opposed to other OECD countries. As well, small-medium enterprises have the opportunity to reduce their R&D costs by as much as 74 per cent in Ontario. Figure 45 includes a list of other tax incentives, grants and programs designed to foster research and innovation.
Figure 44: Cost of Research and Development Index
Source: KPMG, Competitive Alternatives 2016
Baseline
88.1
87.2
84.0
79.0
77.9
77.6
74.0
72.3
55.3
0 10 20 30 40 50 60 70 80 90 100
United States
United Kingdom
Japan
Germany
Italy
Australia
France
Netherlands
Canada
Mexico
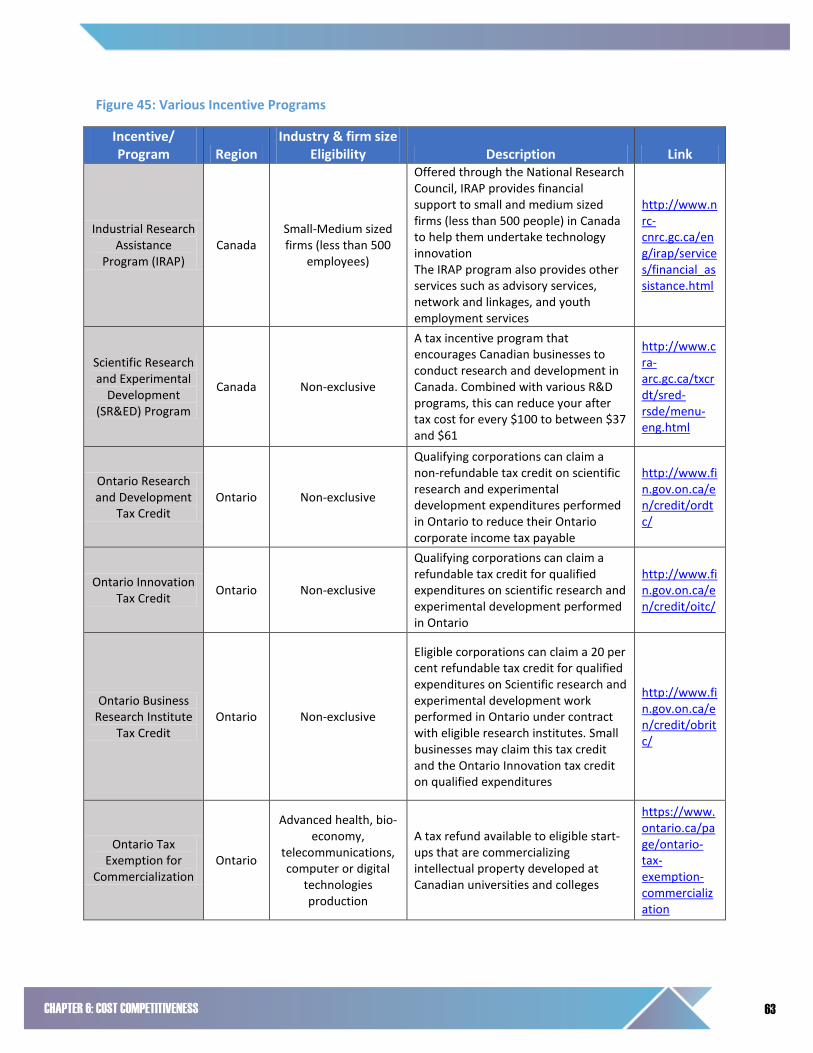
63
CHAPTER 6: COST COMPETITIVENESS
Figure 45: Various Incentive Programs
Incentive/ Program Region
Industry & firm size Eligibility Description Link
Industrial Research Assistance
Program (IRAP) Canada
Small-Medium sized firms (less than 500
employees)
Offered through the National Research Council, IRAP provides financial support to small and medium sized firms (less than 500 people) in Canada to help them undertake technology innovation The IRAP program also provides other services such as advisory services, network and linkages, and youth employment services
http://www.nrc-cnrc.gc.ca/eng/irap/services/financial_assistance.html
Scientific Research and Experimental
Development (SR&ED) Program
Canada Non-exclusive
A tax incentive program that encourages Canadian businesses to conduct research and development in Canada. Combined with various R&D programs, this can reduce your after tax cost for every $100 to between $37 and $61
http://www.cra-arc.gc.ca/txcrdt/sred-rsde/menu-eng.html
Ontario Research and Development
Tax Credit Ontario Non-exclusive
Qualifying corporations can claim a non-refundable tax credit on scientific research and experimental development expenditures performed in Ontario to reduce their Ontario corporate income tax payable
http://www.fin.gov.on.ca/en/credit/ordtc/
Ontario Innovation Tax Credit Ontario Non-exclusive
Qualifying corporations can claim a refundable tax credit for qualified expenditures on scientific research and experimental development performed in Ontario
http://www.fin.gov.on.ca/en/credit/oitc/
Ontario Business Research Institute
Tax Credit Ontario Non-exclusive
Eligible corporations can claim a 20 per cent refundable tax credit for qualified expenditures on Scientific research and experimental development work performed in Ontario under contract with eligible research institutes. Small businesses may claim this tax credit and the Ontario Innovation tax credit on qualified expenditures
http://www.fin.gov.on.ca/en/credit/obritc/
Ontario Tax Exemption for
Commercialization Ontario
Advanced health, bio-economy,
telecommunications, computer or digital
technologies production
A tax refund available to eligible start-ups that are commercializing intellectual property developed at Canadian universities and colleges
https://www.ontario.ca/page/ontario-tax-exemption-commercialization

64
WATERLOO REGION COMMUNTY PROFILE 2018
Region of Waterloo Economic Development
Canadian Manufacturers and
Exporters (CME) SMART Advanced Technologies for Global Growth
South Ontario Manufacturing
Provides manufacturers up to $75,000 in grant funding to cover up to 33 per cent of costs to cover advanced technology assessments or advanced technology adoption projects that focus on improving productivity
http://www.cme-smart.ca/home-en
Ontario Centers of Excellence (OCE)
Collaboration Voucher Program
Ontario Non-exclusive
Connects Ontario companies with the province's world-leading research institutions for increased productivity and commercialization. Through its partners, OCE offers several funding streams for helping businesses improve productivity, adopt cutting-edge technology and harness the power of high performance computing power
http://www.oce-ontario.org/programs/industry-academic-collaboration/collaboration-voucher-program
Automotive Innovation Fund
(AIF) Canada Automotive
The AIF provides repayable and non-repayable contributions to automotive companies in support of strategic, large-scale research and development projects in the automotive sector to build innovative, greener and more fuel-efficient vehicles
https://www.ic.gc.ca/eic/site/auto-auto.nsf/eng/am02258.html
Automotive Supplier
Innovation Program (ASIP)
Canada Automotive
Starting in 2015, Economic Action Plan has proposed to provide $100 million over five years to help Canadian Automotive suppliers gain a competitive edge through new innovative products and processes
http://www.ic.gc.ca/eic/site/auto-auto.nsf/eng/h_am02377.html
Ontario Centers of Excellence (OCE) R&D Challenge
Ontario Aerospace
A $2.5 million program initiative supporting areas of technology that are strategically important to the Ontario aerospace industry. The goals of the program include development of technological breakthroughs and new enabling technologies, with significant economics benefit for Ontario
http://www.oce-ontario.org/programs/industry-academic-collaboration/collaboration-voucher-program/VIA/aerospace-rd-challenge
Strategic Aerospace and
Defence initiative (SADI)
Canada Aerospace
SADI provides repayable contributions to support research and development projects in aerospace, space, defence, and security
https://www.ic.gc.ca/eic/site/ito-oti.nsf/eng/h_00022.html

65
CHAPTER 6: COST COMPETITIVENESS
Sustainable Development
Technology Fund (SD Tech Fund)
Canada
Clean Tech projects which address climate
change, air quality, clean water and clean
soil
Aim is to increase the chances of each project making it to the marketplace. $915 million dollars has been allocated to the fund
https://www.sdtc.ca/en/apply/sd-tech-fund
Sustainable Natural Gas
Development Fund (SD Natural Gas
Fund)
Canada
Clean tech projects which support the development and demonstration of
downstream natural gas tech
With $30 million dollars allocated to the fund, the aim is to support late-stage development and pre-commercial demonstration of new downstream natural gas clean-tech solutions that will generate cleaner energy, create new jobs and stimulate economic growth in Canada
https://www.sdtc.ca/en/apply/sd-natural-gas-fund
Ontario Centers of Excellence's
Explore Program Ontario Pharmaceuticals
This program supports unconventional and highly innovative research with the potential to greatly impact the drug discovery process. The ultimate goal is to challenge the established practices in the drug R&D process
http://www.oce-ontario.org/programs/industry-academic-collaboration/explore

66
WATERLOO REGION COMMUNTY PROFILE 2018
Region of Waterloo Economic Development
6.2 Regional Incentives
6.2.1 Brownfield Financial Incentive Program The Region of Waterloo has a Brownfields Financial Incentive Program (BFIP) to encourage the redevelopment of former industrial sites, gas stations and dry cleaners that have remained unused or underdeveloped after the original business closed. Waterloo Region's history as a manufacturing centre means brownfields are often in prime locations in our community. While redevelopment may be complicated due to contamination, there are benefits to developers interested in building in strategic locations with existing service.
The BFIP is a comprehensive collection of financial incentives to assist developers with the costs of environmental investigation and remediation of brownfield properties. This program exemplifies the Region’s commitment to cost effective development and sustainable business practices. Since initiating the program, over 40 Brownfield grants have been approved, valued at $30 million. This includes the Breithaupt Block, which was awarded the 2016 Best Overall Brownfield by Canadian Urban Institute, as well as the 2016 Sustainable Communities Award by the Federation of Canadian Municipalities.
The BFIP is helping the Region achieve many of its development and environmental goals. The program promotes compact development by encouraging development in the Built Up Area, close to ION Rapid Transit. Remediating impacted properties helps to protect the Region’s groundwater.
6.2.2 Other Incentives The Region of Waterloo maintains a comprehensive list of Regional and Area Municipal incentives. For example, The Region provides incentives for new and expanded industrial buildings.