Embed Size (px)
Citation preview

California Local Health Jurisdiction STD Data Summaries 2010 Provisional Data
Data Sources .................. 2 Data Limitations .............. 3 State Summary ............... 4 Alameda .......................... 8 Alpine ............................ 10 Amador .......................... 12 Berkeley ........................ 14 Butte .............................. 16 Calaveras ...................... 18 Colusa ........................... 20 Contra Costa ................. 22 Del Norte ....................... 24 El Dorado ...................... 26 Fresno ........................... 28 Glenn ............................. 30 Humboldt ....................... 32 Imperial ......................... 34 Inyo ............................... 36 Kern ............................... 38 Kings ............................. 40 Lake .............................. 42 Lassen ........................... 44 Long Beach ................... 46 Los Angeles .................. 48
Madera .......................... 50 Marin ............................. 52 Mariposa ....................... 54 Mendocino .................... 56 Merced .......................... 58 Modoc ........................... 60 Mono ............................. 62 Monterey ....................... 64 Napa ............................. 66 Nevada ......................... 68 Orange .......................... 70 Pasadena ...................... 72 Placer ............................ 74 Plumas .......................... 76 Riverside ....................... 78 Sacramento................... 80 San Benito .................... 82 San Bernardino ............. 84 San Diego ..................... 86 San Francisco ............... 88
San Joaquin .................. 90 San Luis Obispo ........... 92 San Mateo .................... 94 Santa Barbara .............. 96 Santa Clara ................... 98 Santa Cruz .................. 100 Shasta ........................ 102 Sierra .......................... 104 Siskiyou ...................... 106 Solano ........................ 108 Sonoma ...................... 110 Stanislaus ................... 112 Sutter .......................... 114 Tehama ...................... 116 Trinity .......................... 118 Tulare ......................... 120 Tuolumne .................... 122 Ventura ....................... 124 Yolo ............................ 126 Yuba ........................... 128
Local Health Jurisdictions
Prepared by: California Department of Public Health Sexually Transmitted Diseases Control Branch http://www.cdph.ca.gov/programs/std/Pages/default.aspx
July 2011
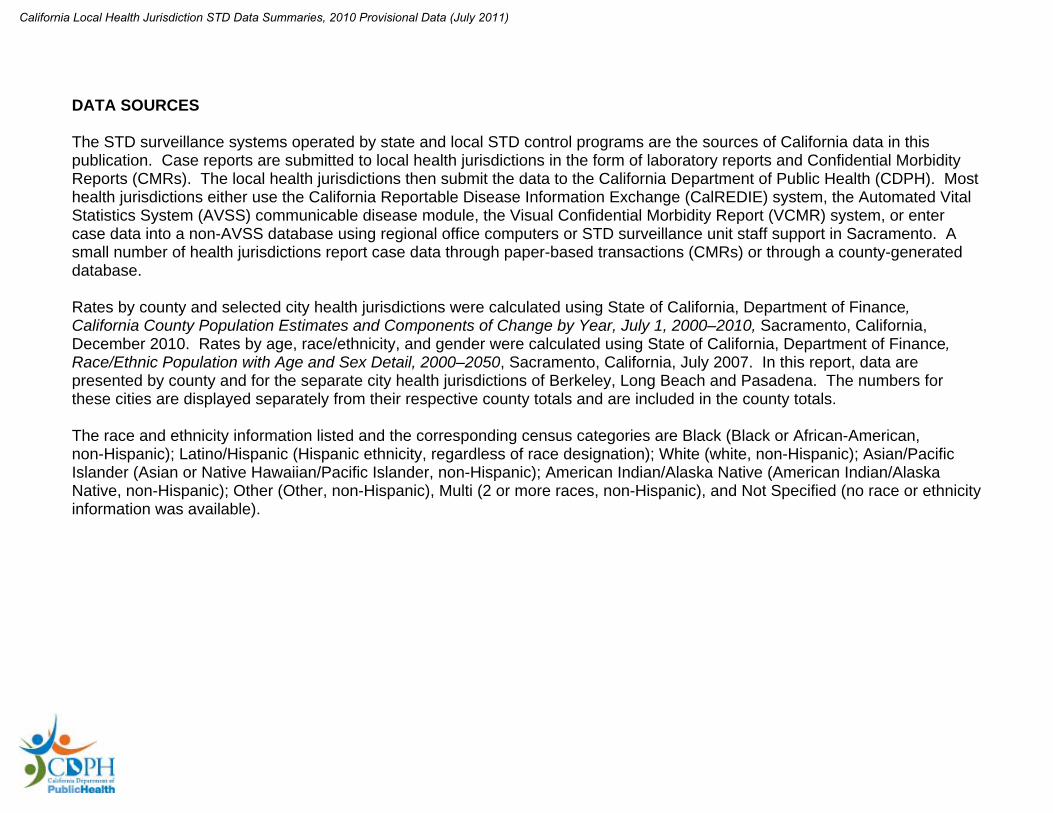
DATA SOURCES The STD surveillance systems operated by state and local STD control programs are the sources of California data in this publication. Case reports are submitted to local health jurisdictions in the form of laboratory reports and Confidential Morbidity Reports (CMRs). The local health jurisdictions then submit the data to the California Department of Public Health (CDPH). Most health jurisdictions either use the California Reportable Disease Information Exchange (CalREDIE) system, the Automated Vital Statistics System (AVSS) communicable disease module, the Visual Confidential Morbidity Report (VCMR) system, or enter case data into a non-AVSS database using regional office computers or STD surveillance unit staff support in Sacramento. A small number of health jurisdictions report case data through paper-based transactions (CMRs) or through a county-generated database. Rates by county and selected city health jurisdictions were calculated using State of California, Department of Finance, California County Population Estimates and Components of Change by Year, July 1, 2000–2010, Sacramento, California, December 2010. Rates by age, race/ethnicity, and gender were calculated using State of California, Department of Finance, Race/Ethnic Population with Age and Sex Detail, 2000–2050, Sacramento, California, July 2007. In this report, data are presented by county and for the separate city health jurisdictions of Berkeley, Long Beach and Pasadena. The numbers for these cities are displayed separately from their respective county totals and are included in the county totals. The race and ethnicity information listed and the corresponding census categories are Black (Black or African-American, non-Hispanic); Latino/Hispanic (Hispanic ethnicity, regardless of race designation); White (white, non-Hispanic); Asian/Pacific Islander (Asian or Native Hawaiian/Pacific Islander, non-Hispanic); American Indian/Alaska Native (American Indian/Alaska Native, non-Hispanic); Other (Other, non-Hispanic), Multi (2 or more races, non-Hispanic), and Not Specified (no race or ethnicity information was available).
California Local Health Jurisdiction STD Data Summaries, 2010 Provisional Data (July 2011)

DATA LIMITATIONS The observed increasing trend in chlamydia cases is influenced by factors other than true increases in cases. Chlamydia is often asymptomatic, and many cases are identified through screening programs offered primarily to women. Based on local, state, and national efforts, these screening activities have been increasing in recent years. Women may be screened for chlamydia through routine Pap smear screening, family planning services, and other services related to reproductive health care. Although the majority of chlamydia infections in males are asymptomatic, there are no guidelines for screening asymptomatic males. Another factor influencing the apparent increase in cases is the increasing use of urine-based, nucleic acid amplification tests (NAAT) for chlamydia screening. This test type is likely contributing to the rise in the number of reported chlamydia cases because these tests are more sensitive and more acceptable to some women and men The substantial amount of missing race/ethnicity data from the laboratory reports and CMRs limits the interpretation of race/ethnicity data from surveillance data. The majority of case reports originate from laboratories, a group which does not routinely collect data on race/ethnicity. Further, some managed care organizations and other health care service providers do not routinely record race/ethnicity of patients. The observed racial/ethnic disparities may reflect true differences in the infection rates, differential access to health care, and/or reporting practices of different types of providers that serve different populations. Caution should also be observed when interpreting rates based on few events and/or small populations. For more information, refer to Guidelines for statistical analysis of public health data with attention to small numbers, Revised, July, 2003. This publication can be found at http://fhop.ucsf.edu/fhop/docs/pdf/prods/smallnumbers2003.pdf. To protect confidentially, non-zero data cells in the Local Health Jurisdiction (LHJ) Data Summaries are suppressed if the population denominator minus the number of cases is less than 100. If a cell is suppressed, one or more complementary cells are suppressed to avoid recalculation of the suppressed cell.
California Local Health Jurisdiction STD Data Summaries, 2010 Provisional Data (July 2011)

California – Chlamydia, Gonorrhea, and P&S SyphilisRates by County, 2010
Chlamydia
Gonorrhea
P&S Syphilis
Note: Rates are per 100,000 population.Source: California Department of Public Health, STD Control Branch
California Local Health Jurisdiction STD Data Summaries, 2010 Provisional Data (July 2011)

1:100
California – Chlamydia, Gonorrhea, and P&S SyphilisRates by Age Group (2010), Race/Ethnicity (2010), and Year
0−9 10−14 15−19 20−24 25−29 30−34 35−44 45+
Age Group
0
500
1000
1500
2000
2500
3000
3500 Chlamydia
Nat. Am. A/PI Black Latino White
Race/Ethnicity*
0
500
1000
1500
Chlamydia
2001 2002 2003 2004 2005 2006 2007 2008 2009 2010
0
100
200
300
400
500
600
Year
Chlamydia
0−9 10−14 15−19 20−24 25−29 30−34 35−44 45+
Age Group
0
50
100
150
200
250
300 Gonorrhea
Nat. Am. A/PI Black Latino White
Race/Ethnicity*
0
100
200
300
400 Gonorrhea
2001 2002 2003 2004 2005 2006 2007 2008 2009 2010
0
20
40
60
80
100
120
Year
Gonorrhea
0−9 10−14 15−19 20−24 25−29 30−34 35−44 45+
Age Group
0
5
10
15
20
25
P&S Syphilis
Nat. Am. A/PI Black Latino White
Race/Ethnicity*
0
5
10
15
20
25
P&S Syphilis
2001 2002 2003 2004 2005 2006 2007 2008 2009 2010
0
2
4
6
8
10
12
Year
P&S Syphilis
Female Male Female Male
* Race data may be missing for a substantial number of cases. See the 'Data Limitations' page for further information.Note: Rates are per 100,000 population.
Source: California Department of Public Health, STD Control Branch
California Local Health Jurisdiction STD Data Summaries, 2010 Provisional Data (July 2011)

1 Gender specific age groups and race/ethnicity percent calculations exclude "Not Specified" from the denominator. 2 Overall state rates were calculated using the July 1 county population estimates from the Department of Finance. (For California, the July 1, 2010 estimate is 38,826,898). Note: Rates are per 100,000 population. Source: California Department of Public Health, STD Control Branch
California State – Chlamydia, Gonorrhea, and Early Syphilis Cases and Rates Tables for 2010
Gender & Age Group Chlamydia Gonorrhea P&S Syphilis Early Latent Syphilis Population
Cases Percent1 Rate Cases Percent1 Rate Cases Percent1 Rate Cases Percent1 Rate Number Percent1
STATE TOTAL 155,300 100.0% 400.0 26,840 100.0% 69.1 2,059 100.0% 5.3 1,805 100.0% 4.6 39,135,676 100.0%
Female Total 106,339 68.5% 542.3 10,757 40.1% 54.9 75 3.6% 0.4 126 7.0% 0.6 19,608,793 50.1% Ages 00 – 09 52 0.0% 1.9 12 0.1% 0.4 0 0.0% 0.0 0 0.0% 0.0 2,701,285 13.8% 10 – 14 908 0.9% 69.1 148 1.4% 11.3 1 1.3% 0.1 0 0.0% 0.0 1,313,498 6.7% 15 – 19 33,440 31.5% 2,247.0 3,349 31.2% 225.0 10 13.3% 0.7 21 16.7% 1.4 1,488,238 7.6% 20 – 24 41,406 39.1% 2,950.5 3,637 33.9% 259.2 12 16.0% 0.9 28 22.2% 2.0 1,403,352 7.2% 25 – 29 16,646 15.7% 1,296.8 1,732 16.1% 134.9 14 18.7% 1.1 21 16.7% 1.6 1,283,661 6.5% 30 – 34 6,961 6.6% 574.2 887 8.3% 73.2 4 5.3% 0.3 14 11.1% 1.2 1,212,291 6.2% 35 – 44 4,998 4.7% 184.8 691 6.4% 25.6 18 24.0% 0.7 22 17.5% 0.8 2,703,970 13.8% 45 + 1,618 1.5% 21.6 274 2.6% 3.7 16 21.3% 0.2 20 15.9% 0.3 7,502,498 38.3% Not Specified 310 0.3% - 27 0.3% - 0 0.0% - 0 0.0% -
Male Total 48,358 31.1% 247.6 15,961 59.5% 81.7 1,983 96.3% 10.2 1,676 92.9% 8.6 19,526,883 49.9% Ages 00 – 09 26 0.1% 0.9 4 0.0% 0.1 0 0.0% 0.0 1 0.1% 0.0 2,812,744 14.4% 10 – 14 174 0.4% 12.7 32 0.2% 2.3 2 0.1% 0.1 0 0.0% 0.0 1,371,611 7.0% 15 – 19 8,762 18.2% 559.4 1,894 11.9% 120.9 65 3.3% 4.2 39 2.3% 2.5 1,566,183 8.0% 20 – 24 16,432 34.1% 1,086.6 4,011 25.2% 265.2 270 13.6% 17.9 171 10.2% 11.3 1,512,182 7.7% 25 – 29 10,072 20.9% 726.5 3,237 20.3% 233.5 311 15.7% 22.4 222 13.3% 16.0 1,386,408 7.1% 30 – 34 5,045 10.5% 395.9 2,080 13.1% 163.2 297 15.0% 23.3 212 12.7% 16.6 1,274,379 6.5% 35 – 44 5,007 10.4% 179.7 2,813 17.7% 101.0 559 28.2% 20.1 570 34.0% 20.5 2,786,242 14.3% 45 + 2,683 5.6% 39.4 1,841 11.6% 27.0 477 24.1% 7.0 460 27.5% 6.7 6,817,134 34.9% Not Specified 157 0.3% - 49 0.3% - 2 0.1% - 1 0.1% -
Gender & Race/Ethnicity Chlamydia Gonorrhea P&S Syphilis Early Latent Syphilis Population
Cases Percent1 Rate Cases Percent1 Rate Cases Percent1 Rate Cases Percent1 Rate Number Percent1
STATE TOTAL 155,300 100.0% 400.0 26,840 100.0% 69.1 2,059 100.0% 5.3 1,805 100.0% 4.6 39,135,676 100.0%
Female Total 106,339 68.5% 542.3 10,757 40.1% 54.9 75 3.6% 0.4 126 7.0% 0.6 19,608,793 50.1%American Indian/Alaska Native 305 0.5% 249.2 27 0.4% 22.1 0 0.0% 0.0 0 0.0% 0.0 122,373 0.6%Asian/Pacific Islander 4,108 6.1% 163.5 274 3.8% 10.9 1 1.4% 0.0 5 4.0% 0.2 2,512,224 12.8%Black/African-American 15,902 23.7% 1,359.3 3,511 48.8% 300.1 32 45.7% 2.7 44 35.5% 3.8 1,169,844 6.0%Latina/Hispanic 33,189 49.5% 466.8 1,968 27.3% 27.7 14 20.0% 0.2 56 45.2% 0.8 7,110,156 36.3%White 13,591 20.3% 164.2 1,421 19.7% 17.2 23 32.9% 0.3 19 15.3% 0.2 8,278,622 42.2%Other/Multi/Not Specified 39,244 36.9% - 3,556 33.1% - 5 6.7% - 2 1.6% - 415,574 2.1%Male Total 48,358 31.1% 247.6 15,961 59.5% 81.7 1,983 96.3% 10.2 1,676 92.9% 8.6 19,526,883 49.9%American Indian/Alaska Native 112 0.4% 94.6 34 0.3% 28.7 7 0.4% 5.9 3 0.2% 2.5 118,348 0.6%Asian/Pacific Islander 1,570 5.0% 67.6 506 4.4% 21.8 92 4.8% 4.0 67 4.2% 2.9 2,321,659 11.9%Black/African-American 8,651 27.7% 774.2 3,877 33.7% 347.0 276 14.4% 24.7 230 14.3% 20.6 1,117,346 5.7%Latina/Hispanic 13,372 42.9% 180.6 3,422 29.7% 46.2 663 34.6% 9.0 695 43.4% 9.4 7,402,661 37.9%White 7,501 24.0% 91.9 3,680 31.9% 45.1 878 45.8% 10.8 608 37.9% 7.5 8,160,162 41.8%Other/Multi/Not Specified 17,152 35.5% - 4,442 27.8% - 67 3.4% - 73 4.4% - 406,707 2.1%
California Local Health Jurisdiction STD Data Summaries, 2010 Provisional Data (July 2011)

* Confidence intervals were calculated using Poisson exact method; not shown for counties with zero cases.Note: Rates are per 100,000 population.
Source: California Department of Public Health, STD Control Branch
California – Chlamydia, Gonorrhea, and P&S SyphilisRanking of County Rates for 2010
(with 95% Confidence Intervals*)
California Local Health Jurisdiction STD Data Summaries, 2010 Provisional Data (July 2011)

1:100
Alameda County – Chlamydia, Gonorrhea, and P&S SyphilisRates by Age Group (2010), Race/Ethnicity (2010), and Year
0−9 10−14 15−19 20−24 25−29 30−34 35−44 45+
Age Group
0
1000
2000
3000
4000
Chlamydia
Nat. Am. A/PI Black Latino White
Race/Ethnicity*
0
200
400
600
800
1000
1200
1400
Chlamydia
2001 2002 2003 2004 2005 2006 2007 2008 2009 2010
0
200
400
600
800
Year
Chlamydia
0−9 10−14 15−19 20−24 25−29 30−34 35−44 45+
Age Group
0
200
400
600
800
1000 Gonorrhea
Nat. Am. A/PI Black Latino White
Race/Ethnicity*
0
100
200
300
400
500 Gonorrhea
2001 2002 2003 2004 2005 2006 2007 2008 2009 2010
0
50
100
150
Year
Gonorrhea
0−9 10−14 15−19 20−24 25−29 30−34 35−44 45+
Age Group
0
10
20
30
40
P&S Syphilis
Nat. Am. A/PI Black Latino White
Race/Ethnicity*
0
10
20
30
40
50
P&S Syphilis
2001 2002 2003 2004 2005 2006 2007 2008 2009 2010
0
5
10
15
Year
P&S Syphilis
Female Male Female Male
* Race data may be missing for a substantial number of cases. See the 'Data Limitations' page for further information.Note: Rates are per 100,000 population. Alameda County includes Berkeley City Health Jurisdiction.
Source: California Department of Public Health, STD Control Branch
California Local Health Jurisdiction STD Data Summaries, 2010 Provisional Data (July 2011)

1 Gender specific age groups and race/ethnicity percent calculations exclude "Not Specified" from the denominator. 2 Overall county rates were calculated using the July 1 county population estimates from the Department of Finance. (For Alameda County, the July 1, 2010 estimate is 1,582,420). Note: Rates are per 100,000 population. Source: California Department of Public Health, STD Control Branch
Alameda County – Chlamydia, Gonorrhea, and Early Syphilis Cases and Rates Tables for 2010
Gender & Age Group Chlamydia Gonorrhea P&S Syphilis Early Latent Syphilis Population
Cases Percent1 Rate Cases Percent1 Rate Cases Percent1 Rate Cases Percent1 Rate Number Percent1
COUNTY TOTAL 7,027 100.0% 444.1 1,923 100.0% 121.5 111 100.0% 7.0 58 100.0% 3.7 1,550,133 100.0%
Female Total 4,779 68.0% 603.0 933 48.5% 117.7 8 7.2% 1.0 10 17.2% 1.3 792,483 51.1% Ages 00 – 09 3 0.1% 3.0 0 0.0% 0.0 0 0.0% 0.0 0 0.0% 0.0 100,767 12.7% 10 – 14 76 1.6% 164.3 27 2.9% 58.4 0 0.0% 0.0 0 0.0% 0.0 46,245 5.8% 15 – 19 1,782 37.3% 3,575.6 418 44.8% 838.7 4 50.0% 8.0 3 30.0% 6.0 49,838 6.3% 20 – 24 1,646 34.5% 3,360.0 241 25.9% 492.0 2 25.0% 4.1 3 30.0% 6.1 48,988 6.2% 25 – 29 646 13.5% 1,311.5 124 13.3% 251.7 1 12.5% 2.0 3 30.0% 6.1 49,256 6.2% 30 – 34 315 6.6% 555.0 69 7.4% 121.6 0 0.0% 0.0 0 0.0% 0.0 56,757 7.2% 35 – 44 223 4.7% 178.0 39 4.2% 31.1 0 0.0% 0.0 1 10.0% 0.8 125,289 15.8% 45 + 86 1.8% 27.3 14 1.5% 4.4 1 12.5% 0.3 0 0.0% 0.0 315,343 39.8% Not Specified 2 0.0% - 1 0.1% - 0 0.0% - 0 0.0% -
Male Total 2,246 32.0% 296.4 989 51.4% 130.5 103 92.8% 13.6 48 82.8% 6.3 757,650 48.9% Ages 00 – 09 1 0.0% 1.0 0 0.0% 0.0 0 0.0% 0.0 0 0.0% 0.0 104,566 13.8% 10 – 14 33 1.5% 68.5 7 0.7% 14.5 0 0.0% 0.0 0 0.0% 0.0 48,190 6.4% 15 – 19 590 26.3% 1,128.6 196 19.9% 374.9 4 3.9% 7.7 3 6.3% 5.7 52,279 6.9% 20 – 24 671 29.9% 1,325.7 249 25.2% 492.0 19 18.4% 37.5 3 6.3% 5.9 50,614 6.7% 25 – 29 393 17.5% 794.4 194 19.7% 392.2 8 7.8% 16.2 9 18.8% 18.2 49,470 6.5% 30 – 34 219 9.8% 409.6 127 12.9% 237.5 21 20.4% 39.3 5 10.4% 9.4 53,468 7.1% 35 – 44 216 9.6% 182.0 134 13.6% 112.9 23 22.3% 19.4 18 37.5% 15.2 118,703 15.7% 45 + 123 5.5% 43.9 80 8.1% 28.5 28 27.2% 10.0 10 20.8% 3.6 280,360 37.0% Not Specified 0 0.0% - 2 0.2% - 0 0.0% - 0 0.0% -
Gender & Race/Ethnicity Chlamydia Gonorrhea P&S Syphilis Early Latent Syphilis Population
Cases Percent1 Rate Cases Percent1 Rate Cases Percent1 Rate Cases Percent1 Rate Number Percent1
COUNTY TOTAL 7,027 100.0% 444.1 1,923 100.0% 121.5 111 100.0% 7.0 58 100.0% 3.7 1,550,133 100.0%
Female Total 4,779 68.0% 603.0 933 48.5% 117.7 8 7.2% 1.0 10 17.2% 1.3 792,483 51.1%American Indian/Alaska Native 9 0.4% 213.8 2 0.4% 47.5 0 0.0% 0.0 0 0.0% 0.0 4,210 0.5%Asian/Pacific Islander 225 9.9% 112.9 27 5.5% 13.5 1 12.5% 0.5 0 0.0% 0.0 199,265 25.1%Black/African-American 1,292 56.8% 1,251.6 378 77.6% 366.2 6 75.0% 5.8 8 80.0% 7.8 103,224 13.0%Latina/Hispanic 507 22.3% 282.9 34 7.0% 19.0 0 0.0% 0.0 1 10.0% 0.6 179,241 22.6%White 242 10.6% 86.0 46 9.4% 16.4 1 12.5% 0.4 1 10.0% 0.4 281,307 35.5%Other/Multi/Not Specified 2,504 52.4% - 446 47.8% - 0 0.0% - 0 0.0% - 25,236 3.2%Male Total 2,246 32.0% 296.4 989 51.4% 130.5 103 92.8% 13.6 48 82.8% 6.3 757,650 48.9%American Indian/Alaska Native 4 0.4% 107.4 0 0.0% 0.0 0 0.0% 0.0 0 0.0% 0.0 3,725 0.5%Asian/Pacific Islander 73 6.5% 38.6 32 5.9% 16.9 5 5.2% 2.6 2 4.5% 1.1 189,148 25.0%Black/African-American 721 64.0% 876.5 346 64.0% 420.6 37 38.1% 45.0 19 43.2% 23.1 82,260 10.9%Latina/Hispanic 182 16.1% 98.3 77 14.2% 41.6 20 20.6% 10.8 13 29.5% 7.0 185,229 24.4%White 147 13.0% 53.9 86 15.9% 31.5 35 36.1% 12.8 10 22.7% 3.7 272,848 36.0%Other/Multi/Not Specified 1,119 49.8% - 448 45.3% - 6 5.8% - 4 8.3% - 24,440 3.2%
California Local Health Jurisdiction STD Data Summaries, 2010 Provisional Data (July 2011)

1:100
Alpine County – Chlamydia, Gonorrhea, and P&S SyphilisRates by Age Group (2010), Race/Ethnicity (2010), and Year
0−9 10−14 15−19 20−24 25−29 30−34 35−44 45+
Age Group
0
1 Chlamydia
Nat. Am. A/PI Black Latino White
Race/Ethnicity*
0
1 Chlamydia
2001 2002 2003 2004 2005 2006 2007 2008 2009 2010
0
100
200
300
400
500
600
Year
Chlamydia
0−9 10−14 15−19 20−24 25−29 30−34 35−44 45+
Age Group
0
1 Gonorrhea
Nat. Am. A/PI Black Latino White
Race/Ethnicity*
0
1 Gonorrhea
2001 2002 2003 2004 2005 2006 2007 2008 2009 2010
Year
0
1 Gonorrhea
0−9 10−14 15−19 20−24 25−29 30−34 35−44 45+
Age Group
0
1 P&S Syphilis
Nat. Am. A/PI Black Latino White
Race/Ethnicity*
0
1 P&S Syphilis
2001 2002 2003 2004 2005 2006 2007 2008 2009 2010
Year
0
1 P&S Syphilis
Female Male Female Male
* Race data may be missing for a substantial number of cases. See the 'Data Limitations' page for further information.Note: Rates are per 100,000 population.
Source: California Department of Public Health, STD Control Branch
California Local Health Jurisdiction STD Data Summaries, 2010 Provisional Data (July 2011)
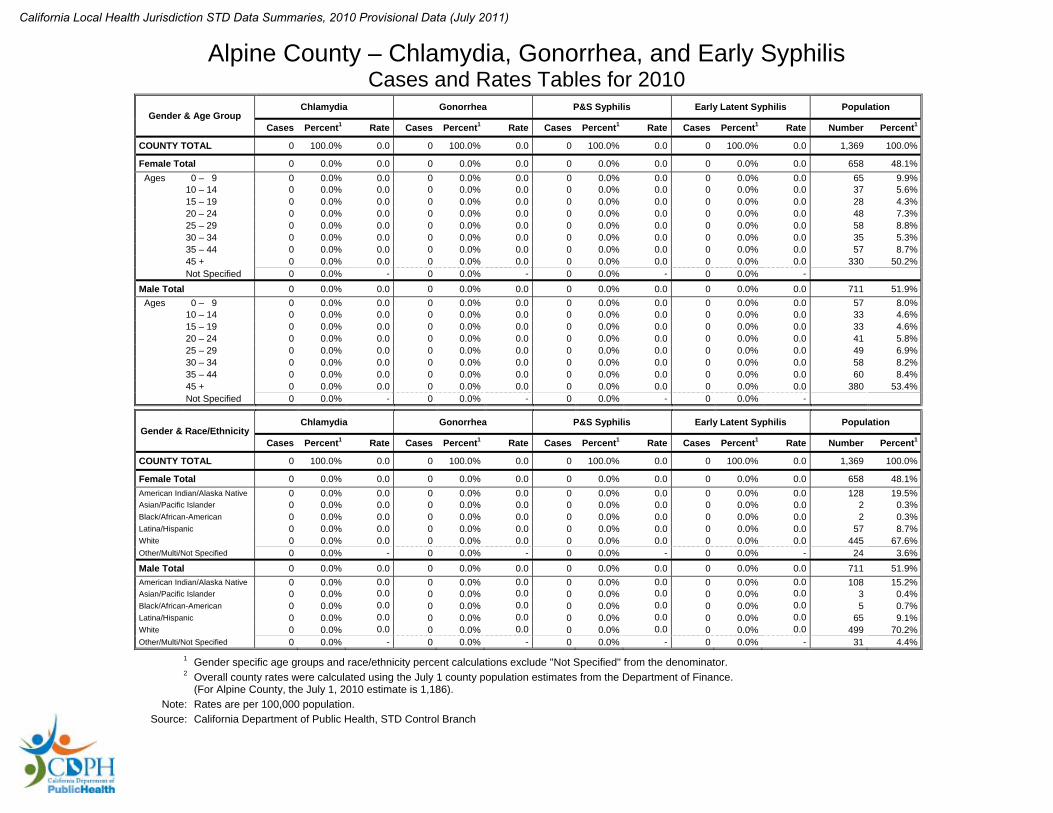
1 Gender specific age groups and race/ethnicity percent calculations exclude "Not Specified" from the denominator. 2 Overall county rates were calculated using the July 1 county population estimates from the Department of Finance. (For Alpine County, the July 1, 2010 estimate is 1,186). Note: Rates are per 100,000 population. Source: California Department of Public Health, STD Control Branch
Alpine County – Chlamydia, Gonorrhea, and Early Syphilis Cases and Rates Tables for 2010
Gender & Age Group Chlamydia Gonorrhea P&S Syphilis Early Latent Syphilis Population
Cases Percent1 Rate Cases Percent1 Rate Cases Percent1 Rate Cases Percent1 Rate Number Percent1
COUNTY TOTAL 0 100.0% 0.0 0 100.0% 0.0 0 100.0% 0.0 0 100.0% 0.0 1,369 100.0%
Female Total 0 0.0% 0.0 0 0.0% 0.0 0 0.0% 0.0 0 0.0% 0.0 658 48.1% Ages 00 – 09 0 0.0% 0.0 0 0.0% 0.0 0 0.0% 0.0 0 0.0% 0.0 65 9.9% 10 – 14 0 0.0% 0.0 0 0.0% 0.0 0 0.0% 0.0 0 0.0% 0.0 37 5.6% 15 – 19 0 0.0% 0.0 0 0.0% 0.0 0 0.0% 0.0 0 0.0% 0.0 28 4.3% 20 – 24 0 0.0% 0.0 0 0.0% 0.0 0 0.0% 0.0 0 0.0% 0.0 48 7.3% 25 – 29 0 0.0% 0.0 0 0.0% 0.0 0 0.0% 0.0 0 0.0% 0.0 58 8.8% 30 – 34 0 0.0% 0.0 0 0.0% 0.0 0 0.0% 0.0 0 0.0% 0.0 35 5.3% 35 – 44 0 0.0% 0.0 0 0.0% 0.0 0 0.0% 0.0 0 0.0% 0.0 57 8.7% 45 + 0 0.0% 0.0 0 0.0% 0.0 0 0.0% 0.0 0 0.0% 0.0 330 50.2% Not Specified 0 0.0% - 0 0.0% - 0 0.0% - 0 0.0% -
Male Total 0 0.0% 0.0 0 0.0% 0.0 0 0.0% 0.0 0 0.0% 0.0 711 51.9% Ages 00 – 09 0 0.0% 0.0 0 0.0% 0.0 0 0.0% 0.0 0 0.0% 0.0 57 8.0% 10 – 14 0 0.0% 0.0 0 0.0% 0.0 0 0.0% 0.0 0 0.0% 0.0 33 4.6% 15 – 19 0 0.0% 0.0 0 0.0% 0.0 0 0.0% 0.0 0 0.0% 0.0 33 4.6% 20 – 24 0 0.0% 0.0 0 0.0% 0.0 0 0.0% 0.0 0 0.0% 0.0 41 5.8% 25 – 29 0 0.0% 0.0 0 0.0% 0.0 0 0.0% 0.0 0 0.0% 0.0 49 6.9% 30 – 34 0 0.0% 0.0 0 0.0% 0.0 0 0.0% 0.0 0 0.0% 0.0 58 8.2% 35 – 44 0 0.0% 0.0 0 0.0% 0.0 0 0.0% 0.0 0 0.0% 0.0 60 8.4% 45 + 0 0.0% 0.0 0 0.0% 0.0 0 0.0% 0.0 0 0.0% 0.0 380 53.4% Not Specified 0 0.0% - 0 0.0% - 0 0.0% - 0 0.0% -
Gender & Race/Ethnicity Chlamydia Gonorrhea P&S Syphilis Early Latent Syphilis Population
Cases Percent1 Rate Cases Percent1 Rate Cases Percent1 Rate Cases Percent1 Rate Number Percent1
COUNTY TOTAL 0 100.0% 0.0 0 100.0% 0.0 0 100.0% 0.0 0 100.0% 0.0 1,369 100.0%
Female Total 0 0.0% 0.0 0 0.0% 0.0 0 0.0% 0.0 0 0.0% 0.0 658 48.1%American Indian/Alaska Native 0 0.0% 0.0 0 0.0% 0.0 0 0.0% 0.0 0 0.0% 0.0 128 19.5%Asian/Pacific Islander 0 0.0% 0.0 0 0.0% 0.0 0 0.0% 0.0 0 0.0% 0.0 2 0.3%Black/African-American 0 0.0% 0.0 0 0.0% 0.0 0 0.0% 0.0 0 0.0% 0.0 2 0.3%Latina/Hispanic 0 0.0% 0.0 0 0.0% 0.0 0 0.0% 0.0 0 0.0% 0.0 57 8.7%White 0 0.0% 0.0 0 0.0% 0.0 0 0.0% 0.0 0 0.0% 0.0 445 67.6%Other/Multi/Not Specified 0 0.0% - 0 0.0% - 0 0.0% - 0 0.0% - 24 3.6%Male Total 0 0.0% 0.0 0 0.0% 0.0 0 0.0% 0.0 0 0.0% 0.0 711 51.9%American Indian/Alaska Native 0 0.0% 0.0 0 0.0% 0.0 0 0.0% 0.0 0 0.0% 0.0 108 15.2%Asian/Pacific Islander 0 0.0% 0.0 0 0.0% 0.0 0 0.0% 0.0 0 0.0% 0.0 3 0.4%Black/African-American 0 0.0% 0.0 0 0.0% 0.0 0 0.0% 0.0 0 0.0% 0.0 5 0.7%Latina/Hispanic 0 0.0% 0.0 0 0.0% 0.0 0 0.0% 0.0 0 0.0% 0.0 65 9.1%White 0 0.0% 0.0 0 0.0% 0.0 0 0.0% 0.0 0 0.0% 0.0 499 70.2%Other/Multi/Not Specified 0 0.0% - 0 0.0% - 0 0.0% - 0 0.0% - 31 4.4%
California Local Health Jurisdiction STD Data Summaries, 2010 Provisional Data (July 2011)
1:100
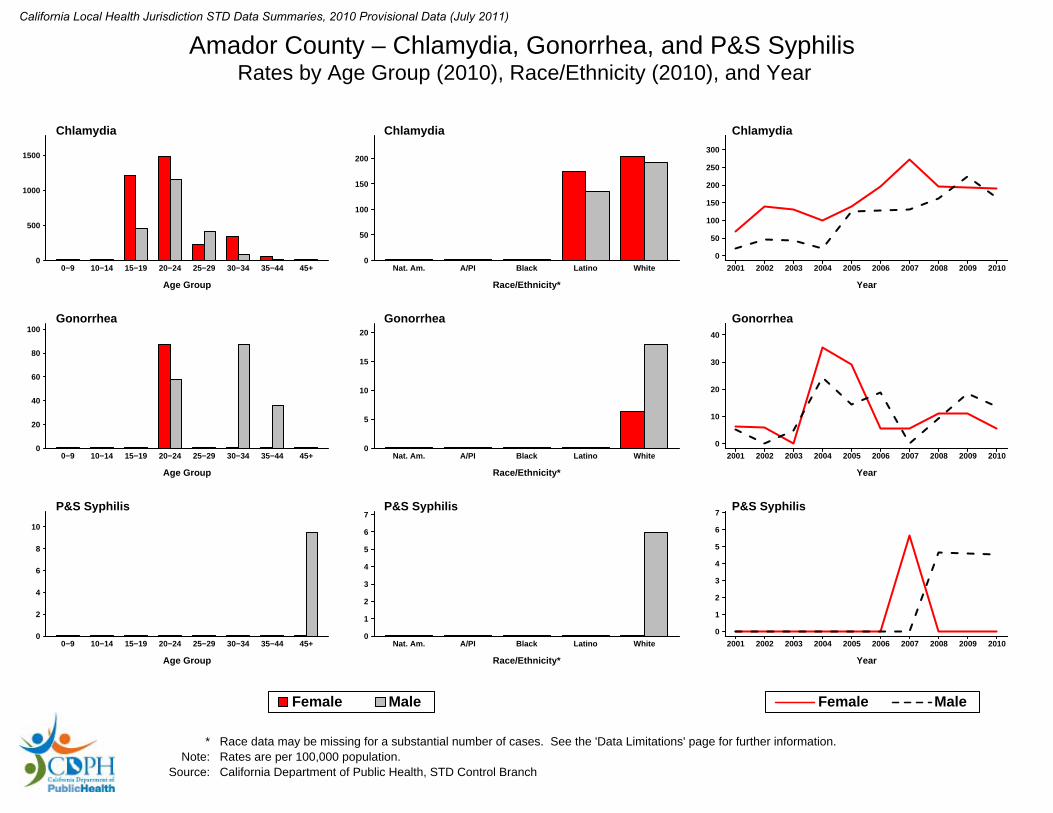
Amador County – Chlamydia, Gonorrhea, and P&S SyphilisRates by Age Group (2010), Race/Ethnicity (2010), and Year
0−9 10−14 15−19 20−24 25−29 30−34 35−44 45+
Age Group
0
500
1000
1500
Chlamydia
Nat. Am. A/PI Black Latino White
Race/Ethnicity*
0
50
100
150
200
Chlamydia
2001 2002 2003 2004 2005 2006 2007 2008 2009 2010
0
50
100
150
200
250
300
Year
Chlamydia
0−9 10−14 15−19 20−24 25−29 30−34 35−44 45+
Age Group
0
20
40
60
80
100 Gonorrhea
Nat. Am. A/PI Black Latino White
Race/Ethnicity*
0
5
10
15
20
Gonorrhea
2001 2002 2003 2004 2005 2006 2007 2008 2009 2010
0
10
20
30
40
Year
Gonorrhea
0−9 10−14 15−19 20−24 25−29 30−34 35−44 45+
Age Group
0
2
4
6
8
10
P&S Syphilis
Nat. Am. A/PI Black Latino White
Race/Ethnicity*
0
1
2
3
4
5
6
7 P&S Syphilis
2001 2002 2003 2004 2005 2006 2007 2008 2009 2010
0
1
2
3
4
5
6
7
Year
P&S Syphilis
Female Male Female Male
* Race data may be missing for a substantial number of cases. See the 'Data Limitations' page for further information.Note: Rates are per 100,000 population.
Source: California Department of Public Health, STD Control Branch
California Local Health Jurisdiction STD Data Summaries, 2010 Provisional Data (July 2011)

1 Gender specific age groups and race/ethnicity percent calculations exclude "Not Specified" from the denominator. 2 Overall county rates were calculated using the July 1 county population estimates from the Department of Finance. (For Amador County, the July 1, 2010 estimate is 38,118). Note: Rates are per 100,000 population. Source: California Department of Public Health, STD Control Branch
Amador County – Chlamydia, Gonorrhea, and Early Syphilis Cases and Rates Tables for 2010
Gender & Age Group Chlamydia Gonorrhea P&S Syphilis Early Latent Syphilis Population
Cases Percent1 Rate Cases Percent1 Rate Cases Percent1 Rate Cases Percent1 Rate Number Percent1
COUNTY TOTAL 71 100.0% 186.3 4 100.0% 10.5 1 100.0% 2.6 0 100.0% 0.0 40,337 100.0%
Female Total 35 49.3% 191.1 1 25.0% 5.5 0 0.0% 0.0 0 0.0% 0.0 18,319 45.4% Ages 00 – 09 0 0.0% 0.0 0 0.0% 0.0 0 0.0% 0.0 0 0.0% 0.0 1,542 8.4% 10 – 14 0 0.0% 0.0 0 0.0% 0.0 0 0.0% 0.0 0 0.0% 0.0 855 4.7% 15 – 19 13 37.1% 1,218.4 0 0.0% 0.0 0 0.0% 0.0 0 0.0% 0.0 1,067 5.8% 20 – 24 17 48.6% 1,482.1 1 100.0% 87.2 0 0.0% 0.0 0 0.0% 0.0 1,147 6.3% 25 – 29 2 5.7% 231.2 0 0.0% 0.0 0 0.0% 0.0 0 0.0% 0.0 865 4.7% 30 – 34 2 5.7% 345.4 0 0.0% 0.0 0 0.0% 0.0 0 0.0% 0.0 579 3.2% 35 – 44 1 2.9% 55.8 0 0.0% 0.0 0 0.0% 0.0 0 0.0% 0.0 1,793 9.8% 45 + 0 0.0% 0.0 0 0.0% 0.0 0 0.0% 0.0 0 0.0% 0.0 10,471 57.2% Not Specified 0 0.0% - 0 0.0% - 0 0.0% - 0 0.0% -
Male Total 36 50.7% 163.5 3 75.0% 13.6 1 100.0% 4.5 0 0.0% 0.0 22,018 54.6% Ages 00 – 09 0 0.0% 0.0 0 0.0% 0.0 0 0.0% 0.0 0 0.0% 0.0 1,540 7.0% 10 – 14 0 0.0% 0.0 0 0.0% 0.0 0 0.0% 0.0 0 0.0% 0.0 876 4.0% 15 – 19 9 25.0% 457.5 0 0.0% 0.0 0 0.0% 0.0 0 0.0% 0.0 1,967 8.9% 20 – 24 20 55.6% 1,153.4 1 33.3% 57.7 0 0.0% 0.0 0 0.0% 0.0 1,734 7.9% 25 – 29 6 16.7% 418.7 0 0.0% 0.0 0 0.0% 0.0 0 0.0% 0.0 1,433 6.5% 30 – 34 1 2.8% 87.3 1 33.3% 87.3 0 0.0% 0.0 0 0.0% 0.0 1,146 5.2% 35 – 44 0 0.0% 0.0 1 33.3% 35.7 0 0.0% 0.0 0 0.0% 0.0 2,800 12.7% 45 + 0 0.0% 0.0 0 0.0% 0.0 1 100.0% 9.5 0 0.0% 0.0 10,522 47.8% Not Specified 0 0.0% - 0 0.0% - 0 0.0% - 0 0.0% -
Gender & Race/Ethnicity Chlamydia Gonorrhea P&S Syphilis Early Latent Syphilis Population
Cases Percent1 Rate Cases Percent1 Rate Cases Percent1 Rate Cases Percent1 Rate Number Percent1
COUNTY TOTAL 71 100.0% 186.3 4 100.0% 10.5 1 100.0% 2.6 0 100.0% 0.0 40,337 100.0%
Female Total 35 49.3% 191.1 1 25.0% 5.5 0 0.0% 0.0 0 0.0% 0.0 18,319 45.4%American Indian/Alaska Native 0 0.0% 0.0 0 0.0% 0.0 0 0.0% 0.0 0 0.0% 0.0 267 1.5%Asian/Pacific Islander 0 0.0% 0.0 0 0.0% 0.0 0 0.0% 0.0 0 0.0% 0.0 179 1.0%Black/African-American 0 0.0% 0.0 0 0.0% 0.0 0 0.0% 0.0 0 0.0% 0.0 55 0.3%Latina/Hispanic 3 8.6% 174.0 0 0.0% 0.0 0 0.0% 0.0 0 0.0% 0.0 1,724 9.4%White 32 91.4% 203.8 1 100.0% 6.4 0 0.0% 0.0 0 0.0% 0.0 15,699 85.7%Other/Multi/Not Specified 0 0.0% - 0 0.0% - 0 0.0% - 0 0.0% - 395 2.2%Male Total 36 50.7% 163.5 3 75.0% 13.6 1 100.0% 4.5 0 0.0% 0.0 22,018 54.6%American Indian/Alaska Native 0 0.0% 0.0 0 0.0% 0.0 0 0.0% 0.0 0 0.0% 0.0 352 1.6%Asian/Pacific Islander 0 0.0% 0.0 0 0.0% 0.0 0 0.0% 0.0 0 0.0% 0.0 226 1.0%Black/African-American 0 0.0% 0.0 0 0.0% 0.0 0 0.0% 0.0 0 0.0% 0.0 1,412 6.4%Latina/Hispanic 4 11.1% 135.5 0 0.0% 0.0 0 0.0% 0.0 0 0.0% 0.0 2,952 13.4%White 32 88.9% 191.5 3 100.0% 18.0 1 100.0% 6.0 0 0.0% 0.0 16,711 75.9%Other/Multi/Not Specified 0 0.0% - 0 0.0% - 0 0.0% - 0 0.0% - 365 1.7%
California Local Health Jurisdiction STD Data Summaries, 2010 Provisional Data (July 2011)

1:100
Berkeley City – Chlamydia, Gonorrhea, and P&S SyphilisRates by Age Group (2010), Race/Ethnicity (2010), and Year
0−9 10−14 15−19 20−24 25−29 30−34 35−44 45+
Age Group
0
500
1000
1500
2000
2500
Chlamydia
Nat. Am. A/PI Black Latino White
Race/Ethnicity*
0
200
400
600
800
1000
1200
1400 Chlamydia
2001 2002 2003 2004 2005 2006 2007 2008 2009 2010
0
100
200
300
400
500
600
Year
Chlamydia
0−9 10−14 15−19 20−24 25−29 30−34 35−44 45+
Age Group
0
200
400
600
800
Gonorrhea
Nat. Am. A/PI Black Latino White
Race/Ethnicity*
0
100
200
300
400
500
600
700 Gonorrhea
2001 2002 2003 2004 2005 2006 2007 2008 2009 2010
0
50
100
150
200
Year
Gonorrhea
0−9 10−14 15−19 20−24 25−29 30−34 35−44 45+
Age Group
0
10
20
30
40
50
60
70
P&S Syphilis
Nat. Am. A/PI Black Latino White
Race/Ethnicity*
0
20
40
60
P&S Syphilis
2001 2002 2003 2004 2005 2006 2007 2008 2009 2010
0
5
10
15
20
25
30
Year
P&S Syphilis
Female Male Female Male
* Race data may be missing for a substantial number of cases. See the 'Data Limitations' page for further information.Note: Rates are per 100,000 population.
Source: California Department of Public Health, STD Control Branch
California Local Health Jurisdiction STD Data Summaries, 2010 Provisional Data (July 2011)

1 Gender specific age groups and race/ethnicity percent calculations exclude "Not Specified" from the denominator. 2 Total city population was calculated by multiplying the July 1 county population estimate by the January 1 (E-1) city to county ratio from the Department of Finance.
Census 2000 gender/age/race distribution percentages were then applied to this total. Note: Rates are per 100,000 population. Source: California Department of Public Health, STD Control Branch
Berkeley City – Chlamydia, Gonorrhea, and Early Syphilis Cases and Rates Tables for 2010
Gender & Age Group Chlamydia Gonorrhea P&S Syphilis Early Latent Syphilis Population
Cases Percent1 Rate Cases Percent1 Rate Cases Percent1 Rate Cases Percent1 Rate Number Percent1
CITY TOTAL 411 100.0% 348.1 172 100.0% 145.7 14 100.0% 11.9 2 100.0% 1.7 118,082 100.0%
Female Total 257 62.5% 427.7 70 40.7% 116.5 0 0.0% 0.0 0 0.0% 0.0 60,093 50.9% Ages 00 – 09 0 0.0% 0.0 0 0.0% 0.0 0 0.0% 0.0 0 0.0% 0.0 4,548 7.6% 10 – 14 3 1.2% 132.4 2 2.9% 88.3 0 0.0% 0.0 0 0.0% 0.0 2,266 3.8% 15 – 19 109 42.6% 2,318.2 36 51.4% 765.6 0 0.0% 0.0 0 0.0% 0.0 4,702 7.8% 20 – 24 94 36.7% 1,030.6 18 25.7% 197.3 0 0.0% 0.0 0 0.0% 0.0 9,121 15.2% 25 – 29 25 9.8% 453.1 5 7.1% 90.6 0 0.0% 0.0 0 0.0% 0.0 5,517 9.2% 30 – 34 16 6.3% 351.9 7 10.0% 153.9 0 0.0% 0.0 0 0.0% 0.0 4,547 7.6% 35 – 44 5 2.0% 59.4 0 0.0% 0.0 0 0.0% 0.0 0 0.0% 0.0 8,416 14.0% 45 + 4 1.6% 19.1 2 2.9% 9.5 0 0.0% 0.0 0 0.0% 0.0 20,977 34.9% Not Specified 1 0.4% - 0 0.0% - 0 0.0% - 0 0.0% -
Male Total 153 37.2% 263.8 101 58.7% 174.2 14 100.0% 24.1 2 100.0% 3.4 57,989 49.1% Ages 00 – 09 0 0.0% 0.0 0 0.0% 0.0 0 0.0% 0.0 0 0.0% 0.0 4,809 8.3% 10 – 14 2 1.3% 86.9 0 0.0% 0.0 0 0.0% 0.0 0 0.0% 0.0 2,301 4.0% 15 – 19 27 17.6% 604.4 9 9.1% 201.5 0 0.0% 0.0 0 0.0% 0.0 4,467 7.7% 20 – 24 51 33.3% 513.4 25 25.3% 251.7 2 14.3% 20.1 0 0.0% 0.0 9,933 17.1% 25 – 29 32 20.9% 522.7 25 25.3% 408.4 3 21.4% 49.0 0 0.0% 0.0 6,122 10.6% 30 – 34 20 13.1% 406.8 13 13.1% 264.4 3 21.4% 61.0 0 0.0% 0.0 4,916 8.5% 35 – 44 14 9.2% 174.3 17 17.2% 211.7 5 35.7% 62.3 1 50.0% 12.5 8,030 13.8% 45 + 7 4.6% 40.2 10 10.1% 57.4 1 7.1% 5.7 1 50.0% 5.7 17,411 30.0% Not Specified 0 0.0% - 2 2.0% - 0 0.0% - 0 0.0% -
Gender & Race/Ethnicity Chlamydia Gonorrhea P&S Syphilis Early Latent Syphilis Population
Cases Percent1 Rate Cases Percent1 Rate Cases Percent1 Rate Cases Percent1 Rate Number Percent1
CITY TOTAL 411 100.0% 348.1 172 100.0% 145.7 14 100.0% 11.9 2 100.0% 1.7 118,082 100.0%
Female Total 257 62.5% 427.7 70 40.7% 116.5 0 0.0% 0.0 0 0.0% 0.0 60,093 50.9%American Indian/Alaska Native 1 0.7% 588.2 1 2.1% 588.2 0 0.0% 0.0 0 0.0% 0.0 170 0.3%Asian/Pacific Islander 4 2.7% 39.4 0 0.0% 0.0 0 0.0% 0.0 0 0.0% 0.0 10,163 16.9%Black/African-American 108 73.5% 1,240.4 38 79.2% 436.4 0 0.0% 0.0 0 0.0% 0.0 8,707 14.5%Latina/Hispanic 20 13.6% 365.6 3 6.3% 54.8 0 0.0% 0.0 0 0.0% 0.0 5,471 9.1%White 14 9.5% 43.0 6 12.5% 18.4 0 0.0% 0.0 0 0.0% 0.0 32,554 54.2%Other/Multi/Not Specified 110 42.8% - 22 31.4% - 0 0.0% - 0 0.0% - 3,028 5.0%Male Total 153 37.2% 263.8 101 58.7% 174.2 14 100.0% 24.1 2 100.0% 3.4 57,989 49.1%American Indian/Alaska Native 0 0.0% 0.0 0 0.0% 0.0 0 0.0% 0.0 0 0.0% 0.0 167 0.3%Asian/Pacific Islander 7 8.9% 76.0 5 9.3% 54.3 0 0.0% 0.0 0 0.0% 0.0 9,215 15.9%Black/African-American 38 48.1% 539.3 17 31.5% 241.3 4 30.8% 56.8 0 0.0% 0.0 7,046 12.2%Latina/Hispanic 17 21.5% 282.3 9 16.7% 149.4 4 30.8% 66.4 0 0.0% 0.0 6,023 10.4%White 17 21.5% 52.1 23 42.6% 70.5 5 38.5% 15.3 1 100.0% 3.1 32,601 56.2%Other/Multi/Not Specified 74 48.4% - 47 46.5% - 1 7.1% - 1 50.0% - 2,936 5.1%
California Local Health Jurisdiction STD Data Summaries, 2010 Provisional Data (July 2011)

1:100
Butte County – Chlamydia, Gonorrhea, and P&S SyphilisRates by Age Group (2010), Race/Ethnicity (2010), and Year
0−9 10−14 15−19 20−24 25−29 30−34 35−44 45+
Age Group
0
500
1000
1500
2000
2500
Chlamydia
Nat. Am. A/PI Black Latino White
Race/Ethnicity*
0
500
1000
1500
2000
2500 Chlamydia
2001 2002 2003 2004 2005 2006 2007 2008 2009 2010
0
100
200
300
400
500
600
Year
Chlamydia
0−9 10−14 15−19 20−24 25−29 30−34 35−44 45+
Age Group
0
50
100
150
Gonorrhea
Nat. Am. A/PI Black Latino White
Race/Ethnicity*
0
50
100
150
200
250
300
350 Gonorrhea
2001 2002 2003 2004 2005 2006 2007 2008 2009 2010
0
20
40
60
80
Year
Gonorrhea
0−9 10−14 15−19 20−24 25−29 30−34 35−44 45+
Age Group
0
1 P&S Syphilis
Nat. Am. A/PI Black Latino White
Race/Ethnicity*
0
1 P&S Syphilis
2001 2002 2003 2004 2005 2006 2007 2008 2009 2010
0.0
0.2
0.4
0.6
0.8
1.0
1.2
Year
P&S Syphilis
Female Male Female Male
* Race data may be missing for a substantial number of cases. See the 'Data Limitations' page for further information.Note: Rates are per 100,000 population.
Source: California Department of Public Health, STD Control Branch
California Local Health Jurisdiction STD Data Summaries, 2010 Provisional Data (July 2011)

1 Gender specific age groups and race/ethnicity percent calculations exclude "Not Specified" from the denominator. 2 Overall county rates were calculated using the July 1 county population estimates from the Department of Finance. (For Butte County, the July 1, 2010 estimate is 222,829). Note: Rates are per 100,000 population. Source: California Department of Public Health, STD Control Branch
Butte County – Chlamydia, Gonorrhea, and Early Syphilis Cases and Rates Tables for 2010
Gender & Age Group Chlamydia Gonorrhea P&S Syphilis Early Latent Syphilis Population
Cases Percent1 Rate Cases Percent1 Rate Cases Percent1 Rate Cases Percent1 Rate Number Percent1
COUNTY TOTAL 802 100.0% 359.9 61 100.0% 27.4 0 100.0% 0.0 1 100.0% 0.4 230,116 100.0%
Female Total 547 68.2% 468.6 31 50.8% 26.6 0 0.0% 0.0 0 0.0% 0.0 116,741 50.7% Ages 00 – 09 0 0.0% 0.0 0 0.0% 0.0 0 0.0% 0.0 0 0.0% 0.0 12,346 10.6% 10 – 14 5 0.9% 74.1 0 0.0% 0.0 0 0.0% 0.0 0 0.0% 0.0 6,751 5.8% 15 – 19 188 34.4% 2,076.7 14 45.2% 154.6 0 0.0% 0.0 0 0.0% 0.0 9,053 7.8% 20 – 24 267 48.9% 2,364.7 8 25.8% 70.9 0 0.0% 0.0 0 0.0% 0.0 11,291 9.7% 25 – 29 56 10.3% 729.2 4 12.9% 52.1 0 0.0% 0.0 0 0.0% 0.0 7,680 6.6% 30 – 34 18 3.3% 262.0 4 12.9% 58.2 0 0.0% 0.0 0 0.0% 0.0 6,871 5.9% 35 – 44 7 1.3% 53.0 1 3.2% 7.6 0 0.0% 0.0 0 0.0% 0.0 13,205 11.3% 45 + 5 0.9% 10.1 0 0.0% 0.0 0 0.0% 0.0 0 0.0% 0.0 49,544 42.4% Not Specified 1 0.2% - 0 0.0% - 0 0.0% - 0 0.0% -
Male Total 251 31.3% 221.4 30 49.2% 26.5 0 0.0% 0.0 1 100.0% 0.9 113,375 49.3% Ages 00 – 09 0 0.0% 0.0 0 0.0% 0.0 0 0.0% 0.0 0 0.0% 0.0 12,807 11.3% 10 – 14 0 0.0% 0.0 0 0.0% 0.0 0 0.0% 0.0 0 0.0% 0.0 7,174 6.3% 15 – 19 38 15.3% 402.6 5 16.7% 53.0 0 0.0% 0.0 0 0.0% 0.0 9,438 8.3% 20 – 24 135 54.2% 1,123.9 9 30.0% 74.9 0 0.0% 0.0 0 0.0% 0.0 12,012 10.6% 25 – 29 41 16.5% 515.4 8 26.7% 100.6 0 0.0% 0.0 0 0.0% 0.0 7,955 7.0% 30 – 34 16 6.4% 228.9 4 13.3% 57.2 0 0.0% 0.0 0 0.0% 0.0 6,989 6.2% 35 – 44 14 5.6% 102.1 4 13.3% 29.2 0 0.0% 0.0 1 100.0% 7.3 13,713 12.1% 45 + 5 2.0% 11.6 0 0.0% 0.0 0 0.0% 0.0 0 0.0% 0.0 43,287 38.2% Not Specified 2 0.8% - 0 0.0% - 0 0.0% - 0 0.0% -
Gender & Race/Ethnicity Chlamydia Gonorrhea P&S Syphilis Early Latent Syphilis Population
Cases Percent1 Rate Cases Percent1 Rate Cases Percent1 Rate Cases Percent1 Rate Number Percent1
COUNTY TOTAL 802 100.0% 359.9 61 100.0% 27.4 0 100.0% 0.0 1 100.0% 0.4 230,116 100.0%
Female Total 547 68.2% 468.6 31 50.8% 26.6 0 0.0% 0.0 0 0.0% 0.0 116,741 50.7%American Indian/Alaska Native 5 1.1% 234.3 0 0.0% 0.0 0 0.0% 0.0 0 0.0% 0.0 2,134 1.8%Asian/Pacific Islander 24 5.2% 657.4 1 4.5% 27.4 0 0.0% 0.0 0 0.0% 0.0 3,651 3.1%Black/African-American 22 4.7% 1,600.0 1 4.5% 72.7 0 0.0% 0.0 0 0.0% 0.0 1,375 1.2%Latina/Hispanic 90 19.4% 568.3 0 0.0% 0.0 0 0.0% 0.0 0 0.0% 0.0 15,838 13.6%White 324 69.7% 356.0 20 90.9% 22.0 0 0.0% 0.0 0 0.0% 0.0 91,005 78.0%Other/Multi/Not Specified 82 15.0% - 9 29.0% - 0 0.0% - 0 0.0% - 2,738 2.3%Male Total 251 31.3% 221.4 30 49.2% 26.5 0 0.0% 0.0 1 100.0% 0.9 113,375 49.3%American Indian/Alaska Native 4 1.9% 180.9 2 7.4% 90.5 0 0.0% 0.0 0 0.0% 0.0 2,211 2.0%Asian/Pacific Islander 0 0.0% 0.0 0 0.0% 0.0 0 0.0% 0.0 0 0.0% 0.0 3,715 3.3%Black/African-American 37 17.8% 2,199.8 5 18.5% 297.3 0 0.0% 0.0 0 0.0% 0.0 1,682 1.5%Latina/Hispanic 27 13.0% 173.0 2 7.4% 12.8 0 0.0% 0.0 0 0.0% 0.0 15,610 13.8%White 140 67.3% 160.1 18 66.7% 20.6 0 0.0% 0.0 1 100.0% 1.1 87,447 77.1%Other/Multi/Not Specified 43 17.1% - 3 10.0% - 0 0.0% - 0 0.0% - 2,710 2.4%
California Local Health Jurisdiction STD Data Summaries, 2010 Provisional Data (July 2011)

1:100
Calaveras County – Chlamydia, Gonorrhea, and P&S SyphilisRates by Age Group (2010), Race/Ethnicity (2010), and Year
0−9 10−14 15−19 20−24 25−29 30−34 35−44 45+
Age Group
0
500
1000
1500
Chlamydia
Nat. Am. A/PI Black Latino White
Race/Ethnicity*
0
500
1000
1500
Chlamydia
2001 2002 2003 2004 2005 2006 2007 2008 2009 2010
0
50
100
150
200
Year
Chlamydia
0−9 10−14 15−19 20−24 25−29 30−34 35−44 45+
Age Group
0
50
100
150
200
Gonorrhea
Nat. Am. A/PI Black Latino White
Race/Ethnicity*
0
2
4
6
8
10
12 Gonorrhea
2001 2002 2003 2004 2005 2006 2007 2008 2009 2010
0
10
20
30
40
Year
Gonorrhea
0−9 10−14 15−19 20−24 25−29 30−34 35−44 45+
Age Group
0
1 P&S Syphilis
Nat. Am. A/PI Black Latino White
Race/Ethnicity*
0
1 P&S Syphilis
2001 2002 2003 2004 2005 2006 2007 2008 2009 2010
0
1
2
3
4
5
Year
P&S Syphilis
Female Male Female Male
* Race data may be missing for a substantial number of cases. See the 'Data Limitations' page for further information.Note: Rates are per 100,000 population.
Source: California Department of Public Health, STD Control Branch
California Local Health Jurisdiction STD Data Summaries, 2010 Provisional Data (July 2011)

1 Gender specific age groups and race/ethnicity percent calculations exclude "Not Specified" from the denominator. 2 Overall county rates were calculated using the July 1 county population estimates from the Department of Finance. (For Calaveras County, the July 1, 2010 estimate is 46,117). Note: Rates are per 100,000 population. Source: California Department of Public Health, STD Control Branch
Calaveras County – Chlamydia, Gonorrhea, and Early Syphilis Cases and Rates Tables for 2010
Gender & Age Group Chlamydia Gonorrhea P&S Syphilis Early Latent Syphilis Population
Cases Percent1 Rate Cases Percent1 Rate Cases Percent1 Rate Cases Percent1 Rate Number Percent1
COUNTY TOTAL 48 100.0% 104.1 6 100.0% 13.0 0 100.0% 0.0 0 100.0% 0.0 47,750 100.0%
Female Total 40 83.3% 165.5 4 66.7% 16.5 0 0.0% 0.0 0 0.0% 0.0 24,175 50.6% Ages 00 – 09 0 0.0% 0.0 0 0.0% 0.0 0 0.0% 0.0 0 0.0% 0.0 1,913 7.9% 10 – 14 0 0.0% 0.0 0 0.0% 0.0 0 0.0% 0.0 0 0.0% 0.0 1,080 4.5% 15 – 19 23 57.5% 1,485.8 3 75.0% 193.8 0 0.0% 0.0 0 0.0% 0.0 1,548 6.4% 20 – 24 9 22.5% 553.2 0 0.0% 0.0 0 0.0% 0.0 0 0.0% 0.0 1,627 6.7% 25 – 29 3 7.5% 272.0 0 0.0% 0.0 0 0.0% 0.0 0 0.0% 0.0 1,103 4.6% 30 – 34 4 10.0% 543.5 1 25.0% 135.9 0 0.0% 0.0 0 0.0% 0.0 736 3.0% 35 – 44 1 2.5% 42.6 0 0.0% 0.0 0 0.0% 0.0 0 0.0% 0.0 2,347 9.7% 45 + 0 0.0% 0.0 0 0.0% 0.0 0 0.0% 0.0 0 0.0% 0.0 13,821 57.2% Not Specified 0 0.0% - 0 0.0% - 0 0.0% - 0 0.0% -
Male Total 8 16.7% 33.9 2 33.3% 8.5 0 0.0% 0.0 0 0.0% 0.0 23,575 49.4% Ages 00 – 09 0 0.0% 0.0 0 0.0% 0.0 0 0.0% 0.0 0 0.0% 0.0 1,982 8.4% 10 – 14 0 0.0% 0.0 0 0.0% 0.0 0 0.0% 0.0 0 0.0% 0.0 1,178 5.0% 15 – 19 3 37.5% 182.1 0 0.0% 0.0 0 0.0% 0.0 0 0.0% 0.0 1,647 7.0% 20 – 24 3 37.5% 167.4 0 0.0% 0.0 0 0.0% 0.0 0 0.0% 0.0 1,792 7.6% 25 – 29 1 12.5% 71.8 1 50.0% 71.8 0 0.0% 0.0 0 0.0% 0.0 1,392 5.9% 30 – 34 1 12.5% 149.9 1 50.0% 149.9 0 0.0% 0.0 0 0.0% 0.0 667 2.8% 35 – 44 0 0.0% 0.0 0 0.0% 0.0 0 0.0% 0.0 0 0.0% 0.0 2,140 9.1% 45 + 0 0.0% 0.0 0 0.0% 0.0 0 0.0% 0.0 0 0.0% 0.0 12,777 54.2% Not Specified 0 0.0% - 0 0.0% - 0 0.0% - 0 0.0% -
Gender & Race/Ethnicity Chlamydia Gonorrhea P&S Syphilis Early Latent Syphilis Population
Cases Percent1 Rate Cases Percent1 Rate Cases Percent1 Rate Cases Percent1 Rate Number Percent1
COUNTY TOTAL 48 100.0% 104.1 6 100.0% 13.0 0 100.0% 0.0 0 100.0% 0.0 47,750 100.0%
Female Total 40 83.3% 165.5 4 66.7% 16.5 0 0.0% 0.0 0 0.0% 0.0 24,175 50.6%American Indian/Alaska Native 0 0.0% 0.0 0 0.0% 0.0 0 0.0% 0.0 0 0.0% 0.0 362 1.5%Asian/Pacific Islander 0 0.0% 0.0 0 0.0% 0.0 0 0.0% 0.0 0 0.0% 0.0 244 1.0%Black/African-American 2 13.3% 1,639.3 0 0.0% 0.0 0 0.0% 0.0 0 0.0% 0.0 122 0.5%Latina/Hispanic 1 6.7% 36.5 0 0.0% 0.0 0 0.0% 0.0 0 0.0% 0.0 2,743 11.3%White 12 80.0% 60.1 2 100.0% 10.0 0 0.0% 0.0 0 0.0% 0.0 19,982 82.7%Other/Multi/Not Specified 25 62.5% - 2 50.0% - 0 0.0% - 0 0.0% - 722 3.0%Male Total 8 16.7% 33.9 2 33.3% 8.5 0 0.0% 0.0 0 0.0% 0.0 23,575 49.4%American Indian/Alaska Native 0 0.0% 0.0 0 0.0% 0.0 0 0.0% 0.0 0 0.0% 0.0 319 1.4%Asian/Pacific Islander 0 0.0% 0.0 0 0.0% 0.0 0 0.0% 0.0 0 0.0% 0.0 172 0.7%Black/African-American 0 0.0% 0.0 0 0.0% 0.0 0 0.0% 0.0 0 0.0% 0.0 219 0.9%Latina/Hispanic 0 0.0% 0.0 0 0.0% 0.0 0 0.0% 0.0 0 0.0% 0.0 2,541 10.8%White 3 100.0% 15.2 2 100.0% 10.2 0 0.0% 0.0 0 0.0% 0.0 19,702 83.6%Other/Multi/Not Specified 5 62.5% - 0 0.0% - 0 0.0% - 0 0.0% - 622 2.6%
California Local Health Jurisdiction STD Data Summaries, 2010 Provisional Data (July 2011)

1:100
Colusa County – Chlamydia, Gonorrhea, and P&S SyphilisRates by Age Group (2010), Race/Ethnicity (2010), and Year
0−9 10−14 15−19 20−24 25−29 30−34 35−44 45+
Age Group
0
200
400
600
800
1000
1200 Chlamydia
Nat. Am. A/PI Black Latino White
Race/Ethnicity*
0
100
200
300
400
500
Chlamydia
2001 2002 2003 2004 2005 2006 2007 2008 2009 2010
0
100
200
300
400
Year
Chlamydia
0−9 10−14 15−19 20−24 25−29 30−34 35−44 45+
Age Group
0
1 Gonorrhea
Nat. Am. A/PI Black Latino White
Race/Ethnicity*
0
1 Gonorrhea
2001 2002 2003 2004 2005 2006 2007 2008 2009 2010
0
10
20
30
40
50
Year
Gonorrhea
0−9 10−14 15−19 20−24 25−29 30−34 35−44 45+
Age Group
0
1 P&S Syphilis
Nat. Am. A/PI Black Latino White
Race/Ethnicity*
0
1 P&S Syphilis
2001 2002 2003 2004 2005 2006 2007 2008 2009 2010
Year
0
1 P&S Syphilis
Female Male Female Male
* Race data may be missing for a substantial number of cases. See the 'Data Limitations' page for further information.Note: Rates are per 100,000 population.
Source: California Department of Public Health, STD Control Branch
California Local Health Jurisdiction STD Data Summaries, 2010 Provisional Data (July 2011)

1 Gender specific age groups and race/ethnicity percent calculations exclude "Not Specified" from the denominator. 2 Overall county rates were calculated using the July 1 county population estimates from the Department of Finance. (For Colusa County, the July 1, 2010 estimate is 22,337). Note: Rates are per 100,000 population. Source: California Department of Public Health, STD Control Branch
Colusa County – Chlamydia, Gonorrhea, and Early Syphilis Cases and Rates Tables for 2010
Gender & Age Group Chlamydia Gonorrhea P&S Syphilis Early Latent Syphilis Population
Cases Percent1 Rate Cases Percent1 Rate Cases Percent1 Rate Cases Percent1 Rate Number Percent1
COUNTY TOTAL 31 100.0% 138.8 0 100.0% 0.0 0 100.0% 0.0 0 100.0% 0.0 23,787 100.0%
Female Total 26 83.9% 223.7 0 0.0% 0.0 0 0.0% 0.0 0 0.0% 0.0 11,624 48.9% Ages 00 – 09 0 0.0% 0.0 0 0.0% 0.0 0 0.0% 0.0 0 0.0% 0.0 1,750 15.1% 10 – 14 0 0.0% 0.0 0 0.0% 0.0 0 0.0% 0.0 0 0.0% 0.0 880 7.6% 15 – 19 10 38.5% 1,023.5 0 0.0% 0.0 0 0.0% 0.0 0 0.0% 0.0 977 8.4% 20 – 24 10 38.5% 1,036.3 0 0.0% 0.0 0 0.0% 0.0 0 0.0% 0.0 965 8.3% 25 – 29 5 19.2% 547.0 0 0.0% 0.0 0 0.0% 0.0 0 0.0% 0.0 914 7.9% 30 – 34 1 3.8% 157.7 0 0.0% 0.0 0 0.0% 0.0 0 0.0% 0.0 634 5.5% 35 – 44 0 0.0% 0.0 0 0.0% 0.0 0 0.0% 0.0 0 0.0% 0.0 1,346 11.6% 45 + 0 0.0% 0.0 0 0.0% 0.0 0 0.0% 0.0 0 0.0% 0.0 4,158 35.8% Not Specified 0 0.0% - 0 0.0% - 0 0.0% - 0 0.0% -
Male Total 5 16.1% 41.1 0 0.0% 0.0 0 0.0% 0.0 0 0.0% 0.0 12,163 51.1% Ages 00 – 09 0 0.0% 0.0 0 0.0% 0.0 0 0.0% 0.0 0 0.0% 0.0 1,873 15.4% 10 – 14 0 0.0% 0.0 0 0.0% 0.0 0 0.0% 0.0 0 0.0% 0.0 860 7.1% 15 – 19 3 60.0% 304.9 0 0.0% 0.0 0 0.0% 0.0 0 0.0% 0.0 984 8.1% 20 – 24 1 20.0% 92.5 0 0.0% 0.0 0 0.0% 0.0 0 0.0% 0.0 1,081 8.9% 25 – 29 0 0.0% 0.0 0 0.0% 0.0 0 0.0% 0.0 0 0.0% 0.0 1,150 9.5% 30 – 34 1 20.0% 123.9 0 0.0% 0.0 0 0.0% 0.0 0 0.0% 0.0 807 6.6% 35 – 44 0 0.0% 0.0 0 0.0% 0.0 0 0.0% 0.0 0 0.0% 0.0 1,434 11.8% 45 + 0 0.0% 0.0 0 0.0% 0.0 0 0.0% 0.0 0 0.0% 0.0 3,974 32.7% Not Specified 0 0.0% - 0 0.0% - 0 0.0% - 0 0.0% -
Gender & Race/Ethnicity Chlamydia Gonorrhea P&S Syphilis Early Latent Syphilis Population
Cases Percent1 Rate Cases Percent1 Rate Cases Percent1 Rate Cases Percent1 Rate Number Percent1
COUNTY TOTAL 31 100.0% 138.8 0 100.0% 0.0 0 100.0% 0.0 0 100.0% 0.0 23,787 100.0%
Female Total 26 83.9% 223.7 0 0.0% 0.0 0 0.0% 0.0 0 0.0% 0.0 11,624 48.9%American Indian/Alaska Native 0 0.0% 0.0 0 0.0% 0.0 0 0.0% 0.0 0 0.0% 0.0 191 1.6%Asian/Pacific Islander 0 0.0% 0.0 0 0.0% 0.0 0 0.0% 0.0 0 0.0% 0.0 201 1.7%Black/African-American 0 0.0% 0.0 0 0.0% 0.0 0 0.0% 0.0 0 0.0% 0.0 47 0.4%Latina/Hispanic 1 3.8% 17.5 0 0.0% 0.0 0 0.0% 0.0 0 0.0% 0.0 5,726 49.3%White 25 96.2% 472.6 0 0.0% 0.0 0 0.0% 0.0 0 0.0% 0.0 5,290 45.5%Other/Multi/Not Specified 0 0.0% - 0 0.0% - 0 0.0% - 0 0.0% - 169 1.5%Male Total 5 16.1% 41.1 0 0.0% 0.0 0 0.0% 0.0 0 0.0% 0.0 12,163 51.1%American Indian/Alaska Native 0 0.0% 0.0 0 0.0% 0.0 0 0.0% 0.0 0 0.0% 0.0 191 1.6%Asian/Pacific Islander 0 0.0% 0.0 0 0.0% 0.0 0 0.0% 0.0 0 0.0% 0.0 227 1.9%Black/African-American 0 0.0% 0.0 0 0.0% 0.0 0 0.0% 0.0 0 0.0% 0.0 61 0.5%Latina/Hispanic 1 33.3% 15.5 0 0.0% 0.0 0 0.0% 0.0 0 0.0% 0.0 6,445 53.0%White 2 66.7% 39.3 0 0.0% 0.0 0 0.0% 0.0 0 0.0% 0.0 5,092 41.9%Other/Multi/Not Specified 2 40.0% - 0 0.0% - 0 0.0% - 0 0.0% - 147 1.2%
California Local Health Jurisdiction STD Data Summaries, 2010 Provisional Data (July 2011)
1:100
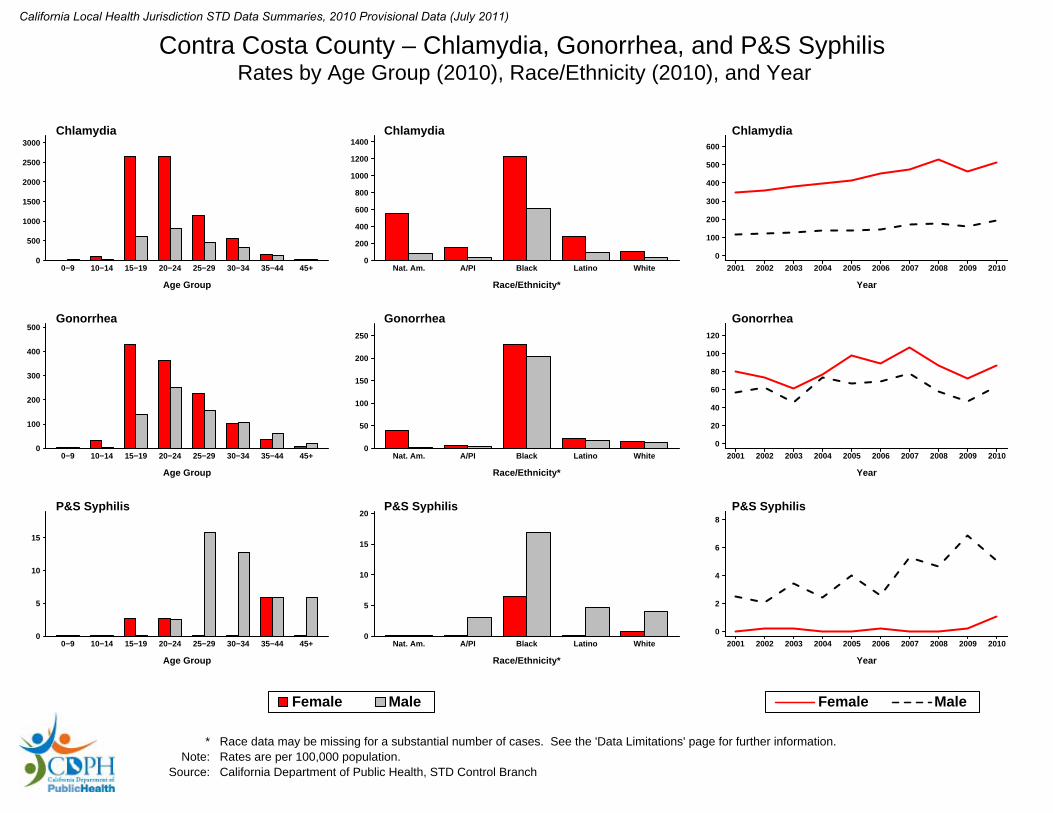
Contra Costa County – Chlamydia, Gonorrhea, and P&S SyphilisRates by Age Group (2010), Race/Ethnicity (2010), and Year
0−9 10−14 15−19 20−24 25−29 30−34 35−44 45+
Age Group
0
500
1000
1500
2000
2500
3000 Chlamydia
Nat. Am. A/PI Black Latino White
Race/Ethnicity*
0
200
400
600
800
1000
1200
1400 Chlamydia
2001 2002 2003 2004 2005 2006 2007 2008 2009 2010
0
100
200
300
400
500
600
Year
Chlamydia
0−9 10−14 15−19 20−24 25−29 30−34 35−44 45+
Age Group
0
100
200
300
400
500 Gonorrhea
Nat. Am. A/PI Black Latino White
Race/Ethnicity*
0
50
100
150
200
250
Gonorrhea
2001 2002 2003 2004 2005 2006 2007 2008 2009 2010
0
20
40
60
80
100
120
Year
Gonorrhea
0−9 10−14 15−19 20−24 25−29 30−34 35−44 45+
Age Group
0
5
10
15
P&S Syphilis
Nat. Am. A/PI Black Latino White
Race/Ethnicity*
0
5
10
15
20 P&S Syphilis
2001 2002 2003 2004 2005 2006 2007 2008 2009 2010
0
2
4
6
8
Year
P&S Syphilis
Female Male Female Male
* Race data may be missing for a substantial number of cases. See the 'Data Limitations' page for further information.Note: Rates are per 100,000 population.
Source: California Department of Public Health, STD Control Branch
California Local Health Jurisdiction STD Data Summaries, 2010 Provisional Data (July 2011)

1 Gender specific age groups and race/ethnicity percent calculations exclude "Not Specified" from the denominator. 2 Overall county rates were calculated using the July 1 county population estimates from the Department of Finance. (For Contra Costa County, the July 1, 2010 estimate is 1,079,160). Note: Rates are per 100,000 population. Source: California Department of Public Health, STD Control Branch
Contra Costa County – Chlamydia, Gonorrhea, and Early Syphilis Cases and Rates Tables for 2010
Gender & Age Group Chlamydia Gonorrhea P&S Syphilis Early Latent Syphilis Population
Cases Percent1 Rate Cases Percent1 Rate Cases Percent1 Rate Cases Percent1 Rate Number Percent1
COUNTY TOTAL 3,872 100.0% 358.8 821 100.0% 76.1 33 100.0% 3.1 13 100.0% 1.2 1,075,931 100.0%
Female Total 2,812 72.6% 514.3 471 57.4% 86.1 6 18.2% 1.1 1 7.7% 0.2 546,789 50.8% Ages 00 – 09 5 0.2% 7.5 0 0.0% 0.0 0 0.0% 0.0 0 0.0% 0.0 66,502 12.2% 10 – 14 33 1.2% 94.0 11 2.4% 31.3 0 0.0% 0.0 0 0.0% 0.0 35,111 6.4% 15 – 19 1,012 36.3% 2,649.2 164 35.3% 429.3 1 16.7% 2.6 0 0.0% 0.0 38,200 7.0% 20 – 24 1,015 36.4% 2,649.8 139 29.9% 362.9 1 16.7% 2.6 0 0.0% 0.0 38,305 7.0% 25 – 29 407 14.6% 1,156.6 80 17.2% 227.4 0 0.0% 0.0 1 100.0% 2.8 35,188 6.4% 30 – 34 165 5.9% 553.4 30 6.5% 100.6 0 0.0% 0.0 0 0.0% 0.0 29,816 5.5% 35 – 44 105 3.8% 153.0 26 5.6% 37.9 4 66.7% 5.8 0 0.0% 0.0 68,644 12.6% 45 + 44 1.6% 18.7 15 3.2% 6.4 0 0.0% 0.0 0 0.0% 0.0 235,023 43.0% Not Specified 26 0.9% - 6 1.3% - 0 0.0% - 0 0.0% -
Male Total 1,025 26.5% 193.7 338 41.2% 63.9 27 81.8% 5.1 12 92.3% 2.3 529,142 49.2% Ages 00 – 09 0 0.0% 0.0 0 0.0% 0.0 0 0.0% 0.0 0 0.0% 0.0 69,022 13.0% 10 – 14 11 1.1% 30.3 1 0.3% 2.8 0 0.0% 0.0 0 0.0% 0.0 36,312 6.9% 15 – 19 242 23.8% 601.5 56 16.7% 139.2 0 0.0% 0.0 1 8.3% 2.5 40,236 7.6% 20 – 24 327 32.2% 807.1 101 30.1% 249.3 1 3.7% 2.5 1 8.3% 2.5 40,514 7.7% 25 – 29 175 17.2% 461.8 59 17.6% 155.7 6 22.2% 15.8 3 25.0% 7.9 37,897 7.2% 30 – 34 101 9.9% 320.1 34 10.1% 107.8 4 14.8% 12.7 0 0.0% 0.0 31,551 6.0% 35 – 44 92 9.1% 136.6 41 12.2% 60.9 4 14.8% 5.9 6 50.0% 8.9 67,350 12.7% 45 + 68 6.7% 33.0 44 13.1% 21.3 12 44.4% 5.8 1 8.3% 0.5 206,260 39.0% Not Specified 9 0.9% - 2 0.6% - 0 0.0% - 0 0.0% -
Gender & Race/Ethnicity Chlamydia Gonorrhea P&S Syphilis Early Latent Syphilis Population
Cases Percent1 Rate Cases Percent1 Rate Cases Percent1 Rate Cases Percent1 Rate Number Percent1
COUNTY TOTAL 3,872 100.0% 358.8 821 100.0% 76.1 33 100.0% 3.1 13 100.0% 1.2 1,075,931 100.0%
Female Total 2,812 72.6% 514.3 471 57.4% 86.1 6 18.2% 1.1 1 7.7% 0.2 546,789 50.8%American Indian/Alaska Native 14 1.0% 548.8 1 0.5% 39.2 0 0.0% 0.0 0 0.0% 0.0 2,551 0.5%Asian/Pacific Islander 115 8.4% 153.8 5 2.7% 6.7 0 0.0% 0.0 0 0.0% 0.0 74,764 13.7%Black/African-American 569 41.7% 1,226.9 107 58.2% 230.7 3 60.0% 6.5 0 0.0% 0.0 46,377 8.5%Latina/Hispanic 356 26.1% 286.0 26 14.1% 20.9 0 0.0% 0.0 1 100.0% 0.8 124,461 22.8%White 310 22.7% 108.0 45 24.5% 15.7 2 40.0% 0.7 0 0.0% 0.0 287,126 52.5%Other/Multi/Not Specified 1,448 51.5% - 287 60.9% - 1 16.7% - 0 0.0% - 11,510 2.1%Male Total 1,025 26.5% 193.7 338 41.2% 63.9 27 81.8% 5.1 12 92.3% 2.3 529,142 49.2%American Indian/Alaska Native 2 0.4% 80.2 0 0.0% 0.0 0 0.0% 0.0 0 0.0% 0.0 2,494 0.5%Asian/Pacific Islander 27 5.4% 39.8 3 2.1% 4.4 2 7.7% 2.9 0 0.0% 0.0 67,821 12.8%Black/African-American 255 50.6% 616.7 84 57.9% 203.1 7 26.9% 16.9 4 36.4% 9.7 41,350 7.8%Latina/Hispanic 117 23.2% 89.8 23 15.9% 17.6 6 23.1% 4.6 4 36.4% 3.1 130,357 24.6%White 103 20.4% 37.3 35 24.1% 12.7 11 42.3% 4.0 3 27.3% 1.1 275,934 52.1%Other/Multi/Not Specified 521 50.8% - 193 57.1% - 1 3.7% - 1 8.3% - 11,186 2.1%
California Local Health Jurisdiction STD Data Summaries, 2010 Provisional Data (July 2011)

1:100
Del Norte County – Chlamydia, Gonorrhea, and P&S SyphilisRates by Age Group (2010), Race/Ethnicity (2010), and Year
0−9 10−14 15−19 20−24 25−29 30−34 35−44 45+
Age Group
0
200
400
600
800
1000
Chlamydia
Nat. Am. A/PI Black Latino White
Race/Ethnicity*
0
50
100
150
200
Chlamydia
2001 2002 2003 2004 2005 2006 2007 2008 2009 2010
0
50
100
150
200
250
300
Year
Chlamydia
0−9 10−14 15−19 20−24 25−29 30−34 35−44 45+
Age Group
0
20
40
60
80 Gonorrhea
Nat. Am. A/PI Black Latino White
Race/Ethnicity*
0
2
4
6
8
10
Gonorrhea
2001 2002 2003 2004 2005 2006 2007 2008 2009 2010
0
10
20
30
Year
Gonorrhea
0−9 10−14 15−19 20−24 25−29 30−34 35−44 45+
Age Group
0
1 P&S Syphilis
Nat. Am. A/PI Black Latino White
Race/Ethnicity*
0
1 P&S Syphilis
2001 2002 2003 2004 2005 2006 2007 2008 2009 2010
Year
0
1 P&S Syphilis
Female Male Female Male
* Race data may be missing for a substantial number of cases. See the 'Data Limitations' page for further information.Note: Rates are per 100,000 population.
Source: California Department of Public Health, STD Control Branch
California Local Health Jurisdiction STD Data Summaries, 2010 Provisional Data (July 2011)

1 Gender specific age groups and race/ethnicity percent calculations exclude "Not Specified" from the denominator. 2 Overall county rates were calculated using the July 1 county population estimates from the Department of Finance. (For Del Norte County, the July 1, 2010 estimate is 29,738). Note: Rates are per 100,000 population. Source: California Department of Public Health, STD Control Branch
Del Norte County – Chlamydia, Gonorrhea, and Early Syphilis Cases and Rates Tables for 2010
Gender & Age Group Chlamydia Gonorrhea P&S Syphilis Early Latent Syphilis Population
Cases Percent1 Rate Cases Percent1 Rate Cases Percent1 Rate Cases Percent1 Rate Number Percent1
COUNTY TOTAL 46 100.0% 154.7 1 100.0% 3.4 0 100.0% 0.0 0 100.0% 0.0 30,983 100.0%
Female Total 34 73.9% 242.6 1 100.0% 7.1 0 0.0% 0.0 0 0.0% 0.0 14,017 45.2% Ages 00 – 09 0 0.0% 0.0 0 0.0% 0.0 0 0.0% 0.0 0 0.0% 0.0 1,763 12.6% 10 – 14 0 0.0% 0.0 0 0.0% 0.0 0 0.0% 0.0 0 0.0% 0.0 802 5.7% 15 – 19 10 29.4% 990.1 0 0.0% 0.0 0 0.0% 0.0 0 0.0% 0.0 1,010 7.2% 20 – 24 10 29.4% 881.8 0 0.0% 0.0 0 0.0% 0.0 0 0.0% 0.0 1,134 8.1% 25 – 29 9 26.5% 835.7 0 0.0% 0.0 0 0.0% 0.0 0 0.0% 0.0 1,077 7.7% 30 – 34 5 14.7% 758.7 0 0.0% 0.0 0 0.0% 0.0 0 0.0% 0.0 659 4.7% 35 – 44 0 0.0% 0.0 1 100.0% 70.8 0 0.0% 0.0 0 0.0% 0.0 1,412 10.1% 45 + 0 0.0% 0.0 0 0.0% 0.0 0 0.0% 0.0 0 0.0% 0.0 6,160 43.9% Not Specified 0 0.0% - 0 0.0% - 0 0.0% - 0 0.0% -
Male Total 12 26.1% 70.7 0 0.0% 0.0 0 0.0% 0.0 0 0.0% 0.0 16,966 54.8% Ages 00 – 09 0 0.0% 0.0 0 0.0% 0.0 0 0.0% 0.0 0 0.0% 0.0 1,831 10.8% 10 – 14 0 0.0% 0.0 0 0.0% 0.0 0 0.0% 0.0 0 0.0% 0.0 808 4.8% 15 – 19 4 33.3% 351.5 0 0.0% 0.0 0 0.0% 0.0 0 0.0% 0.0 1,138 6.7% 20 – 24 4 33.3% 244.1 0 0.0% 0.0 0 0.0% 0.0 0 0.0% 0.0 1,639 9.7% 25 – 29 2 16.7% 102.4 0 0.0% 0.0 0 0.0% 0.0 0 0.0% 0.0 1,953 11.5% 30 – 34 1 8.3% 77.7 0 0.0% 0.0 0 0.0% 0.0 0 0.0% 0.0 1,287 7.6% 35 – 44 1 8.3% 43.6 0 0.0% 0.0 0 0.0% 0.0 0 0.0% 0.0 2,291 13.5% 45 + 0 0.0% 0.0 0 0.0% 0.0 0 0.0% 0.0 0 0.0% 0.0 6,019 35.5% Not Specified 0 0.0% - 0 0.0% - 0 0.0% - 0 0.0% -
Gender & Race/Ethnicity Chlamydia Gonorrhea P&S Syphilis Early Latent Syphilis Population
Cases Percent1 Rate Cases Percent1 Rate Cases Percent1 Rate Cases Percent1 Rate Number Percent1
COUNTY TOTAL 46 100.0% 154.7 1 100.0% 3.4 0 100.0% 0.0 0 100.0% 0.0 30,983 100.0%
Female Total 34 73.9% 242.6 1 100.0% 7.1 0 0.0% 0.0 0 0.0% 0.0 14,017 45.2%American Indian/Alaska Native 2 20.0% 195.9 0 0.0% 0.0 0 0.0% 0.0 0 0.0% 0.0 1,021 7.3%Asian/Pacific Islander 0 0.0% 0.0 0 0.0% 0.0 0 0.0% 0.0 0 0.0% 0.0 400 2.9%Black/African-American 0 0.0% 0.0 0 0.0% 0.0 0 0.0% 0.0 0 0.0% 0.0 67 0.5%Latina/Hispanic 1 10.0% 56.9 0 0.0% 0.0 0 0.0% 0.0 0 0.0% 0.0 1,757 12.5%White 7 70.0% 68.1 1 100.0% 9.7 0 0.0% 0.0 0 0.0% 0.0 10,275 73.3%Other/Multi/Not Specified 24 70.6% - 0 0.0% - 0 0.0% - 0 0.0% - 497 3.5%Male Total 12 26.1% 70.7 0 0.0% 0.0 0 0.0% 0.0 0 0.0% 0.0 16,966 54.8%American Indian/Alaska Native 1 25.0% 97.8 0 0.0% 0.0 0 0.0% 0.0 0 0.0% 0.0 1,022 6.0%Asian/Pacific Islander 0 0.0% 0.0 0 0.0% 0.0 0 0.0% 0.0 0 0.0% 0.0 369 2.2%Black/African-American 0 0.0% 0.0 0 0.0% 0.0 0 0.0% 0.0 0 0.0% 0.0 1,182 7.0%Latina/Hispanic 1 25.0% 29.9 0 0.0% 0.0 0 0.0% 0.0 0 0.0% 0.0 3,342 19.7%White 2 50.0% 19.0 0 0.0% 0.0 0 0.0% 0.0 0 0.0% 0.0 10,534 62.1%Other/Multi/Not Specified 8 66.7% - 0 0.0% - 0 0.0% - 0 0.0% - 517 3.0%
California Local Health Jurisdiction STD Data Summaries, 2010 Provisional Data (July 2011)

1:100
El Dorado County – Chlamydia, Gonorrhea, and P&S SyphilisRates by Age Group (2010), Race/Ethnicity (2010), and Year
0−9 10−14 15−19 20−24 25−29 30−34 35−44 45+
Age Group
0
500
1000
1500 Chlamydia
Nat. Am. A/PI Black Latino White
Race/Ethnicity*
0
100
200
300
400
500
600
700 Chlamydia
2001 2002 2003 2004 2005 2006 2007 2008 2009 2010
0
50
100
150
200
250
Year
Chlamydia
0−9 10−14 15−19 20−24 25−29 30−34 35−44 45+
Age Group
0
20
40
60
80
100
Gonorrhea
Nat. Am. A/PI Black Latino White
Race/Ethnicity*
0
2
4
6
8
10
Gonorrhea
2001 2002 2003 2004 2005 2006 2007 2008 2009 2010
0
5
10
15
20
Year
Gonorrhea
0−9 10−14 15−19 20−24 25−29 30−34 35−44 45+
Age Group
0.0
0.5
1.0
1.5
2.0
2.5
P&S Syphilis
Nat. Am. A/PI Black Latino White
Race/Ethnicity*
0
1 P&S Syphilis
2001 2002 2003 2004 2005 2006 2007 2008 2009 2010
0.0
0.5
1.0
1.5
2.0
2.5
Year
P&S Syphilis
Female Male Female Male
* Race data may be missing for a substantial number of cases. See the 'Data Limitations' page for further information.Note: Rates are per 100,000 population.
Source: California Department of Public Health, STD Control Branch
California Local Health Jurisdiction STD Data Summaries, 2010 Provisional Data (July 2011)

1 Gender specific age groups and race/ethnicity percent calculations exclude "Not Specified" from the denominator. 2 Overall county rates were calculated using the July 1 county population estimates from the Department of Finance. (For El Dorado County, the July 1, 2010 estimate is 182,827). Note: Rates are per 100,000 population. Source: California Department of Public Health, STD Control Branch
El Dorado County – Chlamydia, Gonorrhea, and Early Syphilis Cases and Rates Tables for 2010
Gender & Age Group Chlamydia Gonorrhea P&S Syphilis Early Latent Syphilis Population
Cases Percent1 Rate Cases Percent1 Rate Cases Percent1 Rate Cases Percent1 Rate Number Percent1
COUNTY TOTAL 243 100.0% 132.9 16 100.0% 8.8 1 100.0% 0.5 0 100.0% 0.0 189,308 100.0%
Female Total 173 71.2% 182.4 7 43.8% 7.4 0 0.0% 0.0 0 0.0% 0.0 94,863 50.1% Ages 00 – 09 0 0.0% 0.0 0 0.0% 0.0 0 0.0% 0.0 0 0.0% 0.0 9,485 10.0% 10 – 14 1 0.6% 18.2 0 0.0% 0.0 0 0.0% 0.0 0 0.0% 0.0 5,500 5.8% 15 – 19 51 29.5% 727.9 1 14.3% 14.3 0 0.0% 0.0 0 0.0% 0.0 7,006 7.4% 20 – 24 85 49.1% 1,310.9 1 14.3% 15.4 0 0.0% 0.0 0 0.0% 0.0 6,484 6.8% 25 – 29 19 11.0% 437.6 1 14.3% 23.0 0 0.0% 0.0 0 0.0% 0.0 4,342 4.6% 30 – 34 8 4.6% 270.3 0 0.0% 0.0 0 0.0% 0.0 0 0.0% 0.0 2,960 3.1% 35 – 44 6 3.5% 49.8 3 42.9% 24.9 0 0.0% 0.0 0 0.0% 0.0 12,058 12.7% 45 + 3 1.7% 6.4 1 14.3% 2.1 0 0.0% 0.0 0 0.0% 0.0 47,028 49.6% Not Specified 0 0.0% - 0 0.0% - 0 0.0% - 0 0.0% -
Male Total 70 28.8% 74.1 9 56.3% 9.5 1 100.0% 1.1 0 0.0% 0.0 94,445 49.9% Ages 00 – 09 0 0.0% 0.0 0 0.0% 0.0 0 0.0% 0.0 0 0.0% 0.0 9,973 10.6% 10 – 14 0 0.0% 0.0 0 0.0% 0.0 0 0.0% 0.0 0 0.0% 0.0 6,122 6.5% 15 – 19 12 17.1% 157.5 0 0.0% 0.0 0 0.0% 0.0 0 0.0% 0.0 7,617 8.1% 20 – 24 35 50.0% 501.7 3 33.3% 43.0 0 0.0% 0.0 0 0.0% 0.0 6,976 7.4% 25 – 29 11 15.7% 223.9 1 11.1% 20.4 0 0.0% 0.0 0 0.0% 0.0 4,912 5.2% 30 – 34 8 11.4% 241.6 3 33.3% 90.6 0 0.0% 0.0 0 0.0% 0.0 3,311 3.5% 35 – 44 3 4.3% 26.4 0 0.0% 0.0 0 0.0% 0.0 0 0.0% 0.0 11,383 12.1% 45 + 1 1.4% 2.3 2 22.2% 4.5 1 100.0% 2.3 0 0.0% 0.0 44,151 46.7% Not Specified 0 0.0% - 0 0.0% - 0 0.0% - 0 0.0% -
Gender & Race/Ethnicity Chlamydia Gonorrhea P&S Syphilis Early Latent Syphilis Population
Cases Percent1 Rate Cases Percent1 Rate Cases Percent1 Rate Cases Percent1 Rate Number Percent1
COUNTY TOTAL 243 100.0% 132.9 16 100.0% 8.8 1 100.0% 0.5 0 100.0% 0.0 189,308 100.0%
Female Total 173 71.2% 182.4 7 43.8% 7.4 0 0.0% 0.0 0 0.0% 0.0 94,863 50.1%American Indian/Alaska Native 2 2.2% 297.6 0 0.0% 0.0 0 0.0% 0.0 0 0.0% 0.0 672 0.7%Asian/Pacific Islander 2 2.2% 96.4 0 0.0% 0.0 0 0.0% 0.0 0 0.0% 0.0 2,075 2.2%Black/African-American 2 2.2% 595.2 0 0.0% 0.0 0 0.0% 0.0 0 0.0% 0.0 336 0.4%Latina/Hispanic 20 21.5% 188.4 0 0.0% 0.0 0 0.0% 0.0 0 0.0% 0.0 10,617 11.2%White 67 72.0% 84.2 4 100.0% 5.0 0 0.0% 0.0 0 0.0% 0.0 79,529 83.8%Other/Multi/Not Specified 80 46.2% - 3 42.9% - 0 0.0% - 0 0.0% - 1,634 1.7%Male Total 70 28.8% 74.1 9 56.3% 9.5 1 100.0% 1.1 0 0.0% 0.0 94,445 49.9%American Indian/Alaska Native 0 0.0% 0.0 0 0.0% 0.0 0 0.0% 0.0 0 0.0% 0.0 683 0.7%Asian/Pacific Islander 2 3.8% 108.2 0 0.0% 0.0 0 0.0% 0.0 0 0.0% 0.0 1,849 2.0%Black/African-American 1 1.9% 200.0 0 0.0% 0.0 0 0.0% 0.0 0 0.0% 0.0 500 0.5%Latina/Hispanic 13 25.0% 123.8 1 25.0% 9.5 0 0.0% 0.0 0 0.0% 0.0 10,499 11.1%White 36 69.2% 45.3 3 75.0% 3.8 0 0.0% 0.0 0 0.0% 0.0 79,389 84.1%Other/Multi/Not Specified 18 25.7% - 5 55.6% - 1 100.0% - 0 0.0% - 1,525 1.6%
California Local Health Jurisdiction STD Data Summaries, 2010 Provisional Data (July 2011)

1:100
Fresno County – Chlamydia, Gonorrhea, and P&S SyphilisRates by Age Group (2010), Race/Ethnicity (2010), and Year
0−9 10−14 15−19 20−24 25−29 30−34 35−44 45+
Age Group
0
1000
2000
3000
4000
5000 Chlamydia
Nat. Am. A/PI Black Latino White
Race/Ethnicity*
0
500
1000
1500
2000
2500 Chlamydia
2001 2002 2003 2004 2005 2006 2007 2008 2009 2010
0
200
400
600
800
1000
Year
Chlamydia
0−9 10−14 15−19 20−24 25−29 30−34 35−44 45+
Age Group
0
100
200
300
400
Gonorrhea
Nat. Am. A/PI Black Latino White
Race/Ethnicity*
0
100
200
300
400
500
Gonorrhea
2001 2002 2003 2004 2005 2006 2007 2008 2009 2010
0
50
100
150
200
Year
Gonorrhea
0−9 10−14 15−19 20−24 25−29 30−34 35−44 45+
Age Group
0
2
4
6
8
P&S Syphilis
Nat. Am. A/PI Black Latino White
Race/Ethnicity*
0
2
4
6
8
10 P&S Syphilis
2001 2002 2003 2004 2005 2006 2007 2008 2009 2010
0
1
2
3
4
5
6
Year
P&S Syphilis
Female Male Female Male
* Race data may be missing for a substantial number of cases. See the 'Data Limitations' page for further information.Note: Rates are per 100,000 population.
Source: California Department of Public Health, STD Control Branch
California Local Health Jurisdiction STD Data Summaries, 2010 Provisional Data (July 2011)

1 Gender specific age groups and race/ethnicity percent calculations exclude "Not Specified" from the denominator. 2 Overall county rates were calculated using the July 1 county population estimates from the Department of Finance. (For Fresno County, the July 1, 2010 estimate is 959,318). Note: Rates are per 100,000 population. Source: California Department of Public Health, STD Control Branch
Fresno County – Chlamydia, Gonorrhea, and Early Syphilis Cases and Rates Tables for 2010
Gender & Age Group Chlamydia Gonorrhea P&S Syphilis Early Latent Syphilis Population
Cases Percent1 Rate Cases Percent1 Rate Cases Percent1 Rate Cases Percent1 Rate Number Percent1
COUNTY TOTAL 5,953 100.0% 620.5 798 100.0% 83.2 14 100.0% 1.5 5 100.0% 0.5 983,478 100.0%
Female Total 4,657 78.2% 954.6 434 54.4% 89.0 2 14.3% 0.4 1 20.0% 0.2 487,851 49.6% Ages 00 – 09 2 0.0% 2.5 0 0.0% 0.0 0 0.0% 0.0 0 0.0% 0.0 79,162 16.2% 10 – 14 46 1.0% 132.3 4 0.9% 11.5 0 0.0% 0.0 0 0.0% 0.0 34,761 7.1% 15 – 19 1,597 34.6% 3,942.2 127 29.5% 313.5 1 50.0% 2.5 0 0.0% 0.0 40,510 8.3% 20 – 24 1,738 37.6% 4,312.0 152 35.3% 377.1 0 0.0% 0.0 1 100.0% 2.5 40,306 8.3% 25 – 29 690 14.9% 1,791.4 75 17.4% 194.7 0 0.0% 0.0 0 0.0% 0.0 38,518 7.9% 30 – 34 296 6.4% 854.3 46 10.7% 132.8 0 0.0% 0.0 0 0.0% 0.0 34,647 7.1% 35 – 44 181 3.9% 296.4 21 4.9% 34.4 0 0.0% 0.0 0 0.0% 0.0 61,074 12.5% 45 + 70 1.5% 44.1 6 1.4% 3.8 1 50.0% 0.6 0 0.0% 0.0 158,873 32.6% Not Specified 37 0.8% - 3 0.7% - 0 0.0% - 0 0.0% -
Male Total 1,276 21.4% 257.5 359 45.0% 72.4 11 78.6% 2.2 4 80.0% 0.8 495,627 50.4% Ages 00 – 09 0 0.0% 0.0 0 0.0% 0.0 0 0.0% 0.0 0 0.0% 0.0 82,397 16.6% 10 – 14 6 0.5% 16.4 0 0.0% 0.0 0 0.0% 0.0 0 0.0% 0.0 36,546 7.4% 15 – 19 280 22.2% 651.5 68 18.9% 158.2 0 0.0% 0.0 0 0.0% 0.0 42,978 8.7% 20 – 24 484 38.3% 1,107.6 116 32.3% 265.5 2 18.2% 4.6 0 0.0% 0.0 43,697 8.8% 25 – 29 250 19.8% 578.0 74 20.6% 171.1 2 18.2% 4.6 0 0.0% 0.0 43,249 8.7% 30 – 34 110 8.7% 286.0 33 9.2% 85.8 3 27.3% 7.8 1 25.0% 2.6 38,460 7.8% 35 – 44 98 7.8% 153.1 45 12.5% 70.3 2 18.2% 3.1 1 25.0% 1.6 63,994 12.9% 45 + 36 2.8% 24.9 23 6.4% 15.9 2 18.2% 1.4 2 50.0% 1.4 144,306 29.1% Not Specified 12 0.9% - 0 0.0% - 0 0.0% - 0 0.0% -
Gender & Race/Ethnicity Chlamydia Gonorrhea P&S Syphilis Early Latent Syphilis Population
Cases Percent1 Rate Cases Percent1 Rate Cases Percent1 Rate Cases Percent1 Rate Number Percent1
COUNTY TOTAL 5,953 100.0% 620.5 798 100.0% 83.2 14 100.0% 1.5 5 100.0% 0.5 983,478 100.0%
Female Total 4,657 78.2% 954.6 434 54.4% 89.0 2 14.3% 0.4 1 20.0% 0.2 487,851 49.6%American Indian/Alaska Native 12 0.4% 272.1 3 1.1% 68.0 0 0.0% 0.0 0 0.0% 0.0 4,410 0.9%Asian/Pacific Islander 205 6.4% 434.2 7 2.5% 14.8 0 0.0% 0.0 0 0.0% 0.0 47,218 9.7%Black/African-American 512 15.9% 2,206.3 98 34.9% 422.3 0 0.0% 0.0 0 0.0% 0.0 23,206 4.8%Latina/Hispanic 2,059 63.9% 869.2 136 48.4% 57.4 0 0.0% 0.0 1 100.0% 0.4 236,877 48.6%White 433 13.4% 254.7 37 13.2% 21.8 2 100.0% 1.2 0 0.0% 0.0 170,024 34.9%Other/Multi/Not Specified 1,436 30.8% - 153 35.3% - 0 0.0% - 0 0.0% - 6,116 1.3%Male Total 1,276 21.4% 257.5 359 45.0% 72.4 11 78.6% 2.2 4 80.0% 0.8 495,627 50.4%American Indian/Alaska Native 7 0.8% 174.9 1 0.4% 25.0 0 0.0% 0.0 0 0.0% 0.0 4,002 0.8%Asian/Pacific Islander 38 4.3% 83.2 4 1.6% 8.8 0 0.0% 0.0 0 0.0% 0.0 45,683 9.2%Black/African-American 191 21.4% 809.6 110 43.3% 466.3 2 22.2% 8.5 0 0.0% 0.0 23,591 4.8%Latina/Hispanic 547 61.2% 214.0 105 41.3% 41.1 4 44.4% 1.6 4 100.0% 1.6 255,572 51.6%White 111 12.4% 68.9 34 13.4% 21.1 3 33.3% 1.9 0 0.0% 0.0 161,120 32.5%Other/Multi/Not Specified 382 29.9% - 105 29.2% - 2 18.2% - 0 0.0% - 5,659 1.1%
California Local Health Jurisdiction STD Data Summaries, 2010 Provisional Data (July 2011)

1:100
Glenn County – Chlamydia, Gonorrhea, and P&S SyphilisRates by Age Group (2010), Race/Ethnicity (2010), and Year
0−9 10−14 15−19 20−24 25−29 30−34 35−44 45+
Age Group
0
500
1000
1500
Chlamydia
Nat. Am. A/PI Black Latino White
Race/Ethnicity*
0
200
400
600
800 Chlamydia
2001 2002 2003 2004 2005 2006 2007 2008 2009 2010
0
100
200
300
400
Year
Chlamydia
0−9 10−14 15−19 20−24 25−29 30−34 35−44 45+
Age Group
0
20
40
60
80
100
120
140
Gonorrhea
Nat. Am. A/PI Black Latino White
Race/Ethnicity*
0
10
20
30
40
Gonorrhea
2001 2002 2003 2004 2005 2006 2007 2008 2009 2010
0
10
20
30
40
50
Year
Gonorrhea
0−9 10−14 15−19 20−24 25−29 30−34 35−44 45+
Age Group
0
1 P&S Syphilis
Nat. Am. A/PI Black Latino White
Race/Ethnicity*
0
1 P&S Syphilis
2001 2002 2003 2004 2005 2006 2007 2008 2009 2010
Year
0
1 P&S Syphilis
Female Male Female Male
s Numbers suppressed for confidentiality* Race data may be missing for a substantial number of cases. See the 'Data Limitations' page for further information.
Note: Rates are per 100,000 population.Source: California Department of Public Health, STD Control Branch
California Local Health Jurisdiction STD Data Summaries, 2010 Provisional Data (July 2011)

s Numbers suppressed for confidentiality. 1 Gender specific age groups and race/ethnicity percent calculations exclude "Not Specified" from the denominator. 2 Overall county rates were calculated using the July 1 county population estimates from the Department of Finance. (For Glenn County, the July 1, 2010 estimate is 29,505). Note: Rates are per 100,000 population. Source: California Department of Public Health, STD Control Branch
Glenn County – Chlamydia, Gonorrhea, and Early Syphilis Cases and Rates Tables for 2010
Gender & Age Group Chlamydia Gonorrhea P&S Syphilis Early Latent Syphilis Population
Cases Percent1 Rate Cases Percent1 Rate Cases Percent1 Rate Cases Percent1 Rate Number Percent1
COUNTY TOTAL 46 100.0% 155.9 7 100.0% 23.7 0 100.0% 0.0 0 100.0% 0.0 30,880 100.0%
Female Total 34 73.9% 222.9 5 71.4% 32.8 0 0.0% 0.0 0 0.0% 0.0 15,255 49.4% Ages 00 – 09 0 0.0% 0.0 0 0.0% 0.0 0 0.0% 0.0 0 0.0% 0.0 2,249 14.7% 10 – 14 0 0.0% 0.0 0 0.0% 0.0 0 0.0% 0.0 0 0.0% 0.0 1,053 6.9% 15 – 19 16 47.1% 1,340.0 1 20.0% 83.8 0 0.0% 0.0 0 0.0% 0.0 1,194 7.8% 20 – 24 9 26.5% 715.4 1 20.0% 79.5 0 0.0% 0.0 0 0.0% 0.0 1,258 8.2% 25 – 29 6 17.6% 552.5 1 20.0% 92.1 0 0.0% 0.0 0 0.0% 0.0 1,086 7.1% 30 – 34 2 5.9% 255.4 1 20.0% 127.7 0 0.0% 0.0 0 0.0% 0.0 783 5.1% 35 – 44 1 2.9% 58.2 1 20.0% 58.2 0 0.0% 0.0 0 0.0% 0.0 1,719 11.3% 45 + 0 0.0% 0.0 0 0.0% 0.0 0 0.0% 0.0 0 0.0% 0.0 5,913 38.8% Not Specified 0 0.0% - 0 0.0% - 0 0.0% - 0 0.0% -
Male Total 11 23.9% 70.4 2 28.6% 12.8 0 0.0% 0.0 0 0.0% 0.0 15,625 50.6% Ages 00 – 09 0 0.0% 0.0 0 0.0% 0.0 0 0.0% 0.0 0 0.0% 0.0 2,251 14.4% 10 – 14 0 0.0% 0.0 0 0.0% 0.0 0 0.0% 0.0 0 0.0% 0.0 1,133 7.3% 15 – 19 2 18.2% 158.1 0 0.0% 0.0 0 0.0% 0.0 0 0.0% 0.0 1,265 8.1% 20 – 24 4 36.4% 294.3 1 50.0% 73.6 0 0.0% 0.0 0 0.0% 0.0 1,359 8.7% 25 – 29 3 27.3% 229.5 1 50.0% 76.5 0 0.0% 0.0 0 0.0% 0.0 1,307 8.4% 30 – 34 2 18.2% 226.8 0 0.0% 0.0 0 0.0% 0.0 0 0.0% 0.0 882 5.6% 35 – 44 0 0.0% 0.0 0 0.0% 0.0 0 0.0% 0.0 0 0.0% 0.0 1,798 11.5% 45 + 0 0.0% 0.0 0 0.0% 0.0 0 0.0% 0.0 0 0.0% 0.0 5,630 36.0% Not Specified 0 0.0% - 0 0.0% - 0 0.0% - 0 0.0% -
Gender & Race/Ethnicity Chlamydia Gonorrhea P&S Syphilis Early Latent Syphilis Population
Cases Percent1 Rate Cases Percent1 Rate Cases Percent1 Rate Cases Percent1 Rate Number Percent1
COUNTY TOTAL 46 100.0% 155.9 7 100.0% 23.7 0 100.0% 0.0 0 100.0% 0.0 30,880 100.0%
Female Total 34 73.9% 222.9 5 71.4% 32.8 0 0.0% 0.0 0 0.0% 0.0 15,255 49.4%American Indian/Alaska Native 2 7.1% 701.8 s s s 0 0.0% 0.0 0 0.0% 0.0 285 1.9%Asian/Pacific Islander 1 3.6% 182.1 s s s 0 0.0% 0.0 0 0.0% 0.0 549 3.6%Black/African-American 0 0.0% 0.0 s s s 0 0.0% 0.0 0 0.0% 0.0 57 0.4%Latina/Hispanic 20 71.4% 414.9 2 66.7% 41.5 0 0.0% 0.0 0 0.0% 0.0 4,821 31.6%White 5 17.9% 54.1 s s s 0 0.0% 0.0 0 0.0% 0.0 9,246 60.6%Other/Multi/Not Specified 6 17.6% - s s - 0 0.0% - 0 0.0% - 297 1.9%Male Total 11 23.9% 70.4 2 28.6% 12.8 0 0.0% 0.0 0 0.0% 0.0 15,625 50.6%American Indian/Alaska Native 0 0.0% 0.0 0 0.0% 0.0 0 0.0% 0.0 0 0.0% 0.0 227 1.5%Asian/Pacific Islander 0 0.0% 0.0 0 0.0% 0.0 0 0.0% 0.0 0 0.0% 0.0 531 3.4%Black/African-American 0 0.0% 0.0 0 0.0% 0.0 0 0.0% 0.0 0 0.0% 0.0 95 0.6%Latina/Hispanic 5 55.6% 90.9 2 100.0% 36.4 0 0.0% 0.0 0 0.0% 0.0 5,501 35.2%White 4 44.4% 44.5 0 0.0% 0.0 0 0.0% 0.0 0 0.0% 0.0 8,989 57.5%Other/Multi/Not Specified 2 18.2% - 0 0.0% - 0 0.0% - 0 0.0% - 282 1.8%
California Local Health Jurisdiction STD Data Summaries, 2010 Provisional Data (July 2011)

1:100
Humboldt County – Chlamydia, Gonorrhea, and P&S SyphilisRates by Age Group (2010), Race/Ethnicity (2010), and Year
0−9 10−14 15−19 20−24 25−29 30−34 35−44 45+
Age Group
0
500
1000
1500
2000
Chlamydia
Nat. Am. A/PI Black Latino White
Race/Ethnicity*
0
500
1000
1500
2000
Chlamydia
2001 2002 2003 2004 2005 2006 2007 2008 2009 2010
0
100
200
300
400
500
Year
Chlamydia
0−9 10−14 15−19 20−24 25−29 30−34 35−44 45+
Age Group
0
20
40
60
80
100
120
Gonorrhea
Nat. Am. A/PI Black Latino White
Race/Ethnicity*
0
50
100
150
200
250 Gonorrhea
2001 2002 2003 2004 2005 2006 2007 2008 2009 2010
0
10
20
30
40
50
60
Year
Gonorrhea
0−9 10−14 15−19 20−24 25−29 30−34 35−44 45+
Age Group
0
1 P&S Syphilis
Nat. Am. A/PI Black Latino White
Race/Ethnicity*
0
1 P&S Syphilis
2001 2002 2003 2004 2005 2006 2007 2008 2009 2010
0
1
2
3
4
5
Year
P&S Syphilis
Female Male Female Male
* Race data may be missing for a substantial number of cases. See the 'Data Limitations' page for further information.Note: Rates are per 100,000 population.
Source: California Department of Public Health, STD Control Branch
California Local Health Jurisdiction STD Data Summaries, 2010 Provisional Data (July 2011)
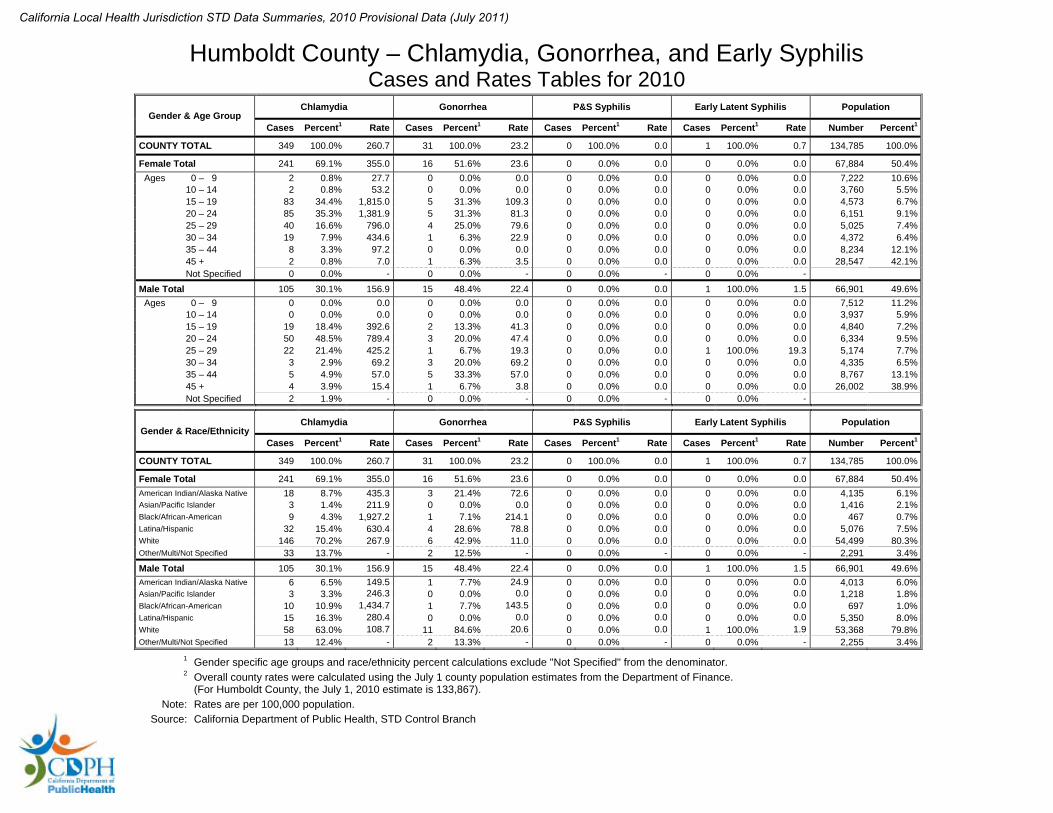
1 Gender specific age groups and race/ethnicity percent calculations exclude "Not Specified" from the denominator. 2 Overall county rates were calculated using the July 1 county population estimates from the Department of Finance. (For Humboldt County, the July 1, 2010 estimate is 133,867). Note: Rates are per 100,000 population. Source: California Department of Public Health, STD Control Branch
Humboldt County – Chlamydia, Gonorrhea, and Early Syphilis Cases and Rates Tables for 2010
Gender & Age Group Chlamydia Gonorrhea P&S Syphilis Early Latent Syphilis Population
Cases Percent1 Rate Cases Percent1 Rate Cases Percent1 Rate Cases Percent1 Rate Number Percent1
COUNTY TOTAL 349 100.0% 260.7 31 100.0% 23.2 0 100.0% 0.0 1 100.0% 0.7 134,785 100.0%
Female Total 241 69.1% 355.0 16 51.6% 23.6 0 0.0% 0.0 0 0.0% 0.0 67,884 50.4% Ages 00 – 09 2 0.8% 27.7 0 0.0% 0.0 0 0.0% 0.0 0 0.0% 0.0 7,222 10.6% 10 – 14 2 0.8% 53.2 0 0.0% 0.0 0 0.0% 0.0 0 0.0% 0.0 3,760 5.5% 15 – 19 83 34.4% 1,815.0 5 31.3% 109.3 0 0.0% 0.0 0 0.0% 0.0 4,573 6.7% 20 – 24 85 35.3% 1,381.9 5 31.3% 81.3 0 0.0% 0.0 0 0.0% 0.0 6,151 9.1% 25 – 29 40 16.6% 796.0 4 25.0% 79.6 0 0.0% 0.0 0 0.0% 0.0 5,025 7.4% 30 – 34 19 7.9% 434.6 1 6.3% 22.9 0 0.0% 0.0 0 0.0% 0.0 4,372 6.4% 35 – 44 8 3.3% 97.2 0 0.0% 0.0 0 0.0% 0.0 0 0.0% 0.0 8,234 12.1% 45 + 2 0.8% 7.0 1 6.3% 3.5 0 0.0% 0.0 0 0.0% 0.0 28,547 42.1% Not Specified 0 0.0% - 0 0.0% - 0 0.0% - 0 0.0% -
Male Total 105 30.1% 156.9 15 48.4% 22.4 0 0.0% 0.0 1 100.0% 1.5 66,901 49.6% Ages 00 – 09 0 0.0% 0.0 0 0.0% 0.0 0 0.0% 0.0 0 0.0% 0.0 7,512 11.2% 10 – 14 0 0.0% 0.0 0 0.0% 0.0 0 0.0% 0.0 0 0.0% 0.0 3,937 5.9% 15 – 19 19 18.4% 392.6 2 13.3% 41.3 0 0.0% 0.0 0 0.0% 0.0 4,840 7.2% 20 – 24 50 48.5% 789.4 3 20.0% 47.4 0 0.0% 0.0 0 0.0% 0.0 6,334 9.5% 25 – 29 22 21.4% 425.2 1 6.7% 19.3 0 0.0% 0.0 1 100.0% 19.3 5,174 7.7% 30 – 34 3 2.9% 69.2 3 20.0% 69.2 0 0.0% 0.0 0 0.0% 0.0 4,335 6.5% 35 – 44 5 4.9% 57.0 5 33.3% 57.0 0 0.0% 0.0 0 0.0% 0.0 8,767 13.1% 45 + 4 3.9% 15.4 1 6.7% 3.8 0 0.0% 0.0 0 0.0% 0.0 26,002 38.9% Not Specified 2 1.9% - 0 0.0% - 0 0.0% - 0 0.0% -
Gender & Race/Ethnicity Chlamydia Gonorrhea P&S Syphilis Early Latent Syphilis Population
Cases Percent1 Rate Cases Percent1 Rate Cases Percent1 Rate Cases Percent1 Rate Number Percent1
COUNTY TOTAL 349 100.0% 260.7 31 100.0% 23.2 0 100.0% 0.0 1 100.0% 0.7 134,785 100.0%
Female Total 241 69.1% 355.0 16 51.6% 23.6 0 0.0% 0.0 0 0.0% 0.0 67,884 50.4%American Indian/Alaska Native 18 8.7% 435.3 3 21.4% 72.6 0 0.0% 0.0 0 0.0% 0.0 4,135 6.1%Asian/Pacific Islander 3 1.4% 211.9 0 0.0% 0.0 0 0.0% 0.0 0 0.0% 0.0 1,416 2.1%Black/African-American 9 4.3% 1,927.2 1 7.1% 214.1 0 0.0% 0.0 0 0.0% 0.0 467 0.7%Latina/Hispanic 32 15.4% 630.4 4 28.6% 78.8 0 0.0% 0.0 0 0.0% 0.0 5,076 7.5%White 146 70.2% 267.9 6 42.9% 11.0 0 0.0% 0.0 0 0.0% 0.0 54,499 80.3%Other/Multi/Not Specified 33 13.7% - 2 12.5% - 0 0.0% - 0 0.0% - 2,291 3.4%Male Total 105 30.1% 156.9 15 48.4% 22.4 0 0.0% 0.0 1 100.0% 1.5 66,901 49.6%American Indian/Alaska Native 6 6.5% 149.5 1 7.7% 24.9 0 0.0% 0.0 0 0.0% 0.0 4,013 6.0%Asian/Pacific Islander 3 3.3% 246.3 0 0.0% 0.0 0 0.0% 0.0 0 0.0% 0.0 1,218 1.8%Black/African-American 10 10.9% 1,434.7 1 7.7% 143.5 0 0.0% 0.0 0 0.0% 0.0 697 1.0%Latina/Hispanic 15 16.3% 280.4 0 0.0% 0.0 0 0.0% 0.0 0 0.0% 0.0 5,350 8.0%White 58 63.0% 108.7 11 84.6% 20.6 0 0.0% 0.0 1 100.0% 1.9 53,368 79.8%Other/Multi/Not Specified 13 12.4% - 2 13.3% - 0 0.0% - 0 0.0% - 2,255 3.4%
California Local Health Jurisdiction STD Data Summaries, 2010 Provisional Data (July 2011)

1:100
Imperial County – Chlamydia, Gonorrhea, and P&S SyphilisRates by Age Group (2010), Race/Ethnicity (2010), and Year
0−9 10−14 15−19 20−24 25−29 30−34 35−44 45+
Age Group
0
500
1000
1500
2000
2500
3000 Chlamydia
Nat. Am. A/PI Black Latino White
Race/Ethnicity*
0
100
200
300
400
500
600
700 Chlamydia
2001 2002 2003 2004 2005 2006 2007 2008 2009 2010
0
200
400
600
800
Year
Chlamydia
0−9 10−14 15−19 20−24 25−29 30−34 35−44 45+
Age Group
0
20
40
60
80
Gonorrhea
Nat. Am. A/PI Black Latino White
Race/Ethnicity*
0
50
100
150
200 Gonorrhea
2001 2002 2003 2004 2005 2006 2007 2008 2009 2010
0
10
20
30
40
50
60
Year
Gonorrhea
0−9 10−14 15−19 20−24 25−29 30−34 35−44 45+
Age Group
0
1 P&S Syphilis
Nat. Am. A/PI Black Latino White
Race/Ethnicity*
0
1 P&S Syphilis
2001 2002 2003 2004 2005 2006 2007 2008 2009 2010
0
1
2
3
4
5
Year
P&S Syphilis
Female Male Female Male
* Race data may be missing for a substantial number of cases. See the 'Data Limitations' page for further information.Note: Rates are per 100,000 population.
Source: California Department of Public Health, STD Control Branch
California Local Health Jurisdiction STD Data Summaries, 2010 Provisional Data (July 2011)

1 Gender specific age groups and race/ethnicity percent calculations exclude "Not Specified" from the denominator. 2 Overall county rates were calculated using the July 1 county population estimates from the Department of Finance. (For Imperial County, the July 1, 2010 estimate is 184,060). Note: Rates are per 100,000 population. Source: California Department of Public Health, STD Control Branch
Imperial County – Chlamydia, Gonorrhea, and Early Syphilis Cases and Rates Tables for 2010
Gender & Age Group Chlamydia Gonorrhea P&S Syphilis Early Latent Syphilis Population
Cases Percent1 Rate Cases Percent1 Rate Cases Percent1 Rate Cases Percent1 Rate Number Percent1
COUNTY TOTAL 656 100.0% 356.4 25 100.0% 13.6 0 100.0% 0.0 0 100.0% 0.0 189,675 100.0%
Female Total 506 77.1% 568.7 10 40.0% 11.2 0 0.0% 0.0 0 0.0% 0.0 88,975 46.9% Ages 00 – 09 0 0.0% 0.0 0 0.0% 0.0 0 0.0% 0.0 0 0.0% 0.0 13,930 15.7% 10 – 14 2 0.4% 38.1 0 0.0% 0.0 0 0.0% 0.0 0 0.0% 0.0 5,244 5.9% 15 – 19 159 31.4% 2,017.5 6 60.0% 76.1 0 0.0% 0.0 0 0.0% 0.0 7,881 8.9% 20 – 24 204 40.3% 2,589.2 1 10.0% 12.7 0 0.0% 0.0 0 0.0% 0.0 7,879 8.9% 25 – 29 74 14.6% 1,340.8 0 0.0% 0.0 0 0.0% 0.0 0 0.0% 0.0 5,519 6.2% 30 – 34 40 7.9% 977.0 0 0.0% 0.0 0 0.0% 0.0 0 0.0% 0.0 4,094 4.6% 35 – 44 20 4.0% 163.8 2 20.0% 16.4 0 0.0% 0.0 0 0.0% 0.0 12,208 13.7% 45 + 7 1.4% 21.7 1 10.0% 3.1 0 0.0% 0.0 0 0.0% 0.0 32,220 36.2% Not Specified 0 0.0% - 0 0.0% - 0 0.0% - 0 0.0% -
Male Total 149 22.7% 148.0 15 60.0% 14.9 0 0.0% 0.0 0 0.0% 0.0 100,700 53.1% Ages 00 – 09 0 0.0% 0.0 0 0.0% 0.0 0 0.0% 0.0 0 0.0% 0.0 14,473 14.4% 10 – 14 1 0.7% 17.7 0 0.0% 0.0 0 0.0% 0.0 0 0.0% 0.0 5,649 5.6% 15 – 19 25 16.8% 299.3 1 6.7% 12.0 0 0.0% 0.0 0 0.0% 0.0 8,354 8.3% 20 – 24 66 44.3% 722.3 6 40.0% 65.7 0 0.0% 0.0 0 0.0% 0.0 9,138 9.1% 25 – 29 34 22.8% 430.9 1 6.7% 12.7 0 0.0% 0.0 0 0.0% 0.0 7,890 7.8% 30 – 34 12 8.1% 172.0 3 20.0% 43.0 0 0.0% 0.0 0 0.0% 0.0 6,978 6.9% 35 – 44 6 4.0% 36.4 3 20.0% 18.2 0 0.0% 0.0 0 0.0% 0.0 16,499 16.4% 45 + 5 3.4% 15.8 1 6.7% 3.2 0 0.0% 0.0 0 0.0% 0.0 31,719 31.5% Not Specified 0 0.0% - 0 0.0% - 0 0.0% - 0 0.0% -
Gender & Race/Ethnicity Chlamydia Gonorrhea P&S Syphilis Early Latent Syphilis Population
Cases Percent1 Rate Cases Percent1 Rate Cases Percent1 Rate Cases Percent1 Rate Number Percent1
COUNTY TOTAL 656 100.0% 356.4 25 100.0% 13.6 0 100.0% 0.0 0 100.0% 0.0 189,675 100.0%
Female Total 506 77.1% 568.7 10 40.0% 11.2 0 0.0% 0.0 0 0.0% 0.0 88,975 46.9%American Indian/Alaska Native 7 3.7% 592.7 0 0.0% 0.0 0 0.0% 0.0 0 0.0% 0.0 1,181 1.3%Asian/Pacific Islander 2 1.1% 96.2 0 0.0% 0.0 0 0.0% 0.0 0 0.0% 0.0 2,078 2.3%Black/African-American 7 3.7% 400.7 3 33.3% 171.7 0 0.0% 0.0 0 0.0% 0.0 1,747 2.0%Latina/Hispanic 165 86.8% 234.3 6 66.7% 8.5 0 0.0% 0.0 0 0.0% 0.0 70,414 79.1%White 9 4.7% 68.8 0 0.0% 0.0 0 0.0% 0.0 0 0.0% 0.0 13,086 14.7%Other/Multi/Not Specified 316 62.5% - 1 10.0% - 0 0.0% - 0 0.0% - 469 0.5%Male Total 149 22.7% 148.0 15 60.0% 14.9 0 0.0% 0.0 0 0.0% 0.0 100,700 53.1%American Indian/Alaska Native 1 1.8% 81.2 0 0.0% 0.0 0 0.0% 0.0 0 0.0% 0.0 1,231 1.2%Asian/Pacific Islander 0 0.0% 0.0 0 0.0% 0.0 0 0.0% 0.0 0 0.0% 0.0 2,762 2.7%Black/African-American 3 5.3% 63.0 3 23.1% 63.0 0 0.0% 0.0 0 0.0% 0.0 4,764 4.7%Latina/Hispanic 49 86.0% 64.3 8 61.5% 10.5 0 0.0% 0.0 0 0.0% 0.0 76,186 75.7%White 4 7.0% 26.3 2 15.4% 13.1 0 0.0% 0.0 0 0.0% 0.0 15,236 15.1%Other/Multi/Not Specified 92 61.7% - 2 13.3% - 0 0.0% - 0 0.0% - 521 0.5%
California Local Health Jurisdiction STD Data Summaries, 2010 Provisional Data (July 2011)

1:100
Inyo County – Chlamydia, Gonorrhea, and P&S SyphilisRates by Age Group (2010), Race/Ethnicity (2010), and Year
0−9 10−14 15−19 20−24 25−29 30−34 35−44 45+
Age Group
0
500
1000
1500
Chlamydia
Nat. Am. A/PI Black Latino White
Race/Ethnicity*
0
100
200
300
400
500
600 Chlamydia
2001 2002 2003 2004 2005 2006 2007 2008 2009 2010
0
100
200
300
Year
Chlamydia
0−9 10−14 15−19 20−24 25−29 30−34 35−44 45+
Age Group
0
50
100
150
Gonorrhea
Nat. Am. A/PI Black Latino White
Race/Ethnicity*
0
20
40
60
80
100
120
Gonorrhea
2001 2002 2003 2004 2005 2006 2007 2008 2009 2010
0
10
20
30
40
Year
Gonorrhea
0−9 10−14 15−19 20−24 25−29 30−34 35−44 45+
Age Group
0
1 P&S Syphilis
Nat. Am. A/PI Black Latino White
Race/Ethnicity*
0
1 P&S Syphilis
2001 2002 2003 2004 2005 2006 2007 2008 2009 2010
Year
0
1 P&S Syphilis
Female Male Female Male
s Numbers suppressed for confidentiality* Race data may be missing for a substantial number of cases. See the 'Data Limitations' page for further information.
Note: Rates are per 100,000 population.Source: California Department of Public Health, STD Control Branch
California Local Health Jurisdiction STD Data Summaries, 2010 Provisional Data (July 2011)
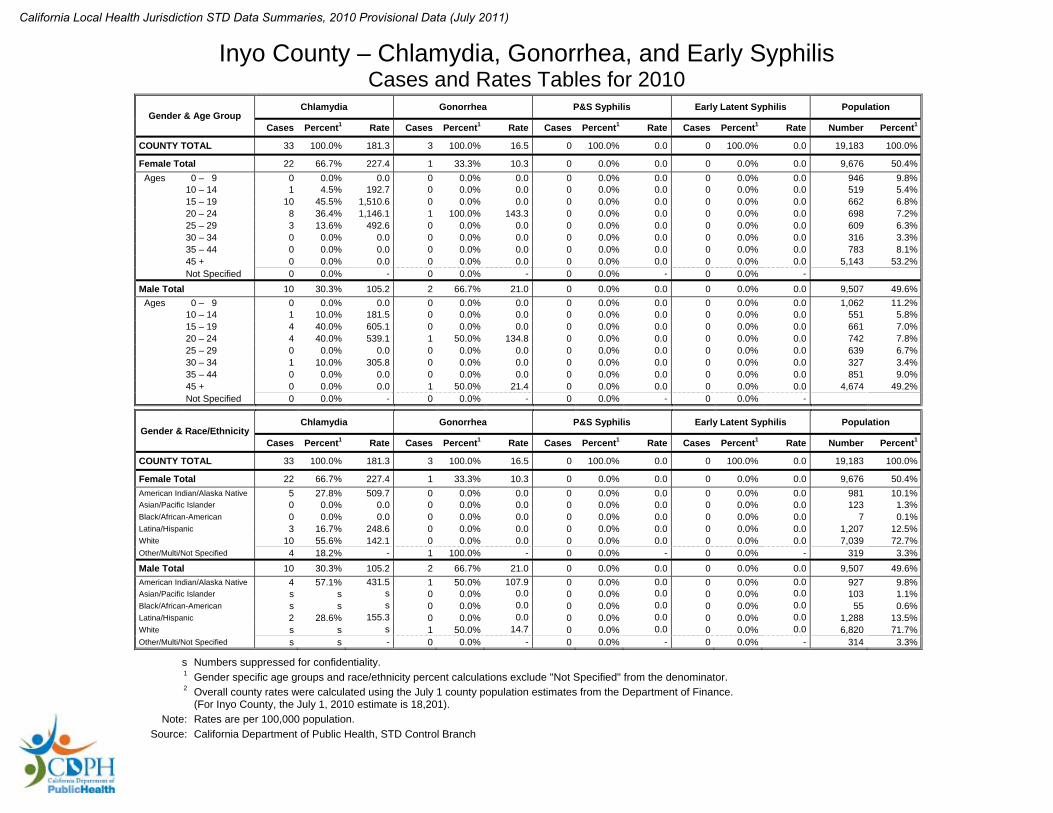
s Numbers suppressed for confidentiality. 1 Gender specific age groups and race/ethnicity percent calculations exclude "Not Specified" from the denominator. 2 Overall county rates were calculated using the July 1 county population estimates from the Department of Finance. (For Inyo County, the July 1, 2010 estimate is 18,201). Note: Rates are per 100,000 population. Source: California Department of Public Health, STD Control Branch
Inyo County – Chlamydia, Gonorrhea, and Early Syphilis Cases and Rates Tables for 2010
Gender & Age Group Chlamydia Gonorrhea P&S Syphilis Early Latent Syphilis Population
Cases Percent1 Rate Cases Percent1 Rate Cases Percent1 Rate Cases Percent1 Rate Number Percent1
COUNTY TOTAL 33 100.0% 181.3 3 100.0% 16.5 0 100.0% 0.0 0 100.0% 0.0 19,183 100.0%
Female Total 22 66.7% 227.4 1 33.3% 10.3 0 0.0% 0.0 0 0.0% 0.0 9,676 50.4% Ages 00 – 09 0 0.0% 0.0 0 0.0% 0.0 0 0.0% 0.0 0 0.0% 0.0 946 9.8% 10 – 14 1 4.5% 192.7 0 0.0% 0.0 0 0.0% 0.0 0 0.0% 0.0 519 5.4% 15 – 19 10 45.5% 1,510.6 0 0.0% 0.0 0 0.0% 0.0 0 0.0% 0.0 662 6.8% 20 – 24 8 36.4% 1,146.1 1 100.0% 143.3 0 0.0% 0.0 0 0.0% 0.0 698 7.2% 25 – 29 3 13.6% 492.6 0 0.0% 0.0 0 0.0% 0.0 0 0.0% 0.0 609 6.3% 30 – 34 0 0.0% 0.0 0 0.0% 0.0 0 0.0% 0.0 0 0.0% 0.0 316 3.3% 35 – 44 0 0.0% 0.0 0 0.0% 0.0 0 0.0% 0.0 0 0.0% 0.0 783 8.1% 45 + 0 0.0% 0.0 0 0.0% 0.0 0 0.0% 0.0 0 0.0% 0.0 5,143 53.2% Not Specified 0 0.0% - 0 0.0% - 0 0.0% - 0 0.0% -
Male Total 10 30.3% 105.2 2 66.7% 21.0 0 0.0% 0.0 0 0.0% 0.0 9,507 49.6% Ages 00 – 09 0 0.0% 0.0 0 0.0% 0.0 0 0.0% 0.0 0 0.0% 0.0 1,062 11.2% 10 – 14 1 10.0% 181.5 0 0.0% 0.0 0 0.0% 0.0 0 0.0% 0.0 551 5.8% 15 – 19 4 40.0% 605.1 0 0.0% 0.0 0 0.0% 0.0 0 0.0% 0.0 661 7.0% 20 – 24 4 40.0% 539.1 1 50.0% 134.8 0 0.0% 0.0 0 0.0% 0.0 742 7.8% 25 – 29 0 0.0% 0.0 0 0.0% 0.0 0 0.0% 0.0 0 0.0% 0.0 639 6.7% 30 – 34 1 10.0% 305.8 0 0.0% 0.0 0 0.0% 0.0 0 0.0% 0.0 327 3.4% 35 – 44 0 0.0% 0.0 0 0.0% 0.0 0 0.0% 0.0 0 0.0% 0.0 851 9.0% 45 + 0 0.0% 0.0 1 50.0% 21.4 0 0.0% 0.0 0 0.0% 0.0 4,674 49.2% Not Specified 0 0.0% - 0 0.0% - 0 0.0% - 0 0.0% -
Gender & Race/Ethnicity Chlamydia Gonorrhea P&S Syphilis Early Latent Syphilis Population
Cases Percent1 Rate Cases Percent1 Rate Cases Percent1 Rate Cases Percent1 Rate Number Percent1
COUNTY TOTAL 33 100.0% 181.3 3 100.0% 16.5 0 100.0% 0.0 0 100.0% 0.0 19,183 100.0%
Female Total 22 66.7% 227.4 1 33.3% 10.3 0 0.0% 0.0 0 0.0% 0.0 9,676 50.4%American Indian/Alaska Native 5 27.8% 509.7 0 0.0% 0.0 0 0.0% 0.0 0 0.0% 0.0 981 10.1%Asian/Pacific Islander 0 0.0% 0.0 0 0.0% 0.0 0 0.0% 0.0 0 0.0% 0.0 123 1.3%Black/African-American 0 0.0% 0.0 0 0.0% 0.0 0 0.0% 0.0 0 0.0% 0.0 7 0.1%Latina/Hispanic 3 16.7% 248.6 0 0.0% 0.0 0 0.0% 0.0 0 0.0% 0.0 1,207 12.5%White 10 55.6% 142.1 0 0.0% 0.0 0 0.0% 0.0 0 0.0% 0.0 7,039 72.7%Other/Multi/Not Specified 4 18.2% - 1 100.0% - 0 0.0% - 0 0.0% - 319 3.3%Male Total 10 30.3% 105.2 2 66.7% 21.0 0 0.0% 0.0 0 0.0% 0.0 9,507 49.6%American Indian/Alaska Native 4 57.1% 431.5 1 50.0% 107.9 0 0.0% 0.0 0 0.0% 0.0 927 9.8%Asian/Pacific Islander s s s 0 0.0% 0.0 0 0.0% 0.0 0 0.0% 0.0 103 1.1%Black/African-American s s s 0 0.0% 0.0 0 0.0% 0.0 0 0.0% 0.0 55 0.6%Latina/Hispanic 2 28.6% 155.3 0 0.0% 0.0 0 0.0% 0.0 0 0.0% 0.0 1,288 13.5%White s s s 1 50.0% 14.7 0 0.0% 0.0 0 0.0% 0.0 6,820 71.7%Other/Multi/Not Specified s s - 0 0.0% - 0 0.0% - 0 0.0% - 314 3.3%
California Local Health Jurisdiction STD Data Summaries, 2010 Provisional Data (July 2011)

1:100
Kern County – Chlamydia, Gonorrhea, and P&S SyphilisRates by Age Group (2010), Race/Ethnicity (2010), and Year
0−9 10−14 15−19 20−24 25−29 30−34 35−44 45+
Age Group
0
1000
2000
3000
Chlamydia
Nat. Am. A/PI Black Latino White
Race/Ethnicity*
0
500
1000
1500
2000
Chlamydia
2001 2002 2003 2004 2005 2006 2007 2008 2009 2010
0
200
400
600
800
Year
Chlamydia
0−9 10−14 15−19 20−24 25−29 30−34 35−44 45+
Age Group
0
100
200
300
400
500
Gonorrhea
Nat. Am. A/PI Black Latino White
Race/Ethnicity*
0
100
200
300
400
500
600
Gonorrhea
2001 2002 2003 2004 2005 2006 2007 2008 2009 2010
0
50
100
150
200
Year
Gonorrhea
0−9 10−14 15−19 20−24 25−29 30−34 35−44 45+
Age Group
0
5
10
15
20
P&S Syphilis
Nat. Am. A/PI Black Latino White
Race/Ethnicity*
0
5
10
15
20
25 P&S Syphilis
2001 2002 2003 2004 2005 2006 2007 2008 2009 2010
0
1
2
3
4
5
6
Year
P&S Syphilis
Female Male Female Male
* Race data may be missing for a substantial number of cases. See the 'Data Limitations' page for further information.Note: Rates are per 100,000 population.
Source: California Department of Public Health, STD Control Branch
California Local Health Jurisdiction STD Data Summaries, 2010 Provisional Data (July 2011)

1 Gender specific age groups and race/ethnicity percent calculations exclude "Not Specified" from the denominator. 2 Overall county rates were calculated using the July 1 county population estimates from the Department of Finance. (For Kern County, the July 1, 2010 estimate is 844,642). Note: Rates are per 100,000 population. Source: California Department of Public Health, STD Control Branch
Kern County – Chlamydia, Gonorrhea, and Early Syphilis Cases and Rates Tables for 2010
Gender & Age Group Chlamydia Gonorrhea P&S Syphilis Early Latent Syphilis Population
Cases Percent1 Rate Cases Percent1 Rate Cases Percent1 Rate Cases Percent1 Rate Number Percent1
COUNTY TOTAL 5,264 100.0% 623.2 970 100.0% 114.8 25 100.0% 3.0 17 100.0% 2.0 871,728 100.0%
Female Total 3,021 57.4% 710.0 530 54.6% 124.6 2 8.0% 0.5 0 0.0% 0.0 425,499 48.8% Ages 00 – 09 1 0.0% 1.4 2 0.4% 2.7 0 0.0% 0.0 0 0.0% 0.0 73,467 17.3% 10 – 14 34 1.1% 103.7 6 1.1% 18.3 0 0.0% 0.0 0 0.0% 0.0 32,800 7.7% 15 – 19 1,173 39.1% 3,267.3 147 27.9% 409.5 0 0.0% 0.0 0 0.0% 0.0 35,901 8.4% 20 – 24 1,074 35.8% 3,064.1 172 32.7% 490.7 1 50.0% 2.9 0 0.0% 0.0 35,051 8.2% 25 – 29 418 13.9% 1,244.2 85 16.2% 253.0 0 0.0% 0.0 0 0.0% 0.0 33,595 7.9% 30 – 34 158 5.3% 570.7 49 9.3% 177.0 0 0.0% 0.0 0 0.0% 0.0 27,685 6.5% 35 – 44 115 3.8% 221.3 47 8.9% 90.4 0 0.0% 0.0 0 0.0% 0.0 51,971 12.2% 45 + 30 1.0% 22.2 18 3.4% 13.3 1 50.0% 0.7 0 0.0% 0.0 135,029 31.7% Not Specified 18 0.6% - 4 0.8% - 0 0.0% - 0 0.0% -
Male Total 2,238 42.5% 501.5 440 45.4% 98.6 23 92.0% 5.2 17 100.0% 3.8 446,229 51.2% Ages 00 – 09 5 0.2% 6.6 0 0.0% 0.0 0 0.0% 0.0 0 0.0% 0.0 76,121 17.1% 10 – 14 2 0.1% 5.8 1 0.2% 2.9 0 0.0% 0.0 0 0.0% 0.0 34,342 7.7% 15 – 19 434 19.5% 1,128.8 74 17.0% 192.5 3 13.0% 7.8 1 5.9% 2.6 38,447 8.6% 20 – 24 957 42.9% 2,265.5 168 38.5% 397.7 4 17.4% 9.5 3 17.6% 7.1 42,243 9.5% 25 – 29 558 25.0% 1,361.4 80 18.3% 195.2 4 17.4% 9.8 2 11.8% 4.9 40,987 9.2% 30 – 34 160 7.2% 490.6 46 10.6% 141.0 6 26.1% 18.4 1 5.9% 3.1 32,613 7.3% 35 – 44 86 3.9% 162.2 33 7.6% 62.2 2 8.7% 3.8 8 47.1% 15.1 53,035 11.9% 45 + 27 1.2% 21.0 34 7.8% 26.5 4 17.4% 3.1 2 11.8% 1.6 128,441 28.8% Not Specified 9 0.4% - 4 0.9% - 0 0.0% - 0 0.0% -
Gender & Race/Ethnicity Chlamydia Gonorrhea P&S Syphilis Early Latent Syphilis Population
Cases Percent1 Rate Cases Percent1 Rate Cases Percent1 Rate Cases Percent1 Rate Number Percent1
COUNTY TOTAL 5,264 100.0% 623.2 970 100.0% 114.8 25 100.0% 3.0 17 100.0% 2.0 871,728 100.0%
Female Total 3,021 57.4% 710.0 530 54.6% 124.6 2 8.0% 0.5 0 0.0% 0.0 425,499 48.8%American Indian/Alaska Native 4 0.2% 109.8 1 0.2% 27.5 0 0.0% 0.0 0 0.0% 0.0 3,642 0.9%Asian/Pacific Islander 26 1.1% 154.4 4 1.0% 23.8 0 0.0% 0.0 0 0.0% 0.0 16,839 4.0%Black/African-American 394 17.4% 1,855.4 122 29.5% 574.5 1 50.0% 4.7 0 0.0% 0.0 21,235 5.0%Latina/Hispanic 1,407 62.0% 752.8 196 47.5% 104.9 0 0.0% 0.0 0 0.0% 0.0 186,890 43.9%White 437 19.3% 228.6 90 21.8% 47.1 1 50.0% 0.5 0 0.0% 0.0 191,205 44.9%Other/Multi/Not Specified 753 24.9% - 117 22.1% - 0 0.0% - 0 0.0% - 5,688 1.3%Male Total 2,238 42.5% 501.5 440 45.4% 98.6 23 92.0% 5.2 17 100.0% 3.8 446,229 51.2%American Indian/Alaska Native 3 0.2% 85.2 1 0.3% 28.4 0 0.0% 0.0 0 0.0% 0.0 3,520 0.8%Asian/Pacific Islander 8 0.5% 48.0 2 0.6% 12.0 0 0.0% 0.0 0 0.0% 0.0 16,651 3.7%Black/African-American 413 24.8% 1,503.6 142 39.2% 517.0 6 26.1% 21.8 4 23.5% 14.6 27,468 6.2%Latina/Hispanic 1,036 62.2% 501.2 146 40.3% 70.6 10 43.5% 4.8 7 41.2% 3.4 206,722 46.3%White 205 12.3% 110.2 71 19.6% 38.2 7 30.4% 3.8 6 35.3% 3.2 186,075 41.7%Other/Multi/Not Specified 573 25.6% - 78 17.7% - 0 0.0% - 0 0.0% - 5,793 1.3%
California Local Health Jurisdiction STD Data Summaries, 2010 Provisional Data (July 2011)
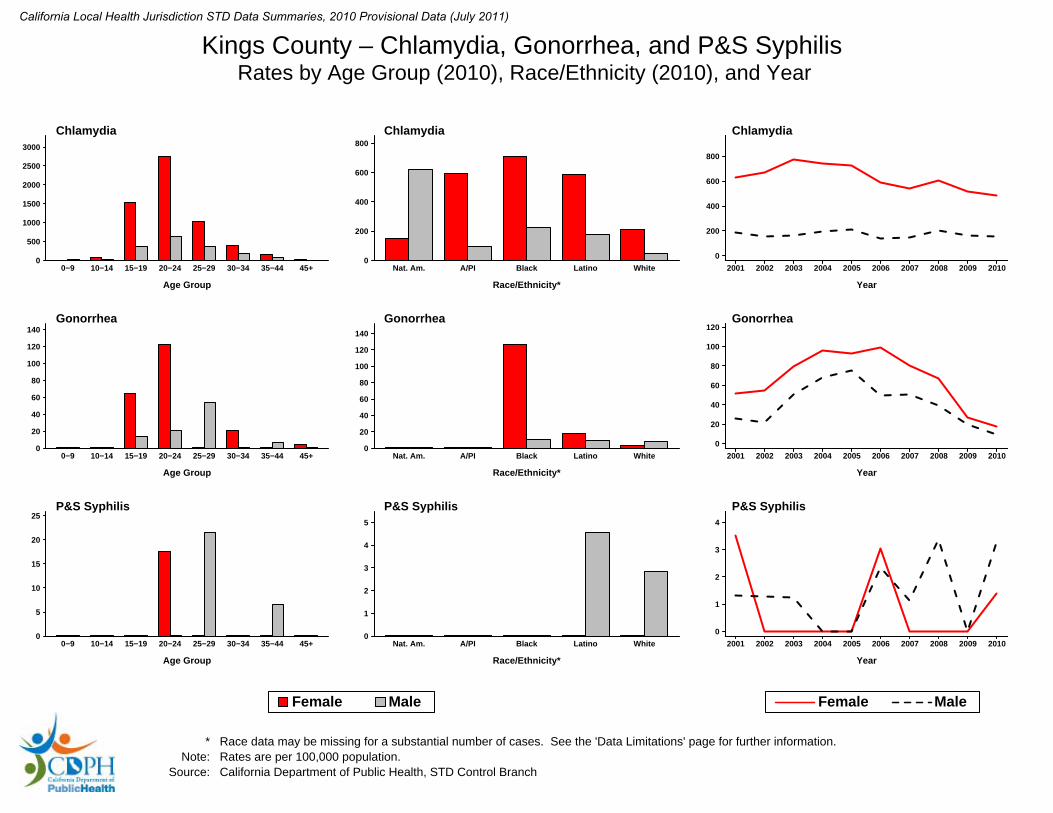
1:100
Kings County – Chlamydia, Gonorrhea, and P&S SyphilisRates by Age Group (2010), Race/Ethnicity (2010), and Year
0−9 10−14 15−19 20−24 25−29 30−34 35−44 45+
Age Group
0
500
1000
1500
2000
2500
3000
Chlamydia
Nat. Am. A/PI Black Latino White
Race/Ethnicity*
0
200
400
600
800 Chlamydia
2001 2002 2003 2004 2005 2006 2007 2008 2009 2010
0
200
400
600
800
Year
Chlamydia
0−9 10−14 15−19 20−24 25−29 30−34 35−44 45+
Age Group
0
20
40
60
80
100
120
140 Gonorrhea
Nat. Am. A/PI Black Latino White
Race/Ethnicity*
0
20
40
60
80
100
120
140
Gonorrhea
2001 2002 2003 2004 2005 2006 2007 2008 2009 2010
0
20
40
60
80
100
120
Year
Gonorrhea
0−9 10−14 15−19 20−24 25−29 30−34 35−44 45+
Age Group
0
5
10
15
20
25 P&S Syphilis
Nat. Am. A/PI Black Latino White
Race/Ethnicity*
0
1
2
3
4
5
P&S Syphilis
2001 2002 2003 2004 2005 2006 2007 2008 2009 2010
0
1
2
3
4
Year
P&S Syphilis
Female Male Female Male
* Race data may be missing for a substantial number of cases. See the 'Data Limitations' page for further information.Note: Rates are per 100,000 population.
Source: California Department of Public Health, STD Control Branch
California Local Health Jurisdiction STD Data Summaries, 2010 Provisional Data (July 2011)

1 Gender specific age groups and race/ethnicity percent calculations exclude "Not Specified" from the denominator. 2 Overall county rates were calculated using the July 1 county population estimates from the Department of Finance. (For Kings County, the July 1, 2010 estimate is 156,172). Note: Rates are per 100,000 population. Source: California Department of Public Health, STD Control Branch
Kings County – Chlamydia, Gonorrhea, and Early Syphilis Cases and Rates Tables for 2010
Gender & Age Group Chlamydia Gonorrhea P&S Syphilis Early Latent Syphilis Population
Cases Percent1 Rate Cases Percent1 Rate Cases Percent1 Rate Cases Percent1 Rate Number Percent1
COUNTY TOTAL 495 100.0% 317.0 22 100.0% 14.1 4 100.0% 2.6 1 100.0% 0.6 164,535 100.0%
Female Total 349 70.5% 481.8 13 59.1% 17.9 1 25.0% 1.4 0 0.0% 0.0 72,438 44.0% Ages 00 – 09 1 0.3% 7.7 0 0.0% 0.0 0 0.0% 0.0 0 0.0% 0.0 13,066 18.0% 10 – 14 4 1.1% 68.2 0 0.0% 0.0 0 0.0% 0.0 0 0.0% 0.0 5,863 8.1% 15 – 19 94 26.9% 1,521.5 4 30.8% 64.7 0 0.0% 0.0 0 0.0% 0.0 6,178 8.5% 20 – 24 157 45.0% 2,749.1 7 53.8% 122.6 1 100.0% 17.5 0 0.0% 0.0 5,711 7.9% 25 – 29 55 15.8% 1,017.4 0 0.0% 0.0 0 0.0% 0.0 0 0.0% 0.0 5,406 7.5% 30 – 34 18 5.2% 385.4 1 7.7% 21.4 0 0.0% 0.0 0 0.0% 0.0 4,671 6.4% 35 – 44 15 4.3% 157.6 0 0.0% 0.0 0 0.0% 0.0 0 0.0% 0.0 9,518 13.1% 45 + 5 1.4% 22.7 1 7.7% 4.5 0 0.0% 0.0 0 0.0% 0.0 22,025 30.4% Not Specified 0 0.0% - 0 0.0% - 0 0.0% - 0 0.0% -
Male Total 146 29.5% 158.5 9 40.9% 9.8 3 75.0% 3.3 1 100.0% 1.1 92,097 56.0% Ages 00 – 09 0 0.0% 0.0 0 0.0% 0.0 0 0.0% 0.0 0 0.0% 0.0 13,541 14.7% 10 – 14 1 0.7% 16.1 0 0.0% 0.0 0 0.0% 0.0 0 0.0% 0.0 6,218 6.8% 15 – 19 26 17.8% 360.8 1 11.1% 13.9 0 0.0% 0.0 0 0.0% 0.0 7,206 7.8% 20 – 24 59 40.4% 625.0 2 22.2% 21.2 0 0.0% 0.0 0 0.0% 0.0 9,440 10.3% 25 – 29 33 22.6% 356.1 5 55.6% 54.0 2 66.7% 21.6 0 0.0% 0.0 9,266 10.1% 30 – 34 16 11.0% 189.8 0 0.0% 0.0 0 0.0% 0.0 1 100.0% 11.9 8,432 9.2% 35 – 44 10 6.8% 65.2 1 11.1% 6.5 1 33.3% 6.5 0 0.0% 0.0 15,343 16.7% 45 + 1 0.7% 4.4 0 0.0% 0.0 0 0.0% 0.0 0 0.0% 0.0 22,651 24.6% Not Specified 0 0.0% - 0 0.0% - 0 0.0% - 0 0.0% -
Gender & Race/Ethnicity Chlamydia Gonorrhea P&S Syphilis Early Latent Syphilis Population
Cases Percent1 Rate Cases Percent1 Rate Cases Percent1 Rate Cases Percent1 Rate Number Percent1
COUNTY TOTAL 495 100.0% 317.0 22 100.0% 14.1 4 100.0% 2.6 1 100.0% 0.6 164,535 100.0%
Female Total 349 70.5% 481.8 13 59.1% 17.9 1 25.0% 1.4 0 0.0% 0.0 72,438 44.0%American Indian/Alaska Native 1 0.3% 150.2 0 0.0% 0.0 0 0.0% 0.0 0 0.0% 0.0 666 0.9%Asian/Pacific Islander 15 4.9% 591.0 0 0.0% 0.0 0 0.0% 0.0 0 0.0% 0.0 2,538 3.5%Black/African-American 28 9.1% 709.4 5 41.7% 126.7 0 0.0% 0.0 0 0.0% 0.0 3,947 5.4%Latina/Hispanic 202 65.4% 587.4 6 50.0% 17.4 0 0.0% 0.0 0 0.0% 0.0 34,387 47.5%White 63 20.4% 211.4 1 8.3% 3.4 0 0.0% 0.0 0 0.0% 0.0 29,806 41.1%Other/Multi/Not Specified 40 11.5% - 1 7.7% - 1 100.0% - 0 0.0% - 1,094 1.5%Male Total 146 29.5% 158.5 9 40.9% 9.8 3 75.0% 3.3 1 100.0% 1.1 92,097 56.0%American Indian/Alaska Native 5 4.1% 621.9 0 0.0% 0.0 0 0.0% 0.0 0 0.0% 0.0 804 0.9%Asian/Pacific Islander 2 1.6% 92.0 0 0.0% 0.0 0 0.0% 0.0 0 0.0% 0.0 2,175 2.4%Black/African-American 21 17.1% 226.6 1 12.5% 10.8 0 0.0% 0.0 0 0.0% 0.0 9,266 10.1%Latina/Hispanic 78 63.4% 178.3 4 50.0% 9.1 2 66.7% 4.6 1 100.0% 2.3 43,752 47.5%White 17 13.8% 48.5 3 37.5% 8.6 1 33.3% 2.9 0 0.0% 0.0 35,027 38.0%Other/Multi/Not Specified 23 15.8% - 1 11.1% - 0 0.0% - 0 0.0% - 1,073 1.2%
California Local Health Jurisdiction STD Data Summaries, 2010 Provisional Data (July 2011)

1:100
Lake County – Chlamydia, Gonorrhea, and P&S SyphilisRates by Age Group (2010), Race/Ethnicity (2010), and Year
0−9 10−14 15−19 20−24 25−29 30−34 35−44 45+
Age Group
0
500
1000
1500
2000
2500
3000
Chlamydia
Nat. Am. A/PI Black Latino White
Race/Ethnicity*
0
200
400
600
800
1000
1200
Chlamydia
2001 2002 2003 2004 2005 2006 2007 2008 2009 2010
0
100
200
300
400
Year
Chlamydia
0−9 10−14 15−19 20−24 25−29 30−34 35−44 45+
Age Group
0
100
200
300
400 Gonorrhea
Nat. Am. A/PI Black Latino White
Race/Ethnicity*
0
100
200
300
400
500
600
700
Gonorrhea
2001 2002 2003 2004 2005 2006 2007 2008 2009 2010
0
20
40
60
Year
Gonorrhea
0−9 10−14 15−19 20−24 25−29 30−34 35−44 45+
Age Group
0
5
10
15
20
25
30
P&S Syphilis
Nat. Am. A/PI Black Latino White
Race/Ethnicity*
0
5
10
15
20 P&S Syphilis
2001 2002 2003 2004 2005 2006 2007 2008 2009 2010
0
2
4
6
8
10
Year
P&S Syphilis
Female Male Female Male
* Race data may be missing for a substantial number of cases. See the 'Data Limitations' page for further information.Note: Rates are per 100,000 population.
Source: California Department of Public Health, STD Control Branch
California Local Health Jurisdiction STD Data Summaries, 2010 Provisional Data (July 2011)

1 Gender specific age groups and race/ethnicity percent calculations exclude "Not Specified" from the denominator. 2 Overall county rates were calculated using the July 1 county population estimates from the Department of Finance. (For Lake County, the July 1, 2010 estimate is 64,508). Note: Rates are per 100,000 population. Source: California Department of Public Health, STD Control Branch
Lake County – Chlamydia, Gonorrhea, and Early Syphilis Cases and Rates Tables for 2010
Gender & Age Group Chlamydia Gonorrhea P&S Syphilis Early Latent Syphilis Population
Cases Percent1 Rate Cases Percent1 Rate Cases Percent1 Rate Cases Percent1 Rate Number Percent1
COUNTY TOTAL 173 100.0% 268.2 28 100.0% 43.4 3 100.0% 4.7 0 100.0% 0.0 67,530 100.0%
Female Total 130 75.1% 382.6 17 60.7% 50.0 0 0.0% 0.0 0 0.0% 0.0 33,981 50.3% Ages 00 – 09 0 0.0% 0.0 0 0.0% 0.0 0 0.0% 0.0 0 0.0% 0.0 3,596 10.6% 10 – 14 2 1.5% 132.6 0 0.0% 0.0 0 0.0% 0.0 0 0.0% 0.0 1,508 4.4% 15 – 19 53 40.8% 2,668.7 3 17.6% 151.1 0 0.0% 0.0 0 0.0% 0.0 1,986 5.8% 20 – 24 55 42.3% 2,444.4 7 41.2% 311.1 0 0.0% 0.0 0 0.0% 0.0 2,250 6.6% 25 – 29 14 10.8% 885.5 5 29.4% 316.3 0 0.0% 0.0 0 0.0% 0.0 1,581 4.7% 30 – 34 4 3.1% 354.3 2 11.8% 177.1 0 0.0% 0.0 0 0.0% 0.0 1,129 3.3% 35 – 44 1 0.8% 26.1 0 0.0% 0.0 0 0.0% 0.0 0 0.0% 0.0 3,830 11.3% 45 + 1 0.8% 5.5 0 0.0% 0.0 0 0.0% 0.0 0 0.0% 0.0 18,101 53.3% Not Specified 0 0.0% - 0 0.0% - 0 0.0% - 0 0.0% -
Male Total 43 24.9% 128.2 11 39.3% 32.8 3 100.0% 8.9 0 0.0% 0.0 33,549 49.7% Ages 00 – 09 0 0.0% 0.0 0 0.0% 0.0 0 0.0% 0.0 0 0.0% 0.0 3,802 11.3% 10 – 14 0 0.0% 0.0 0 0.0% 0.0 0 0.0% 0.0 0 0.0% 0.0 1,664 5.0% 15 – 19 9 20.9% 391.5 2 18.2% 87.0 0 0.0% 0.0 0 0.0% 0.0 2,299 6.9% 20 – 24 20 46.5% 838.9 3 27.3% 125.8 0 0.0% 0.0 0 0.0% 0.0 2,384 7.1% 25 – 29 6 14.0% 340.7 6 54.5% 340.7 0 0.0% 0.0 0 0.0% 0.0 1,761 5.2% 30 – 34 5 11.6% 435.5 0 0.0% 0.0 0 0.0% 0.0 0 0.0% 0.0 1,148 3.4% 35 – 44 3 7.0% 87.1 0 0.0% 0.0 1 33.3% 29.0 0 0.0% 0.0 3,446 10.3% 45 + 0 0.0% 0.0 0 0.0% 0.0 2 66.7% 11.7 0 0.0% 0.0 17,045 50.8% Not Specified 0 0.0% - 0 0.0% - 0 0.0% - 0 0.0% -
Gender & Race/Ethnicity Chlamydia Gonorrhea P&S Syphilis Early Latent Syphilis Population
Cases Percent1 Rate Cases Percent1 Rate Cases Percent1 Rate Cases Percent1 Rate Number Percent1
COUNTY TOTAL 173 100.0% 268.2 28 100.0% 43.4 3 100.0% 4.7 0 100.0% 0.0 67,530 100.0%
Female Total 130 75.1% 382.6 17 60.7% 50.0 0 0.0% 0.0 0 0.0% 0.0 33,981 50.3%American Indian/Alaska Native 3 3.6% 336.7 1 6.7% 112.2 0 0.0% 0.0 0 0.0% 0.0 891 2.6%Asian/Pacific Islander 2 2.4% 537.6 1 6.7% 268.8 0 0.0% 0.0 0 0.0% 0.0 372 1.1%Black/African-American 7 8.3% 1,147.5 0 0.0% 0.0 0 0.0% 0.0 0 0.0% 0.0 610 1.8%Latina/Hispanic 24 28.6% 460.6 6 40.0% 115.1 0 0.0% 0.0 0 0.0% 0.0 5,211 15.3%White 48 57.1% 184.8 7 46.7% 26.9 0 0.0% 0.0 0 0.0% 0.0 25,980 76.5%Other/Multi/Not Specified 46 35.4% - 2 11.8% - 0 0.0% - 0 0.0% - 917 2.7%Male Total 43 24.9% 128.2 11 39.3% 32.8 3 100.0% 8.9 0 0.0% 0.0 33,549 49.7%American Indian/Alaska Native 1 3.7% 118.2 0 0.0% 0.0 0 0.0% 0.0 0 0.0% 0.0 846 2.5%Asian/Pacific Islander 0 0.0% 0.0 1 11.1% 354.6 0 0.0% 0.0 0 0.0% 0.0 282 0.8%Black/African-American 6 22.2% 953.9 4 44.4% 635.9 0 0.0% 0.0 0 0.0% 0.0 629 1.9%Latina/Hispanic 4 14.8% 70.6 0 0.0% 0.0 1 33.3% 17.6 0 0.0% 0.0 5,667 16.9%White 16 59.3% 63.3 4 44.4% 15.8 2 66.7% 7.9 0 0.0% 0.0 25,275 75.3%Other/Multi/Not Specified 16 37.2% - 2 18.2% - 0 0.0% - 0 0.0% - 850 2.5%
California Local Health Jurisdiction STD Data Summaries, 2010 Provisional Data (July 2011)

1:100
Lassen County – Chlamydia, Gonorrhea, and P&S SyphilisRates by Age Group (2010), Race/Ethnicity (2010), and Year
0−9 10−14 15−19 20−24 25−29 30−34 35−44 45+
Age Group
0
500
1000
1500
Chlamydia
Nat. Am. A/PI Black Latino White
Race/Ethnicity*
0
100
200
300
400
500 Chlamydia
2001 2002 2003 2004 2005 2006 2007 2008 2009 2010
0
50
100
150
200
250
300
Year
Chlamydia
0−9 10−14 15−19 20−24 25−29 30−34 35−44 45+
Age Group
0
1 Gonorrhea
Nat. Am. A/PI Black Latino White
Race/Ethnicity*
0
1 Gonorrhea
2001 2002 2003 2004 2005 2006 2007 2008 2009 2010
0
10
20
30
40
50
Year
Gonorrhea
0−9 10−14 15−19 20−24 25−29 30−34 35−44 45+
Age Group
0
1 P&S Syphilis
Nat. Am. A/PI Black Latino White
Race/Ethnicity*
0
1 P&S Syphilis
2001 2002 2003 2004 2005 2006 2007 2008 2009 2010
0
1
2
3
4
5
Year
P&S Syphilis
Female Male Female Male
* Race data may be missing for a substantial number of cases. See the 'Data Limitations' page for further information.Note: Rates are per 100,000 population.
Source: California Department of Public Health, STD Control Branch
California Local Health Jurisdiction STD Data Summaries, 2010 Provisional Data (July 2011)

1 Gender specific age groups and race/ethnicity percent calculations exclude "Not Specified" from the denominator. 2 Overall county rates were calculated using the July 1 county population estimates from the Department of Finance. (For Lassen County, the July 1, 2010 estimate is 35,794). Note: Rates are per 100,000 population. Source: California Department of Public Health, STD Control Branch
Lassen County – Chlamydia, Gonorrhea, and Early Syphilis Cases and Rates Tables for 2010
Gender & Age Group Chlamydia Gonorrhea P&S Syphilis Early Latent Syphilis Population
Cases Percent1 Rate Cases Percent1 Rate Cases Percent1 Rate Cases Percent1 Rate Number Percent1
COUNTY TOTAL 71 100.0% 198.4 0 100.0% 0.0 0 100.0% 0.0 0 100.0% 0.0 37,918 100.0%
Female Total 28 39.4% 192.8 0 0.0% 0.0 0 0.0% 0.0 0 0.0% 0.0 14,526 38.3% Ages 00 – 09 0 0.0% 0.0 0 0.0% 0.0 0 0.0% 0.0 0 0.0% 0.0 1,557 10.7% 10 – 14 0 0.0% 0.0 0 0.0% 0.0 0 0.0% 0.0 0 0.0% 0.0 965 6.6% 15 – 19 15 53.6% 1,357.5 0 0.0% 0.0 0 0.0% 0.0 0 0.0% 0.0 1,105 7.6% 20 – 24 5 17.9% 421.2 0 0.0% 0.0 0 0.0% 0.0 0 0.0% 0.0 1,187 8.2% 25 – 29 5 17.9% 481.2 0 0.0% 0.0 0 0.0% 0.0 0 0.0% 0.0 1,039 7.2% 30 – 34 3 10.7% 497.5 0 0.0% 0.0 0 0.0% 0.0 0 0.0% 0.0 603 4.2% 35 – 44 0 0.0% 0.0 0 0.0% 0.0 0 0.0% 0.0 0 0.0% 0.0 1,608 11.1% 45 + 0 0.0% 0.0 0 0.0% 0.0 0 0.0% 0.0 0 0.0% 0.0 6,462 44.5% Not Specified 0 0.0% - 0 0.0% - 0 0.0% - 0 0.0% -
Male Total 43 60.6% 183.8 0 0.0% 0.0 0 0.0% 0.0 0 0.0% 0.0 23,392 61.7% Ages 00 – 09 0 0.0% 0.0 0 0.0% 0.0 0 0.0% 0.0 0 0.0% 0.0 1,821 7.8% 10 – 14 0 0.0% 0.0 0 0.0% 0.0 0 0.0% 0.0 0 0.0% 0.0 1,049 4.5% 15 – 19 2 4.7% 131.1 0 0.0% 0.0 0 0.0% 0.0 0 0.0% 0.0 1,526 6.5% 20 – 24 21 48.8% 735.0 0 0.0% 0.0 0 0.0% 0.0 0 0.0% 0.0 2,857 12.2% 25 – 29 9 20.9% 339.4 0 0.0% 0.0 0 0.0% 0.0 0 0.0% 0.0 2,652 11.3% 30 – 34 5 11.6% 223.2 0 0.0% 0.0 0 0.0% 0.0 0 0.0% 0.0 2,240 9.6% 35 – 44 4 9.3% 101.3 0 0.0% 0.0 0 0.0% 0.0 0 0.0% 0.0 3,950 16.9% 45 + 2 4.7% 27.4 0 0.0% 0.0 0 0.0% 0.0 0 0.0% 0.0 7,297 31.2% Not Specified 0 0.0% - 0 0.0% - 0 0.0% - 0 0.0% -
Gender & Race/Ethnicity Chlamydia Gonorrhea P&S Syphilis Early Latent Syphilis Population
Cases Percent1 Rate Cases Percent1 Rate Cases Percent1 Rate Cases Percent1 Rate Number Percent1
COUNTY TOTAL 71 100.0% 198.4 0 100.0% 0.0 0 100.0% 0.0 0 100.0% 0.0 37,918 100.0%
Female Total 28 39.4% 192.8 0 0.0% 0.0 0 0.0% 0.0 0 0.0% 0.0 14,526 38.3%American Indian/Alaska Native 2 8.7% 422.8 0 0.0% 0.0 0 0.0% 0.0 0 0.0% 0.0 473 3.3%Asian/Pacific Islander 0 0.0% 0.0 0 0.0% 0.0 0 0.0% 0.0 0 0.0% 0.0 226 1.6%Black/African-American 0 0.0% 0.0 0 0.0% 0.0 0 0.0% 0.0 0 0.0% 0.0 178 1.2%Latina/Hispanic 3 13.0% 216.0 0 0.0% 0.0 0 0.0% 0.0 0 0.0% 0.0 1,389 9.6%White 18 78.3% 151.5 0 0.0% 0.0 0 0.0% 0.0 0 0.0% 0.0 11,880 81.8%Other/Multi/Not Specified 5 17.9% - 0 0.0% - 0 0.0% - 0 0.0% - 380 2.6%Male Total 43 60.6% 183.8 0 0.0% 0.0 0 0.0% 0.0 0 0.0% 0.0 23,392 61.7%American Indian/Alaska Native 1 3.8% 172.4 0 0.0% 0.0 0 0.0% 0.0 0 0.0% 0.0 580 2.5%Asian/Pacific Islander 0 0.0% 0.0 0 0.0% 0.0 0 0.0% 0.0 0 0.0% 0.0 275 1.2%Black/African-American 4 15.4% 132.4 0 0.0% 0.0 0 0.0% 0.0 0 0.0% 0.0 3,021 12.9%Latina/Hispanic 2 7.7% 51.7 0 0.0% 0.0 0 0.0% 0.0 0 0.0% 0.0 3,870 16.5%White 19 73.1% 124.8 0 0.0% 0.0 0 0.0% 0.0 0 0.0% 0.0 15,224 65.1%Other/Multi/Not Specified 17 39.5% - 0 0.0% - 0 0.0% - 0 0.0% - 422 1.8%
California Local Health Jurisdiction STD Data Summaries, 2010 Provisional Data (July 2011)

1:100
Long Beach City – Chlamydia, Gonorrhea, and P&S SyphilisRates by Age Group (2010), Race/Ethnicity (2010), and Year
0−9 10−14 15−19 20−24 25−29 30−34 35−44 45+
Age Group
0
1000
2000
3000
4000 Chlamydia
Nat. Am. A/PI Black Latino White
Race/Ethnicity*
0
500
1000
1500 Chlamydia
2001 2002 2003 2004 2005 2006 2007 2008 2009 2010
0
200
400
600
800
1000
Year
Chlamydia
0−9 10−14 15−19 20−24 25−29 30−34 35−44 45+
Age Group
0
100
200
300
400 Gonorrhea
Nat. Am. A/PI Black Latino White
Race/Ethnicity*
0
50
100
150
200
250
300 Gonorrhea
2001 2002 2003 2004 2005 2006 2007 2008 2009 2010
0
50
100
150
200
Year
Gonorrhea
0−9 10−14 15−19 20−24 25−29 30−34 35−44 45+
Age Group
0
10
20
30
40
50 P&S Syphilis
Nat. Am. A/PI Black Latino White
Race/Ethnicity*
0
10
20
30
40 P&S Syphilis
2001 2002 2003 2004 2005 2006 2007 2008 2009 2010
0
10
20
30
40
Year
P&S Syphilis
Female Male Female Male
* Race data may be missing for a substantial number of cases. See the 'Data Limitations' page for further information.Note: Rates are per 100,000 population.
Source: California Department of Public Health, STD Control Branch
California Local Health Jurisdiction STD Data Summaries, 2010 Provisional Data (July 2011)

1 Gender specific age groups and race/ethnicity percent calculations exclude "Not Specified" from the denominator. 2 Total city population was calculated by multiplying the July 1 county population estimate by the January 1 (E-1) city to county ratio from the Department of Finance.
Census 2000 gender/age/race distribution percentages were then applied to this total. Note: Rates are per 100,000 population. Source: California Department of Public Health, STD Control Branch
Long Beach City – Chlamydia, Gonorrhea, and Early Syphilis Cases and Rates Tables for 2010
Gender & Age Group Chlamydia Gonorrhea P&S Syphilis Early Latent Syphilis Population
Cases Percent1 Rate Cases Percent1 Rate Cases Percent1 Rate Cases Percent1 Rate Number Percent1
CITY TOTAL 2,644 100.0% 536.0 444 100.0% 90.0 47 100.0% 9.5 37 100.0% 7.5 493,257 100.0%
Female Total 1,915 72.4% 763.1 175 39.4% 69.7 0 0.0% 0.0 2 5.4% 0.8 250,949 50.9% Ages 00 – 09 1 0.1% 2.4 0 0.0% 0.0 0 0.0% 0.0 0 0.0% 0.0 41,893 16.7% 10 – 14 18 0.9% 97.2 0 0.0% 0.0 0 0.0% 0.0 0 0.0% 0.0 18,511 7.4% 15 – 19 631 33.1% 3,498.4 43 24.7% 238.4 0 0.0% 0.0 0 0.0% 0.0 18,037 7.2% 20 – 24 690 36.2% 3,481.2 67 38.5% 338.0 0 0.0% 0.0 0 0.0% 0.0 19,821 7.9% 25 – 29 320 16.8% 1,493.2 32 18.4% 149.3 0 0.0% 0.0 0 0.0% 0.0 21,430 8.5% 30 – 34 132 6.9% 615.7 14 8.0% 65.3 0 0.0% 0.0 0 0.0% 0.0 21,440 8.5% 35 – 44 80 4.2% 208.7 13 7.5% 33.9 0 0.0% 0.0 1 50.0% 2.6 38,330 15.3% 45 + 35 1.8% 49.0 5 2.9% 7.0 0 0.0% 0.0 1 50.0% 1.4 71,486 28.5% Not Specified 8 0.4% - 1 0.6% - 0 0.0% - 0 0.0% -
Male Total 720 27.2% 297.1 268 60.4% 110.6 47 100.0% 19.4 35 94.6% 14.4 242,307 49.1% Ages 00 – 09 0 0.0% 0.0 0 0.0% 0.0 0 0.0% 0.0 0 0.0% 0.0 43,539 18.0% 10 – 14 4 0.6% 20.4 2 0.7% 10.2 0 0.0% 0.0 0 0.0% 0.0 19,581 8.1% 15 – 19 129 18.1% 724.3 32 11.9% 179.7 2 4.3% 11.2 0 0.0% 0.0 17,811 7.4% 20 – 24 227 31.8% 1,239.8 56 20.9% 305.8 5 10.6% 27.3 0 0.0% 0.0 18,310 7.6% 25 – 29 151 21.2% 741.9 51 19.0% 250.6 9 19.1% 44.2 2 5.7% 9.8 20,352 8.4% 30 – 34 77 10.8% 353.4 37 13.8% 169.8 6 12.8% 27.5 3 8.6% 13.8 21,789 9.0% 35 – 44 81 11.4% 207.8 51 19.0% 130.8 15 31.9% 38.5 15 42.9% 38.5 38,986 16.1% 45 + 44 6.2% 71.0 39 14.6% 63.0 10 21.3% 16.1 15 42.9% 24.2 61,939 25.6% Not Specified 7 1.0% - 0 0.0% - 0 0.0% - 0 0.0% -
Gender & Race/Ethnicity Chlamydia Gonorrhea P&S Syphilis Early Latent Syphilis Population
Cases Percent1 Rate Cases Percent1 Rate Cases Percent1 Rate Cases Percent1 Rate Number Percent1
CITY TOTAL 2,644 100.0% 536.0 444 100.0% 90.0 47 100.0% 9.5 37 100.0% 7.5 493,257 100.0%
Female Total 1,915 72.4% 763.1 175 39.4% 69.7 0 0.0% 0.0 2 5.4% 0.8 250,949 50.9%American Indian/Alaska Native 1 0.1% 103.5 0 0.0% 0.0 0 0.0% 0.0 0 0.0% 0.0 966 0.4%Asian/Pacific Islander 91 6.9% 266.4 1 0.8% 2.9 0 0.0% 0.0 0 0.0% 0.0 34,161 13.6%Black/African-American 508 38.5% 1,320.4 68 54.8% 176.7 0 0.0% 0.0 0 0.0% 0.0 38,473 15.3%Latina/Hispanic 585 44.3% 675.6 36 29.0% 41.6 0 0.0% 0.0 1 50.0% 1.2 86,584 34.5%White 136 10.3% 164.1 19 15.3% 22.9 0 0.0% 0.0 1 50.0% 1.2 82,856 33.0%Other/Multi/Not Specified 594 31.0% - 51 29.1% - 0 0.0% - 0 0.0% - 7,910 3.2%Male Total 720 27.2% 297.1 268 60.4% 110.6 47 100.0% 19.4 35 94.6% 14.4 242,307 49.1%American Indian/Alaska Native 3 0.6% 323.3 0 0.0% 0.0 0 0.0% 0.0 0 0.0% 0.0 928 0.4%Asian/Pacific Islander 30 6.1% 99.0 11 5.8% 36.3 2 4.3% 6.6 1 2.9% 3.3 30,316 12.5%Black/African-American 187 38.1% 567.4 83 43.7% 251.8 11 23.9% 33.4 7 20.0% 21.2 32,958 13.6%Latina/Hispanic 203 41.3% 225.9 57 30.0% 63.4 12 26.1% 13.4 12 34.3% 13.4 89,860 37.1%White 68 13.8% 84.4 39 20.5% 48.4 21 45.7% 26.1 15 42.9% 18.6 80,557 33.2%Other/Multi/Not Specified 229 31.8% - 78 29.1% - 1 2.1% - 0 0.0% - 7,688 3.2%
California Local Health Jurisdiction STD Data Summaries, 2010 Provisional Data (July 2011)

1:100
Los Angeles County – Chlamydia, Gonorrhea, and P&S SyphilisRates by Age Group (2010), Race/Ethnicity (2010), and Year
0−9 10−14 15−19 20−24 25−29 30−34 35−44 45+
Age Group
0
1000
2000
3000
Chlamydia
Nat. Am. A/PI Black Latino White
Race/Ethnicity*
0
500
1000
1500
Chlamydia
2001 2002 2003 2004 2005 2006 2007 2008 2009 2010
0
200
400
600
Year
Chlamydia
0−9 10−14 15−19 20−24 25−29 30−34 35−44 45+
Age Group
0
100
200
300
400
Gonorrhea
Nat. Am. A/PI Black Latino White
Race/Ethnicity*
0
100
200
300
400
500
600 Gonorrhea
2001 2002 2003 2004 2005 2006 2007 2008 2009 2010
0
50
100
150
Year
Gonorrhea
0−9 10−14 15−19 20−24 25−29 30−34 35−44 45+
Age Group
0
10
20
30
40 P&S Syphilis
Nat. Am. A/PI Black Latino White
Race/Ethnicity*
0
5
10
15
20
25
30
P&S Syphilis
2001 2002 2003 2004 2005 2006 2007 2008 2009 2010
0
5
10
15
20
Year
P&S Syphilis
Female Male Female Male
* Race data may be missing for a substantial number of cases. See the 'Data Limitations' page for further information.Note: Rates are per 100,000 population. Los Angeles County includes Long Beach & Pasadena City Health Jurisdiction
Source: California Department of Public Health, STD Control Branch
California Local Health Jurisdiction STD Data Summaries, 2010 Provisional Data (July 2011)

1 Gender specific age groups and race/ethnicity percent calculations exclude "Not Specified" from the denominator. 2 Overall county rates were calculated using the July 1 county population estimates from the Department of Finance. (For Los Angeles County, the July 1, 2010 estimate is 10,473,535). Note: Rates are per 100,000 population. Source: California Department of Public Health, STD Control Branch
Los Angeles County – Chlamydia, Gonorrhea, and Early Syphilis Cases and Rates Tables for 2010
Gender & Age Group Chlamydia Gonorrhea P&S Syphilis Early Latent Syphilis Population
Cases Percent1 Rate Cases Percent1 Rate Cases Percent1 Rate Cases Percent1 Rate Number Percent1
COUNTY TOTAL 47,694 100.0% 455.4 10,022 100.0% 95.7 690 100.0% 6.6 963 100.0% 9.2 10,514,663 100.0%
Female Total 31,596 66.2% 595.9 3,597 35.9% 67.8 13 1.9% 0.2 70 7.3% 1.3 5,301,941 50.4% Ages 00 – 09 3 0.0% 0.4 4 0.1% 0.6 0 0.0% 0.0 0 0.0% 0.0 713,292 13.5% 10 – 14 278 0.9% 76.6 50 1.4% 13.8 0 0.0% 0.0 0 0.0% 0.0 362,964 6.8% 15 – 19 9,634 30.5% 2,253.8 1,001 27.9% 234.2 0 0.0% 0.0 12 17.1% 2.8 427,460 8.1% 20 – 24 12,202 38.7% 3,268.4 1,255 35.0% 336.2 0 0.0% 0.0 11 15.7% 2.9 373,333 7.0% 25 – 29 5,035 16.0% 1,477.6 619 17.2% 181.7 3 23.1% 0.9 9 12.9% 2.6 340,765 6.4% 30 – 34 2,205 7.0% 668.2 312 8.7% 94.5 2 15.4% 0.6 8 11.4% 2.4 329,996 6.2% 35 – 44 1,630 5.2% 217.4 245 6.8% 32.7 4 30.8% 0.5 16 22.9% 2.1 749,680 14.1% 45 + 552 1.8% 27.5 103 2.9% 5.1 4 30.8% 0.2 14 20.0% 0.7 2,004,451 37.8% Not Specified 57 0.2% - 8 0.2% - 0 0.0% - 0 0.0% -
Male Total 15,941 33.4% 305.8 6,377 63.6% 122.3 677 98.1% 13.0 893 92.7% 17.1 5,212,722 49.6% Ages 00 – 09 3 0.0% 0.4 0 0.0% 0.0 0 0.0% 0.0 0 0.0% 0.0 742,235 14.2% 10 – 14 60 0.4% 15.8 9 0.1% 2.4 1 0.1% 0.3 0 0.0% 0.0 379,964 7.3% 15 – 19 2,996 18.8% 669.3 719 11.3% 160.6 28 4.1% 6.3 14 1.6% 3.1 447,655 8.6% 20 – 24 5,012 31.5% 1,287.4 1,503 23.6% 386.1 91 13.5% 23.4 89 10.0% 22.9 389,315 7.5% 25 – 29 3,270 20.6% 944.6 1,372 21.6% 396.3 118 17.5% 34.1 128 14.3% 37.0 346,170 6.6% 30 – 34 1,742 10.9% 545.3 844 13.3% 264.2 107 15.9% 33.5 120 13.5% 37.6 319,473 6.1% 35 – 44 1,869 11.7% 239.6 1,186 18.6% 152.0 202 29.9% 25.9 308 34.5% 39.5 780,055 15.0% 45 + 957 6.0% 52.9 728 11.4% 40.3 128 19.0% 7.1 233 26.1% 12.9 1,807,855 34.7% Not Specified 32 0.2% - 16 0.3% - 2 0.3% - 1 0.1% -
Gender & Race/Ethnicity Chlamydia Gonorrhea P&S Syphilis Early Latent Syphilis Population
Cases Percent1 Rate Cases Percent1 Rate Cases Percent1 Rate Cases Percent1 Rate Number Percent1
COUNTY TOTAL 47,694 100.0% 455.4 10,022 100.0% 95.7 690 100.0% 6.6 963 100.0% 9.2 10,514,663 100.0%
Female Total 31,596 66.2% 595.9 3,597 35.9% 67.8 13 1.9% 0.2 70 7.3% 1.3 5,301,941 50.4%American Indian/Alaska Native 32 0.1% 200.4 5 0.2% 31.3 0 0.0% 0.0 0 0.0% 0.0 15,971 0.3%Asian/Pacific Islander 1,156 4.6% 153.3 94 2.9% 12.5 0 0.0% 0.0 4 5.7% 0.5 753,911 14.2%Black/African-American 7,828 31.3% 1,661.6 1,732 54.2% 367.6 4 33.3% 0.8 23 32.9% 4.9 471,126 8.9%Latina/Hispanic 13,273 53.1% 530.0 864 27.0% 34.5 7 58.3% 0.3 38 54.3% 1.5 2,504,195 47.2%White 2,711 10.8% 185.4 502 15.7% 34.3 1 8.3% 0.1 5 7.1% 0.3 1,462,547 27.6%Other/Multi/Not Specified 6,596 20.9% - 400 11.1% - 1 7.7% - 0 0.0% - 94,191 1.8%Male Total 15,941 33.4% 305.8 6,377 63.6% 122.3 677 98.1% 13.0 893 92.7% 17.1 5,212,722 49.6%American Indian/Alaska Native 21 0.2% 138.9 10 0.2% 66.1 2 0.3% 13.2 1 0.1% 6.6 15,118 0.3%Asian/Pacific Islander 513 4.1% 76.2 200 3.5% 29.7 29 4.4% 4.3 38 4.4% 5.6 673,578 12.9%Black/African-American 4,100 32.8% 1,009.1 2,060 36.5% 507.0 118 17.7% 29.0 134 15.3% 33.0 406,297 7.8%Latina/Hispanic 5,832 46.6% 226.4 1,824 32.3% 70.8 281 42.2% 10.9 450 51.5% 17.5 2,575,778 49.4%White 2,037 16.3% 140.4 1,547 27.4% 106.6 236 35.4% 16.3 250 28.6% 17.2 1,451,148 27.8%Other/Multi/Not Specified 3,438 21.6% - 736 11.5% - 11 1.6% - 20 2.2% - 90,803 1.7%
California Local Health Jurisdiction STD Data Summaries, 2010 Provisional Data (July 2011)
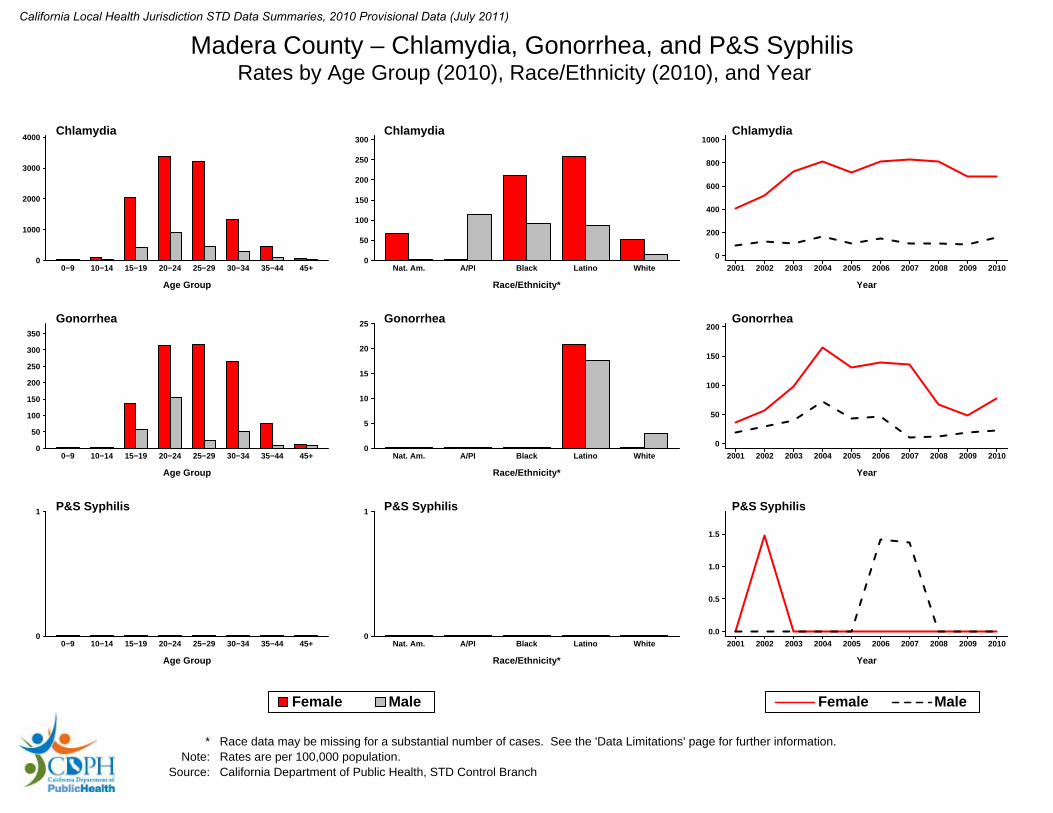
1:100
Madera County – Chlamydia, Gonorrhea, and P&S SyphilisRates by Age Group (2010), Race/Ethnicity (2010), and Year
0−9 10−14 15−19 20−24 25−29 30−34 35−44 45+
Age Group
0
1000
2000
3000
4000 Chlamydia
Nat. Am. A/PI Black Latino White
Race/Ethnicity*
0
50
100
150
200
250
300 Chlamydia
2001 2002 2003 2004 2005 2006 2007 2008 2009 2010
0
200
400
600
800
1000
Year
Chlamydia
0−9 10−14 15−19 20−24 25−29 30−34 35−44 45+
Age Group
0
50
100
150
200
250
300
350
Gonorrhea
Nat. Am. A/PI Black Latino White
Race/Ethnicity*
0
5
10
15
20
25 Gonorrhea
2001 2002 2003 2004 2005 2006 2007 2008 2009 2010
0
50
100
150
200
Year
Gonorrhea
0−9 10−14 15−19 20−24 25−29 30−34 35−44 45+
Age Group
0
1 P&S Syphilis
Nat. Am. A/PI Black Latino White
Race/Ethnicity*
0
1 P&S Syphilis
2001 2002 2003 2004 2005 2006 2007 2008 2009 2010
0.0
0.5
1.0
1.5
Year
P&S Syphilis
Female Male Female Male
* Race data may be missing for a substantial number of cases. See the 'Data Limitations' page for further information.Note: Rates are per 100,000 population.
Source: California Department of Public Health, STD Control Branch
California Local Health Jurisdiction STD Data Summaries, 2010 Provisional Data (July 2011)

1 Gender specific age groups and race/ethnicity percent calculations exclude "Not Specified" from the denominator. 2 Overall county rates were calculated using the July 1 county population estimates from the Department of Finance. (For Madera County, the July 1, 2010 estimate is 154,278). Note: Rates are per 100,000 population. Source: California Department of Public Health, STD Control Branch
Madera County – Chlamydia, Gonorrhea, and Early Syphilis Cases and Rates Tables for 2010
Gender & Age Group Chlamydia Gonorrhea P&S Syphilis Early Latent Syphilis Population
Cases Percent1 Rate Cases Percent1 Rate Cases Percent1 Rate Cases Percent1 Rate Number Percent1
COUNTY TOTAL 696 100.0% 451.1 82 100.0% 53.2 0 100.0% 0.0 1 100.0% 0.6 162,114 100.0%
Female Total 573 82.3% 686.6 64 78.0% 76.7 0 0.0% 0.0 0 0.0% 0.0 83,450 51.5% Ages 00 – 09 0 0.0% 0.0 0 0.0% 0.0 0 0.0% 0.0 0 0.0% 0.0 11,072 13.3% 10 – 14 5 0.9% 84.0 0 0.0% 0.0 0 0.0% 0.0 0 0.0% 0.0 5,949 7.1% 15 – 19 134 23.4% 2,035.9 9 14.1% 136.7 0 0.0% 0.0 0 0.0% 0.0 6,582 7.9% 20 – 24 172 30.0% 3,372.5 16 25.0% 313.7 0 0.0% 0.0 0 0.0% 0.0 5,100 6.1% 25 – 29 121 21.1% 3,197.7 12 18.8% 317.1 0 0.0% 0.0 0 0.0% 0.0 3,784 4.5% 30 – 34 60 10.5% 1,318.4 12 18.8% 263.7 0 0.0% 0.0 0 0.0% 0.0 4,551 5.5% 35 – 44 66 11.5% 450.2 11 17.2% 75.0 0 0.0% 0.0 0 0.0% 0.0 14,660 17.6% 45 + 15 2.6% 47.2 4 6.3% 12.6 0 0.0% 0.0 0 0.0% 0.0 31,752 38.0% Not Specified 0 0.0% - 0 0.0% - 0 0.0% - 0 0.0% -
Male Total 123 17.7% 156.4 18 22.0% 22.9 0 0.0% 0.0 1 100.0% 1.3 78,664 48.5% Ages 00 – 09 0 0.0% 0.0 0 0.0% 0.0 0 0.0% 0.0 0 0.0% 0.0 11,639 14.8% 10 – 14 0 0.0% 0.0 0 0.0% 0.0 0 0.0% 0.0 0 0.0% 0.0 6,569 8.4% 15 – 19 30 24.4% 424.6 4 22.2% 56.6 0 0.0% 0.0 0 0.0% 0.0 7,065 9.0% 20 – 24 47 38.2% 908.0 8 44.4% 154.6 0 0.0% 0.0 1 100.0% 19.3 5,176 6.6% 25 – 29 18 14.6% 448.1 1 5.6% 24.9 0 0.0% 0.0 0 0.0% 0.0 4,017 5.1% 30 – 34 11 8.9% 288.7 2 11.1% 52.5 0 0.0% 0.0 0 0.0% 0.0 3,810 4.8% 35 – 44 10 8.1% 87.4 1 5.6% 8.7 0 0.0% 0.0 0 0.0% 0.0 11,437 14.5% 45 + 7 5.7% 24.2 2 11.1% 6.9 0 0.0% 0.0 0 0.0% 0.0 28,951 36.8% Not Specified 0 0.0% - 0 0.0% - 0 0.0% - 0 0.0% -
Gender & Race/Ethnicity Chlamydia Gonorrhea P&S Syphilis Early Latent Syphilis Population
Cases Percent1 Rate Cases Percent1 Rate Cases Percent1 Rate Cases Percent1 Rate Number Percent1
COUNTY TOTAL 696 100.0% 451.1 82 100.0% 53.2 0 100.0% 0.0 1 100.0% 0.6 162,114 100.0%
Female Total 573 82.3% 686.6 64 78.0% 76.7 0 0.0% 0.0 0 0.0% 0.0 83,450 51.5%American Indian/Alaska Native 1 0.8% 66.2 0 0.0% 0.0 0 0.0% 0.0 0 0.0% 0.0 1,511 1.8%Asian/Pacific Islander 0 0.0% 0.0 0 0.0% 0.0 0 0.0% 0.0 0 0.0% 0.0 1,099 1.3%Black/African-American 7 5.6% 211.7 0 0.0% 0.0 0 0.0% 0.0 0 0.0% 0.0 3,307 4.0%Latina/Hispanic 99 78.6% 258.0 8 100.0% 20.8 0 0.0% 0.0 0 0.0% 0.0 38,378 46.0%White 19 15.1% 50.6 0 0.0% 0.0 0 0.0% 0.0 0 0.0% 0.0 37,526 45.0%Other/Multi/Not Specified 447 78.0% - 56 87.5% - 0 0.0% - 0 0.0% - 1,629 2.0%Male Total 123 17.7% 156.4 18 22.0% 22.9 0 0.0% 0.0 1 100.0% 1.3 78,664 48.5%American Indian/Alaska Native 0 0.0% 0.0 0 0.0% 0.0 0 0.0% 0.0 0 0.0% 0.0 983 1.2%Asian/Pacific Islander 1 2.4% 112.9 0 0.0% 0.0 0 0.0% 0.0 1 100.0% 112.9 886 1.1%Black/African-American 1 2.4% 91.3 0 0.0% 0.0 0 0.0% 0.0 0 0.0% 0.0 1,095 1.4%Latina/Hispanic 35 83.3% 87.7 7 87.5% 17.5 0 0.0% 0.0 0 0.0% 0.0 39,917 50.7%White 5 11.9% 14.5 1 12.5% 2.9 0 0.0% 0.0 0 0.0% 0.0 34,554 43.9%Other/Multi/Not Specified 81 65.9% - 10 55.6% - 0 0.0% - 0 0.0% - 1,229 1.6%
California Local Health Jurisdiction STD Data Summaries, 2010 Provisional Data (July 2011)

1:100
Marin County – Chlamydia, Gonorrhea, and P&S SyphilisRates by Age Group (2010), Race/Ethnicity (2010), and Year
0−9 10−14 15−19 20−24 25−29 30−34 35−44 45+
Age Group
0
500
1000
1500
Chlamydia
Nat. Am. A/PI Black Latino White
Race/Ethnicity*
0
200
400
600
800
1000
Chlamydia
2001 2002 2003 2004 2005 2006 2007 2008 2009 2010
0
50
100
150
200
250
300
Year
Chlamydia
0−9 10−14 15−19 20−24 25−29 30−34 35−44 45+
Age Group
0
50
100
150
Gonorrhea
Nat. Am. A/PI Black Latino White
Race/Ethnicity*
0
20
40
60
80
100
120
Gonorrhea
2001 2002 2003 2004 2005 2006 2007 2008 2009 2010
0
10
20
30
40
50
60
Year
Gonorrhea
0−9 10−14 15−19 20−24 25−29 30−34 35−44 45+
Age Group
0
2
4
6
8
10
12
P&S Syphilis
Nat. Am. A/PI Black Latino White
Race/Ethnicity*
0
1
2
3
4
P&S Syphilis
2001 2002 2003 2004 2005 2006 2007 2008 2009 2010
0
1
2
3
4
5
6
Year
P&S Syphilis
Female Male Female Male
* Race data may be missing for a substantial number of cases. See the 'Data Limitations' page for further information.Note: Rates are per 100,000 population.
Source: California Department of Public Health, STD Control Branch
California Local Health Jurisdiction STD Data Summaries, 2010 Provisional Data (July 2011)

1 Gender specific age groups and race/ethnicity percent calculations exclude "Not Specified" from the denominator. 2 Overall county rates were calculated using the July 1 county population estimates from the Department of Finance. (For Marin County, the July 1, 2010 estimate is 261,837). Note: Rates are per 100,000 population. Source: California Department of Public Health, STD Control Branch
Marin County – Chlamydia, Gonorrhea, and Early Syphilis Cases and Rates Tables for 2010
Gender & Age Group Chlamydia Gonorrhea P&S Syphilis Early Latent Syphilis Population
Cases Percent1 Rate Cases Percent1 Rate Cases Percent1 Rate Cases Percent1 Rate Number Percent1
COUNTY TOTAL 603 100.0% 230.3 65 100.0% 24.8 2 100.0% 0.8 6 100.0% 2.3 253,682 100.0%
Female Total 253 42.0% 197.3 21 32.3% 16.4 0 0.0% 0.0 0 0.0% 0.0 128,263 50.6% Ages 00 – 09 0 0.0% 0.0 0 0.0% 0.0 0 0.0% 0.0 0 0.0% 0.0 14,454 11.3% 10 – 14 3 1.2% 38.6 0 0.0% 0.0 0 0.0% 0.0 0 0.0% 0.0 7,780 6.1% 15 – 19 70 27.7% 957.6 8 38.1% 109.4 0 0.0% 0.0 0 0.0% 0.0 7,310 5.7% 20 – 24 90 35.6% 1,244.8 6 28.6% 83.0 0 0.0% 0.0 0 0.0% 0.0 7,230 5.6% 25 – 29 44 17.4% 728.7 3 14.3% 49.7 0 0.0% 0.0 0 0.0% 0.0 6,038 4.7% 30 – 34 30 11.9% 706.4 2 9.5% 47.1 0 0.0% 0.0 0 0.0% 0.0 4,247 3.3% 35 – 44 11 4.3% 77.9 2 9.5% 14.2 0 0.0% 0.0 0 0.0% 0.0 14,114 11.0% 45 + 5 2.0% 7.5 0 0.0% 0.0 0 0.0% 0.0 0 0.0% 0.0 67,090 52.3% Not Specified 0 0.0% - 0 0.0% - 0 0.0% - 0 0.0% -
Male Total 346 57.4% 275.9 44 67.7% 35.1 2 100.0% 1.6 6 100.0% 4.8 125,419 49.4% Ages 00 – 09 0 0.0% 0.0 0 0.0% 0.0 0 0.0% 0.0 0 0.0% 0.0 14,997 12.0% 10 – 14 2 0.6% 26.4 0 0.0% 0.0 0 0.0% 0.0 0 0.0% 0.0 7,572 6.0% 15 – 19 33 9.5% 417.4 1 2.3% 12.6 0 0.0% 0.0 0 0.0% 0.0 7,907 6.3% 20 – 24 135 39.0% 1,519.6 12 27.3% 135.1 1 50.0% 11.3 1 16.7% 11.3 8,884 7.1% 25 – 29 90 26.0% 1,159.8 11 25.0% 141.8 0 0.0% 0.0 1 16.7% 12.9 7,760 6.2% 30 – 34 40 11.6% 724.0 5 11.4% 90.5 0 0.0% 0.0 1 16.7% 18.1 5,525 4.4% 35 – 44 23 6.6% 156.7 6 13.6% 40.9 0 0.0% 0.0 1 16.7% 6.8 14,679 11.7% 45 + 23 6.6% 39.6 9 20.5% 15.5 1 50.0% 1.7 2 33.3% 3.4 58,095 46.3% Not Specified 0 0.0% - 0 0.0% - 0 0.0% - 0 0.0% -
Gender & Race/Ethnicity Chlamydia Gonorrhea P&S Syphilis Early Latent Syphilis Population
Cases Percent1 Rate Cases Percent1 Rate Cases Percent1 Rate Cases Percent1 Rate Number Percent1
COUNTY TOTAL 603 100.0% 230.3 65 100.0% 24.8 2 100.0% 0.8 6 100.0% 2.3 253,682 100.0%
Female Total 253 42.0% 197.3 21 32.3% 16.4 0 0.0% 0.0 0 0.0% 0.0 128,263 50.6%American Indian/Alaska Native 0 0.0% 0.0 0 0.0% 0.0 0 0.0% 0.0 0 0.0% 0.0 297 0.2%Asian/Pacific Islander 8 5.9% 127.1 0 0.0% 0.0 0 0.0% 0.0 0 0.0% 0.0 6,293 4.9%Black/African-American 25 18.4% 962.3 3 23.1% 115.5 0 0.0% 0.0 0 0.0% 0.0 2,598 2.0%Latina/Hispanic 46 33.8% 202.9 3 23.1% 13.2 0 0.0% 0.0 0 0.0% 0.0 22,676 17.7%White 57 41.9% 60.9 7 53.8% 7.5 0 0.0% 0.0 0 0.0% 0.0 93,569 73.0%Other/Multi/Not Specified 117 46.2% - 8 38.1% - 0 0.0% - 0 0.0% - 2,830 2.2%Male Total 346 57.4% 275.9 44 67.7% 35.1 2 100.0% 1.6 6 100.0% 4.8 125,419 49.4%American Indian/Alaska Native 0 0.0% 0.0 0 0.0% 0.0 0 0.0% 0.0 0 0.0% 0.0 386 0.3%Asian/Pacific Islander 6 3.6% 116.6 2 6.9% 38.9 0 0.0% 0.0 0 0.0% 0.0 5,146 4.1%Black/African-American 32 19.0% 622.3 3 10.3% 58.3 0 0.0% 0.0 2 33.3% 38.9 5,142 4.1%Latina/Hispanic 60 35.7% 245.0 14 48.3% 57.2 1 100.0% 4.1 2 33.3% 8.2 24,494 19.5%White 70 41.7% 79.9 10 34.5% 11.4 0 0.0% 0.0 2 33.3% 2.3 87,646 69.9%Other/Multi/Not Specified 178 51.4% - 15 34.1% - 1 50.0% - 0 0.0% - 2,605 2.1%
California Local Health Jurisdiction STD Data Summaries, 2010 Provisional Data (July 2011)

1:100
Mariposa County – Chlamydia, Gonorrhea, and P&S SyphilisRates by Age Group (2010), Race/Ethnicity (2010), and Year
0−9 10−14 15−19 20−24 25−29 30−34 35−44 45+
Age Group
0
500
1000
1500
2000
Chlamydia
Nat. Am. A/PI Black Latino White
Race/Ethnicity*
0
50
100
150
200
250
300
350 Chlamydia
2001 2002 2003 2004 2005 2006 2007 2008 2009 2010
0
50
100
150
200
Year
Chlamydia
0−9 10−14 15−19 20−24 25−29 30−34 35−44 45+
Age Group
0
50
100
150
200 Gonorrhea
Nat. Am. A/PI Black Latino White
Race/Ethnicity*
0
2
4
6
8
10
12
14
Gonorrhea
2001 2002 2003 2004 2005 2006 2007 2008 2009 2010
0
20
40
60
80
Year
Gonorrhea
0−9 10−14 15−19 20−24 25−29 30−34 35−44 45+
Age Group
0
1 P&S Syphilis
Nat. Am. A/PI Black Latino White
Race/Ethnicity*
0
1 P&S Syphilis
2001 2002 2003 2004 2005 2006 2007 2008 2009 2010
0
2
4
6
8
10
12
Year
P&S Syphilis
Female Male Female Male
* Race data may be missing for a substantial number of cases. See the 'Data Limitations' page for further information.Note: Rates are per 100,000 population.
Source: California Department of Public Health, STD Control Branch
California Local Health Jurisdiction STD Data Summaries, 2010 Provisional Data (July 2011)

1 Gender specific age groups and race/ethnicity percent calculations exclude "Not Specified" from the denominator. 2 Overall county rates were calculated using the July 1 county population estimates from the Department of Finance. (For Mariposa County, the July 1, 2010 estimate is 18,243). Note: Rates are per 100,000 population. Source: California Department of Public Health, STD Control Branch
Mariposa County – Chlamydia, Gonorrhea, and Early Syphilis Cases and Rates Tables for 2010
Gender & Age Group Chlamydia Gonorrhea P&S Syphilis Early Latent Syphilis Population
Cases Percent1 Rate Cases Percent1 Rate Cases Percent1 Rate Cases Percent1 Rate Number Percent1
COUNTY TOTAL 20 100.0% 109.6 1 100.0% 5.5 0 100.0% 0.0 0 100.0% 0.0 19,108 100.0%
Female Total 14 70.0% 149.6 1 100.0% 10.7 0 0.0% 0.0 0 0.0% 0.0 9,358 49.0% Ages 00 – 09 0 0.0% 0.0 0 0.0% 0.0 0 0.0% 0.0 0 0.0% 0.0 802 8.6% 10 – 14 0 0.0% 0.0 0 0.0% 0.0 0 0.0% 0.0 0 0.0% 0.0 441 4.7% 15 – 19 10 71.4% 1,848.4 0 0.0% 0.0 0 0.0% 0.0 0 0.0% 0.0 541 5.8% 20 – 24 4 28.6% 684.9 1 100.0% 171.2 0 0.0% 0.0 0 0.0% 0.0 584 6.2% 25 – 29 0 0.0% 0.0 0 0.0% 0.0 0 0.0% 0.0 0 0.0% 0.0 440 4.7% 30 – 34 0 0.0% 0.0 0 0.0% 0.0 0 0.0% 0.0 0 0.0% 0.0 294 3.1% 35 – 44 0 0.0% 0.0 0 0.0% 0.0 0 0.0% 0.0 0 0.0% 0.0 989 10.6% 45 + 0 0.0% 0.0 0 0.0% 0.0 0 0.0% 0.0 0 0.0% 0.0 5,267 56.3% Not Specified 0 0.0% - 0 0.0% - 0 0.0% - 0 0.0% -
Male Total 6 30.0% 61.5 0 0.0% 0.0 0 0.0% 0.0 0 0.0% 0.0 9,750 51.0% Ages 00 – 09 0 0.0% 0.0 0 0.0% 0.0 0 0.0% 0.0 0 0.0% 0.0 720 7.4% 10 – 14 0 0.0% 0.0 0 0.0% 0.0 0 0.0% 0.0 0 0.0% 0.0 396 4.1% 15 – 19 0 0.0% 0.0 0 0.0% 0.0 0 0.0% 0.0 0 0.0% 0.0 600 6.2% 20 – 24 0 0.0% 0.0 0 0.0% 0.0 0 0.0% 0.0 0 0.0% 0.0 592 6.1% 25 – 29 1 16.7% 177.0 0 0.0% 0.0 0 0.0% 0.0 0 0.0% 0.0 565 5.8% 30 – 34 1 16.7% 208.8 0 0.0% 0.0 0 0.0% 0.0 0 0.0% 0.0 479 4.9% 35 – 44 2 33.3% 185.2 0 0.0% 0.0 0 0.0% 0.0 0 0.0% 0.0 1,080 11.1% 45 + 2 33.3% 37.6 0 0.0% 0.0 0 0.0% 0.0 0 0.0% 0.0 5,318 54.5% Not Specified 0 0.0% - 0 0.0% - 0 0.0% - 0 0.0% -
Gender & Race/Ethnicity Chlamydia Gonorrhea P&S Syphilis Early Latent Syphilis Population
Cases Percent1 Rate Cases Percent1 Rate Cases Percent1 Rate Cases Percent1 Rate Number Percent1
COUNTY TOTAL 20 100.0% 109.6 1 100.0% 5.5 0 100.0% 0.0 0 100.0% 0.0 19,108 100.0%
Female Total 14 70.0% 149.6 1 100.0% 10.7 0 0.0% 0.0 0 0.0% 0.0 9,358 49.0%American Indian/Alaska Native 0 0.0% 0.0 0 0.0% 0.0 0 0.0% 0.0 0 0.0% 0.0 307 3.3%Asian/Pacific Islander 0 0.0% 0.0 0 0.0% 0.0 0 0.0% 0.0 0 0.0% 0.0 96 1.0%Black/African-American 0 0.0% 0.0 0 0.0% 0.0 0 0.0% 0.0 0 0.0% 0.0 39 0.4%Latina/Hispanic 2 25.0% 299.9 0 0.0% 0.0 0 0.0% 0.0 0 0.0% 0.0 667 7.1%White 6 75.0% 75.1 1 100.0% 12.5 0 0.0% 0.0 0 0.0% 0.0 7,991 85.4%Other/Multi/Not Specified 6 42.9% - 0 0.0% - 0 0.0% - 0 0.0% - 258 2.8%Male Total 6 30.0% 61.5 0 0.0% 0.0 0 0.0% 0.0 0 0.0% 0.0 9,750 51.0%American Indian/Alaska Native 0 0.0% 0.0 0 0.0% 0.0 0 0.0% 0.0 0 0.0% 0.0 308 3.2%Asian/Pacific Islander 0 0.0% 0.0 0 0.0% 0.0 0 0.0% 0.0 0 0.0% 0.0 85 0.9%Black/African-American 0 0.0% 0.0 0 0.0% 0.0 0 0.0% 0.0 0 0.0% 0.0 83 0.9%Latina/Hispanic 0 0.0% 0.0 0 0.0% 0.0 0 0.0% 0.0 0 0.0% 0.0 791 8.1%White 4 100.0% 48.8 0 0.0% 0.0 0 0.0% 0.0 0 0.0% 0.0 8,199 84.1%Other/Multi/Not Specified 2 33.3% - 0 0.0% - 0 0.0% - 0 0.0% - 284 2.9%
California Local Health Jurisdiction STD Data Summaries, 2010 Provisional Data (July 2011)

1:100
Mendocino County – Chlamydia, Gonorrhea, and P&S SyphilisRates by Age Group (2010), Race/Ethnicity (2010), and Year
0−9 10−14 15−19 20−24 25−29 30−34 35−44 45+
Age Group
0
500
1000
1500
2000
2500
Chlamydia
Nat. Am. A/PI Black Latino White
Race/Ethnicity*
0
100
200
300
400
500
600
Chlamydia
2001 2002 2003 2004 2005 2006 2007 2008 2009 2010
0
100
200
300
400
500
Year
Chlamydia
0−9 10−14 15−19 20−24 25−29 30−34 35−44 45+
Age Group
0
20
40
60
80
100
Gonorrhea
Nat. Am. A/PI Black Latino White
Race/Ethnicity*
0
5
10
15
20
25
Gonorrhea
2001 2002 2003 2004 2005 2006 2007 2008 2009 2010
0
10
20
30
40
Year
Gonorrhea
0−9 10−14 15−19 20−24 25−29 30−34 35−44 45+
Age Group
0
1 P&S Syphilis
Nat. Am. A/PI Black Latino White
Race/Ethnicity*
0
1 P&S Syphilis
2001 2002 2003 2004 2005 2006 2007 2008 2009 2010
0
2
4
6
8
Year
P&S Syphilis
Female Male Female Male
* Race data may be missing for a substantial number of cases. See the 'Data Limitations' page for further information.Note: Rates are per 100,000 population.
Source: California Department of Public Health, STD Control Branch
California Local Health Jurisdiction STD Data Summaries, 2010 Provisional Data (July 2011)

1 Gender specific age groups and race/ethnicity percent calculations exclude "Not Specified" from the denominator. 2 Overall county rates were calculated using the July 1 county population estimates from the Department of Finance. (For Mendocino County, the July 1, 2010 estimate is 90,583). Note: Rates are per 100,000 population. Source: California Department of Public Health, STD Control Branch
Mendocino County – Chlamydia, Gonorrhea, and Early Syphilis Cases and Rates Tables for 2010
Gender & Age Group Chlamydia Gonorrhea P&S Syphilis Early Latent Syphilis Population
Cases Percent1 Rate Cases Percent1 Rate Cases Percent1 Rate Cases Percent1 Rate Number Percent1
COUNTY TOTAL 260 100.0% 287.0 15 100.0% 16.6 0 100.0% 0.0 0 100.0% 0.0 93,166 100.0%
Female Total 193 74.2% 414.0 9 60.0% 19.3 0 0.0% 0.0 0 0.0% 0.0 46,622 50.0% Ages 00 – 09 1 0.5% 17.6 0 0.0% 0.0 0 0.0% 0.0 0 0.0% 0.0 5,675 12.2% 10 – 14 1 0.5% 38.0 0 0.0% 0.0 0 0.0% 0.0 0 0.0% 0.0 2,631 5.6% 15 – 19 72 37.7% 2,384.9 3 33.3% 99.4 0 0.0% 0.0 0 0.0% 0.0 3,019 6.5% 20 – 24 68 35.6% 2,001.2 2 22.2% 58.9 0 0.0% 0.0 0 0.0% 0.0 3,398 7.3% 25 – 29 22 11.5% 663.7 1 11.1% 30.2 0 0.0% 0.0 0 0.0% 0.0 3,315 7.1% 30 – 34 16 8.4% 696.9 2 22.2% 87.1 0 0.0% 0.0 0 0.0% 0.0 2,296 4.9% 35 – 44 8 4.2% 166.7 1 11.1% 20.8 0 0.0% 0.0 0 0.0% 0.0 4,799 10.3% 45 + 3 1.6% 14.0 0 0.0% 0.0 0 0.0% 0.0 0 0.0% 0.0 21,489 46.1% Not Specified 2 1.0% - 0 0.0% - 0 0.0% - 0 0.0% -
Male Total 67 25.8% 143.9 6 40.0% 12.9 0 0.0% 0.0 0 0.0% 0.0 46,544 50.0% Ages 00 – 09 0 0.0% 0.0 0 0.0% 0.0 0 0.0% 0.0 0 0.0% 0.0 5,930 12.7% 10 – 14 0 0.0% 0.0 0 0.0% 0.0 0 0.0% 0.0 0 0.0% 0.0 2,725 5.9% 15 – 19 14 21.2% 436.0 0 0.0% 0.0 0 0.0% 0.0 0 0.0% 0.0 3,211 6.9% 20 – 24 26 39.4% 709.8 0 0.0% 0.0 0 0.0% 0.0 0 0.0% 0.0 3,663 7.9% 25 – 29 15 22.7% 408.4 1 16.7% 27.2 0 0.0% 0.0 0 0.0% 0.0 3,673 7.9% 30 – 34 8 12.1% 292.2 2 33.3% 73.0 0 0.0% 0.0 0 0.0% 0.0 2,738 5.9% 35 – 44 3 4.5% 57.7 1 16.7% 19.2 0 0.0% 0.0 0 0.0% 0.0 5,197 11.2% 45 + 0 0.0% 0.0 2 33.3% 10.3 0 0.0% 0.0 0 0.0% 0.0 19,407 41.7% Not Specified 1 1.5% - 0 0.0% - 0 0.0% - 0 0.0% -
Gender & Race/Ethnicity Chlamydia Gonorrhea P&S Syphilis Early Latent Syphilis Population
Cases Percent1 Rate Cases Percent1 Rate Cases Percent1 Rate Cases Percent1 Rate Number Percent1
COUNTY TOTAL 260 100.0% 287.0 15 100.0% 16.6 0 100.0% 0.0 0 100.0% 0.0 93,166 100.0%
Female Total 193 74.2% 414.0 9 60.0% 19.3 0 0.0% 0.0 0 0.0% 0.0 46,622 50.0%American Indian/Alaska Native 1 0.5% 33.1 0 0.0% 0.0 0 0.0% 0.0 0 0.0% 0.0 3,020 6.5%Asian/Pacific Islander 0 0.0% 0.0 0 0.0% 0.0 0 0.0% 0.0 0 0.0% 0.0 729 1.6%Black/African-American 0 0.0% 0.0 0 0.0% 0.0 0 0.0% 0.0 0 0.0% 0.0 197 0.4%Latina/Hispanic 10 5.2% 113.4 1 11.1% 11.3 0 0.0% 0.0 0 0.0% 0.0 8,819 18.9%White 182 94.3% 556.4 8 88.9% 24.5 0 0.0% 0.0 0 0.0% 0.0 32,708 70.2%Other/Multi/Not Specified 0 0.0% - 0 0.0% - 0 0.0% - 0 0.0% - 1,149 2.5%Male Total 67 25.8% 143.9 6 40.0% 12.9 0 0.0% 0.0 0 0.0% 0.0 46,544 50.0%American Indian/Alaska Native 0 0.0% 0.0 0 0.0% 0.0 0 0.0% 0.0 0 0.0% 0.0 2,841 6.1%Asian/Pacific Islander 0 0.0% 0.0 0 0.0% 0.0 0 0.0% 0.0 0 0.0% 0.0 520 1.1%Black/African-American 0 0.0% 0.0 0 0.0% 0.0 0 0.0% 0.0 0 0.0% 0.0 325 0.7%Latina/Hispanic 5 7.5% 48.2 0 0.0% 0.0 0 0.0% 0.0 0 0.0% 0.0 10,378 22.3%White 62 92.5% 196.9 6 100.0% 19.1 0 0.0% 0.0 0 0.0% 0.0 31,495 67.7%Other/Multi/Not Specified 0 0.0% - 0 0.0% - 0 0.0% - 0 0.0% - 985 2.1%
California Local Health Jurisdiction STD Data Summaries, 2010 Provisional Data (July 2011)
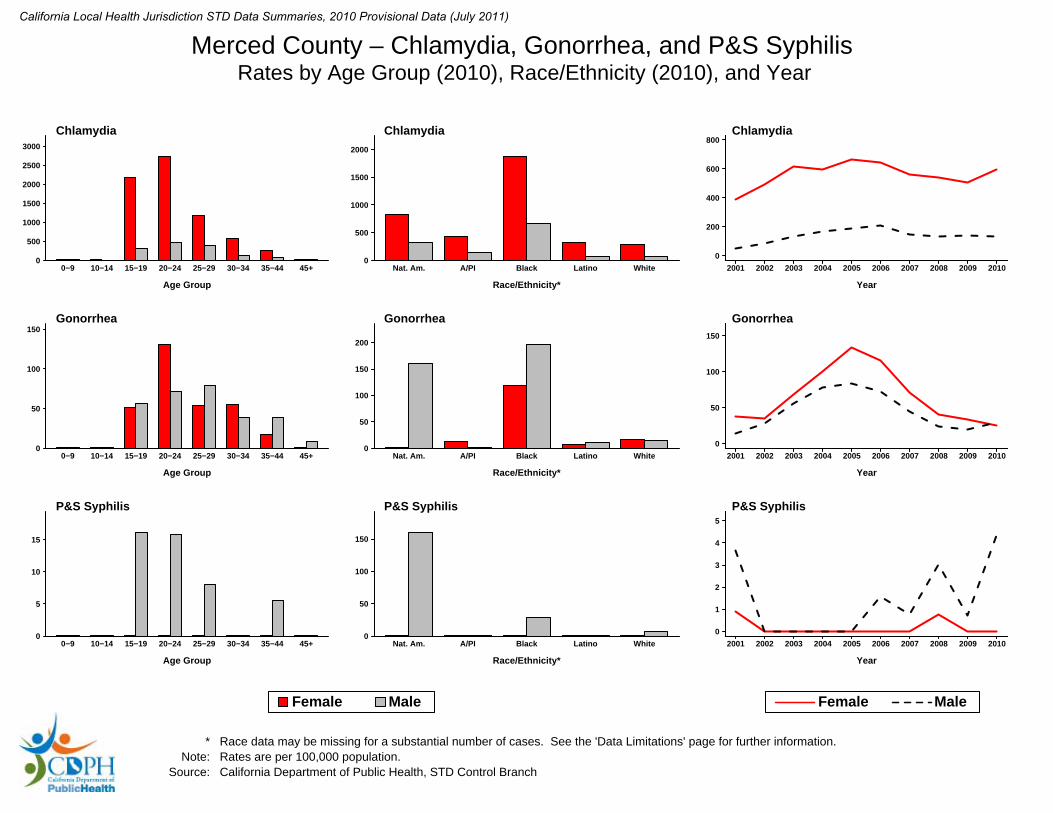
1:100
Merced County – Chlamydia, Gonorrhea, and P&S SyphilisRates by Age Group (2010), Race/Ethnicity (2010), and Year
0−9 10−14 15−19 20−24 25−29 30−34 35−44 45+
Age Group
0
500
1000
1500
2000
2500
3000
Chlamydia
Nat. Am. A/PI Black Latino White
Race/Ethnicity*
0
500
1000
1500
2000
Chlamydia
2001 2002 2003 2004 2005 2006 2007 2008 2009 2010
0
200
400
600
800
Year
Chlamydia
0−9 10−14 15−19 20−24 25−29 30−34 35−44 45+
Age Group
0
50
100
150 Gonorrhea
Nat. Am. A/PI Black Latino White
Race/Ethnicity*
0
50
100
150
200
Gonorrhea
2001 2002 2003 2004 2005 2006 2007 2008 2009 2010
0
50
100
150
Year
Gonorrhea
0−9 10−14 15−19 20−24 25−29 30−34 35−44 45+
Age Group
0
5
10
15
P&S Syphilis
Nat. Am. A/PI Black Latino White
Race/Ethnicity*
0
50
100
150
P&S Syphilis
2001 2002 2003 2004 2005 2006 2007 2008 2009 2010
0
1
2
3
4
5
Year
P&S Syphilis
Female Male Female Male
* Race data may be missing for a substantial number of cases. See the 'Data Limitations' page for further information.Note: Rates are per 100,000 population.
Source: California Department of Public Health, STD Control Branch
California Local Health Jurisdiction STD Data Summaries, 2010 Provisional Data (July 2011)

1 Gender specific age groups and race/ethnicity percent calculations exclude "Not Specified" from the denominator. 2 Overall county rates were calculated using the July 1 county population estimates from the Department of Finance. (For Merced County, the July 1, 2010 estimate is 260,000). Note: Rates are per 100,000 population. Source: California Department of Public Health, STD Control Branch
Merced County – Chlamydia, Gonorrhea, and Early Syphilis Cases and Rates Tables for 2010
Gender & Age Group Chlamydia Gonorrhea P&S Syphilis Early Latent Syphilis Population
Cases Percent1 Rate Cases Percent1 Rate Cases Percent1 Rate Cases Percent1 Rate Number Percent1
COUNTY TOTAL 995 100.0% 382.7 76 100.0% 29.2 6 100.0% 2.3 2 100.0% 0.8 273,935 100.0%
Female Total 813 81.7% 598.5 35 46.1% 25.8 0 0.0% 0.0 1 50.0% 0.7 135,839 49.6% Ages 00 – 09 0 0.0% 0.0 0 0.0% 0.0 0 0.0% 0.0 0 0.0% 0.0 23,131 17.0% 10 – 14 3 0.4% 28.7 0 0.0% 0.0 0 0.0% 0.0 0 0.0% 0.0 10,466 7.7% 15 – 19 256 31.5% 2,169.3 6 17.1% 50.8 0 0.0% 0.0 1 100.0% 8.5 11,801 8.7% 20 – 24 313 38.5% 2,732.2 15 42.9% 130.9 0 0.0% 0.0 0 0.0% 0.0 11,456 8.4% 25 – 29 133 16.4% 1,193.8 6 17.1% 53.9 0 0.0% 0.0 0 0.0% 0.0 11,141 8.2% 30 – 34 53 6.5% 582.7 5 14.3% 55.0 0 0.0% 0.0 0 0.0% 0.0 9,096 6.7% 35 – 44 45 5.5% 261.7 3 8.6% 17.4 0 0.0% 0.0 0 0.0% 0.0 17,195 12.7% 45 + 10 1.2% 24.1 0 0.0% 0.0 0 0.0% 0.0 0 0.0% 0.0 41,553 30.6% Not Specified 0 0.0% - 0 0.0% - 0 0.0% - 0 0.0% -
Male Total 182 18.3% 131.8 40 52.6% 29.0 6 100.0% 4.3 1 50.0% 0.7 138,096 50.4% Ages 00 – 09 0 0.0% 0.0 0 0.0% 0.0 0 0.0% 0.0 0 0.0% 0.0 23,978 17.4% 10 – 14 1 0.5% 9.3 0 0.0% 0.0 0 0.0% 0.0 0 0.0% 0.0 10,741 7.8% 15 – 19 39 21.4% 315.0 7 17.5% 56.5 2 33.3% 16.2 0 0.0% 0.0 12,379 9.0% 20 – 24 60 33.0% 475.9 9 22.5% 71.4 2 33.3% 15.9 1 100.0% 7.9 12,609 9.1% 25 – 29 48 26.4% 382.2 10 25.0% 79.6 1 16.7% 8.0 0 0.0% 0.0 12,559 9.1% 30 – 34 14 7.7% 135.0 4 10.0% 38.6 0 0.0% 0.0 0 0.0% 0.0 10,370 7.5% 35 – 44 13 7.1% 72.9 7 17.5% 39.3 1 16.7% 5.6 0 0.0% 0.0 17,834 12.9% 45 + 7 3.8% 18.6 3 7.5% 8.0 0 0.0% 0.0 0 0.0% 0.0 37,626 27.2% Not Specified 0 0.0% - 0 0.0% - 0 0.0% - 0 0.0% -
Gender & Race/Ethnicity Chlamydia Gonorrhea P&S Syphilis Early Latent Syphilis Population
Cases Percent1 Rate Cases Percent1 Rate Cases Percent1 Rate Cases Percent1 Rate Number Percent1
COUNTY TOTAL 995 100.0% 382.7 76 100.0% 29.2 6 100.0% 2.3 2 100.0% 0.8 273,935 100.0%
Female Total 813 81.7% 598.5 35 46.1% 25.8 0 0.0% 0.0 1 50.0% 0.7 135,839 49.6%American Indian/Alaska Native 5 1.1% 821.0 0 0.0% 0.0 0 0.0% 0.0 0 0.0% 0.0 609 0.4%Asian/Pacific Islander 35 7.4% 423.9 1 5.6% 12.1 0 0.0% 0.0 0 0.0% 0.0 8,257 6.1%Black/African-American 63 13.3% 1,874.4 4 22.2% 119.0 0 0.0% 0.0 1 100.0% 29.8 3,361 2.5%Latina/Hispanic 238 50.4% 319.1 5 27.8% 6.7 0 0.0% 0.0 0 0.0% 0.0 74,576 54.9%White 131 27.8% 279.2 8 44.4% 17.1 0 0.0% 0.0 0 0.0% 0.0 46,919 34.5%Other/Multi/Not Specified 341 41.9% - 17 48.6% - 0 0.0% - 0 0.0% - 2,117 1.6%Male Total 182 18.3% 131.8 40 52.6% 29.0 6 100.0% 4.3 1 50.0% 0.7 138,096 50.4%American Indian/Alaska Native 2 1.6% 321.0 1 4.2% 160.5 1 16.7% 160.5 0 0.0% 0.0 623 0.5%Asian/Pacific Islander 12 9.5% 149.2 0 0.0% 0.0 0 0.0% 0.0 0 0.0% 0.0 8,042 5.8%Black/African-American 24 19.0% 674.3 7 29.2% 196.7 1 16.7% 28.1 0 0.0% 0.0 3,559 2.6%Latina/Hispanic 57 45.2% 72.0 9 37.5% 11.4 1 16.7% 1.3 1 100.0% 1.3 79,122 57.3%White 31 24.6% 69.1 7 29.2% 15.6 3 50.0% 6.7 0 0.0% 0.0 44,880 32.5%Other/Multi/Not Specified 56 30.8% - 16 40.0% - 0 0.0% - 0 0.0% - 1,870 1.4%
California Local Health Jurisdiction STD Data Summaries, 2010 Provisional Data (July 2011)

1:100
Modoc County – Chlamydia, Gonorrhea, and P&S SyphilisRates by Age Group (2010), Race/Ethnicity (2010), and Year
0−9 10−14 15−19 20−24 25−29 30−34 35−44 45+
Age Group
0
50
100
150
200
250
300
Chlamydia
Nat. Am. A/PI Black Latino White
Race/Ethnicity*
0
1 Chlamydia
2001 2002 2003 2004 2005 2006 2007 2008 2009 2010
0
50
100
150
200
Year
Chlamydia
0−9 10−14 15−19 20−24 25−29 30−34 35−44 45+
Age Group
0
1 Gonorrhea
Nat. Am. A/PI Black Latino White
Race/Ethnicity*
0
1 Gonorrhea
2001 2002 2003 2004 2005 2006 2007 2008 2009 2010
0
20
40
60
80
100
120
140
Year
Gonorrhea
0−9 10−14 15−19 20−24 25−29 30−34 35−44 45+
Age Group
0
1 P&S Syphilis
Nat. Am. A/PI Black Latino White
Race/Ethnicity*
0
1 P&S Syphilis
2001 2002 2003 2004 2005 2006 2007 2008 2009 2010
Year
0
1 P&S Syphilis
Female Male Female Male
* Race data may be missing for a substantial number of cases. See the 'Data Limitations' page for further information.Note: Rates are per 100,000 population.
Source: California Department of Public Health, STD Control Branch
California Local Health Jurisdiction STD Data Summaries, 2010 Provisional Data (July 2011)
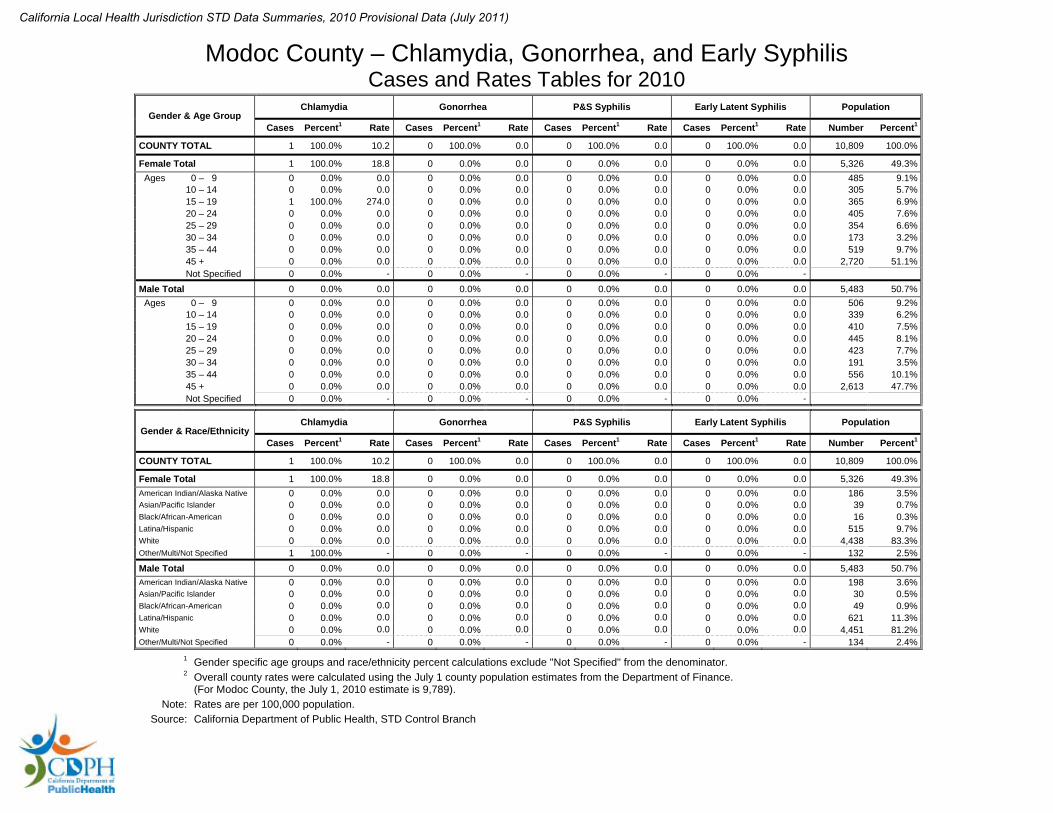
1 Gender specific age groups and race/ethnicity percent calculations exclude "Not Specified" from the denominator. 2 Overall county rates were calculated using the July 1 county population estimates from the Department of Finance. (For Modoc County, the July 1, 2010 estimate is 9,789). Note: Rates are per 100,000 population. Source: California Department of Public Health, STD Control Branch
Modoc County – Chlamydia, Gonorrhea, and Early Syphilis Cases and Rates Tables for 2010
Gender & Age Group Chlamydia Gonorrhea P&S Syphilis Early Latent Syphilis Population
Cases Percent1 Rate Cases Percent1 Rate Cases Percent1 Rate Cases Percent1 Rate Number Percent1
COUNTY TOTAL 1 100.0% 10.2 0 100.0% 0.0 0 100.0% 0.0 0 100.0% 0.0 10,809 100.0%
Female Total 1 100.0% 18.8 0 0.0% 0.0 0 0.0% 0.0 0 0.0% 0.0 5,326 49.3% Ages 00 – 09 0 0.0% 0.0 0 0.0% 0.0 0 0.0% 0.0 0 0.0% 0.0 485 9.1% 10 – 14 0 0.0% 0.0 0 0.0% 0.0 0 0.0% 0.0 0 0.0% 0.0 305 5.7% 15 – 19 1 100.0% 274.0 0 0.0% 0.0 0 0.0% 0.0 0 0.0% 0.0 365 6.9% 20 – 24 0 0.0% 0.0 0 0.0% 0.0 0 0.0% 0.0 0 0.0% 0.0 405 7.6% 25 – 29 0 0.0% 0.0 0 0.0% 0.0 0 0.0% 0.0 0 0.0% 0.0 354 6.6% 30 – 34 0 0.0% 0.0 0 0.0% 0.0 0 0.0% 0.0 0 0.0% 0.0 173 3.2% 35 – 44 0 0.0% 0.0 0 0.0% 0.0 0 0.0% 0.0 0 0.0% 0.0 519 9.7% 45 + 0 0.0% 0.0 0 0.0% 0.0 0 0.0% 0.0 0 0.0% 0.0 2,720 51.1% Not Specified 0 0.0% - 0 0.0% - 0 0.0% - 0 0.0% -
Male Total 0 0.0% 0.0 0 0.0% 0.0 0 0.0% 0.0 0 0.0% 0.0 5,483 50.7% Ages 00 – 09 0 0.0% 0.0 0 0.0% 0.0 0 0.0% 0.0 0 0.0% 0.0 506 9.2% 10 – 14 0 0.0% 0.0 0 0.0% 0.0 0 0.0% 0.0 0 0.0% 0.0 339 6.2% 15 – 19 0 0.0% 0.0 0 0.0% 0.0 0 0.0% 0.0 0 0.0% 0.0 410 7.5% 20 – 24 0 0.0% 0.0 0 0.0% 0.0 0 0.0% 0.0 0 0.0% 0.0 445 8.1% 25 – 29 0 0.0% 0.0 0 0.0% 0.0 0 0.0% 0.0 0 0.0% 0.0 423 7.7% 30 – 34 0 0.0% 0.0 0 0.0% 0.0 0 0.0% 0.0 0 0.0% 0.0 191 3.5% 35 – 44 0 0.0% 0.0 0 0.0% 0.0 0 0.0% 0.0 0 0.0% 0.0 556 10.1% 45 + 0 0.0% 0.0 0 0.0% 0.0 0 0.0% 0.0 0 0.0% 0.0 2,613 47.7% Not Specified 0 0.0% - 0 0.0% - 0 0.0% - 0 0.0% -
Gender & Race/Ethnicity Chlamydia Gonorrhea P&S Syphilis Early Latent Syphilis Population
Cases Percent1 Rate Cases Percent1 Rate Cases Percent1 Rate Cases Percent1 Rate Number Percent1
COUNTY TOTAL 1 100.0% 10.2 0 100.0% 0.0 0 100.0% 0.0 0 100.0% 0.0 10,809 100.0%
Female Total 1 100.0% 18.8 0 0.0% 0.0 0 0.0% 0.0 0 0.0% 0.0 5,326 49.3%American Indian/Alaska Native 0 0.0% 0.0 0 0.0% 0.0 0 0.0% 0.0 0 0.0% 0.0 186 3.5%Asian/Pacific Islander 0 0.0% 0.0 0 0.0% 0.0 0 0.0% 0.0 0 0.0% 0.0 39 0.7%Black/African-American 0 0.0% 0.0 0 0.0% 0.0 0 0.0% 0.0 0 0.0% 0.0 16 0.3%Latina/Hispanic 0 0.0% 0.0 0 0.0% 0.0 0 0.0% 0.0 0 0.0% 0.0 515 9.7%White 0 0.0% 0.0 0 0.0% 0.0 0 0.0% 0.0 0 0.0% 0.0 4,438 83.3%Other/Multi/Not Specified 1 100.0% - 0 0.0% - 0 0.0% - 0 0.0% - 132 2.5%Male Total 0 0.0% 0.0 0 0.0% 0.0 0 0.0% 0.0 0 0.0% 0.0 5,483 50.7%American Indian/Alaska Native 0 0.0% 0.0 0 0.0% 0.0 0 0.0% 0.0 0 0.0% 0.0 198 3.6%Asian/Pacific Islander 0 0.0% 0.0 0 0.0% 0.0 0 0.0% 0.0 0 0.0% 0.0 30 0.5%Black/African-American 0 0.0% 0.0 0 0.0% 0.0 0 0.0% 0.0 0 0.0% 0.0 49 0.9%Latina/Hispanic 0 0.0% 0.0 0 0.0% 0.0 0 0.0% 0.0 0 0.0% 0.0 621 11.3%White 0 0.0% 0.0 0 0.0% 0.0 0 0.0% 0.0 0 0.0% 0.0 4,451 81.2%Other/Multi/Not Specified 0 0.0% - 0 0.0% - 0 0.0% - 0 0.0% - 134 2.4%
California Local Health Jurisdiction STD Data Summaries, 2010 Provisional Data (July 2011)

1:100
Mono County – Chlamydia, Gonorrhea, and P&S SyphilisRates by Age Group (2010), Race/Ethnicity (2010), and Year
0−9 10−14 15−19 20−24 25−29 30−34 35−44 45+
Age Group
0
500
1000
1500
2000
2500
3000
Chlamydia
Nat. Am. A/PI Black Latino White
Race/Ethnicity*
0
100
200
300
400
500 Chlamydia
2001 2002 2003 2004 2005 2006 2007 2008 2009 2010
0
100
200
300
400
Year
Chlamydia
0−9 10−14 15−19 20−24 25−29 30−34 35−44 45+
Age Group
0
50
100
150
200
Gonorrhea
Nat. Am. A/PI Black Latino White
Race/Ethnicity*
0
5
10
15
20
25 Gonorrhea
2001 2002 2003 2004 2005 2006 2007 2008 2009 2010
0
5
10
15
20
25
30
Year
Gonorrhea
0−9 10−14 15−19 20−24 25−29 30−34 35−44 45+
Age Group
0
1 P&S Syphilis
Nat. Am. A/PI Black Latino White
Race/Ethnicity*
0
1 P&S Syphilis
2001 2002 2003 2004 2005 2006 2007 2008 2009 2010
Year
0
1 P&S Syphilis
Female Male Female Male
* Race data may be missing for a substantial number of cases. See the 'Data Limitations' page for further information.Note: Rates are per 100,000 population.
Source: California Department of Public Health, STD Control Branch
California Local Health Jurisdiction STD Data Summaries, 2010 Provisional Data (July 2011)

1 Gender specific age groups and race/ethnicity percent calculations exclude "Not Specified" from the denominator. 2 Overall county rates were calculated using the July 1 county population estimates from the Department of Finance. (For Mono County, the July 1, 2010 estimate is 13,698). Note: Rates are per 100,000 population. Source: California Department of Public Health, STD Control Branch
Mono County – Chlamydia, Gonorrhea, and Early Syphilis Cases and Rates Tables for 2010
Gender & Age Group Chlamydia Gonorrhea P&S Syphilis Early Latent Syphilis Population
Cases Percent1 Rate Cases Percent1 Rate Cases Percent1 Rate Cases Percent1 Rate Number Percent1
COUNTY TOTAL 31 100.0% 226.3 2 100.0% 14.6 0 100.0% 0.0 0 100.0% 0.0 14,833 100.0%
Female Total 25 80.6% 361.2 1 50.0% 14.4 0 0.0% 0.0 0 0.0% 0.0 6,922 46.7% Ages 00 – 09 0 0.0% 0.0 0 0.0% 0.0 0 0.0% 0.0 0 0.0% 0.0 820 11.8% 10 – 14 0 0.0% 0.0 0 0.0% 0.0 0 0.0% 0.0 0 0.0% 0.0 407 5.9% 15 – 19 7 28.0% 1,323.3 1 100.0% 189.0 0 0.0% 0.0 0 0.0% 0.0 529 7.6% 20 – 24 13 52.0% 2,777.8 0 0.0% 0.0 0 0.0% 0.0 0 0.0% 0.0 468 6.8% 25 – 29 5 20.0% 1,079.9 0 0.0% 0.0 0 0.0% 0.0 0 0.0% 0.0 463 6.7% 30 – 34 0 0.0% 0.0 0 0.0% 0.0 0 0.0% 0.0 0 0.0% 0.0 438 6.3% 35 – 44 0 0.0% 0.0 0 0.0% 0.0 0 0.0% 0.0 0 0.0% 0.0 860 12.4% 45 + 0 0.0% 0.0 0 0.0% 0.0 0 0.0% 0.0 0 0.0% 0.0 2,937 42.4% Not Specified 0 0.0% - 0 0.0% - 0 0.0% - 0 0.0% -
Male Total 6 19.4% 75.8 1 50.0% 12.6 0 0.0% 0.0 0 0.0% 0.0 7,911 53.3% Ages 00 – 09 0 0.0% 0.0 0 0.0% 0.0 0 0.0% 0.0 0 0.0% 0.0 853 10.8% 10 – 14 0 0.0% 0.0 0 0.0% 0.0 0 0.0% 0.0 0 0.0% 0.0 404 5.1% 15 – 19 0 0.0% 0.0 0 0.0% 0.0 0 0.0% 0.0 0 0.0% 0.0 444 5.6% 20 – 24 4 66.7% 633.9 1 100.0% 158.5 0 0.0% 0.0 0 0.0% 0.0 631 8.0% 25 – 29 2 33.3% 339.0 0 0.0% 0.0 0 0.0% 0.0 0 0.0% 0.0 590 7.5% 30 – 34 0 0.0% 0.0 0 0.0% 0.0 0 0.0% 0.0 0 0.0% 0.0 644 8.1% 35 – 44 0 0.0% 0.0 0 0.0% 0.0 0 0.0% 0.0 0 0.0% 0.0 1,152 14.6% 45 + 0 0.0% 0.0 0 0.0% 0.0 0 0.0% 0.0 0 0.0% 0.0 3,193 40.4% Not Specified 0 0.0% - 0 0.0% - 0 0.0% - 0 0.0% -
Gender & Race/Ethnicity Chlamydia Gonorrhea P&S Syphilis Early Latent Syphilis Population
Cases Percent1 Rate Cases Percent1 Rate Cases Percent1 Rate Cases Percent1 Rate Number Percent1
COUNTY TOTAL 31 100.0% 226.3 2 100.0% 14.6 0 100.0% 0.0 0 100.0% 0.0 14,833 100.0%
Female Total 25 80.6% 361.2 1 50.0% 14.4 0 0.0% 0.0 0 0.0% 0.0 6,922 46.7%American Indian/Alaska Native 0 0.0% 0.0 0 0.0% 0.0 0 0.0% 0.0 0 0.0% 0.0 142 2.1%Asian/Pacific Islander 0 0.0% 0.0 0 0.0% 0.0 0 0.0% 0.0 0 0.0% 0.0 90 1.3%Black/African-American 0 0.0% 0.0 0 0.0% 0.0 0 0.0% 0.0 0 0.0% 0.0 17 0.2%Latina/Hispanic 9 50.0% 442.3 0 0.0% 0.0 0 0.0% 0.0 0 0.0% 0.0 2,035 29.4%White 9 50.0% 198.9 1 100.0% 22.1 0 0.0% 0.0 0 0.0% 0.0 4,525 65.4%Other/Multi/Not Specified 7 28.0% - 0 0.0% - 0 0.0% - 0 0.0% - 113 1.6%Male Total 6 19.4% 75.8 1 50.0% 12.6 0 0.0% 0.0 0 0.0% 0.0 7,911 53.3%American Indian/Alaska Native 0 0.0% 0.0 0 0.0% 0.0 0 0.0% 0.0 0 0.0% 0.0 161 2.0%Asian/Pacific Islander 0 0.0% 0.0 0 0.0% 0.0 0 0.0% 0.0 0 0.0% 0.0 95 1.2%Black/African-American 0 0.0% 0.0 0 0.0% 0.0 0 0.0% 0.0 0 0.0% 0.0 52 0.7%Latina/Hispanic 2 50.0% 86.5 0 0.0% 0.0 0 0.0% 0.0 0 0.0% 0.0 2,313 29.2%White 2 50.0% 38.8 1 100.0% 19.4 0 0.0% 0.0 0 0.0% 0.0 5,157 65.2%Other/Multi/Not Specified 2 33.3% - 0 0.0% - 0 0.0% - 0 0.0% - 133 1.7%
California Local Health Jurisdiction STD Data Summaries, 2010 Provisional Data (July 2011)

1:100
Monterey County – Chlamydia, Gonorrhea, and P&S SyphilisRates by Age Group (2010), Race/Ethnicity (2010), and Year
0−9 10−14 15−19 20−24 25−29 30−34 35−44 45+
Age Group
0
500
1000
1500
2000
2500
3000
Chlamydia
Nat. Am. A/PI Black Latino White
Race/Ethnicity*
0
200
400
600
800
1000
1200
1400
Chlamydia
2001 2002 2003 2004 2005 2006 2007 2008 2009 2010
0
100
200
300
400
500
600
Year
Chlamydia
0−9 10−14 15−19 20−24 25−29 30−34 35−44 45+
Age Group
0
20
40
60
80
100
Gonorrhea
Nat. Am. A/PI Black Latino White
Race/Ethnicity*
0
50
100
150
200
Gonorrhea
2001 2002 2003 2004 2005 2006 2007 2008 2009 2010
0
10
20
30
40
50
60
70
Year
Gonorrhea
0−9 10−14 15−19 20−24 25−29 30−34 35−44 45+
Age Group
0
2
4
6
8
P&S Syphilis
Nat. Am. A/PI Black Latino White
Race/Ethnicity*
0
2
4
6
8
P&S Syphilis
2001 2002 2003 2004 2005 2006 2007 2008 2009 2010
0.0
0.5
1.0
1.5
2.0
2.5
3.0
Year
P&S Syphilis
Female Male Female Male
* Race data may be missing for a substantial number of cases. See the 'Data Limitations' page for further information.Note: Rates are per 100,000 population.
Source: California Department of Public Health, STD Control Branch
California Local Health Jurisdiction STD Data Summaries, 2010 Provisional Data (July 2011)

1 Gender specific age groups and race/ethnicity percent calculations exclude "Not Specified" from the denominator. 2 Overall county rates were calculated using the July 1 county population estimates from the Department of Finance. (For Monterey County, the July 1, 2010 estimate is 438,459). Note: Rates are per 100,000 population. Source: California Department of Public Health, STD Control Branch
Monterey County – Chlamydia, Gonorrhea, and Early Syphilis Cases and Rates Tables for 2010
Gender & Age Group Chlamydia Gonorrhea P&S Syphilis Early Latent Syphilis Population
Cases Percent1 Rate Cases Percent1 Rate Cases Percent1 Rate Cases Percent1 Rate Number Percent1
COUNTY TOTAL 1,426 100.0% 325.2 81 100.0% 18.5 6 100.0% 1.4 5 100.0% 1.1 433,283 100.0%
Female Total 1,112 78.0% 524.3 40 49.4% 18.9 0 0.0% 0.0 0 0.0% 0.0 212,096 49.0% Ages 00 – 09 0 0.0% 0.0 0 0.0% 0.0 0 0.0% 0.0 0 0.0% 0.0 35,067 16.5% 10 – 14 6 0.5% 40.1 0 0.0% 0.0 0 0.0% 0.0 0 0.0% 0.0 14,975 7.1% 15 – 19 331 29.8% 2,128.5 9 22.5% 57.9 0 0.0% 0.0 0 0.0% 0.0 15,551 7.3% 20 – 24 422 38.0% 2,857.1 11 27.5% 74.5 0 0.0% 0.0 0 0.0% 0.0 14,770 7.0% 25 – 29 190 17.1% 1,336.9 14 35.0% 98.5 0 0.0% 0.0 0 0.0% 0.0 14,212 6.7% 30 – 34 85 7.7% 629.8 2 5.0% 14.8 0 0.0% 0.0 0 0.0% 0.0 13,496 6.4% 35 – 44 64 5.8% 242.3 1 2.5% 3.8 0 0.0% 0.0 0 0.0% 0.0 26,418 12.5% 45 + 12 1.1% 15.5 3 7.5% 3.9 0 0.0% 0.0 0 0.0% 0.0 77,607 36.6% Not Specified 2 0.2% - 0 0.0% - 0 0.0% - 0 0.0% -
Male Total 313 21.9% 141.5 41 50.6% 18.5 6 100.0% 2.7 5 100.0% 2.3 221,187 51.0% Ages 00 – 09 0 0.0% 0.0 0 0.0% 0.0 0 0.0% 0.0 0 0.0% 0.0 36,418 16.5% 10 – 14 0 0.0% 0.0 1 2.4% 6.3 0 0.0% 0.0 0 0.0% 0.0 15,920 7.2% 15 – 19 56 18.0% 335.8 7 17.1% 42.0 1 16.7% 6.0 2 40.0% 12.0 16,675 7.5% 20 – 24 109 35.0% 586.2 14 34.1% 75.3 0 0.0% 0.0 2 40.0% 10.8 18,593 8.4% 25 – 29 76 24.4% 371.8 8 19.5% 39.1 1 16.7% 4.9 0 0.0% 0.0 20,442 9.2% 30 – 34 39 12.5% 233.8 4 9.8% 24.0 0 0.0% 0.0 1 20.0% 6.0 16,680 7.5% 35 – 44 24 7.7% 93.8 5 12.2% 19.5 2 33.3% 7.8 0 0.0% 0.0 25,577 11.6% 45 + 7 2.3% 9.9 2 4.9% 2.8 2 33.3% 2.8 0 0.0% 0.0 70,882 32.0% Not Specified 2 0.6% - 0 0.0% - 0 0.0% - 0 0.0% -
Gender & Race/Ethnicity Chlamydia Gonorrhea P&S Syphilis Early Latent Syphilis Population
Cases Percent1 Rate Cases Percent1 Rate Cases Percent1 Rate Cases Percent1 Rate Number Percent1
COUNTY TOTAL 1,426 100.0% 325.2 81 100.0% 18.5 6 100.0% 1.4 5 100.0% 1.1 433,283 100.0%
Female Total 1,112 78.0% 524.3 40 49.4% 18.9 0 0.0% 0.0 0 0.0% 0.0 212,096 49.0%American Indian/Alaska Native 6 0.7% 642.4 1 3.2% 107.1 0 0.0% 0.0 0 0.0% 0.0 934 0.4%Asian/Pacific Islander 26 3.1% 173.3 1 3.2% 6.7 0 0.0% 0.0 0 0.0% 0.0 15,004 7.1%Black/African-American 44 5.2% 1,294.9 7 22.6% 206.0 0 0.0% 0.0 0 0.0% 0.0 3,398 1.6%Latina/Hispanic 629 74.5% 536.9 17 54.8% 14.5 0 0.0% 0.0 0 0.0% 0.0 117,159 55.2%White 139 16.5% 197.1 5 16.1% 7.1 0 0.0% 0.0 0 0.0% 0.0 70,524 33.3%Other/Multi/Not Specified 268 24.1% - 9 22.5% - 0 0.0% - 0 0.0% - 5,077 2.4%Male Total 313 21.9% 141.5 41 50.6% 18.5 6 100.0% 2.7 5 100.0% 2.3 221,187 51.0%American Indian/Alaska Native 1 0.4% 95.8 0 0.0% 0.0 0 0.0% 0.0 0 0.0% 0.0 1,044 0.5%Asian/Pacific Islander 6 2.6% 44.1 0 0.0% 0.0 1 16.7% 7.3 0 0.0% 0.0 13,608 6.2%Black/African-American 11 4.8% 145.6 4 12.9% 52.9 0 0.0% 0.0 0 0.0% 0.0 7,557 3.4%Latina/Hispanic 168 74.0% 129.5 17 54.8% 13.1 3 50.0% 2.3 5 100.0% 3.9 129,690 58.6%White 41 18.1% 63.6 10 32.3% 15.5 2 33.3% 3.1 0 0.0% 0.0 64,482 29.2%Other/Multi/Not Specified 86 27.5% - 10 24.4% - 0 0.0% - 0 0.0% - 4,806 2.2%
California Local Health Jurisdiction STD Data Summaries, 2010 Provisional Data (July 2011)
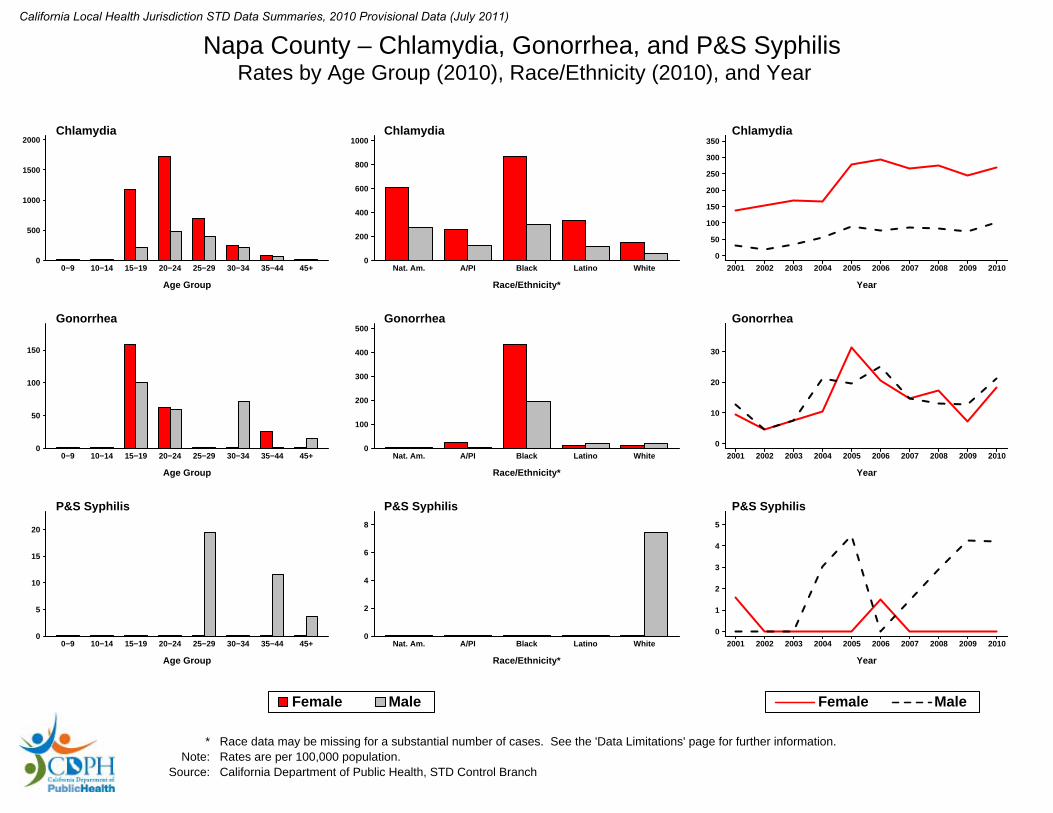
1:100
Napa County – Chlamydia, Gonorrhea, and P&S SyphilisRates by Age Group (2010), Race/Ethnicity (2010), and Year
0−9 10−14 15−19 20−24 25−29 30−34 35−44 45+
Age Group
0
500
1000
1500
2000 Chlamydia
Nat. Am. A/PI Black Latino White
Race/Ethnicity*
0
200
400
600
800
1000 Chlamydia
2001 2002 2003 2004 2005 2006 2007 2008 2009 2010
0
50
100
150
200
250
300
350
Year
Chlamydia
0−9 10−14 15−19 20−24 25−29 30−34 35−44 45+
Age Group
0
50
100
150
Gonorrhea
Nat. Am. A/PI Black Latino White
Race/Ethnicity*
0
100
200
300
400
500 Gonorrhea
2001 2002 2003 2004 2005 2006 2007 2008 2009 2010
0
10
20
30
Year
Gonorrhea
0−9 10−14 15−19 20−24 25−29 30−34 35−44 45+
Age Group
0
5
10
15
20
P&S Syphilis
Nat. Am. A/PI Black Latino White
Race/Ethnicity*
0
2
4
6
8
P&S Syphilis
2001 2002 2003 2004 2005 2006 2007 2008 2009 2010
0
1
2
3
4
5
Year
P&S Syphilis
Female Male Female Male
* Race data may be missing for a substantial number of cases. See the 'Data Limitations' page for further information.Note: Rates are per 100,000 population.
Source: California Department of Public Health, STD Control Branch
California Local Health Jurisdiction STD Data Summaries, 2010 Provisional Data (July 2011)

1 Gender specific age groups and race/ethnicity percent calculations exclude "Not Specified" from the denominator. 2 Overall county rates were calculated using the July 1 county population estimates from the Department of Finance. (For Napa County, the July 1, 2010 estimate is 139,748). Note: Rates are per 100,000 population. Source: California Department of Public Health, STD Control Branch
Napa County – Chlamydia, Gonorrhea, and Early Syphilis Cases and Rates Tables for 2010
Gender & Age Group Chlamydia Gonorrhea P&S Syphilis Early Latent Syphilis Population
Cases Percent1 Rate Cases Percent1 Rate Cases Percent1 Rate Cases Percent1 Rate Number Percent1
COUNTY TOTAL 267 100.0% 191.1 28 100.0% 20.0 3 100.0% 2.1 0 100.0% 0.0 142,767 100.0%
Female Total 193 72.3% 269.4 13 46.4% 18.1 0 0.0% 0.0 0 0.0% 0.0 71,628 50.2% Ages 00 – 09 0 0.0% 0.0 0 0.0% 0.0 0 0.0% 0.0 0 0.0% 0.0 9,694 13.5% 10 – 14 0 0.0% 0.0 0 0.0% 0.0 0 0.0% 0.0 0 0.0% 0.0 4,899 6.8% 15 – 19 59 30.6% 1,169.9 8 61.5% 158.6 0 0.0% 0.0 0 0.0% 0.0 5,043 7.0% 20 – 24 83 43.0% 1,723.4 3 23.1% 62.3 0 0.0% 0.0 0 0.0% 0.0 4,816 6.7% 25 – 29 32 16.6% 695.0 0 0.0% 0.0 0 0.0% 0.0 0 0.0% 0.0 4,604 6.4% 30 – 34 9 4.7% 242.7 0 0.0% 0.0 0 0.0% 0.0 0 0.0% 0.0 3,709 5.2% 35 – 44 7 3.6% 87.5 2 15.4% 25.0 0 0.0% 0.0 0 0.0% 0.0 7,998 11.2% 45 + 3 1.6% 9.7 0 0.0% 0.0 0 0.0% 0.0 0 0.0% 0.0 30,865 43.1% Not Specified 0 0.0% - 0 0.0% - 0 0.0% - 0 0.0% -
Male Total 73 27.3% 102.6 15 53.6% 21.1 3 100.0% 4.2 0 0.0% 0.0 71,139 49.8% Ages 00 – 09 0 0.0% 0.0 0 0.0% 0.0 0 0.0% 0.0 0 0.0% 0.0 10,400 14.6% 10 – 14 0 0.0% 0.0 0 0.0% 0.0 0 0.0% 0.0 0 0.0% 0.0 4,984 7.0% 15 – 19 11 15.1% 221.8 5 33.3% 100.8 0 0.0% 0.0 0 0.0% 0.0 4,960 7.0% 20 – 24 24 32.9% 477.8 3 20.0% 59.7 0 0.0% 0.0 0 0.0% 0.0 5,023 7.1% 25 – 29 20 27.4% 389.8 0 0.0% 0.0 1 33.3% 19.5 0 0.0% 0.0 5,131 7.2% 30 – 34 9 12.3% 211.9 3 20.0% 70.6 0 0.0% 0.0 0 0.0% 0.0 4,247 6.0% 35 – 44 6 8.2% 69.8 0 0.0% 0.0 1 33.3% 11.6 0 0.0% 0.0 8,593 12.1% 45 + 3 4.1% 10.8 4 26.7% 14.4 1 33.3% 3.6 0 0.0% 0.0 27,801 39.1% Not Specified 0 0.0% - 0 0.0% - 0 0.0% - 0 0.0% -
Gender & Race/Ethnicity Chlamydia Gonorrhea P&S Syphilis Early Latent Syphilis Population
Cases Percent1 Rate Cases Percent1 Rate Cases Percent1 Rate Cases Percent1 Rate Number Percent1
COUNTY TOTAL 267 100.0% 191.1 28 100.0% 20.0 3 100.0% 2.1 0 100.0% 0.0 142,767 100.0%
Female Total 193 72.3% 269.4 13 46.4% 18.1 0 0.0% 0.0 0 0.0% 0.0 71,628 50.2%American Indian/Alaska Native 2 1.3% 609.8 0 0.0% 0.0 0 0.0% 0.0 0 0.0% 0.0 328 0.5%Asian/Pacific Islander 11 7.1% 258.8 1 9.1% 23.5 0 0.0% 0.0 0 0.0% 0.0 4,250 5.9%Black/African-American 6 3.8% 867.1 3 27.3% 433.5 0 0.0% 0.0 0 0.0% 0.0 692 1.0%Latina/Hispanic 74 47.4% 331.7 3 27.3% 13.4 0 0.0% 0.0 0 0.0% 0.0 22,308 31.1%White 63 40.4% 147.3 4 36.4% 9.4 0 0.0% 0.0 0 0.0% 0.0 42,756 59.7%Other/Multi/Not Specified 37 19.2% - 2 15.4% - 0 0.0% - 0 0.0% - 1,294 1.8%Male Total 73 27.3% 102.6 15 53.6% 21.1 3 100.0% 4.2 0 0.0% 0.0 71,139 49.8%American Indian/Alaska Native 1 1.6% 271.0 0 0.0% 0.0 0 0.0% 0.0 0 0.0% 0.0 369 0.5%Asian/Pacific Islander 5 8.1% 128.0 0 0.0% 0.0 0 0.0% 0.0 0 0.0% 0.0 3,907 5.5%Black/African-American 3 4.8% 295.6 2 13.3% 197.0 0 0.0% 0.0 0 0.0% 0.0 1,015 1.4%Latina/Hispanic 29 46.8% 119.4 5 33.3% 20.6 0 0.0% 0.0 0 0.0% 0.0 24,291 34.1%White 24 38.7% 59.6 8 53.3% 19.9 3 100.0% 7.5 0 0.0% 0.0 40,253 56.6%Other/Multi/Not Specified 11 15.1% - 0 0.0% - 0 0.0% - 0 0.0% - 1,304 1.8%
California Local Health Jurisdiction STD Data Summaries, 2010 Provisional Data (July 2011)

1:100
Nevada County – Chlamydia, Gonorrhea, and P&S SyphilisRates by Age Group (2010), Race/Ethnicity (2010), and Year
0−9 10−14 15−19 20−24 25−29 30−34 35−44 45+
Age Group
0
500
1000
1500
Chlamydia
Nat. Am. A/PI Black Latino White
Race/Ethnicity*
0
200
400
600
800
1000
Chlamydia
2001 2002 2003 2004 2005 2006 2007 2008 2009 2010
0
50
100
150
200
250
Year
Chlamydia
0−9 10−14 15−19 20−24 25−29 30−34 35−44 45+
Age Group
0
20
40
60
80
Gonorrhea
Nat. Am. A/PI Black Latino White
Race/Ethnicity*
0.0
0.5
1.0
1.5
2.0
2.5 Gonorrhea
2001 2002 2003 2004 2005 2006 2007 2008 2009 2010
0
5
10
15
20
Year
Gonorrhea
0−9 10−14 15−19 20−24 25−29 30−34 35−44 45+
Age Group
0
1
2
3
4
P&S Syphilis
Nat. Am. A/PI Black Latino White
Race/Ethnicity*
0.0
0.5
1.0
1.5
2.0
2.5 P&S Syphilis
2001 2002 2003 2004 2005 2006 2007 2008 2009 2010
0
1
2
3
4
Year
P&S Syphilis
Female Male Female Male
* Race data may be missing for a substantial number of cases. See the 'Data Limitations' page for further information.Note: Rates are per 100,000 population.
Source: California Department of Public Health, STD Control Branch
California Local Health Jurisdiction STD Data Summaries, 2010 Provisional Data (July 2011)

1 Gender specific age groups and race/ethnicity percent calculations exclude "Not Specified" from the denominator. 2 Overall county rates were calculated using the July 1 county population estimates from the Department of Finance. (For Nevada County, the July 1, 2010 estimate is 98,915). Note: Rates are per 100,000 population. Source: California Department of Public Health, STD Control Branch
Nevada County – Chlamydia, Gonorrhea, and Early Syphilis Cases and Rates Tables for 2010
Gender & Age Group Chlamydia Gonorrhea P&S Syphilis Early Latent Syphilis Population
Cases Percent1 Rate Cases Percent1 Rate Cases Percent1 Rate Cases Percent1 Rate Number Percent1
COUNTY TOTAL 144 100.0% 145.6 7 100.0% 7.1 1 100.0% 1.0 0 100.0% 0.0 102,649 100.0%
Female Total 100 69.4% 194.1 3 42.9% 5.8 0 0.0% 0.0 0 0.0% 0.0 51,519 50.2% Ages 00 – 09 0 0.0% 0.0 0 0.0% 0.0 0 0.0% 0.0 0 0.0% 0.0 3,976 7.7% 10 – 14 1 1.0% 39.7 0 0.0% 0.0 0 0.0% 0.0 0 0.0% 0.0 2,516 4.9% 15 – 19 34 34.0% 984.4 1 33.3% 29.0 0 0.0% 0.0 0 0.0% 0.0 3,454 6.7% 20 – 24 46 46.0% 1,413.6 1 33.3% 30.7 0 0.0% 0.0 0 0.0% 0.0 3,254 6.3% 25 – 29 13 13.0% 593.6 0 0.0% 0.0 0 0.0% 0.0 0 0.0% 0.0 2,190 4.3% 30 – 34 0 0.0% 0.0 1 33.3% 78.4 0 0.0% 0.0 0 0.0% 0.0 1,275 2.5% 35 – 44 5 5.0% 86.5 0 0.0% 0.0 0 0.0% 0.0 0 0.0% 0.0 5,781 11.2% 45 + 1 1.0% 3.4 0 0.0% 0.0 0 0.0% 0.0 0 0.0% 0.0 29,073 56.4% Not Specified 0 0.0% - 0 0.0% - 0 0.0% - 0 0.0% -
Male Total 44 30.6% 86.1 4 57.1% 7.8 1 100.0% 2.0 0 0.0% 0.0 51,130 49.8% Ages 00 – 09 0 0.0% 0.0 0 0.0% 0.0 0 0.0% 0.0 0 0.0% 0.0 4,279 8.4% 10 – 14 0 0.0% 0.0 0 0.0% 0.0 0 0.0% 0.0 0 0.0% 0.0 2,921 5.7% 15 – 19 12 27.3% 318.6 0 0.0% 0.0 0 0.0% 0.0 0 0.0% 0.0 3,766 7.4% 20 – 24 11 25.0% 295.9 2 50.0% 53.8 0 0.0% 0.0 0 0.0% 0.0 3,718 7.3% 25 – 29 11 25.0% 405.5 1 25.0% 36.9 0 0.0% 0.0 0 0.0% 0.0 2,713 5.3% 30 – 34 7 15.9% 448.4 0 0.0% 0.0 0 0.0% 0.0 0 0.0% 0.0 1,561 3.1% 35 – 44 2 4.5% 35.0 0 0.0% 0.0 0 0.0% 0.0 0 0.0% 0.0 5,713 11.2% 45 + 1 2.3% 3.8 1 25.0% 3.8 1 100.0% 3.8 0 0.0% 0.0 26,459 51.7% Not Specified 0 0.0% - 0 0.0% - 0 0.0% - 0 0.0% -
Gender & Race/Ethnicity Chlamydia Gonorrhea P&S Syphilis Early Latent Syphilis Population
Cases Percent1 Rate Cases Percent1 Rate Cases Percent1 Rate Cases Percent1 Rate Number Percent1
COUNTY TOTAL 144 100.0% 145.6 7 100.0% 7.1 1 100.0% 1.0 0 100.0% 0.0 102,649 100.0%
Female Total 100 69.4% 194.1 3 42.9% 5.8 0 0.0% 0.0 0 0.0% 0.0 51,519 50.2%American Indian/Alaska Native 2 3.8% 549.5 0 0.0% 0.0 0 0.0% 0.0 0 0.0% 0.0 364 0.7%Asian/Pacific Islander 1 1.9% 202.8 0 0.0% 0.0 0 0.0% 0.0 0 0.0% 0.0 493 1.0%Black/African-American 1 1.9% 925.9 0 0.0% 0.0 0 0.0% 0.0 0 0.0% 0.0 108 0.2%Latina/Hispanic 9 17.0% 281.2 0 0.0% 0.0 0 0.0% 0.0 0 0.0% 0.0 3,201 6.2%White 40 75.5% 86.3 1 100.0% 2.2 0 0.0% 0.0 0 0.0% 0.0 46,357 90.0%Other/Multi/Not Specified 47 47.0% - 2 66.7% - 0 0.0% - 0 0.0% - 996 1.9%Male Total 44 30.6% 86.1 4 57.1% 7.8 1 100.0% 2.0 0 0.0% 0.0 51,130 49.8%American Indian/Alaska Native 1 3.6% 274.0 0 0.0% 0.0 0 0.0% 0.0 0 0.0% 0.0 365 0.7%Asian/Pacific Islander 1 3.6% 259.7 0 0.0% 0.0 0 0.0% 0.0 0 0.0% 0.0 385 0.8%Black/African-American 0 0.0% 0.0 0 0.0% 0.0 0 0.0% 0.0 0 0.0% 0.0 159 0.3%Latina/Hispanic 8 28.6% 233.2 0 0.0% 0.0 0 0.0% 0.0 0 0.0% 0.0 3,430 6.7%White 18 64.3% 39.3 1 100.0% 2.2 1 100.0% 2.2 0 0.0% 0.0 45,800 89.6%Other/Multi/Not Specified 16 36.4% - 3 75.0% - 0 0.0% - 0 0.0% - 991 1.9%
California Local Health Jurisdiction STD Data Summaries, 2010 Provisional Data (July 2011)
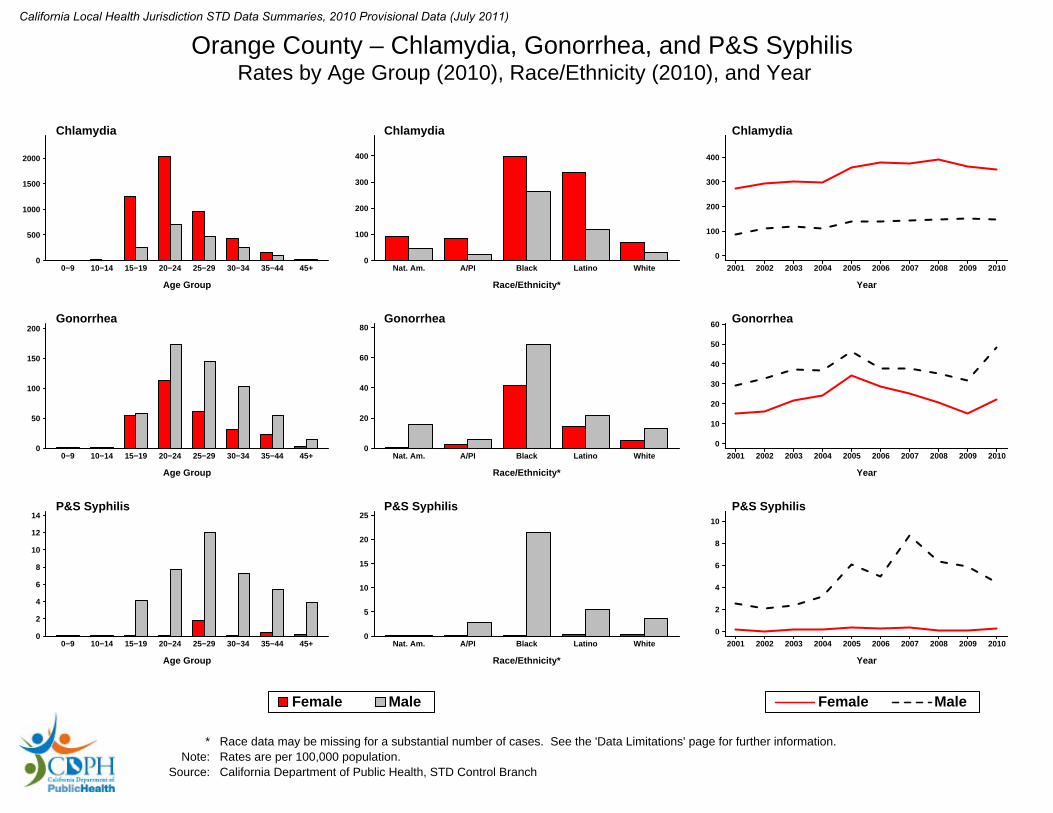
1:100
Orange County – Chlamydia, Gonorrhea, and P&S SyphilisRates by Age Group (2010), Race/Ethnicity (2010), and Year
0−9 10−14 15−19 20−24 25−29 30−34 35−44 45+
Age Group
0
500
1000
1500
2000
Chlamydia
Nat. Am. A/PI Black Latino White
Race/Ethnicity*
0
100
200
300
400
Chlamydia
2001 2002 2003 2004 2005 2006 2007 2008 2009 2010
0
100
200
300
400
Year
Chlamydia
0−9 10−14 15−19 20−24 25−29 30−34 35−44 45+
Age Group
0
50
100
150
200 Gonorrhea
Nat. Am. A/PI Black Latino White
Race/Ethnicity*
0
20
40
60
80 Gonorrhea
2001 2002 2003 2004 2005 2006 2007 2008 2009 2010
0
10
20
30
40
50
60
Year
Gonorrhea
0−9 10−14 15−19 20−24 25−29 30−34 35−44 45+
Age Group
0
2
4
6
8
10
12
14 P&S Syphilis
Nat. Am. A/PI Black Latino White
Race/Ethnicity*
0
5
10
15
20
25 P&S Syphilis
2001 2002 2003 2004 2005 2006 2007 2008 2009 2010
0
2
4
6
8
10
Year
P&S Syphilis
Female Male Female Male
* Race data may be missing for a substantial number of cases. See the 'Data Limitations' page for further information.Note: Rates are per 100,000 population.
Source: California Department of Public Health, STD Control Branch
California Local Health Jurisdiction STD Data Summaries, 2010 Provisional Data (July 2011)

1 Gender specific age groups and race/ethnicity percent calculations exclude "Not Specified" from the denominator. 2 Overall county rates were calculated using the July 1 county population estimates from the Department of Finance. (For Orange County, the July 1, 2010 estimate is 3,182,171). Note: Rates are per 100,000 population. Source: California Department of Public Health, STD Control Branch
Orange County – Chlamydia, Gonorrhea, and Early Syphilis Cases and Rates Tables for 2010
Gender & Age Group Chlamydia Gonorrhea P&S Syphilis Early Latent Syphilis Population
Cases Percent1 Rate Cases Percent1 Rate Cases Percent1 Rate Cases Percent1 Rate Number Percent1
COUNTY TOTAL 8,063 100.0% 253.4 1,137 100.0% 35.7 75 100.0% 2.4 46 100.0% 1.4 3,227,836 100.0%
Female Total 5,678 70.4% 349.2 358 31.5% 22.0 4 5.3% 0.2 3 6.5% 0.2 1,625,960 50.4% Ages 00 – 09 1 0.0% 0.5 0 0.0% 0.0 0 0.0% 0.0 0 0.0% 0.0 218,259 13.4% 10 – 14 22 0.4% 21.1 0 0.0% 0.0 0 0.0% 0.0 0 0.0% 0.0 104,132 6.4% 15 – 19 1,448 25.6% 1,248.2 64 17.9% 55.2 0 0.0% 0.0 0 0.0% 0.0 116,004 7.1% 20 – 24 2,243 39.7% 2,034.2 124 34.7% 112.5 0 0.0% 0.0 1 33.3% 0.9 110,267 6.8% 25 – 29 1,024 18.1% 950.4 66 18.5% 61.3 2 50.0% 1.9 1 33.3% 0.9 107,739 6.6% 30 – 34 458 8.1% 428.3 34 9.5% 31.8 0 0.0% 0.0 1 33.3% 0.9 106,923 6.6% 35 – 44 362 6.4% 149.1 55 15.4% 22.7 1 25.0% 0.4 0 0.0% 0.0 242,797 14.9% 45 + 98 1.7% 15.8 14 3.9% 2.3 1 25.0% 0.2 0 0.0% 0.0 619,839 38.1% Not Specified 22 0.4% - 1 0.3% - 0 0.0% - 0 0.0% -
Male Total 2,340 29.0% 146.1 774 68.1% 48.3 71 94.7% 4.4 43 93.5% 2.7 1,601,876 49.6% Ages 00 – 09 3 0.1% 1.3 0 0.0% 0.0 0 0.0% 0.0 0 0.0% 0.0 227,348 14.2% 10 – 14 2 0.1% 1.8 0 0.0% 0.0 0 0.0% 0.0 0 0.0% 0.0 109,205 6.8% 15 – 19 316 13.5% 257.3 71 9.2% 57.8 5 7.0% 4.1 1 2.3% 0.8 122,826 7.7% 20 – 24 824 35.2% 704.2 203 26.3% 173.5 9 12.7% 7.7 6 14.0% 5.1 117,005 7.3% 25 – 29 541 23.1% 465.4 169 21.9% 145.4 14 19.7% 12.0 6 14.0% 5.2 116,243 7.3% 30 – 34 290 12.4% 262.0 115 14.9% 103.9 8 11.3% 7.2 9 20.9% 8.1 110,682 6.9% 35 – 44 253 10.8% 104.7 131 16.9% 54.2 13 18.3% 5.4 14 32.6% 5.8 241,605 15.1% 45 + 109 4.7% 19.6 84 10.9% 15.1 22 31.0% 4.0 7 16.3% 1.3 556,962 34.8% Not Specified 2 0.1% - 1 0.1% - 0 0.0% - 0 0.0% -
Gender & Race/Ethnicity Chlamydia Gonorrhea P&S Syphilis Early Latent Syphilis Population
Cases Percent1 Rate Cases Percent1 Rate Cases Percent1 Rate Cases Percent1 Rate Number Percent1
COUNTY TOTAL 8,063 100.0% 253.4 1,137 100.0% 35.7 75 100.0% 2.4 46 100.0% 1.4 3,227,836 100.0%
Female Total 5,678 70.4% 349.2 358 31.5% 22.0 4 5.3% 0.2 3 6.5% 0.2 1,625,960 50.4%American Indian/Alaska Native 6 0.2% 91.7 0 0.0% 0.0 0 0.0% 0.0 0 0.0% 0.0 6,545 0.4%Asian/Pacific Islander 226 8.3% 82.7 6 4.5% 2.2 0 0.0% 0.0 0 0.0% 0.0 273,338 16.8%Black/African-American 86 3.1% 398.0 9 6.8% 41.6 0 0.0% 0.0 0 0.0% 0.0 21,610 1.3%Latina/Hispanic 1,928 70.5% 337.6 81 60.9% 14.2 2 50.0% 0.4 1 33.3% 0.2 571,065 35.1%White 488 17.8% 67.6 37 27.8% 5.1 2 50.0% 0.3 2 66.7% 0.3 722,244 44.4%Other/Multi/Not Specified 2,944 51.8% - 225 62.8% - 0 0.0% - 0 0.0% - 31,158 1.9%Male Total 2,340 29.0% 146.1 774 68.1% 48.3 71 94.7% 4.4 43 93.5% 2.7 1,601,876 49.6%American Indian/Alaska Native 3 0.3% 47.4 1 0.4% 15.8 0 0.0% 0.0 0 0.0% 0.0 6,335 0.4%Asian/Pacific Islander 53 5.2% 20.7 15 6.0% 5.9 7 10.1% 2.7 1 2.4% 0.4 256,332 16.0%Black/African-American 61 5.9% 262.2 16 6.4% 68.8 5 7.2% 21.5 3 7.1% 12.9 23,263 1.5%Latina/Hispanic 688 66.9% 117.2 128 51.0% 21.8 32 46.4% 5.4 23 54.8% 3.9 587,205 36.7%White 223 21.7% 32.0 91 36.3% 13.0 25 36.2% 3.6 15 35.7% 2.2 697,643 43.6%Other/Multi/Not Specified 1,312 56.1% - 523 67.6% - 2 2.8% - 1 2.3% - 31,098 1.9%
California Local Health Jurisdiction STD Data Summaries, 2010 Provisional Data (July 2011)

1:100
Pasadena City – Chlamydia, Gonorrhea, and P&S SyphilisRates by Age Group (2010), Race/Ethnicity (2010), and Year
0−9 10−14 15−19 20−24 25−29 30−34 35−44 45+
Age Group
0
500
1000
1500
2000
2500
Chlamydia
Nat. Am. A/PI Black Latino White
Race/Ethnicity*
0
100
200
300
400
500
600
700 Chlamydia
2001 2002 2003 2004 2005 2006 2007 2008 2009 2010
0
100
200
300
400
500
600
700
Year
Chlamydia
0−9 10−14 15−19 20−24 25−29 30−34 35−44 45+
Age Group
0
50
100
150
200
250
Gonorrhea
Nat. Am. A/PI Black Latino White
Race/Ethnicity*
0
20
40
60
80
100
Gonorrhea
2001 2002 2003 2004 2005 2006 2007 2008 2009 2010
0
50
100
150
Year
Gonorrhea
0−9 10−14 15−19 20−24 25−29 30−34 35−44 45+
Age Group
0
1 P&S Syphilis
Nat. Am. A/PI Black Latino White
Race/Ethnicity*
0
1 P&S Syphilis
2001 2002 2003 2004 2005 2006 2007 2008 2009 2010
0
5
10
15
Year
P&S Syphilis
Female Male Female Male
* Race data may be missing for a substantial number of cases. See the 'Data Limitations' page for further information.Note: Rates are per 100,000 population.
Source: California Department of Public Health, STD Control Branch
California Local Health Jurisdiction STD Data Summaries, 2010 Provisional Data (July 2011)

1 Gender specific age groups and race/ethnicity percent calculations exclude "Not Specified" from the denominator. 2 Total city population was calculated by multiplying the July 1 county population estimate by the January 1 (E-1) city to county ratio from the Department of Finance.
Census 2000 gender/age/race distribution percentages were then applied to this total. Note: Rates are per 100,000 population. Source: California Department of Public Health, STD Control Branch
Pasadena City – Chlamydia, Gonorrhea, and Early Syphilis Cases and Rates Tables for 2010
Gender & Age Group Chlamydia Gonorrhea P&S Syphilis Early Latent Syphilis Population
Cases Percent1 Rate Cases Percent1 Rate Cases Percent1 Rate Cases Percent1 Rate Number Percent1
CITY TOTAL 366 100.0% 251.0 57 100.0% 39.1 0 100.0% 0.0 4 100.0% 2.7 145,840 100.0%
Female Total 244 66.7% 327.4 15 26.3% 20.1 0 0.0% 0.0 1 25.0% 1.3 74,524 51.1% Ages 00 – 09 0 0.0% 0.0 0 0.0% 0.0 0 0.0% 0.0 0 0.0% 0.0 9,940 13.3% 10 – 14 3 1.2% 69.9 0 0.0% 0.0 0 0.0% 0.0 0 0.0% 0.0 4,291 5.8% 15 – 19 90 37.0% 2,398.1 6 42.9% 159.9 0 0.0% 0.0 0 0.0% 0.0 3,753 5.0% 20 – 24 79 32.5% 1,646.5 2 14.3% 41.7 0 0.0% 0.0 0 0.0% 0.0 4,798 6.4% 25 – 29 39 16.0% 593.4 1 7.1% 15.2 0 0.0% 0.0 1 100.0% 15.2 6,572 8.8% 30 – 34 14 5.8% 211.5 3 21.4% 45.3 0 0.0% 0.0 0 0.0% 0.0 6,619 8.9% 35 – 44 10 4.1% 83.8 1 7.1% 8.4 0 0.0% 0.0 0 0.0% 0.0 11,935 16.0% 45 + 8 3.3% 30.1 1 7.1% 3.8 0 0.0% 0.0 0 0.0% 0.0 26,614 35.7% Not Specified 1 0.4% - 1 6.7% - 0 0.0% - 0 0.0% -
Male Total 119 32.5% 166.9 42 73.7% 58.9 0 0.0% 0.0 3 75.0% 4.2 71,316 48.9% Ages 00 – 09 0 0.0% 0.0 0 0.0% 0.0 0 0.0% 0.0 0 0.0% 0.0 10,229 14.3% 10 – 14 0 0.0% 0.0 0 0.0% 0.0 0 0.0% 0.0 0 0.0% 0.0 4,531 6.4% 15 – 19 26 22.0% 594.0 5 11.9% 114.2 0 0.0% 0.0 0 0.0% 0.0 4,377 6.1% 20 – 24 32 27.1% 596.3 13 31.0% 242.3 0 0.0% 0.0 1 33.3% 18.6 5,366 7.5% 25 – 29 24 20.3% 352.4 7 16.7% 102.8 0 0.0% 0.0 0 0.0% 0.0 6,810 9.5% 30 – 34 14 11.9% 201.7 7 16.7% 100.8 0 0.0% 0.0 1 33.3% 14.4 6,942 9.7% 35 – 44 13 11.0% 108.1 4 9.5% 33.3 0 0.0% 0.0 1 33.3% 8.3 12,024 16.9% 45 + 9 7.6% 42.8 6 14.3% 28.5 0 0.0% 0.0 0 0.0% 0.0 21,037 29.5% Not Specified 1 0.8% - 0 0.0% - 0 0.0% - 0 0.0% -
Gender & Race/Ethnicity Chlamydia Gonorrhea P&S Syphilis Early Latent Syphilis Population
Cases Percent1 Rate Cases Percent1 Rate Cases Percent1 Rate Cases Percent1 Rate Number Percent1
CITY TOTAL 366 100.0% 251.0 57 100.0% 39.1 0 100.0% 0.0 4 100.0% 2.7 145,840 100.0%
Female Total 244 66.7% 327.4 15 26.3% 20.1 0 0.0% 0.0 1 25.0% 1.3 74,524 51.1%American Indian/Alaska Native 0 0.0% 0.0 0 0.0% 0.0 0 0.0% 0.0 0 0.0% 0.0 185 0.2%Asian/Pacific Islander 7 4.7% 89.6 1 9.1% 12.8 0 0.0% 0.0 0 0.0% 0.0 7,809 10.5%Black/African-American 61 40.7% 550.2 4 36.4% 36.1 0 0.0% 0.0 0 0.0% 0.0 11,086 14.9%Latina/Hispanic 68 45.3% 282.2 5 45.5% 20.7 0 0.0% 0.0 0 0.0% 0.0 24,098 32.3%White 14 9.3% 48.4 1 9.1% 3.5 0 0.0% 0.0 1 100.0% 3.5 28,902 38.8%Other/Multi/Not Specified 94 38.5% - 4 26.7% - 0 0.0% - 0 0.0% - 2,443 3.3%Male Total 119 32.5% 166.9 42 73.7% 58.9 0 0.0% 0.0 3 75.0% 4.2 71,316 48.9%American Indian/Alaska Native 1 1.3% 595.2 0 0.0% 0.0 0 0.0% 0.0 0 0.0% 0.0 168 0.2%Asian/Pacific Islander 7 9.0% 103.9 1 5.3% 14.8 0 0.0% 0.0 2 66.7% 29.7 6,735 9.4%Black/African-American 30 38.5% 323.0 9 47.4% 96.9 0 0.0% 0.0 0 0.0% 0.0 9,288 13.0%Latina/Hispanic 31 39.7% 126.0 6 31.6% 24.4 0 0.0% 0.0 1 33.3% 4.1 24,612 34.5%White 9 11.5% 32.0 3 15.8% 10.7 0 0.0% 0.0 0 0.0% 0.0 28,134 39.4%Other/Multi/Not Specified 41 34.5% - 23 54.8% - 0 0.0% - 0 0.0% - 2,379 3.3%
California Local Health Jurisdiction STD Data Summaries, 2010 Provisional Data (July 2011)

1:100
Placer County – Chlamydia, Gonorrhea, and P&S SyphilisRates by Age Group (2010), Race/Ethnicity (2010), and Year
0−9 10−14 15−19 20−24 25−29 30−34 35−44 45+
Age Group
0
500
1000
1500
Chlamydia
Nat. Am. A/PI Black Latino White
Race/Ethnicity*
0
500
1000
1500 Chlamydia
2001 2002 2003 2004 2005 2006 2007 2008 2009 2010
0
50
100
150
200
250
300
350
Year
Chlamydia
0−9 10−14 15−19 20−24 25−29 30−34 35−44 45+
Age Group
0
20
40
60
80
100 Gonorrhea
Nat. Am. A/PI Black Latino White
Race/Ethnicity*
0
50
100
150
200
250
300
350 Gonorrhea
2001 2002 2003 2004 2005 2006 2007 2008 2009 2010
0
5
10
15
20
25
30
35
Year
Gonorrhea
0−9 10−14 15−19 20−24 25−29 30−34 35−44 45+
Age Group
0
5
10
15
P&S Syphilis
Nat. Am. A/PI Black Latino White
Race/Ethnicity*
0
20
40
60
80
100 P&S Syphilis
2001 2002 2003 2004 2005 2006 2007 2008 2009 2010
0.0
0.5
1.0
1.5
2.0
2.5
3.0
Year
P&S Syphilis
Female Male Female Male
* Race data may be missing for a substantial number of cases. See the 'Data Limitations' page for further information.Note: Rates are per 100,000 population.
Source: California Department of Public Health, STD Control Branch
California Local Health Jurisdiction STD Data Summaries, 2010 Provisional Data (July 2011)

1 Gender specific age groups and race/ethnicity percent calculations exclude "Not Specified" from the denominator. 2 Overall county rates were calculated using the July 1 county population estimates from the Department of Finance. (For Placer County, the July 1, 2010 estimate is 350,198). Note: Rates are per 100,000 population. Source: California Department of Public Health, STD Control Branch
Placer County – Chlamydia, Gonorrhea, and Early Syphilis Cases and Rates Tables for 2010
Gender & Age Group Chlamydia Gonorrhea P&S Syphilis Early Latent Syphilis Population
Cases Percent1 Rate Cases Percent1 Rate Cases Percent1 Rate Cases Percent1 Rate Number Percent1
COUNTY TOTAL 604 100.0% 172.5 64 100.0% 18.3 4 100.0% 1.1 1 100.0% 0.3 347,543 100.0%
Female Total 452 74.8% 253.9 32 50.0% 18.0 0 0.0% 0.0 0 0.0% 0.0 178,024 51.2% Ages 00 – 09 0 0.0% 0.0 0 0.0% 0.0 0 0.0% 0.0 0 0.0% 0.0 21,482 12.1% 10 – 14 3 0.7% 24.4 2 6.3% 16.3 0 0.0% 0.0 0 0.0% 0.0 12,299 6.9% 15 – 19 178 39.4% 1,294.2 6 18.8% 43.6 0 0.0% 0.0 0 0.0% 0.0 13,754 7.7% 20 – 24 167 36.9% 1,375.2 7 21.9% 57.6 0 0.0% 0.0 0 0.0% 0.0 12,144 6.8% 25 – 29 65 14.4% 723.3 6 18.8% 66.8 0 0.0% 0.0 0 0.0% 0.0 8,986 5.0% 30 – 34 20 4.4% 312.5 4 12.5% 62.5 0 0.0% 0.0 0 0.0% 0.0 6,401 3.6% 35 – 44 16 3.5% 68.2 6 18.8% 25.6 0 0.0% 0.0 0 0.0% 0.0 23,461 13.2% 45 + 3 0.7% 3.8 1 3.1% 1.3 0 0.0% 0.0 0 0.0% 0.0 79,497 44.7% Not Specified 0 0.0% - 0 0.0% - 0 0.0% - 0 0.0% -
Male Total 152 25.2% 89.7 32 50.0% 18.9 4 100.0% 2.4 1 100.0% 0.6 169,519 48.8% Ages 00 – 09 0 0.0% 0.0 0 0.0% 0.0 0 0.0% 0.0 0 0.0% 0.0 23,075 13.6% 10 – 14 0 0.0% 0.0 0 0.0% 0.0 0 0.0% 0.0 0 0.0% 0.0 12,255 7.2% 15 – 19 32 21.1% 235.9 2 6.3% 14.7 1 25.0% 7.4 0 0.0% 0.0 13,567 8.0% 20 – 24 55 36.2% 440.2 11 34.4% 88.0 0 0.0% 0.0 1 100.0% 8.0 12,493 7.4% 25 – 29 31 20.4% 321.2 6 18.8% 62.2 0 0.0% 0.0 0 0.0% 0.0 9,650 5.7% 30 – 34 17 11.2% 252.0 4 12.5% 59.3 1 25.0% 14.8 0 0.0% 0.0 6,745 4.0% 35 – 44 11 7.2% 50.7 3 9.4% 13.8 0 0.0% 0.0 0 0.0% 0.0 21,685 12.8% 45 + 6 3.9% 8.6 6 18.8% 8.6 2 50.0% 2.9 0 0.0% 0.0 70,049 41.3% Not Specified 0 0.0% - 0 0.0% - 0 0.0% - 0 0.0% -
Gender & Race/Ethnicity Chlamydia Gonorrhea P&S Syphilis Early Latent Syphilis Population
Cases Percent1 Rate Cases Percent1 Rate Cases Percent1 Rate Cases Percent1 Rate Number Percent1
COUNTY TOTAL 604 100.0% 172.5 64 100.0% 18.3 4 100.0% 1.1 1 100.0% 0.3 347,543 100.0%
Female Total 452 74.8% 253.9 32 50.0% 18.0 0 0.0% 0.0 0 0.0% 0.0 178,024 51.2%American Indian/Alaska Native 5 1.7% 519.8 0 0.0% 0.0 0 0.0% 0.0 0 0.0% 0.0 962 0.5%Asian/Pacific Islander 7 2.4% 76.0 2 10.5% 21.7 0 0.0% 0.0 0 0.0% 0.0 9,215 5.2%Black/African-American 13 4.5% 1,303.9 3 15.8% 300.9 0 0.0% 0.0 0 0.0% 0.0 997 0.6%Latina/Hispanic 54 18.9% 227.0 1 5.3% 4.2 0 0.0% 0.0 0 0.0% 0.0 23,784 13.4%White 207 72.4% 148.4 13 68.4% 9.3 0 0.0% 0.0 0 0.0% 0.0 139,466 78.3%Other/Multi/Not Specified 166 36.7% - 13 40.6% - 0 0.0% - 0 0.0% - 3,600 2.0%Male Total 152 25.2% 89.7 32 50.0% 18.9 4 100.0% 2.4 1 100.0% 0.6 169,519 48.8%American Indian/Alaska Native 0 0.0% 0.0 1 4.5% 106.7 0 0.0% 0.0 0 0.0% 0.0 937 0.6%Asian/Pacific Islander 3 3.3% 36.2 0 0.0% 0.0 0 0.0% 0.0 0 0.0% 0.0 8,287 4.9%Black/African-American 6 6.7% 518.6 2 9.1% 172.9 1 33.3% 86.4 0 0.0% 0.0 1,157 0.7%Latina/Hispanic 17 18.9% 73.3 1 4.5% 4.3 0 0.0% 0.0 0 0.0% 0.0 23,199 13.7%White 64 71.1% 48.4 18 81.8% 13.6 2 66.7% 1.5 1 100.0% 0.8 132,353 78.1%Other/Multi/Not Specified 62 40.8% - 10 31.3% - 1 25.0% - 0 0.0% - 3,586 2.1%
California Local Health Jurisdiction STD Data Summaries, 2010 Provisional Data (July 2011)

1:100
Plumas County – Chlamydia, Gonorrhea, and P&S SyphilisRates by Age Group (2010), Race/Ethnicity (2010), and Year
0−9 10−14 15−19 20−24 25−29 30−34 35−44 45+
Age Group
0
500
1000
1500
2000
2500
3000 Chlamydia
Nat. Am. A/PI Black Latino White
Race/Ethnicity*
0
50
100
150
200
Chlamydia
2001 2002 2003 2004 2005 2006 2007 2008 2009 2010
0
50
100
150
200
250
300
350
Year
Chlamydia
0−9 10−14 15−19 20−24 25−29 30−34 35−44 45+
Age Group
0
50
100
150
Gonorrhea
Nat. Am. A/PI Black Latino White
Race/Ethnicity*
0
1 Gonorrhea
2001 2002 2003 2004 2005 2006 2007 2008 2009 2010
0
10
20
30
40
50
Year
Gonorrhea
0−9 10−14 15−19 20−24 25−29 30−34 35−44 45+
Age Group
0
1 P&S Syphilis
Nat. Am. A/PI Black Latino White
Race/Ethnicity*
0
1 P&S Syphilis
2001 2002 2003 2004 2005 2006 2007 2008 2009 2010
Year
0
1 P&S Syphilis
Female Male Female Male
s Numbers suppressed for confidentiality* Race data may be missing for a substantial number of cases. See the 'Data Limitations' page for further information.
Note: Rates are per 100,000 population.Source: California Department of Public Health, STD Control Branch
California Local Health Jurisdiction STD Data Summaries, 2010 Provisional Data (July 2011)

s Numbers suppressed for confidentiality. 1 Gender specific age groups and race/ethnicity percent calculations exclude "Not Specified" from the denominator. 2 Overall county rates were calculated using the July 1 county population estimates from the Department of Finance. (For Plumas County, the July 1, 2010 estimate is 20,491). Note: Rates are per 100,000 population. Source: California Department of Public Health, STD Control Branch
Plumas County – Chlamydia, Gonorrhea, and Early Syphilis Cases and Rates Tables for 2010
Gender & Age Group Chlamydia Gonorrhea P&S Syphilis Early Latent Syphilis Population
Cases Percent1 Rate Cases Percent1 Rate Cases Percent1 Rate Cases Percent1 Rate Number Percent1
COUNTY TOTAL 55 100.0% 268.4 3 100.0% 14.6 0 100.0% 0.0 0 100.0% 0.0 21,824 100.0%
Female Total 31 56.4% 280.6 0 0.0% 0.0 0 0.0% 0.0 0 0.0% 0.0 11,047 50.6% Ages 00 – 09 0 0.0% 0.0 0 0.0% 0.0 0 0.0% 0.0 0 0.0% 0.0 1,050 9.5% 10 – 14 0 0.0% 0.0 0 0.0% 0.0 0 0.0% 0.0 0 0.0% 0.0 498 4.5% 15 – 19 18 58.1% 2,549.6 0 0.0% 0.0 0 0.0% 0.0 0 0.0% 0.0 706 6.4% 20 – 24 11 35.5% 1,388.9 0 0.0% 0.0 0 0.0% 0.0 0 0.0% 0.0 792 7.2% 25 – 29 2 6.5% 276.6 0 0.0% 0.0 0 0.0% 0.0 0 0.0% 0.0 723 6.5% 30 – 34 0 0.0% 0.0 0 0.0% 0.0 0 0.0% 0.0 0 0.0% 0.0 397 3.6% 35 – 44 0 0.0% 0.0 0 0.0% 0.0 0 0.0% 0.0 0 0.0% 0.0 907 8.2% 45 + 0 0.0% 0.0 0 0.0% 0.0 0 0.0% 0.0 0 0.0% 0.0 5,974 54.1% Not Specified 0 0.0% - 0 0.0% - 0 0.0% - 0 0.0% -
Male Total 22 40.0% 204.1 3 100.0% 27.8 0 0.0% 0.0 0 0.0% 0.0 10,777 49.4% Ages 00 – 09 0 0.0% 0.0 0 0.0% 0.0 0 0.0% 0.0 0 0.0% 0.0 966 9.0% 10 – 14 0 0.0% 0.0 0 0.0% 0.0 0 0.0% 0.0 0 0.0% 0.0 547 5.1% 15 – 19 8 36.4% 1,183.4 1 33.3% 147.9 0 0.0% 0.0 0 0.0% 0.0 676 6.3% 20 – 24 12 54.5% 1,397.0 0 0.0% 0.0 0 0.0% 0.0 0 0.0% 0.0 859 8.0% 25 – 29 2 9.1% 249.7 0 0.0% 0.0 0 0.0% 0.0 0 0.0% 0.0 801 7.4% 30 – 34 0 0.0% 0.0 0 0.0% 0.0 0 0.0% 0.0 0 0.0% 0.0 435 4.0% 35 – 44 0 0.0% 0.0 0 0.0% 0.0 0 0.0% 0.0 0 0.0% 0.0 914 8.5% 45 + 0 0.0% 0.0 2 66.7% 35.8 0 0.0% 0.0 0 0.0% 0.0 5,579 51.8% Not Specified 0 0.0% - 0 0.0% - 0 0.0% - 0 0.0% -
Gender & Race/Ethnicity Chlamydia Gonorrhea P&S Syphilis Early Latent Syphilis Population
Cases Percent1 Rate Cases Percent1 Rate Cases Percent1 Rate Cases Percent1 Rate Number Percent1
COUNTY TOTAL 55 100.0% 268.4 3 100.0% 14.6 0 100.0% 0.0 0 100.0% 0.0 21,824 100.0%
Female Total 31 56.4% 280.6 0 0.0% 0.0 0 0.0% 0.0 0 0.0% 0.0 11,047 50.6%American Indian/Alaska Native s s s 0 0.0% 0.0 0 0.0% 0.0 0 0.0% 0.0 266 2.4%Asian/Pacific Islander s s s 0 0.0% 0.0 0 0.0% 0.0 0 0.0% 0.0 88 0.8%Black/African-American s s s 0 0.0% 0.0 0 0.0% 0.0 0 0.0% 0.0 57 0.5%Latina/Hispanic s s s 0 0.0% 0.0 0 0.0% 0.0 0 0.0% 0.0 673 6.1%White 19 79.2% 196.0 0 0.0% 0.0 0 0.0% 0.0 0 0.0% 0.0 9,692 87.7%Other/Multi/Not Specified 7 22.6% - 0 0.0% - 0 0.0% - 0 0.0% - 271 2.5%Male Total 22 40.0% 204.1 3 100.0% 27.8 0 0.0% 0.0 0 0.0% 0.0 10,777 49.4%American Indian/Alaska Native s s s 0 0.0% 0.0 0 0.0% 0.0 0 0.0% 0.0 251 2.3%Asian/Pacific Islander s s s 0 0.0% 0.0 0 0.0% 0.0 0 0.0% 0.0 70 0.6%Black/African-American s s s 0 0.0% 0.0 0 0.0% 0.0 0 0.0% 0.0 92 0.9%Latina/Hispanic s s s 0 0.0% 0.0 0 0.0% 0.0 0 0.0% 0.0 710 6.6%White 9 47.4% 95.6 0 0.0% 0.0 0 0.0% 0.0 0 0.0% 0.0 9,412 87.3%Other/Multi/Not Specified 3 13.6% - 3 100.0% - 0 0.0% - 0 0.0% - 242 2.2%
California Local Health Jurisdiction STD Data Summaries, 2010 Provisional Data (July 2011)

1:100
Riverside County – Chlamydia, Gonorrhea, and P&S SyphilisRates by Age Group (2010), Race/Ethnicity (2010), and Year
0−9 10−14 15−19 20−24 25−29 30−34 35−44 45+
Age Group
0
500
1000
1500
2000
2500
Chlamydia
Nat. Am. A/PI Black Latino White
Race/Ethnicity*
0
200
400
600
800
1000 Chlamydia
2001 2002 2003 2004 2005 2006 2007 2008 2009 2010
0
100
200
300
400
500
Year
Chlamydia
0−9 10−14 15−19 20−24 25−29 30−34 35−44 45+
Age Group
0
50
100
150
Gonorrhea
Nat. Am. A/PI Black Latino White
Race/Ethnicity*
0
20
40
60
80
100
Gonorrhea
2001 2002 2003 2004 2005 2006 2007 2008 2009 2010
0
10
20
30
40
50
60
70
Year
Gonorrhea
0−9 10−14 15−19 20−24 25−29 30−34 35−44 45+
Age Group
0
5
10
15
20
25
P&S Syphilis
Nat. Am. A/PI Black Latino White
Race/Ethnicity*
0
2
4
6
8
10
12
14
P&S Syphilis
2001 2002 2003 2004 2005 2006 2007 2008 2009 2010
0
2
4
6
8
10
12
Year
P&S Syphilis
Female Male Female Male
* Race data may be missing for a substantial number of cases. See the 'Data Limitations' page for further information.Note: Rates are per 100,000 population.
Source: California Department of Public Health, STD Control Branch
California Local Health Jurisdiction STD Data Summaries, 2010 Provisional Data (July 2011)

1 Gender specific age groups and race/ethnicity percent calculations exclude "Not Specified" from the denominator. 2 Overall county rates were calculated using the July 1 county population estimates from the Department of Finance. (For Riverside County, the July 1, 2010 estimate is 2,161,163). Note: Rates are per 100,000 population. Source: California Department of Public Health, STD Control Branch
Riverside County – Chlamydia, Gonorrhea, and Early Syphilis Cases and Rates Tables for 2010
Gender & Age Group Chlamydia Gonorrhea P&S Syphilis Early Latent Syphilis Population
Cases Percent1 Rate Cases Percent1 Rate Cases Percent1 Rate Cases Percent1 Rate Number Percent1
COUNTY TOTAL 7,092 100.0% 328.2 773 100.0% 35.8 116 100.0% 5.4 64 100.0% 3.0 2,239,053 100.0%
Female Total 5,316 75.0% 473.1 363 47.0% 32.3 0 0.0% 0.0 2 3.1% 0.2 1,123,582 50.2% Ages 00 – 09 2 0.0% 1.2 0 0.0% 0.0 0 0.0% 0.0 0 0.0% 0.0 168,072 15.0% 10 – 14 20 0.4% 24.8 2 0.6% 2.5 0 0.0% 0.0 0 0.0% 0.0 80,681 7.2% 15 – 19 1,519 28.6% 1,556.4 113 31.1% 115.8 0 0.0% 0.0 0 0.0% 0.0 97,600 8.7% 20 – 24 2,302 43.3% 2,444.3 146 40.2% 155.0 0 0.0% 0.0 0 0.0% 0.0 94,180 8.4% 25 – 29 851 16.0% 1,010.7 53 14.6% 62.9 0 0.0% 0.0 1 50.0% 1.2 84,196 7.5% 30 – 34 342 6.4% 494.9 26 7.2% 37.6 0 0.0% 0.0 1 50.0% 1.4 69,103 6.2% 35 – 44 213 4.0% 147.3 17 4.7% 11.8 0 0.0% 0.0 0 0.0% 0.0 144,573 12.9% 45 + 67 1.3% 17.4 6 1.7% 1.6 0 0.0% 0.0 0 0.0% 0.0 385,177 34.3% Not Specified 0 0.0% - 0 0.0% - 0 0.0% - 0 0.0% -
Male Total 1,751 24.7% 157.0 409 52.9% 36.7 116 100.0% 10.4 61 95.3% 5.5 1,115,471 49.8% Ages 00 – 09 1 0.1% 0.6 1 0.2% 0.6 0 0.0% 0.0 0 0.0% 0.0 175,774 15.8% 10 – 14 0 0.0% 0.0 3 0.7% 3.5 1 0.9% 1.2 0 0.0% 0.0 84,749 7.6% 15 – 19 297 17.0% 290.6 53 13.0% 51.9 3 2.6% 2.9 0 0.0% 0.0 102,203 9.2% 20 – 24 686 39.2% 692.6 135 33.1% 136.3 19 16.4% 19.2 7 11.5% 7.1 99,044 8.9% 25 – 29 402 23.0% 451.1 70 17.2% 78.6 20 17.2% 22.4 4 6.6% 4.5 89,113 8.0% 30 – 34 148 8.5% 199.4 33 8.1% 44.5 13 11.2% 17.5 4 6.6% 5.4 74,229 6.7% 35 – 44 136 7.8% 95.0 49 12.0% 34.2 27 23.3% 18.9 18 29.5% 12.6 143,086 12.8% 45 + 81 4.6% 23.3 64 15.7% 18.4 33 28.4% 9.5 28 45.9% 8.1 347,273 31.1% Not Specified 0 0.0% - 1 0.2% - 0 0.0% - 0 0.0% -
Gender & Race/Ethnicity Chlamydia Gonorrhea P&S Syphilis Early Latent Syphilis Population
Cases Percent1 Rate Cases Percent1 Rate Cases Percent1 Rate Cases Percent1 Rate Number Percent1
COUNTY TOTAL 7,092 100.0% 328.2 773 100.0% 35.8 116 100.0% 5.4 64 100.0% 3.0 2,239,053 100.0%
Female Total 5,316 75.0% 473.1 363 47.0% 32.3 0 0.0% 0.0 2 3.1% 0.2 1,123,582 50.2%American Indian/Alaska Native 13 0.3% 212.7 0 0.0% 0.0 0 0.0% 0.0 0 0.0% 0.0 6,111 0.5%Asian/Pacific Islander 80 1.7% 142.3 2 0.7% 3.6 0 0.0% 0.0 0 0.0% 0.0 56,209 5.0%Black/African-American 614 13.0% 883.2 63 21.6% 90.6 0 0.0% 0.0 0 0.0% 0.0 69,516 6.2%Latina/Hispanic 2,400 50.9% 521.2 107 36.6% 23.2 0 0.0% 0.0 2 100.0% 0.4 460,484 41.0%White 1,606 34.1% 313.3 120 41.1% 23.4 0 0.0% 0.0 0 0.0% 0.0 512,592 45.6%Other/Multi/Not Specified 603 11.3% - 71 19.6% - 0 0.0% - 0 0.0% - 18,670 1.7%Male Total 1,751 24.7% 157.0 409 52.9% 36.7 116 100.0% 10.4 61 95.3% 5.5 1,115,471 49.8%American Indian/Alaska Native 5 0.3% 85.1 3 0.9% 51.1 0 0.0% 0.0 0 0.0% 0.0 5,876 0.5%Asian/Pacific Islander 29 1.9% 58.2 3 0.9% 6.0 1 0.9% 2.0 0 0.0% 0.0 49,854 4.5%Black/African-American 237 15.4% 340.0 59 17.6% 84.7 3 2.7% 4.3 2 3.8% 2.9 69,698 6.2%Latina/Hispanic 710 46.3% 148.9 108 32.1% 22.7 45 40.2% 9.4 18 34.0% 3.8 476,762 42.7%White 553 36.0% 111.7 163 48.5% 32.9 63 56.3% 12.7 33 62.3% 6.7 494,921 44.4%Other/Multi/Not Specified 217 12.4% - 73 17.8% - 4 3.4% - 8 13.1% - 18,360 1.6%
California Local Health Jurisdiction STD Data Summaries, 2010 Provisional Data (July 2011)

1:100
Sacramento County – Chlamydia, Gonorrhea, and P&S SyphilisRates by Age Group (2010), Race/Ethnicity (2010), and Year
0−9 10−14 15−19 20−24 25−29 30−34 35−44 45+
Age Group
0
1000
2000
3000
4000
5000 Chlamydia
Nat. Am. A/PI Black Latino White
Race/Ethnicity*
0
500
1000
1500
2000
Chlamydia
2001 2002 2003 2004 2005 2006 2007 2008 2009 2010
0
200
400
600
800
1000
Year
Chlamydia
0−9 10−14 15−19 20−24 25−29 30−34 35−44 45+
Age Group
0
200
400
600
800
Gonorrhea
Nat. Am. A/PI Black Latino White
Race/Ethnicity*
0
100
200
300
400
500
600
Gonorrhea
2001 2002 2003 2004 2005 2006 2007 2008 2009 2010
0
50
100
150
200
Year
Gonorrhea
0−9 10−14 15−19 20−24 25−29 30−34 35−44 45+
Age Group
0
5
10
15
P&S Syphilis
Nat. Am. A/PI Black Latino White
Race/Ethnicity*
0
2
4
6
8
10
12 P&S Syphilis
2001 2002 2003 2004 2005 2006 2007 2008 2009 2010
0
2
4
6
8
10
12
Year
P&S Syphilis
Female Male Female Male
* Race data may be missing for a substantial number of cases. See the 'Data Limitations' page for further information.Note: Rates are per 100,000 population.
Source: California Department of Public Health, STD Control Branch
California Local Health Jurisdiction STD Data Summaries, 2010 Provisional Data (July 2011)

1 Gender specific age groups and race/ethnicity percent calculations exclude "Not Specified" from the denominator. 2 Overall county rates were calculated using the July 1 county population estimates from the Department of Finance. (For Sacramento County, the July 1, 2010 estimate is 1,453,495). Note: Rates are per 100,000 population. Source: California Department of Public Health, STD Control Branch
Sacramento County – Chlamydia, Gonorrhea, and Early Syphilis Cases and Rates Tables for 2010
Gender & Age Group Chlamydia Gonorrhea P&S Syphilis Early Latent Syphilis Population
Cases Percent1 Rate Cases Percent1 Rate Cases Percent1 Rate Cases Percent1 Rate Number Percent1
COUNTY TOTAL 8,439 100.0% 580.6 1,889 100.0% 130.0 52 100.0% 3.6 43 100.0% 3.0 1,451,866 100.0%
Female Total 6,042 71.6% 818.3 1,025 54.3% 138.8 12 23.1% 1.6 11 25.6% 1.5 738,329 50.9% Ages 00 – 09 11 0.2% 10.9 2 0.2% 2.0 0 0.0% 0.0 0 0.0% 0.0 101,198 13.7% 10 – 14 76 1.3% 150.8 20 2.0% 39.7 1 8.3% 2.0 0 0.0% 0.0 50,387 6.8% 15 – 19 2,248 37.4% 4,045.6 417 40.8% 750.4 1 8.3% 1.8 2 18.2% 3.6 55,567 7.5% 20 – 24 2,292 38.1% 4,342.5 336 32.8% 636.6 3 25.0% 5.7 1 9.1% 1.9 52,781 7.1% 25 – 29 829 13.8% 1,738.7 130 12.7% 272.7 3 25.0% 6.3 2 18.2% 4.2 47,679 6.5% 30 – 34 318 5.3% 724.5 65 6.4% 148.1 0 0.0% 0.0 0 0.0% 0.0 43,893 5.9% 35 – 44 189 3.1% 194.4 47 4.6% 48.3 2 16.7% 2.1 2 18.2% 2.1 97,209 13.2% 45 + 54 0.9% 18.6 6 0.6% 2.1 2 16.7% 0.7 4 36.4% 1.4 289,615 39.2% Not Specified 25 0.4% - 2 0.2% - 0 0.0% - 0 0.0% -
Male Total 2,338 27.7% 327.7 849 44.9% 119.0 40 76.9% 5.6 32 74.4% 4.5 713,537 49.1% Ages 00 – 09 6 0.3% 5.7 2 0.2% 1.9 0 0.0% 0.0 1 3.1% 0.9 105,297 14.8% 10 – 14 10 0.4% 19.2 1 0.1% 1.9 0 0.0% 0.0 0 0.0% 0.0 52,031 7.3% 15 – 19 599 25.7% 1,027.6 189 22.4% 324.2 1 2.5% 1.7 3 9.4% 5.1 58,290 8.2% 20 – 24 852 36.6% 1,543.1 284 33.6% 514.4 9 22.5% 16.3 8 25.0% 14.5 55,214 7.7% 25 – 29 426 18.3% 857.2 133 15.8% 267.6 4 10.0% 8.0 5 15.6% 10.1 49,694 7.0% 30 – 34 194 8.3% 446.7 78 9.2% 179.6 7 17.5% 16.1 2 6.3% 4.6 43,430 6.1% 35 – 44 162 7.0% 170.5 91 10.8% 95.8 8 20.0% 8.4 8 25.0% 8.4 94,997 13.3% 45 + 78 3.4% 30.6 66 7.8% 25.9 11 27.5% 4.3 5 15.6% 2.0 254,584 35.7% Not Specified 11 0.5% - 5 0.6% - 0 0.0% - 0 0.0% -
Gender & Race/Ethnicity Chlamydia Gonorrhea P&S Syphilis Early Latent Syphilis Population
Cases Percent1 Rate Cases Percent1 Rate Cases Percent1 Rate Cases Percent1 Rate Number Percent1
COUNTY TOTAL 8,439 100.0% 580.6 1,889 100.0% 130.0 52 100.0% 3.6 43 100.0% 3.0 1,451,866 100.0%
Female Total 6,042 71.6% 818.3 1,025 54.3% 138.8 12 23.1% 1.6 11 25.6% 1.5 738,329 50.9%American Indian/Alaska Native 32 0.9% 587.9 4 0.7% 73.5 0 0.0% 0.0 0 0.0% 0.0 5,443 0.7%Asian/Pacific Islander 360 10.5% 357.8 30 5.0% 29.8 0 0.0% 0.0 0 0.0% 0.0 100,625 13.6%Black/African-American 1,412 41.3% 2,025.0 374 62.9% 536.4 6 60.0% 8.6 5 50.0% 7.2 69,727 9.4%Latina/Hispanic 782 22.9% 530.0 80 13.4% 54.2 0 0.0% 0.0 2 20.0% 1.4 147,557 20.0%White 833 24.4% 218.0 107 18.0% 28.0 4 40.0% 1.0 3 30.0% 0.8 382,090 51.8%Other/Multi/Not Specified 2,623 43.4% - 430 42.0% - 2 16.7% - 1 9.1% - 32,887 4.5%Male Total 2,338 27.7% 327.7 849 44.9% 119.0 40 76.9% 5.6 32 74.4% 4.5 713,537 49.1%American Indian/Alaska Native 5 0.4% 99.1 2 0.4% 39.6 0 0.0% 0.0 1 3.6% 19.8 5,046 0.7%Asian/Pacific Islander 80 6.5% 83.5 15 3.1% 15.7 0 0.0% 0.0 1 3.6% 1.0 95,769 13.4%Black/African-American 653 52.8% 983.1 312 65.3% 469.7 7 18.9% 10.5 5 17.9% 7.5 66,420 9.3%Latina/Hispanic 240 19.4% 159.6 61 12.8% 40.6 14 37.8% 9.3 7 25.0% 4.7 150,341 21.1%White 258 20.9% 70.7 88 18.4% 24.1 16 43.2% 4.4 14 50.0% 3.8 364,884 51.1%Other/Multi/Not Specified 1,102 47.1% - 371 43.7% - 3 7.5% - 4 12.5% - 31,077 4.4%
California Local Health Jurisdiction STD Data Summaries, 2010 Provisional Data (July 2011)

1:100
San Benito County – Chlamydia, Gonorrhea, and P&S SyphilisRates by Age Group (2010), Race/Ethnicity (2010), and Year
0−9 10−14 15−19 20−24 25−29 30−34 35−44 45+
Age Group
0
500
1000
1500
2000
Chlamydia
Nat. Am. A/PI Black Latino White
Race/Ethnicity*
0
100
200
300
400
500
600 Chlamydia
2001 2002 2003 2004 2005 2006 2007 2008 2009 2010
0
100
200
300
400
500
Year
Chlamydia
0−9 10−14 15−19 20−24 25−29 30−34 35−44 45+
Age Group
0
20
40
60
80
Gonorrhea
Nat. Am. A/PI Black Latino White
Race/Ethnicity*
0
5
10
15
20 Gonorrhea
2001 2002 2003 2004 2005 2006 2007 2008 2009 2010
0
20
40
60
80
100
Year
Gonorrhea
0−9 10−14 15−19 20−24 25−29 30−34 35−44 45+
Age Group
0
10
20
30
40 P&S Syphilis
Nat. Am. A/PI Black Latino White
Race/Ethnicity*
0
2
4
6
8
10
12 P&S Syphilis
2001 2002 2003 2004 2005 2006 2007 2008 2009 2010
0
2
4
6
8
Year
P&S Syphilis
Female Male Female Male
* Race data may be missing for a substantial number of cases. See the 'Data Limitations' page for further information.Note: Rates are per 100,000 population.
Source: California Department of Public Health, STD Control Branch
California Local Health Jurisdiction STD Data Summaries, 2010 Provisional Data (July 2011)

1 Gender specific age groups and race/ethnicity percent calculations exclude "Not Specified" from the denominator. 2 Overall county rates were calculated using the July 1 county population estimates from the Department of Finance. (For San Benito County, the July 1, 2010 estimate is 58,692). Note: Rates are per 100,000 population. Source: California Department of Public Health, STD Control Branch
San Benito County – Chlamydia, Gonorrhea, and Early Syphilis Cases and Rates Tables for 2010
Gender & Age Group Chlamydia Gonorrhea P&S Syphilis Early Latent Syphilis Population
Cases Percent1 Rate Cases Percent1 Rate Cases Percent1 Rate Cases Percent1 Rate Number Percent1
COUNTY TOTAL 177 100.0% 301.6 9 100.0% 15.3 2 100.0% 3.4 1 100.0% 1.7 64,230 100.0%
Female Total 146 82.5% 460.6 4 44.4% 12.6 0 0.0% 0.0 0 0.0% 0.0 31,696 49.3% Ages 00 – 09 0 0.0% 0.0 0 0.0% 0.0 0 0.0% 0.0 0 0.0% 0.0 4,871 15.4% 10 – 14 0 0.0% 0.0 0 0.0% 0.0 0 0.0% 0.0 0 0.0% 0.0 2,479 7.8% 15 – 19 55 37.9% 2,081.0 2 50.0% 75.7 0 0.0% 0.0 0 0.0% 0.0 2,643 8.3% 20 – 24 49 33.8% 1,846.3 1 25.0% 37.7 0 0.0% 0.0 0 0.0% 0.0 2,654 8.4% 25 – 29 24 16.6% 975.6 0 0.0% 0.0 0 0.0% 0.0 0 0.0% 0.0 2,460 7.8% 30 – 34 12 8.3% 630.6 1 25.0% 52.5 0 0.0% 0.0 0 0.0% 0.0 1,903 6.0% 35 – 44 5 3.4% 126.9 0 0.0% 0.0 0 0.0% 0.0 0 0.0% 0.0 3,940 12.4% 45 + 0 0.0% 0.0 0 0.0% 0.0 0 0.0% 0.0 0 0.0% 0.0 10,746 33.9% Not Specified 1 0.7% - 0 0.0% - 0 0.0% - 0 0.0% -
Male Total 31 17.5% 95.3 5 55.6% 15.4 2 100.0% 6.1 1 100.0% 3.1 32,534 50.7% Ages 00 – 09 0 0.0% 0.0 0 0.0% 0.0 0 0.0% 0.0 0 0.0% 0.0 5,058 15.5% 10 – 14 0 0.0% 0.0 0 0.0% 0.0 0 0.0% 0.0 0 0.0% 0.0 2,633 8.1% 15 – 19 5 16.1% 177.0 1 20.0% 35.4 0 0.0% 0.0 1 100.0% 35.4 2,825 8.7% 20 – 24 13 41.9% 446.0 1 20.0% 34.3 0 0.0% 0.0 0 0.0% 0.0 2,915 9.0% 25 – 29 10 32.3% 348.3 0 0.0% 0.0 1 50.0% 34.8 0 0.0% 0.0 2,871 8.8% 30 – 34 0 0.0% 0.0 1 20.0% 46.4 0 0.0% 0.0 0 0.0% 0.0 2,156 6.6% 35 – 44 3 9.7% 74.3 2 40.0% 49.5 0 0.0% 0.0 0 0.0% 0.0 4,038 12.4% 45 + 0 0.0% 0.0 0 0.0% 0.0 1 50.0% 10.0 0 0.0% 0.0 10,038 30.9% Not Specified 0 0.0% - 0 0.0% - 0 0.0% - 0 0.0% -
Gender & Race/Ethnicity Chlamydia Gonorrhea P&S Syphilis Early Latent Syphilis Population
Cases Percent1 Rate Cases Percent1 Rate Cases Percent1 Rate Cases Percent1 Rate Number Percent1
COUNTY TOTAL 177 100.0% 301.6 9 100.0% 15.3 2 100.0% 3.4 1 100.0% 1.7 64,230 100.0%
Female Total 146 82.5% 460.6 4 44.4% 12.6 0 0.0% 0.0 0 0.0% 0.0 31,696 49.3%American Indian/Alaska Native 0 0.0% 0.0 0 0.0% 0.0 0 0.0% 0.0 0 0.0% 0.0 155 0.5%Asian/Pacific Islander 1 0.7% 108.7 0 0.0% 0.0 0 0.0% 0.0 0 0.0% 0.0 920 2.9%Black/African-American 0 0.0% 0.0 0 0.0% 0.0 0 0.0% 0.0 0 0.0% 0.0 244 0.8%Latina/Hispanic 95 65.1% 517.7 2 50.0% 10.9 0 0.0% 0.0 0 0.0% 0.0 18,352 57.9%White 50 34.2% 433.4 2 50.0% 17.3 0 0.0% 0.0 0 0.0% 0.0 11,536 36.4%Other/Multi/Not Specified 0 0.0% - 0 0.0% - 0 0.0% - 0 0.0% - 489 1.5%Male Total 31 17.5% 95.3 5 55.6% 15.4 2 100.0% 6.1 1 100.0% 3.1 32,534 50.7%American Indian/Alaska Native 0 0.0% 0.0 0 0.0% 0.0 0 0.0% 0.0 0 0.0% 0.0 160 0.5%Asian/Pacific Islander 0 0.0% 0.0 0 0.0% 0.0 0 0.0% 0.0 0 0.0% 0.0 740 2.3%Black/African-American 0 0.0% 0.0 0 0.0% 0.0 0 0.0% 0.0 0 0.0% 0.0 343 1.1%Latina/Hispanic 20 64.5% 102.3 3 60.0% 15.3 2 100.0% 10.2 0 0.0% 0.0 19,553 60.1%White 11 35.5% 97.5 2 40.0% 17.7 0 0.0% 0.0 1 100.0% 8.9 11,281 34.7%Other/Multi/Not Specified 0 0.0% - 0 0.0% - 0 0.0% - 0 0.0% - 457 1.4%
California Local Health Jurisdiction STD Data Summaries, 2010 Provisional Data (July 2011)

1:100
San Bernardino County – Chlamydia, Gonorrhea, and P&S SyphilisRates by Age Group (2010), Race/Ethnicity (2010), and Year
0−9 10−14 15−19 20−24 25−29 30−34 35−44 45+
Age Group
0
500
1000
1500
2000
2500
3000
Chlamydia
Nat. Am. A/PI Black Latino White
Race/Ethnicity*
0
100
200
300
400
Chlamydia
2001 2002 2003 2004 2005 2006 2007 2008 2009 2010
0
200
400
600
Year
Chlamydia
0−9 10−14 15−19 20−24 25−29 30−34 35−44 45+
Age Group
0
50
100
150
200
250
300 Gonorrhea
Nat. Am. A/PI Black Latino White
Race/Ethnicity*
0
20
40
60
80
100
120
140 Gonorrhea
2001 2002 2003 2004 2005 2006 2007 2008 2009 2010
0
20
40
60
80
100
120
140
Year
Gonorrhea
0−9 10−14 15−19 20−24 25−29 30−34 35−44 45+
Age Group
0
2
4
6
8
10
12
14 P&S Syphilis
Nat. Am. A/PI Black Latino White
Race/Ethnicity*
0
5
10
15
P&S Syphilis
2001 2002 2003 2004 2005 2006 2007 2008 2009 2010
0
1
2
3
4
Year
P&S Syphilis
Female Male Female Male
* Race data may be missing for a substantial number of cases. See the 'Data Limitations' page for further information.Note: Rates are per 100,000 population.
Source: California Department of Public Health, STD Control Branch
California Local Health Jurisdiction STD Data Summaries, 2010 Provisional Data (July 2011)

1 Gender specific age groups and race/ethnicity percent calculations exclude "Not Specified" from the denominator. 2 Overall county rates were calculated using the July 1 county population estimates from the Department of Finance. (For San Bernardino County, the July 1, 2010 estimate is 2,084,514). Note: Rates are per 100,000 population. Source: California Department of Public Health, STD Control Branch
San Bernardino County – Chlamydia, Gonorrhea, and Early Syphilis Cases and Rates Tables for 2010
Gender & Age Group Chlamydia Gonorrhea P&S Syphilis Early Latent Syphilis Population
Cases Percent1 Rate Cases Percent1 Rate Cases Percent1 Rate Cases Percent1 Rate Number Percent1
COUNTY TOTAL 8,678 100.0% 416.3 1,138 100.0% 54.6 39 100.0% 1.9 21 100.0% 1.0 2,177,596 100.0%
Female Total 6,156 70.9% 565.1 600 52.7% 55.1 1 2.6% 0.1 3 14.3% 0.3 1,089,352 50.0% Ages 00 – 09 2 0.0% 1.2 2 0.3% 1.2 0 0.0% 0.0 0 0.0% 0.0 164,234 15.1% 10 – 14 63 1.0% 79.2 5 0.8% 6.3 0 0.0% 0.0 0 0.0% 0.0 79,526 7.3% 15 – 19 2,041 33.2% 2,178.9 183 30.5% 195.4 0 0.0% 0.0 0 0.0% 0.0 93,670 8.6% 20 – 24 2,479 40.3% 2,725.9 231 38.5% 254.0 1 100.0% 1.1 2 66.7% 2.2 90,941 8.3% 25 – 29 921 15.0% 1,143.1 88 14.7% 109.2 0 0.0% 0.0 0 0.0% 0.0 80,571 7.4% 30 – 34 327 5.3% 458.2 42 7.0% 58.8 0 0.0% 0.0 1 33.3% 1.4 71,374 6.6% 35 – 44 251 4.1% 172.5 37 6.2% 25.4 0 0.0% 0.0 0 0.0% 0.0 145,546 13.4% 45 + 72 1.2% 19.8 12 2.0% 3.3 0 0.0% 0.0 0 0.0% 0.0 363,490 33.4% Not Specified 0 0.0% - 0 0.0% - 0 0.0% - 0 0.0% -
Male Total 2,508 28.9% 230.5 536 47.1% 49.3 38 97.4% 3.5 18 85.7% 1.7 1,088,244 50.0% Ages 00 – 09 0 0.0% 0.0 1 0.2% 0.6 0 0.0% 0.0 0 0.0% 0.0 171,563 15.8% 10 – 14 10 0.4% 11.9 3 0.6% 3.6 0 0.0% 0.0 0 0.0% 0.0 84,182 7.7% 15 – 19 519 20.7% 522.8 81 15.1% 81.6 3 7.9% 3.0 2 11.1% 2.0 99,280 9.1% 20 – 24 994 39.6% 1,029.9 193 36.0% 200.0 12 31.6% 12.4 8 44.4% 8.3 96,510 8.9% 25 – 29 511 20.4% 586.7 104 19.4% 119.4 8 21.1% 9.2 3 16.7% 3.4 87,097 8.0% 30 – 34 237 9.4% 301.6 59 11.0% 75.1 4 10.5% 5.1 3 16.7% 3.8 78,571 7.2% 35 – 44 182 7.3% 127.1 62 11.6% 43.3 6 15.8% 4.2 1 5.6% 0.7 143,195 13.2% 45 + 55 2.2% 16.8 33 6.2% 10.1 5 13.2% 1.5 1 5.6% 0.3 327,846 30.1% Not Specified 0 0.0% - 0 0.0% - 0 0.0% - 0 0.0% -
Gender & Race/Ethnicity Chlamydia Gonorrhea P&S Syphilis Early Latent Syphilis Population
Cases Percent1 Rate Cases Percent1 Rate Cases Percent1 Rate Cases Percent1 Rate Number Percent1
COUNTY TOTAL 8,678 100.0% 416.3 1,138 100.0% 54.6 39 100.0% 1.9 21 100.0% 1.0 2,177,596 100.0%
Female Total 6,156 70.9% 565.1 600 52.7% 55.1 1 2.6% 0.1 3 14.3% 0.3 1,089,352 50.0%American Indian/Alaska Native 10 0.6% 140.6 0 0.0% 0.0 0 0.0% 0.0 0 0.0% 0.0 7,114 0.7%Asian/Pacific Islander 49 2.8% 77.4 7 3.1% 11.1 0 0.0% 0.0 0 0.0% 0.0 63,297 5.8%Black/African-American 413 23.4% 376.5 103 45.8% 93.9 1 100.0% 0.9 1 33.3% 0.9 109,693 10.1%Latina/Hispanic 891 50.4% 178.2 65 28.9% 13.0 0 0.0% 0.0 1 33.3% 0.2 499,991 45.9%White 404 22.9% 104.4 50 22.2% 12.9 0 0.0% 0.0 1 33.3% 0.3 386,885 35.5%Other/Multi/Not Specified 4,389 71.3% - 375 62.5% - 0 0.0% - 0 0.0% - 22,372 2.1%Male Total 2,508 28.9% 230.5 536 47.1% 49.3 38 97.4% 3.5 18 85.7% 1.7 1,088,244 50.0%American Indian/Alaska Native 4 0.4% 60.0 1 0.4% 15.0 1 2.7% 15.0 0 0.0% 0.0 6,662 0.6%Asian/Pacific Islander 15 1.5% 25.2 4 1.7% 6.7 0 0.0% 0.0 1 5.9% 1.7 59,472 5.5%Black/African-American 332 33.8% 319.4 124 51.5% 119.3 6 16.2% 5.8 3 17.6% 2.9 103,949 9.6%Latina/Hispanic 443 45.1% 86.4 81 33.6% 15.8 23 62.2% 4.5 9 52.9% 1.8 512,848 47.1%White 188 19.1% 49.1 31 12.9% 8.1 7 18.9% 1.8 4 23.5% 1.0 383,262 35.2%Other/Multi/Not Specified 1,526 60.8% - 295 55.0% - 1 2.6% - 1 5.6% - 22,051 2.0%
California Local Health Jurisdiction STD Data Summaries, 2010 Provisional Data (July 2011)

1:100
San Diego County – Chlamydia, Gonorrhea, and P&S SyphilisRates by Age Group (2010), Race/Ethnicity (2010), and Year
0−9 10−14 15−19 20−24 25−29 30−34 35−44 45+
Age Group
0
1000
2000
3000
4000
5000 Chlamydia
Nat. Am. A/PI Black Latino White
Race/Ethnicity*
0
500
1000
1500
Chlamydia
2001 2002 2003 2004 2005 2006 2007 2008 2009 2010
0
200
400
600
800
Year
Chlamydia
0−9 10−14 15−19 20−24 25−29 30−34 35−44 45+
Age Group
0
50
100
150
200
250
300
350 Gonorrhea
Nat. Am. A/PI Black Latino White
Race/Ethnicity*
0
50
100
150
200
Gonorrhea
2001 2002 2003 2004 2005 2006 2007 2008 2009 2010
0
20
40
60
80
100
120
Year
Gonorrhea
0−9 10−14 15−19 20−24 25−29 30−34 35−44 45+
Age Group
0
10
20
30
40
50
P&S Syphilis
Nat. Am. A/PI Black Latino White
Race/Ethnicity*
0
10
20
30
40
50
P&S Syphilis
2001 2002 2003 2004 2005 2006 2007 2008 2009 2010
0
5
10
15
20
25
Year
P&S Syphilis
Female Male Female Male
* Race data may be missing for a substantial number of cases. See the 'Data Limitations' page for further information.Note: Rates are per 100,000 population.
Source: California Department of Public Health, STD Control Branch
California Local Health Jurisdiction STD Data Summaries, 2010 Provisional Data (July 2011)

1 Gender specific age groups and race/ethnicity percent calculations exclude "Not Specified" from the denominator. 2 Overall county rates were calculated using the July 1 county population estimates from the Department of Finance. (For San Diego County, the July 1, 2010 estimate is 3,239,223). Note: Rates are per 100,000 population. Source: California Department of Public Health, STD Control Branch
San Diego County – Chlamydia, Gonorrhea, and Early Syphilis Cases and Rates Tables for 2010
Gender & Age Group Chlamydia Gonorrhea P&S Syphilis Early Latent Syphilis Population
Cases Percent1 Rate Cases Percent1 Rate Cases Percent1 Rate Cases Percent1 Rate Number Percent1
COUNTY TOTAL 15,355 100.0% 474.0 2,025 100.0% 62.5 276 100.0% 8.5 177 100.0% 5.5 3,199,706 100.0%
Female Total 10,536 68.6% 661.5 541 26.7% 34.0 3 1.1% 0.2 3 1.7% 0.2 1,592,714 49.8% Ages 00 – 09 1 0.0% 0.5 0 0.0% 0.0 0 0.0% 0.0 0 0.0% 0.0 218,972 13.7% 10 – 14 53 0.5% 49.4 3 0.6% 2.8 0 0.0% 0.0 0 0.0% 0.0 107,287 6.7% 15 – 19 3,024 28.8% 2,609.7 127 23.5% 109.6 0 0.0% 0.0 0 0.0% 0.0 115,876 7.3% 20 – 24 4,378 41.7% 4,196.7 219 40.5% 209.9 1 33.3% 1.0 3 100.0% 2.9 104,321 6.5% 25 – 29 1,744 16.6% 1,933.8 98 18.1% 108.7 0 0.0% 0.0 0 0.0% 0.0 90,185 5.7% 30 – 34 678 6.5% 694.7 47 8.7% 48.2 0 0.0% 0.0 0 0.0% 0.0 97,597 6.1% 35 – 44 478 4.6% 206.2 28 5.2% 12.1 2 66.7% 0.9 0 0.0% 0.0 231,817 14.6% 45 + 148 1.4% 23.6 19 3.5% 3.0 0 0.0% 0.0 0 0.0% 0.0 626,659 39.3% Not Specified 32 0.3% - 0 0.0% - 0 0.0% - 0 0.0% -
Male Total 4,801 31.3% 298.8 1,480 73.1% 92.1 273 98.9% 17.0 174 98.3% 10.8 1,606,992 50.2% Ages 00 – 09 0 0.0% 0.0 0 0.0% 0.0 0 0.0% 0.0 0 0.0% 0.0 227,502 14.2% 10 – 14 5 0.1% 4.5 1 0.1% 0.9 0 0.0% 0.0 0 0.0% 0.0 111,886 7.0% 15 – 19 608 12.7% 484.2 92 6.3% 73.3 4 1.5% 3.2 4 2.3% 3.2 125,571 7.8% 20 – 24 1,703 35.7% 1,334.5 382 26.0% 299.3 46 16.8% 36.0 17 9.8% 13.3 127,610 7.9% 25 – 29 1,096 23.0% 1,012.7 309 21.0% 285.5 41 15.0% 37.9 18 10.3% 16.6 108,225 6.7% 30 – 34 510 10.7% 481.1 215 14.6% 202.8 50 18.3% 47.2 21 12.1% 19.8 106,012 6.6% 35 – 44 510 10.7% 226.2 275 18.7% 122.0 73 26.7% 32.4 61 35.1% 27.1 225,425 14.0% 45 + 341 7.1% 59.3 196 13.3% 34.1 59 21.6% 10.3 53 30.5% 9.2 574,761 35.8% Not Specified 28 0.6% - 10 0.7% - 0 0.0% - 0 0.0% -
Gender & Race/Ethnicity Chlamydia Gonorrhea P&S Syphilis Early Latent Syphilis Population
Cases Percent1 Rate Cases Percent1 Rate Cases Percent1 Rate Cases Percent1 Rate Number Percent1
COUNTY TOTAL 15,355 100.0% 474.0 2,025 100.0% 62.5 276 100.0% 8.5 177 100.0% 5.5 3,199,706 100.0%
Female Total 10,536 68.6% 661.5 541 26.7% 34.0 3 1.1% 0.2 3 1.7% 0.2 1,592,714 49.8%American Indian/Alaska Native 26 0.5% 180.3 1 0.4% 6.9 0 0.0% 0.0 0 0.0% 0.0 14,421 0.9%Asian/Pacific Islander 489 9.7% 287.9 22 8.5% 13.0 0 0.0% 0.0 0 0.0% 0.0 169,848 10.7%Black/African-American 858 17.1% 1,354.6 101 38.8% 159.5 0 0.0% 0.0 0 0.0% 0.0 63,338 4.0%Latina/Hispanic 2,298 45.8% 490.4 76 29.2% 16.2 1 33.3% 0.2 3 100.0% 0.6 468,632 29.4%White 1,346 26.8% 159.6 60 23.1% 7.1 2 66.7% 0.2 0 0.0% 0.0 843,205 52.9%Other/Multi/Not Specified 5,519 52.4% - 281 51.9% - 0 0.0% - 0 0.0% - 33,270 2.1%Male Total 4,801 31.3% 298.8 1,480 73.1% 92.1 273 98.9% 17.0 174 98.3% 10.8 1,606,992 50.2%American Indian/Alaska Native 7 0.3% 48.8 2 0.2% 13.9 1 0.4% 7.0 1 0.6% 7.0 14,355 0.9%Asian/Pacific Islander 207 8.8% 134.1 64 7.9% 41.5 12 4.5% 7.8 8 4.8% 5.2 154,360 9.6%Black/African-American 528 22.4% 719.0 149 18.4% 202.9 36 13.6% 49.0 20 11.9% 27.2 73,431 4.6%Latina/Hispanic 803 34.1% 169.6 246 30.4% 52.0 70 26.5% 14.8 56 33.3% 11.8 473,365 29.5%White 810 34.4% 94.5 349 43.1% 40.7 145 54.9% 16.9 83 49.4% 9.7 856,801 53.3%Other/Multi/Not Specified 2,446 50.9% - 670 45.3% - 9 3.3% - 6 3.4% - 34,680 2.2%
California Local Health Jurisdiction STD Data Summaries, 2010 Provisional Data (July 2011)

1:100
San Francisco County – Chlamydia, Gonorrhea, and P&S SyphilisRates by Age Group (2010), Race/Ethnicity (2010), and Year
0−9 10−14 15−19 20−24 25−29 30−34 35−44 45+
Age Group
0
1000
2000
3000
4000
5000
Chlamydia
Nat. Am. A/PI Black Latino White
Race/Ethnicity*
0
500
1000
1500
2000
2500 Chlamydia
2001 2002 2003 2004 2005 2006 2007 2008 2009 2010
0
200
400
600
Year
Chlamydia
0−9 10−14 15−19 20−24 25−29 30−34 35−44 45+
Age Group
0
500
1000
1500 Gonorrhea
Nat. Am. A/PI Black Latino White
Race/Ethnicity*
0
200
400
600
800
Gonorrhea
2001 2002 2003 2004 2005 2006 2007 2008 2009 2010
0
100
200
300
400
500
600
Year
Gonorrhea
0−9 10−14 15−19 20−24 25−29 30−34 35−44 45+
Age Group
0
50
100
150
P&S Syphilis
Nat. Am. A/PI Black Latino White
Race/Ethnicity*
0
20
40
60
80
100
120
140
P&S Syphilis
2001 2002 2003 2004 2005 2006 2007 2008 2009 2010
0
20
40
60
80
100
Year
P&S Syphilis
Female Male Female Male
* Race data may be missing for a substantial number of cases. See the 'Data Limitations' page for further information.Note: Rates are per 100,000 population.
Source: California Department of Public Health, STD Control Branch
California Local Health Jurisdiction STD Data Summaries, 2010 Provisional Data (July 2011)

1 Gender specific age groups and race/ethnicity percent calculations exclude "Not Specified" from the denominator. 2 Overall county rates were calculated using the July 1 county population estimates from the Department of Finance. (For San Francisco County, the July 1, 2010 estimate is 859,658). Note: Rates are per 100,000 population. Source: California Department of Public Health, STD Control Branch
San Francisco County – Chlamydia, Gonorrhea, and Early Syphilis Cases and Rates Tables for 2010
Gender & Age Group Chlamydia Gonorrhea P&S Syphilis Early Latent Syphilis Population
Cases Percent1 Rate Cases Percent1 Rate Cases Percent1 Rate Cases Percent1 Rate Number Percent1
COUNTY TOTAL 4,600 100.0% 535.1 1,937 100.0% 225.3 366 100.0% 42.6 285 100.0% 33.2 818,163 100.0%
Female Total 2,010 43.7% 505.6 273 14.1% 68.7 6 1.6% 1.5 9 3.2% 2.3 397,558 48.6% Ages 00 – 09 2 0.1% 5.0 1 0.4% 2.5 0 0.0% 0.0 0 0.0% 0.0 39,718 10.0% 10 – 14 29 1.4% 236.4 4 1.5% 32.6 0 0.0% 0.0 0 0.0% 0.0 12,265 3.1% 15 – 19 530 26.4% 4,179.5 84 30.8% 662.4 1 16.7% 7.9 1 11.1% 7.9 12,681 3.2% 20 – 24 740 36.9% 4,716.7 97 35.5% 618.3 0 0.0% 0.0 0 0.0% 0.0 15,689 3.9% 25 – 29 374 18.7% 1,485.1 43 15.8% 170.7 1 16.7% 4.0 1 11.1% 4.0 25,184 6.3% 30 – 34 175 8.7% 413.7 25 9.2% 59.1 0 0.0% 0.0 2 22.2% 4.7 42,306 10.6% 35 – 44 105 5.2% 118.2 10 3.7% 11.3 0 0.0% 0.0 3 33.3% 3.4 88,844 22.3% 45 + 50 2.5% 31.1 9 3.3% 5.6 4 66.7% 2.5 2 22.2% 1.2 160,871 40.5% Not Specified 5 0.2% - 0 0.0% - 0 0.0% - 0 0.0% -
Male Total 2,545 55.3% 605.1 1,649 85.1% 392.1 360 98.4% 85.6 274 96.1% 65.1 420,605 51.4% Ages 00 – 09 2 0.1% 4.9 0 0.0% 0.0 0 0.0% 0.0 0 0.0% 0.0 41,201 9.8% 10 – 14 4 0.2% 31.0 0 0.0% 0.0 0 0.0% 0.0 0 0.0% 0.0 12,893 3.1% 15 – 19 169 6.7% 1,305.5 42 2.6% 324.4 1 0.3% 7.7 1 0.4% 7.7 12,945 3.1% 20 – 24 446 17.6% 2,836.4 207 12.6% 1,316.5 22 6.1% 139.9 10 3.6% 63.6 15,724 3.7% 25 – 29 471 18.5% 1,886.9 316 19.2% 1,266.0 35 9.7% 140.2 30 10.9% 120.2 24,961 5.9% 30 – 34 387 15.2% 889.4 290 17.6% 666.5 44 12.2% 101.1 29 10.6% 66.6 43,513 10.3% 35 – 44 664 26.1% 610.9 500 30.4% 460.0 146 40.6% 134.3 101 36.9% 92.9 108,694 25.8% 45 + 398 15.7% 247.7 289 17.6% 179.9 112 31.1% 69.7 103 37.6% 64.1 160,674 38.2% Not Specified 4 0.2% - 5 0.3% - 0 0.0% - 0 0.0% -
Gender & Race/Ethnicity Chlamydia Gonorrhea P&S Syphilis Early Latent Syphilis Population
Cases Percent1 Rate Cases Percent1 Rate Cases Percent1 Rate Cases Percent1 Rate Number Percent1
COUNTY TOTAL 4,600 100.0% 535.1 1,937 100.0% 225.3 366 100.0% 42.6 285 100.0% 33.2 818,163 100.0%
Female Total 2,010 43.7% 505.6 273 14.1% 68.7 6 1.6% 1.5 9 3.2% 2.3 397,558 48.6%American Indian/Alaska Native 8 0.5% 638.0 0 0.0% 0.0 0 0.0% 0.0 0 0.0% 0.0 1,254 0.3%Asian/Pacific Islander 292 19.5% 214.1 19 8.2% 13.9 0 0.0% 0.0 0 0.0% 0.0 136,401 34.3%Black/African-American 588 39.2% 2,179.1 135 58.4% 500.3 3 50.0% 11.1 3 33.3% 11.1 26,984 6.8%Latina/Hispanic 339 22.6% 654.5 30 13.0% 57.9 0 0.0% 0.0 3 33.3% 5.8 51,799 13.0%White 272 18.1% 159.8 47 20.3% 27.6 3 50.0% 1.8 3 33.3% 1.8 170,171 42.8%Other/Multi/Not Specified 511 25.4% - 42 15.4% - 0 0.0% - 0 0.0% - 10,949 2.8%Male Total 2,545 55.3% 605.1 1,649 85.1% 392.1 360 98.4% 85.6 274 96.1% 65.1 420,605 51.4%American Indian/Alaska Native 4 0.2% 249.4 4 0.3% 249.4 1 0.3% 62.3 0 0.0% 0.0 1,604 0.4%Asian/Pacific Islander 234 11.0% 191.7 98 6.8% 80.3 20 5.8% 16.4 12 4.8% 9.8 122,095 29.0%Black/African-American 383 17.9% 1,430.4 217 15.0% 810.5 34 9.9% 127.0 26 10.4% 97.1 26,775 6.4%Latina/Hispanic 438 20.5% 751.6 281 19.4% 482.2 65 18.8% 111.5 53 21.3% 91.0 58,273 13.9%White 1,075 50.4% 535.2 848 58.6% 422.2 225 65.2% 112.0 158 63.5% 78.7 200,869 47.8%Other/Multi/Not Specified 411 16.1% - 201 12.2% - 15 4.2% - 25 9.1% - 10,989 2.6%
California Local Health Jurisdiction STD Data Summaries, 2010 Provisional Data (July 2011)

1:100
San Joaquin County – Chlamydia, Gonorrhea, and P&S SyphilisRates by Age Group (2010), Race/Ethnicity (2010), and Year
0−9 10−14 15−19 20−24 25−29 30−34 35−44 45+
Age Group
0
500
1000
1500
2000
2500
3000
3500
Chlamydia
Nat. Am. A/PI Black Latino White
Race/Ethnicity*
0
500
1000
1500
Chlamydia
2001 2002 2003 2004 2005 2006 2007 2008 2009 2010
0
200
400
600
800
Year
Chlamydia
0−9 10−14 15−19 20−24 25−29 30−34 35−44 45+
Age Group
0
100
200
300
400
500 Gonorrhea
Nat. Am. A/PI Black Latino White
Race/Ethnicity*
0
100
200
300
400
500
Gonorrhea
2001 2002 2003 2004 2005 2006 2007 2008 2009 2010
0
50
100
150
Year
Gonorrhea
0−9 10−14 15−19 20−24 25−29 30−34 35−44 45+
Age Group
0
5
10
15
P&S Syphilis
Nat. Am. A/PI Black Latino White
Race/Ethnicity*
0
5
10
15
20
P&S Syphilis
2001 2002 2003 2004 2005 2006 2007 2008 2009 2010
0
2
4
6
8
Year
P&S Syphilis
Female Male Female Male
* Race data may be missing for a substantial number of cases. See the 'Data Limitations' page for further information.Note: Rates are per 100,000 population.
Source: California Department of Public Health, STD Control Branch
California Local Health Jurisdiction STD Data Summaries, 2010 Provisional Data (July 2011)

1 Gender specific age groups and race/ethnicity percent calculations exclude "Not Specified" from the denominator. 2 Overall county rates were calculated using the July 1 county population estimates from the Department of Finance. (For San Joaquin County, the July 1, 2010 estimate is 698,202). Note: Rates are per 100,000 population. Source: California Department of Public Health, STD Control Branch
San Joaquin County – Chlamydia, Gonorrhea, and Early Syphilis Cases and Rates Tables for 2010
Gender & Age Group Chlamydia Gonorrhea P&S Syphilis Early Latent Syphilis Population
Cases Percent1 Rate Cases Percent1 Rate Cases Percent1 Rate Cases Percent1 Rate Number Percent1
COUNTY TOTAL 3,678 100.0% 526.8 709 100.0% 101.5 32 100.0% 4.6 12 100.0% 1.7 741,417 100.0%
Female Total 2,500 68.0% 670.9 371 52.3% 99.6 9 28.1% 2.4 3 25.0% 0.8 372,620 50.3% Ages 00 – 09 0 0.0% 0.0 0 0.0% 0.0 0 0.0% 0.0 0 0.0% 0.0 67,107 18.0% 10 – 14 21 0.8% 64.1 6 1.6% 18.3 0 0.0% 0.0 0 0.0% 0.0 32,765 8.8% 15 – 19 928 37.3% 2,868.4 135 36.5% 417.3 1 11.1% 3.1 0 0.0% 0.0 32,353 8.7% 20 – 24 937 37.7% 3,171.6 119 32.2% 402.8 1 11.1% 3.4 1 33.3% 3.4 29,543 7.9% 25 – 29 340 13.7% 1,264.6 54 14.6% 200.9 1 11.1% 3.7 2 66.7% 7.4 26,885 7.2% 30 – 34 132 5.3% 639.1 28 7.6% 135.6 1 11.1% 4.8 0 0.0% 0.0 20,655 5.5% 35 – 44 104 4.2% 259.6 21 5.7% 52.4 4 44.4% 10.0 0 0.0% 0.0 40,061 10.8% 45 + 25 1.0% 20.3 7 1.9% 5.7 1 11.1% 0.8 0 0.0% 0.0 123,251 33.1% Not Specified 13 0.5% - 1 0.3% - 0 0.0% - 0 0.0% -
Male Total 1,152 31.3% 312.4 333 47.0% 90.3 23 71.9% 6.2 9 75.0% 2.4 368,797 49.7% Ages 00 – 09 1 0.1% 1.4 0 0.0% 0.0 0 0.0% 0.0 0 0.0% 0.0 69,670 18.9% 10 – 14 10 0.9% 30.5 3 0.9% 9.1 0 0.0% 0.0 0 0.0% 0.0 32,794 8.9% 15 – 19 256 22.4% 776.2 68 20.4% 206.2 2 8.7% 6.1 0 0.0% 0.0 32,981 8.9% 20 – 24 406 35.6% 1,282.1 90 27.0% 284.2 4 17.4% 12.6 1 11.1% 3.2 31,668 8.6% 25 – 29 278 24.3% 966.7 85 25.5% 295.6 4 17.4% 13.9 2 22.2% 7.0 28,759 7.8% 30 – 34 92 8.1% 438.5 32 9.6% 152.5 2 8.7% 9.5 3 33.3% 14.3 20,982 5.7% 35 – 44 72 6.3% 174.9 41 12.3% 99.6 5 21.7% 12.1 3 33.3% 7.3 41,166 11.2% 45 + 27 2.4% 24.4 14 4.2% 12.6 6 26.1% 5.4 0 0.0% 0.0 110,777 30.0% Not Specified 10 0.9% - 0 0.0% - 0 0.0% - 0 0.0% -
Gender & Race/Ethnicity Chlamydia Gonorrhea P&S Syphilis Early Latent Syphilis Population
Cases Percent1 Rate Cases Percent1 Rate Cases Percent1 Rate Cases Percent1 Rate Number Percent1
COUNTY TOTAL 3,678 100.0% 526.8 709 100.0% 101.5 32 100.0% 4.6 12 100.0% 1.7 741,417 100.0%
Female Total 2,500 68.0% 670.9 371 52.3% 99.6 9 28.1% 2.4 3 25.0% 0.8 372,620 50.3%American Indian/Alaska Native 4 0.3% 159.1 0 0.0% 0.0 0 0.0% 0.0 0 0.0% 0.0 2,514 0.7%Asian/Pacific Islander 156 10.2% 273.9 15 6.3% 26.3 0 0.0% 0.0 0 0.0% 0.0 56,953 15.3%Black/African-American 400 26.1% 1,527.7 118 49.2% 450.7 5 55.6% 19.1 0 0.0% 0.0 26,184 7.0%Latina/Hispanic 674 44.1% 515.2 68 28.3% 52.0 1 11.1% 0.8 1 33.3% 0.8 130,818 35.1%White 296 19.3% 201.1 39 16.3% 26.5 3 33.3% 2.0 2 66.7% 1.4 147,219 39.5%Other/Multi/Not Specified 970 38.8% - 131 35.3% - 0 0.0% - 0 0.0% - 8,932 2.4%Male Total 1,152 31.3% 312.4 333 47.0% 90.3 23 71.9% 6.2 9 75.0% 2.4 368,797 49.7%American Indian/Alaska Native 1 0.2% 43.0 0 0.0% 0.0 0 0.0% 0.0 0 0.0% 0.0 2,324 0.6%Asian/Pacific Islander 41 7.3% 78.2 9 4.6% 17.2 1 4.5% 1.9 1 12.5% 1.9 52,418 14.2%Black/African-American 198 35.1% 789.1 101 51.5% 402.5 2 9.1% 8.0 1 12.5% 4.0 25,093 6.8%Latina/Hispanic 239 42.4% 178.1 63 32.1% 47.0 13 59.1% 9.7 4 50.0% 3.0 134,183 36.4%White 85 15.1% 57.9 23 11.7% 15.7 6 27.3% 4.1 2 25.0% 1.4 146,709 39.8%Other/Multi/Not Specified 588 51.0% - 137 41.1% - 1 4.3% - 1 11.1% - 8,070 2.2%
California Local Health Jurisdiction STD Data Summaries, 2010 Provisional Data (July 2011)

1:100
San Luis Obispo County – Chlamydia, Gonorrhea, and P&S SyphilisRates by Age Group (2010), Race/Ethnicity (2010), and Year
0−9 10−14 15−19 20−24 25−29 30−34 35−44 45+
Age Group
0
500
1000
1500
2000
Chlamydia
Nat. Am. A/PI Black Latino White
Race/Ethnicity*
0
200
400
600
800
1000
1200
1400
Chlamydia
2001 2002 2003 2004 2005 2006 2007 2008 2009 2010
0
100
200
300
400
Year
Chlamydia
0−9 10−14 15−19 20−24 25−29 30−34 35−44 45+
Age Group
0
10
20
30
40
50
Gonorrhea
Nat. Am. A/PI Black Latino White
Race/Ethnicity*
0
5
10
15
20 Gonorrhea
2001 2002 2003 2004 2005 2006 2007 2008 2009 2010
0
5
10
15
20
25
30
Year
Gonorrhea
0−9 10−14 15−19 20−24 25−29 30−34 35−44 45+
Age Group
0
1 P&S Syphilis
Nat. Am. A/PI Black Latino White
Race/Ethnicity*
0
1 P&S Syphilis
2001 2002 2003 2004 2005 2006 2007 2008 2009 2010
0
1
2
3
4
5
6
7
Year
P&S Syphilis
Female Male Female Male
* Race data may be missing for a substantial number of cases. See the 'Data Limitations' page for further information.Note: Rates are per 100,000 population.
Source: California Department of Public Health, STD Control Branch
California Local Health Jurisdiction STD Data Summaries, 2010 Provisional Data (July 2011)

1 Gender specific age groups and race/ethnicity percent calculations exclude "Not Specified" from the denominator. 2 Overall county rates were calculated using the July 1 county population estimates from the Department of Finance. (For San Luis Obispo County, the July 1, 2010 estimate is 274,820). Note: Rates are per 100,000 population. Source: California Department of Public Health, STD Control Branch
San Luis Obispo County – Chlamydia, Gonorrhea, and Early Syphilis Cases and Rates Tables for 2010
Gender & Age Group Chlamydia Gonorrhea P&S Syphilis Early Latent Syphilis Population
Cases Percent1 Rate Cases Percent1 Rate Cases Percent1 Rate Cases Percent1 Rate Number Percent1
COUNTY TOTAL 673 100.0% 244.9 31 100.0% 11.3 0 100.0% 0.0 0 100.0% 0.0 269,734 100.0%
Female Total 459 68.2% 347.6 11 35.5% 8.3 0 0.0% 0.0 0 0.0% 0.0 132,041 49.0% Ages 00 – 09 1 0.2% 7.1 0 0.0% 0.0 0 0.0% 0.0 0 0.0% 0.0 14,075 10.7% 10 – 14 1 0.2% 13.5 0 0.0% 0.0 0 0.0% 0.0 0 0.0% 0.0 7,402 5.6% 15 – 19 142 31.0% 1,405.0 3 27.3% 29.7 0 0.0% 0.0 0 0.0% 0.0 10,107 7.7% 20 – 24 208 45.4% 1,842.3 5 45.5% 44.3 0 0.0% 0.0 0 0.0% 0.0 11,290 8.6% 25 – 29 68 14.8% 844.0 2 18.2% 24.8 0 0.0% 0.0 0 0.0% 0.0 8,057 6.1% 30 – 34 23 5.0% 349.9 0 0.0% 0.0 0 0.0% 0.0 0 0.0% 0.0 6,573 5.0% 35 – 44 12 2.6% 97.9 1 9.1% 8.2 0 0.0% 0.0 0 0.0% 0.0 12,258 9.3% 45 + 3 0.7% 4.8 0 0.0% 0.0 0 0.0% 0.0 0 0.0% 0.0 62,279 47.2% Not Specified 1 0.2% - 0 0.0% - 0 0.0% - 0 0.0% -
Male Total 214 31.8% 155.4 20 64.5% 14.5 0 0.0% 0.0 0 0.0% 0.0 137,693 51.0% Ages 00 – 09 0 0.0% 0.0 0 0.0% 0.0 0 0.0% 0.0 0 0.0% 0.0 14,684 10.7% 10 – 14 0 0.0% 0.0 0 0.0% 0.0 0 0.0% 0.0 0 0.0% 0.0 7,503 5.4% 15 – 19 35 16.4% 306.7 3 15.0% 26.3 0 0.0% 0.0 0 0.0% 0.0 11,410 8.3% 20 – 24 95 44.6% 675.0 7 35.0% 49.7 0 0.0% 0.0 0 0.0% 0.0 14,074 10.2% 25 – 29 57 26.8% 563.9 4 20.0% 39.6 0 0.0% 0.0 0 0.0% 0.0 10,109 7.3% 30 – 34 15 7.0% 163.2 0 0.0% 0.0 0 0.0% 0.0 0 0.0% 0.0 9,192 6.7% 35 – 44 9 4.2% 62.1 3 15.0% 20.7 0 0.0% 0.0 0 0.0% 0.0 14,504 10.5% 45 + 2 0.9% 3.6 3 15.0% 5.3 0 0.0% 0.0 0 0.0% 0.0 56,217 40.8% Not Specified 1 0.5% - 0 0.0% - 0 0.0% - 0 0.0% -
Gender & Race/Ethnicity Chlamydia Gonorrhea P&S Syphilis Early Latent Syphilis Population
Cases Percent1 Rate Cases Percent1 Rate Cases Percent1 Rate Cases Percent1 Rate Number Percent1
COUNTY TOTAL 673 100.0% 244.9 31 100.0% 11.3 0 100.0% 0.0 0 100.0% 0.0 269,734 100.0%
Female Total 459 68.2% 347.6 11 35.5% 8.3 0 0.0% 0.0 0 0.0% 0.0 132,041 49.0%American Indian/Alaska Native 1 0.2% 137.6 0 0.0% 0.0 0 0.0% 0.0 0 0.0% 0.0 727 0.6%Asian/Pacific Islander 4 0.9% 99.6 0 0.0% 0.0 0 0.0% 0.0 0 0.0% 0.0 4,015 3.0%Black/African-American 14 3.1% 1,293.9 0 0.0% 0.0 0 0.0% 0.0 0 0.0% 0.0 1,082 0.8%Latina/Hispanic 128 28.1% 470.4 4 36.4% 14.7 0 0.0% 0.0 0 0.0% 0.0 27,211 20.6%White 308 67.7% 319.2 7 63.6% 7.3 0 0.0% 0.0 0 0.0% 0.0 96,500 73.1%Other/Multi/Not Specified 4 0.9% - 0 0.0% - 0 0.0% - 0 0.0% - 2,506 1.9%Male Total 214 31.8% 155.4 20 64.5% 14.5 0 0.0% 0.0 0 0.0% 0.0 137,693 51.0%American Indian/Alaska Native 0 0.0% 0.0 0 0.0% 0.0 0 0.0% 0.0 0 0.0% 0.0 890 0.6%Asian/Pacific Islander 3 1.4% 72.9 0 0.0% 0.0 0 0.0% 0.0 0 0.0% 0.0 4,118 3.0%Black/African-American 6 2.8% 156.4 0 0.0% 0.0 0 0.0% 0.0 0 0.0% 0.0 3,837 2.8%Latina/Hispanic 54 25.6% 174.6 4 20.0% 12.9 0 0.0% 0.0 0 0.0% 0.0 30,924 22.5%White 148 70.1% 155.1 16 80.0% 16.8 0 0.0% 0.0 0 0.0% 0.0 95,405 69.3%Other/Multi/Not Specified 3 1.4% - 0 0.0% - 0 0.0% - 0 0.0% - 2,519 1.8%
California Local Health Jurisdiction STD Data Summaries, 2010 Provisional Data (July 2011)

1:100
San Mateo County – Chlamydia, Gonorrhea, and P&S SyphilisRates by Age Group (2010), Race/Ethnicity (2010), and Year
0−9 10−14 15−19 20−24 25−29 30−34 35−44 45+
Age Group
0
500
1000
1500
2000
2500
Chlamydia
Nat. Am. A/PI Black Latino White
Race/Ethnicity*
0
200
400
600
800
1000
Chlamydia
2001 2002 2003 2004 2005 2006 2007 2008 2009 2010
0
100
200
300
400
Year
Chlamydia
0−9 10−14 15−19 20−24 25−29 30−34 35−44 45+
Age Group
0
50
100
150
Gonorrhea
Nat. Am. A/PI Black Latino White
Race/Ethnicity*
0
50
100
150
200
Gonorrhea
2001 2002 2003 2004 2005 2006 2007 2008 2009 2010
0
10
20
30
40
50
60
Year
Gonorrhea
0−9 10−14 15−19 20−24 25−29 30−34 35−44 45+
Age Group
0
5
10
15
20
25
P&S Syphilis
Nat. Am. A/PI Black Latino White
Race/Ethnicity*
0
2
4
6
8
P&S Syphilis
2001 2002 2003 2004 2005 2006 2007 2008 2009 2010
0
2
4
6
8
10
Year
P&S Syphilis
Female Male Female Male
* Race data may be missing for a substantial number of cases. See the 'Data Limitations' page for further information.Note: Rates are per 100,000 population.
Source: California Department of Public Health, STD Control Branch
California Local Health Jurisdiction STD Data Summaries, 2010 Provisional Data (July 2011)

1 Gender specific age groups and race/ethnicity percent calculations exclude "Not Specified" from the denominator. 2 Overall county rates were calculated using the July 1 county population estimates from the Department of Finance. (For San Mateo County, the July 1, 2010 estimate is 756,892). Note: Rates are per 100,000 population. Source: California Department of Public Health, STD Control Branch
San Mateo County – Chlamydia, Gonorrhea, and Early Syphilis Cases and Rates Tables for 2010
Gender & Age Group Chlamydia Gonorrhea P&S Syphilis Early Latent Syphilis Population
Cases Percent1 Rate Cases Percent1 Rate Cases Percent1 Rate Cases Percent1 Rate Number Percent1
COUNTY TOTAL 1,967 100.0% 259.9 211 100.0% 27.9 23 100.0% 3.0 10 100.0% 1.3 736,667 100.0%
Female Total 1,337 68.0% 361.2 57 27.0% 15.4 0 0.0% 0.0 0 0.0% 0.0 370,178 50.3% Ages 00 – 09 7 0.5% 15.2 0 0.0% 0.0 0 0.0% 0.0 0 0.0% 0.0 45,997 12.4% 10 – 14 9 0.7% 43.4 0 0.0% 0.0 0 0.0% 0.0 0 0.0% 0.0 20,748 5.6% 15 – 19 403 30.3% 1,872.7 12 21.1% 55.8 0 0.0% 0.0 0 0.0% 0.0 21,520 5.8% 20 – 24 485 36.4% 2,362.7 22 38.6% 107.2 0 0.0% 0.0 0 0.0% 0.0 20,527 5.5% 25 – 29 236 17.7% 1,198.5 7 12.3% 35.5 0 0.0% 0.0 0 0.0% 0.0 19,692 5.3% 30 – 34 85 6.4% 381.2 8 14.0% 35.9 0 0.0% 0.0 0 0.0% 0.0 22,296 6.0% 35 – 44 69 5.2% 118.1 6 10.5% 10.3 0 0.0% 0.0 0 0.0% 0.0 58,419 15.8% 45 + 38 2.9% 23.6 2 3.5% 1.2 0 0.0% 0.0 0 0.0% 0.0 160,979 43.5% Not Specified 5 0.4% - 0 0.0% - 0 0.0% - 0 0.0% -
Male Total 616 31.3% 168.1 153 72.5% 41.7 23 100.0% 6.3 10 100.0% 2.7 366,489 49.7% Ages 00 – 09 2 0.3% 4.2 0 0.0% 0.0 0 0.0% 0.0 0 0.0% 0.0 47,739 13.0% 10 – 14 4 0.7% 18.3 0 0.0% 0.0 0 0.0% 0.0 0 0.0% 0.0 21,862 6.0% 15 – 19 90 14.7% 400.2 19 12.5% 84.5 0 0.0% 0.0 0 0.0% 0.0 22,491 6.1% 20 – 24 184 30.1% 821.2 29 19.1% 129.4 4 17.4% 17.9 1 10.0% 4.5 22,405 6.1% 25 – 29 116 19.0% 523.9 34 22.4% 153.6 2 8.7% 9.0 4 40.0% 18.1 22,141 6.0% 30 – 34 77 12.6% 310.9 16 10.5% 64.6 6 26.1% 24.2 1 10.0% 4.0 24,766 6.8% 35 – 44 77 12.6% 124.9 27 17.8% 43.8 7 30.4% 11.4 3 30.0% 4.9 61,672 16.8% 45 + 61 10.0% 42.5 27 17.8% 18.8 4 17.4% 2.8 1 10.0% 0.7 143,413 39.1% Not Specified 5 0.8% - 1 0.7% - 0 0.0% - 0 0.0% -
Gender & Race/Ethnicity Chlamydia Gonorrhea P&S Syphilis Early Latent Syphilis Population
Cases Percent1 Rate Cases Percent1 Rate Cases Percent1 Rate Cases Percent1 Rate Number Percent1
COUNTY TOTAL 1,967 100.0% 259.9 211 100.0% 27.9 23 100.0% 3.0 10 100.0% 1.3 736,667 100.0%
Female Total 1,337 68.0% 361.2 57 27.0% 15.4 0 0.0% 0.0 0 0.0% 0.0 370,178 50.3%American Indian/Alaska Native 3 0.3% 299.4 0 0.0% 0.0 0 0.0% 0.0 0 0.0% 0.0 1,002 0.3%Asian/Pacific Islander 210 20.3% 214.6 9 17.3% 9.2 0 0.0% 0.0 0 0.0% 0.0 97,841 26.4%Black/African-American 129 12.4% 965.0 17 32.7% 127.2 0 0.0% 0.0 0 0.0% 0.0 13,368 3.6%Latina/Hispanic 522 50.3% 567.6 10 19.2% 10.9 0 0.0% 0.0 0 0.0% 0.0 91,967 24.8%White 173 16.7% 110.1 16 30.8% 10.2 0 0.0% 0.0 0 0.0% 0.0 157,099 42.4%Other/Multi/Not Specified 300 22.4% - 5 8.8% - 0 0.0% - 0 0.0% - 8,901 2.4%Male Total 616 31.3% 168.1 153 72.5% 41.7 23 100.0% 6.3 10 100.0% 2.7 366,489 49.7%American Indian/Alaska Native 3 0.7% 358.9 0 0.0% 0.0 0 0.0% 0.0 0 0.0% 0.0 836 0.2%Asian/Pacific Islander 85 18.4% 94.8 35 24.1% 39.0 6 28.6% 6.7 0 0.0% 0.0 89,703 24.5%Black/African-American 73 15.8% 541.5 25 17.2% 185.5 1 4.8% 7.4 1 10.0% 7.4 13,480 3.7%Latina/Hispanic 196 42.5% 203.2 47 32.4% 48.7 7 33.3% 7.3 5 50.0% 5.2 96,453 26.3%White 104 22.6% 66.3 38 26.2% 24.2 7 33.3% 4.5 4 40.0% 2.5 156,893 42.8%Other/Multi/Not Specified 155 25.2% - 8 5.2% - 2 8.7% - 0 0.0% - 9,124 2.5%
California Local Health Jurisdiction STD Data Summaries, 2010 Provisional Data (July 2011)

1:100
Santa Barbara County – Chlamydia, Gonorrhea, and P&S SyphilisRates by Age Group (2010), Race/Ethnicity (2010), and Year
0−9 10−14 15−19 20−24 25−29 30−34 35−44 45+
Age Group
0
500
1000
1500
2000
2500
3000 Chlamydia
Nat. Am. A/PI Black Latino White
Race/Ethnicity*
0
200
400
600
800 Chlamydia
2001 2002 2003 2004 2005 2006 2007 2008 2009 2010
0
100
200
300
400
500
Year
Chlamydia
0−9 10−14 15−19 20−24 25−29 30−34 35−44 45+
Age Group
0
20
40
60
80
100 Gonorrhea
Nat. Am. A/PI Black Latino White
Race/Ethnicity*
0
20
40
60
80
Gonorrhea
2001 2002 2003 2004 2005 2006 2007 2008 2009 2010
0
10
20
30
Year
Gonorrhea
0−9 10−14 15−19 20−24 25−29 30−34 35−44 45+
Age Group
0
2
4
6
8
10
12
P&S Syphilis
Nat. Am. A/PI Black Latino White
Race/Ethnicity*
0
5
10
15
P&S Syphilis
2001 2002 2003 2004 2005 2006 2007 2008 2009 2010
0
2
4
6
8
Year
P&S Syphilis
Female Male Female Male
* Race data may be missing for a substantial number of cases. See the 'Data Limitations' page for further information.Note: Rates are per 100,000 population.
Source: California Department of Public Health, STD Control Branch
California Local Health Jurisdiction STD Data Summaries, 2010 Provisional Data (July 2011)
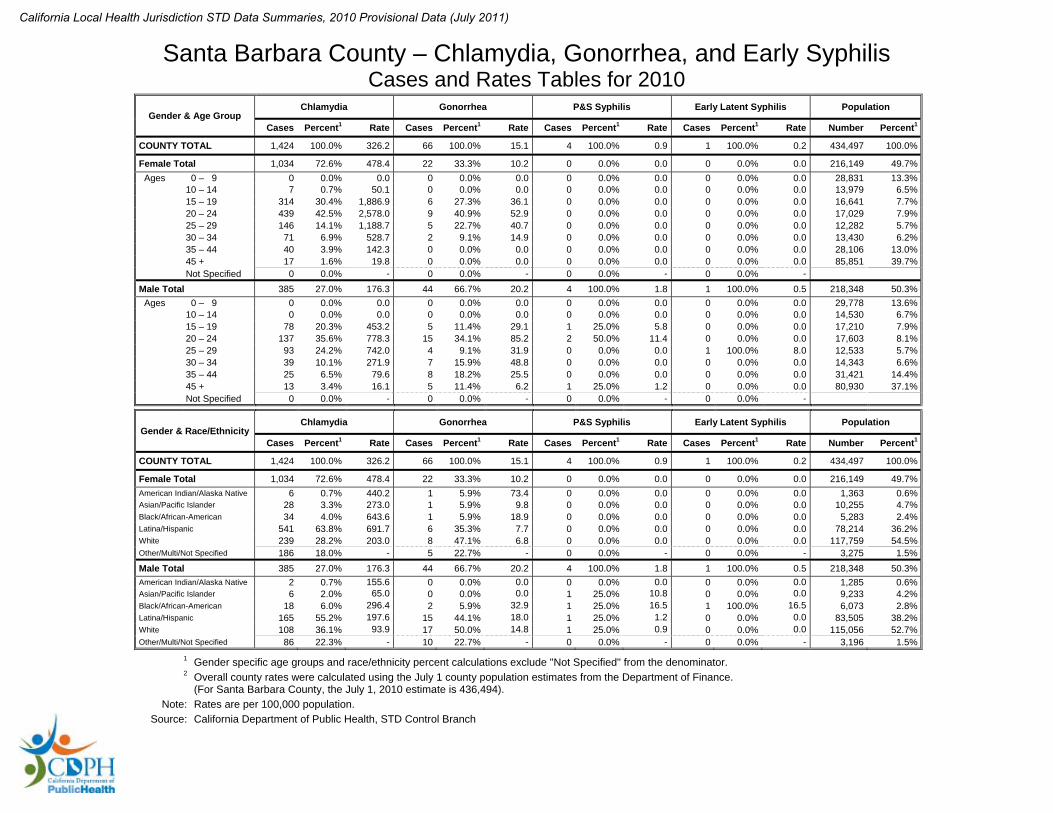
1 Gender specific age groups and race/ethnicity percent calculations exclude "Not Specified" from the denominator. 2 Overall county rates were calculated using the July 1 county population estimates from the Department of Finance. (For Santa Barbara County, the July 1, 2010 estimate is 436,494). Note: Rates are per 100,000 population. Source: California Department of Public Health, STD Control Branch
Santa Barbara County – Chlamydia, Gonorrhea, and Early Syphilis Cases and Rates Tables for 2010
Gender & Age Group Chlamydia Gonorrhea P&S Syphilis Early Latent Syphilis Population
Cases Percent1 Rate Cases Percent1 Rate Cases Percent1 Rate Cases Percent1 Rate Number Percent1
COUNTY TOTAL 1,424 100.0% 326.2 66 100.0% 15.1 4 100.0% 0.9 1 100.0% 0.2 434,497 100.0%
Female Total 1,034 72.6% 478.4 22 33.3% 10.2 0 0.0% 0.0 0 0.0% 0.0 216,149 49.7% Ages 00 – 09 0 0.0% 0.0 0 0.0% 0.0 0 0.0% 0.0 0 0.0% 0.0 28,831 13.3% 10 – 14 7 0.7% 50.1 0 0.0% 0.0 0 0.0% 0.0 0 0.0% 0.0 13,979 6.5% 15 – 19 314 30.4% 1,886.9 6 27.3% 36.1 0 0.0% 0.0 0 0.0% 0.0 16,641 7.7% 20 – 24 439 42.5% 2,578.0 9 40.9% 52.9 0 0.0% 0.0 0 0.0% 0.0 17,029 7.9% 25 – 29 146 14.1% 1,188.7 5 22.7% 40.7 0 0.0% 0.0 0 0.0% 0.0 12,282 5.7% 30 – 34 71 6.9% 528.7 2 9.1% 14.9 0 0.0% 0.0 0 0.0% 0.0 13,430 6.2% 35 – 44 40 3.9% 142.3 0 0.0% 0.0 0 0.0% 0.0 0 0.0% 0.0 28,106 13.0% 45 + 17 1.6% 19.8 0 0.0% 0.0 0 0.0% 0.0 0 0.0% 0.0 85,851 39.7% Not Specified 0 0.0% - 0 0.0% - 0 0.0% - 0 0.0% -
Male Total 385 27.0% 176.3 44 66.7% 20.2 4 100.0% 1.8 1 100.0% 0.5 218,348 50.3% Ages 00 – 09 0 0.0% 0.0 0 0.0% 0.0 0 0.0% 0.0 0 0.0% 0.0 29,778 13.6% 10 – 14 0 0.0% 0.0 0 0.0% 0.0 0 0.0% 0.0 0 0.0% 0.0 14,530 6.7% 15 – 19 78 20.3% 453.2 5 11.4% 29.1 1 25.0% 5.8 0 0.0% 0.0 17,210 7.9% 20 – 24 137 35.6% 778.3 15 34.1% 85.2 2 50.0% 11.4 0 0.0% 0.0 17,603 8.1% 25 – 29 93 24.2% 742.0 4 9.1% 31.9 0 0.0% 0.0 1 100.0% 8.0 12,533 5.7% 30 – 34 39 10.1% 271.9 7 15.9% 48.8 0 0.0% 0.0 0 0.0% 0.0 14,343 6.6% 35 – 44 25 6.5% 79.6 8 18.2% 25.5 0 0.0% 0.0 0 0.0% 0.0 31,421 14.4% 45 + 13 3.4% 16.1 5 11.4% 6.2 1 25.0% 1.2 0 0.0% 0.0 80,930 37.1% Not Specified 0 0.0% - 0 0.0% - 0 0.0% - 0 0.0% -
Gender & Race/Ethnicity Chlamydia Gonorrhea P&S Syphilis Early Latent Syphilis Population
Cases Percent1 Rate Cases Percent1 Rate Cases Percent1 Rate Cases Percent1 Rate Number Percent1
COUNTY TOTAL 1,424 100.0% 326.2 66 100.0% 15.1 4 100.0% 0.9 1 100.0% 0.2 434,497 100.0%
Female Total 1,034 72.6% 478.4 22 33.3% 10.2 0 0.0% 0.0 0 0.0% 0.0 216,149 49.7%American Indian/Alaska Native 6 0.7% 440.2 1 5.9% 73.4 0 0.0% 0.0 0 0.0% 0.0 1,363 0.6%Asian/Pacific Islander 28 3.3% 273.0 1 5.9% 9.8 0 0.0% 0.0 0 0.0% 0.0 10,255 4.7%Black/African-American 34 4.0% 643.6 1 5.9% 18.9 0 0.0% 0.0 0 0.0% 0.0 5,283 2.4%Latina/Hispanic 541 63.8% 691.7 6 35.3% 7.7 0 0.0% 0.0 0 0.0% 0.0 78,214 36.2%White 239 28.2% 203.0 8 47.1% 6.8 0 0.0% 0.0 0 0.0% 0.0 117,759 54.5%Other/Multi/Not Specified 186 18.0% - 5 22.7% - 0 0.0% - 0 0.0% - 3,275 1.5%Male Total 385 27.0% 176.3 44 66.7% 20.2 4 100.0% 1.8 1 100.0% 0.5 218,348 50.3%American Indian/Alaska Native 2 0.7% 155.6 0 0.0% 0.0 0 0.0% 0.0 0 0.0% 0.0 1,285 0.6%Asian/Pacific Islander 6 2.0% 65.0 0 0.0% 0.0 1 25.0% 10.8 0 0.0% 0.0 9,233 4.2%Black/African-American 18 6.0% 296.4 2 5.9% 32.9 1 25.0% 16.5 1 100.0% 16.5 6,073 2.8%Latina/Hispanic 165 55.2% 197.6 15 44.1% 18.0 1 25.0% 1.2 0 0.0% 0.0 83,505 38.2%White 108 36.1% 93.9 17 50.0% 14.8 1 25.0% 0.9 0 0.0% 0.0 115,056 52.7%Other/Multi/Not Specified 86 22.3% - 10 22.7% - 0 0.0% - 0 0.0% - 3,196 1.5%
California Local Health Jurisdiction STD Data Summaries, 2010 Provisional Data (July 2011)

1:100
Santa Clara County – Chlamydia, Gonorrhea, and P&S SyphilisRates by Age Group (2010), Race/Ethnicity (2010), and Year
0−9 10−14 15−19 20−24 25−29 30−34 35−44 45+
Age Group
0
500
1000
1500
2000
2500
3000
Chlamydia
Nat. Am. A/PI Black Latino White
Race/Ethnicity*
0
50
100
150
200
250
300 Chlamydia
2001 2002 2003 2004 2005 2006 2007 2008 2009 2010
0
100
200
300
400
500
Year
Chlamydia
0−9 10−14 15−19 20−24 25−29 30−34 35−44 45+
Age Group
0
50
100
150
Gonorrhea
Nat. Am. A/PI Black Latino White
Race/Ethnicity*
0
10
20
30
40
50
Gonorrhea
2001 2002 2003 2004 2005 2006 2007 2008 2009 2010
0
20
40
60
80
Year
Gonorrhea
0−9 10−14 15−19 20−24 25−29 30−34 35−44 45+
Age Group
0
10
20
30
40
P&S Syphilis
Nat. Am. A/PI Black Latino White
Race/Ethnicity*
0
5
10
15
20
P&S Syphilis
2001 2002 2003 2004 2005 2006 2007 2008 2009 2010
0
2
4
6
8
10
Year
P&S Syphilis
Female Male Female Male
* Race data may be missing for a substantial number of cases. See the 'Data Limitations' page for further information.Note: Rates are per 100,000 population.
Source: California Department of Public Health, STD Control Branch
California Local Health Jurisdiction STD Data Summaries, 2010 Provisional Data (July 2011)
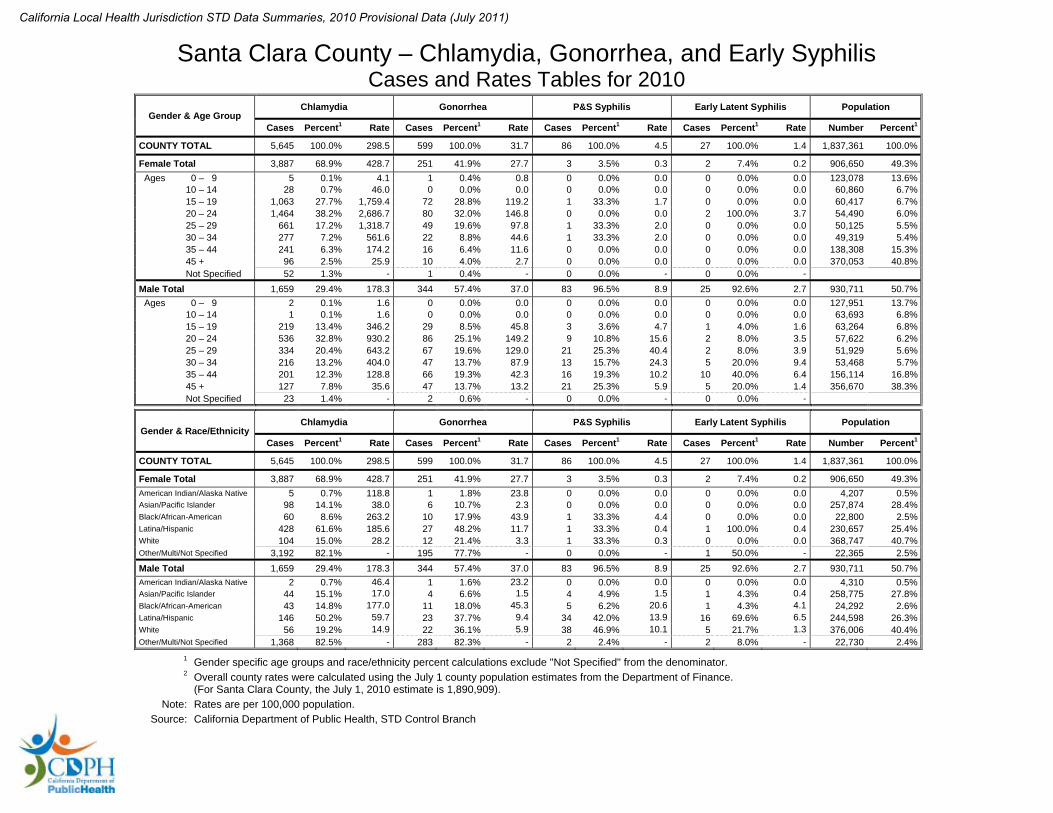
1 Gender specific age groups and race/ethnicity percent calculations exclude "Not Specified" from the denominator. 2 Overall county rates were calculated using the July 1 county population estimates from the Department of Finance. (For Santa Clara County, the July 1, 2010 estimate is 1,890,909). Note: Rates are per 100,000 population. Source: California Department of Public Health, STD Control Branch
Santa Clara County – Chlamydia, Gonorrhea, and Early Syphilis Cases and Rates Tables for 2010
Gender & Age Group Chlamydia Gonorrhea P&S Syphilis Early Latent Syphilis Population
Cases Percent1 Rate Cases Percent1 Rate Cases Percent1 Rate Cases Percent1 Rate Number Percent1
COUNTY TOTAL 5,645 100.0% 298.5 599 100.0% 31.7 86 100.0% 4.5 27 100.0% 1.4 1,837,361 100.0%
Female Total 3,887 68.9% 428.7 251 41.9% 27.7 3 3.5% 0.3 2 7.4% 0.2 906,650 49.3% Ages 00 – 09 5 0.1% 4.1 1 0.4% 0.8 0 0.0% 0.0 0 0.0% 0.0 123,078 13.6% 10 – 14 28 0.7% 46.0 0 0.0% 0.0 0 0.0% 0.0 0 0.0% 0.0 60,860 6.7% 15 – 19 1,063 27.7% 1,759.4 72 28.8% 119.2 1 33.3% 1.7 0 0.0% 0.0 60,417 6.7% 20 – 24 1,464 38.2% 2,686.7 80 32.0% 146.8 0 0.0% 0.0 2 100.0% 3.7 54,490 6.0% 25 – 29 661 17.2% 1,318.7 49 19.6% 97.8 1 33.3% 2.0 0 0.0% 0.0 50,125 5.5% 30 – 34 277 7.2% 561.6 22 8.8% 44.6 1 33.3% 2.0 0 0.0% 0.0 49,319 5.4% 35 – 44 241 6.3% 174.2 16 6.4% 11.6 0 0.0% 0.0 0 0.0% 0.0 138,308 15.3% 45 + 96 2.5% 25.9 10 4.0% 2.7 0 0.0% 0.0 0 0.0% 0.0 370,053 40.8% Not Specified 52 1.3% - 1 0.4% - 0 0.0% - 0 0.0% -
Male Total 1,659 29.4% 178.3 344 57.4% 37.0 83 96.5% 8.9 25 92.6% 2.7 930,711 50.7% Ages 00 – 09 2 0.1% 1.6 0 0.0% 0.0 0 0.0% 0.0 0 0.0% 0.0 127,951 13.7% 10 – 14 1 0.1% 1.6 0 0.0% 0.0 0 0.0% 0.0 0 0.0% 0.0 63,693 6.8% 15 – 19 219 13.4% 346.2 29 8.5% 45.8 3 3.6% 4.7 1 4.0% 1.6 63,264 6.8% 20 – 24 536 32.8% 930.2 86 25.1% 149.2 9 10.8% 15.6 2 8.0% 3.5 57,622 6.2% 25 – 29 334 20.4% 643.2 67 19.6% 129.0 21 25.3% 40.4 2 8.0% 3.9 51,929 5.6% 30 – 34 216 13.2% 404.0 47 13.7% 87.9 13 15.7% 24.3 5 20.0% 9.4 53,468 5.7% 35 – 44 201 12.3% 128.8 66 19.3% 42.3 16 19.3% 10.2 10 40.0% 6.4 156,114 16.8% 45 + 127 7.8% 35.6 47 13.7% 13.2 21 25.3% 5.9 5 20.0% 1.4 356,670 38.3% Not Specified 23 1.4% - 2 0.6% - 0 0.0% - 0 0.0% -
Gender & Race/Ethnicity Chlamydia Gonorrhea P&S Syphilis Early Latent Syphilis Population
Cases Percent1 Rate Cases Percent1 Rate Cases Percent1 Rate Cases Percent1 Rate Number Percent1
COUNTY TOTAL 5,645 100.0% 298.5 599 100.0% 31.7 86 100.0% 4.5 27 100.0% 1.4 1,837,361 100.0%
Female Total 3,887 68.9% 428.7 251 41.9% 27.7 3 3.5% 0.3 2 7.4% 0.2 906,650 49.3%American Indian/Alaska Native 5 0.7% 118.8 1 1.8% 23.8 0 0.0% 0.0 0 0.0% 0.0 4,207 0.5%Asian/Pacific Islander 98 14.1% 38.0 6 10.7% 2.3 0 0.0% 0.0 0 0.0% 0.0 257,874 28.4%Black/African-American 60 8.6% 263.2 10 17.9% 43.9 1 33.3% 4.4 0 0.0% 0.0 22,800 2.5%Latina/Hispanic 428 61.6% 185.6 27 48.2% 11.7 1 33.3% 0.4 1 100.0% 0.4 230,657 25.4%White 104 15.0% 28.2 12 21.4% 3.3 1 33.3% 0.3 0 0.0% 0.0 368,747 40.7%Other/Multi/Not Specified 3,192 82.1% - 195 77.7% - 0 0.0% - 1 50.0% - 22,365 2.5%Male Total 1,659 29.4% 178.3 344 57.4% 37.0 83 96.5% 8.9 25 92.6% 2.7 930,711 50.7%American Indian/Alaska Native 2 0.7% 46.4 1 1.6% 23.2 0 0.0% 0.0 0 0.0% 0.0 4,310 0.5%Asian/Pacific Islander 44 15.1% 17.0 4 6.6% 1.5 4 4.9% 1.5 1 4.3% 0.4 258,775 27.8%Black/African-American 43 14.8% 177.0 11 18.0% 45.3 5 6.2% 20.6 1 4.3% 4.1 24,292 2.6%Latina/Hispanic 146 50.2% 59.7 23 37.7% 9.4 34 42.0% 13.9 16 69.6% 6.5 244,598 26.3%White 56 19.2% 14.9 22 36.1% 5.9 38 46.9% 10.1 5 21.7% 1.3 376,006 40.4%Other/Multi/Not Specified 1,368 82.5% - 283 82.3% - 2 2.4% - 2 8.0% - 22,730 2.4%
California Local Health Jurisdiction STD Data Summaries, 2010 Provisional Data (July 2011)

1:100
Santa Cruz County – Chlamydia, Gonorrhea, and P&S SyphilisRates by Age Group (2010), Race/Ethnicity (2010), and Year
0−9 10−14 15−19 20−24 25−29 30−34 35−44 45+
Age Group
0
500
1000
1500
2000
2500 Chlamydia
Nat. Am. A/PI Black Latino White
Race/Ethnicity*
0
100
200
300
400
500
600
Chlamydia
2001 2002 2003 2004 2005 2006 2007 2008 2009 2010
0
100
200
300
400
500
Year
Chlamydia
0−9 10−14 15−19 20−24 25−29 30−34 35−44 45+
Age Group
0
20
40
60
80
100
120 Gonorrhea
Nat. Am. A/PI Black Latino White
Race/Ethnicity*
0
20
40
60
80
Gonorrhea
2001 2002 2003 2004 2005 2006 2007 2008 2009 2010
0
10
20
30
40
50
Year
Gonorrhea
0−9 10−14 15−19 20−24 25−29 30−34 35−44 45+
Age Group
0
5
10
15
20
P&S Syphilis
Nat. Am. A/PI Black Latino White
Race/Ethnicity*
0
20
40
60
80 P&S Syphilis
2001 2002 2003 2004 2005 2006 2007 2008 2009 2010
0
1
2
3
4
5
6
7
Year
P&S Syphilis
Female Male Female Male
* Race data may be missing for a substantial number of cases. See the 'Data Limitations' page for further information.Note: Rates are per 100,000 population.
Source: California Department of Public Health, STD Control Branch
California Local Health Jurisdiction STD Data Summaries, 2010 Provisional Data (July 2011)

1 Gender specific age groups and race/ethnicity percent calculations exclude "Not Specified" from the denominator. 2 Overall county rates were calculated using the July 1 county population estimates from the Department of Finance. (For Santa Cruz County, the July 1, 2010 estimate is 272,092). Note: Rates are per 100,000 population. Source: California Department of Public Health, STD Control Branch
Santa Cruz County – Chlamydia, Gonorrhea, and Early Syphilis Cases and Rates Tables for 2010
Gender & Age Group Chlamydia Gonorrhea P&S Syphilis Early Latent Syphilis Population
Cases Percent1 Rate Cases Percent1 Rate Cases Percent1 Rate Cases Percent1 Rate Number Percent1
COUNTY TOTAL 762 100.0% 280.1 47 100.0% 17.3 8 100.0% 2.9 5 100.0% 1.8 268,016 100.0%
Female Total 555 72.8% 413.9 16 34.0% 11.9 0 0.0% 0.0 1 20.0% 0.7 134,077 50.0% Ages 00 – 09 0 0.0% 0.0 0 0.0% 0.0 0 0.0% 0.0 0 0.0% 0.0 16,430 12.3% 10 – 14 7 1.3% 101.3 0 0.0% 0.0 0 0.0% 0.0 0 0.0% 0.0 6,909 5.2% 15 – 19 170 30.6% 1,986.7 6 37.5% 70.1 0 0.0% 0.0 0 0.0% 0.0 8,557 6.4% 20 – 24 229 41.3% 2,168.4 6 37.5% 56.8 0 0.0% 0.0 0 0.0% 0.0 10,561 7.9% 25 – 29 84 15.1% 772.9 2 12.5% 18.4 0 0.0% 0.0 0 0.0% 0.0 10,868 8.1% 30 – 34 34 6.1% 347.5 1 6.3% 10.2 0 0.0% 0.0 1 100.0% 10.2 9,784 7.3% 35 – 44 30 5.4% 164.7 1 6.3% 5.5 0 0.0% 0.0 0 0.0% 0.0 18,219 13.6% 45 + 1 0.2% 1.9 0 0.0% 0.0 0 0.0% 0.0 0 0.0% 0.0 52,749 39.3% Not Specified 0 0.0% - 0 0.0% - 0 0.0% - 0 0.0% -
Male Total 206 27.0% 153.8 29 61.7% 21.7 8 100.0% 6.0 4 80.0% 3.0 133,939 50.0% Ages 00 – 09 0 0.0% 0.0 0 0.0% 0.0 0 0.0% 0.0 0 0.0% 0.0 17,284 12.9% 10 – 14 0 0.0% 0.0 0 0.0% 0.0 0 0.0% 0.0 0 0.0% 0.0 7,587 5.7% 15 – 19 38 18.4% 419.5 3 10.3% 33.1 1 12.5% 11.0 1 25.0% 11.0 9,059 6.8% 20 – 24 75 36.4% 750.3 10 34.5% 100.0 1 12.5% 10.0 1 25.0% 10.0 9,996 7.5% 25 – 29 48 23.3% 484.9 5 17.2% 50.5 0 0.0% 0.0 0 0.0% 0.0 9,898 7.4% 30 – 34 16 7.8% 150.2 5 17.2% 46.9 2 25.0% 18.8 0 0.0% 0.0 10,650 8.0% 35 – 44 20 9.7% 97.1 2 6.9% 9.7 3 37.5% 14.6 1 25.0% 4.9 20,602 15.4% 45 + 9 4.4% 18.4 4 13.8% 8.2 1 12.5% 2.0 1 25.0% 2.0 48,863 36.5% Not Specified 0 0.0% - 0 0.0% - 0 0.0% - 0 0.0% -
Gender & Race/Ethnicity Chlamydia Gonorrhea P&S Syphilis Early Latent Syphilis Population
Cases Percent1 Rate Cases Percent1 Rate Cases Percent1 Rate Cases Percent1 Rate Number Percent1
COUNTY TOTAL 762 100.0% 280.1 47 100.0% 17.3 8 100.0% 2.9 5 100.0% 1.8 268,016 100.0%
Female Total 555 72.8% 413.9 16 34.0% 11.9 0 0.0% 0.0 1 20.0% 0.7 134,077 50.0%American Indian/Alaska Native 3 0.7% 419.0 0 0.0% 0.0 0 0.0% 0.0 0 0.0% 0.0 716 0.5%Asian/Pacific Islander 19 4.7% 259.4 0 0.0% 0.0 0 0.0% 0.0 0 0.0% 0.0 7,326 5.5%Black/African-American 7 1.7% 573.3 1 6.7% 81.9 0 0.0% 0.0 0 0.0% 0.0 1,221 0.9%Latina/Hispanic 248 60.9% 539.8 7 46.7% 15.2 0 0.0% 0.0 0 0.0% 0.0 45,947 34.3%White 130 31.9% 170.4 7 46.7% 9.2 0 0.0% 0.0 1 100.0% 1.3 76,285 56.9%Other/Multi/Not Specified 148 26.7% - 1 6.3% - 0 0.0% - 0 0.0% - 2,582 1.9%Male Total 206 27.0% 153.8 29 61.7% 21.7 8 100.0% 6.0 4 80.0% 3.0 133,939 50.0%American Indian/Alaska Native 0 0.0% 0.0 0 0.0% 0.0 0 0.0% 0.0 0 0.0% 0.0 812 0.6%Asian/Pacific Islander 5 3.5% 76.5 1 3.4% 15.3 0 0.0% 0.0 0 0.0% 0.0 6,533 4.9%Black/African-American 4 2.8% 267.7 0 0.0% 0.0 1 12.5% 66.9 1 25.0% 66.9 1,494 1.1%Latina/Hispanic 78 54.9% 158.4 16 55.2% 32.5 2 25.0% 4.1 0 0.0% 0.0 49,231 36.8%White 55 38.7% 75.1 12 41.4% 16.4 5 62.5% 6.8 3 75.0% 4.1 73,261 54.7%Other/Multi/Not Specified 64 31.1% - 0 0.0% - 0 0.0% - 0 0.0% - 2,608 1.9%
California Local Health Jurisdiction STD Data Summaries, 2010 Provisional Data (July 2011)

1:100
Shasta County – Chlamydia, Gonorrhea, and P&S SyphilisRates by Age Group (2010), Race/Ethnicity (2010), and Year
0−9 10−14 15−19 20−24 25−29 30−34 35−44 45+
Age Group
0
500
1000
1500
2000 Chlamydia
Nat. Am. A/PI Black Latino White
Race/Ethnicity*
0
200
400
600
800
1000 Chlamydia
2001 2002 2003 2004 2005 2006 2007 2008 2009 2010
0
100
200
300
400
500
600
700
Year
Chlamydia
0−9 10−14 15−19 20−24 25−29 30−34 35−44 45+
Age Group
0
20
40
60
80
Gonorrhea
Nat. Am. A/PI Black Latino White
Race/Ethnicity*
0
50
100
150
200
250
300
350
Gonorrhea
2001 2002 2003 2004 2005 2006 2007 2008 2009 2010
0
10
20
30
40
50
60
Year
Gonorrhea
0−9 10−14 15−19 20−24 25−29 30−34 35−44 45+
Age Group
0
2
4
6
8
10
12
14
P&S Syphilis
Nat. Am. A/PI Black Latino White
Race/Ethnicity*
0
1 P&S Syphilis
2001 2002 2003 2004 2005 2006 2007 2008 2009 2010
0.0
0.2
0.4
0.6
0.8
1.0
1.2
1.4
Year
P&S Syphilis
Female Male Female Male
* Race data may be missing for a substantial number of cases. See the 'Data Limitations' page for further information.Note: Rates are per 100,000 population.
Source: California Department of Public Health, STD Control Branch
California Local Health Jurisdiction STD Data Summaries, 2010 Provisional Data (July 2011)

1 Gender specific age groups and race/ethnicity percent calculations exclude "Not Specified" from the denominator. 2 Overall county rates were calculated using the July 1 county population estimates from the Department of Finance. (For Shasta County, the July 1, 2010 estimate is 185,170). Note: Rates are per 100,000 population. Source: California Department of Public Health, STD Control Branch
Shasta County – Chlamydia, Gonorrhea, and Early Syphilis Cases and Rates Tables for 2010
Gender & Age Group Chlamydia Gonorrhea P&S Syphilis Early Latent Syphilis Population
Cases Percent1 Rate Cases Percent1 Rate Cases Percent1 Rate Cases Percent1 Rate Number Percent1
COUNTY TOTAL 415 100.0% 224.1 36 100.0% 19.4 1 100.0% 0.5 0 100.0% 0.0 191,722 100.0%
Female Total 300 72.3% 308.1 19 52.8% 19.5 0 0.0% 0.0 0 0.0% 0.0 97,364 50.8% Ages 00 – 09 0 0.0% 0.0 0 0.0% 0.0 0 0.0% 0.0 0 0.0% 0.0 10,827 11.1% 10 – 14 0 0.0% 0.0 0 0.0% 0.0 0 0.0% 0.0 0 0.0% 0.0 5,704 5.9% 15 – 19 117 39.1% 1,694.9 5 26.3% 72.4 0 0.0% 0.0 0 0.0% 0.0 6,903 7.1% 20 – 24 117 39.1% 1,586.9 6 31.6% 81.4 0 0.0% 0.0 0 0.0% 0.0 7,373 7.6% 25 – 29 40 13.4% 582.2 5 26.3% 72.8 0 0.0% 0.0 0 0.0% 0.0 6,870 7.1% 30 – 34 18 6.0% 398.7 2 10.5% 44.3 0 0.0% 0.0 0 0.0% 0.0 4,515 4.6% 35 – 44 6 2.0% 59.7 1 5.3% 9.9 0 0.0% 0.0 0 0.0% 0.0 10,054 10.3% 45 + 1 0.3% 2.2 0 0.0% 0.0 0 0.0% 0.0 0 0.0% 0.0 45,118 46.3% Not Specified 1 0.3% - 0 0.0% - 0 0.0% - 0 0.0% -
Male Total 113 27.2% 119.8 17 47.2% 18.0 1 100.0% 1.1 0 0.0% 0.0 94,358 49.2% Ages 00 – 09 0 0.0% 0.0 0 0.0% 0.0 0 0.0% 0.0 0 0.0% 0.0 11,674 12.4% 10 – 14 1 0.9% 16.1 0 0.0% 0.0 0 0.0% 0.0 0 0.0% 0.0 6,209 6.6% 15 – 19 31 27.4% 427.4 1 5.9% 13.8 0 0.0% 0.0 0 0.0% 0.0 7,254 7.7% 20 – 24 46 40.7% 590.5 6 35.3% 77.0 1 100.0% 12.8 0 0.0% 0.0 7,790 8.3% 25 – 29 10 8.8% 140.9 2 11.8% 28.2 0 0.0% 0.0 0 0.0% 0.0 7,095 7.5% 30 – 34 16 14.2% 341.7 1 5.9% 21.4 0 0.0% 0.0 0 0.0% 0.0 4,683 5.0% 35 – 44 8 7.1% 82.5 5 29.4% 51.6 0 0.0% 0.0 0 0.0% 0.0 9,693 10.3% 45 + 1 0.9% 2.5 2 11.8% 5.0 0 0.0% 0.0 0 0.0% 0.0 39,960 42.3% Not Specified 0 0.0% - 0 0.0% - 0 0.0% - 0 0.0% -
Gender & Race/Ethnicity Chlamydia Gonorrhea P&S Syphilis Early Latent Syphilis Population
Cases Percent1 Rate Cases Percent1 Rate Cases Percent1 Rate Cases Percent1 Rate Number Percent1
COUNTY TOTAL 415 100.0% 224.1 36 100.0% 19.4 1 100.0% 0.5 0 100.0% 0.0 191,722 100.0%
Female Total 300 72.3% 308.1 19 52.8% 19.5 0 0.0% 0.0 0 0.0% 0.0 97,364 50.8%American Indian/Alaska Native 5 3.0% 197.9 1 9.1% 39.6 0 0.0% 0.0 0 0.0% 0.0 2,526 2.6%Asian/Pacific Islander 5 3.0% 162.8 1 9.1% 32.6 0 0.0% 0.0 0 0.0% 0.0 3,072 3.2%Black/African-American 5 3.0% 802.6 2 18.2% 321.0 0 0.0% 0.0 0 0.0% 0.0 623 0.6%Latina/Hispanic 15 8.9% 261.8 0 0.0% 0.0 0 0.0% 0.0 0 0.0% 0.0 5,730 5.9%White 138 82.1% 166.8 7 63.6% 8.5 0 0.0% 0.0 0 0.0% 0.0 82,726 85.0%Other/Multi/Not Specified 132 44.0% - 8 42.1% - 0 0.0% - 0 0.0% - 2,687 2.8%Male Total 113 27.2% 119.8 17 47.2% 18.0 1 100.0% 1.1 0 0.0% 0.0 94,358 49.2%American Indian/Alaska Native 2 2.8% 84.4 1 8.3% 42.2 0 0.0% 0.0 0 0.0% 0.0 2,370 2.5%Asian/Pacific Islander 1 1.4% 35.1 0 0.0% 0.0 0 0.0% 0.0 0 0.0% 0.0 2,846 3.0%Black/African-American 7 9.7% 877.2 2 16.7% 250.6 0 0.0% 0.0 0 0.0% 0.0 798 0.8%Latina/Hispanic 9 12.5% 153.1 1 8.3% 17.0 0 0.0% 0.0 0 0.0% 0.0 5,878 6.2%White 53 73.6% 66.4 8 66.7% 10.0 0 0.0% 0.0 0 0.0% 0.0 79,815 84.6%Other/Multi/Not Specified 41 36.3% - 5 29.4% - 1 100.0% - 0 0.0% - 2,651 2.8%
California Local Health Jurisdiction STD Data Summaries, 2010 Provisional Data (July 2011)

1:100
Sierra County – Chlamydia, Gonorrhea, and P&S SyphilisRates by Age Group (2010), Race/Ethnicity (2010), and Year
0−9 10−14 15−19 20−24 25−29 30−34 35−44 45+
Age Group
0
200
400
600
800
1000 Chlamydia
Nat. Am. A/PI Black Latino White
Race/Ethnicity*
0
50
100
150
200
Chlamydia
2001 2002 2003 2004 2005 2006 2007 2008 2009 2010
0
50
100
150
200
250
Year
Chlamydia
0−9 10−14 15−19 20−24 25−29 30−34 35−44 45+
Age Group
0
1 Gonorrhea
Nat. Am. A/PI Black Latino White
Race/Ethnicity*
0
1 Gonorrhea
2001 2002 2003 2004 2005 2006 2007 2008 2009 2010
0
10
20
30
40
50
60
Year
Gonorrhea
0−9 10−14 15−19 20−24 25−29 30−34 35−44 45+
Age Group
0
1 P&S Syphilis
Nat. Am. A/PI Black Latino White
Race/Ethnicity*
0
1 P&S Syphilis
2001 2002 2003 2004 2005 2006 2007 2008 2009 2010
0
10
20
30
40
50
60
Year
P&S Syphilis
Female Male Female Male
* Race data may be missing for a substantial number of cases. See the 'Data Limitations' page for further information.Note: Rates are per 100,000 population.
Source: California Department of Public Health, STD Control Branch
California Local Health Jurisdiction STD Data Summaries, 2010 Provisional Data (July 2011)

1 Gender specific age groups and race/ethnicity percent calculations exclude "Not Specified" from the denominator. 2 Overall county rates were calculated using the July 1 county population estimates from the Department of Finance. (For Sierra County, the July 1, 2010 estimate is 3,304). Note: Rates are per 100,000 population. Source: California Department of Public Health, STD Control Branch
Sierra County – Chlamydia, Gonorrhea, and Early Syphilis Cases and Rates Tables for 2010
Gender & Age Group Chlamydia Gonorrhea P&S Syphilis Early Latent Syphilis Population
Cases Percent1 Rate Cases Percent1 Rate Cases Percent1 Rate Cases Percent1 Rate Number Percent1
COUNTY TOTAL 3 100.0% 90.8 0 100.0% 0.0 0 100.0% 0.0 0 100.0% 0.0 3,628 100.0%
Female Total 3 100.0% 166.5 0 0.0% 0.0 0 0.0% 0.0 0 0.0% 0.0 1,802 49.7% Ages 00 – 09 0 0.0% 0.0 0 0.0% 0.0 0 0.0% 0.0 0 0.0% 0.0 118 6.5% 10 – 14 0 0.0% 0.0 0 0.0% 0.0 0 0.0% 0.0 0 0.0% 0.0 70 3.9% 15 – 19 1 33.3% 877.2 0 0.0% 0.0 0 0.0% 0.0 0 0.0% 0.0 114 6.3% 20 – 24 1 33.3% 877.2 0 0.0% 0.0 0 0.0% 0.0 0 0.0% 0.0 114 6.3% 25 – 29 1 33.3% 714.3 0 0.0% 0.0 0 0.0% 0.0 0 0.0% 0.0 140 7.8% 30 – 34 0 0.0% 0.0 0 0.0% 0.0 0 0.0% 0.0 0 0.0% 0.0 52 2.9% 35 – 44 0 0.0% 0.0 0 0.0% 0.0 0 0.0% 0.0 0 0.0% 0.0 157 8.7% 45 + 0 0.0% 0.0 0 0.0% 0.0 0 0.0% 0.0 0 0.0% 0.0 1,037 57.5% Not Specified 0 0.0% - 0 0.0% - 0 0.0% - 0 0.0% -
Male Total 0 0.0% 0.0 0 0.0% 0.0 0 0.0% 0.0 0 0.0% 0.0 1,826 50.3% Ages 00 – 09 0 0.0% 0.0 0 0.0% 0.0 0 0.0% 0.0 0 0.0% 0.0 129 7.1% 10 – 14 0 0.0% 0.0 0 0.0% 0.0 0 0.0% 0.0 0 0.0% 0.0 77 4.2% 15 – 19 0 0.0% 0.0 0 0.0% 0.0 0 0.0% 0.0 0 0.0% 0.0 120 6.6% 20 – 24 0 0.0% 0.0 0 0.0% 0.0 0 0.0% 0.0 0 0.0% 0.0 178 9.7% 25 – 29 0 0.0% 0.0 0 0.0% 0.0 0 0.0% 0.0 0 0.0% 0.0 132 7.2% 30 – 34 0 0.0% 0.0 0 0.0% 0.0 0 0.0% 0.0 0 0.0% 0.0 54 3.0% 35 – 44 0 0.0% 0.0 0 0.0% 0.0 0 0.0% 0.0 0 0.0% 0.0 155 8.5% 45 + 0 0.0% 0.0 0 0.0% 0.0 0 0.0% 0.0 0 0.0% 0.0 981 53.7% Not Specified 0 0.0% - 0 0.0% - 0 0.0% - 0 0.0% -
Gender & Race/Ethnicity Chlamydia Gonorrhea P&S Syphilis Early Latent Syphilis Population
Cases Percent1 Rate Cases Percent1 Rate Cases Percent1 Rate Cases Percent1 Rate Number Percent1
COUNTY TOTAL 3 100.0% 90.8 0 100.0% 0.0 0 100.0% 0.0 0 100.0% 0.0 3,628 100.0%
Female Total 3 100.0% 166.5 0 0.0% 0.0 0 0.0% 0.0 0 0.0% 0.0 1,802 49.7%American Indian/Alaska Native 0 0.0% 0.0 0 0.0% 0.0 0 0.0% 0.0 0 0.0% 0.0 34 1.9%Asian/Pacific Islander 0 0.0% 0.0 0 0.0% 0.0 0 0.0% 0.0 0 0.0% 0.0 6 0.3%Black/African-American 0 0.0% 0.0 0 0.0% 0.0 0 0.0% 0.0 0 0.0% 0.0 4 0.2%Latina/Hispanic 0 0.0% 0.0 0 0.0% 0.0 0 0.0% 0.0 0 0.0% 0.0 119 6.6%White 3 100.0% 186.1 0 0.0% 0.0 0 0.0% 0.0 0 0.0% 0.0 1,612 89.5%Other/Multi/Not Specified 0 0.0% - 0 0.0% - 0 0.0% - 0 0.0% - 27 1.5%Male Total 0 0.0% 0.0 0 0.0% 0.0 0 0.0% 0.0 0 0.0% 0.0 1,826 50.3%American Indian/Alaska Native 0 0.0% 0.0 0 0.0% 0.0 0 0.0% 0.0 0 0.0% 0.0 28 1.5%Asian/Pacific Islander 0 0.0% 0.0 0 0.0% 0.0 0 0.0% 0.0 0 0.0% 0.0 3 0.2%Black/African-American 0 0.0% 0.0 0 0.0% 0.0 0 0.0% 0.0 0 0.0% 0.0 2 0.1%Latina/Hispanic 0 0.0% 0.0 0 0.0% 0.0 0 0.0% 0.0 0 0.0% 0.0 132 7.2%White 0 0.0% 0.0 0 0.0% 0.0 0 0.0% 0.0 0 0.0% 0.0 1,620 88.7%Other/Multi/Not Specified 0 0.0% - 0 0.0% - 0 0.0% - 0 0.0% - 41 2.2%
California Local Health Jurisdiction STD Data Summaries, 2010 Provisional Data (July 2011)

1:100
Siskiyou County – Chlamydia, Gonorrhea, and P&S SyphilisRates by Age Group (2010), Race/Ethnicity (2010), and Year
0−9 10−14 15−19 20−24 25−29 30−34 35−44 45+
Age Group
0
200
400
600
800
1000
1200
1400
Chlamydia
Nat. Am. A/PI Black Latino White
Race/Ethnicity*
0
200
400
600
800
1000
1200
1400 Chlamydia
2001 2002 2003 2004 2005 2006 2007 2008 2009 2010
0
100
200
300
400
Year
Chlamydia
0−9 10−14 15−19 20−24 25−29 30−34 35−44 45+
Age Group
0
20
40
60
80
100
120
Gonorrhea
Nat. Am. A/PI Black Latino White
Race/Ethnicity*
0
100
200
300
400
Gonorrhea
2001 2002 2003 2004 2005 2006 2007 2008 2009 2010
0
10
20
30
40
Year
Gonorrhea
0−9 10−14 15−19 20−24 25−29 30−34 35−44 45+
Age Group
0
1 P&S Syphilis
Nat. Am. A/PI Black Latino White
Race/Ethnicity*
0
1 P&S Syphilis
2001 2002 2003 2004 2005 2006 2007 2008 2009 2010
0
1
2
3
4
5
Year
P&S Syphilis
Female Male Female Male
* Race data may be missing for a substantial number of cases. See the 'Data Limitations' page for further information.Note: Rates are per 100,000 population.
Source: California Department of Public Health, STD Control Branch
California Local Health Jurisdiction STD Data Summaries, 2010 Provisional Data (July 2011)

1 Gender specific age groups and race/ethnicity percent calculations exclude "Not Specified" from the denominator. 2 Overall county rates were calculated using the July 1 county population estimates from the Department of Finance. (For Siskiyou County, the July 1, 2010 estimate is 46,101). Note: Rates are per 100,000 population. Source: California Department of Public Health, STD Control Branch
Siskiyou County – Chlamydia, Gonorrhea, and Early Syphilis Cases and Rates Tables for 2010
Gender & Age Group Chlamydia Gonorrhea P&S Syphilis Early Latent Syphilis Population
Cases Percent1 Rate Cases Percent1 Rate Cases Percent1 Rate Cases Percent1 Rate Number Percent1
COUNTY TOTAL 73 100.0% 158.3 6 100.0% 13.0 0 100.0% 0.0 0 100.0% 0.0 47,109 100.0%
Female Total 53 72.6% 220.6 3 50.0% 12.5 0 0.0% 0.0 0 0.0% 0.0 24,020 51.0% Ages 00 – 09 0 0.0% 0.0 0 0.0% 0.0 0 0.0% 0.0 0 0.0% 0.0 2,666 11.1% 10 – 14 1 1.9% 81.0 0 0.0% 0.0 0 0.0% 0.0 0 0.0% 0.0 1,234 5.1% 15 – 19 18 34.6% 1,201.6 1 33.3% 66.8 0 0.0% 0.0 0 0.0% 0.0 1,498 6.2% 20 – 24 22 42.3% 1,245.8 2 66.7% 113.3 0 0.0% 0.0 0 0.0% 0.0 1,766 7.4% 25 – 29 6 11.5% 356.9 0 0.0% 0.0 0 0.0% 0.0 0 0.0% 0.0 1,681 7.0% 30 – 34 1 1.9% 117.4 0 0.0% 0.0 0 0.0% 0.0 0 0.0% 0.0 852 3.5% 35 – 44 4 7.7% 203.7 0 0.0% 0.0 0 0.0% 0.0 0 0.0% 0.0 1,964 8.2% 45 + 0 0.0% 0.0 0 0.0% 0.0 0 0.0% 0.0 0 0.0% 0.0 12,359 51.5% Not Specified 1 1.9% - 0 0.0% - 0 0.0% - 0 0.0% -
Male Total 20 27.4% 86.6 3 50.0% 13.0 0 0.0% 0.0 0 0.0% 0.0 23,089 49.0% Ages 00 – 09 0 0.0% 0.0 0 0.0% 0.0 0 0.0% 0.0 0 0.0% 0.0 2,555 11.1% 10 – 14 0 0.0% 0.0 0 0.0% 0.0 0 0.0% 0.0 0 0.0% 0.0 1,328 5.8% 15 – 19 7 35.0% 453.1 0 0.0% 0.0 0 0.0% 0.0 0 0.0% 0.0 1,545 6.7% 20 – 24 6 30.0% 330.4 0 0.0% 0.0 0 0.0% 0.0 0 0.0% 0.0 1,816 7.9% 25 – 29 3 15.0% 163.3 1 33.3% 54.4 0 0.0% 0.0 0 0.0% 0.0 1,837 8.0% 30 – 34 1 5.0% 97.3 1 33.3% 97.3 0 0.0% 0.0 0 0.0% 0.0 1,028 4.5% 35 – 44 3 15.0% 149.2 1 33.3% 49.7 0 0.0% 0.0 0 0.0% 0.0 2,011 8.7% 45 + 0 0.0% 0.0 0 0.0% 0.0 0 0.0% 0.0 0 0.0% 0.0 10,969 47.5% Not Specified 0 0.0% - 0 0.0% - 0 0.0% - 0 0.0% -
Gender & Race/Ethnicity Chlamydia Gonorrhea P&S Syphilis Early Latent Syphilis Population
Cases Percent1 Rate Cases Percent1 Rate Cases Percent1 Rate Cases Percent1 Rate Number Percent1
COUNTY TOTAL 73 100.0% 158.3 6 100.0% 13.0 0 100.0% 0.0 0 100.0% 0.0 47,109 100.0%
Female Total 53 72.6% 220.6 3 50.0% 12.5 0 0.0% 0.0 0 0.0% 0.0 24,020 51.0%American Indian/Alaska Native 5 10.2% 517.1 0 0.0% 0.0 0 0.0% 0.0 0 0.0% 0.0 967 4.0%Asian/Pacific Islander 1 2.0% 261.1 0 0.0% 0.0 0 0.0% 0.0 0 0.0% 0.0 383 1.6%Black/African-American 2 4.1% 711.7 1 33.3% 355.9 0 0.0% 0.0 0 0.0% 0.0 281 1.2%Latina/Hispanic 5 10.2% 241.9 0 0.0% 0.0 0 0.0% 0.0 0 0.0% 0.0 2,067 8.6%White 36 73.5% 184.6 2 66.7% 10.3 0 0.0% 0.0 0 0.0% 0.0 19,500 81.2%Other/Multi/Not Specified 4 7.5% - 0 0.0% - 0 0.0% - 0 0.0% - 822 3.4%Male Total 20 27.4% 86.6 3 50.0% 13.0 0 0.0% 0.0 0 0.0% 0.0 23,089 49.0%American Indian/Alaska Native 2 10.5% 224.0 0 0.0% 0.0 0 0.0% 0.0 0 0.0% 0.0 893 3.9%Asian/Pacific Islander 1 5.3% 323.6 1 33.3% 323.6 0 0.0% 0.0 0 0.0% 0.0 309 1.3%Black/African-American 4 21.1% 1,173.0 0 0.0% 0.0 0 0.0% 0.0 0 0.0% 0.0 341 1.5%Latina/Hispanic 2 10.5% 89.0 0 0.0% 0.0 0 0.0% 0.0 0 0.0% 0.0 2,247 9.7%White 10 52.6% 54.1 2 66.7% 10.8 0 0.0% 0.0 0 0.0% 0.0 18,489 80.1%Other/Multi/Not Specified 1 5.0% - 0 0.0% - 0 0.0% - 0 0.0% - 810 3.5%
California Local Health Jurisdiction STD Data Summaries, 2010 Provisional Data (July 2011)

1:100
Solano County – Chlamydia, Gonorrhea, and P&S SyphilisRates by Age Group (2010), Race/Ethnicity (2010), and Year
0−9 10−14 15−19 20−24 25−29 30−34 35−44 45+
Age Group
0
1000
2000
3000
4000
Chlamydia
Nat. Am. A/PI Black Latino White
Race/Ethnicity*
0
200
400
600
800
1000
1200 Chlamydia
2001 2002 2003 2004 2005 2006 2007 2008 2009 2010
0
200
400
600
800
Year
Chlamydia
0−9 10−14 15−19 20−24 25−29 30−34 35−44 45+
Age Group
0
200
400
600
800 Gonorrhea
Nat. Am. A/PI Black Latino White
Race/Ethnicity*
0
50
100
150
200
250
300
Gonorrhea
2001 2002 2003 2004 2005 2006 2007 2008 2009 2010
0
20
40
60
80
100
120
140
Year
Gonorrhea
0−9 10−14 15−19 20−24 25−29 30−34 35−44 45+
Age Group
0
2
4
6
8
10
12
14 P&S Syphilis
Nat. Am. A/PI Black Latino White
Race/Ethnicity*
0
1
2
3
4
P&S Syphilis
2001 2002 2003 2004 2005 2006 2007 2008 2009 2010
0
2
4
6
8
Year
P&S Syphilis
Female Male Female Male
* Race data may be missing for a substantial number of cases. See the 'Data Limitations' page for further information.Note: Rates are per 100,000 population.
Source: California Department of Public Health, STD Control Branch
California Local Health Jurisdiction STD Data Summaries, 2010 Provisional Data (July 2011)

1 Gender specific age groups and race/ethnicity percent calculations exclude "Not Specified" from the denominator. 2 Overall county rates were calculated using the July 1 county population estimates from the Department of Finance. (For Solano County, the July 1, 2010 estimate is 429,334). Note: Rates are per 100,000 population. Source: California Department of Public Health, STD Control Branch
Solano County – Chlamydia, Gonorrhea, and Early Syphilis Cases and Rates Tables for 2010
Gender & Age Group Chlamydia Gonorrhea P&S Syphilis Early Latent Syphilis Population
Cases Percent1 Rate Cases Percent1 Rate Cases Percent1 Rate Cases Percent1 Rate Number Percent1
COUNTY TOTAL 2,071 100.0% 482.4 436 100.0% 101.6 5 100.0% 1.2 8 100.0% 1.9 441,061 100.0%
Female Total 1,504 72.6% 687.0 250 57.3% 114.2 0 0.0% 0.0 2 25.0% 0.9 218,910 49.6% Ages 00 – 09 0 0.0% 0.0 0 0.0% 0.0 0 0.0% 0.0 0 0.0% 0.0 29,103 13.3% 10 – 14 21 1.4% 142.4 4 1.6% 27.1 0 0.0% 0.0 0 0.0% 0.0 14,749 6.7% 15 – 19 594 39.5% 3,640.4 109 43.6% 668.0 0 0.0% 0.0 1 50.0% 6.1 16,317 7.5% 20 – 24 586 39.0% 3,550.4 71 28.4% 430.2 0 0.0% 0.0 1 50.0% 6.1 16,505 7.5% 25 – 29 165 11.0% 1,104.8 33 13.2% 221.0 0 0.0% 0.0 0 0.0% 0.0 14,935 6.8% 30 – 34 75 5.0% 595.6 14 5.6% 111.2 0 0.0% 0.0 0 0.0% 0.0 12,593 5.8% 35 – 44 48 3.2% 173.1 13 5.2% 46.9 0 0.0% 0.0 0 0.0% 0.0 27,730 12.7% 45 + 15 1.0% 17.2 6 2.4% 6.9 0 0.0% 0.0 0 0.0% 0.0 86,978 39.7% Not Specified 0 0.0% - 0 0.0% - 0 0.0% - 0 0.0% -
Male Total 567 27.4% 255.2 186 42.7% 83.7 5 100.0% 2.3 6 75.0% 2.7 222,151 50.4% Ages 00 – 09 0 0.0% 0.0 0 0.0% 0.0 0 0.0% 0.0 0 0.0% 0.0 30,287 13.6% 10 – 14 0 0.0% 0.0 0 0.0% 0.0 0 0.0% 0.0 0 0.0% 0.0 14,884 6.7% 15 – 19 129 22.8% 767.8 51 27.4% 303.6 1 20.0% 6.0 0 0.0% 0.0 16,801 7.6% 20 – 24 217 38.3% 1,243.5 48 25.8% 275.1 1 20.0% 5.7 1 16.7% 5.7 17,451 7.9% 25 – 29 101 17.8% 615.6 31 16.7% 188.9 2 40.0% 12.2 1 16.7% 6.1 16,407 7.4% 30 – 34 47 8.3% 314.5 17 9.1% 113.8 0 0.0% 0.0 1 16.7% 6.7 14,944 6.7% 35 – 44 39 6.9% 128.9 23 12.4% 76.0 1 20.0% 3.3 2 33.3% 6.6 30,250 13.6% 45 + 34 6.0% 41.9 16 8.6% 19.7 0 0.0% 0.0 1 16.7% 1.2 81,127 36.5% Not Specified 0 0.0% - 0 0.0% - 0 0.0% - 0 0.0% -
Gender & Race/Ethnicity Chlamydia Gonorrhea P&S Syphilis Early Latent Syphilis Population
Cases Percent1 Rate Cases Percent1 Rate Cases Percent1 Rate Cases Percent1 Rate Number Percent1
COUNTY TOTAL 2,071 100.0% 482.4 436 100.0% 101.6 5 100.0% 1.2 8 100.0% 1.9 441,061 100.0%
Female Total 1,504 72.6% 687.0 250 57.3% 114.2 0 0.0% 0.0 2 25.0% 0.9 218,910 49.6%American Indian/Alaska Native 8 1.2% 549.5 2 1.8% 137.4 0 0.0% 0.0 0 0.0% 0.0 1,456 0.7%Asian/Pacific Islander 82 12.5% 217.8 6 5.5% 15.9 0 0.0% 0.0 0 0.0% 0.0 37,642 17.2%Black/African-American 259 39.4% 1,022.7 68 61.8% 268.5 0 0.0% 0.0 1 50.0% 3.9 25,326 11.6%Latina/Hispanic 112 17.0% 247.1 9 8.2% 19.9 0 0.0% 0.0 0 0.0% 0.0 45,324 20.7%White 196 29.8% 198.7 25 22.7% 25.3 0 0.0% 0.0 1 50.0% 1.0 98,653 45.1%Other/Multi/Not Specified 847 56.3% - 140 56.0% - 0 0.0% - 0 0.0% - 10,509 4.8%Male Total 567 27.4% 255.2 186 42.7% 83.7 5 100.0% 2.3 6 75.0% 2.7 222,151 50.4%American Indian/Alaska Native 1 0.4% 63.6 1 1.2% 63.6 0 0.0% 0.0 0 0.0% 0.0 1,573 0.7%Asian/Pacific Islander 27 10.7% 80.3 3 3.6% 8.9 1 25.0% 3.0 0 0.0% 0.0 33,618 15.1%Black/African-American 127 50.2% 489.2 53 63.1% 204.1 1 25.0% 3.9 3 50.0% 11.6 25,963 11.7%Latina/Hispanic 47 18.6% 92.3 11 13.1% 21.6 2 50.0% 3.9 2 33.3% 3.9 50,904 22.9%White 51 20.2% 51.1 16 19.0% 16.0 0 0.0% 0.0 1 16.7% 1.0 99,859 45.0%Other/Multi/Not Specified 314 55.4% - 102 54.8% - 1 20.0% - 0 0.0% - 10,234 4.6%
California Local Health Jurisdiction STD Data Summaries, 2010 Provisional Data (July 2011)

1:100
Sonoma County – Chlamydia, Gonorrhea, and P&S SyphilisRates by Age Group (2010), Race/Ethnicity (2010), and Year
0−9 10−14 15−19 20−24 25−29 30−34 35−44 45+
Age Group
0
500
1000
1500
2000
Chlamydia
Nat. Am. A/PI Black Latino White
Race/Ethnicity*
0
50
100
150
200
250
300
350
Chlamydia
2001 2002 2003 2004 2005 2006 2007 2008 2009 2010
0
100
200
300
400
Year
Chlamydia
0−9 10−14 15−19 20−24 25−29 30−34 35−44 45+
Age Group
0
20
40
60
80
Gonorrhea
Nat. Am. A/PI Black Latino White
Race/Ethnicity*
0
50
100
150
200 Gonorrhea
2001 2002 2003 2004 2005 2006 2007 2008 2009 2010
0
10
20
30
40
Year
Gonorrhea
0−9 10−14 15−19 20−24 25−29 30−34 35−44 45+
Age Group
0
5
10
15
P&S Syphilis
Nat. Am. A/PI Black Latino White
Race/Ethnicity*
0
10
20
30
40
P&S Syphilis
2001 2002 2003 2004 2005 2006 2007 2008 2009 2010
0
2
4
6
8
Year
P&S Syphilis
Female Male Female Male
* Race data may be missing for a substantial number of cases. See the 'Data Limitations' page for further information.Note: Rates are per 100,000 population.
Source: California Department of Public Health, STD Control Branch
California Local Health Jurisdiction STD Data Summaries, 2010 Provisional Data (July 2011)

1 Gender specific age groups and race/ethnicity percent calculations exclude "Not Specified" from the denominator. 2 Overall county rates were calculated using the July 1 county population estimates from the Department of Finance. (For Sonoma County, the July 1, 2010 estimate is 494,675). Note: Rates are per 100,000 population. Source: California Department of Public Health, STD Control Branch
Sonoma County – Chlamydia, Gonorrhea, and Early Syphilis Cases and Rates Tables for 2010
Gender & Age Group Chlamydia Gonorrhea P&S Syphilis Early Latent Syphilis Population
Cases Percent1 Rate Cases Percent1 Rate Cases Percent1 Rate Cases Percent1 Rate Number Percent1
COUNTY TOTAL 1,180 100.0% 238.5 97 100.0% 19.6 12 100.0% 2.4 2 100.0% 0.4 495,412 100.0%
Female Total 831 70.4% 332.2 40 41.2% 16.0 0 0.0% 0.0 0 0.0% 0.0 250,187 50.5% Ages 00 – 09 0 0.0% 0.0 0 0.0% 0.0 0 0.0% 0.0 0 0.0% 0.0 32,688 13.1% 10 – 14 8 1.0% 49.6 1 2.5% 6.2 0 0.0% 0.0 0 0.0% 0.0 16,133 6.4% 15 – 19 240 28.9% 1,400.7 7 17.5% 40.9 0 0.0% 0.0 0 0.0% 0.0 17,134 6.8% 20 – 24 342 41.2% 1,917.9 14 35.0% 78.5 0 0.0% 0.0 0 0.0% 0.0 17,832 7.1% 25 – 29 133 16.0% 761.1 7 17.5% 40.1 0 0.0% 0.0 0 0.0% 0.0 17,474 7.0% 30 – 34 58 7.0% 414.5 4 10.0% 28.6 0 0.0% 0.0 0 0.0% 0.0 13,994 5.6% 35 – 44 39 4.7% 148.2 2 5.0% 7.6 0 0.0% 0.0 0 0.0% 0.0 26,318 10.5% 45 + 11 1.3% 10.1 5 12.5% 4.6 0 0.0% 0.0 0 0.0% 0.0 108,614 43.4% Not Specified 0 0.0% - 0 0.0% - 0 0.0% - 0 0.0% -
Male Total 348 29.5% 141.9 57 58.8% 23.2 12 100.0% 4.9 2 100.0% 0.8 245,225 49.5% Ages 00 – 09 0 0.0% 0.0 0 0.0% 0.0 0 0.0% 0.0 0 0.0% 0.0 33,782 13.8% 10 – 14 2 0.6% 12.2 0 0.0% 0.0 0 0.0% 0.0 0 0.0% 0.0 16,329 6.7% 15 – 19 45 12.9% 257.3 2 3.5% 11.4 0 0.0% 0.0 0 0.0% 0.0 17,490 7.1% 20 – 24 140 40.2% 746.5 8 14.0% 42.7 0 0.0% 0.0 0 0.0% 0.0 18,753 7.6% 25 – 29 71 20.4% 372.2 14 24.6% 73.4 3 25.0% 15.7 0 0.0% 0.0 19,078 7.8% 30 – 34 37 10.6% 239.4 9 15.8% 58.2 1 8.3% 6.5 1 50.0% 6.5 15,456 6.3% 35 – 44 33 9.5% 117.4 9 15.8% 32.0 3 25.0% 10.7 0 0.0% 0.0 28,115 11.5% 45 + 20 5.7% 20.8 15 26.3% 15.6 5 41.7% 5.2 1 50.0% 1.0 96,222 39.2% Not Specified 0 0.0% - 0 0.0% - 0 0.0% - 0 0.0% -
Gender & Race/Ethnicity Chlamydia Gonorrhea P&S Syphilis Early Latent Syphilis Population
Cases Percent1 Rate Cases Percent1 Rate Cases Percent1 Rate Cases Percent1 Rate Number Percent1
COUNTY TOTAL 1,180 100.0% 238.5 97 100.0% 19.6 12 100.0% 2.4 2 100.0% 0.4 495,412 100.0%
Female Total 831 70.4% 332.2 40 41.2% 16.0 0 0.0% 0.0 0 0.0% 0.0 250,187 50.5%American Indian/Alaska Native 3 0.8% 118.4 0 0.0% 0.0 0 0.0% 0.0 0 0.0% 0.0 2,534 1.0%Asian/Pacific Islander 16 4.5% 123.4 1 5.6% 7.7 0 0.0% 0.0 0 0.0% 0.0 12,964 5.2%Black/African-American 11 3.1% 314.7 6 33.3% 171.7 0 0.0% 0.0 0 0.0% 0.0 3,495 1.4%Latina/Hispanic 163 45.7% 281.6 2 11.1% 3.5 0 0.0% 0.0 0 0.0% 0.0 57,881 23.1%White 164 45.9% 97.9 9 50.0% 5.4 0 0.0% 0.0 0 0.0% 0.0 167,532 67.0%Other/Multi/Not Specified 474 57.0% - 22 55.0% - 0 0.0% - 0 0.0% - 5,781 2.3%Male Total 348 29.5% 141.9 57 58.8% 23.2 12 100.0% 4.9 2 100.0% 0.8 245,225 49.5%American Indian/Alaska Native 1 0.6% 41.3 0 0.0% 0.0 1 8.3% 41.3 0 0.0% 0.0 2,419 1.0%Asian/Pacific Islander 3 1.7% 26.4 0 0.0% 0.0 1 8.3% 8.8 0 0.0% 0.0 11,361 4.6%Black/African-American 7 4.0% 159.0 3 9.7% 68.2 0 0.0% 0.0 0 0.0% 0.0 4,402 1.8%Latina/Hispanic 77 43.5% 123.5 11 35.5% 17.6 1 8.3% 1.6 1 50.0% 1.6 62,360 25.4%White 89 50.3% 55.9 17 54.8% 10.7 9 75.0% 5.7 1 50.0% 0.6 159,191 64.9%Other/Multi/Not Specified 171 49.1% - 26 45.6% - 0 0.0% - 0 0.0% - 5,492 2.2%
California Local Health Jurisdiction STD Data Summaries, 2010 Provisional Data (July 2011)

1:100
Stanislaus County – Chlamydia, Gonorrhea, and P&S SyphilisRates by Age Group (2010), Race/Ethnicity (2010), and Year
0−9 10−14 15−19 20−24 25−29 30−34 35−44 45+
Age Group
0
500
1000
1500
2000
2500
Chlamydia
Nat. Am. A/PI Black Latino White
Race/Ethnicity*
0
200
400
600
800
Chlamydia
2001 2002 2003 2004 2005 2006 2007 2008 2009 2010
0
100
200
300
400
500
600
700
Year
Chlamydia
0−9 10−14 15−19 20−24 25−29 30−34 35−44 45+
Age Group
0
20
40
60
80
100
120
140
Gonorrhea
Nat. Am. A/PI Black Latino White
Race/Ethnicity*
0
50
100
150
200
Gonorrhea
2001 2002 2003 2004 2005 2006 2007 2008 2009 2010
0
50
100
150
Year
Gonorrhea
0−9 10−14 15−19 20−24 25−29 30−34 35−44 45+
Age Group
0
5
10
15
20
25
30
P&S Syphilis
Nat. Am. A/PI Black Latino White
Race/Ethnicity*
0
5
10
15
P&S Syphilis
2001 2002 2003 2004 2005 2006 2007 2008 2009 2010
0
2
4
6
8
10
Year
P&S Syphilis
Female Male Female Male
* Race data may be missing for a substantial number of cases. See the 'Data Limitations' page for further information.Note: Rates are per 100,000 population.
Source: California Department of Public Health, STD Control Branch
California Local Health Jurisdiction STD Data Summaries, 2010 Provisional Data (July 2011)
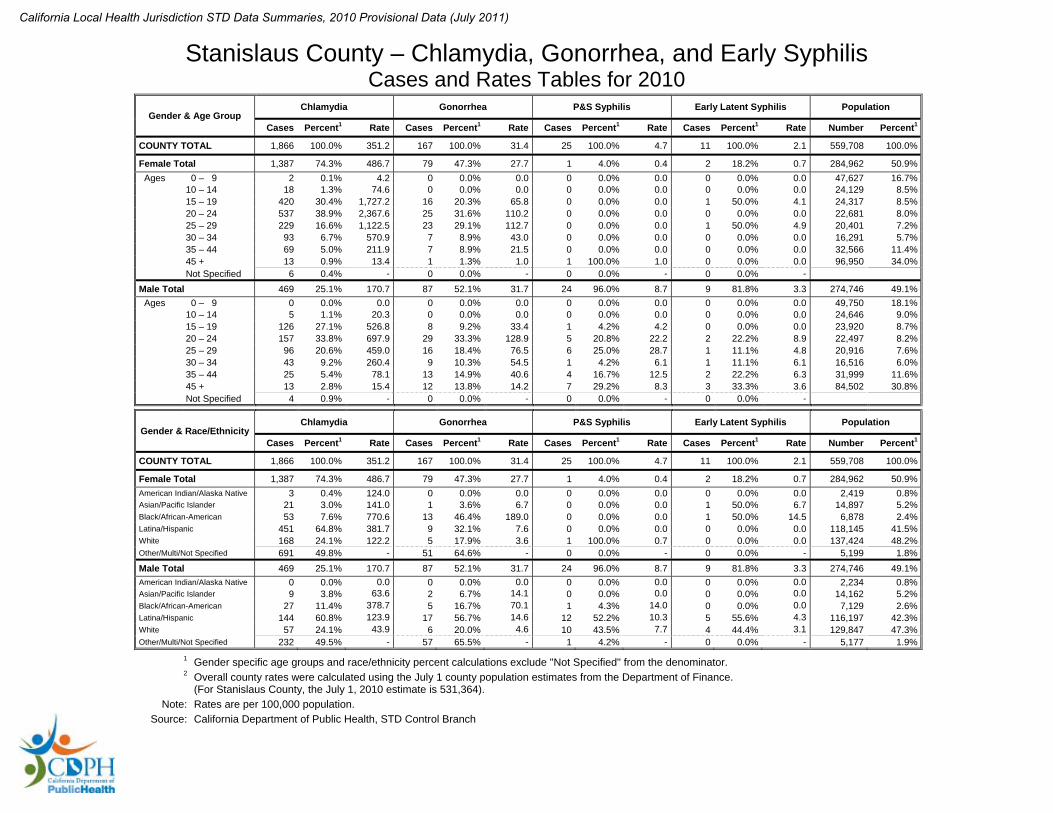
1 Gender specific age groups and race/ethnicity percent calculations exclude "Not Specified" from the denominator. 2 Overall county rates were calculated using the July 1 county population estimates from the Department of Finance. (For Stanislaus County, the July 1, 2010 estimate is 531,364). Note: Rates are per 100,000 population. Source: California Department of Public Health, STD Control Branch
Stanislaus County – Chlamydia, Gonorrhea, and Early Syphilis Cases and Rates Tables for 2010
Gender & Age Group Chlamydia Gonorrhea P&S Syphilis Early Latent Syphilis Population
Cases Percent1 Rate Cases Percent1 Rate Cases Percent1 Rate Cases Percent1 Rate Number Percent1
COUNTY TOTAL 1,866 100.0% 351.2 167 100.0% 31.4 25 100.0% 4.7 11 100.0% 2.1 559,708 100.0%
Female Total 1,387 74.3% 486.7 79 47.3% 27.7 1 4.0% 0.4 2 18.2% 0.7 284,962 50.9% Ages 00 – 09 2 0.1% 4.2 0 0.0% 0.0 0 0.0% 0.0 0 0.0% 0.0 47,627 16.7% 10 – 14 18 1.3% 74.6 0 0.0% 0.0 0 0.0% 0.0 0 0.0% 0.0 24,129 8.5% 15 – 19 420 30.4% 1,727.2 16 20.3% 65.8 0 0.0% 0.0 1 50.0% 4.1 24,317 8.5% 20 – 24 537 38.9% 2,367.6 25 31.6% 110.2 0 0.0% 0.0 0 0.0% 0.0 22,681 8.0% 25 – 29 229 16.6% 1,122.5 23 29.1% 112.7 0 0.0% 0.0 1 50.0% 4.9 20,401 7.2% 30 – 34 93 6.7% 570.9 7 8.9% 43.0 0 0.0% 0.0 0 0.0% 0.0 16,291 5.7% 35 – 44 69 5.0% 211.9 7 8.9% 21.5 0 0.0% 0.0 0 0.0% 0.0 32,566 11.4% 45 + 13 0.9% 13.4 1 1.3% 1.0 1 100.0% 1.0 0 0.0% 0.0 96,950 34.0% Not Specified 6 0.4% - 0 0.0% - 0 0.0% - 0 0.0% -
Male Total 469 25.1% 170.7 87 52.1% 31.7 24 96.0% 8.7 9 81.8% 3.3 274,746 49.1% Ages 00 – 09 0 0.0% 0.0 0 0.0% 0.0 0 0.0% 0.0 0 0.0% 0.0 49,750 18.1% 10 – 14 5 1.1% 20.3 0 0.0% 0.0 0 0.0% 0.0 0 0.0% 0.0 24,646 9.0% 15 – 19 126 27.1% 526.8 8 9.2% 33.4 1 4.2% 4.2 0 0.0% 0.0 23,920 8.7% 20 – 24 157 33.8% 697.9 29 33.3% 128.9 5 20.8% 22.2 2 22.2% 8.9 22,497 8.2% 25 – 29 96 20.6% 459.0 16 18.4% 76.5 6 25.0% 28.7 1 11.1% 4.8 20,916 7.6% 30 – 34 43 9.2% 260.4 9 10.3% 54.5 1 4.2% 6.1 1 11.1% 6.1 16,516 6.0% 35 – 44 25 5.4% 78.1 13 14.9% 40.6 4 16.7% 12.5 2 22.2% 6.3 31,999 11.6% 45 + 13 2.8% 15.4 12 13.8% 14.2 7 29.2% 8.3 3 33.3% 3.6 84,502 30.8% Not Specified 4 0.9% - 0 0.0% - 0 0.0% - 0 0.0% -
Gender & Race/Ethnicity Chlamydia Gonorrhea P&S Syphilis Early Latent Syphilis Population
Cases Percent1 Rate Cases Percent1 Rate Cases Percent1 Rate Cases Percent1 Rate Number Percent1
COUNTY TOTAL 1,866 100.0% 351.2 167 100.0% 31.4 25 100.0% 4.7 11 100.0% 2.1 559,708 100.0%
Female Total 1,387 74.3% 486.7 79 47.3% 27.7 1 4.0% 0.4 2 18.2% 0.7 284,962 50.9%American Indian/Alaska Native 3 0.4% 124.0 0 0.0% 0.0 0 0.0% 0.0 0 0.0% 0.0 2,419 0.8%Asian/Pacific Islander 21 3.0% 141.0 1 3.6% 6.7 0 0.0% 0.0 1 50.0% 6.7 14,897 5.2%Black/African-American 53 7.6% 770.6 13 46.4% 189.0 0 0.0% 0.0 1 50.0% 14.5 6,878 2.4%Latina/Hispanic 451 64.8% 381.7 9 32.1% 7.6 0 0.0% 0.0 0 0.0% 0.0 118,145 41.5%White 168 24.1% 122.2 5 17.9% 3.6 1 100.0% 0.7 0 0.0% 0.0 137,424 48.2%Other/Multi/Not Specified 691 49.8% - 51 64.6% - 0 0.0% - 0 0.0% - 5,199 1.8%Male Total 469 25.1% 170.7 87 52.1% 31.7 24 96.0% 8.7 9 81.8% 3.3 274,746 49.1%American Indian/Alaska Native 0 0.0% 0.0 0 0.0% 0.0 0 0.0% 0.0 0 0.0% 0.0 2,234 0.8%Asian/Pacific Islander 9 3.8% 63.6 2 6.7% 14.1 0 0.0% 0.0 0 0.0% 0.0 14,162 5.2%Black/African-American 27 11.4% 378.7 5 16.7% 70.1 1 4.3% 14.0 0 0.0% 0.0 7,129 2.6%Latina/Hispanic 144 60.8% 123.9 17 56.7% 14.6 12 52.2% 10.3 5 55.6% 4.3 116,197 42.3%White 57 24.1% 43.9 6 20.0% 4.6 10 43.5% 7.7 4 44.4% 3.1 129,847 47.3%Other/Multi/Not Specified 232 49.5% - 57 65.5% - 1 4.2% - 0 0.0% - 5,177 1.9%
California Local Health Jurisdiction STD Data Summaries, 2010 Provisional Data (July 2011)

1:100
Sutter County – Chlamydia, Gonorrhea, and P&S SyphilisRates by Age Group (2010), Race/Ethnicity (2010), and Year
0−9 10−14 15−19 20−24 25−29 30−34 35−44 45+
Age Group
0
500
1000
1500
2000 Chlamydia
Nat. Am. A/PI Black Latino White
Race/Ethnicity*
0
200
400
600
800
1000
Chlamydia
2001 2002 2003 2004 2005 2006 2007 2008 2009 2010
0
100
200
300
400
Year
Chlamydia
0−9 10−14 15−19 20−24 25−29 30−34 35−44 45+
Age Group
0
50
100
150
200
250
300
Gonorrhea
Nat. Am. A/PI Black Latino White
Race/Ethnicity*
0
50
100
150
200
250
Gonorrhea
2001 2002 2003 2004 2005 2006 2007 2008 2009 2010
0
20
40
60
80
100
Year
Gonorrhea
0−9 10−14 15−19 20−24 25−29 30−34 35−44 45+
Age Group
0
10
20
30
40
50
60
P&S Syphilis
Nat. Am. A/PI Black Latino White
Race/Ethnicity*
0
50
100
150
200
250
300 P&S Syphilis
2001 2002 2003 2004 2005 2006 2007 2008 2009 2010
0
1
2
3
4
Year
P&S Syphilis
Female Male Female Male
* Race data may be missing for a substantial number of cases. See the 'Data Limitations' page for further information.Note: Rates are per 100,000 population.
Source: California Department of Public Health, STD Control Branch
California Local Health Jurisdiction STD Data Summaries, 2010 Provisional Data (July 2011)

1 Gender specific age groups and race/ethnicity percent calculations exclude "Not Specified" from the denominator. 2 Overall county rates were calculated using the July 1 county population estimates from the Department of Finance. (For Sutter County, the July 1, 2010 estimate is 98,013). Note: Rates are per 100,000 population. Source: California Department of Public Health, STD Control Branch
Sutter County – Chlamydia, Gonorrhea, and Early Syphilis Cases and Rates Tables for 2010
Gender & Age Group Chlamydia Gonorrhea P&S Syphilis Early Latent Syphilis Population
Cases Percent1 Rate Cases Percent1 Rate Cases Percent1 Rate Cases Percent1 Rate Number Percent1
COUNTY TOTAL 238 100.0% 242.8 30 100.0% 30.6 2 100.0% 2.0 0 100.0% 0.0 102,326 100.0%
Female Total 177 74.4% 341.7 18 60.0% 34.7 2 100.0% 3.9 0 0.0% 0.0 51,801 50.6% Ages 00 – 09 0 0.0% 0.0 0 0.0% 0.0 0 0.0% 0.0 0 0.0% 0.0 8,487 16.4% 10 – 14 1 0.6% 24.0 0 0.0% 0.0 0 0.0% 0.0 0 0.0% 0.0 4,161 8.0% 15 – 19 57 32.2% 1,387.5 4 22.2% 97.4 0 0.0% 0.0 0 0.0% 0.0 4,108 7.9% 20 – 24 67 37.9% 1,771.5 11 61.1% 290.9 0 0.0% 0.0 0 0.0% 0.0 3,782 7.3% 25 – 29 35 19.8% 989.0 0 0.0% 0.0 2 100.0% 56.5 0 0.0% 0.0 3,539 6.8% 30 – 34 10 5.6% 384.0 2 11.1% 76.8 0 0.0% 0.0 0 0.0% 0.0 2,604 5.0% 35 – 44 6 3.4% 102.1 0 0.0% 0.0 0 0.0% 0.0 0 0.0% 0.0 5,875 11.3% 45 + 1 0.6% 5.2 1 5.6% 5.2 0 0.0% 0.0 0 0.0% 0.0 19,245 37.2% Not Specified 0 0.0% - 0 0.0% - 0 0.0% - 0 0.0% -
Male Total 61 25.6% 120.7 12 40.0% 23.8 0 0.0% 0.0 0 0.0% 0.0 50,525 49.4% Ages 00 – 09 0 0.0% 0.0 0 0.0% 0.0 0 0.0% 0.0 0 0.0% 0.0 8,780 17.4% 10 – 14 0 0.0% 0.0 0 0.0% 0.0 0 0.0% 0.0 0 0.0% 0.0 4,109 8.1% 15 – 19 17 27.9% 408.2 2 16.7% 48.0 0 0.0% 0.0 0 0.0% 0.0 4,165 8.2% 20 – 24 29 47.5% 715.2 3 25.0% 74.0 0 0.0% 0.0 0 0.0% 0.0 4,055 8.0% 25 – 29 9 14.8% 251.0 3 25.0% 83.7 0 0.0% 0.0 0 0.0% 0.0 3,586 7.1% 30 – 34 5 8.2% 176.9 2 16.7% 70.7 0 0.0% 0.0 0 0.0% 0.0 2,827 5.6% 35 – 44 1 1.6% 16.8 1 8.3% 16.8 0 0.0% 0.0 0 0.0% 0.0 5,953 11.8% 45 + 0 0.0% 0.0 1 8.3% 5.9 0 0.0% 0.0 0 0.0% 0.0 17,050 33.7% Not Specified 0 0.0% - 0 0.0% - 0 0.0% - 0 0.0% -
Gender & Race/Ethnicity Chlamydia Gonorrhea P&S Syphilis Early Latent Syphilis Population
Cases Percent1 Rate Cases Percent1 Rate Cases Percent1 Rate Cases Percent1 Rate Number Percent1
COUNTY TOTAL 238 100.0% 242.8 30 100.0% 30.6 2 100.0% 2.0 0 100.0% 0.0 102,326 100.0%
Female Total 177 74.4% 341.7 18 60.0% 34.7 2 100.0% 3.9 0 0.0% 0.0 51,801 50.6%American Indian/Alaska Native 3 1.8% 550.5 0 0.0% 0.0 0 0.0% 0.0 0 0.0% 0.0 545 1.1%Asian/Pacific Islander 1 0.6% 15.1 0 0.0% 0.0 0 0.0% 0.0 0 0.0% 0.0 6,610 12.8%Black/African-American 6 3.5% 777.2 0 0.0% 0.0 2 100.0% 259.1 0 0.0% 0.0 772 1.5%Latina/Hispanic 76 44.4% 478.6 9 52.9% 56.7 0 0.0% 0.0 0 0.0% 0.0 15,880 30.7%White 85 49.7% 313.1 8 47.1% 29.5 0 0.0% 0.0 0 0.0% 0.0 27,148 52.4%Other/Multi/Not Specified 6 3.4% - 1 5.6% - 0 0.0% - 0 0.0% - 846 1.6%Male Total 61 25.6% 120.7 12 40.0% 23.8 0 0.0% 0.0 0 0.0% 0.0 50,525 49.4%American Indian/Alaska Native 0 0.0% 0.0 0 0.0% 0.0 0 0.0% 0.0 0 0.0% 0.0 479 0.9%Asian/Pacific Islander 0 0.0% 0.0 0 0.0% 0.0 0 0.0% 0.0 0 0.0% 0.0 6,599 13.1%Black/African-American 8 13.3% 987.7 2 16.7% 246.9 0 0.0% 0.0 0 0.0% 0.0 810 1.6%Latina/Hispanic 30 50.0% 189.8 4 33.3% 25.3 0 0.0% 0.0 0 0.0% 0.0 15,803 31.3%White 22 36.7% 84.7 6 50.0% 23.1 0 0.0% 0.0 0 0.0% 0.0 25,969 51.4%Other/Multi/Not Specified 1 1.6% - 0 0.0% - 0 0.0% - 0 0.0% - 865 1.7%
California Local Health Jurisdiction STD Data Summaries, 2010 Provisional Data (July 2011)

1:100
Tehama County – Chlamydia, Gonorrhea, and P&S SyphilisRates by Age Group (2010), Race/Ethnicity (2010), and Year
0−9 10−14 15−19 20−24 25−29 30−34 35−44 45+
Age Group
0
500
1000
1500
2000
Chlamydia
Nat. Am. A/PI Black Latino White
Race/Ethnicity*
0
200
400
600
800 Chlamydia
2001 2002 2003 2004 2005 2006 2007 2008 2009 2010
0
100
200
300
400
Year
Chlamydia
0−9 10−14 15−19 20−24 25−29 30−34 35−44 45+
Age Group
0
10
20
30
40
Gonorrhea
Nat. Am. A/PI Black Latino White
Race/Ethnicity*
0
5
10
15
Gonorrhea
2001 2002 2003 2004 2005 2006 2007 2008 2009 2010
0
20
40
60
Year
Gonorrhea
0−9 10−14 15−19 20−24 25−29 30−34 35−44 45+
Age Group
0
1 P&S Syphilis
Nat. Am. A/PI Black Latino White
Race/Ethnicity*
0
1 P&S Syphilis
2001 2002 2003 2004 2005 2006 2007 2008 2009 2010
0
1
2
3
4
Year
P&S Syphilis
Female Male Female Male
* Race data may be missing for a substantial number of cases. See the 'Data Limitations' page for further information.Note: Rates are per 100,000 population.
Source: California Department of Public Health, STD Control Branch
California Local Health Jurisdiction STD Data Summaries, 2010 Provisional Data (July 2011)

1 Gender specific age groups and race/ethnicity percent calculations exclude "Not Specified" from the denominator. 2 Overall county rates were calculated using the July 1 county population estimates from the Department of Finance. (For Tehama County, the July 1, 2010 estimate is 63,475). Note: Rates are per 100,000 population. Source: California Department of Public Health, STD Control Branch
Tehama County – Chlamydia, Gonorrhea, and Early Syphilis Cases and Rates Tables for 2010
Gender & Age Group Chlamydia Gonorrhea P&S Syphilis Early Latent Syphilis Population
Cases Percent1 Rate Cases Percent1 Rate Cases Percent1 Rate Cases Percent1 Rate Number Percent1
COUNTY TOTAL 167 100.0% 263.1 3 100.0% 4.7 0 100.0% 0.0 0 100.0% 0.0 65,593 100.0%
Female Total 125 74.9% 378.4 2 66.7% 6.1 0 0.0% 0.0 0 0.0% 0.0 33,036 50.4% Ages 00 – 09 0 0.0% 0.0 0 0.0% 0.0 0 0.0% 0.0 0 0.0% 0.0 4,068 12.3% 10 – 14 1 0.8% 51.1 0 0.0% 0.0 0 0.0% 0.0 0 0.0% 0.0 1,956 5.9% 15 – 19 42 33.6% 1,705.9 0 0.0% 0.0 0 0.0% 0.0 0 0.0% 0.0 2,462 7.5% 20 – 24 49 39.2% 1,861.0 1 50.0% 38.0 0 0.0% 0.0 0 0.0% 0.0 2,633 8.0% 25 – 29 20 16.0% 797.1 0 0.0% 0.0 0 0.0% 0.0 0 0.0% 0.0 2,509 7.6% 30 – 34 7 5.6% 416.7 0 0.0% 0.0 0 0.0% 0.0 0 0.0% 0.0 1,680 5.1% 35 – 44 5 4.0% 140.7 0 0.0% 0.0 0 0.0% 0.0 0 0.0% 0.0 3,553 10.8% 45 + 1 0.8% 7.1 1 50.0% 7.1 0 0.0% 0.0 0 0.0% 0.0 14,175 42.9% Not Specified 0 0.0% - 0 0.0% - 0 0.0% - 0 0.0% -
Male Total 42 25.1% 129.0 1 33.3% 3.1 0 0.0% 0.0 0 0.0% 0.0 32,557 49.6% Ages 00 – 09 0 0.0% 0.0 0 0.0% 0.0 0 0.0% 0.0 0 0.0% 0.0 4,232 13.0% 10 – 14 0 0.0% 0.0 0 0.0% 0.0 0 0.0% 0.0 0 0.0% 0.0 1,967 6.0% 15 – 19 6 14.3% 233.3 0 0.0% 0.0 0 0.0% 0.0 0 0.0% 0.0 2,572 7.9% 20 – 24 16 38.1% 552.9 0 0.0% 0.0 0 0.0% 0.0 0 0.0% 0.0 2,894 8.9% 25 – 29 12 28.6% 420.6 1 100.0% 35.1 0 0.0% 0.0 0 0.0% 0.0 2,853 8.8% 30 – 34 6 14.3% 316.3 0 0.0% 0.0 0 0.0% 0.0 0 0.0% 0.0 1,897 5.8% 35 – 44 2 4.8% 58.0 0 0.0% 0.0 0 0.0% 0.0 0 0.0% 0.0 3,451 10.6% 45 + 0 0.0% 0.0 0 0.0% 0.0 0 0.0% 0.0 0 0.0% 0.0 12,691 39.0% Not Specified 0 0.0% - 0 0.0% - 0 0.0% - 0 0.0% -
Gender & Race/Ethnicity Chlamydia Gonorrhea P&S Syphilis Early Latent Syphilis Population
Cases Percent1 Rate Cases Percent1 Rate Cases Percent1 Rate Cases Percent1 Rate Number Percent1
COUNTY TOTAL 167 100.0% 263.1 3 100.0% 4.7 0 100.0% 0.0 0 100.0% 0.0 65,593 100.0%
Female Total 125 74.9% 378.4 2 66.7% 6.1 0 0.0% 0.0 0 0.0% 0.0 33,036 50.4%American Indian/Alaska Native 3 3.3% 500.8 0 0.0% 0.0 0 0.0% 0.0 0 0.0% 0.0 599 1.8%Asian/Pacific Islander 2 2.2% 704.2 0 0.0% 0.0 0 0.0% 0.0 0 0.0% 0.0 284 0.9%Black/African-American 0 0.0% 0.0 0 0.0% 0.0 0 0.0% 0.0 0 0.0% 0.0 129 0.4%Latina/Hispanic 24 26.4% 358.5 1 50.0% 14.9 0 0.0% 0.0 0 0.0% 0.0 6,694 20.3%White 62 68.1% 252.9 1 50.0% 4.1 0 0.0% 0.0 0 0.0% 0.0 24,517 74.2%Other/Multi/Not Specified 34 27.2% - 0 0.0% - 0 0.0% - 0 0.0% - 813 2.5%Male Total 42 25.1% 129.0 1 33.3% 3.1 0 0.0% 0.0 0 0.0% 0.0 32,557 49.6%American Indian/Alaska Native 0 0.0% 0.0 0 0.0% 0.0 0 0.0% 0.0 0 0.0% 0.0 546 1.7%Asian/Pacific Islander 1 3.4% 392.2 0 0.0% 0.0 0 0.0% 0.0 0 0.0% 0.0 255 0.8%Black/African-American 0 0.0% 0.0 0 0.0% 0.0 0 0.0% 0.0 0 0.0% 0.0 204 0.6%Latina/Hispanic 7 24.1% 98.8 0 0.0% 0.0 0 0.0% 0.0 0 0.0% 0.0 7,084 21.8%White 21 72.4% 88.8 1 100.0% 4.2 0 0.0% 0.0 0 0.0% 0.0 23,659 72.7%Other/Multi/Not Specified 13 31.0% - 0 0.0% - 0 0.0% - 0 0.0% - 809 2.5%
California Local Health Jurisdiction STD Data Summaries, 2010 Provisional Data (July 2011)

1:100
Trinity County – Chlamydia, Gonorrhea, and P&S SyphilisRates by Age Group (2010), Race/Ethnicity (2010), and Year
0−9 10−14 15−19 20−24 25−29 30−34 35−44 45+
Age Group
0
200
400
600
800
1000 Chlamydia
Nat. Am. A/PI Black Latino White
Race/Ethnicity*
0
100
200
300
Chlamydia
2001 2002 2003 2004 2005 2006 2007 2008 2009 2010
0
50
100
150
200
Year
Chlamydia
0−9 10−14 15−19 20−24 25−29 30−34 35−44 45+
Age Group
0
50
100
150
Gonorrhea
Nat. Am. A/PI Black Latino White
Race/Ethnicity*
0
5
10
15
Gonorrhea
2001 2002 2003 2004 2005 2006 2007 2008 2009 2010
0
5
10
15
20
25
30
35
Year
Gonorrhea
0−9 10−14 15−19 20−24 25−29 30−34 35−44 45+
Age Group
0
1 P&S Syphilis
Nat. Am. A/PI Black Latino White
Race/Ethnicity*
0
1 P&S Syphilis
2001 2002 2003 2004 2005 2006 2007 2008 2009 2010
Year
0
1 P&S Syphilis
Female Male Female Male
* Race data may be missing for a substantial number of cases. See the 'Data Limitations' page for further information.Note: Rates are per 100,000 population.
Source: California Department of Public Health, STD Control Branch
California Local Health Jurisdiction STD Data Summaries, 2010 Provisional Data (July 2011)

1 Gender specific age groups and race/ethnicity percent calculations exclude "Not Specified" from the denominator. 2 Overall county rates were calculated using the July 1 county population estimates from the Department of Finance. (For Trinity County, the July 1, 2010 estimate is 13,918). Note: Rates are per 100,000 population. Source: California Department of Public Health, STD Control Branch
Trinity County – Chlamydia, Gonorrhea, and Early Syphilis Cases and Rates Tables for 2010
Gender & Age Group Chlamydia Gonorrhea P&S Syphilis Early Latent Syphilis Population
Cases Percent1 Rate Cases Percent1 Rate Cases Percent1 Rate Cases Percent1 Rate Number Percent1
COUNTY TOTAL 16 100.0% 115.0 1 100.0% 7.2 0 100.0% 0.0 0 100.0% 0.0 15,172 100.0%
Female Total 11 68.8% 147.0 0 0.0% 0.0 0 0.0% 0.0 0 0.0% 0.0 7,481 49.3% Ages 00 – 09 0 0.0% 0.0 0 0.0% 0.0 0 0.0% 0.0 0 0.0% 0.0 660 8.8% 10 – 14 0 0.0% 0.0 0 0.0% 0.0 0 0.0% 0.0 0 0.0% 0.0 392 5.2% 15 – 19 4 36.4% 782.8 0 0.0% 0.0 0 0.0% 0.0 0 0.0% 0.0 511 6.8% 20 – 24 3 27.3% 565.0 0 0.0% 0.0 0 0.0% 0.0 0 0.0% 0.0 531 7.1% 25 – 29 4 36.4% 833.3 0 0.0% 0.0 0 0.0% 0.0 0 0.0% 0.0 480 6.4% 30 – 34 0 0.0% 0.0 0 0.0% 0.0 0 0.0% 0.0 0 0.0% 0.0 183 2.4% 35 – 44 0 0.0% 0.0 0 0.0% 0.0 0 0.0% 0.0 0 0.0% 0.0 637 8.5% 45 + 0 0.0% 0.0 0 0.0% 0.0 0 0.0% 0.0 0 0.0% 0.0 4,087 54.6% Not Specified 0 0.0% - 0 0.0% - 0 0.0% - 0 0.0% -
Male Total 5 31.3% 65.0 1 100.0% 13.0 0 0.0% 0.0 0 0.0% 0.0 7,691 50.7% Ages 00 – 09 0 0.0% 0.0 0 0.0% 0.0 0 0.0% 0.0 0 0.0% 0.0 715 9.3% 10 – 14 0 0.0% 0.0 0 0.0% 0.0 0 0.0% 0.0 0 0.0% 0.0 406 5.3% 15 – 19 0 0.0% 0.0 0 0.0% 0.0 0 0.0% 0.0 0 0.0% 0.0 543 7.1% 20 – 24 5 100.0% 851.8 0 0.0% 0.0 0 0.0% 0.0 0 0.0% 0.0 587 7.6% 25 – 29 0 0.0% 0.0 0 0.0% 0.0 0 0.0% 0.0 0 0.0% 0.0 528 6.9% 30 – 34 0 0.0% 0.0 0 0.0% 0.0 0 0.0% 0.0 0 0.0% 0.0 227 3.0% 35 – 44 0 0.0% 0.0 1 100.0% 142.7 0 0.0% 0.0 0 0.0% 0.0 701 9.1% 45 + 0 0.0% 0.0 0 0.0% 0.0 0 0.0% 0.0 0 0.0% 0.0 3,984 51.8% Not Specified 0 0.0% - 0 0.0% - 0 0.0% - 0 0.0% -
Gender & Race/Ethnicity Chlamydia Gonorrhea P&S Syphilis Early Latent Syphilis Population
Cases Percent1 Rate Cases Percent1 Rate Cases Percent1 Rate Cases Percent1 Rate Number Percent1
COUNTY TOTAL 16 100.0% 115.0 1 100.0% 7.2 0 100.0% 0.0 0 100.0% 0.0 15,172 100.0%
Female Total 11 68.8% 147.0 0 0.0% 0.0 0 0.0% 0.0 0 0.0% 0.0 7,481 49.3%American Indian/Alaska Native 1 16.7% 332.2 0 0.0% 0.0 0 0.0% 0.0 0 0.0% 0.0 301 4.0%Asian/Pacific Islander 0 0.0% 0.0 0 0.0% 0.0 0 0.0% 0.0 0 0.0% 0.0 59 0.8%Black/African-American 0 0.0% 0.0 0 0.0% 0.0 0 0.0% 0.0 0 0.0% 0.0 7 0.1%Latina/Hispanic 1 16.7% 331.1 0 0.0% 0.0 0 0.0% 0.0 0 0.0% 0.0 302 4.0%White 4 66.7% 61.3 0 0.0% 0.0 0 0.0% 0.0 0 0.0% 0.0 6,525 87.2%Other/Multi/Not Specified 5 45.5% - 0 0.0% - 0 0.0% - 0 0.0% - 287 3.8%Male Total 5 31.3% 65.0 1 100.0% 13.0 0 0.0% 0.0 0 0.0% 0.0 7,691 50.7%American Indian/Alaska Native 1 20.0% 279.3 0 0.0% 0.0 0 0.0% 0.0 0 0.0% 0.0 358 4.7%Asian/Pacific Islander 0 0.0% 0.0 0 0.0% 0.0 0 0.0% 0.0 0 0.0% 0.0 36 0.5%Black/African-American 0 0.0% 0.0 0 0.0% 0.0 0 0.0% 0.0 0 0.0% 0.0 55 0.7%Latina/Hispanic 0 0.0% 0.0 0 0.0% 0.0 0 0.0% 0.0 0 0.0% 0.0 300 3.9%White 4 80.0% 60.4 1 100.0% 15.1 0 0.0% 0.0 0 0.0% 0.0 6,626 86.2%Other/Multi/Not Specified 0 0.0% - 0 0.0% - 0 0.0% - 0 0.0% - 316 4.1%
California Local Health Jurisdiction STD Data Summaries, 2010 Provisional Data (July 2011)

1:100
Tulare County – Chlamydia, Gonorrhea, and P&S SyphilisRates by Age Group (2010), Race/Ethnicity (2010), and Year
0−9 10−14 15−19 20−24 25−29 30−34 35−44 45+
Age Group
0
500
1000
1500
2000
2500
Chlamydia
Nat. Am. A/PI Black Latino White
Race/Ethnicity*
0
500
1000
1500
Chlamydia
2001 2002 2003 2004 2005 2006 2007 2008 2009 2010
0
200
400
600
800
Year
Chlamydia
0−9 10−14 15−19 20−24 25−29 30−34 35−44 45+
Age Group
0
20
40
60
Gonorrhea
Nat. Am. A/PI Black Latino White
Race/Ethnicity*
0
50
100
150
200
250
300
350 Gonorrhea
2001 2002 2003 2004 2005 2006 2007 2008 2009 2010
0
50
100
150
Year
Gonorrhea
0−9 10−14 15−19 20−24 25−29 30−34 35−44 45+
Age Group
0
5
10
15
P&S Syphilis
Nat. Am. A/PI Black Latino White
Race/Ethnicity*
0
1
2
3
4
5
6
P&S Syphilis
2001 2002 2003 2004 2005 2006 2007 2008 2009 2010
0
2
4
6
8
10
Year
P&S Syphilis
Female Male Female Male
* Race data may be missing for a substantial number of cases. See the 'Data Limitations' page for further information.Note: Rates are per 100,000 population.
Source: California Department of Public Health, STD Control Branch
California Local Health Jurisdiction STD Data Summaries, 2010 Provisional Data (July 2011)

1 Gender specific age groups and race/ethnicity percent calculations exclude "Not Specified" from the denominator. 2 Overall county rates were calculated using the July 1 county population estimates from the Department of Finance. (For Tulare County, the July 1, 2010 estimate is 450,749). Note: Rates are per 100,000 population. Source: California Department of Public Health, STD Control Branch
Tulare County – Chlamydia, Gonorrhea, and Early Syphilis Cases and Rates Tables for 2010
Gender & Age Group Chlamydia Gonorrhea P&S Syphilis Early Latent Syphilis Population
Cases Percent1 Rate Cases Percent1 Rate Cases Percent1 Rate Cases Percent1 Rate Number Percent1
COUNTY TOTAL 1,582 100.0% 351.0 90 100.0% 20.0 13 100.0% 2.9 5 100.0% 1.1 466,893 100.0%
Female Total 1,179 74.5% 507.0 44 48.9% 18.9 2 15.4% 0.9 0 0.0% 0.0 232,550 49.8% Ages 00 – 09 0 0.0% 0.0 0 0.0% 0.0 0 0.0% 0.0 0 0.0% 0.0 41,161 17.7% 10 – 14 6 0.5% 34.7 0 0.0% 0.0 0 0.0% 0.0 0 0.0% 0.0 17,277 7.4% 15 – 19 361 30.6% 1,806.8 7 15.9% 35.0 0 0.0% 0.0 0 0.0% 0.0 19,980 8.6% 20 – 24 445 37.7% 2,278.8 13 29.5% 66.6 1 50.0% 5.1 0 0.0% 0.0 19,528 8.4% 25 – 29 208 17.6% 1,111.0 8 18.2% 42.7 0 0.0% 0.0 0 0.0% 0.0 18,722 8.1% 30 – 34 77 6.5% 497.7 6 13.6% 38.8 0 0.0% 0.0 0 0.0% 0.0 15,472 6.7% 35 – 44 61 5.2% 219.9 8 18.2% 28.8 1 50.0% 3.6 0 0.0% 0.0 27,743 11.9% 45 + 21 1.8% 28.9 2 4.5% 2.8 0 0.0% 0.0 0 0.0% 0.0 72,667 31.2% Not Specified 0 0.0% - 0 0.0% - 0 0.0% - 0 0.0% -
Male Total 403 25.5% 172.0 46 51.1% 19.6 11 84.6% 4.7 5 100.0% 2.1 234,343 50.2% Ages 00 – 09 0 0.0% 0.0 0 0.0% 0.0 0 0.0% 0.0 0 0.0% 0.0 42,628 18.2% 10 – 14 1 0.2% 5.6 1 2.2% 5.6 0 0.0% 0.0 0 0.0% 0.0 17,811 7.6% 15 – 19 110 27.3% 528.0 9 19.6% 43.2 0 0.0% 0.0 1 20.0% 4.8 20,832 8.9% 20 – 24 148 36.7% 693.5 9 19.6% 42.2 2 18.2% 9.4 3 60.0% 14.1 21,340 9.1% 25 – 29 76 18.9% 355.8 6 13.0% 28.1 3 27.3% 14.0 0 0.0% 0.0 21,360 9.1% 30 – 34 40 9.9% 237.0 8 17.4% 47.4 1 9.1% 5.9 1 20.0% 5.9 16,879 7.2% 35 – 44 22 5.5% 79.5 9 19.6% 32.5 2 18.2% 7.2 0 0.0% 0.0 27,663 11.8% 45 + 6 1.5% 9.1 4 8.7% 6.1 3 27.3% 4.6 0 0.0% 0.0 65,830 28.1% Not Specified 0 0.0% - 0 0.0% - 0 0.0% - 0 0.0% -
Gender & Race/Ethnicity Chlamydia Gonorrhea P&S Syphilis Early Latent Syphilis Population
Cases Percent1 Rate Cases Percent1 Rate Cases Percent1 Rate Cases Percent1 Rate Number Percent1
COUNTY TOTAL 1,582 100.0% 351.0 90 100.0% 20.0 13 100.0% 2.9 5 100.0% 1.1 466,893 100.0%
Female Total 1,179 74.5% 507.0 44 48.9% 18.9 2 15.4% 0.9 0 0.0% 0.0 232,550 49.8%American Indian/Alaska Native 5 0.5% 222.1 0 0.0% 0.0 0 0.0% 0.0 0 0.0% 0.0 2,251 1.0%Asian/Pacific Islander 16 1.7% 187.1 1 2.7% 11.7 0 0.0% 0.0 0 0.0% 0.0 8,552 3.7%Black/African-American 31 3.3% 1,337.9 3 8.1% 129.5 0 0.0% 0.0 0 0.0% 0.0 2,317 1.0%Latina/Hispanic 717 75.9% 550.2 20 54.1% 15.3 2 100.0% 1.5 0 0.0% 0.0 130,324 56.0%White 176 18.6% 203.6 13 35.1% 15.0 0 0.0% 0.0 0 0.0% 0.0 86,444 37.2%Other/Multi/Not Specified 234 19.8% - 7 15.9% - 0 0.0% - 0 0.0% - 2,662 1.1%Male Total 403 25.5% 172.0 46 51.1% 19.6 11 84.6% 4.7 5 100.0% 2.1 234,343 50.2%American Indian/Alaska Native 2 0.6% 101.3 0 0.0% 0.0 0 0.0% 0.0 0 0.0% 0.0 1,975 0.8%Asian/Pacific Islander 2 0.6% 24.8 1 2.9% 12.4 0 0.0% 0.0 0 0.0% 0.0 8,080 3.4%Black/African-American 24 7.6% 906.7 8 22.9% 302.2 0 0.0% 0.0 0 0.0% 0.0 2,647 1.1%Latina/Hispanic 239 76.1% 173.2 18 51.4% 13.0 8 72.7% 5.8 3 60.0% 2.2 138,019 58.9%White 47 15.0% 58.0 8 22.9% 9.9 3 27.3% 3.7 2 40.0% 2.5 81,076 34.6%Other/Multi/Not Specified 89 22.1% - 11 23.9% - 0 0.0% - 0 0.0% - 2,546 1.1%
California Local Health Jurisdiction STD Data Summaries, 2010 Provisional Data (July 2011)

1:100
Tuolumne County – Chlamydia, Gonorrhea, and P&S SyphilisRates by Age Group (2010), Race/Ethnicity (2010), and Year
0−9 10−14 15−19 20−24 25−29 30−34 35−44 45+
Age Group
0
500
1000
1500
2000
2500
Chlamydia
Nat. Am. A/PI Black Latino White
Race/Ethnicity*
0
50
100
150
200
250 Chlamydia
2001 2002 2003 2004 2005 2006 2007 2008 2009 2010
0
50
100
150
200
250
300
Year
Chlamydia
0−9 10−14 15−19 20−24 25−29 30−34 35−44 45+
Age Group
0
20
40
60
80
100
120
Gonorrhea
Nat. Am. A/PI Black Latino White
Race/Ethnicity*
0
1
2
3
4
Gonorrhea
2001 2002 2003 2004 2005 2006 2007 2008 2009 2010
0
5
10
15
20
25
30
Year
Gonorrhea
0−9 10−14 15−19 20−24 25−29 30−34 35−44 45+
Age Group
0
1 P&S Syphilis
Nat. Am. A/PI Black Latino White
Race/Ethnicity*
0
1 P&S Syphilis
2001 2002 2003 2004 2005 2006 2007 2008 2009 2010
0
1
2
3
4
Year
P&S Syphilis
Female Male Female Male
s Numbers suppressed for confidentiality* Race data may be missing for a substantial number of cases. See the 'Data Limitations' page for further information.
Note: Rates are per 100,000 population.Source: California Department of Public Health, STD Control Branch
California Local Health Jurisdiction STD Data Summaries, 2010 Provisional Data (July 2011)

s Numbers suppressed for confidentiality. 1 Gender specific age groups and race/ethnicity percent calculations exclude "Not Specified" from the denominator. 2 Overall county rates were calculated using the July 1 county population estimates from the Department of Finance. (For Tuolumne County, the July 1, 2010 estimate is 55,896). Note: Rates are per 100,000 population. Source: California Department of Public Health, STD Control Branch
Tuolumne County – Chlamydia, Gonorrhea, and Early Syphilis Cases and Rates Tables for 2010
Gender & Age Group Chlamydia Gonorrhea P&S Syphilis Early Latent Syphilis Population
Cases Percent1 Rate Cases Percent1 Rate Cases Percent1 Rate Cases Percent1 Rate Number Percent1
COUNTY TOTAL 104 100.0% 186.1 3 100.0% 5.4 0 100.0% 0.0 0 100.0% 0.0 58,721 100.0%
Female Total 74 71.2% 265.2 2 66.7% 7.2 0 0.0% 0.0 0 0.0% 0.0 27,904 47.5% Ages 00 – 09 0 0.0% 0.0 0 0.0% 0.0 0 0.0% 0.0 0 0.0% 0.0 2,366 8.5% 10 – 14 0 0.0% 0.0 0 0.0% 0.0 0 0.0% 0.0 0 0.0% 0.0 1,278 4.6% 15 – 19 39 52.7% 2,463.7 0 0.0% 0.0 0 0.0% 0.0 0 0.0% 0.0 1,583 5.7% 20 – 24 24 32.4% 1,340.8 1 50.0% 55.9 0 0.0% 0.0 0 0.0% 0.0 1,790 6.4% 25 – 29 3 4.1% 205.2 0 0.0% 0.0 0 0.0% 0.0 0 0.0% 0.0 1,462 5.2% 30 – 34 6 8.1% 641.0 1 50.0% 106.8 0 0.0% 0.0 0 0.0% 0.0 936 3.4% 35 – 44 1 1.4% 39.3 0 0.0% 0.0 0 0.0% 0.0 0 0.0% 0.0 2,543 9.1% 45 + 1 1.4% 6.3 0 0.0% 0.0 0 0.0% 0.0 0 0.0% 0.0 15,946 57.1% Not Specified 0 0.0% - 0 0.0% - 0 0.0% - 0 0.0% -
Male Total 30 28.8% 97.3 1 33.3% 3.2 0 0.0% 0.0 0 0.0% 0.0 30,817 52.5% Ages 00 – 09 0 0.0% 0.0 0 0.0% 0.0 0 0.0% 0.0 0 0.0% 0.0 2,689 8.7% 10 – 14 0 0.0% 0.0 0 0.0% 0.0 0 0.0% 0.0 0 0.0% 0.0 1,384 4.5% 15 – 19 9 30.0% 475.4 0 0.0% 0.0 0 0.0% 0.0 0 0.0% 0.0 1,893 6.1% 20 – 24 15 50.0% 566.7 1 100.0% 37.8 0 0.0% 0.0 0 0.0% 0.0 2,647 8.6% 25 – 29 1 3.3% 41.9 0 0.0% 0.0 0 0.0% 0.0 0 0.0% 0.0 2,385 7.7% 30 – 34 5 16.7% 331.6 0 0.0% 0.0 0 0.0% 0.0 0 0.0% 0.0 1,508 4.9% 35 – 44 0 0.0% 0.0 0 0.0% 0.0 0 0.0% 0.0 0 0.0% 0.0 3,111 10.1% 45 + 0 0.0% 0.0 0 0.0% 0.0 0 0.0% 0.0 0 0.0% 0.0 15,200 49.3% Not Specified 0 0.0% - 0 0.0% - 0 0.0% - 0 0.0% -
Gender & Race/Ethnicity Chlamydia Gonorrhea P&S Syphilis Early Latent Syphilis Population
Cases Percent1 Rate Cases Percent1 Rate Cases Percent1 Rate Cases Percent1 Rate Number Percent1
COUNTY TOTAL 104 100.0% 186.1 3 100.0% 5.4 0 100.0% 0.0 0 100.0% 0.0 58,721 100.0%
Female Total 74 71.2% 265.2 2 66.7% 7.2 0 0.0% 0.0 0 0.0% 0.0 27,904 47.5%American Indian/Alaska Native s s s 0 0.0% 0.0 0 0.0% 0.0 0 0.0% 0.0 425 1.5%Asian/Pacific Islander s s s 0 0.0% 0.0 0 0.0% 0.0 0 0.0% 0.0 259 0.9%Black/African-American s s s 0 0.0% 0.0 0 0.0% 0.0 0 0.0% 0.0 93 0.3%Latina/Hispanic s s s 0 0.0% 0.0 0 0.0% 0.0 0 0.0% 0.0 2,421 8.7%White 51 92.7% 212.5 1 100.0% 4.2 0 0.0% 0.0 0 0.0% 0.0 24,003 86.0%Other/Multi/Not Specified s s - 1 50.0% - 0 0.0% - 0 0.0% - 703 2.5%Male Total 30 28.8% 97.3 1 33.3% 3.2 0 0.0% 0.0 0 0.0% 0.0 30,817 52.5%American Indian/Alaska Native 0 0.0% 0.0 0 0.0% 0.0 0 0.0% 0.0 0 0.0% 0.0 525 1.7%Asian/Pacific Islander 0 0.0% 0.0 0 0.0% 0.0 0 0.0% 0.0 0 0.0% 0.0 261 0.8%Black/African-American 2 9.1% 187.1 0 0.0% 0.0 0 0.0% 0.0 0 0.0% 0.0 1,069 3.5%Latina/Hispanic 0 0.0% 0.0 0 0.0% 0.0 0 0.0% 0.0 0 0.0% 0.0 3,825 12.4%White 20 90.9% 81.8 0 0.0% 0.0 0 0.0% 0.0 0 0.0% 0.0 24,460 79.4%Other/Multi/Not Specified 8 26.7% - 1 100.0% - 0 0.0% - 0 0.0% - 677 2.2%
California Local Health Jurisdiction STD Data Summaries, 2010 Provisional Data (July 2011)

1:100
Ventura County – Chlamydia, Gonorrhea, and P&S SyphilisRates by Age Group (2010), Race/Ethnicity (2010), and Year
0−9 10−14 15−19 20−24 25−29 30−34 35−44 45+
Age Group
0
500
1000
1500
2000
2500
Chlamydia
Nat. Am. A/PI Black Latino White
Race/Ethnicity*
0
200
400
600
800
1000 Chlamydia
2001 2002 2003 2004 2005 2006 2007 2008 2009 2010
0
100
200
300
400
500
Year
Chlamydia
0−9 10−14 15−19 20−24 25−29 30−34 35−44 45+
Age Group
0
20
40
60
80
100
Gonorrhea
Nat. Am. A/PI Black Latino White
Race/Ethnicity*
0
50
100
150
200
250 Gonorrhea
2001 2002 2003 2004 2005 2006 2007 2008 2009 2010
0
10
20
30
Year
Gonorrhea
0−9 10−14 15−19 20−24 25−29 30−34 35−44 45+
Age Group
0
2
4
6
8
10
12
P&S Syphilis
Nat. Am. A/PI Black Latino White
Race/Ethnicity*
0
5
10
15
P&S Syphilis
2001 2002 2003 2004 2005 2006 2007 2008 2009 2010
0
1
2
3
4
5
Year
P&S Syphilis
Female Male Female Male
* Race data may be missing for a substantial number of cases. See the 'Data Limitations' page for further information.Note: Rates are per 100,000 population.
Source: California Department of Public Health, STD Control Branch
California Local Health Jurisdiction STD Data Summaries, 2010 Provisional Data (July 2011)

1 Gender specific age groups and race/ethnicity percent calculations exclude "Not Specified" from the denominator. 2 Overall county rates were calculated using the July 1 county population estimates from the Department of Finance. (For Ventura County, the July 1, 2010 estimate is 848,331). Note: Rates are per 100,000 population. Source: California Department of Public Health, STD Control Branch
Ventura County – Chlamydia, Gonorrhea, and Early Syphilis Cases and Rates Tables for 2010
Gender & Age Group Chlamydia Gonorrhea P&S Syphilis Early Latent Syphilis Population
Cases Percent1 Rate Cases Percent1 Rate Cases Percent1 Rate Cases Percent1 Rate Number Percent1
COUNTY TOTAL 2,279 100.0% 268.6 170 100.0% 20.0 15 100.0% 1.8 12 100.0% 1.4 855,876 100.0%
Female Total 1,682 73.8% 395.0 82 48.2% 19.3 0 0.0% 0.0 2 16.7% 0.5 425,850 49.8% Ages 00 – 09 0 0.0% 0.0 0 0.0% 0.0 0 0.0% 0.0 0 0.0% 0.0 58,945 13.8% 10 – 14 4 0.2% 14.4 2 2.4% 7.2 0 0.0% 0.0 0 0.0% 0.0 27,813 6.5% 15 – 19 398 23.7% 1,266.4 23 28.0% 73.2 0 0.0% 0.0 0 0.0% 0.0 31,428 7.4% 20 – 24 732 43.5% 2,341.1 30 36.6% 95.9 0 0.0% 0.0 2 100.0% 6.4 31,268 7.3% 25 – 29 306 18.2% 1,039.3 9 11.0% 30.6 0 0.0% 0.0 0 0.0% 0.0 29,443 6.9% 30 – 34 121 7.2% 496.7 5 6.1% 20.5 0 0.0% 0.0 0 0.0% 0.0 24,362 5.7% 35 – 44 97 5.8% 186.8 8 9.8% 15.4 0 0.0% 0.0 0 0.0% 0.0 51,915 12.2% 45 + 24 1.4% 14.1 5 6.1% 2.9 0 0.0% 0.0 0 0.0% 0.0 170,676 40.1% Not Specified 0 0.0% - 0 0.0% - 0 0.0% - 0 0.0% -
Male Total 597 26.2% 138.8 88 51.8% 20.5 15 100.0% 3.5 10 83.3% 2.3 430,026 50.2% Ages 00 – 09 0 0.0% 0.0 0 0.0% 0.0 0 0.0% 0.0 0 0.0% 0.0 61,312 14.3% 10 – 14 0 0.0% 0.0 0 0.0% 0.0 0 0.0% 0.0 0 0.0% 0.0 29,102 6.8% 15 – 19 86 14.4% 260.5 9 10.2% 27.3 0 0.0% 0.0 3 30.0% 9.1 33,011 7.7% 20 – 24 257 43.0% 784.7 26 29.5% 79.4 3 20.0% 9.2 2 20.0% 6.1 32,753 7.6% 25 – 29 136 22.8% 418.5 17 19.3% 52.3 3 20.0% 9.2 0 0.0% 0.0 32,499 7.6% 30 – 34 58 9.7% 201.8 9 10.2% 31.3 2 13.3% 7.0 1 10.0% 3.5 28,747 6.7% 35 – 44 42 7.0% 75.1 15 17.0% 26.8 6 40.0% 10.7 3 30.0% 5.4 55,908 13.0% 45 + 18 3.0% 11.5 12 13.6% 7.7 1 6.7% 0.6 1 10.0% 0.6 156,694 36.4% Not Specified 0 0.0% - 0 0.0% - 0 0.0% - 0 0.0% -
Gender & Race/Ethnicity Chlamydia Gonorrhea P&S Syphilis Early Latent Syphilis Population
Cases Percent1 Rate Cases Percent1 Rate Cases Percent1 Rate Cases Percent1 Rate Number Percent1
COUNTY TOTAL 2,279 100.0% 268.6 170 100.0% 20.0 15 100.0% 1.8 12 100.0% 1.4 855,876 100.0%
Female Total 1,682 73.8% 395.0 82 48.2% 19.3 0 0.0% 0.0 2 16.7% 0.5 425,850 49.8%American Indian/Alaska Native 6 0.4% 309.8 0 0.0% 0.0 0 0.0% 0.0 0 0.0% 0.0 1,937 0.5%Asian/Pacific Islander 47 3.5% 179.9 2 3.1% 7.7 0 0.0% 0.0 0 0.0% 0.0 26,131 6.1%Black/African-American 57 4.2% 870.4 14 21.9% 213.8 0 0.0% 0.0 1 50.0% 15.3 6,549 1.5%Latina/Hispanic 865 64.2% 559.4 29 45.3% 18.8 0 0.0% 0.0 1 50.0% 0.6 154,626 36.3%White 372 27.6% 163.0 19 29.7% 8.3 0 0.0% 0.0 0 0.0% 0.0 228,263 53.6%Other/Multi/Not Specified 335 19.9% - 18 22.0% - 0 0.0% - 0 0.0% - 8,344 2.0%Male Total 597 26.2% 138.8 88 51.8% 20.5 15 100.0% 3.5 10 83.3% 2.3 430,026 50.2%American Indian/Alaska Native 1 0.2% 49.6 0 0.0% 0.0 0 0.0% 0.0 0 0.0% 0.0 2,017 0.5%Asian/Pacific Islander 13 2.9% 56.0 6 8.6% 25.8 0 0.0% 0.0 1 10.0% 4.3 23,217 5.4%Black/African-American 37 8.2% 516.7 11 15.7% 153.6 1 7.1% 14.0 0 0.0% 0.0 7,161 1.7%Latina/Hispanic 258 57.5% 157.5 30 42.9% 18.3 3 21.4% 1.8 6 60.0% 3.7 163,853 38.1%White 140 31.2% 62.0 23 32.9% 10.2 10 71.4% 4.4 3 30.0% 1.3 225,642 52.5%Other/Multi/Not Specified 148 24.8% - 18 20.5% - 1 6.7% - 0 0.0% - 8,136 1.9%
California Local Health Jurisdiction STD Data Summaries, 2010 Provisional Data (July 2011)

1:100
Yolo County – Chlamydia, Gonorrhea, and P&S SyphilisRates by Age Group (2010), Race/Ethnicity (2010), and Year
0−9 10−14 15−19 20−24 25−29 30−34 35−44 45+
Age Group
0
500
1000
1500
Chlamydia
Nat. Am. A/PI Black Latino White
Race/Ethnicity*
0
200
400
600
800
1000
Chlamydia
2001 2002 2003 2004 2005 2006 2007 2008 2009 2010
0
100
200
300
400
500
Year
Chlamydia
0−9 10−14 15−19 20−24 25−29 30−34 35−44 45+
Age Group
0
20
40
60
80
100
120
Gonorrhea
Nat. Am. A/PI Black Latino White
Race/Ethnicity*
0
50
100
150
Gonorrhea
2001 2002 2003 2004 2005 2006 2007 2008 2009 2010
0
10
20
30
40
50
Year
Gonorrhea
0−9 10−14 15−19 20−24 25−29 30−34 35−44 45+
Age Group
0
5
10
15
P&S Syphilis
Nat. Am. A/PI Black Latino White
Race/Ethnicity*
0
2
4
6
8
10
P&S Syphilis
2001 2002 2003 2004 2005 2006 2007 2008 2009 2010
0
1
2
3
4
5
Year
P&S Syphilis
Female Male Female Male
* Race data may be missing for a substantial number of cases. See the 'Data Limitations' page for further information.Note: Rates are per 100,000 population.
Source: California Department of Public Health, STD Control Branch
California Local Health Jurisdiction STD Data Summaries, 2010 Provisional Data (July 2011)

1 Gender specific age groups and race/ethnicity percent calculations exclude "Not Specified" from the denominator. 2 Overall county rates were calculated using the July 1 county population estimates from the Department of Finance. (For Yolo County, the July 1, 2010 estimate is 203,893). Note: Rates are per 100,000 population. Source: California Department of Public Health, STD Control Branch
Yolo County – Chlamydia, Gonorrhea, and Early Syphilis Cases and Rates Tables for 2010
Gender & Age Group Chlamydia Gonorrhea P&S Syphilis Early Latent Syphilis Population
Cases Percent1 Rate Cases Percent1 Rate Cases Percent1 Rate Cases Percent1 Rate Number Percent1
COUNTY TOTAL 580 100.0% 284.5 54 100.0% 26.5 2 100.0% 1.0 0 100.0% 0.0 206,100 100.0%
Female Total 422 72.8% 404.4 27 50.0% 25.9 0 0.0% 0.0 0 0.0% 0.0 104,360 50.6% Ages 00 – 09 0 0.0% 0.0 0 0.0% 0.0 0 0.0% 0.0 0 0.0% 0.0 12,934 12.4% 10 – 14 2 0.5% 31.4 1 3.7% 15.7 0 0.0% 0.0 0 0.0% 0.0 6,369 6.1% 15 – 19 117 27.8% 1,169.3 5 18.5% 50.0 0 0.0% 0.0 0 0.0% 0.0 10,006 9.6% 20 – 24 192 45.6% 1,631.1 12 44.4% 101.9 0 0.0% 0.0 0 0.0% 0.0 11,771 11.3% 25 – 29 68 16.2% 933.6 8 29.6% 109.8 0 0.0% 0.0 0 0.0% 0.0 7,284 7.0% 30 – 34 16 3.8% 223.7 1 3.7% 14.0 0 0.0% 0.0 0 0.0% 0.0 7,153 6.9% 35 – 44 22 5.2% 164.2 0 0.0% 0.0 0 0.0% 0.0 0 0.0% 0.0 13,397 12.8% 45 + 4 1.0% 11.3 0 0.0% 0.0 0 0.0% 0.0 0 0.0% 0.0 35,446 34.0% Not Specified 1 0.2% - 0 0.0% - 0 0.0% - 0 0.0% -
Male Total 157 27.1% 154.3 27 50.0% 26.5 2 100.0% 2.0 0 0.0% 0.0 101,740 49.4% Ages 00 – 09 0 0.0% 0.0 0 0.0% 0.0 0 0.0% 0.0 0 0.0% 0.0 14,052 13.8% 10 – 14 1 0.6% 14.8 1 3.7% 14.8 0 0.0% 0.0 0 0.0% 0.0 6,740 6.6% 15 – 19 26 16.6% 265.6 5 18.5% 51.1 0 0.0% 0.0 0 0.0% 0.0 9,790 9.6% 20 – 24 69 43.9% 587.4 10 37.0% 85.1 1 50.0% 8.5 0 0.0% 0.0 11,747 11.5% 25 – 29 32 20.4% 444.1 4 14.8% 55.5 1 50.0% 13.9 0 0.0% 0.0 7,206 7.1% 30 – 34 13 8.3% 187.6 3 11.1% 43.3 0 0.0% 0.0 0 0.0% 0.0 6,928 6.8% 35 – 44 12 7.6% 87.9 3 11.1% 22.0 0 0.0% 0.0 0 0.0% 0.0 13,651 13.4% 45 + 4 2.5% 12.6 1 3.7% 3.2 0 0.0% 0.0 0 0.0% 0.0 31,626 31.1% Not Specified 0 0.0% - 0 0.0% - 0 0.0% - 0 0.0% -
Gender & Race/Ethnicity Chlamydia Gonorrhea P&S Syphilis Early Latent Syphilis Population
Cases Percent1 Rate Cases Percent1 Rate Cases Percent1 Rate Cases Percent1 Rate Number Percent1
COUNTY TOTAL 580 100.0% 284.5 54 100.0% 26.5 2 100.0% 1.0 0 100.0% 0.0 206,100 100.0%
Female Total 422 72.8% 404.4 27 50.0% 25.9 0 0.0% 0.0 0 0.0% 0.0 104,360 50.6%American Indian/Alaska Native 4 1.7% 488.4 0 0.0% 0.0 0 0.0% 0.0 0 0.0% 0.0 819 0.8%Asian/Pacific Islander 30 12.4% 249.9 1 5.3% 8.3 0 0.0% 0.0 0 0.0% 0.0 12,004 11.5%Black/African-American 23 9.5% 957.9 4 21.1% 166.6 0 0.0% 0.0 0 0.0% 0.0 2,401 2.3%Latina/Hispanic 106 43.8% 346.9 8 42.1% 26.2 0 0.0% 0.0 0 0.0% 0.0 30,559 29.3%White 79 32.6% 141.9 6 31.6% 10.8 0 0.0% 0.0 0 0.0% 0.0 55,670 53.3%Other/Multi/Not Specified 180 42.7% - 8 29.6% - 0 0.0% - 0 0.0% - 2,907 2.8%Male Total 157 27.1% 154.3 27 50.0% 26.5 2 100.0% 2.0 0 0.0% 0.0 101,740 49.4%American Indian/Alaska Native 0 0.0% 0.0 0 0.0% 0.0 0 0.0% 0.0 0 0.0% 0.0 634 0.6%Asian/Pacific Islander 8 9.9% 72.8 1 5.3% 9.1 1 100.0% 9.1 0 0.0% 0.0 10,996 10.8%Black/African-American 14 17.3% 534.6 2 10.5% 76.4 0 0.0% 0.0 0 0.0% 0.0 2,619 2.6%Latina/Hispanic 28 34.6% 86.9 9 47.4% 27.9 0 0.0% 0.0 0 0.0% 0.0 32,231 31.7%White 31 38.3% 59.1 7 36.8% 13.4 0 0.0% 0.0 0 0.0% 0.0 52,431 51.5%Other/Multi/Not Specified 76 48.4% - 8 29.6% - 1 50.0% - 0 0.0% - 2,829 2.8%
California Local Health Jurisdiction STD Data Summaries, 2010 Provisional Data (July 2011)
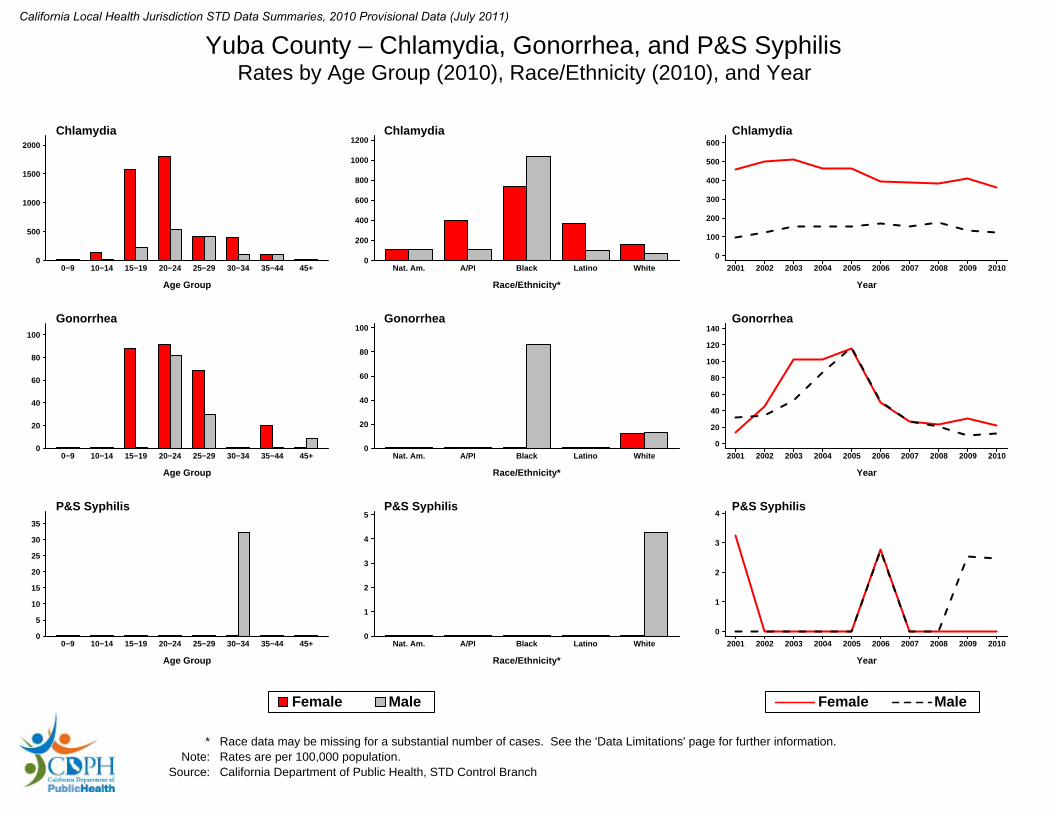
1:100
Yuba County – Chlamydia, Gonorrhea, and P&S SyphilisRates by Age Group (2010), Race/Ethnicity (2010), and Year
0−9 10−14 15−19 20−24 25−29 30−34 35−44 45+
Age Group
0
500
1000
1500
2000
Chlamydia
Nat. Am. A/PI Black Latino White
Race/Ethnicity*
0
200
400
600
800
1000
1200 Chlamydia
2001 2002 2003 2004 2005 2006 2007 2008 2009 2010
0
100
200
300
400
500
600
Year
Chlamydia
0−9 10−14 15−19 20−24 25−29 30−34 35−44 45+
Age Group
0
20
40
60
80
100
Gonorrhea
Nat. Am. A/PI Black Latino White
Race/Ethnicity*
0
20
40
60
80
100 Gonorrhea
2001 2002 2003 2004 2005 2006 2007 2008 2009 2010
0
20
40
60
80
100
120
140
Year
Gonorrhea
0−9 10−14 15−19 20−24 25−29 30−34 35−44 45+
Age Group
0
5
10
15
20
25
30
35
P&S Syphilis
Nat. Am. A/PI Black Latino White
Race/Ethnicity*
0
1
2
3
4
5 P&S Syphilis
2001 2002 2003 2004 2005 2006 2007 2008 2009 2010
0
1
2
3
4
Year
P&S Syphilis
Female Male Female Male
* Race data may be missing for a substantial number of cases. See the 'Data Limitations' page for further information.Note: Rates are per 100,000 population.
Source: California Department of Public Health, STD Control Branch
California Local Health Jurisdiction STD Data Summaries, 2010 Provisional Data (July 2011)

1 Gender specific age groups and race/ethnicity percent calculations exclude "Not Specified" from the denominator. 2 Overall county rates were calculated using the July 1 county population estimates from the Department of Finance. (For Yuba County, the July 1, 2010 estimate is 73,777). Note: Rates are per 100,000 population. Source: California Department of Public Health, STD Control Branch
Yuba County – Chlamydia, Gonorrhea, and Early Syphilis Cases and Rates Tables for 2010
Gender & Age Group Chlamydia Gonorrhea P&S Syphilis Early Latent Syphilis Population
Cases Percent1 Rate Cases Percent1 Rate Cases Percent1 Rate Cases Percent1 Rate Number Percent1
COUNTY TOTAL 197 100.0% 267.0 14 100.0% 19.0 1 100.0% 1.4 1 100.0% 1.4 80,411 100.0%
Female Total 145 73.6% 363.7 9 64.3% 22.6 0 0.0% 0.0 0 0.0% 0.0 39,871 49.6% Ages 00 – 09 0 0.0% 0.0 0 0.0% 0.0 0 0.0% 0.0 0 0.0% 0.0 6,465 16.2% 10 – 14 4 2.8% 135.6 0 0.0% 0.0 0 0.0% 0.0 0 0.0% 0.0 2,949 7.4% 15 – 19 54 37.2% 1,584.0 3 33.3% 88.0 0 0.0% 0.0 0 0.0% 0.0 3,409 8.6% 20 – 24 59 40.7% 1,801.5 3 33.3% 91.6 0 0.0% 0.0 0 0.0% 0.0 3,275 8.2% 25 – 29 12 8.3% 410.7 2 22.2% 68.4 0 0.0% 0.0 0 0.0% 0.0 2,922 7.3% 30 – 34 11 7.6% 402.6 0 0.0% 0.0 0 0.0% 0.0 0 0.0% 0.0 2,732 6.9% 35 – 44 5 3.4% 101.1 1 11.1% 20.2 0 0.0% 0.0 0 0.0% 0.0 4,944 12.4% 45 + 0 0.0% 0.0 0 0.0% 0.0 0 0.0% 0.0 0 0.0% 0.0 13,175 33.0% Not Specified 0 0.0% - 0 0.0% - 0 0.0% - 0 0.0% -
Male Total 51 25.9% 125.8 5 35.7% 12.3 1 100.0% 2.5 1 100.0% 2.5 40,540 50.4% Ages 00 – 09 0 0.0% 0.0 0 0.0% 0.0 0 0.0% 0.0 0 0.0% 0.0 6,683 16.5% 10 – 14 0 0.0% 0.0 0 0.0% 0.0 0 0.0% 0.0 0 0.0% 0.0 3,092 7.6% 15 – 19 8 15.7% 218.5 0 0.0% 0.0 0 0.0% 0.0 0 0.0% 0.0 3,662 9.0% 20 – 24 20 39.2% 542.6 3 60.0% 81.4 0 0.0% 0.0 0 0.0% 0.0 3,686 9.1% 25 – 29 14 27.5% 421.3 1 20.0% 30.1 0 0.0% 0.0 1 100.0% 30.1 3,323 8.2% 30 – 34 3 5.9% 97.0 0 0.0% 0.0 1 100.0% 32.3 0 0.0% 0.0 3,094 7.6% 35 – 44 5 9.8% 99.3 0 0.0% 0.0 0 0.0% 0.0 0 0.0% 0.0 5,033 12.4% 45 + 1 2.0% 8.4 1 20.0% 8.4 0 0.0% 0.0 0 0.0% 0.0 11,967 29.5% Not Specified 0 0.0% - 0 0.0% - 0 0.0% - 0 0.0% -
Gender & Race/Ethnicity Chlamydia Gonorrhea P&S Syphilis Early Latent Syphilis Population
Cases Percent1 Rate Cases Percent1 Rate Cases Percent1 Rate Cases Percent1 Rate Number Percent1
COUNTY TOTAL 197 100.0% 267.0 14 100.0% 19.0 1 100.0% 1.4 1 100.0% 1.4 80,411 100.0%
Female Total 145 73.6% 363.7 9 64.3% 22.6 0 0.0% 0.0 0 0.0% 0.0 39,871 49.6%American Indian/Alaska Native 1 1.1% 112.2 0 0.0% 0.0 0 0.0% 0.0 0 0.0% 0.0 891 2.2%Asian/Pacific Islander 11 11.8% 399.3 0 0.0% 0.0 0 0.0% 0.0 0 0.0% 0.0 2,755 6.9%Black/African-American 7 7.5% 739.2 0 0.0% 0.0 0 0.0% 0.0 0 0.0% 0.0 947 2.4%Latina/Hispanic 37 39.8% 371.2 0 0.0% 0.0 0 0.0% 0.0 0 0.0% 0.0 9,968 25.0%White 37 39.8% 155.3 3 100.0% 12.6 0 0.0% 0.0 0 0.0% 0.0 23,832 59.8%Other/Multi/Not Specified 52 35.9% - 6 66.7% - 0 0.0% - 0 0.0% - 1,478 3.7%Male Total 51 25.9% 125.8 5 35.7% 12.3 1 100.0% 2.5 1 100.0% 2.5 40,540 50.4%American Indian/Alaska Native 1 2.3% 103.8 0 0.0% 0.0 0 0.0% 0.0 0 0.0% 0.0 963 2.4%Asian/Pacific Islander 3 7.0% 112.6 0 0.0% 0.0 0 0.0% 0.0 0 0.0% 0.0 2,665 6.6%Black/African-American 12 27.9% 1,035.4 1 25.0% 86.3 0 0.0% 0.0 0 0.0% 0.0 1,159 2.9%Latina/Hispanic 11 25.6% 100.9 0 0.0% 0.0 0 0.0% 0.0 0 0.0% 0.0 10,905 26.9%White 16 37.2% 68.5 3 75.0% 12.8 1 100.0% 4.3 1 100.0% 4.3 23,367 57.6%Other/Multi/Not Specified 8 15.7% - 1 20.0% - 0 0.0% - 0 0.0% - 1,481 3.7%
California Local Health Jurisdiction STD Data Summaries, 2010 Provisional Data (July 2011)