Embed Size (px)
Citation preview
Accreditation Council for Business Schools and Programs (ACBSP)Quality Assurance (QA) Report
ForAssociate Degree Business Programs
Current as of February 2011
Overview (O)1. Complete all information requested.
Submit your report as an attachment to [email protected] on or before February 27th or September 30th.
O2. This report should be limited to maximum of 50 pages. The average length of most good reports is 30 pages. To help reduce the page numbers you can remove the ACBSP examples used in this report template to help you complete the report.
O3. Institution Name: Northern Oklahoma College Date 2/17/2012 Address: P.O. Box 310, 1220 E. Grand, Tonkawa, OK 74653
O4. Year Accredited/Reaffirmed: 1992 / 2008 This Report Covers Years: 2009-2011
O5. List All Accredited Programs (as they appear in your catalog): Business Administration, Business Administration – International Option, Business Administration – MIS Option, Computer Science, Business Management, Office Management, Office Management – Medical Assistant Option, Information Technology – Network Engineering Option, Information Technology – Web Development Option, Information Technology – Interactive Media Option
O6. List all programs that are in your business unit that are not accredited by ACBSP and how you distinguish accurately to the public between programs that have achieved accredited status and those that have not. Enterprise Development – Business Administration Area of Emphasis, Business Management – Accounting Option, Business Management – Entrepreneurship Option On the Northern Oklahoma College Business Division Website, accredited degrees are indicated with an asterisk and in the catalog, the accredited programs are indicated on the degree sheets.
1

O7. List all campuses that a student can earn a business degree from your institution: Tonkawa, Oklahoma Enid, Oklahoma Stillwater, Oklahoma
O8. Person completing report Name: Carolyn Johnson Phone: 580-628-6340 E-mail address: [email protected] ACBSP Champion name: Carolyn Johnson ACBSP Co-Champion name: Todd Ging
O9. Conditions/Notes/Opportunity for Improvement (OFI) to be Addressed N/A
1O. The business unit must routinely provide reliable information to the public on their performance, including student achievement.
The Business Division currently posts current ACBSP reports (Self-study and QA Reports) on the divisional website. With the current review and revision of the divisional course objectives and student learning outcomes, the website will also be updated. A page listing the course objectives will be linked to the related student learning outcomes assessment data results. Implementation of the new web page is scheduled for April 2012.
Note: This requirement can be addressed from the Standards and Criteria book in Standard 4: Measurement, Analysis, and Knowledge Management, Criterion 4.3 Student Assessment, Item F. Organizational Performance Results.
2
Standard #1 Leadership
Organization
a. List any organizational or administrative personnel changes within the business unit since your last report.
Though there have been no changes to the administrative personnel within the business unit since the last report, significant changes have occurred institutionally with the turnover in the president’s office of three presidents in three years. This high turnover has caused a degree of uncertainty within the institution over the past two years, but is now stabilized with the leadership of our current president, Dr. Cheryl Evans.
b. List all new sites where students can earn an accredited business degree (international campus, off-campus or on campus, on-line) that have been added since your last report.
No new sites.
Standard #2 Strategic Planning (this standard not typically addressed in the QA report) This is used as a place holder to allow all the other standards to be addressed in the QA report and keep the numbering system consistent with self-studies and QA reports.
3
Standard #3 Student and Stakeholder Focus
Complete the following table. Use a maximum of three or four examples, reporting what you consider to be the most important data. It is not necessary to provide results for every process.
Standard 3 - Student and Stakeholder-Focused ResultsStudent- and Stakeholder-Focused Results Student- and stakeholder-focused results examine how well your organization satisfies students and
stakeholders key needs and expectations.Key indicators may include: satisfaction and dissatisfaction of current and past students and key stakeholders, perceived value, loyalty, persistence, or other aspects of relationship building, end of course surveys, alumni surveys, Internship feedback, etc.
Each academic unit must demonstrate linkages to business practitioners and organizations, which are current and significant, including an advisory board.
Periodic surveys should be made of graduates, transfer institutions, and/or employers of graduates to obtain data on the success of business programs in preparing students to compete successfully for entry-level positions.
Analysis of ResultsPerformance
Measure (Competency)
Description of Measurement
Instrument
Areas of Success (results)
Analysis and Action Taken
(improvement)
Results of Action Taken (occurs in
the following year)
Insert Graphs or Tables of Resulting Trends for 3-5 Years (please graph all
available data up to five years)
Student Satisfaction:The benchmark set is that students will give satisfaction ratings that are greater than or equal to the national norms for community colleges (approximately 70% or better) regarding recommendation of college, quality of educational experience and satisfaction with services.
The satisfaction ratings are based on results of the Community College Survey of Student Engagement (CCSSE). The survey focuses on institutional practices and student behaviors that promote student engagement and is completed biannually by a random selection of Northern Oklahoma College students.
697 students completed the CCSSE Student Opinion Survey in the 2008-09 academic year. 93% of students surveyed indicated that they would recommend Northern to a friend or family member.
Each of the indicators of student satisfaction is above the benchmark set of being greater than the national norm. The Business unit will continue to monitor comments from this instrument to make sure we continue to meet the needs of the students.
Desirable outcomes have been achieved since 2005-06. Results were scheduled to be analyzed at the biannual administration of the survey, but due to institutional change, the report has been discontinued and a new satisfaction survey, the ACT Student Opinion Survey, will be administered in Spring 2012 and results analyzed upon administration.
4
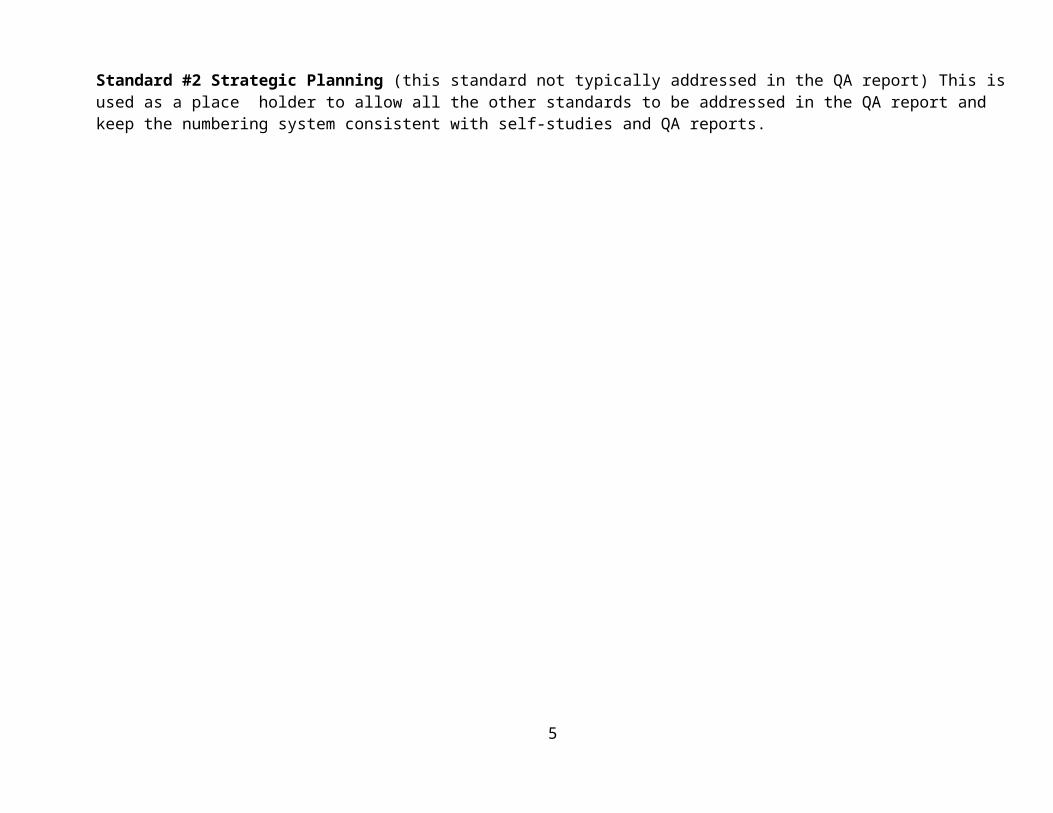
When ranking the quality of education of Northern Oklahoma College, 86.4% of all students surveyed rated Northern as either excellent or good.
When ranking satisfaction with certain services as either “Very Satisfied” or “Satisfied”, students expressed 73.8%, 56% and 73.5% satisfaction with Computer Labs, Financial Aid Advising, and Academic Advising and Planning respectively.
5

Performance Measure
(Competency)
Description of Measurement
Instrument
Areas of Success (results)
Analysis and Action Taken
(improvement)
Results of Action Taken (occurs in the following year)
Insert Graphs or Tables of Resulting Trends for 3-5 Years (please graph all
available data up to five years)
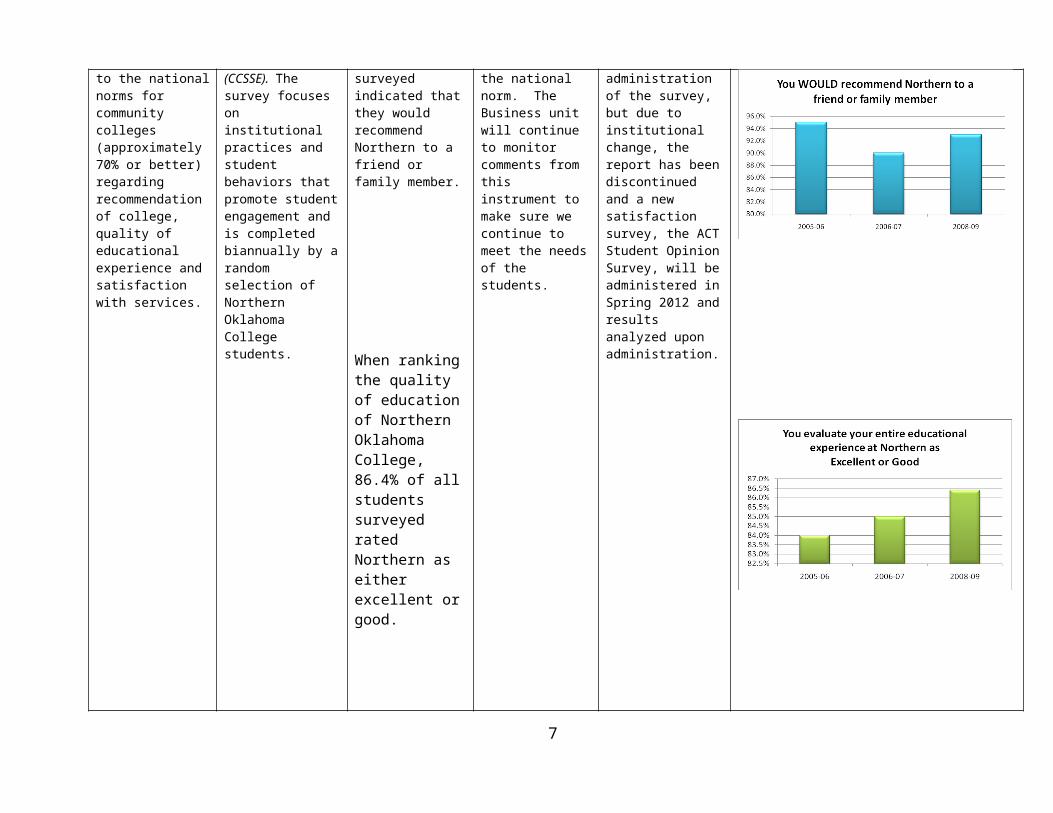
Internships:The desirable outcome is that 100% of the employers who sponsor an intern will respond to the Supervisor / Employer Follow-Up Evaluation and that each employer will indicate that if they had a position available to a person with the intern’s background they would hire the intern.
Supervisor Follow-up Survey for Students enrolled in Business Internships—completed at the end of the internship by the supervisor / employer of the intern.
100% of employers who sponsored interns returned the employer / supervisor follow-up surveys. Of all interns placed since Fall 2007, only one employer indicated that they would not hire the intern.
The desired outcome has been achieved since Fall 2007, except in Spring 2009, in which the employer added that if the intern received a higher level of education (bachelors or higher) the intern would be a desirable candidate. Continuous monitoring will ensue to insure that quality students are selected as interns AND that quality employers are selected for as internship program sponsors.
Monitoring and communication with employers will continue to insure continued satisfaction with the quality of skills and effort of interns.
SEMWould you
Hire? Yes NoF 07 2 0S 08 5 0F 08 1 0S 09 4 1F 09 1 0S 10 3 0F 10 1 0S 11 1 0
6
Performance Measure
(Competency)
Description of Measurement
Instrument
Areas of Success (results)
Analysis and Action Taken
(improvement)
Results of Action Taken (occurs in the following year)
Insert Graphs or Tables of Resulting Trends for 3-5 Years (please graph all
available data up to five years)
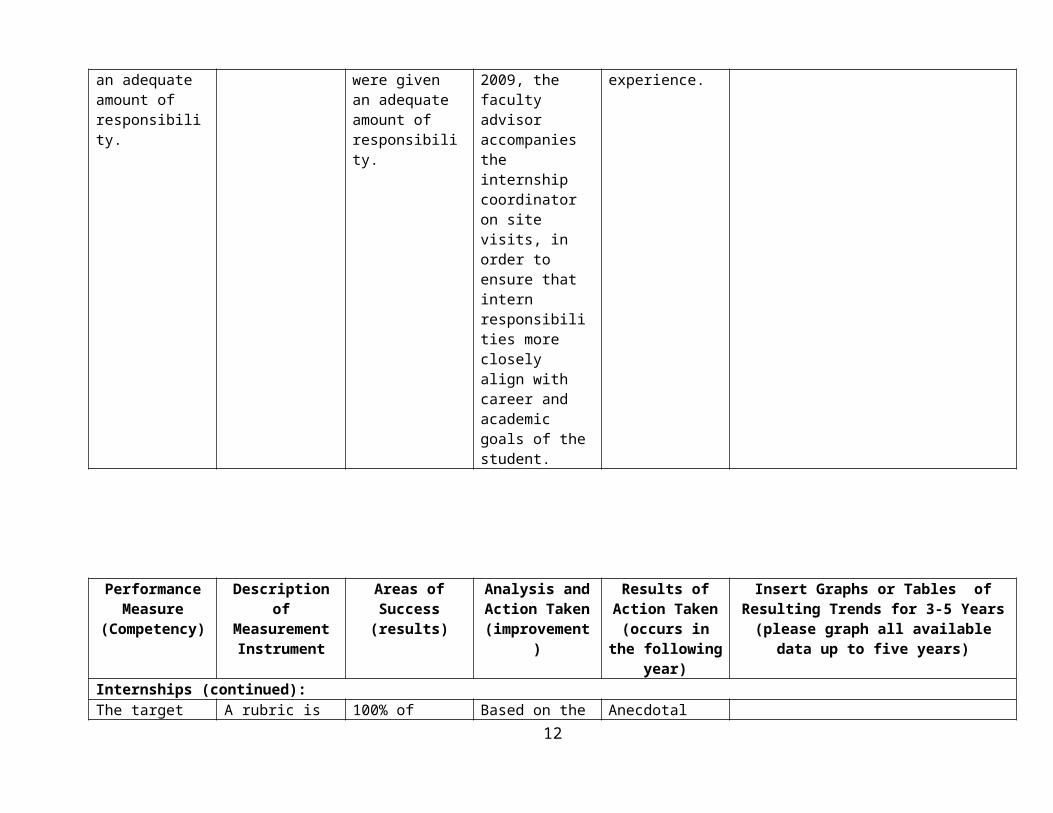
Internships (continued):The desirable outcome is that 100% of student interns will respond to the Intern Completion Questionnaire and will indicate that the work assignments were closely related to their field of study and/or career objectives and they were given an adequate amount of responsibility.
Intern Completion Questionnaire for Students enrolled in Business Internships—completed at the end of the internship by the student intern.
100% of the interns placed since Fall 2007 completed the Intern Completion Questionnaire. All indicated that the work assignments were closely related to their field of study and all but two (one in Fall 2007 and one in Spring 2009) indicated that they were given an adequate amount of responsibility.
The internship coordinator will continuously monitor intern sites to assure that interns are placed in areas related to their field of study or career objectives and that the desired amount of responsibility is delegated to the intern. Since Fall 2009, the faculty advisor accompanies the internship coordinator on site visits, in order to ensure that intern responsibilities more closely align with career and academic goals of the student.
A desirable outcome has been achieved since, Spring, 2007. The changes made in Fall 2009 have caused a higher degree of cooperation between the internship coordinator and the academic advisor, benefitting the program as well as student internship experience.
Related to Field?
Adequate Responsibility?
Yes No Yes NoF 07 2 0 1 1S 08 5 0 5 0F 08 1 0 1 0S 09 5 0 4 1F 09 1 0 1 0S 10 3 0 3 0F 10 1 0 1 0S 11 1 0 1 0
7

Performance Measure
(Competency)
Description of Measurement
Instrument
Areas of Success (results)
Analysis and Action Taken
(improvement)
Results of Action Taken (occurs in the following year)
Insert Graphs or Tables of Resulting Trends for 3-5 Years (please graph all
available data up to five years)
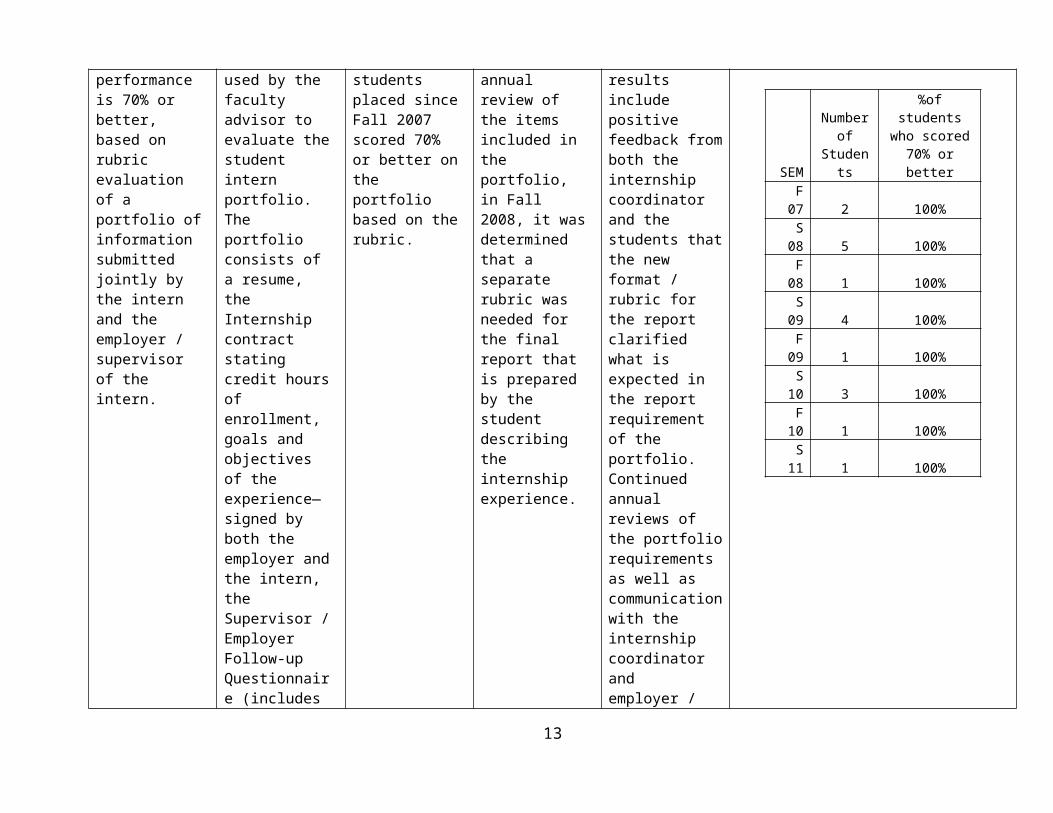
Internships (continued):The target performance is 70% or better, based on rubric evaluation of a portfolio of information submitted jointly by the intern and the employer / supervisor of the intern.
A rubric is used by the faculty advisor to evaluate the student intern portfolio. The portfolio consists of a resume, the Internship contract stating credit hours of enrollment, goals and objectives of the experience—signed by both the employer and the intern, the Supervisor / Employer Follow-up Questionnaire (includes the employer’s recommendation for a final grade for the intern), the Intern’s Completion Questionnaire, and a final report prepared by the intern to describe the experience.
100% of students placed since Fall 2007 scored 70% or better on the portfolio based on the rubric.
Based on the annual review of the items included in the portfolio, in Fall 2008, it was determined that a separate rubric was needed for the final report that is prepared by the student describing the internship experience.
Anecdotal results include positive feedback from both the internship coordinator and the students that the new format / rubric for the report clarified what is expected in the report requirement of the portfolio. Continued annual reviews of the portfolio requirements as well as communication with the internship coordinator and employer / supervisors will be conducted to insure appropriate evaluation of the internship experience.
SEM
Number of
Students
%of students who scored
70% or betterF 07 2 100%S 08 5 100%F 08 1 100%S 09 4 100%F 09 1 100%S 10 3 100%F 10 1 100%S 11 1 100%
8
Performance Measure
(Competency)
Description of Measurement
Instrument
Areas of Success (results)
Analysis and Action Taken
(improvement)
Results of Action Taken (occurs in the following year)
Insert Graphs or Tables of Resulting Trends for 3-5 Years (please graph all
available data up to five years)
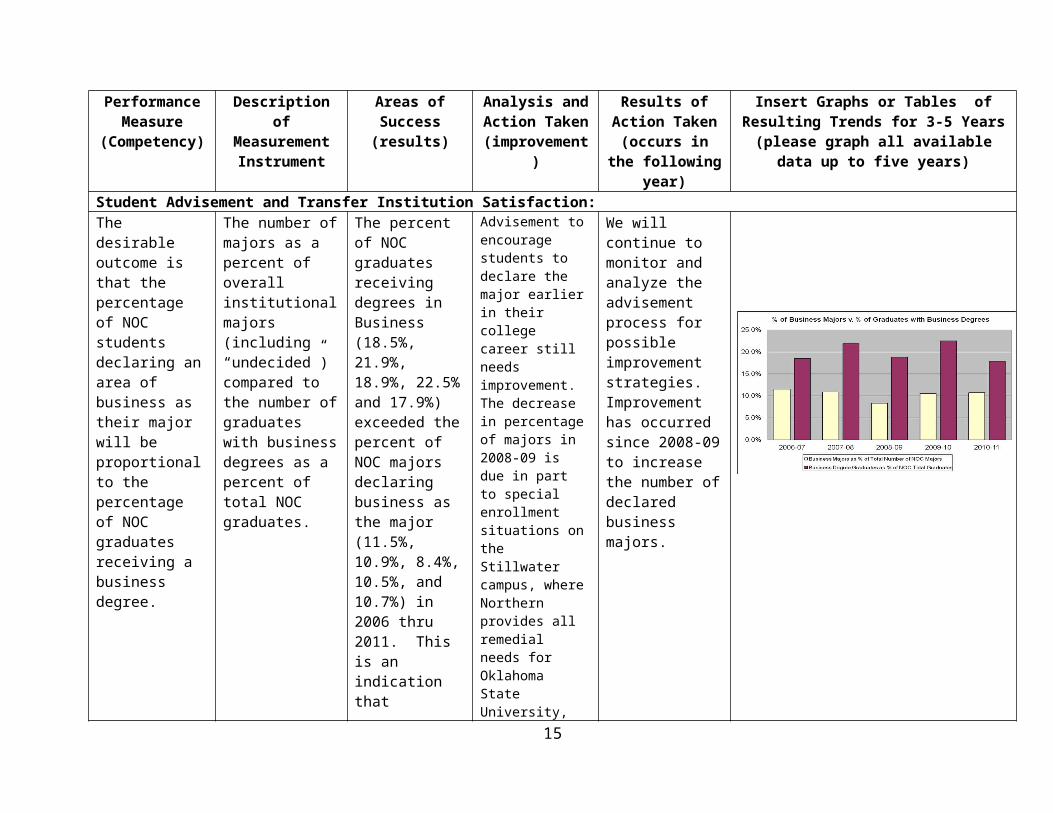
Student Advisement and Transfer Institution Satisfaction:The desirable outcome is that the percentage of NOC students declaring an area of business as their major will be proportional to the percentage of NOC graduates receiving a business degree.
The number of majors as a percent of overall institutional majors (including “undecided”) compared to the number of graduates with business degrees as a percent of total NOC graduates.
The percent of NOC graduates receiving degrees in Business (18.5%, 21.9%, 18.9%, 22.5% and 17.9%) exceeded the percent of NOC majors declaring business as the major (11.5%, 10.9%, 8.4%, 10.5%, and 10.7%) in 2006 thru 2011. This is an indication that advising of students toward degree is resulting in more majors actually completing the degree.
Advisement to encourage students to declare the major earlier in their college career still needs improvement. The decrease in percentage of majors in 2008-09 is due in part to special enrollment situations on the Stillwater campus, where Northern provides all remedial needs for Oklahoma State University, causing Arts & Science majors to be artificially inflated. More effort has been and will continue to be made to identify business students and encourage them to declare a major rather than be listed as the default of Arts & Sciences.
We will continue to monitor and analyze the advisement process for possible improvement strategies. Improvement has occurred since 2008-09 to increase the number of declared business majors.
9
Performance Measure
(Competency)
Description of Measurement
Instrument
Areas of Success (results)
Analysis and Action Taken
(improvement)
Results of Action Taken (occurs in the following year)
Insert Graphs or Tables of Resulting Trends for 3-5 Years (please graph all
available data up to five years)
Student Advisement and Transfer Satisfaction (continued):The desirable outcome is that the retention rate for NOC Gateway students transferring to Oklahoma State University (OSU) will be higher than the retention rate of students transferring from other institutions. This report indicates the performance of students who transferred to OSU after completing at least 24 credit hours at NOC -Stillwater.
The number of students continuing after the first year at OSU as a percentage of the total cohort of transfer students from the NOC - Stillwater campus as compared to the same rate of transfer students from all other institutions.
First year at OSU retention rate of NOC transfer students is greater than the First year at OSU retention rate of other transfer students for each of the years studied indicating that NOC graduates are well prepared for continued success at the four-year institution.
Though first year at OSU retention rate of NOC transfer students is greater than the than the first year at OSU retention rate of other transfer students, both of these retention rates have declined in the past two academic years. Retention will be monitored by both NOC and OSU to improve the trend.
We will continue to monitor and analyze the retention for identification of the cause of the decline in retention and provide improvement strategies.
10

Standard #4 Measurement and Analysis of Student Learning and Performance
a. Program Outcomes
List outcomes, by accredited program - Program outcomes should be used as part of a student learning assessment plan and be measurable.
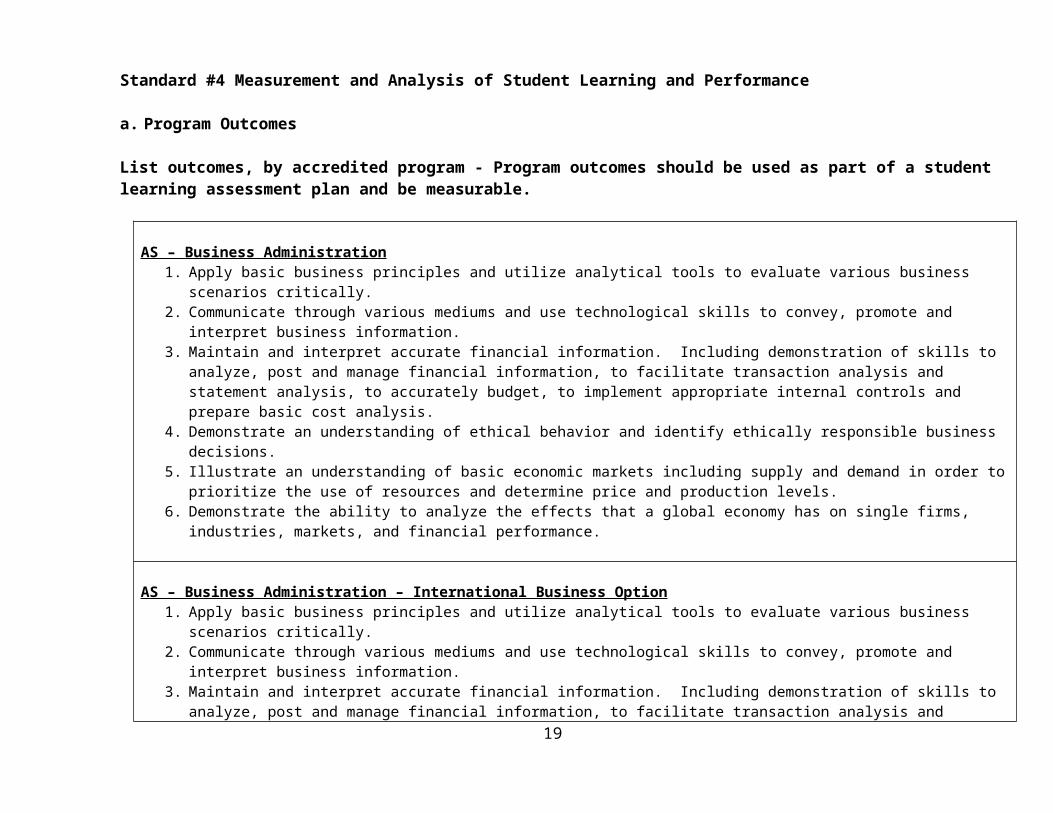
AS – Business Administration1. Apply basic business principles and utilize analytical tools to evaluate various business scenarios critically.2. Communicate through various mediums and use technological skills to convey, promote and interpret business information.3. Maintain and interpret accurate financial information. Including demonstration of skills to analyze, post and manage financial
information, to facilitate transaction analysis and statement analysis, to accurately budget, to implement appropriate internal controls and prepare basic cost analysis.
4. Demonstrate an understanding of ethical behavior and identify ethically responsible business decisions.5. Illustrate an understanding of basic economic markets including supply and demand in order to prioritize the use of resources
and determine price and production levels.6. Demonstrate the ability to analyze the effects that a global economy has on single firms, industries, markets, and financial
performance.
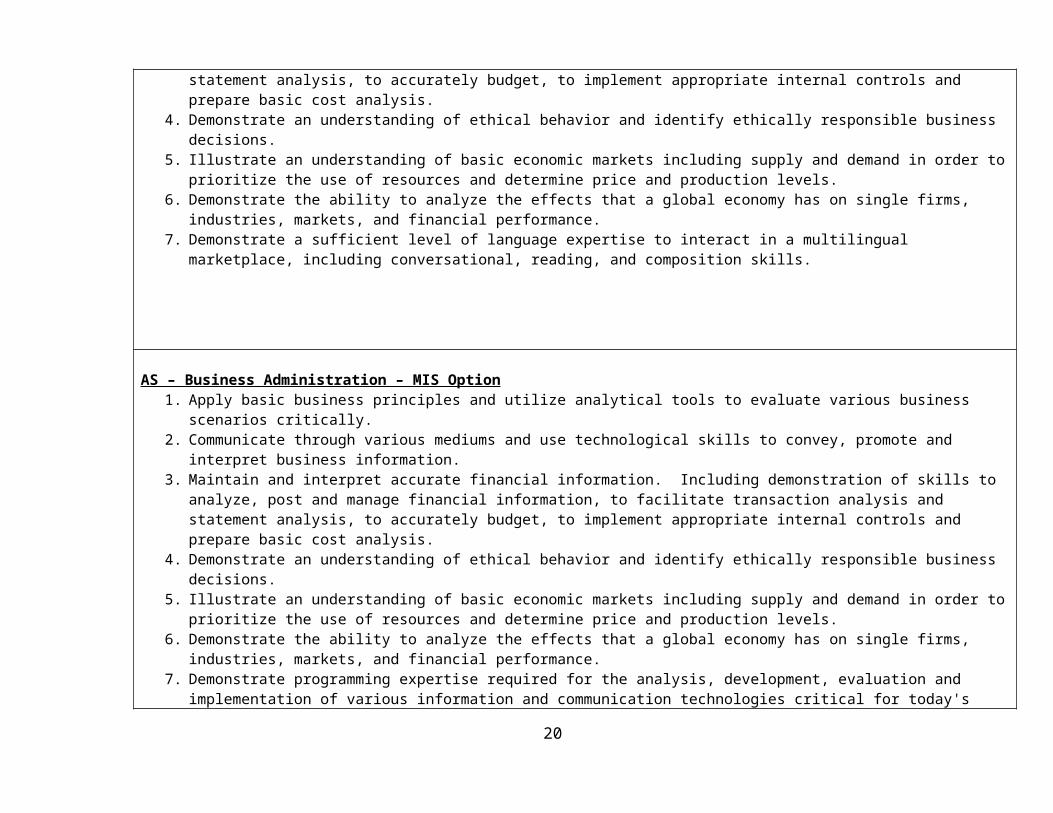
AS – Business Administration – International Business Option1. Apply basic business principles and utilize analytical tools to evaluate various business scenarios critically.2. Communicate through various mediums and use technological skills to convey, promote and interpret business information.3. Maintain and interpret accurate financial information. Including demonstration of skills to analyze, post and manage financial
information, to facilitate transaction analysis and statement analysis, to accurately budget, to implement appropriate internal controls and prepare basic cost analysis.
4. Demonstrate an understanding of ethical behavior and identify ethically responsible business decisions.5. Illustrate an understanding of basic economic markets including supply and demand in order to prioritize the use of resources
and determine price and production levels.6. Demonstrate the ability to analyze the effects that a global economy has on single firms, industries, markets, and financial
performance.7. Demonstrate a sufficient level of language expertise to interact in a multilingual marketplace, including conversational, reading,
and composition skills.
11
AS – Business Administration – MIS Option1. Apply basic business principles and utilize analytical tools to evaluate various business scenarios critically.2. Communicate through various mediums and use technological skills to convey, promote and interpret business information.3. Maintain and interpret accurate financial information. Including demonstration of skills to analyze, post and manage financial
information, to facilitate transaction analysis and statement analysis, to accurately budget, to implement appropriate internal controls and prepare basic cost analysis.
4. Demonstrate an understanding of ethical behavior and identify ethically responsible business decisions.5. Illustrate an understanding of basic economic markets including supply and demand in order to prioritize the use of resources
and determine price and production levels.6. Demonstrate the ability to analyze the effects that a global economy has on single firms, industries, markets, and financial
performance.7. Demonstrate programming expertise required for the analysis, development, evaluation and implementation of various
information and communication technologies critical for today's organizations.
AAS – Business Management1. Apply basic business principles and utilize analytical tools to evaluate various business scenarios critically.2. Communicate through various mediums and use technological skills to convey, promote and interpret business information.3. Maintain and interpret accurate financial information. Including demonstration of skills to analyze, post and manage financial
information, to facilitate transaction analysis and statement analysis, to accurately budget, to implement appropriate internal controls and prepare basic cost analysis.
4. Demonstrate an understanding of ethical behavior and identify ethically responsible business decisions.5. Illustrate an understanding of basic economic markets including supply and demand in order to prioritize the use of resources
and determine price and production levels.6. Demonstrate the ability to analyze the effects that a global economy has on single firms, industries, markets, and financial
performance.7. Demonstrate the skills and knowledge to appropriately handle a diverse workforce, including basic human relations issues in
personnel, training and development, basic employment law, compensation and conflict resolution.8. Demonstrate the skills and knowledge to manage people in a variety of business settings to improve productivity.9. Demonstrate the skills needed to create interest in products and services and promote those products and services to a vast
audience.
12
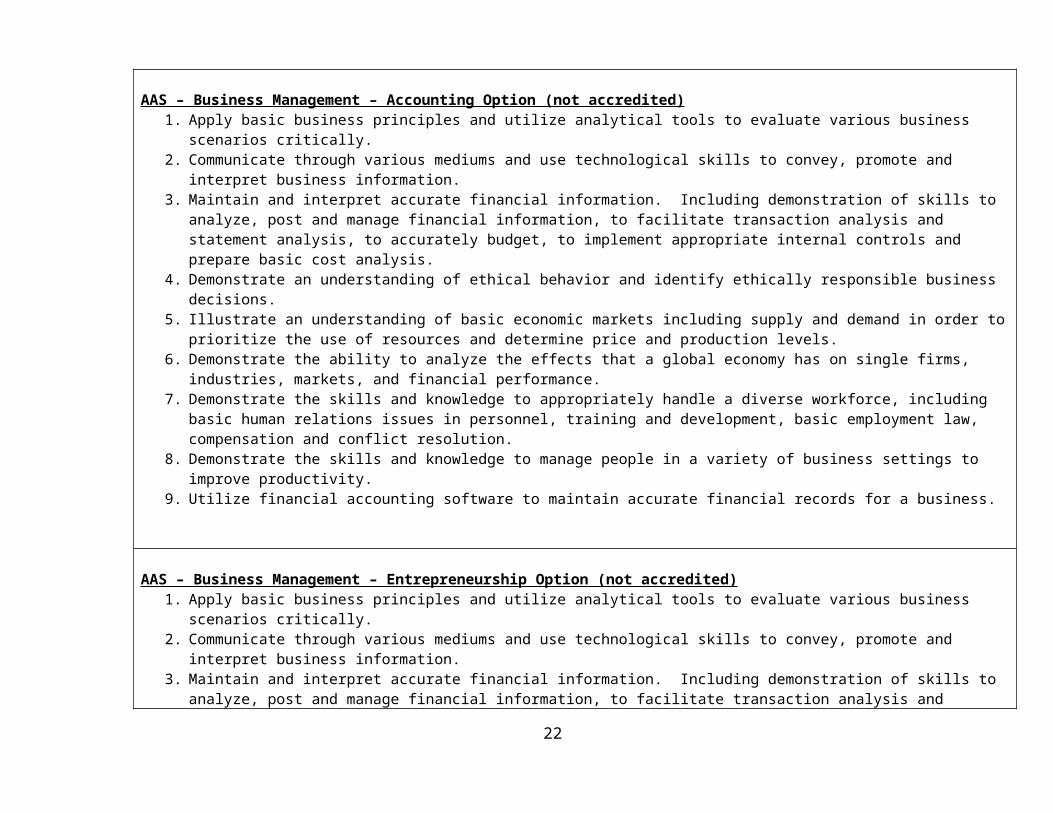
AAS – Business Management – Accounting Option (not accredited)1. Apply basic business principles and utilize analytical tools to evaluate various business scenarios critically.2. Communicate through various mediums and use technological skills to convey, promote and interpret business information.3. Maintain and interpret accurate financial information. Including demonstration of skills to analyze, post and manage financial
information, to facilitate transaction analysis and statement analysis, to accurately budget, to implement appropriate internal controls and prepare basic cost analysis.
4. Demonstrate an understanding of ethical behavior and identify ethically responsible business decisions.5. Illustrate an understanding of basic economic markets including supply and demand in order to prioritize the use of resources
and determine price and production levels.6. Demonstrate the ability to analyze the effects that a global economy has on single firms, industries, markets, and financial
performance.7. Demonstrate the skills and knowledge to appropriately handle a diverse workforce, including basic human relations issues in
personnel, training and development, basic employment law, compensation and conflict resolution.8. Demonstrate the skills and knowledge to manage people in a variety of business settings to improve productivity.9. Utilize financial accounting software to maintain accurate financial records for a business.
AAS – Business Management – Entrepreneurship Option (not accredited)1. Apply basic business principles and utilize analytical tools to evaluate various business scenarios critically.2. Communicate through various mediums and use technological skills to convey, promote and interpret business information.3. Maintain and interpret accurate financial information. Including demonstration of skills to analyze, post and manage financial
information, to facilitate transaction analysis and statement analysis, to accurately budget, to implement appropriate internal controls and prepare basic cost analysis.
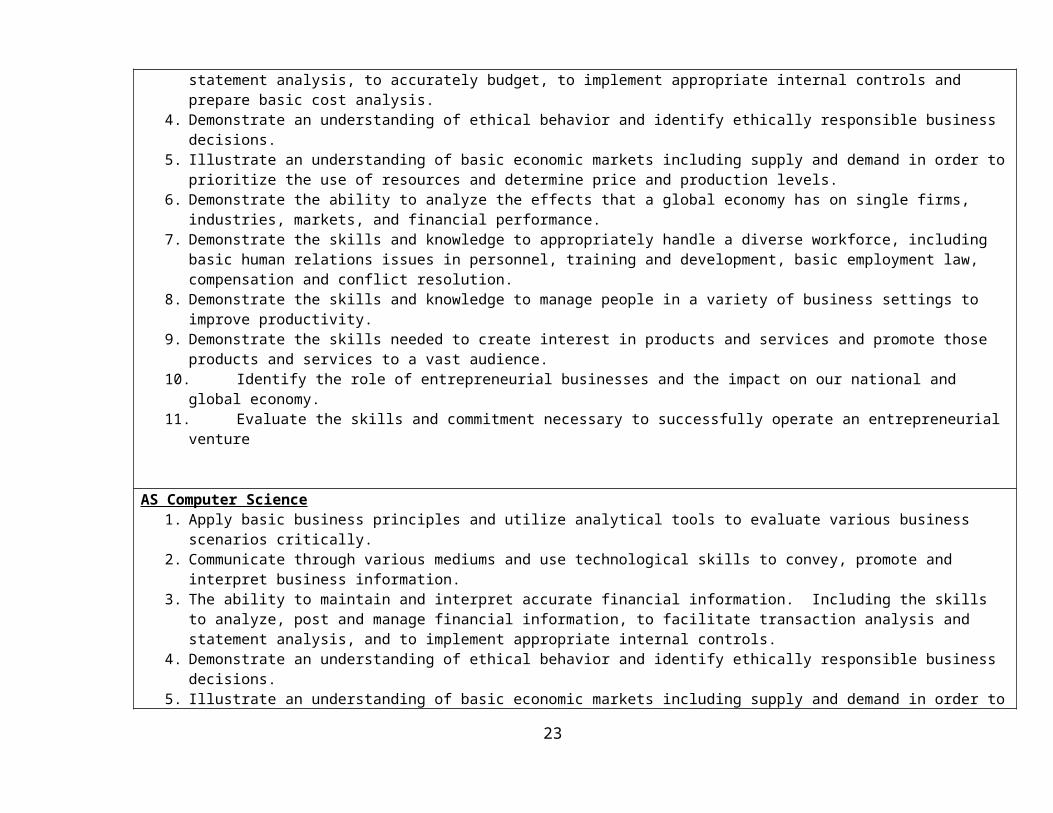
4. Demonstrate an understanding of ethical behavior and identify ethically responsible business decisions.5. Illustrate an understanding of basic economic markets including supply and demand in order to prioritize the use of resources
and determine price and production levels.6. Demonstrate the ability to analyze the effects that a global economy has on single firms, industries, markets, and financial
performance.7. Demonstrate the skills and knowledge to appropriately handle a diverse workforce, including basic human relations issues in
personnel, training and development, basic employment law, compensation and conflict resolution.8. Demonstrate the skills and knowledge to manage people in a variety of business settings to improve productivity.9. Demonstrate the skills needed to create interest in products and services and promote those products and services to a vast
audience.10. Identify the role of entrepreneurial businesses and the impact on our national and global economy. 11. Evaluate the skills and commitment necessary to successfully operate an entrepreneurial venture
13
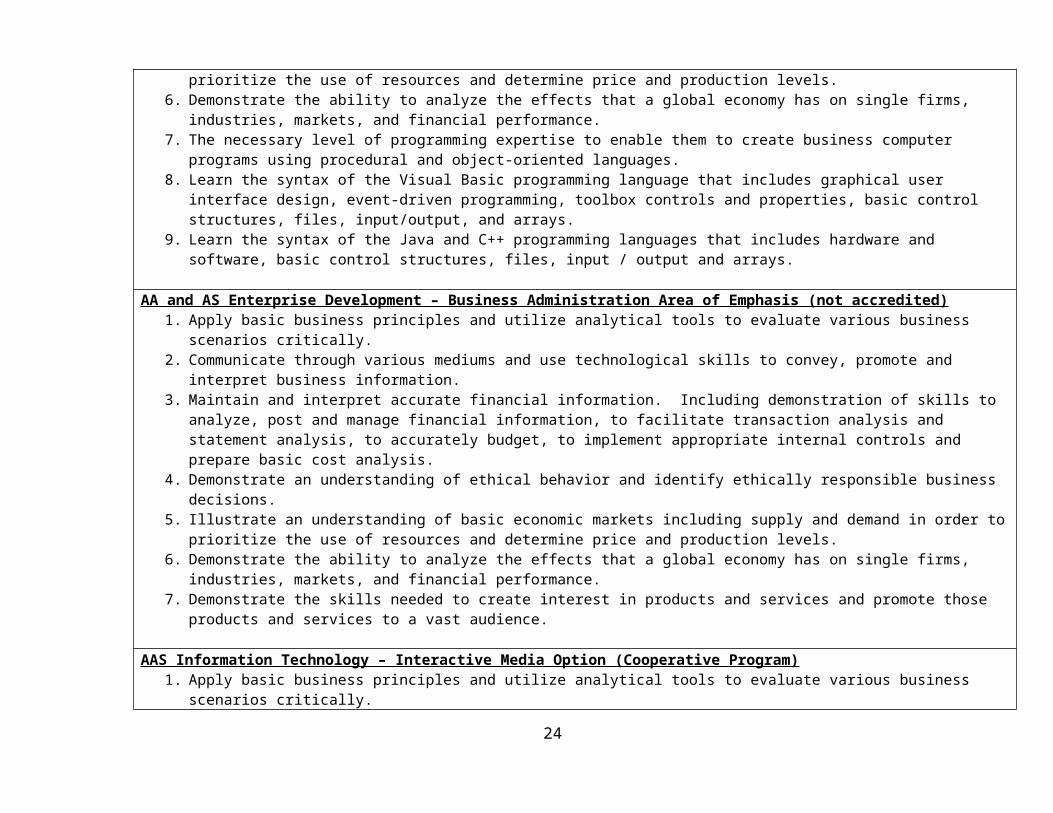
AS Computer Science1. Apply basic business principles and utilize analytical tools to evaluate various business scenarios critically.2. Communicate through various mediums and use technological skills to convey, promote and interpret business information.3. The ability to maintain and interpret accurate financial information. Including the skills to analyze, post and manage financial
information, to facilitate transaction analysis and statement analysis, and to implement appropriate internal controls.4. Demonstrate an understanding of ethical behavior and identify ethically responsible business decisions.5. Illustrate an understanding of basic economic markets including supply and demand in order to prioritize the use of resources
and determine price and production levels.6. Demonstrate the ability to analyze the effects that a global economy has on single firms, industries, markets, and financial
performance.7. The necessary level of programming expertise to enable them to create business computer programs using procedural and
object-oriented languages.8. Learn the syntax of the Visual Basic programming language that includes graphical user interface design, event-driven
programming, toolbox controls and properties, basic control structures, files, input/output, and arrays.9. Learn the syntax of the Java and C++ programming languages that includes hardware and software, basic control structures,
files, input / output and arrays.
AA and AS Enterprise Development – Business Administration Area of Emphasis (not accredited)1. Apply basic business principles and utilize analytical tools to evaluate various business scenarios critically.2. Communicate through various mediums and use technological skills to convey, promote and interpret business information.3. Maintain and interpret accurate financial information. Including demonstration of skills to analyze, post and manage financial
information, to facilitate transaction analysis and statement analysis, to accurately budget, to implement appropriate internal controls and prepare basic cost analysis.
4. Demonstrate an understanding of ethical behavior and identify ethically responsible business decisions.5. Illustrate an understanding of basic economic markets including supply and demand in order to prioritize the use of resources
and determine price and production levels.6. Demonstrate the ability to analyze the effects that a global economy has on single firms, industries, markets, and financial
performance.7. Demonstrate the skills needed to create interest in products and services and promote those products and services to a vast
audience.
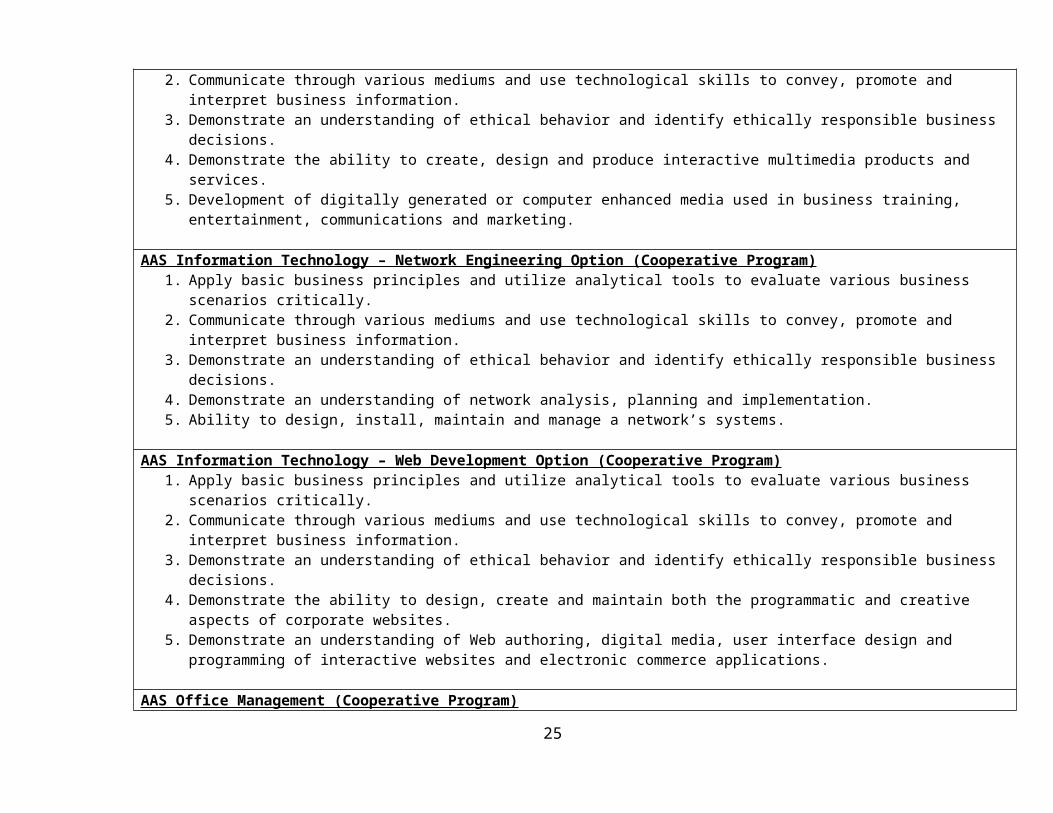
AAS Information Technology – Interactive Media Option (Cooperative Program)1. Apply basic business principles and utilize analytical tools to evaluate various business scenarios critically.2. Communicate through various mediums and use technological skills to convey, promote and interpret business information.3. Demonstrate an understanding of ethical behavior and identify ethically responsible business decisions.4. Demonstrate the ability to create, design and produce interactive multimedia products and services.5. Development of digitally generated or computer enhanced media used in business training, entertainment, communications
and marketing.
14
AAS Information Technology – Network Engineering Option (Cooperative Program)1. Apply basic business principles and utilize analytical tools to evaluate various business scenarios critically.2. Communicate through various mediums and use technological skills to convey, promote and interpret business information.3. Demonstrate an understanding of ethical behavior and identify ethically responsible business decisions.4. Demonstrate an understanding of network analysis, planning and implementation.5. Ability to design, install, maintain and manage a network’s systems.
AAS Information Technology – Web Development Option (Cooperative Program)1. Apply basic business principles and utilize analytical tools to evaluate various business scenarios critically.2. Communicate through various mediums and use technological skills to convey, promote and interpret business information.3. Demonstrate an understanding of ethical behavior and identify ethically responsible business decisions.4. Demonstrate the ability to design, create and maintain both the programmatic and creative aspects of corporate websites.5. Demonstrate an understanding of Web authoring, digital media, user interface design and programming of interactive websites
and electronic commerce applications.
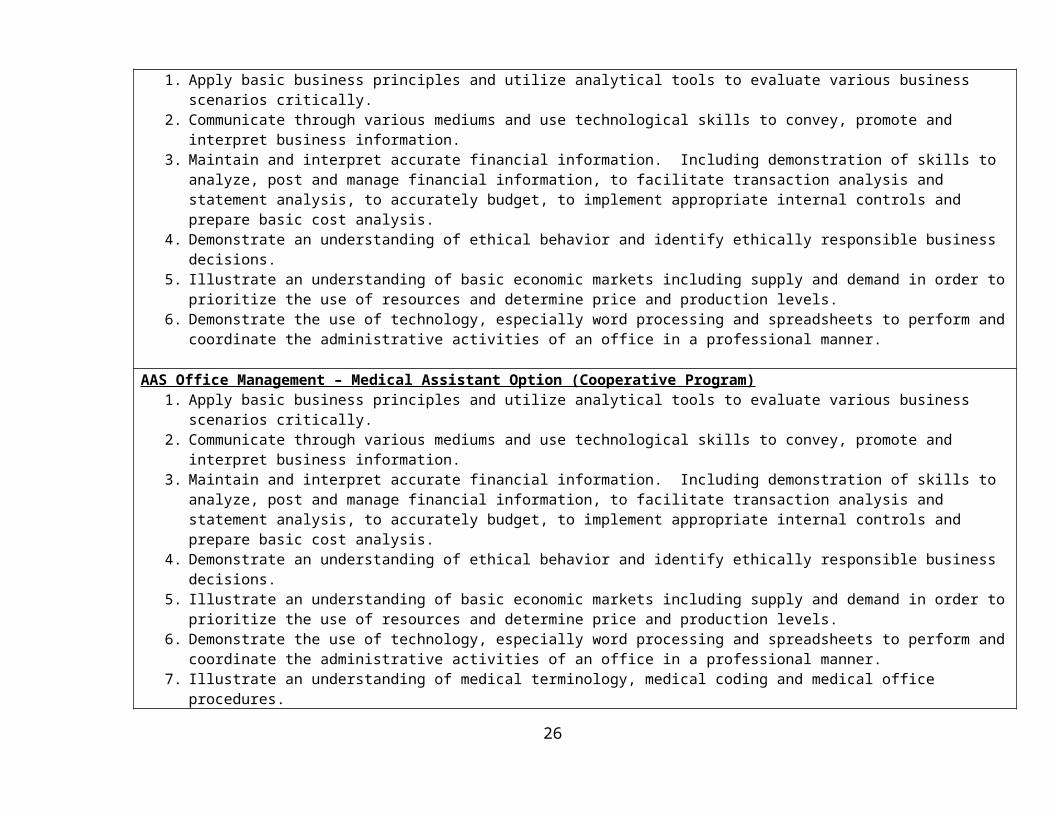
AAS Office Management (Cooperative Program)1. Apply basic business principles and utilize analytical tools to evaluate various business scenarios critically.2. Communicate through various mediums and use technological skills to convey, promote and interpret business information.3. Maintain and interpret accurate financial information. Including demonstration of skills to analyze, post and manage financial
information, to facilitate transaction analysis and statement analysis, to accurately budget, to implement appropriate internal controls and prepare basic cost analysis.
4. Demonstrate an understanding of ethical behavior and identify ethically responsible business decisions.5. Illustrate an understanding of basic economic markets including supply and demand in order to prioritize the use of resources
and determine price and production levels.6. Demonstrate the use of technology, especially word processing and spreadsheets to perform and coordinate the administrative
activities of an office in a professional manner.
AAS Office Management – Medical Assistant Option (Cooperative Program)1. Apply basic business principles and utilize analytical tools to evaluate various business scenarios critically.2. Communicate through various mediums and use technological skills to convey, promote and interpret business information.3. Maintain and interpret accurate financial information. Including demonstration of skills to analyze, post and manage financial
information, to facilitate transaction analysis and statement analysis, to accurately budget, to implement appropriate internal controls and prepare basic cost analysis.
4. Demonstrate an understanding of ethical behavior and identify ethically responsible business decisions.5. Illustrate an understanding of basic economic markets including supply and demand in order to prioritize the use of resources
and determine price and production levels.6. Demonstrate the use of technology, especially word processing and spreadsheets to perform and coordinate the administrative
activities of an office in a professional manner.7. Illustrate an understanding of medical terminology, medical coding and medical office procedures.
15

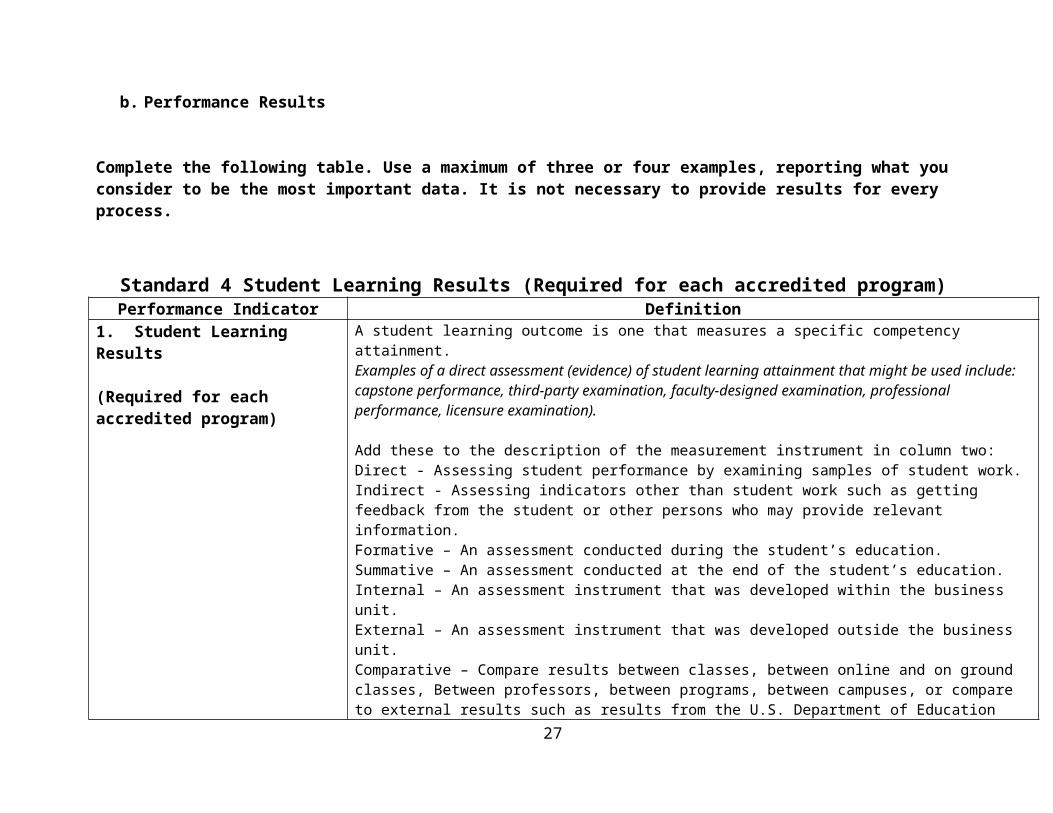
b. Performance Results
Complete the following table. Use a maximum of three or four examples, reporting what you consider to be the most important data. It is not necessary to provide results for every process.
Standard 4 Student Learning Results (Required for each accredited program)Performance Indicator Definition
1. Student Learning Results
(Required for each accredited program)
A student learning outcome is one that measures a specific competency attainment. Examples of a direct assessment (evidence) of student learning attainment that might be used include: capstone performance, third-party examination, faculty-designed examination, professional performance, licensure examination).
Add these to the description of the measurement instrument in column two:Direct - Assessing student performance by examining samples of student work.Indirect - Assessing indicators other than student work such as getting feedback from the student or other persons who may provide relevant information.Formative – An assessment conducted during the student’s education.Summative – An assessment conducted at the end of the student’s education.Internal – An assessment instrument that was developed within the business unit.External – An assessment instrument that was developed outside the business unit.Comparative – Compare results between classes, between online and on ground classes, Between professors, between programs, between campuses, or compare to external results such as results from the U.S. Department of Education Research and Statistics, or results from a vendor providing comparable data.
16

Analysis of ResultsPerformance
Measure (Competency)
Description of Measurement
Instrument
Areas of Success (results)
Analysis and Action Taken
(improvement)
Results of Action Taken (occurs in the following year)
Insert Graphs or Tables of Resulting Trends for 3-5 Years (please graph all
available data up to five years)
Computer Proficiency:Exit score on common comprehensive final exam. Target score: 70% or better.
(Summative, Internal) Faculty developed final exam given to computer concepts students each semester to determine computer proficiency in Word, Excel, Access, PowerPoint and integrating the four applications.
Averages from a sampling of sections of the computer concepts course indicates final exam averages for the 2007-08 and 2008-09 academic years were met the 70% or better target.
Based on our findings, the benchmark of 70% or better has been exceeded since the test was developed in Fall 2008. The test was reevaluated and adjusted to include a slightly higher level of difficulty. In Spring 2010.
Continue monitoring ongoing progress each semester to see if any other adjustments are necessary to the curriculum.
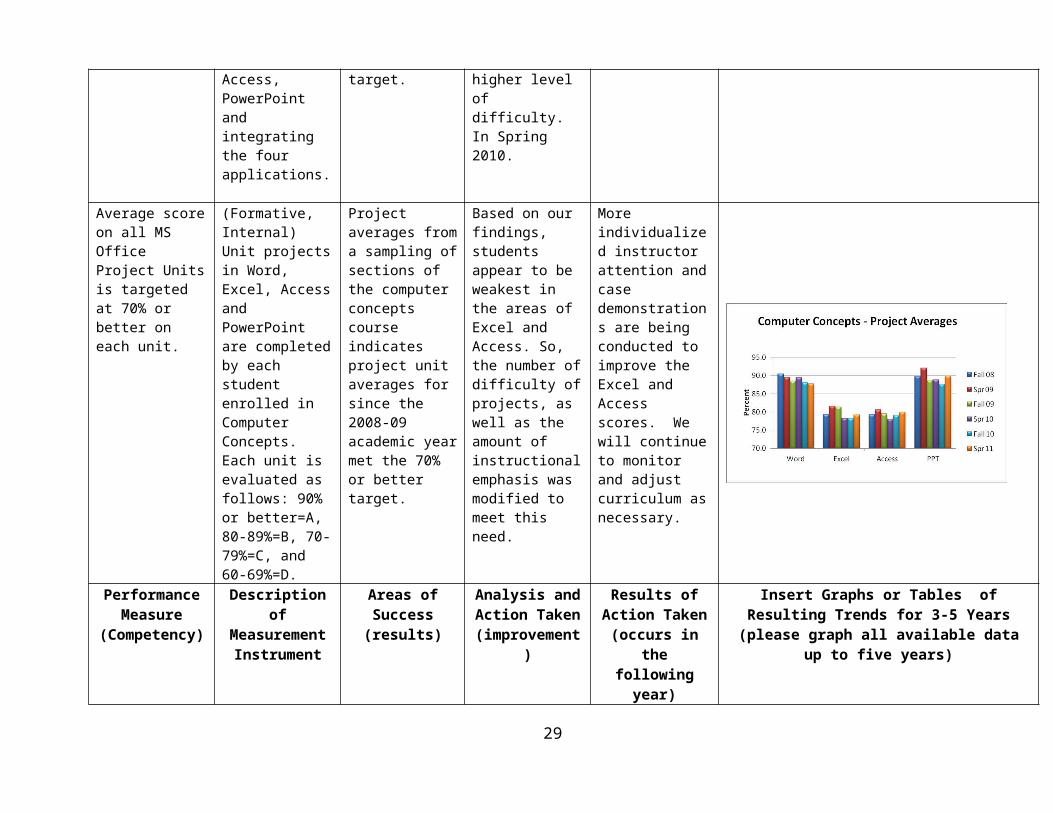
Average score on all MS Office Project Units is targeted at 70% or better on each unit.
(Formative, Internal) Unit projects in Word, Excel, Access and PowerPoint are completed by each student enrolled in Computer Concepts. Each unit is evaluated as follows: 90% or better=A, 80-89%=B, 70-79%=C, and 60-69%=D.
Project averages from a sampling of sections of the computer concepts course indicates project unit averages for since the 2008-09 academic year met the 70% or better target.
Based on our findings, students appear to be weakest in the areas of Excel and Access. So, the number of difficulty of projects, as well as the amount of instructional emphasis was modified to meet this need.
More individualized instructor attention and case demonstrations are being conducted to improve the Excel and Access scores. We will continue to monitor and adjust curriculum as necessary.
17

Performance Measure
(Competency)
Description of Measurement
Instrument
Areas of Success (results)
Analysis and Action Taken
(improvement)
Results of Action Taken (occurs in the following year)
Insert Graphs or Tables of Resulting Trends for 3-5 Years (please graph all
available data up to five years)
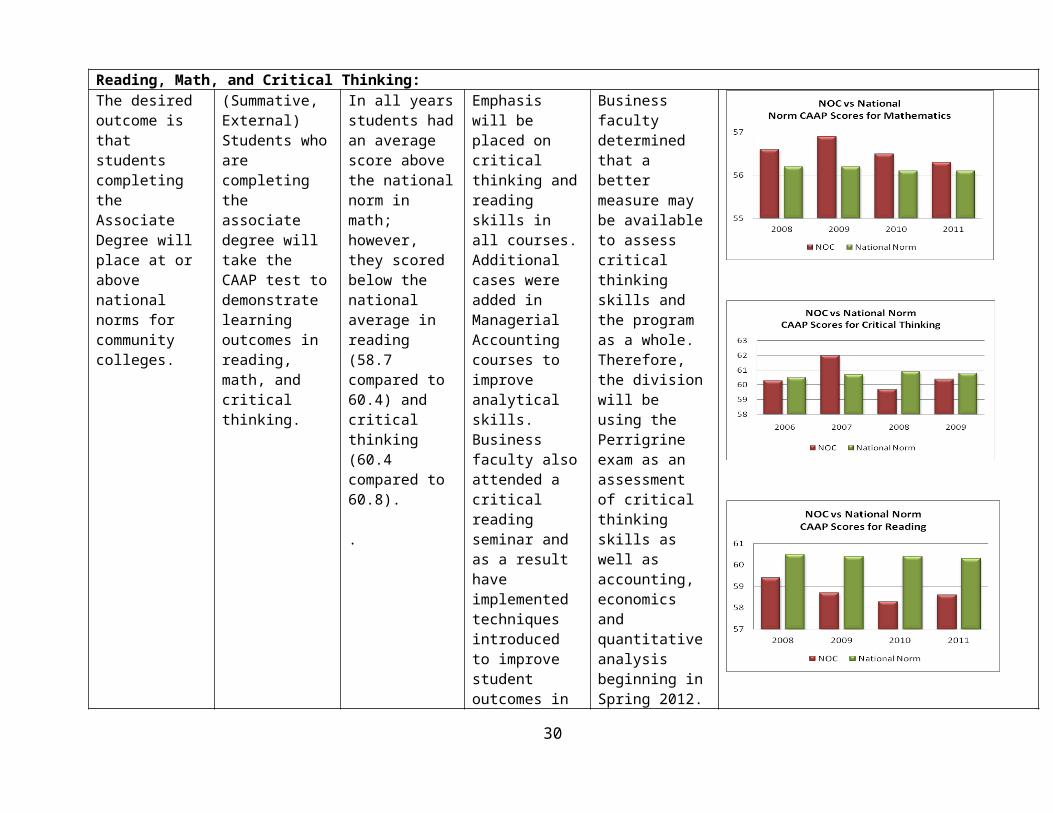
Reading, Math, and Critical Thinking:The desired outcome is that students completing the Associate Degree will place at or above national norms for community colleges.
(Summative, External)Students who are completing the associate degree will take the CAAP test to demonstrate learning outcomes in reading, math, and critical thinking.
In all years students had an average score above the national norm in math; however, they scored below the national average in reading (58.7 compared to 60.4) and critical thinking (60.4 compared to 60.8).
.
Emphasis will be placed on critical thinking and reading skills in all courses. Additional cases were added in Managerial Accounting courses to improve analytical skills. Business faculty also attended a critical reading seminar and as a result have implemented techniques introduced to improve student outcomes in these areas. Also, institutionally, cut scores for remedial reading courses were evaluated and lowered to meet the needs of the current population of students.
Business faculty determined that a better measure may be available to assess critical thinking skills and the program as a whole. Therefore, the division will be using the Perrigrine exam as an assessment of critical thinking skills as well as accounting, economics and quantitative analysis beginning in Spring 2012. This exam will be a significant cost savings for the institution over use of the CAAP test and will provide the division with more business related feedback.
18
Performance Measure
(Competency)
Description of Measurement
Instrument
Areas of Success (results)
Analysis and Action Taken
(improvement)
Results of Action Taken (occurs in the following year)
Insert Graphs or Tables of Resulting Trends for 3-5 Years (please graph all
available data up to five years)
Graduation Competency:Students will demonstrate proficiency in all coursework required for the degree by completing their degree programs with a cumulative GPA of 2.0 or above on a 4.0 scale.
(Formative, internal)A degree audit is completed by the business advisor in the student’s final semester prior to graduation to determine that all coursework is completed and the cumulative GPA to the date of the audit is 2.0 or above. Upon final completion of the degree, the audit is verified by the registrar before the degree is awarded.
All students who are awarded the associate degree have met the GPA requirement.
Continuous monitoring of business majors to be sure that all coursework is completed with a 2.0 (C) average or better.
Based on the fact that students DO NOT graduate without the 2.0 cumulative GPA as verified by both the business unit advisor and the Northern Oklahoma College registrar, results are 100% of all students who receive the associate degree will have met the GPA requirement.-
Performance Description of Areas of Analysis and Results of Insert Graphs or Tables of Resulting 19
Measure (Competency)
Measurement Instrument
Success (results)
Action Taken (improvement)
Action Taken (occurs in the following year)
Trends for 3-5 Years (please graph all available data up to five years)
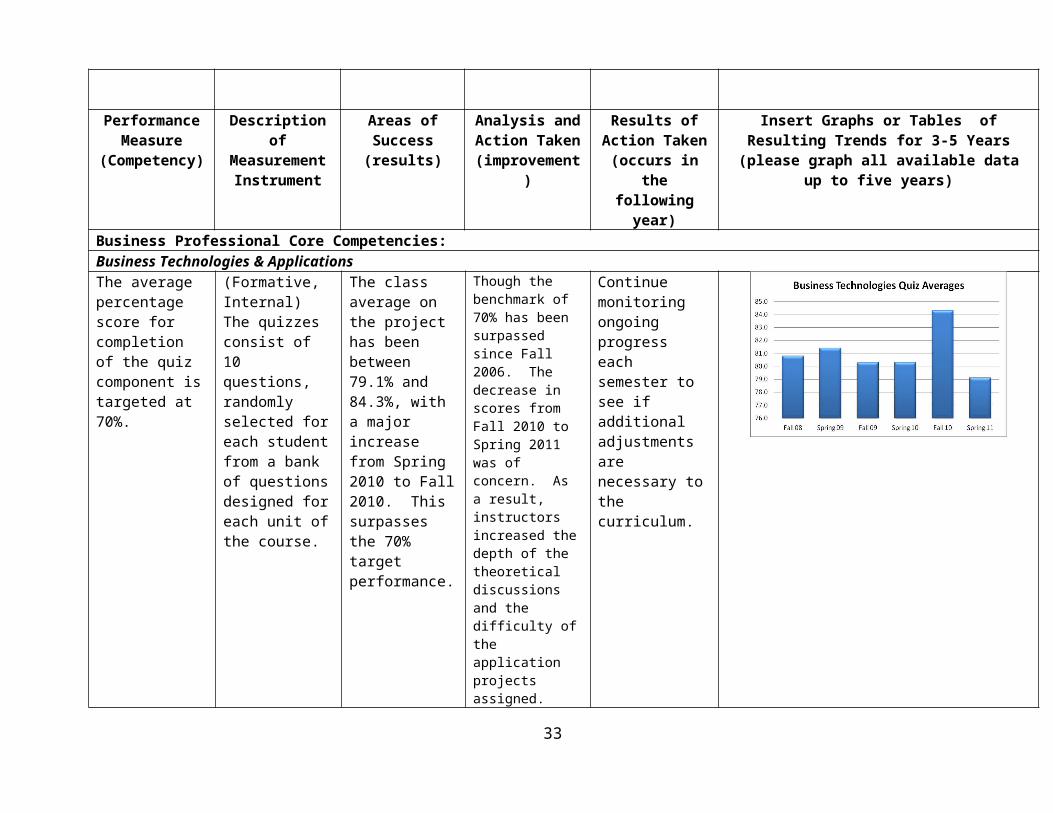
Business Professional Core Competencies:Business Technologies & ApplicationsThe average percentage score for completion of the quiz component is targeted at 70%.
(Formative, Internal)The quizzes consist of 10 questions, randomly selected for each student from a bank of questions designed for each unit of the course.
The class average on the project has been between 79.1% and 84.3%, with a major increase from Spring 2010 to Fall 2010. This surpasses the 70% target performance.
Though the benchmark of 70% has been surpassed since Fall 2006. The decrease in scores from Fall 2010 to Spring 2011 was of concern. As a result, instructors increased the depth of the theoretical discussions and the difficulty of the application projects assigned.
Continue monitoring ongoing progress each semester to see if additional adjustments are necessary to the curriculum.
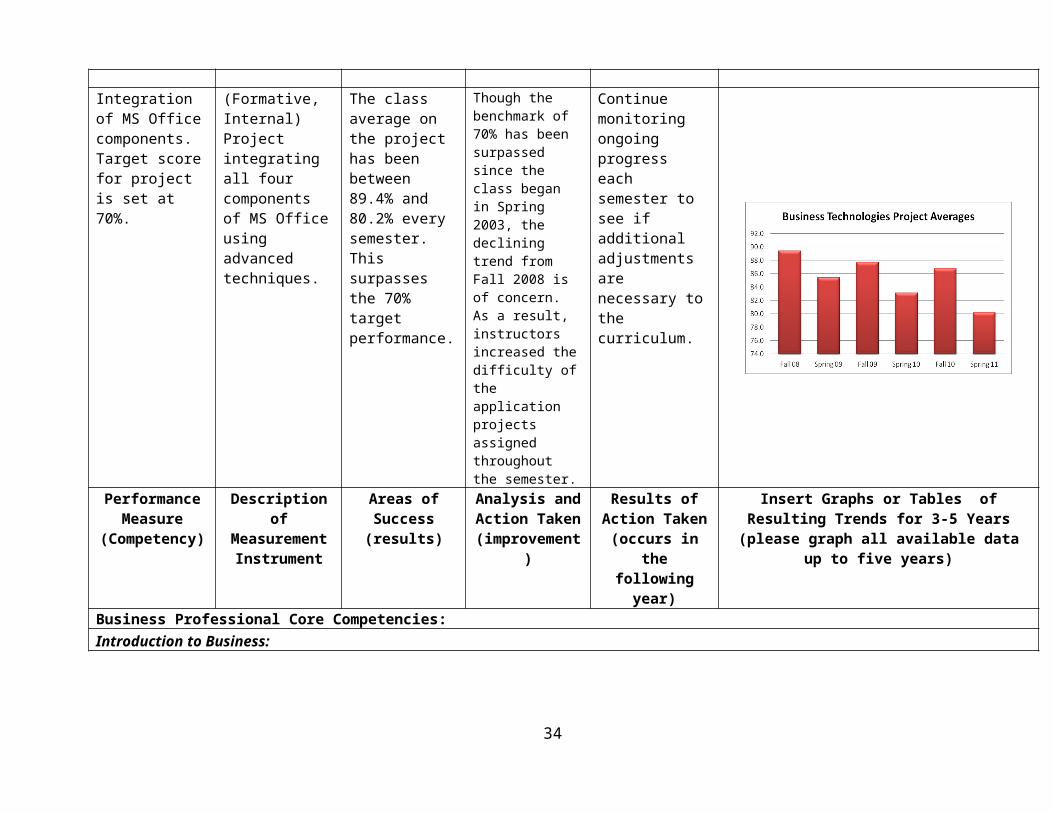
Integration of MS Office components. Target score for project is set at 70%.
(Formative, Internal)Project integrating all four components of MS Office using advanced techniques.
The class average on the project has been between 89.4% and 80.2% every semester. This surpasses the 70% target performance.
Though the benchmark of 70% has been surpassed since the class began in Spring 2003, the declining trend from Fall 2008 is of concern. As a result, instructors increased the difficulty of the application projects assigned throughout the semester.
Continue monitoring ongoing progress each semester to see if additional adjustments are necessary to the curriculum.
Performance Description of Areas of Analysis and Results of Insert Graphs or Tables of Resulting
20

Measure (Competency)
Measurement Instrument
Success (results)
Action Taken (improvement)
Action Taken (occurs in the following year)
Trends for 3-5 Years (please graph all available data up to five years)
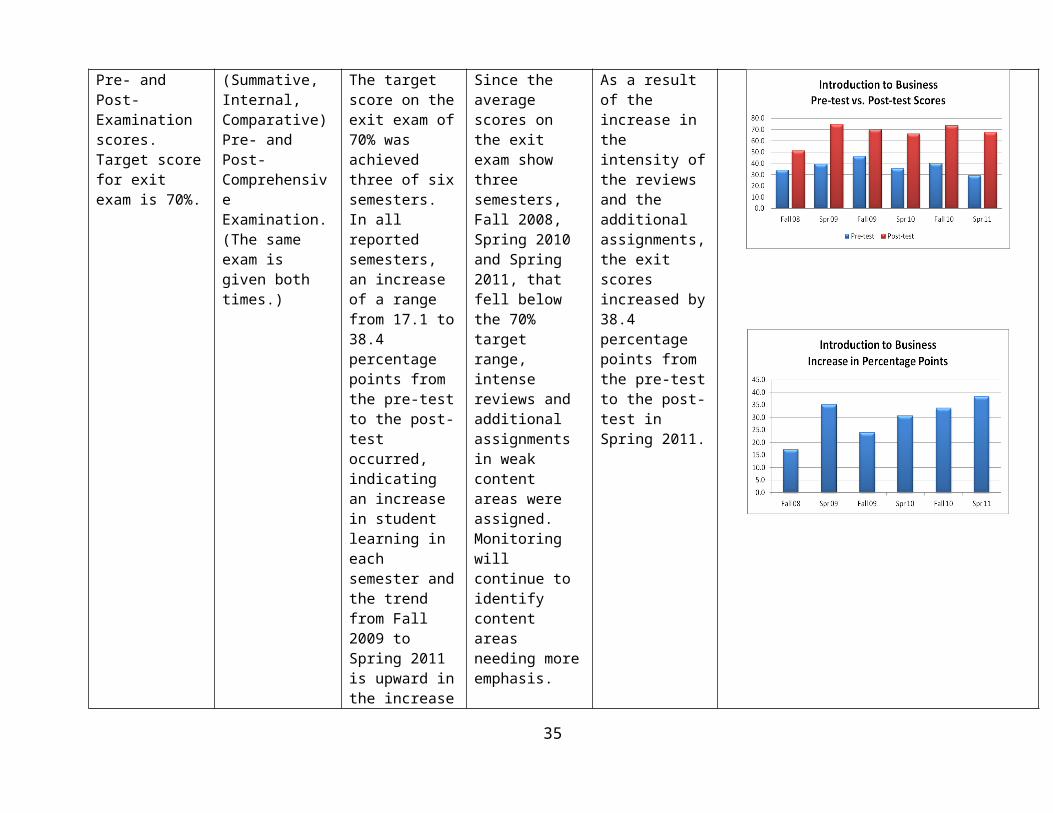
Business Professional Core Competencies:Introduction to Business:Pre- and Post-Examination scores. Target score for exit exam is 70%.
(Summative, Internal, Comparative)Pre- and Post-Comprehensive Examination. (The same exam is given both times.)
The target score on the exit exam of 70% was achieved three of six semesters. In all reported semesters, an increase of a range from 17.1 to 38.4 percentage points from the pre-test to the post-test occurred, indicating an increase in student learning in each semester and the trend from Fall 2009 to Spring 2011 is upward in the increase in scores.
Since the average scores on the exit exam show three semesters, Fall 2008, Spring 2010 and Spring 2011, that fell below the 70% target range, intense reviews and additional assignments in weak content areas were assigned. Monitoring will continue to identify content areas needing more emphasis.
As a result of the increase in the intensity of the reviews and the additional assignments, the exit scores increased by 38.4 percentage points from the pre-test to the post-test in Spring 2011.
Performance Description of Areas of Analysis and Results of Insert Graphs or Tables of Resulting
21
Measure (Competency)
Measurement Instrument
Success (results)
Action Taken (improvement)
Action Taken (occurs in the following year)
Trends for 3-5 Years (please graph all available data up to five years)
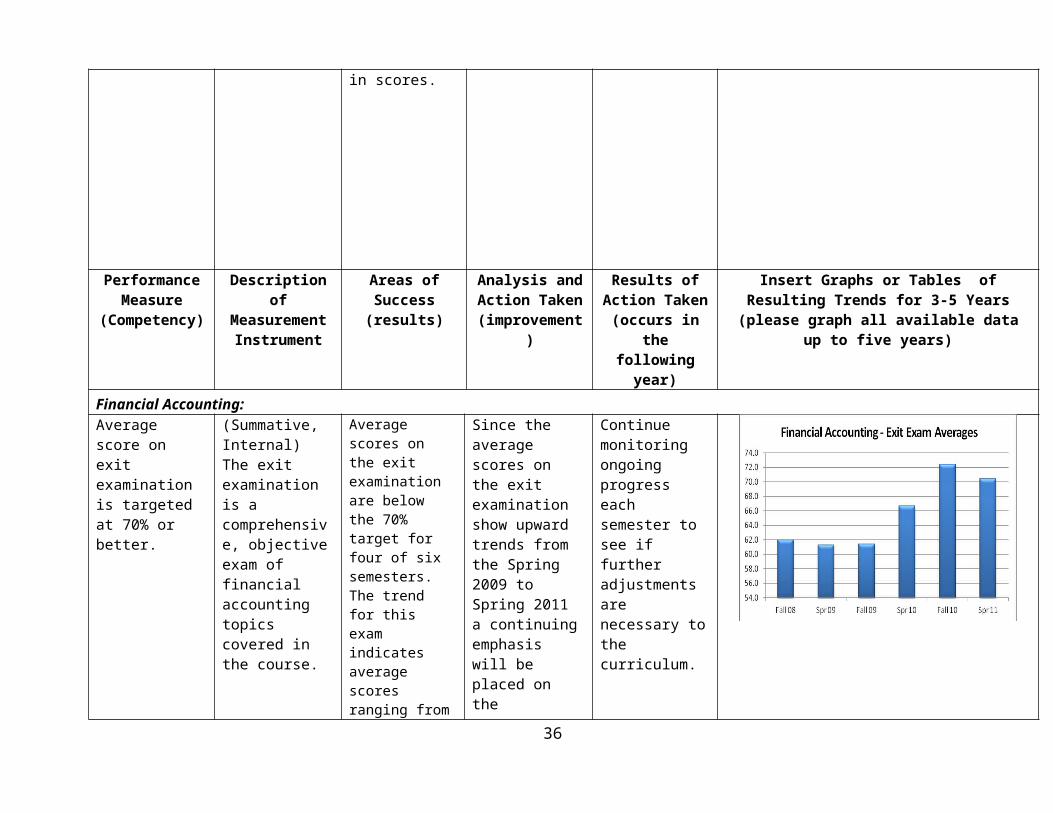
Financial Accounting:Average score on exit examination is targeted at 70% or better.
(Summative, Internal)The exit examination is a comprehensive, objective exam of financial accounting topics covered in the course.
Average scores on the exit examination are below the 70% target for four of six semesters. The trend for this exam indicates average scores ranging from 61.3% - 72.4%. The target score was achieved in both Fall 2010 and Spring 2011 and overall the trend is moving in a positive direction.
Since the average scores on the exit examination show upward trends from the Spring 2009 to Spring 2011 a continuing emphasis will be placed on the conceptual content areas needing improvement.
Continue monitoring ongoing progress each semester to see if further adjustments are necessary to the curriculum.
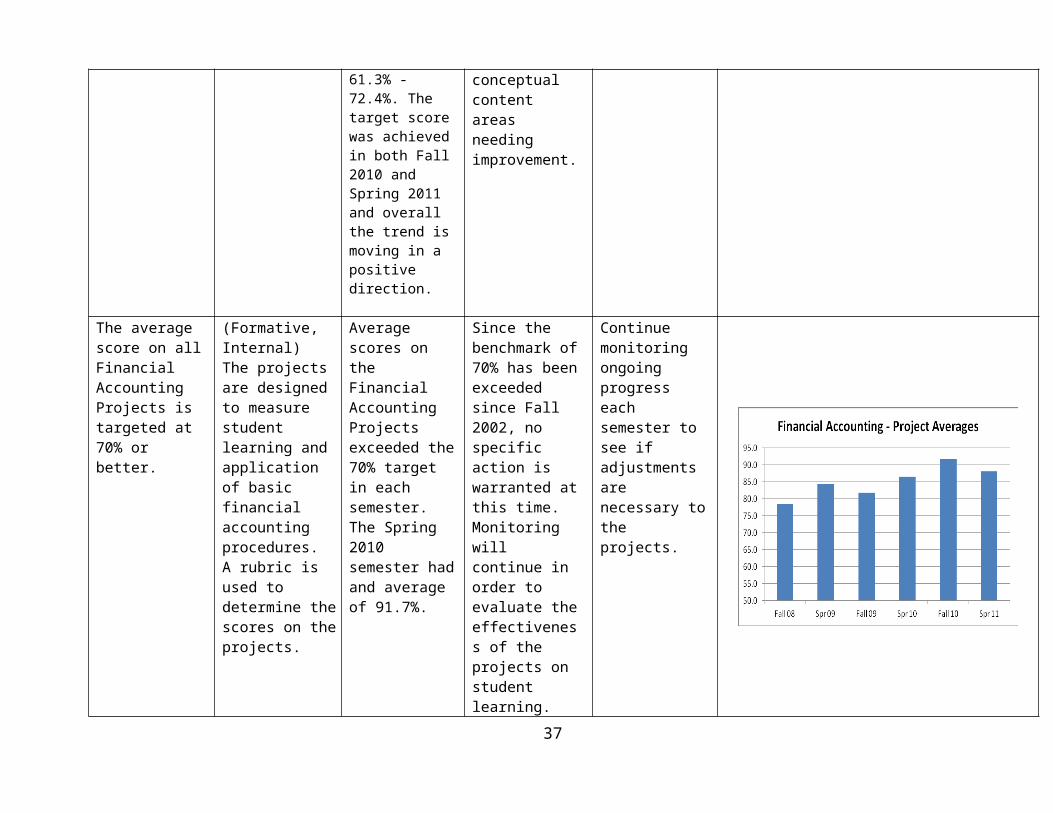
The average score on all Financial Accounting Projects is targeted at 70% or better.
(Formative, Internal)The projects are designed to measure student learning and application of basic financial accounting procedures. A rubric is used to determine the scores on the projects.
Average scores on the Financial Accounting Projects exceeded the 70% target in each semester. The Spring 2010 semester had and average of 91.7%.
Since the benchmark of 70% has been exceeded since Fall 2002, no specific action is warranted at this time. Monitoring will continue in order to evaluate the effectiveness of the projects on student learning.
Continue monitoring ongoing progress each semester to see if adjustments are necessary to the projects.
Performance Description of Areas of Analysis and Results of Insert Graphs or Tables of Resulting
22
Measure (Competency)
Measurement Instrument
Success (results)
Action Taken (improvement)
Action Taken (occurs in the following year)
Trends for 3-5 Years (please graph all available data up to five years)
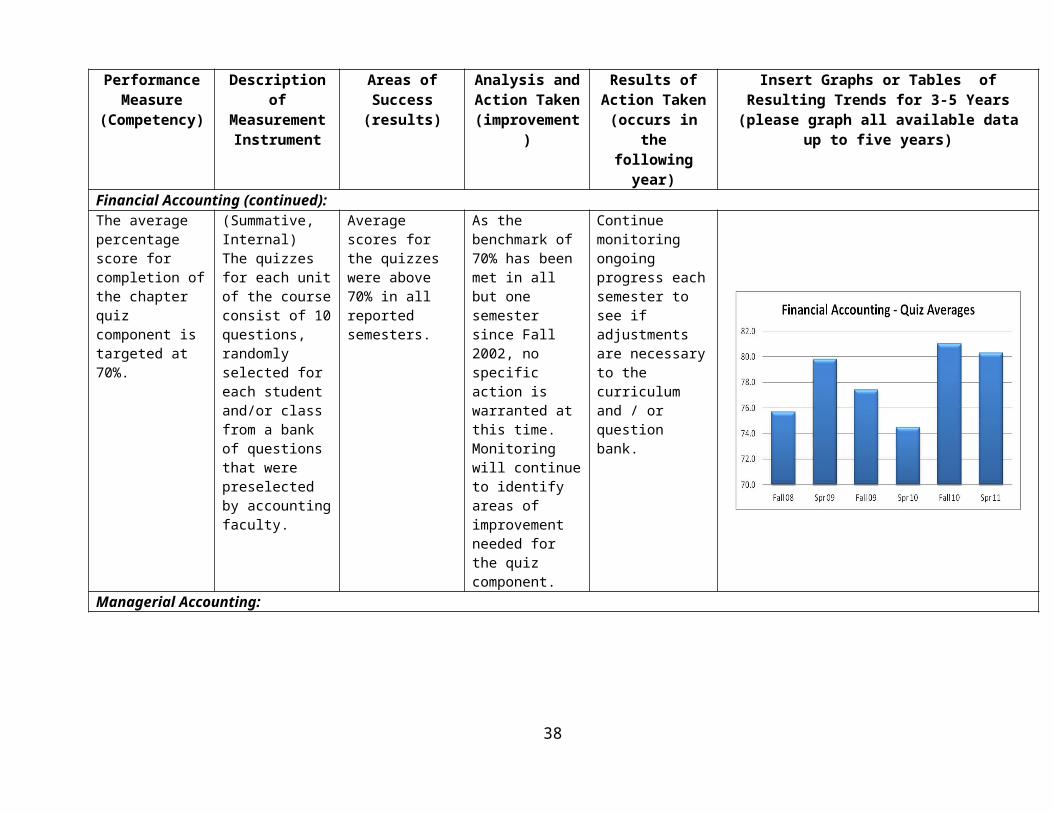
Financial Accounting (continued):The average percentage score for completion of the chapter quiz component is targeted at 70%.
(Summative, Internal)The quizzes for each unit of the course consist of 10 questions, randomly selected for each student and/or class from a bank of questions that were preselected by accounting faculty.
Average scores for the quizzes were above 70% in all reported semesters.
As the benchmark of 70% has been met in all but one semester since Fall 2002, no specific action is warranted at this time. Monitoring will continue to identify areas of improvement needed for the quiz component.
Continue monitoring ongoing progress each semester to see if adjustments are necessary to the curriculum and / or question bank.
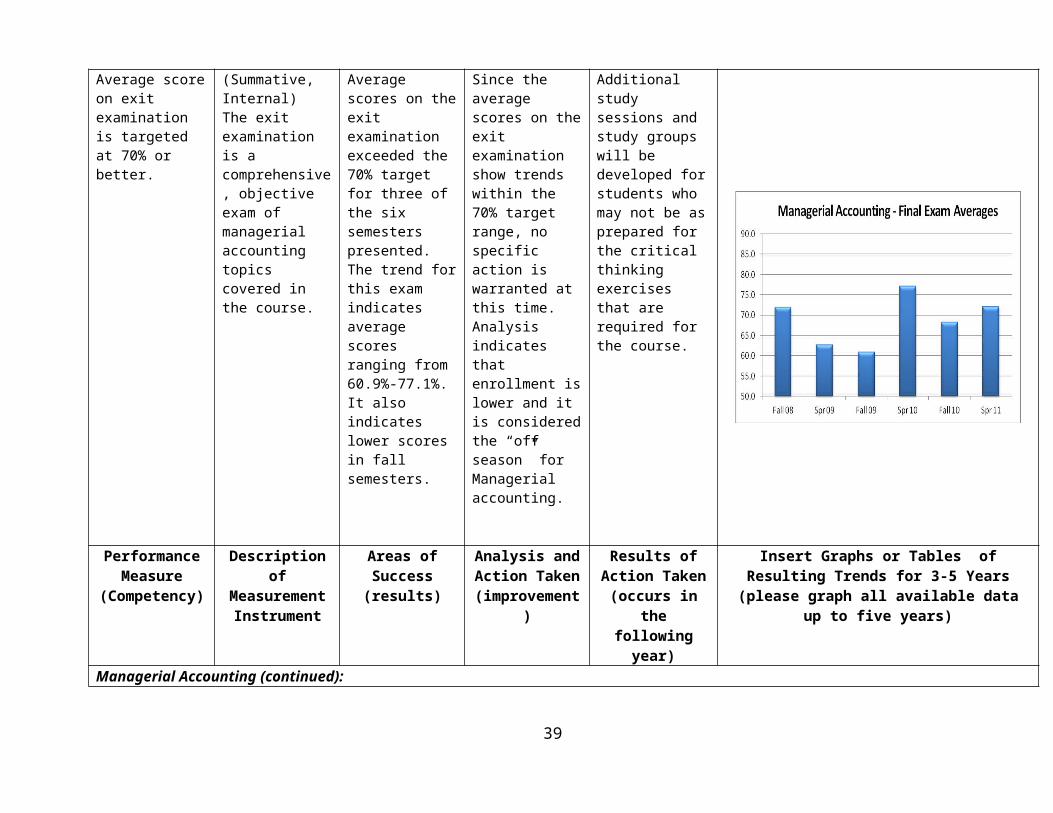
Managerial Accounting:Average score on exit examination is targeted at 70% or better.
(Summative, Internal)The exit examination is a comprehensive, objective exam of managerial accounting topics covered in the course.
Average scores on the exit examination exceeded the 70% target for three of the six semesters presented. The trend for this exam indicates average scores ranging from 60.9%-77.1%. It also indicates lower scores in fall semesters.
Since the average scores on the exit examination show trends within the 70% target range, no specific action is warranted at this time. Analysis indicates that enrollment is lower and it is considered the “off season” for Managerial accounting.
Additional study sessions and study groups will be developed for students who may not be as prepared for the critical thinking exercises that are required for the course.
Performance Measure
Description of Measurement
Areas of Success
Analysis and Action Taken
Results of Action Taken
Insert Graphs or Tables of Resulting Trends for 3-5 Years (please graph all
23
(Competency) Instrument (results) (improvement) (occurs in the following year)
available data up to five years)
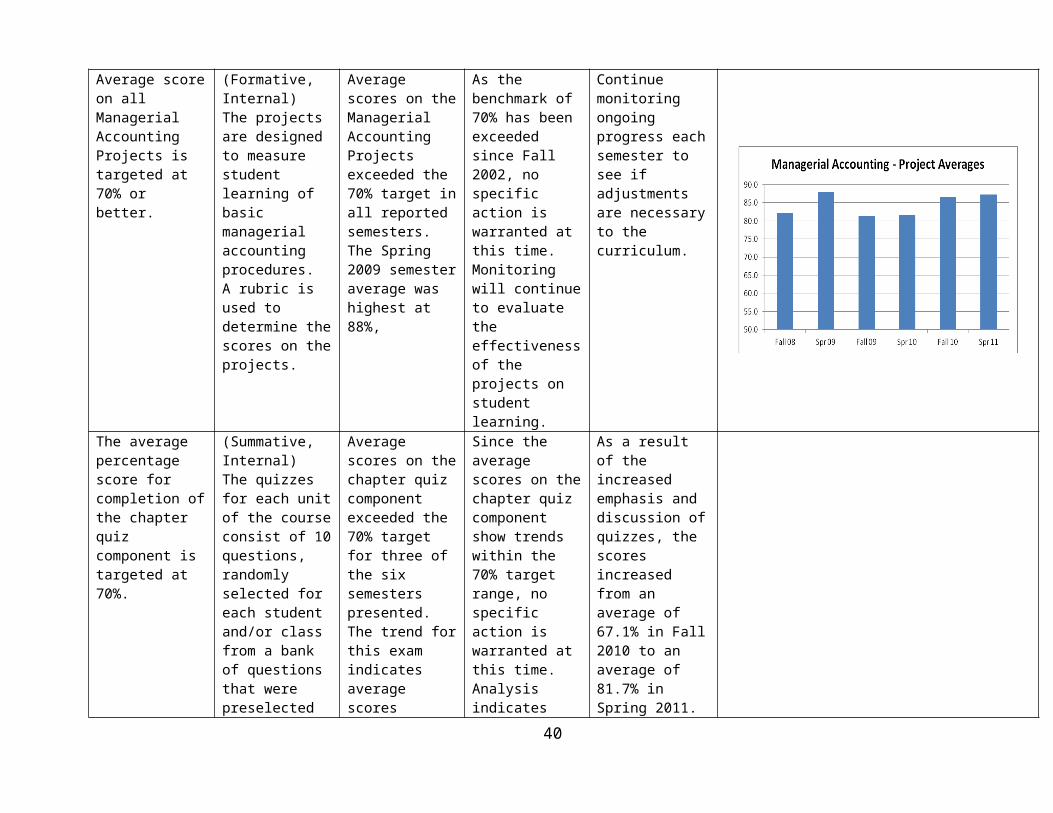
Managerial Accounting (continued):Average score on all Managerial Accounting Projects is targeted at 70% or better.
(Formative, Internal)The projects are designed to measure student learning of basic managerial accounting procedures. A rubric is used to determine the scores on the projects.
Average scores on the Managerial Accounting Projects exceeded the 70% target in all reported semesters. The Spring 2009 semester average was highest at 88%,
As the benchmark of 70% has been exceeded since Fall 2002, no specific action is warranted at this time. Monitoring will continue to evaluate the effectiveness of the projects on student learning.
Continue monitoring ongoing progress each semester to see if adjustments are necessary to the curriculum.
The average percentage score for completion of the chapter quiz component is targeted at 70%.
(Summative, Internal)The quizzes for each unit of the course consist of 10 questions, randomly selected for each student and/or class from a bank of questions that were preselected by accounting faculty.
Average scores on the chapter quiz component exceeded the 70% target for three of the six semesters presented. The trend for this exam indicates average scores ranging from 64.0%-81.7%. It also indicates lower scores in fall semesters.
Since the average scores on the chapter quiz component show trends within the 70% target range, no specific action is warranted at this time. Analysis indicates that enrollment is lower and it is considered the “off season” for Managerial accounting.
As a result of the increased emphasis and discussion of quizzes, the scores increased from an average of 67.1% in Fall 2010 to an average of 81.7% in Spring 2011. Continue monitoring and implementation of additional study groups in the fall semesters will be developed in order to better prepare students.
24
Performance Measure
(Competency)
Description of Measurement
Instrument
Areas of Success (results)
Analysis and Action Taken
(improvement)
Results of Action Taken (occurs in the following year)
Insert Graphs or Tables of Resulting Trends for 3-5 Years (please graph all
available data up to five years)
Macroeconomics and Microeconomics:Pre- and Post-Examination, utilizing the College-Level Examination Program® or CLEP practice exams for both Macroeconomics and Microeconomics courses.Target score for exit exam is 70%.
(Summative, External, Comparative)The tests are standardized tests that allow students to demonstrate college-level achievement in undergraduate college courses. CLEP practice tests were utilized as the proficiency assessment tool for bothMacroeconomics and Microeconomics.
The average score for all reported semesters exceeded the 70% benchmark for Macro and all but one for Micro. The trend for this exit exam indicates average scores ranging from 77.8%-81.7% for Macro and percentage point increases from the Pre- to the Post-exam ranged from 47 to 55.6 percentage points.
The trend for the exit exam indicate average scores ranging from 62.2%-86.3% for Micro and percentage point increases from the Pre- to the Post-exam ranged from 26.6 to 54 percentage points.
As the benchmark of 70% has been exceeded for Macroeconomics since Fall 2006, and all semesters except Spring 2011 for Microeconomics, no specific action is warranted at this time. Results do not align with past trends and may be an anomaly.
Continue monitoring ongoing progress each semester to see if trends continue and make necessary adjustments to the curriculum.
25
Performance Measure
(Competency)
Description of Measurement
Instrument
Areas of Success (results)
Analysis and Action Taken
(improvement)
Results of Action Taken (occurs in the following year)
Insert Graphs or Tables of Resulting Trends for 3-5 Years (please graph all
available data up to five years)
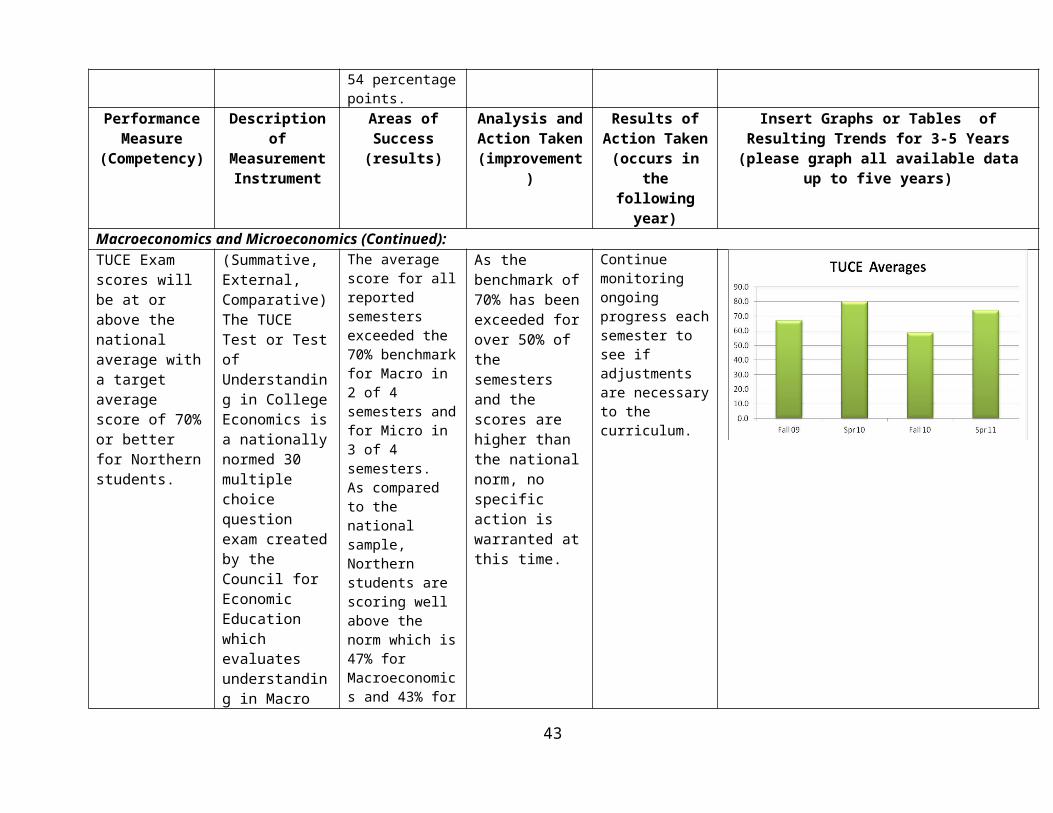
Macroeconomics and Microeconomics (Continued):TUCE Exam scores will be at or above the national average with a target average score of 70% or better for Northern students.
(Summative, External, Comparative) The TUCE Test or Test of Understanding in College Economics is a nationally normed 30 multiple choice question exam created by the Council for Economic Education which evaluates understanding in Macro and Microeconomics.
The average score for all reported semesters exceeded the 70% benchmark for Macro in 2 of 4 semesters and for Micro in 3 of 4 semesters.As compared to the national sample, Northern students are scoring well above the norm which is 47% for Macroeconomics and 43% for Microeconomics.
As the benchmark of 70% has been exceeded for over 50% of the semesters and the scores are higher than the national norm, no specific action is warranted at this time.
Continue monitoring ongoing progress each semester to see if adjustments are necessary to the curriculum.
Computer Science Degree Core Competencies:Visual Basic Programming-- Average scores on all Programming Projects are targeted at 70% or better.
(Formative, Internal)Programs of increasing difficulty that include basic control structures, files, input/output, selection, repetition, and arrays.
The average score for all reported semesters exceeded the 70% benchmark.
As the benchmark of 70% on Visual Basic Projects has been exceeded since Fall 2002, no specific curricular action is warranted at this time.
Continue monitoring ongoing progress each semester to see if adjustments are necessary to the curriculum.
26
Performance Measure
(Competency)
Description of Measurement
Instrument
Areas of Success (results)
Analysis and Action Taken
(improvement)
Results of Action Taken (occurs in the following year)
Insert Graphs or Tables of Resulting Trends for 3-5 Years (please graph all
available data up to five years)
Computer Science Degree Core Competencies (Continued):C++ Programming — Average scores on all Programming Projects is targeted at 70% or better.
(Formative, Internal)Programs of increasing difficulty that include basic control structures, files, input/output, selection, repetition, and arrays.
The average score for all reported semesters exceeded the 70% benchmark.
As the benchmark of 70% on C++ Projects has been exceeded since Spring 2000, no specific curricular action is warranted at this time.
Continue monitoring ongoing progress each semester to see if adjustments are necessary to the curriculum.
Java Programming— Average scores on all Programming Projects is targeted at 70% or better.
(Formative, Internal)Programs of increasing difficulty that include basic control structures, files, input/output, selection, repetition, and arrays.
The average score for all reported semesters exceeded the 70% benchmark.
As the benchmark of 70% on Java Projects has been exceeded since Spring 2004, no specific curricular action is warranted at this time.
Continue monitoring ongoing progress each semester to see if adjustments are necessary to the curriculum.
Standard #5 Faculty and Staff Focus
Complete the following table. Use a maximum of three or four examples, reporting what you consider to be the most important data. It is not necessary to provide results for every process.
27

Standard 5 - Faculty- and Staff-Focused ResultsFaculty and Staff Focused Results Faculty and staff-focused results examine how well the organization creates and maintains a
positive, productive, learning-centered work environment for business faculty and staff.
Key indicators may include: professional development, scholarly activities, community service, administrative duties, business and industry interaction, number of advisees, number of committees, number of theses supervised, satisfaction or dissatisfaction of faculty and staff, positive, productive, and learning-centered environment, safety, absenteeism, turnover, or complaints. Analysis of Results
Performance Measure
(Competency)
Description of Measurement
Instrument
Areas of Success
Analysis and Action Taken
Results of Action Taken (occurs in the following year)
Insert Graphs or Tables of Resulting Trends for 3-5 Years (please graph all
available data up to five years)
The average score for all Business Division full-time faculty members on the “Student Evaluation of Faculty Member” will be 3.0 or better.
Students evaluate faculty members once a semester to provide feedback on the class that was taught. These surveys are provided to administration as well as to the individual faculty member for review and action as necessary. Students are asked to rate the faculty member on a 4-point scale ranging from 4 being superior to 1 being poor.
The average score for all Business Division full-time faculty members on the “Student Evaluation of Faculty Member” has been above 3.0 for the past four years.
(Note: Due to a change in the evaluation rating scale by the institution, data for Spring 2011 is not comparable to prior years’ data for the graph.)
The process will continue. Based on the review, changes will be made if necessary to insure quality and to continuously make improvements to pedagogy.
Results to be analyzed again in the 2011-12 school year.
28
Performance Measure
(Competency)
Description of Measurement
Instrument
Areas of Success
Analysis and Action Taken
Results of Action Taken (occurs in the following year)
Insert Graphs or Tables of Resulting Trends for 3-5 Years (please graph all
available data up to five years)
Faculty and Staff Focused (Continued):100% of all full time faculty members of the Business Division will complete an annual “Faculty Service Report”.
Faculty members are asked to complete a “Faculty Service Report” detailing Institutional Service activities, Professional Development activities, Community Service Activities, and Other College Related Activities that they participated in during the academic year.
100% of Business Division faculty members completed the form indicating a wide variety of institutional service, professional development, and community service activities.
Since many times salary increases tie partially to this report, faculty members are generally willing to submit the necessary information. No further action warranted at this time.
The process will continue to be monitored. Results to be analyzed again in the 2011-12 school year.
Faculty turnover: Employee turnover can be a reflection of employee job satisfaction and commitment to the institution. The Business Division will achieve a low turnover in faculty, less than 15% annually, due to job dissatisfaction.
Annual review of employment status of faculty and staff.
The Business Division has not exceeded the 15% turnover rate in over 10 years.
For the past three years, no turnover in personnel has occurred in the Business Division. Prior to that, the only turnover was a result of the retirement of a long-time faculty member.
The turnover rate will continue to be monitored and the reason for turnover evaluated.
29
Performance Measure
(Competency)
Description of Measurement
Instrument
Areas of Success
Analysis and Action Taken
Results of Action Taken (occurs in the following year)
Insert Graphs or Tables of Resulting Trends for 3-5 Years (please graph all
available data up to five years)
Faculty and Staff Focused (Continued):100% of the Business Division full time faculty members will identify strengths and opportunities for improvement with their self evaluation instrument.
The evaluation instrument is the Self Evaluation of Instructional Performance. The final section of the form provides an area for goals and opportunities for improvement to be listed. The immediate supervisor meets annually with each faculty member to review the evaluations and to discuss/update goals and OFI’s.
In 2008 and 2011 100% of Business Division faculty members submitted goals and opportunities for improvement. Evaluations from the Enid campus were missing for 2009, the supervisor was counseled and improvements have occurred since that time.
Since one-on-one review occurs annually between faculty member and immediate supervisor, these goals and opportunities for improvement are a natural point of discussion and revision. This procedure will continue to be followed and monitored.
The process will continue to be monitored. Results to be analyzed again in the 2011-12 school year.
100% participation by the Business Division full-time faculty in the institutional professional development program.
Results of annual Faculty Development Participation reports indicating participation in the Faculty Professional Development Program which provides a series of at least 4 professional development opportunities annually.
The Business Division met the benchmark of 100% FT faculty participation in 2008 and 2009. Due to a decrease in funding, the program was suspended in 2010. However, in 2010 and 2011, 78% (7 out of 9) voluntarily participated in the program.
Continue to stress the importance of professional development and improvement to both full-time faculty and adjunct faculty. When funds are available a percentage increase to faculty pay is awarded as an incentive to participate.
The process will continue to be monitored. Results to be analyzed again in the 2011-12 school year.
30
Faculty Qualifications
Complete the next two tables for new full-time and part-time faculty members since last self-study or QA report. Do not include faculty members previously reported.
Standard 5 - NEW FULL-TIME AND PART-TIME FACULTY QUALIFICATIONS
NAME (List alphabetically by Last Name)
MAJORTEACHINGFIELD
COURSES TAUGHT(List the Courses TaughtDuring the Reporting Period,Do Not Duplicate Listing)
LIST ALL EARNED DEGREES(State Degree asDocumented onTranscript, Must Include Major Field)
DOCUMENT OTHERPROFESSIONAL CERTIFICATION CRITIERA
Five Years Work Experience
Teaching Excellence
Professional Certifications
ACBSPQUALIFICATION
1. Master's2. Doctorate3. Professional4. Exception
Brown, Julia Computer Applications
Business Technologies &
Applications
AAS Information Technology Network
EngineeringBAAS Technical
Management
18 hours of college credit above the introductory principles level:ECOM 2013 & ECOM 3113 Web Programming I & IICMSC 3003 Data Mgmt SysMIS4413 Mgmt Info Systms ECOM4113 Grphc Dev ToolECOM 4133 Digital PhotographyCCNAA+ Certified Professional IT TechnicianMicrosoft Cert. ProfessionalComp TIA Security +
Professional
Coombs, Aaron Marketing Principles of Marketing BS Marketing Exception
Dolezal, JohnBusiness
AdministrationEconomics
Introduction to Business
Business EthicsMicroeconomicsMacroeconomics
BS General AdministrationMS Business
Education
Master’s
31
NAME (List alphabetically by Last Name)
MAJORTEACHINGFIELD
COURSES TAUGHT(List the Courses TaughtDuring the Reporting Period,Do Not Duplicate Listing)
LIST ALL EARNED DEGREES(State Degree asDocumented onTranscript, Must Include Major Field)
DOCUMENT OTHERPROFESSIONAL CERTIFICATION CRITIERA
Five Years Work Experience
Teaching Excellence
Professional Certifications
ACBSPQUALIFICATION
1. Master's2. Doctorate3. Professional4. Exception
Friesen, Harold Economics Macroeconomics
BS Secondary Ed Social StudiesMA Economics
Ed.D Business Ed
Doctorate
Humphries, Alexa Marketing Principles of
MarketingBA Business Admin
MBA Finance Master’s
Stewart, Leslie Accounting Managerial Accounting BS Accounting
18 hours of college credit above the introductory principles level:ACCT 3133 Income Tax AcctgACCT 3153 Cost Acctg IACCT 3013 Intermed Acctg IACCT 3113 Intermed Acctg II ACCT 3143 Adv Income Tax ACCT 3163 Cost Acctg II
In field professional employment 20+ years
Professional
Storm, Chris Economics Microeconomics
BS Geography, minor Economics
MS Geography, minor Econ & Urban
Development
Master’s
Sullivan, Amy AccountingFinancial and Managerial Accounting
BBA Accounting MBA Accounting
EmphasisMaster’s
Tibbetts, Price Economics Macroeconomics BS EconomicsMS Economics Master’s
32
Standard #6 Educational and Business Process Management
a. Curriculum
1. List any existing accredited degree programs/curricula that have been substantially revised since your last report and attach an updated Table 6 Curriculum Summary from Criterion 6.2 Professional Component, Criterion 6.3 General Education Component, and Criterion 6.4 Business Major Component.
No substantial revisions have been made to existing programs.
2. List any new degree programs that have been developed since your last report and attach a Table 6 Curriculum Summary from Criterion 6.2 Professional Component, Criterion 6.3 General Education Component, and Criterion 6.4 Business Major Component.
AAS Business Management – Accounting OptionAAS Business Management – Entrepreneurship OptionAS Enterprise Development – Business Administration Area of EmphasisAA Enterprise Development – Business Administration Area of Emphasis
3. List any accredited programs that have been terminated since your last report.
No accredited programs have been terminated since the last report.
33
34
35
36
37
Complete the following table. Use a maximum of three or four examples, reporting what you consider to be the most important data. It is not necessary to provide results for every process.
Standard 6 - Budgetary, Financial, and Market ResultsBudgetary, Financial, and Market Performance Results
Budgetary, financial, and market performance results examine (1) management and use of financial resources and (2) market challenges and opportunities. Adequate financial resources are vital to ensuring an outstanding faculty and teaching environment. The resources budgeted for and allocated to business units should be adequate to fund the necessary technology and training to allow students to develop the requisite competencies for business environments.Key indicators may include: expenditures per business student, business program expenditures as a percentage of budget, annual business unit budget increases or decreases, enrollment increase or decrease of business students, transfer in or out of business students, student credit hour production, or comparative data.
Analysis of ResultsPerformance
Measure (Competency)
Description of Measurement
Instrument
Areas of Success
Analysis and Action Taken
Results of Action Taken (occurs in the
following year)
Insert Graphs or Tables of Resulting Trends for 3-5 Years
(please graph all available data up to five years)
The Business Division budget will be proportional to the institution budget based on credit hours generation percentages.
The measurement will be a comparison between the percentages of institutional credit hours generated by the Business Division compared to the percentage of institutional budget the Business Division is allocated.
For the past five academic years, the Business Division has generated an average of 11.4% of the institutional credit hours and received an average of 7.3% of the instructional budget over the same 5 year period.
Due to state and national budgetary constraints, no additional funding has been provided to the business division.
The amount of funds will be monitored closely. The current budget appears to be sufficient to achieve departmental goals.
38
Performance Measure
(Competency)
Description of Measurement
Instrument
Areas of Success
Analysis and Action Taken
Results of Action Taken (occurs in the following year)
Insert Graphs or Tables of Resulting Trends for 3-5 Years (please graph all
available data up to five years)
The business division will grow at a rate equal to or better than the institution’s overall growth rate.
The measurement instrument is number of credit hours generated.
Credit hours generated by the business division decreased slightly in 2007-08, but then rebounded in 2008-09 and saw a dramatic increase in 2009-10, which was an unusual growth caused by a change in the reporting of credit hours generated by cooperative agreement partners. With the exception of that unusual 2009-10 year, Business Division and has not kept up with institutional growth.
A significant increase in credit hours has occurred since the 2006-07 academic year due largely to the offering of business courses on the Stillwater campus. As a result, the Business Division is requesting a new full-time faculty member for the 2012-13 school year on the Stillwater campus funded by the institutional budget.
The credit hours generated will continue to be monitored closely and new modes of delivery examined in order to keep up with the institutional growth rate.
Standard 6 - Organizational Performance ResultsOrganizational Effectiveness Results Organizational effectiveness results examine attainment of organizational goals. Each business
unit must have a systematic reporting mechanism for each business program that charts enrollment patterns, student retention, student academic success, and other characteristics reflecting students' performance.
Key indicators may include: graduation rates, enrollment, improvement in safety, hiring equity, increased use of web-based technologies, use of facilities by community organizations, contributions to the community, or partnerships, retention rates by program, and what you report to governing boards and administrative units.
39
Analysis of ResultsPerformance
Measure (Competency)
Description of Measurement
Instrument
Areas of Success Analysis and Action Taken
Results of Action Taken (occurs in the following year)
Insert Graphs or Tales of Resulting Trends for 3-5 Years (please graph all
available data up to five years))
Student Advisement:The desirable outcome is that the percentage of NOC students declaring an area of business as their major will be proportional to the percentage of NOC graduates receiving a business degree.
The number of majors as a percent of overall institutional majors (including “undecided”) compared to the number of graduates with business degrees as a percent of total NOC graduates.
The percent of NOC graduates receiving degrees in Business (18.5%, 21.9%, 18.9%, 22.5% and 17.9%) exceeded the percent of NOC majors declaring business as the major (11.5%, 10.9%, 8.4%, 10.5%, and 10.7%) in 2006 thru 2011. This is an indication that advising of students toward degree is resulting in more majors actually completing the degree.
Advisement to encourage students to declare the major earlier in their college career still needs improvement. The decrease in percentage of majors in 2008-09 is due in part to special enrollment situations on the Stillwater campus, where Northern provides all remedial needs for Oklahoma State University, causing Arts & Science majors to be artificially inflated. More effort has been and will continue to be made to identify business students and encourage them to declare a major rather than be listed as the default of Arts & Sciences.
We will continue to monitor and analyze the advisement process for possible improvement strategies. Improvement has occurred since 2008-09 to increase the number of declared business majors.
40

Performance Measure
(Competency)
Description of Measurement
Instrument
Areas of Success Analysis and Action Taken
Results of Action Taken (occurs in the following year)
Insert Graphs or Tales of Resulting Trends for 3-5 Years (please graph all
available data up to five years))
Program Review MeetingsAAS Cooperative Degrees PlansSmooth alignment of courses in cooperative agreements between NOC and career technology centers.
Yearly meetings between the NOC VP of Academic Affairs, NOC Program Director, Division Chair, Career Tech Representatives, and the Oklahoma Career Tech Liaison to discuss changes in curriculum and or cooperative agreement changes.
Successful completion of the AAS degree plan by students completing technical components at the career tech locations.
Although a minimal number of students participate in these cooperative agreement options, annual monitoring seems to be assuring a smooth alignment for these agreements and enrollment and graduation has increased.
Results are anecdotal, based on case-by-case interviews with students who participate in these agreements. Monitoring is continuous based on the annual program review meetings.
AAS and AS Degree PlansInsure coursework and training for Business Programs is aligned with Business and Industry Requirements.
Yearly Advisory Committee members complete surveys and meetings are held to discuss proposed changes in curriculum and to solicit suggestions and recommendations from Business & Industry in the service area.
The latest surveys indicated that a program in Entrepreneurship would be a good addition. No changes to curriculum for existing programs were suggested. The members suggested reorganizing the board to a more permanent group with a designated
As a result of the suggestions, the division has added an option in Business Management for Entrepreneurship. Also, the Business Advisory Board is being reorganized to include a formalized handbook and set rotation of membership.
Continue monitoring ongoing progress with students and the business community to see if adjustments are necessary to the curriculum and / or the board.
41

membership rotation.
Performance Measure
(Competency)
Description of Measurement
Instrument
Areas of Success Analysis and Action Taken
Results of Action Taken (occurs in the following year)
Insert Graphs or Tales of Resulting Trends for 3-5 Years (please graph all
available data up to five years))
AS Degree Plans (Transfer Programs)Insure 100 % smooth transfer of courses between NOC and four-year institutions within the state.
2+2 transfer agreements to allow students to complete two-year degree at Northern and then be able to finish the four-year degree within the next two years. The measurement would be the number of students who take advantage of this opportunity.
2+2 agreements are in place with Northern’s Business Division and Oklahoma State University, Northwestern Oklahoma State University, Northeastern Oklahoma State University, Southeastern University, Southwestern Oklahoma State University and the University of Central Oklahoma.
The 2+2 is a possibility in many instances, but there simply may not been a documented agreement. Negotiations are in process for a formal 2+2 agreement with the Rogers State University and East Central University. Continue to monitor and negotiate with the institutions that have “open doors” to discussion of the 2+2 agreements. Even if the 2+2 is not accomplished in writing, the negotiation process has proven to improve the transfer process for our students.
Continue monitoring ongoing progress each semester to see if adjustments are necessary or if additional 2+2 agreements are negotiable in order to improve transfer.
42
Performance Measure
(Competency)
Description of Measurement
Instrument
Areas of Success Analysis and Action Taken
Results of Action Taken (occurs in the following year)
Insert Graphs or Tales of Resulting Trends for 3-5 Years (please graph all
available data up to five years))
Insure 100 % smooth transfer of courses between NOC and four-year institutions within the state.
Transfer Matrix realignment meetings are held annually for 2 and 4-year institutions within the State of Oklahoma. Meetings are held for each academic area, i.e. accounting, finance, economics, business communications, statistics, mathematics, etc. The purpose of the meetings is to come to agreement concerning the transfer of specific courses. The results of each meeting is then published on the Oklahoma State Regents website and become part of a state-wide articulation agreement.
The Business Unit has very good transfer of coursework to 4-year / graduate institutions within the state of Oklahoma. Course-for-course transfer is now approved by nearly all state institutions for students who complete the business core courses at Northern: Financial and Managerial Accounting, Macroeconomics Microeconomics, and Computer Concepts.
Northern Oklahoma College will continue to participate in the Transfer Matrix meetings. Additionally, we will continue to monitor and communicate with the major 4-year recipients of our graduates to insure their smooth transfer of coursework.
Results analyzed on a yearly basis at the Transfer matrix realignment meeting each academic area.We will continue monitoring ongoing progress with students and the transfer institutions to see if adjustments are necessary to the curriculum.
43