Embed Size (px)
Citation preview

created by desi 29
TABLE & CHART

created by desi 3030
TABLE
Set of numbers are
arranged in such a way
based on certain criteria to
facilitate discussion and
analysis.

created by desi 3131
TABLE SHAPE
1. one way table:Contain one characerictic data.
3. three way table
Contain three characterictic data
2. two way table
Contain two characerictic data.

created by desi 3232
Table 3.1. Number of Employees Pt Maju by Education Level
Education level frequency (person)
Elementry
Junior High School
Senior High school
Collage
10
5
32
6
Total 60
Source: personnel data PT Manu 2007
Example : One way table

created by desi 3333
Table 3.2. Number of Employees by Education Level and Working Period
Sumber : Data Personalia PT. Maju (2007).
Example : Two way table
Working
Period
Education level TOTAL
Elemtry Junior
HS
Senior
HS
collage
<1th - 2th 1 1
2,1th - 3th 4 4
3,1th - 4th 7 8 1 9
4,1th – 5th 5 10 15
> 5th 5 5 14 24
Total 10 5 32 6 60

created by desi 3434
Example: Three way table
Working
period
Education level TOTAL
E JHS SHS Collage
M F M F M F M F
<1th - 2th 1 1 2 4
2,1th - 3th 2 2 2 6
3,1th - 4th 5 3 1 3 12
4,1th – 5th 5 5 10
> 5th 5 5 14 2 26
total 10 5 19 8 3 3 6 2 60
Table 3.3. Number of Employees by Education Level,
Working Period, and Sex

created by desi 3535
What can we explain from the TABLE?
Table 3.4. Sales by Type of Goods and sales area in 2006
(units of cartoons )
Sales area TotalType
source : PT. Maju Data (2007).
Goods JABAR JATENG DIY JATIM
soap 200 300 500 600 1600
Shampoo 150 250 400 500 1300
Toothpaste 100 350 250 300 900
total 450 800 1150 1400 3800
created by desi 3636
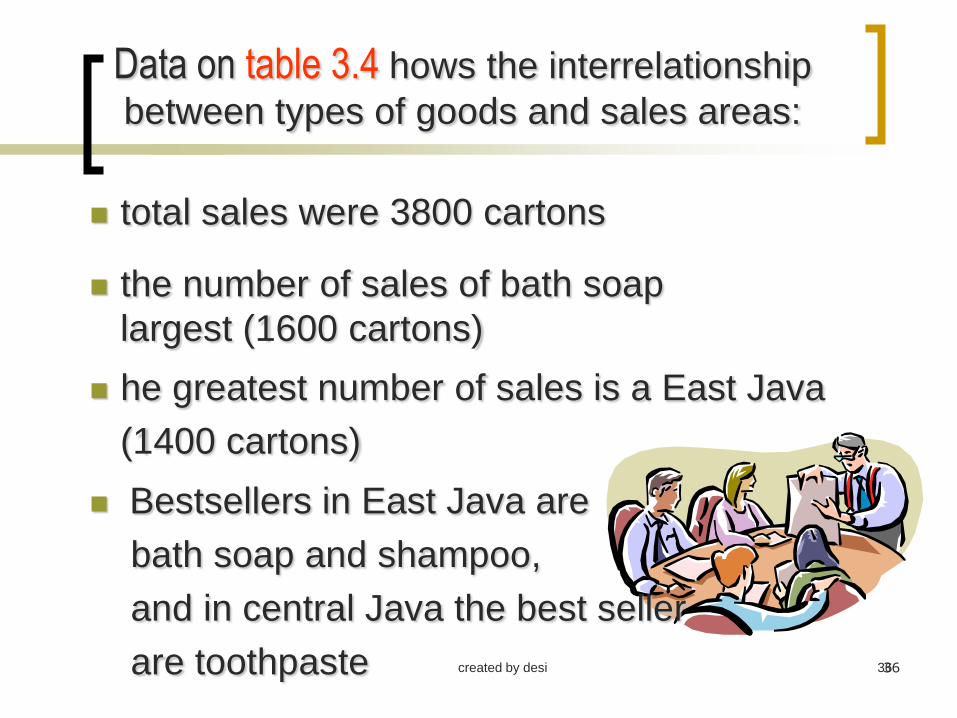
Data on table 3.4 hows the interrelationship
between types of goods and sales areas:
total sales were 3800 cartons
the number of sales of bath soap
largest (1600 cartons)
he greatest number of sales is a East Java
(1400 cartons)
Bestsellers in East Java are
bath soap and shampoo,
and in central Java the best seller
are toothpaste
created by desi 3737
The graph shows the data
based on the values of
observations or a table
GRAPH

created by desi 3838
Sales grafik
0
10
20
30
40
50
60
70
80
90
100
2004 2005 2006 2007
Year
sale
s p
oin
t (b
illio
n)
Example: line graph

created by desi 3939
Line graph for table 3.4
product sales PT. Maju in 2006
0
100
200
300
400
500
600
700
west java central java DIY east java
Sales area
Sale
s
soap
Shampoo
toothpaste

created by desi 4040
Sales Graph
0
20
40
60
80
100
2004 2005 2006 2007
Year
Sa
les
vo
lum
(b
illio
n)
Example for histogram

created by desi 4141
Example for Pie graph

created by desi 4242
Summary
• Table is a media presentation of data that
contains numbers with certain criteria.
• Tables can be arranged in several forms, such
as one way table, two way eventhough three or
four way direction. It’s depends on the number
of criteria and information .
• The graph is a visual media presentation of
data based on the criteria and the value of the
observations are collected.
Among other forms of graphs, line graphs, bar,
and pie.

created by desi 43
Table 3.5. Sale of Yamaha, Honda, Suzuki in 2002-2006 (units)
Brand Total
Source : distributor Yamaha, Honda, dan Suzuki area DIY (2007).
Year Yamaha Honda Suzuki
2002 200 300 100 600
2003 150 450 200 800
2004 200 380 225 805
2005 225 400 150 775
2006 300 550 250 1100
total 1075 2080 925 4080
What information can you give from these data ?
Problem Exercise

created by desi 4444
Reference
• J. Supranto, Statistik, Teori dan Aplikasi, Jilid 1, Erlangga, Jakarta,
2000.
• Sutrisno Hadi, Statistik, Jilid 1, Andi Offset, Yogyakarta, 2000.
• Maryati, MC., Statistik Ekonomi dan Bisnis, AMP YKPN,
Yogyakarta, 1997.