Embed Size (px)
Citation preview

Table Annex: Detailed information on the impact of the tax system on social expenditure
A. Average Itemised Tax Rates (AITR %)
B. Average implicit indirect tax rates of consumption out of benefit income
C. Tax breaks for social purposes
Missing values are presented as follows:
m data not available;
a data do not exist;
x data included in another category.
SOCX Manual/MethodologySee Part II. (p.88) OECD Social, Employment and Migration Working Papers No. 124, October 2011: “Is the European welfare state really more
expensive? Indicators on social spending, 1980-2012 and a manual to the OECD Social Expenditure database (SOCX)"
II.4. Net (after tax) social expenditure ................................................................................................. 103
www.oecd.org/social/expenditure.htm

AUSTRALIA
A. Average Itemised Tax Rates (AITR %)
2001(a)
2003(a)
2005(b)
2007(b)
2009(b)
2010 2011(d)
2012 2013 2014
1 Old-age cash benefits
1a - public pensions
Age Pension 0.38 0.03 0.84 0.12 0.03 0.05 0.07 0.05 0.08
Wife's Pension 0.38 1.25 0.14 0.07 0.06 na na na na
Widow's B Pension 0.26 0.77 0.67 0.67 na na na na na
1b - early retirement benefits
1c - private pensions
Superannuation pension 16.83 15.07 13.58 1.87 1.38 1.80 1.84 1.70 1.29 1.18
Superannuation Lump Sums 2.66 10.45 9.50 0.31 0.23 0.34 0.34 0.43 0.24 0.19
2 Survivors' benefits
2a - public pensions
Veteran's Service Pensions 0.68 0.00 0.54 0.21 0.08 0.10 0.12 0.05 0.07
3 Incapacity-related benefits
Disability Support Pension 0.02 0.00 na na 0.36 0.36
3c - Sickness payments
Sickness Allowance (c) 0.45 0.09 0.05 0.00 0.01 0.10 0.12 na na
4 Family cash benefits
4a - Family benefits
Parenting Allowance 1.03 1.49 1.44 0.24 0.06 0.10 0.12 0.11 0.11
Partner Allowance 0.17 1.02 0.61 0.14 0.13 na na na na
Carer's Payment 0.00 0.19 0.31 0.00 0.01 0.14 0.20 0.16 0.23
4c - Sole parent benefits
Sole Parent 0.64 0.92 1.43 0.72 0.41 0.42 0.50 0.42 0.52
Widow Allowance 0.00 0.05 0.05 na na
6 Unemployment
6b - unemployment assistance benefit
Unemployment Benefits 1.10 0.81 1.11 0.33 0.13 0.55 0.67 0.14 0.19
9 Wage income 23.59 24.63 23.78 22.48 20.88 20.49 21.15 22.79 23.54
(e) Data is reported for the financial year commencing on 1 July of the year indicated and finishing on 30 June of the following year.
(f) Data is unavailable for 2012 as the current micro-simulation model does not provide information for 2012-13.
Sources: CAPITA distributional model. Revenue Group of The Treasury, NZLtralian Government.B. Average implicit indirect tax rates of consumption out of benefit income
Indirect taxes paid out of consumption of cash transfers, in millions of NZLtralian dollars
2001 2003 2005 2007 2009 2010 2011 2012 2013
(1) 437,841 502,035 566,955 663,844 719,001 761,638 801,183 835,826 878,289
Private final consumption expenditure
(2) 492,080 563,115 638,585 754,264 822,710 872,123 919,502 951,493 998,305
Private consumption plus Government consumption minus Government wages
(3) 48,674 57,019 62,882 69,843 73,172 76,018 76,329 77,887 83,291
General consumption taxes plus excise duties (5110+5121)
28,180 35,123 40,086 45,486 47,800 49,329 50,004 51,462 56,819
5110 General taxes 20,494 21,896 22,796 24,357 25,372 26,689 26,325 26,425 26,472
5121 Excises
(4) 60,440 69,938 75,988 85,022 88,585 92,038 94,210 97,072 103,678
Taxes on production sale transfer (5100)
(5) 66,219 76,724 83,441 93,645 98,188 103,425 105,931 116,712 123,516
Taxes on Goods and Services (5000)
Implicit average indirect tax rate on consumption out of benefit income:
(d) 2011 figures have been updated using revised estimates published in the 2015 Tax Expenditure Statement.
Table Annex
Detailed information on the impact of the tax system on social expenditure
The AITRs for wage income, superannuation pensions and superannuation lump sums were calculated using a sample file of NZLtralian tax returns in 2001. All other AITRs were calculated using the STINMOD model, a static microsimulation model developed by the National Center for
Social and Economic Modelling (NATSEM).
(a) The AITRs were obtained by calculating the amount of tax paid in aggregate with and without the income streams. The difference between the taxes paid was then divided by the value of the income stream to reveal the value of the AITR.
(b) Tax paid on an income stream was calculated by dividing income from stream by total tax liability and then multiplying it by total tax paid. This amount was then divided by the total income from stream to calculate the AITR. This methodology has been adopted to align with the
instructions provided by the OECD.(c) Figure is derived from a small sample of observations and caution should be taken with interpretation.

(6) 9.9% 10.1% 9.8% 9.3% 8.9% 8.7% 8.3% 8.2% 8.3%
using general consumption taxes plus excise duties (3)/(2)
(7) 13.5% 13.6% 13.1% 12.4% 11.9% 11.9% 11.5% 12.3% 12.4%
using a broad concept of the indirect tax base (5)/(2)
(8) 15.1% 15.3% 14.7% 14.1% 13.7% 13.6% 13.2% 14.0% 14.1%
using a broad concept of the indirect tax base and ignoring government consumpion (5)/(1)
C. Tax breaks for social purposes (in millions of NZLtralian dollars)
2001 2003 2005 2007 2009 2010 2011 2012 2013 2014
Tax breaks similar to cash benefits (f) 2,389 1,728 3,306 3,896 4,510 4,533 4,877 4,941 4,759 4,748
Family: 376 385 430 470 585 560 500 370 140 120
Tax offsets for taxpayers with dependants 16 15 20 - - - - - - -
Tax offset for housekeeper who cares for a prescribed dependant 360 370 390 - - - - - - -
Tax offset for dependant spouse, child-housekeeper and housekeeper who cares for prescribed dependent (d) - - - 430 585 560 500 370 140 120
Tax offsets for taxpayers supporting a parent, parent-in-law, or invalid relative - - 20 40 - - - - - -
Other areas: 2,013 1,343 2,876 3,426 3,925 3,973 4,377 4,571 4,619 4,628
Medical expenses tax offset 150 220 305 390 460 530 510 540 390 230
Exemption of certain income support benefits, pensions or allowances - - 820 690 590 770 880 500 550 570
Exemption of Utilities Allowance and Seniors’ Concession Allowance (g) - - 14 38 114 19 1 - - -
Exemption of payments made under the First Home Owners Grant Scheme - - 285 325 685 730 260 290 275 185
Income averaging for authors, inventors, performing artists, production associates and sportspersons - - 7 8 14 16 18 23 26 29
Exemption of post-judgment injury awards in personal injury compensation cases - - 2 2 2 3 3 3 3 4
Capped taxation rates for lump sum payments for unused recreation and long service leave 210 190 150 105 105 105 145 200 220 240
Concessional treatment of non-superannuation termination benefits 990 320 310 1,200 1,450 1,300 2,000 2450 2550 2700
Taxation of five per cent of unused long service leave accumulated by 15 August 1978 135 85 85 75 55 55 60 60 55 50
Capital gains tax exemption on the sale of a small business at retirement 55 100 190 490 360 350 370 370 400 420
Small business capital gains tax exemption for assets held for more than 15 years - 15 35 100 90 95 130 135 150 200
Exemption of rent subsidy payments under the Commonwealth/State mortgage and rent relief schemes 13 13 3 3 - - - - - -
Tax offset for low income earners 460 400 670 - - - - - - -
For informaton only: these items are not included in the sum of TBSPs as that constitute a double counting with the calculations on Average Direct Tax Rates over benefit incomeExemption of the Child Care Assistance Payments (Revenue foregone) (h) - - - - 485 360 735 815 1010 1225
Tax offset for child care (Revenue foregone) - - - 365 - - - - - -
Exemption of Child Care Benefit (Revenue foregone) (i) - - 410 455 270 290 - - - -
Exemption of the Baby Bonus (Revenue foregone) (j) - - 140 165 165 135 115 100 45 -
Exemption of the first child tax offset (Baby Bonus) (Revenue foregone) (k) - - 31 22 8 4 1 - - -Exemption of Family Tax Benefit, Parts A and B (Revenue foregone) - - 1,880 2,230 1,960 1,900 1950 1990 2090 2180Exemption of certain veterans' pensions, allowances or benefits, compensations, and particular WWII-related
payments for persecutions (Revenue foregone) - - 290 430 430 490 450 400 440 430
(g)
A range of dependency tax offsets, including the dependent spouse tax offset and the invalid relative, parent, parent-in-law, housekeeper, housekeeper (with child), child--housekeeper and child-housekeeper (with child) tax offsets, were abolished from 1 July 2014.
(h) From 20 September 2009, the Utilities and Seniors' Concession Allowance was incorporated into Pension Supplement.
(i)
(j) This tax expenditure is now incorporated into A24 - Exemption of Child Care Assistance payments
(k) The Baby Bonus was discontinued from 1 March 2014 and replaced by changes to Family Tax Benefit Part A. This change from 2014-15 onwards is reflected in A35. Source: 2013 TES.
(l) The first child tax offset expired on 30 June 2009.
Source: NZLtralian Government (2015, 2013, 2011, 2009, 2007,2005, 2003), Tax Expenditure Statement, The Treasury, Canberra.
For information only : Exemptions from Goods and Services Tax for social products and services (excluded from total) (l) 2005 2007 2009 2010 2011 2012 2013 2014
GST exemption for education supplies (e.g. education sources, student accommodation) 1,850 2,100 2,550 2,800 3,050 3,350 3,650 3,850
GST exemption for drugs and medicinal preparations 270 320 310 330 420 470 490 520
GST exemption for medical aids and applicances 30 35 80 85 95 100 110 115
Source: OECD on-line National Accounts database (http://stats.oecd.org/Index.aspx?DataSetCode=SNA_TABLE1) for lines 1 and 2, except Government wages from NZLtralian National Accounts (table 40); and OECD Revenue Statistics database
Reporting Modification. This tax expenditure modifies 'Exemption of the Child Care Rebate' (A26 in 2014 TES) and incorporates 'Exemption of Child Care Benefit' (A37 in the 2014 TES). From 2017-18 this tax expenditure incorporates the Child Care Subsidy, subject to passage
of legislation.

GST exemption for medical and health services 1,850 2,200 2,500 2,700 2,900 3,100 3,250 3,450
GST exemption for private health insurance 160 190 210 240 250 250 260 290
GST exemption for residential care, community care and other care services (e.g. publicly funded aged care, disability care) 70 90 780 830 870 910 970 1,030
GST exemption for child care services 360 480 600 670 770 880 1,020 1,150
(m)
Source: NZLtralian Government (2015, 2013, 2011), Tax Expenditure Statement, The Treasury, Canberra.
2001 2003 2005 2007 2009 2010 2011 2012 2013 2014
Tax breaks to stimulate private social protection (not including pensions) 1,170 1,510 1,992 2,800 3,140 3,240 3,625 3,955 4,030 4,135
Tax offset for expenditure on private health insurance (m) 590 740 900 1,020 1,140 1,220 1,330 1,600 1,470 1,450
Deduction for gifts to deductible gift recipients - - - 790 960 870 1,030 1,010 1,080 1,020
Deduction for gifts to approved donees 300 540 730 - - - -
Deduction for contributions with an associated minor benefit - - 3 - - - -
Partial rebate for certain non-profit, non-government bodies 40 20 19 30 30 30 30 40 50 55
Capped exemption for public benevolent institutions (excluding public hospitals) 240 210 250 720 890 980 1,100 1,150 1,300 1,400
Deduction for donations to prescribed private funds - - 90 240 120 140 135 155 130 210
(n) The rebate for private health insurance has been moved from the category 'Tax breaks similar to cash benefits' to 'Tax breaks to stimulate private social protection' to be consistent with other countries.Source: NZLtralian Government (2015, 2013, 2011, 2009, 2007,2005, 2003), Tax Expenditure Statement, The Treasury, Canberra.
Memorandum Items 2001 2003 2005 2007 2009 2010 2011 2012 2013 2014
Tax breaks for pensions 9,215 13,540 19,525 38,868 25,336 29,110 28,770 26,870 26,590 29,470
Superannuation - capital gains tax discount for funds .. .. 1,090 1,030 80 100 90 80 170 350
Concessional taxation of employer contributions - - - 13,150 12,700 12,600 14,250 13,850 14,400 15,500
Concessional taxation of superannuation entity earnings - - - 22,050 10,650 15,050 13,100 11,600 11,100 12,500
Concessional taxation of funded superannuation 9,215 13,400 17,930 - - - - - - -
Concessional taxation of unfunded superannuation lump sums - 140 150 308 360 410 450 470 500 530
Superannuation - deduction and concessional taxation of certain personal contributions .. .. 410 2,000 1,500 870 960 1,000 620 750
Superannuation - measures for low-income earners .. .. 90 500 230 300 170 140 120 200
Superannuation - spouse contribution offset .. .. 15 10 6 - -
Superannuation - tax on funded lump sums relating to post-June 1983 service .. .. -160 -180 -190 -220 -250 -270 -320 -360
Source: NZLtralian Government (2015, 2013, 2011, 2009, 2007,2005, 2003), Tax Expenditure Statement, The Treasury, Canberra.
The GST is an indirect, broad based consumption tax charged at a rate of 10 per cent. Several goods and services that fall within the OECD's definition of a social product are exempt from this tax. The value of these exemptions are listed above. If this type of tax expenditure in
included in the calculation of net social expenditure for other countries, it may be appropriate to similarly incorporate this information in the calculation of net social expenditure in NZLtralia. Estimates of tax expenditure on these concessions is not available for 2003 or 2001. Note
that tax expenditures relating to GST exemptions was introduced into the Tax Expenditures Statement in 2008. For this reason, tax breaks relating to GST exemptions are not available for prior years.

AUSTRIA
A. Average Itemised Tax Rates (AITR %)
2001 2003 2005 2007 2009 2010 2011 2012 2013 2014
Old-age cash benefits (1 +3) 17.7% - public pensions 17.0% 16.6% 15.9% 15.0% 15.4% 15.8% 16.4% 16.8% 17.3% - private pensions 13.0% 16.6% 15.9% 15.0% 15.4% 15.8% 16.4% 16.8% 17.3%Incapacity-related benefits - Disability pensions 17.7% 17.0% 16.6% 15.9% 15.0% 15.4% 15.8% 16.4% 16.8% 17.3% - Occupational Injury benefits 0.0% 0.0% 0.0% 0.0% 0.0% 0.0% 0.0% 0.0% 0.0% 0.0%
- Sickness payments 30.0% 30.0% 29.3% 22.0% 22.0% 22.0% 22.0% 22.0% 22.0% 22.0%
Source: Ministry of Finance (Bundesministerium fur Finanzen), Wage Tax Statistics (2001, 2003, 2005, 2007, 2009, 2010, 2011).
B. Average implicit indirect tax rates of consumption out of benefit income
Indirect taxes paid out of consumption of cash transfers, in millions of euros
2001 2003 2005 2007 2009 2010 2011 2012 2013 2014
(1) Private final consumption expenditure 119,386 125,494 136,880 147,809 153,891 158,041 165,191 170,058 173,714 177,344
(2) Private consumption plus Government consumption minus Government wages 136,965 144,100 158,009 171,091 180,717 185,453 193,224 198,916 203,371 208,026
(3) General consumption taxes plus excise duties (5110+5121) 23,029 24,164 26,052 27,748 28,945 29,685 30,970 32,163 32,566 33,048
5110 General taxes 17,301 17,944 19,466 20,988 22,231 22,764 23,498 24,601 24,978 25,467 5121 Excises 5,728 6,220 6,586 6,760 6,714 6,921 7,472 7,562 7,588 7,581
(4) Taxes on production sale transfer (5100) 24,925 26,154 27,980 29,830 31,141 31,827 33,771 35,056 35,442 35,995
(5) Taxes on Goods and Services (5000) 26,550 27,924 29,732 31,688 33,088 33,818 35,881 37,263 37,745 38,671
Implicit average indirect tax rate on consumption out of benefit income:
(6) using general consumption taxes plus excise duties (3)/(2) 16.8% 16.8% 16.5% 16.2% 16.0% 16.0% 16.0% 16.2% 16.0% 15.9%
(7) using a broad concept of the indirect tax base (5)/(2) 19.4% 19.4% 18.8% 18.5% 18.3% 18.2% 18.6% 18.7% 18.6% 18.6%
(8) using a broad concept of the indirect tax base and ignoring government consumpion (5)/(1) 22.2% 22.3% 21.7% 21.4% 21.5% 21.4% 21.7% 21.9% 21.7% 21.8%
C. Tax breaks for social purposes (in millions of euros)
2001 2003 2005 2007 2009 2010 2011 2012 2013 2014
Tax breaks similar to cash benefits 55 95 165 175 175 175 175 180 180 180
Family:
Tax credits for one-parent families ("Alleinerzieherabsetzbetrag") 40 110 120 120 120 120 120 120 120
Other areas:
Appliances for the disabled (Steuerbefreiung für Kfz für Körperbehinderte) § 2 (1) Z 12 KfzStG und § 4 (3) Z 9 VersStG 15 15 15 15 15 15 15 15 15 15Special tax relief (Außergewöhnliche Belastungen) § 35 40 40 40 40 40 40 40 45 45 45
Tax measures to stimulate private social protection (including pensions) 270 280 280 280 280
Contributions to health, accident and pension insurance (Versicherungsbeiträge) § 18 Abs. 1 Z 2 270 280 280 280 280
Memorandum Items
Tax breaks for pensions 130 130 180 205 230 83 84 83 36 21
- Deduction of contributions to private pension insurances or funds as "special expenses" 130 130 150 150 150
- Premium (payable tax credit) for contributions to pension funds 30 55 80 83 84 83 36 21
Source: Budget Accounts, Foerderungsbericht (2001, 2003, 2005, 2007, 2009, 2010, 2011), Ministry of Finance, Austria.
Table Annex
Detailed information on the impact of the tax system on social expenditure (cont.)
Source: OECD on-line National Accounts database (http://stats.oecd.org/Index.aspx?DataSetCode=SNA_TABLE1) for lines 1 and 2; and OECD Revenue Statistics database (http://stats.oecd.org/Index.aspx?DataSetCode=REV) for lines 3, 4, and 5.
OECD Social Expenditure database (www.oecd.org/social/expenditure.htm) // Base de données des dépenses sociales de l'OCDE (www.oecd.org/fr/social/depenses.htm) - Version 17-10-2016

BELGIUM
A. Amount of direct tax paid on benefit income (in millions of euros)
2001 2003 2005 2007 2009 2010 2011 2012 2013
A.Taxes paid on transfer income (A1 minus A2 , then adding local tax rate *) 4,093.5 4,370.1 4,079.4 4,003.9 4,884.3 5,084.9 5,386.8 5,713.7 5,722.2
Pensions: PIT 5,060 5,458 5,972 5,974 7,030 7,315 7,778 8,243 8,371Sickness: PIT 449 496 485 483 597 651 700 735 794Early retirement: PIT 2 1Unemployment benefits: PIT 525 581 536 484 754 706 636 674 731Total PIT (A1) 6,036 6,535 6,993 6,941 8,381 8,672 9,114 9,652 9,896
- Pensions: tax credit 1,722 1,924 2,525 2,562 2,937 3,001 3,132 3,324 3,489 - Sickness: tax credit 177 213 304 308 384 413 449 477 519 - Early retirement: tax credit 1 0 - - - Unemployment benefits: tax credit 215 302 323 319 454 457 440 448 477 - Others 98 26 32 24 54 62 82 78 88Total tax credits (A2) 2,213 2,465 3,184 3,213 3,829 3,933 4,103 4,327 4,573
Local tax rate 0 0 0 0 0 0 0 0 0
B. Social security contributions 885 ## 984 ## 1,109 ## 1,187 ## 1,338 1,295 1,309 1,324 1,363
Total (A + B) 4,979 5,354 5,189 5,191 6,222 6,380 6,695 7,038 7,086
B. Average implicit indirect tax rates of consumption out of benefit income
Indirect taxes paid out of consumption of cash transfers, in millions of euros
2001 2003 2005 2007 2009 2010 2011 2012 2013
(1) Private final consumption expenditure 140,291 145,800 157,661 172,866 181,546 189,693 196,069 201,182 205,167
(2) Private consumption plus Government consumption minus Government wages 166,787 175,370 190,105 207,646 221,580 230,783 239,426 246,554 250,762
(3) General consumption taxes plus excise duties (5110+5121) 23,535 25,129 28,865 31,523 31,118 33,265 34,147 35,069 35,536
5110 General taxes 17,902 18,880 21,735 24,179 23,832 25,483 26,297 27,122 27,499 5121 Excises 5,632 6,249 7,130 7,344 7,287 7,783 7,850 7,947 8,036
(4) Taxes on production sale transfer (5100) 25,660 27,564 31,381 34,453 34,574 36,975 38,025 40,437 40,183
(5) Taxes on Goods and Services (5000) 27,928 29,714 33,678 36,823 36,898 39,364 40,571 42,876 42,678
Implicit average indirect tax rate on consumption out of benefit income:
(6) using general consumption taxes plus excise duties (3)/(2) 14.1% 14.3% 15.2% 15.2% 14.0% 14.4% 14.3% 14.2% 14.2%
(7) using a broad concept of the indirect tax base (5)/(2) 16.7% 16.9% 17.7% 17.7% 16.7% 17.1% 16.9% 17.4% 17.0%
(8) using a broad concept of the indirect tax base and ignoring government consumpion (5)/(1) 19.9% 20.4% 21.4% 21.3% 20.3% 20.8% 20.7% 21.3% 20.8%
Source: OECD on-line National Accounts database (http://stats.oecd.org/Index.aspx?DataSetCode=SNA_TABLE1) for lines 1 and 2; and OECD Revenue Statistics database
(http://stats.oecd.org/Index.aspx?DataSetCode=REV) for lines 3, 4, and 5.
Table Annex
Detailed information on the impact of the tax system on social expenditure (cont.)
* Local tax rate is applied to income tax, which overestimates local tax amount as local taxes are only paid when the amount of the credit does not exhaust income tax. So for 2011,
Taxes paid to on tranfers income refer to Total PIT - Total tax credits * local tax (A1 minus A2 , then adding local tax rate *) (9114-4103)* (1+0.075)= 5386.8
OECD Social Expenditure database (www.oecd.org/social/expenditure.htm) // Base de données des dépenses sociales de l'OCDE (www.oecd.org/fr/social/depenses.htm) - Version 17-10-2016
BELGIUM
Table Annex
Detailed information on the impact of the tax system on social expenditure (cont.)
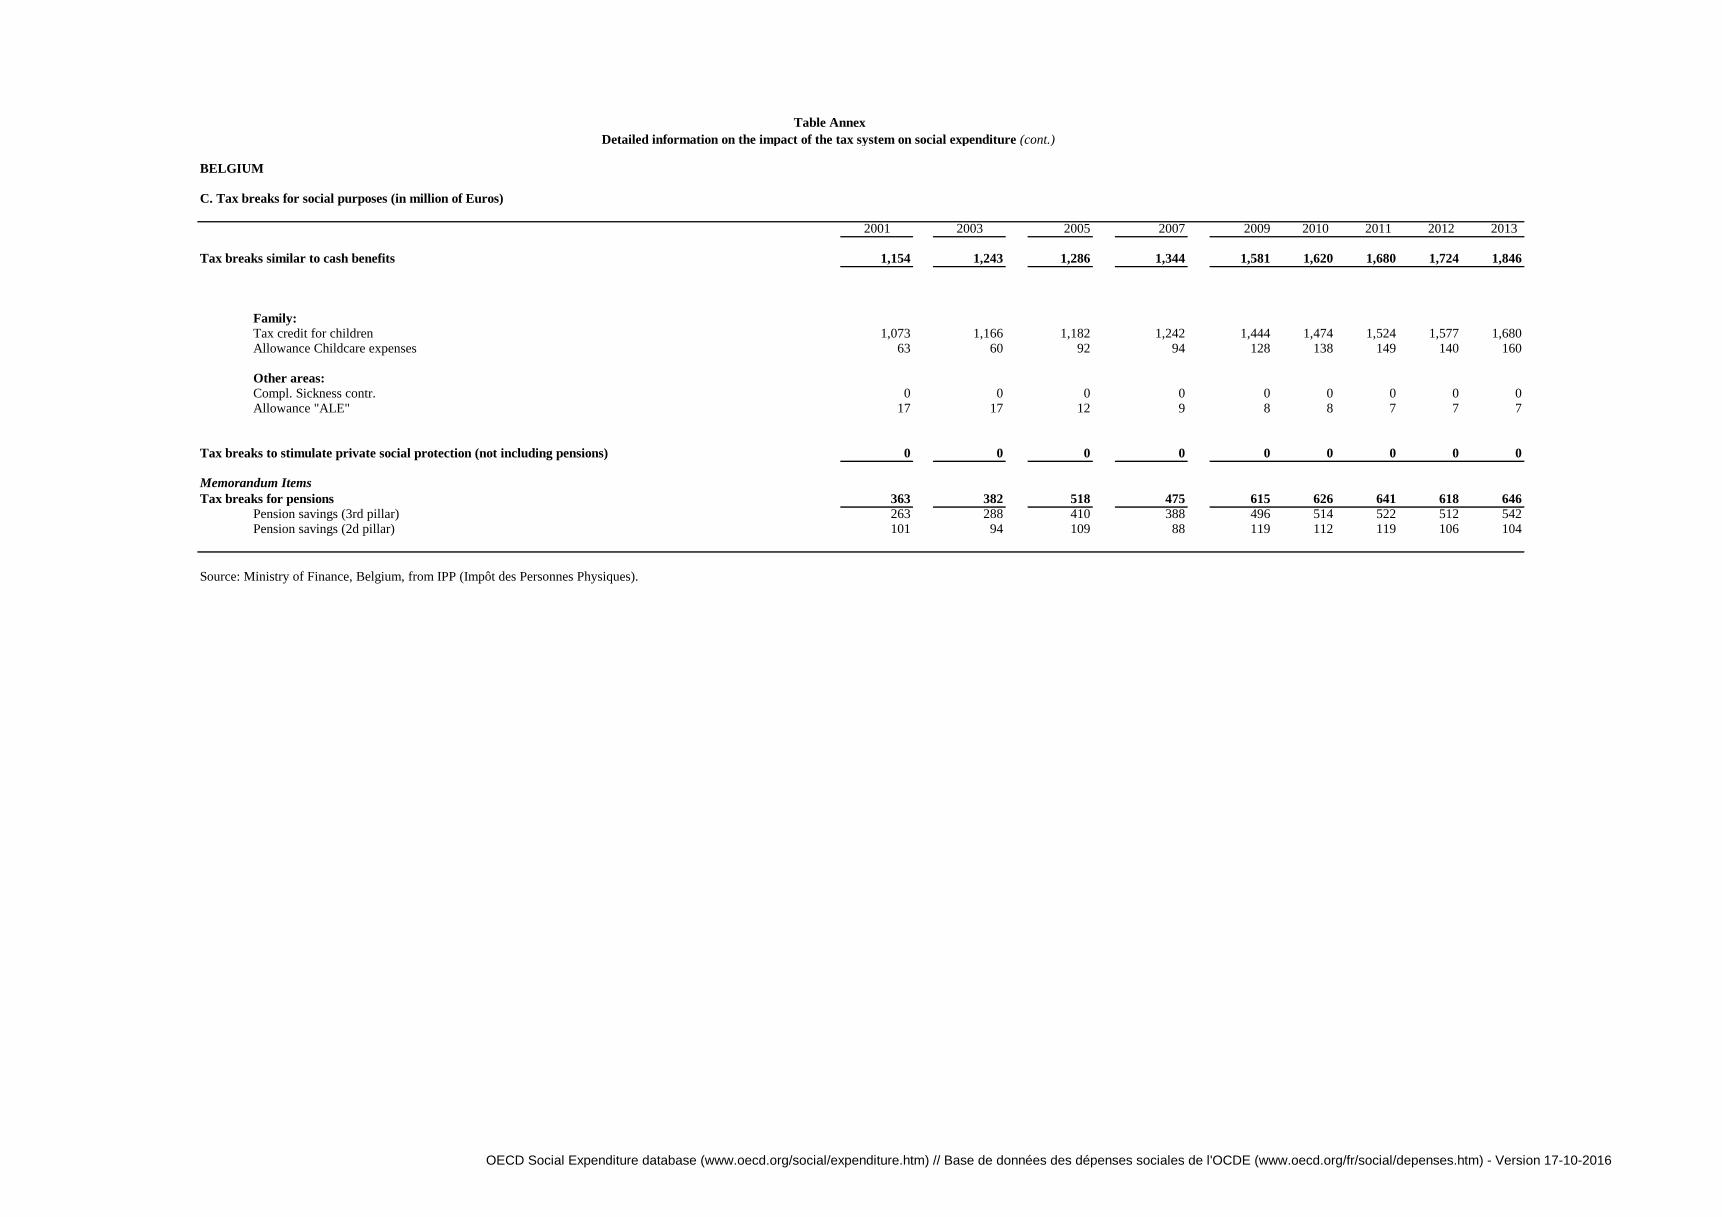
C. Tax breaks for social purposes (in million of Euros)
2001 2003 2005 2007 2009 2010 2011 2012 2013
Tax breaks similar to cash benefits 1,154 1,243 1,286 1,344 1,581 1,620 1,680 1,724 1,846
Family:
Tax credit for children 1,073 1,166 1,182 1,242 1,444 1,474 1,524 1,577 1,680Allowance Childcare expenses 63 60 92 94 128 138 149 140 160
Other areas:
Compl. Sickness contr. 0 0 0 0 0 0 0 0 0Allowance "ALE" 17 17 12 9 8 8 7 7 7
Tax breaks to stimulate private social protection (not including pensions) 0 0 0 0 0 0 0 0 0
Memorandum Items
Tax breaks for pensions 363 382 518 475 615 626 641 618 646
Pension savings (3rd pillar) 263 288 410 388 496 514 522 512 542Pension savings (2d pillar) 101 94 109 88 119 112 119 106 104
Source: Ministry of Finance, Belgium, from IPP (Impôt des Personnes Physiques).
OECD Social Expenditure database (www.oecd.org/social/expenditure.htm) // Base de données des dépenses sociales de l'OCDE (www.oecd.org/fr/social/depenses.htm) - Version 17-10-2016

CANADA
A. Average Itemised Tax Rates (AITR %)
2001 2003 2005 2007 2009 2010 2011 2012 2013 2014
1 Old-age Cash Benefits 14.8 14.2 14.5 12.7 11.7 11.9 12.4 12.0 12.0 12.11a - Public Pensions (OAS) 7.0 6.7 6.7 5.9 5.5 5.7 5.9 6.1 6.0 6.01b - Private Pensions 17.8 17.1 17.2 15.0 14.0 14.2 14.7 14.1 14.1 14.4
2 Canadian Pension Plan (Retirement) 9.7 9.3 9.4 8.3 7.8 8.0 8.2 8.3 8.3 8.4
3 Canadian Pension Plan (Disability) 5.6 5.0 5.1 4.5 4.2 4.1 3.8 4.3 4.4 4.4
4 Employment Insurance 11.2 10.9 10.1 9.2 9.1 9.1 9.4 9.6 9.7 9.94a - Regular Employment Insurance - 11.3 10.6 9.6 9.4 9.3 9.8 10.0 10.0 10.24b - Parental Leave Payments - n.a. n.a. n.a. n.a. n.a. n.a. n.a. n.a. n.a4c - Active Labour Market Programs - 0.0 0.0 0.0 0.0 0.0 0.0 0.0 0.0 0.0
5 Worker's Compensation 0.0 0.0 0.0 0.0 0.0 0.0 0.0 0.0 0.0 0.0
6 Guaranteed Income Supplement 0.0 0.0 0.0 0.0 0.0 0.0 0.0 0.0 0.0 0.0
7 Social Assistance 0.0 0.0 0.0 0.0 0.0 0.0 0.0 0.0 0.0 0.0
8 Universal Child Care Benefits (UCCB) - - - 4.3 4.2 4.1 4.4 4.0 4.1 4.2
9 Wage Income * 19.5 19.2 19.1 18.4 17.8 18.0 18.2 18.2 18.3 18.5
B. Average implicit indirect tax rates of consumption out of benefit incomeIndirect taxes paid out of consumption of cash transfers, in millions of Canadian dollars
2001 2003 2005 2007 2009 2010 2011 2012 2013 2014
(1) Private final consumption expenditure 627,551 695,313 768,649 860,349 901,170 946,350 988,577 1,020,599 1,059,398 1,106,703
(2) Private consumption plus Government consumption minus Government wages 722,722 799,940 882,619 985,356 1,044,858 1,097,518 1,147,908 1,183,633 1,227,423 1,278,816
(3) General consumption taxes plus excise duties (5110+5121) 75,516 85,008 91,462 94,002 90,067 96,447 101,870 106,467 109,280 114,778
5110 General taxes 56,297 62,348 68,510 71,242 66,843 72,104 76,663 81,098 82,978 86,988 5121 Excises 19,219 22,659 22,952 22,759 23,224 24,343 25,208 25,368 26,302 27,791
(4) Taxes on production sale transfer (5100) 90,699 101,791 109,926 114,701 110,439 116,994 123,068 128,292 131,473 137,458
(5) Taxes on Goods and Services (5000) 96,448 107,782 116,921 122,855 118,583 125,417 132,542 137,900 141,097 147,239
Implicit average indirect tax rate on consumption out of benefit income:
(6) using general consumption taxes plus excise duties (3)/(2) 10.4% 10.6% 10.4% 9.5% 8.6% 8.8% 8.9% 9.0% 8.9% 9.0%
(7) using a broad concept of the indirect tax base (5)/(2) 13.3% 13.5% 13.2% 12.5% 11.3% 11.4% 11.5% 11.7% 11.5% 11.5%
(8) using a broad concept of the indirect tax base and ignoring government consumpion (5)/(1) 15.4% 15.5% 15.2% 14.3% 13.2% 13.3% 13.4% 13.5% 13.3% 13.3%
C. Tax breaks for social purposes (in millions of Canadian dollars)1
2001 2003 2005 2007 2009 2010 2011 2012 2013 2014
Tax breaks similar to cash benefits (total without 5, 8 and 17 below) 5,328 5,621 6,079 8,129 8,547 8,811 9,122 9,607 9,850 12,085
Family: 2 Infirm Dependant Credit/ Caregiver Credit 69 85 89 94 102 105 115 125 130 135
10 Child care expense deduction 530 535 570 750 810 850 900 960 960 98511 Adoption Expense Tax Credit - - 3 3 3 3 3 3 2 212 Eligible Dependant Credit 610 660 665 755 785 770 770 775 770 79018 Children's Fitness Tax Credit - - - 90 110 110 110 115 120 18020 Child Tax Credit - - - 1,445 1,470 1,480 1,510 1,560 1,590 1,61521 Investment Tax Credit for Child Care Spaces - - - s s s s s s s
Table Annex
Detailed information on the impact of the tax system on social expenditure (cont.)
The sample used for the microdataset simulation was a stratified sample, consisting of approximately 690 000 records for the 2013 tax year, weighted to represent all taxfilers in Canada. The sample is provided by the Canada Revenue Agency.
Source: OECD on-line National Accounts database (http://stats.oecd.org/Index.aspx?DataSetCode=SNA_TABLE1) for lines 1 and 2; and OECD Revenue Statistics database (http://stats.oecd.org/Index.aspx?DataSetCode=REV) for lines 3, 4, and
5.
OECD Social Expenditure database (www.oecd.org/social/expenditure.htm) // Base de données des dépenses sociales de l'OCDE (www.oecd.org/fr/social/depenses.htm) - Version 17-10-2016

CANADA
Table Annex
Detailed information on the impact of the tax system on social expenditure (cont.)
Children's Arts Tax Credit - - - - - - 30 35 40 40Family Caregiver Tax Credit - - - - - - - 55 65 65Family Tax Cut - - - - - - - - - 1,900Inclusion of the Universal Child Care Benefit in the income of an eligible dependant 2 2 2 2 2
Other areas:1 Disability Tax Credit 419 460 496 585 620 650 675 720 770 8253 Infirm Dependant Credit
Disability supports deduction 0 1 1 2 2 1 2 2 1 19 Medical Expense Tax Credit 570 700 805 915 1,000 1,080 1,135 1,260 1,310 1,370
Goods and Services Tax/Harmonized Sales Tax Credit 3,130 3,180 3,450 3,490 3,645 3,760 3,870 3,995 4,090 4,175
For information only: not included in total TBSP
8 Age Credit (amount not included in total TBSP, as already taken into account when calculating AITRs) 1,916 2,036 2,010 2,496 2,295 2,410 2,530 2,700 2,885 3,010
Tax breaks to stimulate private social protection (not including pensions)1 2,165 2,245 2,826 3,245 4,753 5,165 5,290 5,310 5,510 5,965
Non-taxation of employer paid health and dental benefits .. .. .. .. 2,105 2,225 2,315 2,420 2,520 2,590Deductibility of charitable donations from corporate income tax 490 245 430 455 325 385 395 385 305 500Charitable Donation Tax Credit (excluding donations of cultural property and ecologically sensitive land) 1,490 1,825 2,233 2,510 2,118 2,320 2,330 2,315 2,450 2,575Non-taxation of capital gains on donations of publicly-listed securities (reduced inclusion rate for capital gains) - - 28 105 65 100 110 95 115 170First-Time Donor's Super Credit - - - - - - - - 5 5Non-taxation of non-profit organizations 185 175 135 175 140 125 125 70 90 90Registered Disability Savings Plan - - - - s 10 15 25 25 35
For information only: these items are not included in the sum of TBSPs, as that would constitute a double counting with the calculationis on Average Direct Tax Rates over benefit incomeExemption for certain supplies made by charities and non-profit organizations n.a. n.a. 810 845 895 865 955 865 890 945Rebate for qualifying non-profit organizations 60 70 75 70 70 75 70 65 65 65Rebate for registered charities 240 270 295 295 265 270 285 290 285 295Exemption for child care 130 135 155 135 135 120 120 130 135 140Exemption for health care services 325 495 665 585 515 585 585 610 640 680Rebate for specially equipped motor vehicles n.a. n.a. n.a. n.a. s s s s s sZero-rating of medical and assistive devices 120 160 185 190 290 310 320 325 335 350Zero-rating of prescription drugs 430 600 710 720 665 695 720 730 750 785Exemption and rebate for legal aid services 25 25 25 25 20 30 30 30 30 35
Memorandum item
Tax breaks for pensions (1+2+3+4) 5,390 13,980 22,535 30,765 21,030 27,885 28,050 34,525 37,595 40,360
Revenue foregone method:1 Pension Income Credit 405 430 420 975 965 1,010 1,035 1,065 1,100 1,1352 Registered retirement savings plans (RRSPs)
Deduction for contributions 6,225 6,000 6,820 7,405 7,005 7,330 7,480 7,705 8,050 8,090
Non-taxation of investment income 1,280 3,655 6,920 9,110 4,085 7,560 7,805 10,130 11,290 12,220
Taxation of withdrawals -3,465 -3,670 -4,280 -5,030 -4,375 -4,895 -5,330 -5,095 -5,440 -5,610
Net tax expenditure 4,040 5,985 9,460 11,485 6,715 9,995 9,955 12,740 13,900 14,700
3 Registered pension plans (RPPs)
Deduction for contributions 4,575 6,615 8,355 9,430 11,945 12,235 12,465 13,530 14,185 15,115
Non-taxation of investment income 2,785 7,525 11,580 14,825 7,145 11,035 11,290 13,875 15,840 17,260
Taxation of withdrawals -6,415 -6,575 -7,280 -6,790 -6,605 -7,285 -7,670 -7,725 -8,505 -8,960
Net tax expenditure 945 7,565 12,655 17,465 12,485 15,985 16,085 19,680 21,520 23,415
4 Pension Income Splitting - - - 840 865 895 975 1,040 1,075 1,110
Supplementary information:
Data supplied by Finance Canada, from Department of Finance Canada (2015, 2014, 2012, 2010, 2009, 2008, 2006, 2004, 2002), Tax Expenditures and Evaluations, Ottawa.1. Since 2001 Tax expenditures are for federal measures only cannot be considered complete, therefore cannot be compared to some other countries’ estimates, given that sub-national expenditures are not included. 1. The totals may overestimate total expenditure, as interactions between measures are not taken into account.
The sample used for the microdataset simulation was a stratified sample of approximately 450,000 records, weighted to represent all taxfilers in Canada. The sample is provided by the Canada Revenue Agency.2. "s" denotes a very small number that has been suppressed.
* The present-value estimates reflect the lifetime cost of a given year’s contributions. This definition is different from that used for the cash-flow estimates, and thus the two sets of estimates are not directly comparable.
OECD Social Expenditure database (www.oecd.org/social/expenditure.htm) // Base de données des dépenses sociales de l'OCDE (www.oecd.org/fr/social/depenses.htm) - Version 17-10-2016
CHILE
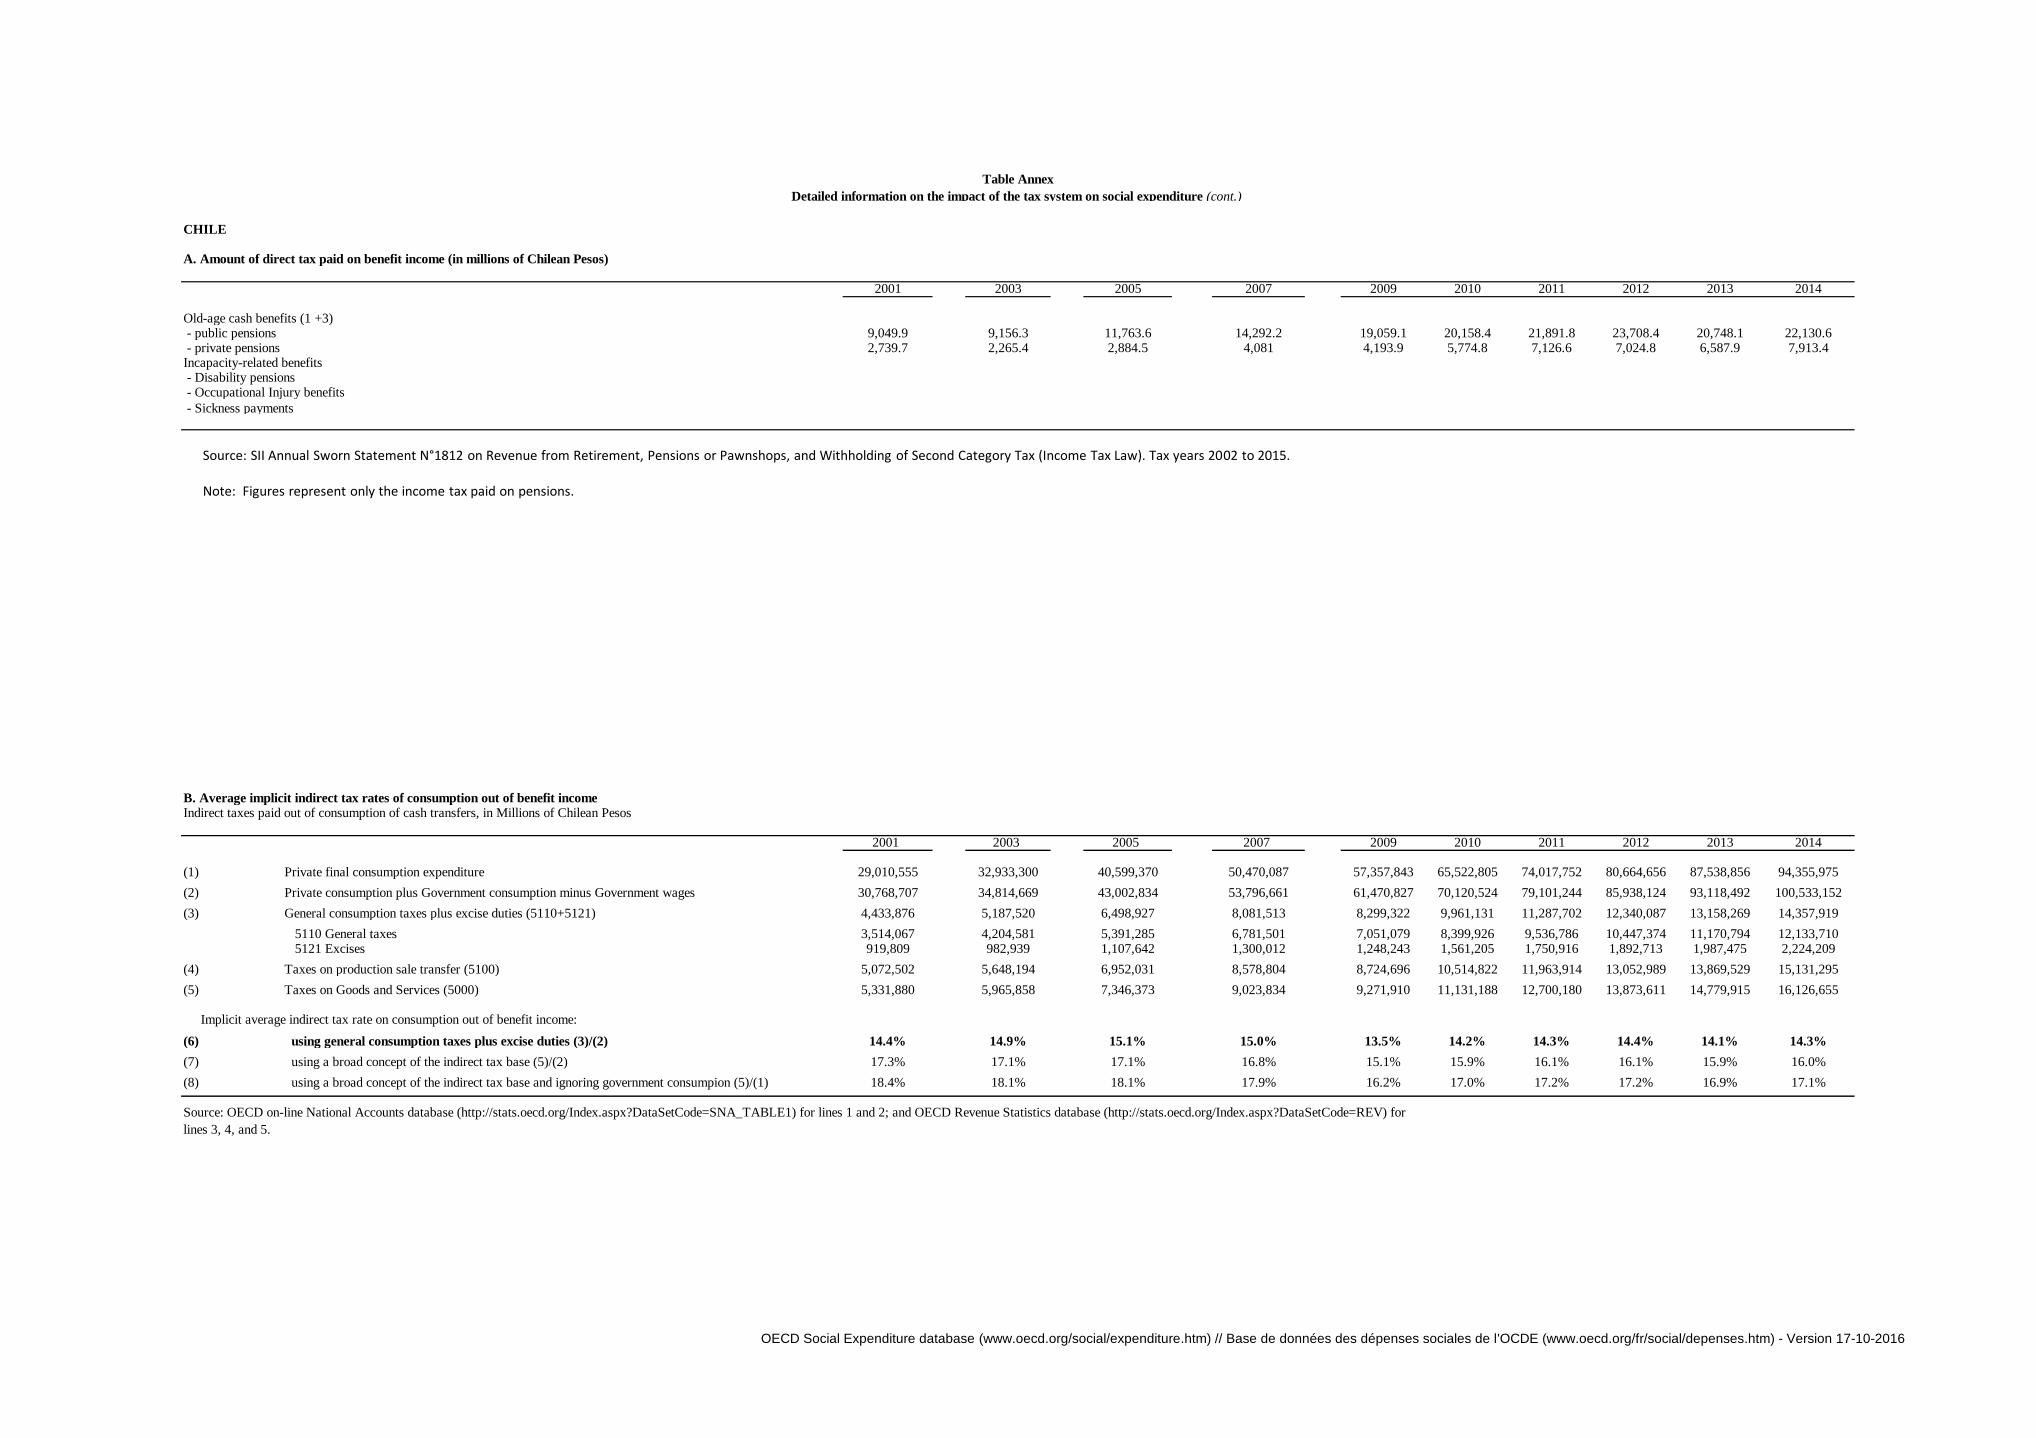
A. Amount of direct tax paid on benefit income (in millions of Chilean Pesos)
2001 2003 2005 2007 2009 2010 2011 2012 2013 2014
Old-age cash benefits (1 +3) - public pensions 9,049.9 9,156.3 11,763.6 14,292.2 19,059.1 20,158.4 21,891.8 23,708.4 20,748.1 22,130.6 - private pensions 2,739.7 2,265.4 2,884.5 4,081 4,193.9 5,774.8 7,126.6 7,024.8 6,587.9 7,913.4Incapacity-related benefits - Disability pensions - Occupational Injury benefits
- Sickness payments
B. Average implicit indirect tax rates of consumption out of benefit incomeIndirect taxes paid out of consumption of cash transfers, in Millions of Chilean Pesos
2001 2003 2005 2007 2009 2010 2011 2012 2013 2014
(1) Private final consumption expenditure 29,010,555 32,933,300 40,599,370 50,470,087 57,357,843 65,522,805 74,017,752 80,664,656 87,538,856 94,355,975
(2) Private consumption plus Government consumption minus Government wages 30,768,707 34,814,669 43,002,834 53,796,661 61,470,827 70,120,524 79,101,244 85,938,124 93,118,492 100,533,152
(3) General consumption taxes plus excise duties (5110+5121) 4,433,876 5,187,520 6,498,927 8,081,513 8,299,322 9,961,131 11,287,702 12,340,087 13,158,269 14,357,919
5110 General taxes 3,514,067 4,204,581 5,391,285 6,781,501 7,051,079 8,399,926 9,536,786 10,447,374 11,170,794 12,133,710 5121 Excises 919,809 982,939 1,107,642 1,300,012 1,248,243 1,561,205 1,750,916 1,892,713 1,987,475 2,224,209
(4) Taxes on production sale transfer (5100) 5,072,502 5,648,194 6,952,031 8,578,804 8,724,696 10,514,822 11,963,914 13,052,989 13,869,529 15,131,295
(5) Taxes on Goods and Services (5000) 5,331,880 5,965,858 7,346,373 9,023,834 9,271,910 11,131,188 12,700,180 13,873,611 14,779,915 16,126,655
Implicit average indirect tax rate on consumption out of benefit income:
(6) using general consumption taxes plus excise duties (3)/(2) 14.4% 14.9% 15.1% 15.0% 13.5% 14.2% 14.3% 14.4% 14.1% 14.3%
(7) using a broad concept of the indirect tax base (5)/(2) 17.3% 17.1% 17.1% 16.8% 15.1% 15.9% 16.1% 16.1% 15.9% 16.0%
(8) using a broad concept of the indirect tax base and ignoring government consumpion (5)/(1) 18.4% 18.1% 18.1% 17.9% 16.2% 17.0% 17.2% 17.2% 16.9% 17.1%
Table Annex
Detailed information on the impact of the tax system on social expenditure (cont.)
Source: OECD on-line National Accounts database (http://stats.oecd.org/Index.aspx?DataSetCode=SNA_TABLE1) for lines 1 and 2; and OECD Revenue Statistics database (http://stats.oecd.org/Index.aspx?DataSetCode=REV) for
lines 3, 4, and 5.
Source: SII Annual Sworn Statement N°1812 on Revenue from Retirement, Pensions or Pawnshops, and Withholding of Second Category Tax (Income Tax Law). Tax years 2002 to 2015. Note: Figures represent only the income tax paid on pensions.
OECD Social Expenditure database (www.oecd.org/social/expenditure.htm) // Base de données des dépenses sociales de l'OCDE (www.oecd.org/fr/social/depenses.htm) - Version 17-10-2016

CHILE
Table Annex
Detailed information on the impact of the tax system on social expenditure (cont.)
C. Tax breaks for social purposes (in Millions of Chilean Pesos)
2001 2003 2005 2007 2009 2010 2011 2012 2013 2014
Tax breaks similar to cash benefits 0 0 0 0 0 0 0 0 0 0
FamilyOther areas
Tax breaks to stimulate private social protection (not including pensions) a), b), c)
0.0 236,640 296,973 373,905 426,814 476,355 419,142 459,717 529,924 501,325
Item 1 Health insurance (Income tax - deduction) n.a 37,418 53,507 74,970 95,840 112,199 104,851 122,975 147,518 146,339Item 2 Unemploment insurance ( Income tax - deduction) n.a. 14,593 27,750 39,376 47,007 59,051 65,738 81,075 103,059Item 3 Donations for social purposes (Income tax - credit and deduction) 756 174 616 1,228 2,246 49 21 4Item 4 Income from renting DFL 2 housing (Income tax exempt) n.a. 108,141 108,207 116,643 134,815 136,580 142,696 148,003 152,819 83,389Item 5 Health services (VAT exempt) n.a. 81,016 106,659 137,309 138,909 159,523 94,408 103,960 120,993 144,797Item 6 Contributions to Private Health System (VAT exempt) n.a. 10,065 13,251 17,059 17,258 19,819 15,890 18,993 27,498 23,737Item 7 Refund of customs duties when importing equipment for disabled people n.a. n.a. n.a. n.a. n.a. n.a. n.a. n.a. n.a. n.a.Item 8 Lower customs duties for disabled people that import vehicles with special features n.a. n.a. n.a. n.a. n.a. n.a. n.a. n.a. n.a. n.a.
Memorandum Items
Tax breaks for pensions d), e)
n.a. 127,843 356,289 800,612 129,090 1,431,687 792,756 199,270 540,501 610,395
n.a. 54,466 71,985 100,980 129,090 151,125 171,078 199,270 201,768 226,326
- Non-taxation of investment of private pension funds n.a. 73,377 284,304 699,632 0 1,280,562 621,677 0 338,733 384,069
- Deduction of contributions to private pensions (e.g occupational pension plans, individual retirement accounts, RRSPs,
Superannuation, etc)
Source: Tax Expenditure Reports, elaborated by Servicio de Impuestos Internos (Chilean Internal Revenue Service). Note: a) Tax expenditure measurement began in 2002 and is made on a cash basis. b) Tax breaks concerning pensions (compulsory or voluntary) were excluded.
OECD Social Expenditure database (www.oecd.org/social/expenditure.htm) // Base de données des dépenses sociales de l'OCDE (www.oecd.org/fr/social/depenses.htm) - Version 17-10-2016

CZECH REPUBLIC
A. Amount of direct tax paid on benefit income (in millions of Czech koruny)
2001 2003 2005 2007 2009 2010 2011 2012 2013Total tax paid on transfer income old-age pensions 1.0 3.0 14.6 11.0 3.7 5.3 8.6 12.5 16.1
Source: Ministry of Finance, Tax Policy Unit; Czech Social Security Administation.
B. Average implicit indirect tax rates of consumption out of benefit incomeIndirect taxes paid out of consumption of cash transfers, in millions of Czech koruny
2001 2003 2005 2007 2009 2010 2011 2012 2013
(1) Private final consumption expenditure 1,284,892 1,406,227 1,566,462 1,775,163 1,917,902 1,947,082 1,984,240 1,997,914 2,029,819
(2) Private consumption plus Government consumption minus Government wages 1,611,646 1,803,635 1,992,942 2,238,113 2,436,570 2,470,926 2,426,419 2,421,183 2,464,584
(3) General consumption taxes plus excise duties (5110+5121) 226,686 251,925 325,652 365,780 395,831 401,858 426,291 437,834 453,582
5110 General taxes 149,893 164,250 215,118 232,288 258,627 263,457 276,533 286,116 303,822 5121 Excises 76,793 87,675 110,534 133,492 137,203 138,401 149,757 151,719 149,760
(4) Taxes on production sale transfer (5100) 236,864 262,453 325,861 365,998 396,042 402,072 426,528 438,090 453,863
(5) Taxes on Goods and Services (5000) 255,029 285,108 350,949 393,041 421,958 427,813 452,578 463,459 478,386
Implicit average indirect tax rate on consumption out of benefit income:
(6) using general consumption taxes plus excise duties (3)/(2) 14.1% 14.0% 16.3% 16.3% 16.2% 16.3% 17.6% 18.1% 18.4%
(7) using a broad concept of the indirect tax base (5)/(2) 15.8% 15.8% 17.6% 17.6% 17.3% 17.3% 18.7% 19.1% 19.4%
(8) using a broad concept of the indirect tax base and ignoring government consumpion (5)/(1) 19.8% 20.3% 22.4% 22.1% 22.0% 22.0% 22.8% 23.2% 23.6%
Table Annex
Detailed information on the impact of the tax system on social expenditure (cont.)
Source: OECD on-line National Accounts database (http://stats.oecd.org/Index.aspx?DataSetCode=SNA_TABLE1) for lines 1 and 2; and OECD Revenue Statistics database
(http://stats.oecd.org/Index.aspx?DataSetCode=REV) for lines 3, 4, and 5.
OECD Social Expenditure database (www.oecd.org/social/expenditure.htm) // Base de données des dépenses sociales de l'OCDE (www.oecd.org/fr/social/depenses.htm) - Version 17-10-2016
CZECH REPUBLIC
Table Annex
Detailed information on the impact of the tax system on social expenditure (cont.)
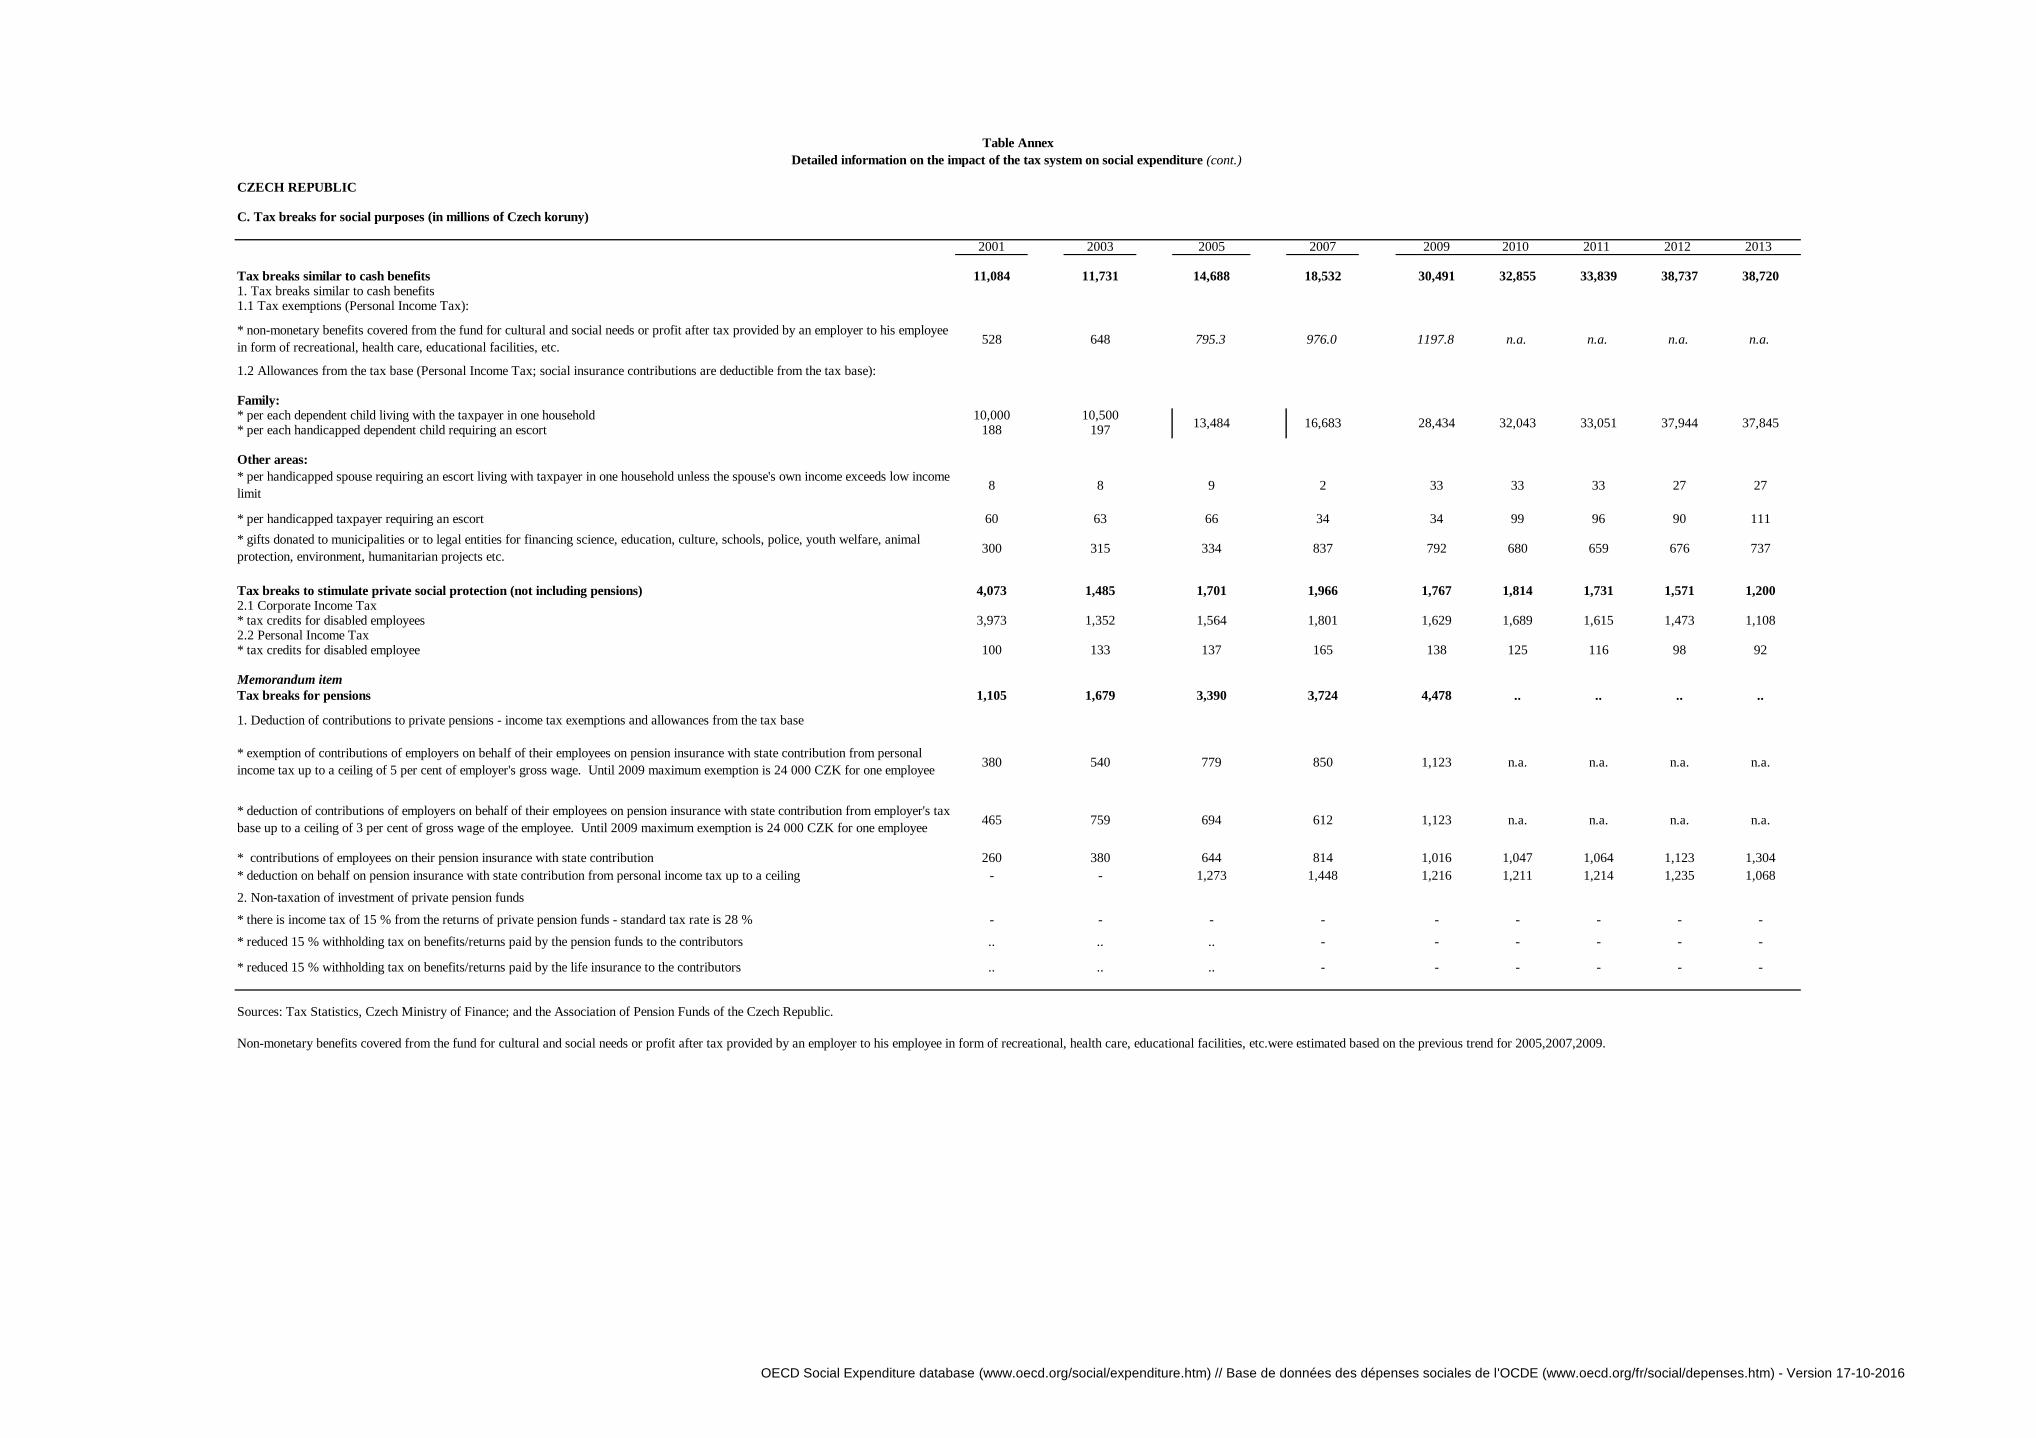
C. Tax breaks for social purposes (in millions of Czech koruny)
2001 2003 2005 2007 2009 2010 2011 2012 2013
Tax breaks similar to cash benefits 11,084 11,731 14,688 18,532 30,491 32,855 33,839 38,737 38,7201. Tax breaks similar to cash benefits1.1 Tax exemptions (Personal Income Tax):
528 648 795.3 976.0 1197.8 n.a. n.a. n.a. n.a.
1.2 Allowances from the tax base (Personal Income Tax; social insurance contributions are deductible from the tax base):
Family: * per each dependent child living with the taxpayer in one household 10,000 10,500* per each handicapped dependent child requiring an escort 188 197
Other areas:
8 8 9 2 33 33 33 27 27
* per handicapped taxpayer requiring an escort 60 63 66 34 34 99 96 90 111
300 315 334 837 792 680 659 676 737
Tax breaks to stimulate private social protection (not including pensions) 4,073 1,485 1,701 1,966 1,767 1,814 1,731 1,571 1,2002.1 Corporate Income Tax* tax credits for disabled employees 3,973 1,352 1,564 1,801 1,629 1,689 1,615 1,473 1,1082.2 Personal Income Tax* tax credits for disabled employee 100 133 137 165 138 125 116 98 92
Memorandum item
Tax breaks for pensions 1,105 1,679 3,390 3,724 4,478 .. .. .. ..
1. Deduction of contributions to private pensions - income tax exemptions and allowances from the tax base
380 540 779 850 1,123 n.a. n.a. n.a. n.a.
465 759 694 612 1,123 n.a. n.a. n.a. n.a.
* contributions of employees on their pension insurance with state contribution 260 380 644 814 1,016 1,047 1,064 1,123 1,304
* deduction on behalf on pension insurance with state contribution from personal income tax up to a ceiling - - 1,273 1,448 1,216 1,211 1,214 1,235 1,068
2. Non-taxation of investment of private pension funds
* there is income tax of 15 % from the returns of private pension funds - standard tax rate is 28 % - - - - - - - - -
* reduced 15 % withholding tax on benefits/returns paid by the pension funds to the contributors .. .. .. - - - - - -
* reduced 15 % withholding tax on benefits/returns paid by the life insurance to the contributors .. .. .. - - - - - -
Sources: Tax Statistics, Czech Ministry of Finance; and the Association of Pension Funds of the Czech Republic.
Non-monetary benefits covered from the fund for cultural and social needs or profit after tax provided by an employer to his employee in form of recreational, health care, educational facilities, etc.were estimated based on the previous trend for 2005,2007,2009.
* non-monetary benefits covered from the fund for cultural and social needs or profit after tax provided by an employer to his employee
in form of recreational, health care, educational facilities, etc.
13,484 16,683 28,434 32,043 33,051 37,944 37,845
* per handicapped spouse requiring an escort living with taxpayer in one household unless the spouse's own income exceeds low income
limit
* gifts donated to municipalities or to legal entities for financing science, education, culture, schools, police, youth welfare, animal
protection, environment, humanitarian projects etc.
* exemption of contributions of employers on behalf of their employees on pension insurance with state contribution from personal
income tax up to a ceiling of 5 per cent of employer's gross wage. Until 2009 maximum exemption is 24 000 CZK for one employee
* deduction of contributions of employers on behalf of their employees on pension insurance with state contribution from employer's tax
base up to a ceiling of 3 per cent of gross wage of the employee. Until 2009 maximum exemption is 24 000 CZK for one employee
OECD Social Expenditure database (www.oecd.org/social/expenditure.htm) // Base de données des dépenses sociales de l'OCDE (www.oecd.org/fr/social/depenses.htm) - Version 17-10-2016

DENMARK No Social security <2012 and onwards>
A. Average Itemised Tax Rates - AITR %
2001 2003 2005 2007 2009 2010 2011 2012 2013
Tax and
Social security
Tax and
Social
security
Tax and
Social
security
Tax and
Social
security
Tax and
Social
security
Tax and
Social
security
Tax and
Social
security
Tax and
Social
security
Tax and
Social
security
1 Social pension
- state old age pension 27.68 (98%) 27.20 (98%) 27.25 (98%) 27.13 (98%) 26.54 (98%) 26.40 ('98%') 26.52 ('98%') 26.27 0.99 27.00 0.99
- disability pension 26.92 (75%) 26.22 (75%) 26.38 (77%) 27.16 (85%) 27.08 (88%) 27.05 ('89 %') 27.30 ('90 %') 27.21 0.91 27.89 0.92
- anticipated old age pension 23.78 (84%) 23.69 (84%) 26.57 (90%) 23.37 (76%) 23.06 (76%) 22.78 ('76%') 23.07 ('76 %') 23.06 0.78 23.99 0.78
2 Supplementary pensions (ATP) 30.68 29.79 29.83 29.56 28.95 28.57 28.45 28.13 28.71
3 Civil servants pension 34.77 34.00 33.66 33.81 33.31 31.98 31.97 31.44 31.70
4 Early retirement pensions (Delpension) 32.30 31.48 30.19 30.00 30.00 30 30 30 30
5 Sickness benefit 36.36 36.49 36.75 35.16 33.43 32.84 32.67 29.97 29.92
6 Parental leave 28.85 28.56 28.69 29.47 29.78 28.32 -'
7 Unemployment benefits 32.78 32.66 32.58 30.80 30.22 29.69 29.96 26.11 26.64
8 Early retirement benefits 29.38 28.16 28.09 30.29 29.78 29.59 29.7 26.95 27.68
9 Occupational accidents - except: 36.07 32.05 36.29 32.70 32.70 36.20 32.82 31.13 31.93
Occupational accidents and decease (10.3.1.3.1) 35.34 (22%) 35.09 (23%) 33.89 (26%) 32.12 32.29 31.95 32.18
War victims, accidents, sailors (10.3.1.5.5) (60%) 32.70 (40%) 32.70 (39%) 36.20 32.82 32.82 31.21
Handicapped children and adults (10.3.1.5.4) (47%) 39.85 (41%) 38.04 (47%) 36.99 37.03 35.02 34.22
10 Survivors 10.00 10.00 10.00 10.00 10.00 10 10 10 10
11 Childbirth benefit (barsel) 39.71 37.21 37.59 35.44 34.35 33.94 34.09 31.57 31.25
12 Items under active labour market policy
- Measures by regional labour market councils 26.89 26.42 26.02 25.37 23.75 23.24 23.70 25.05 24.21
- Employment measures for disabled 31.30 30.72 30.87 30.21 28.50 29.31 29.55 27.08 28.49
13 Other, war victims 35.30 (90%) 33.95 (90%) 33.50 (84%) 33.46 (88%) 32.78 (89%) 31.55 ('87%') 31.41 ('87%') 27.20 100 25.39 100
14 Other, wage earn. Guar. Fond. 44.10 39.31 35.40 37.48 37.73 37.46 37.87 34.45 35.02
15 Cash payments to refugees (10.9.1.2.1) 5.70 3.18 5.17 4.73 6.12 9.31 9.2
16 Low income 26.73 26.04 25.80 24.97 23.75 23.24 23.70 25.05 24.21
17 Transfers taxed as wages 43.54 42.07 41.21 39.85 38.04 36.99 37.03 35.02 34.22
In parentheses: proportion of spending subject to taxation if not 100%.
B. Average implicit indirect tax rates of consumption out of benefit income
Indirect taxes paid out of consumption of cash transfers, in millions Danish kroner
2001 2003 2005 2007 2009 2010 2011 2012 2013
(1) Private final consumption expenditure 640,633 678,795 757,919 825,592 834,603 861,835 884,301 908,702 914,493
(2) Private consumption plus Government consumption minus Government wages 758,248 804,509 898,246 982,010 1,014,139 1,044,224 1,064,712 1,095,698 1,101,377
(3) General consumption taxes plus excise duties (5110+5121) 196,031 204,715 232,644 256,629 235,329 244,568 250,659 259,209 262,479
5110 General taxes 125,829 132,588 154,111 174,049 166,871 170,852 175,620 180,778 180,947
5121 Excises 70,202 72,127 78,533 82,581 68,457 73,717 75,039 78,431 81,532
(4) Taxes on production sale transfer (5100) 200,850 210,529 239,350 263,151 241,093 249,992 256,085 263,821 266,857
(5) Taxes on Goods and Services (5000) 212,411 222,696 252,703 281,899 259,994 269,587 276,477 284,565 289,722
Implicit average indirect tax rate on consumption out of benefit income:
(6) using general consumption taxes plus excise duties (3)/(2) 25.9% 25.4% 25.9% 26.1% 23.2% 23.4% 23.5% 23.7% 23.8%
(7) using a broad concept of the indirect tax base (5)/(2) 28.0% 27.7% 28.1% 28.7% 25.6% 25.8% 26.0% 26.0% 26.3%
(8) using a broad concept of the indirect tax base and ignoring government consumpion (5)/(1) 33.2% 32.8% 33.3% 34.1% 31.2% 31.3% 31.3% 31.3% 31.7%
C. Tax breaks for social purposes (in millions of Danish kroner)
2001 2003 2005 2007 2009 2010 2011 2012 2013
Tax breaks similar to cash benefits 182 189 201 0 0 0 0 0 0
Family:
Other areas:
Supplement for older people "Engangsbelob" (67+) 135 140 147 .. .. .. .. .. ..
Capital tax reduction for older people (67+) 0 0
Housing for older people "Plejehjem" 47 49 54 .. .. .. .. .. ..
Tax breaks to stimulate private social protection (not including pensions) 0 0 0 0 0 0 0 0 0
Memorandum item
Tax breaks for pensions 0 0 0 0 0 0 0 0 0
Source: Ministry of Finance, Denmark.
Table Annex
Detailed information on the impact of the tax system on social expenditure (cont.)
Source: OECD on-line National Accounts database (http://stats.oecd.org/Index.aspx?DataSetCode=SNA_TABLE1) for lines 1 and 2; and OECD Revenue Statistics database (http://stats.oecd.org/Index.aspx?DataSetCode=REV)
for lines 3, 4, and 5.
OECD Social Expenditure database (www.oecd.org/social/expenditure.htm) // Base de données des dépenses sociales de l'OCDE (www.oecd.org/fr/social/depenses.htm) - Version 17-10-2016

ESTONIA
A. Average Itemised Tax Rates (AITR %)
2007 2009 2010 2011 2012 2013
Total tax paid (including soc. sec. cont.) over transfer income .. 2.2 2.0 3.5 4.4
- pensions 2.7 2.6 2.7 3.1 old age pensions 7.5 7.4 7.5 7.7 disability pension 0.4 0.3 0.4 0.5 survivor's pension 0.1 0.1 0.1 1.1
- benefits for temporary incapacity for work 16.1 15.8 16.2 17.0
- unemployment benefits 17.1 16.8 17.1 17.0 income tax: unemployment insurance benefit 9.5 8.9 9.7 9.7 insurance benefit upon lay-off 20.9 20.8 20.8 20.7 benefit upon insolvency of employer 20.9 20.8 20.7 20.7 social security contributions: insurance benefit upon lay-off benefit upon insolvency of employer
- family benefits 18.8 18.7 18.8 18.8 maternity benefit 18.8 18.7 18.8 18.8 parental benefit
B. Average implicit indirect tax rates of consumption out of benefit income
Indirect taxes paid out of consumption of cash transfers, in Millions of Estonian kroon (EEK).
2007 2009 2010 2011 2012 2013
(1) Private final consumption expenditure 8,670 7,551 7,689 8,427 9,104 9,738
(2) Private consumption plus Government consumption minus Government wages 9,739 8,753 8,937 9,752 10,570 11,293
(3) General consumption taxes plus excise duties (5110+5121) 2,000 1,922 1,881 2,091 2,304 2,354
5110 General taxes 1,423 1,224 1,263 1,380 1,513 1,558 5121 Excises 577 697 619 711 791 796
(4) Taxes on production sale transfer (5100) 2,033 1,942 1,905 2,113 2,328 2,380
(5) Taxes on Goods and Services (5000) 2,101 2,004 1,959 2,173 2,387 2,445
Implicit average indirect tax rate on consumption out of benefit income:
Table Annex
Detailed information on the impact of the tax system on social expenditure (cont.)
OECD Social Expenditure database (www.oecd.org/social/expenditure.htm) // Base de données des dépenses sociales de l'OCDE (www.oecd.org/fr/social/depenses.htm) -
Version 17-10-2016

ESTONIA
Table Annex
Detailed information on the impact of the tax system on social expenditure (cont.)
(6) using general consumption taxes plus excise duties (3)/(2) 20.5% 22.0% 21.0% 21.4% 21.8% 20.8%
(7) using a broad concept of the indirect tax base (5)/(2) 21.6% 22.9% 21.9% 22.3% 22.6% 21.7%
(8) using a broad concept of the indirect tax base and ignoring government consumpion (5)/(1) 24.2% 26.5% 25.5% 25.8% 26.2% 25.1%
C. Tax breaks for social purposes (in Millions of EUR).
2007 2009 2010 2011 2012 2013
Tax breaks similar to cash benefits 38.6 41.0 38.1 38.9 39.5 40.4
Family: 38.6 41.0 38.1 38.9 39.5 40.4
Increased basic exemption upon provision of maintenance to child Additional allowance for 2nd+ children, accrual 22.6 24.8 24.2 24.7 25.2 25.8Deduction from tax base: educational expenses, accrual 14.3 14.5 14.0 14.1 14.3 14.6Deduction from tax base: education loan interests, accrual 1.6 1.7 0.0 0.0 0.0 0.0
Not included in the totalAdditional allowance for couple, accrual 32.7 34.9 35.2 34.2 34.2 32.8
Other areas: 30.6 27.9 17.9 20.2 17.3 12.2
Deduction from tax base: mortgage interest payments, accrual 30.6 27.9 17.9 20.2 17.3 12.2
Tax breaks to stimulate private social protection (not including pensions) 10.3 6.8 6.3 6.1 5.9 6.4
Deduction from tax base: contributions to voluntary pension funds, accrual 10.3 6.8 6.3 6.1 5.9 6.4
Memorandum Items
Tax breaks for pensions 76.8 110.6 113.9 114.2 119.1 125.8
Additional allowance for pensioners, this is not cash benefit but tax expenditure 76.8 110.6 113.9 114.2 119.1 125.8
Source: Estonian Tax and Customs Board
Source: OECD on-line National Accounts database (http://stats.oecd.org/Index.aspx?DataSetCode=SNA_TABLE1) for lines 1 and 2; and OECD Revenue
Statistics database (http://stats.oecd.org/Index.aspx?DataSetCode=REV) for lines 3, 4, and 5.
OECD Social Expenditure database (www.oecd.org/social/expenditure.htm) // Base de données des dépenses sociales de l'OCDE (www.oecd.org/fr/social/depenses.htm) -
Version 17-10-2016

FINLAND
A. Average Itemised Tax Rates (%)
2001 2003 2005 2007 2009 2010 2011 2012 20131 Old-age cash benefits1a - public pensions 19.7 19.4 19.9 20.0 17.9 17.9 18.2 18.2 18.61c - private pensions 28.6 28.9 28.7 28.4 25.5 26.0 25.6 25.2 27.82 Survivors' benefits2a - public pensions 19.1 19.8 19.9 18.6 16.9 17.0 15.8 16.5 16.43 Incapacity-related benefits3a - Disability pensions 17.5 17.6 16.5 15.5 12.9 11.9 12.5 12.6 12.63b - Occupational Injury benefits 26.2 23.5 24.3 23.0 21.9 21.7 23.1 21.4 22.83c - Sickness payments 26.8 24.4 24.5 22.4 21.9 21.7 21.5 21.4 21.54 Family cash benefits 4a - Family benefits 15.8 15.4 14.6 15.14b - Maternity and parental leave payments 21.7 21.5 21.6 19.7 20.1 20.0 20.6 19.7 21.65 Active labour market policies5a - benefits while on training 19.4 19.9 20.0 18.5 19.1 20.5 21.2 19.7 24.46 Unemployment6a - unemployment insurance benefit 20.5 20.5 20.5 18.9 18.4 19.3 18.9 19.5 20.56b - unemployment assistance benefit 18.6 18.1 18.2 17.8 15.9 14.7 14.9 14.4 15.3
Source : Ministry of Finance.
B. Average implicit indirect tax rates of consumption out of benefit income
Indirect taxes paid out of consumption of cash transfers, in millions of euros
2001 2003 2005 2007 2009 2010 2011 2012 2013
(1) Private final consumption expenditure 68,771 75,526 81,876 91,052 95,212 99,553 105,771 109,108 111,277
(2) Private consumption plus Government consumption minus Government wages 79,461 87,551 95,370 106,532 113,252 117,820 124,813 129,229 132,460
(3) General consumption taxes plus excise duties (5110+5121) 16,789 18,689 19,713 21,220 21,064 21,819 24,634 25,501 26,399
5110 General taxes 11,118 12,487 13,748 15,207 15,176 15,533 17,315 17,987 18,888 5121 Excises 5,671 6,202 5,965 6,013 5,888 6,286 7,319 7,514 7,511
(4) Taxes on production sale transfer (5100) 18,004 20,043 21,188 22,754 22,700 23,491 26,407 27,355 28,496
(5) Taxes on Goods and Services (5000) 18,482 20,570 21,782 23,425 23,419 24,256 27,240 28,186 29,430
Implicit average indirect tax rate on consumption out of benefit income:
(6) using general consumption taxes plus excise duties (3)/(2) 21.1% 21.3% 20.7% 19.9% 18.6% 18.5% 19.7% 19.7% 19.9%
(7) using a broad concept of the indirect tax base (5)/(2) 23.3% 23.5% 22.8% 22.0% 20.7% 20.6% 21.8% 21.8% 22.2%
(8) using a broad concept of the indirect tax base and ignoring government consumpion (5)/(1) 26.9% 27.2% 26.6% 25.7% 24.6% 24.4% 25.8% 25.8% 26.4%
Table Annex
Detailed information on the impact of the tax system on social expenditure (cont.)
The micro-simulation model used in the Ministry of Finance is based on a representative sample of some 25 000 individual taxpayers. The model is used for the planning of national tax policies and for estimating the effect of tax policy alterations on tax
revenues and on the income tax liabilities of taxpayers at different income levels. The information is in principle collected for the Income Distribution Survey from Statistics Finland. The sample covers about 0,5% of the total taxpayer population, but the
model has been made representative for the total taxpayer population. The dataset is updated annually.There is a break in series in 2009 for unemployment average itemised tax rates resulting from a change in definition.
Source: OECD on-line National Accounts database (http://stats.oecd.org/Index.aspx?DataSetCode=SNA_TABLE1) for lines 1 and 2; and OECD Revenue Statistics database
(http://stats.oecd.org/Index.aspx?DataSetCode=REV) for lines 3, 4, and 5.
OECD Social Expenditure database (www.oecd.org/social/expenditure.htm) // Base de données des dépenses sociales de l'OCDE (www.oecd.org/fr/social/depenses.htm) - Version 17-10-2016

FINLAND
Table Annex
Detailed information on the impact of the tax system on social expenditure (cont.)
C. Tax breaks for social purposes (in millions of euros)
2001 2003 2005 2007 2009 2010 2011 2012 2013
Tax breaks similar to cash benefits 0 0 0 0 0 0 0 0 0
Family:
Other areas:
Tax breaks to stimulate private social protection (not including pensions) 0 0 0 0 0 0 0 0 0
Cash donations to Charities
Memorandum Items
Tax breaks for pension 170 205 220 125 130 125 125 120 105
- Deduction of contributions to private pensions 170 205 220 125 130 125 125 120 105
Source: Ministry of Finance, Finland.
Ministry of Finance (2001), Hallituksen kertomus Valtiovarain Hoidosta Ja Tilasta Vuonna 2000, helsinki
The micro-simulation model used in the Ministry of Finance is based on a representative sample of some 25.000 individual taxpayers. The model is used for the planning of national tax policies and for estimating the effect of tax policy alterations on tax revenues and on the
income tax liabilities of taxpayers at different income levels. The information is in principle collected for the Income Distribution Survey from Statistics Finland. The sample covers about 0,5% of the total taxpayer population, but the model has been made representative for
the total taxpayer population. The data set is updated annually.
OECD Social Expenditure database (www.oecd.org/social/expenditure.htm) // Base de données des dépenses sociales de l'OCDE (www.oecd.org/fr/social/depenses.htm) - Version 17-10-2016
FRANCE
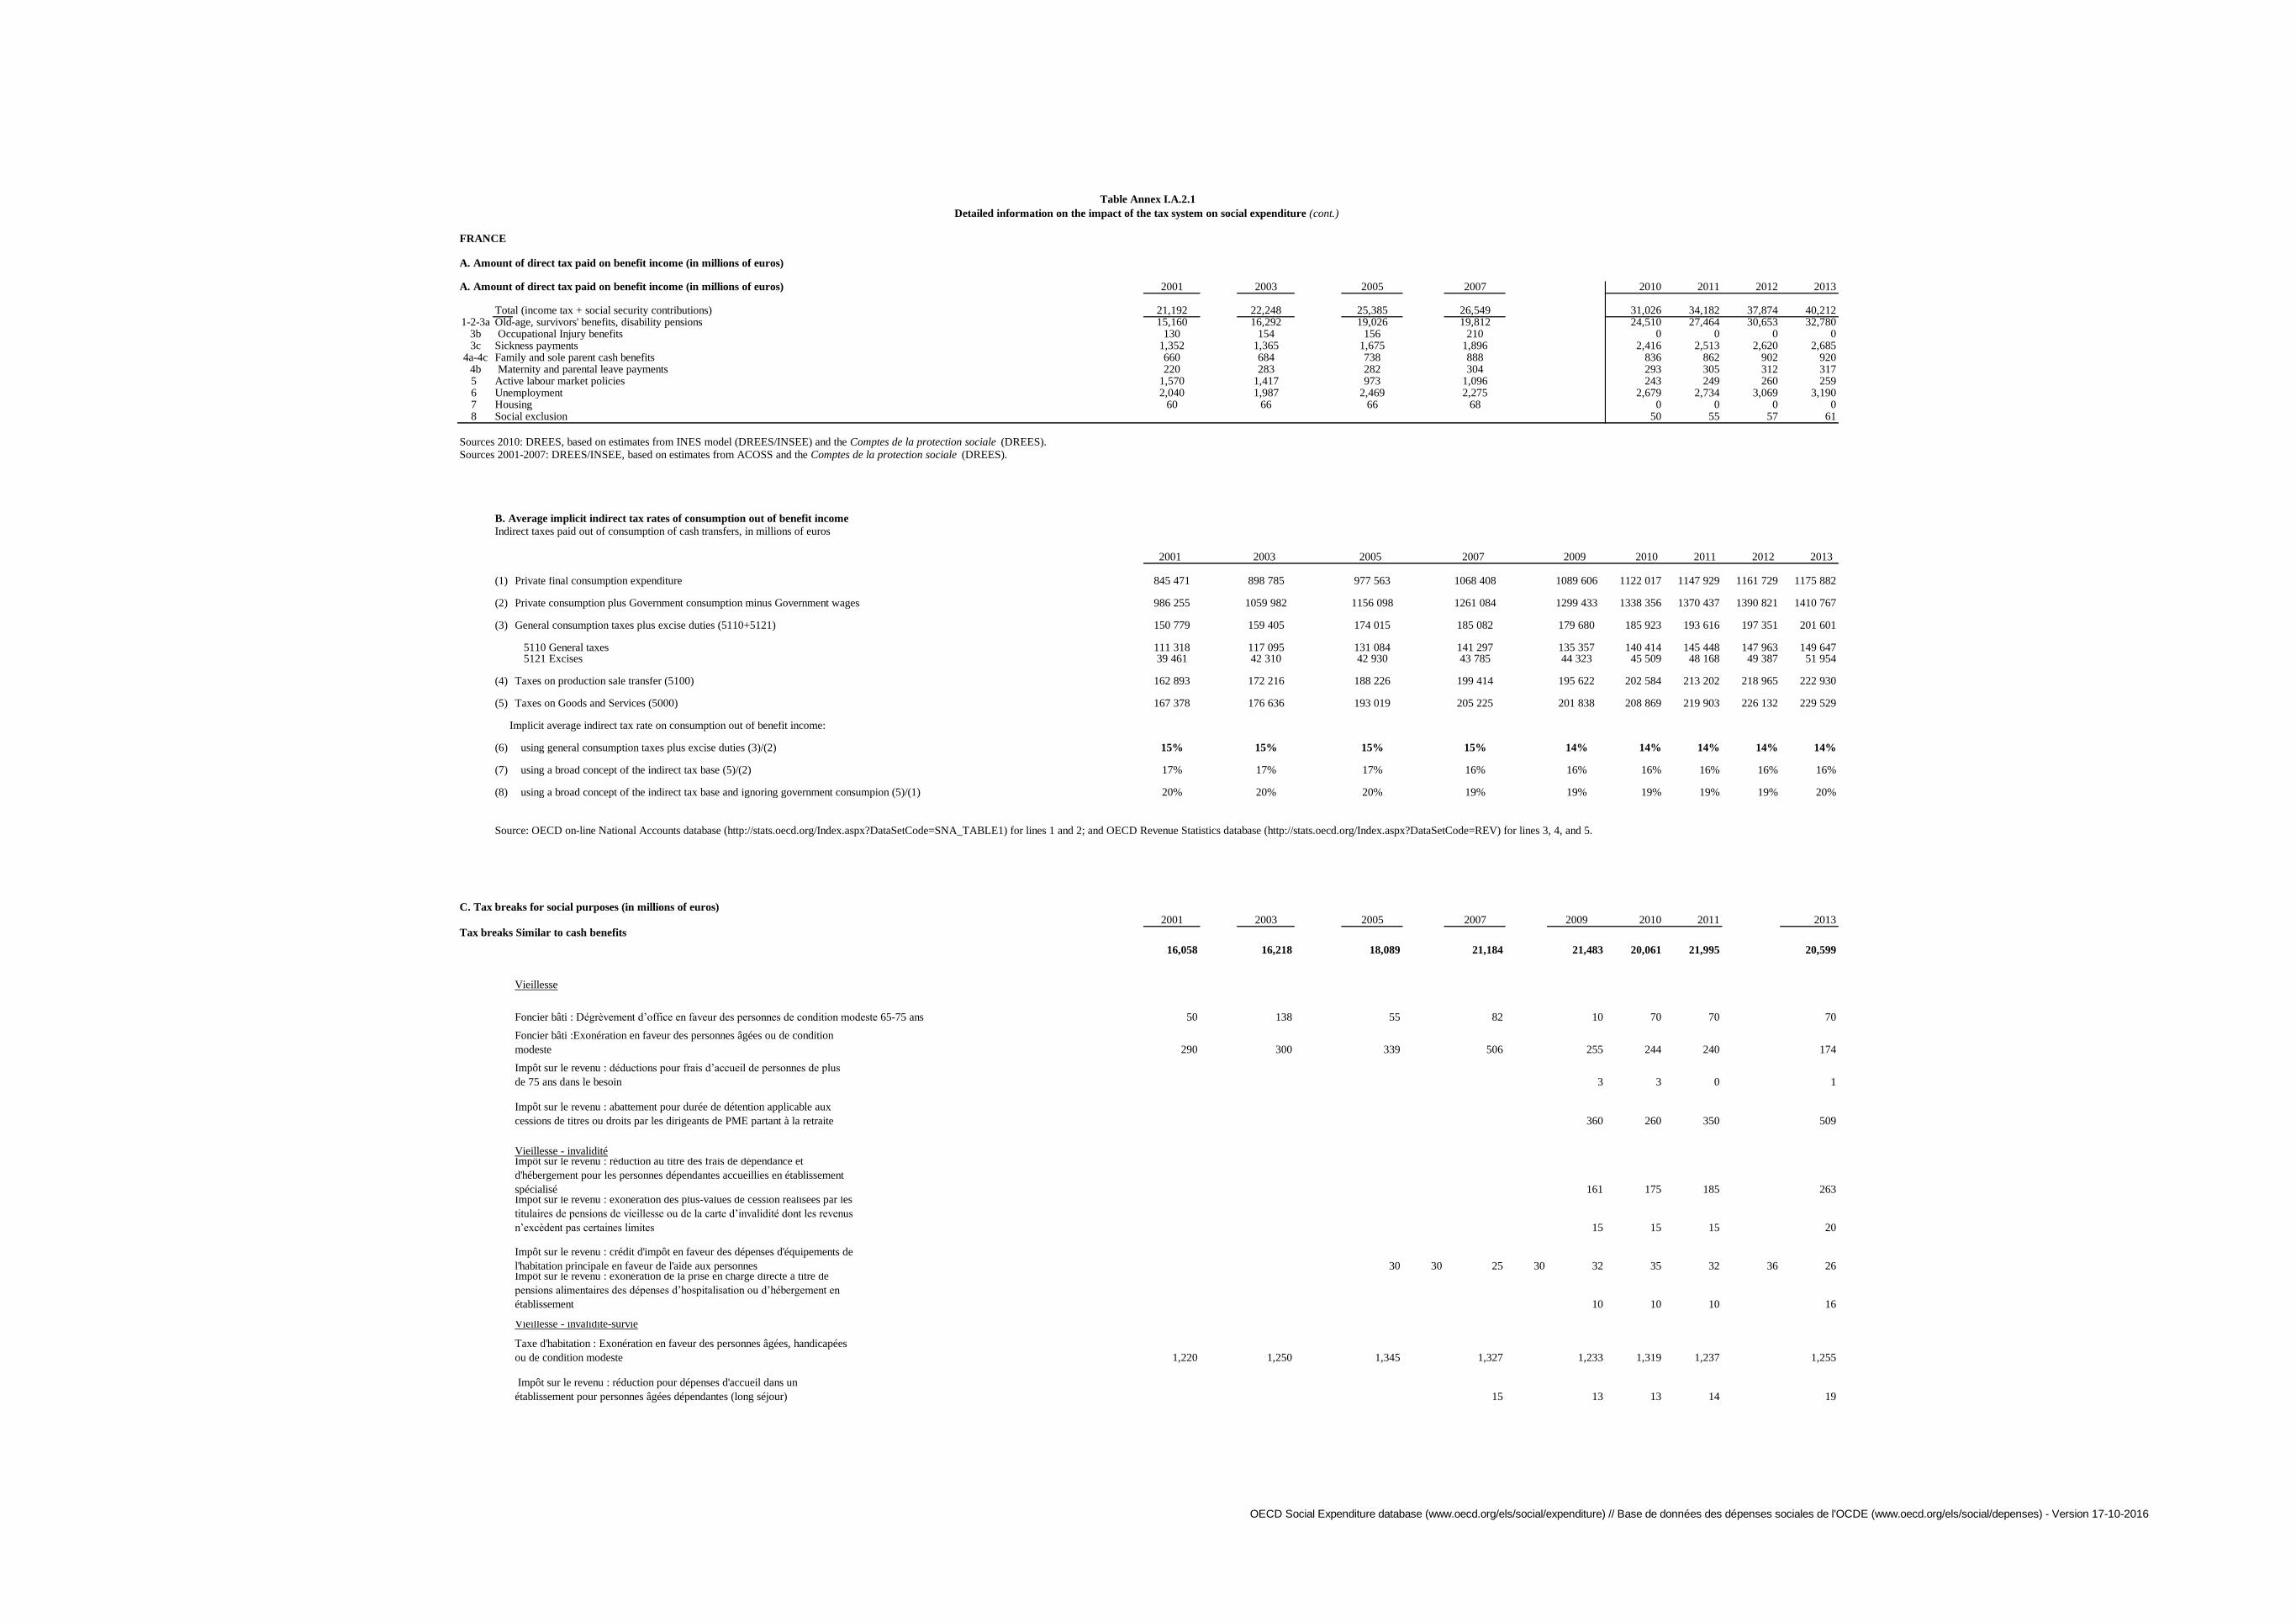
A. Amount of direct tax paid on benefit income (in millions of euros)
A. Amount of direct tax paid on benefit income (in millions of euros) 2001 2003 2005 2007 2010 2011 2012 2013
Total (income tax + social security contributions) 21,192 22,248 25,385 26,549 31,026 34,182 37,874 40,2121-2-3a Old-age, survivors' benefits, disability pensions 15,160 16,292 19,026 19,812 24,510 27,464 30,653 32,780
3b Occupational Injury benefits 130 154 156 210 0 0 0 03c Sickness payments 1,352 1,365 1,675 1,896 2,416 2,513 2,620 2,685
4a-4c Family and sole parent cash benefits 660 684 738 888 836 862 902 9204b Maternity and parental leave payments 220 283 282 304 293 305 312 3175 Active labour market policies 1,570 1,417 973 1,096 243 249 260 2596 Unemployment 2,040 1,987 2,469 2,275 2,679 2,734 3,069 3,1907 Housing 60 66 66 68 0 0 0 08 Social exclusion 50 55 57 61
Sources 2010: DREES, based on estimates from INES model (DREES/INSEE) and the Comptes de la protection sociale (DREES).
Sources 2001-2007: DREES/INSEE, based on estimates from ACOSS and the Comptes de la protection sociale (DREES).
B. Average implicit indirect tax rates of consumption out of benefit income
Indirect taxes paid out of consumption of cash transfers, in millions of euros
2001 2003 2005 2007 2009 2010 2011 2012 2013
(1) Private final consumption expenditure 845 471 898 785 977 563 1068 408 1089 606 1122 017 1147 929 1161 729 1175 882
(2) Private consumption plus Government consumption minus Government wages 986 255 1059 982 1156 098 1261 084 1299 433 1338 356 1370 437 1390 821 1410 767
(3) General consumption taxes plus excise duties (5110+5121) 150 779 159 405 174 015 185 082 179 680 185 923 193 616 197 351 201 601
5110 General taxes 111 318 117 095 131 084 141 297 135 357 140 414 145 448 147 963 149 647 5121 Excises 39 461 42 310 42 930 43 785 44 323 45 509 48 168 49 387 51 954
(4) Taxes on production sale transfer (5100) 162 893 172 216 188 226 199 414 195 622 202 584 213 202 218 965 222 930
(5) Taxes on Goods and Services (5000) 167 378 176 636 193 019 205 225 201 838 208 869 219 903 226 132 229 529
Implicit average indirect tax rate on consumption out of benefit income:
(6) using general consumption taxes plus excise duties (3)/(2) 15% 15% 15% 15% 14% 14% 14% 14% 14%
(7) using a broad concept of the indirect tax base (5)/(2) 17% 17% 17% 16% 16% 16% 16% 16% 16%
(8) using a broad concept of the indirect tax base and ignoring government consumpion (5)/(1) 20% 20% 20% 19% 19% 19% 19% 19% 20%
Source: OECD on-line National Accounts database (http://stats.oecd.org/Index.aspx?DataSetCode=SNA_TABLE1) for lines 1 and 2; and OECD Revenue Statistics database (http://stats.oecd.org/Index.aspx?DataSetCode=REV) for lines 3, 4, and 5.
C. Tax breaks for social purposes (in millions of euros)
2001 2003 2005 2007 2009 2010 2011 2013
Tax breaks Similar to cash benefits
16,058 16,218 18,089 21,184 21,483 20,061 21,995 20,599
Vieillesse
Foncier bâti : Dégrèvement d’office en faveur des personnes de condition modeste 65-75 ans 50 138 55 82 10 70 70 70
Foncier bâti :Exonération en faveur des personnes âgées ou de condition
modeste 290 300 339 506 255 244 240 174
Impôt sur le revenu : déductions pour frais d’accueil de personnes de plus
de 75 ans dans le besoin 3 3 0 1
Impôt sur le revenu : abattement pour durée de détention applicable aux
cessions de titres ou droits par les dirigeants de PME partant à la retraite 360 260 350 509
Vieillesse - invaliditéImpôt sur le revenu : réduction au titre des frais de dépendance et
d'hébergement pour les personnes dépendantes accueillies en établissement
spécialisé 161 175 185 263Impôt sur le revenu : exonération des plus-values de cession réalisées par les
titulaires de pensions de vieillesse ou de la carte d’invalidité dont les revenus
n’excèdent pas certaines limites 15 15 15 20
Impôt sur le revenu : crédit d'impôt en faveur des dépenses d'équipements de
l'habitation principale en faveur de l'aide aux personnes 30 30 25 30 32 35 32 36 26Impôt sur le revenu : exonération de la prise en charge directe à titre de
pensions alimentaires des dépenses d’hospitalisation ou d’hébergement en
établissement 10 10 10 16
Vieillesse - invalidité-survie
Taxe d'habitation : Exonération en faveur des personnes âgées, handicapées
ou de condition modeste 1,220 1,250 1,345 1,327 1,233 1,319 1,237 1,255
Impôt sur le revenu : réduction pour dépenses d'accueil dans un
établissement pour personnes âgées dépendantes (long séjour) 15 13 13 14 19
Table Annex I.A.2.1
Detailed information on the impact of the tax system on social expenditure (cont.)
OECD Social Expenditure database (www.oecd.org/els/social/expenditure) // Base de données des dépenses sociales de l'OCDE (www.oecd.org/els/social/depenses) - Version 17-10-2016

Impôt sur le revenu : abattement en faveur des personnes âgées ou invalides 23 24 22 25
Invalidité - survie
Mutations à titre gratuit : abattement effectué sur l’actif taxable aux droits de
mutation revenant à tout héritier, légataire ou donataire handicapé physique
ou mental 85 70 80 60
Famille - survie
Impôt sur le revenu : mantien du quotien conjugal des veufs pour enfants à
charge 80 85 80 110
Famille-invalidité
Impôt sur le revenu : quotient familial 9,700 9,866 10,987 11,528 10,098 10,249 12,428 11,036
Taxe d'habitation : abattement pour charge de famille 1,070 1,130 1,300 1,283 1,283 1,283 1,283 1,283 1,283
Taxe d'habitation : effet du quotient familial sur les dégrèvements partiels 100 100 120 118 118 118 118 118 118
FamilleImpôt sur le revenu: déduction des pensions pour enfants majeurs étudiants
(et mineurs et ascendants à partir de 2009) 280 290 333 265 1,110 1,126 1,201 1,344
Impôt sur le revenu : réduction d'impôt pour enfants scolarisés 400 399 372 216 366 372 360 377Impôt sur le revenu : crédit/réduction d'impôt pour frais de garde d'enfants
de moins de 7 ans 190 200 131 350 780 840 878 920 940 1,025 1,145Impôt sur le revenu : abattement en faveur des contribuables ayant des
enfants mariés à charge 10 10 12 2
Impôt sur le revenu : régime spécial d'imposition des assistantes maternelles 140 140 140 200Impôt de solidarité sur la fortune : réduction d'impôt en raison du nombre
d'enfants 22 22 12 -
Autres domaines de politique sociale
Impôt sur le revenu : Prime Pour l'Emploi 2,518 2,145 2,210 2,450 2,700 3,240 4,520 4,480 3,917 3,311 3,000 2,900 2,353
Impôt sur le revenu : crédit d'impôt exceptionnel aux contribuables modestes 1,004
Taxe d'habitation : dégrèvement total pour les titulaires du RMI 200 285 295 291 96 26 3 -
Impôt sur le revenu : réduction pour dons aux personnes en difficulté 40 50 82 133 127 128 118 124
Politiques actives du marché du travail
Impôt sur le revenu : crédit d'impôt en cas de déménagement pour reprise
d'une activité salariée 60 72 15 4
Crédit d’impôt en faveur des jeunes de moins de vingt-six ans s’orientant
vers un emploi qui connaît des difficultés de recrutement 15 22 40 26Logement
Foncier bâti : exonération des immeubles à caractère social 4 8 18 37
Taxe d'habitation : dégrèvement en faveur des personnes de condition
modeste relogées dans le cadre du programme ANRU 0 25 27 32
Tax breaks to stimulate private social protection (not including pensions)0 0 0 8 2,105 2,205 5 5
Invalidité - survie
Impôt sur le revenu : réduction au titre des primes des contrats de rente
survie et contrats d'épargne handicap 8 5 5 5 5
Santé
Taxe sur les conventions d'assurance : exonération en faveur de certains
contrats d'assurance maladie complémentaire 2,100 2,200 - -
Memorendum items
0 0 0 430 1,074 1,179 1,452 1,739
Vieillesse
Impôt sur le revenu : déduction des cotisations versées au titre de l'épargne
individuelle et facultative 360 339 344 365 504
Impôt sur le revenu : déduction du revenu imposable des cotisations de
retraite ou de prévoyance complémentaire versées à titre facultatif 700 800 1,050 1,200
par les non-salariés et leurs conjoints collaborateurs
Impôt sur le revenu: déduction des versements effectués en vue de la retraite
mutualiste du combattant 70 35 35 37 35
*2007 estimates
Sources 2009-2013: DREES, based on estimates from INES model (DREES-INSEE), the Projets de loi des finances (Direction Générale des Impôts) and the Comptes de la protection sociale (DREES).Sources 2001-2007: Direction Générale des Impôts, INES model (DREES/INSEE).
OECD Social Expenditure database (www.oecd.org/els/social/expenditure) // Base de données des dépenses sociales de l'OCDE (www.oecd.org/els/social/depenses) - Version 17-10-2016

GERMANY
A. Amount of direct tax paid on benefit income (in millions of euros)
2001 2003 2005 2007 2009 2010 2011 2012 2013
Direct taxes and social contributions paid on public cash benefits 25,845 27,074 33,014 34,712 41,812 41,871 43,949 45,817 47,650
Social contributions paid by recipients of benefits (unemployment , disability, etc.) 16,534 17,949 21,092 22,024 27,351 27,454 28,594 29,237 30,057
Income tax on pensions 5,134 4,749 6,900 8,050 9,460 9,380 10,020 11,040 11,830
Social security contributions 1,094 1,219 1,920 2,087 2,287 2,296 2,409 2,470 2,542 Soc. Sec. Cont. on old-age security for farmers 253 268 266 274 283 275 278 275 275 Soc Sec Cont on pension schemes of liberal professions 165 204 244 299 359 376 404 429 463 Supplementary Pensions by public employers 677 747 1,410 1,515 1,645 1,645 1,727 1,765 1,804
Progressionsvorbehalt 1,600 1,670 1,895 2,070 1,980 2,030 2,190 2,300 2,430
Tax and social contributions on family allowances for public servants 1,483 1,488 1,207 481 734 712 736 770 791
Direct taxes and social contributions paid on mandatory private cash benefits 9,619 9,079 7,704 8,399 9,965 9,899 11,062 12,513 13,650Continued wage payments in case of sickness (Entgeltfortzahlung) 9,619 9,079 7,704 8,399 9,965 9,899 11,062 12,513 13,650Continued Wage Payments: Maternity and parental leave
Direct taxes and social contributions paid on voluntary private cash benefits 3,028 3,222 5,037 5,514 5,998 5,484 5,883 6,020 6,199
Tax over BAV (company pension) 1,189 1,306 1,775 1,935 2,190 1,640 1,790 1,795 1,815
Soc. Sec. cont over BAV (company pension) 1,527 1,597 3,028 3,500 3,808 3,844 4,093 4,225 4,384Tax and soc.sec. cont over other benefits by employers 312 319 234 79
B. Average implicit indirect tax rates of consumption out of benefit incomeIndirect taxes paid out of consumption of cash transfers, in millions of euros
2001 2003 2005 2007 2009 2010 2011 2012 2013
(1) Private final consumption expenditure 1,250,347 1,280,872 1,328,551 1,384,900 1,413,041 1,446,274 1,495,533 1,533,829 1,562,704
(2) Private consumption plus Government consumption minus Government wages 1,478,355 1,519,581 1,569,314 1,640,465 1,696,436 1,736,082 1,792,579 1,843,650 1,885,995
(3) General consumption taxes plus excise duties (5110+5121) 200,521 206,353 205,306 234,198 241,704 243,985 256,572 259,221 261,950
5110 General taxes 138,935 137,568 140,121 170,387 178,020 180,533 190,229 194,353 197,326 5121 Excises 61,586 68,785 65,185 63,811 63,684 63,452 66,343 64,868 64,624
(4) Taxes on production sale transfer (5100) 210,641 217,610 217,709 247,547 254,971 256,859 271,046 274,219 277,659
(5) Taxes on Goods and Services (5000) 219,252 225,190 226,641 256,708 264,523 266,014 281,180 285,221 288,064
Implicit average indirect tax rate on consumption out of benefit income:
(6) using general consumption taxes plus excise duties (3)/(2) 13.6% 13.6% 13.1% 14.3% 14.2% 14.1% 14.3% 14.1% 13.89%
(7) using a broad concept of the indirect tax base (5)/(2) 14.8% 14.8% 14.4% 15.6% 15.6% 15.3% 15.7% 15.5% 15.27%
(8) using a broad concept of the indirect tax base and ignoring government consumpion (5)/(1) 17.5% 17.6% 17.1% 18.5% 18.7% 18.4% 18.8% 18.6% 18.43%
Table Annex I.A.2.1
Detailed information on the impact of the tax system on social expenditure (cont.)
Source: OECD on-line National Accounts database (http://stats.oecd.org/Index.aspx?DataSetCode=SNA_TABLE1) for lines 1 and 2; and OECD Revenue Statistics database
(http://stats.oecd.org/Index.aspx?DataSetCode=REV) for lines 3, 4, and 5.
OECD Social Expenditure database (www.oecd.org/social/expenditure.htm) // Base de données des dépenses sociales de l'OCDE (www.oecd.org/fr/social/depenses.htm) - Version 17-10-2016

GERMANY
Table Annex I.A.2.1
Detailed information on the impact of the tax system on social expenditure (cont.)
C. Tax breaks for social purposes (in millions of euros)
2001 2003 2005 2007 2009 2010 2011 2012 2013
Tax breaks similar to cash benefits 33,327 36,473 32,743 30,283 28,174 29,373 28,668 28,481 28,277
Special expenses for owner-occupied homes 1,733 430 30Child component in conjunction with sec.10 e EStG (sec. 34 f EStG) 460 65 30Owner-occupied Homes Premium Law, total 8,050 10,536 10,247 7,722 4,972 3,616 2,378 1,366 542
Employee savings premiums for productive investment (sec. 19 a EStG) 41 41 36 80 97 122 150 150 150
Deduction of occupational training expenses 79 85 90 90 100 95 95 100 105Motor vehicle tax exemption for physically disabled persons 135 130 140 146 135 130 125 120 120Household allowance 1,100 1,000 340 350 360 355 350 355 365Deduction for extraordinary financial burdens 465 475 650 675 970 1,035 1,060 1,105 1,165Deduction for extraordinary financial burdens in special instances 1,094 659 845 845 805 815 810 840 885Lump sum allowances for the physically disabled and others 798 810 805 740 955 960 950 990 1,040Lump sum care allowance 72 72 60 60 65 65 70 75 75Childcare expenses (Kinderbetreuungskosten) 170 160 245 345 420 430 440 490Family benefits (child tax credit ) 19,300 22,000 19,310 19,330 19,370 21,760 22,250 22,940 23,340 For information: Family benefits (Familienlastenausgleich: tax credit + cash benefits) (32 021) (36 080) (36 600) (36 240) (38 570) (41 200) (40 960) (41 180) (41 140)
Tax breaks to stimulate private social protection (not including pensions) 9,480 9,485 9,480 10,580 9,970 18,510 19,800 20,330 21,550
Exclusion of contributions to health and accident insurance 8,400 8,400 8,400 9,300 8,820 17,020 18,150 18,700 19,850
Donations to (approved) NGOs and political parties 1,080 1,085 1,080 1,280 1,150 1,490 1,650 1,630 1,700
Memorandum Item
Tax breaks to pensions 17,520 18,280 19,585 20,270 20,730 19,610 26,470 30,270 31,880
- Deduction of contributions to public pensions 14,300 15,100 16,500 17,400 18,110 19,150 26,040 29,870 31,500
- Deduction of private life insurances 2,300 2,200 2,100 2,000 1,800
- Lump sump taxation of contributions to occupational pension plans 920 980 985 870 820 460 430 400 380
Sources : Bundesministerium fur Arbeit und Soziales (BMAS) = Federal Ministry of Labour and Social Affairs, Germany = red text
Bundesministerium der Finanzen (BMF) = Federal Ministry of Finance, Germany = blue figures
a) Donation to political parties are not in the social domain. However, the value of these donations cannot be separately identified, but is considered smaller that the donations to NGOs, and therefore this item is included in the list here.
OECD Social Expenditure database (www.oecd.org/social/expenditure.htm) // Base de données des dépenses sociales de l'OCDE (www.oecd.org/fr/social/depenses.htm) - Version 17-10-2016
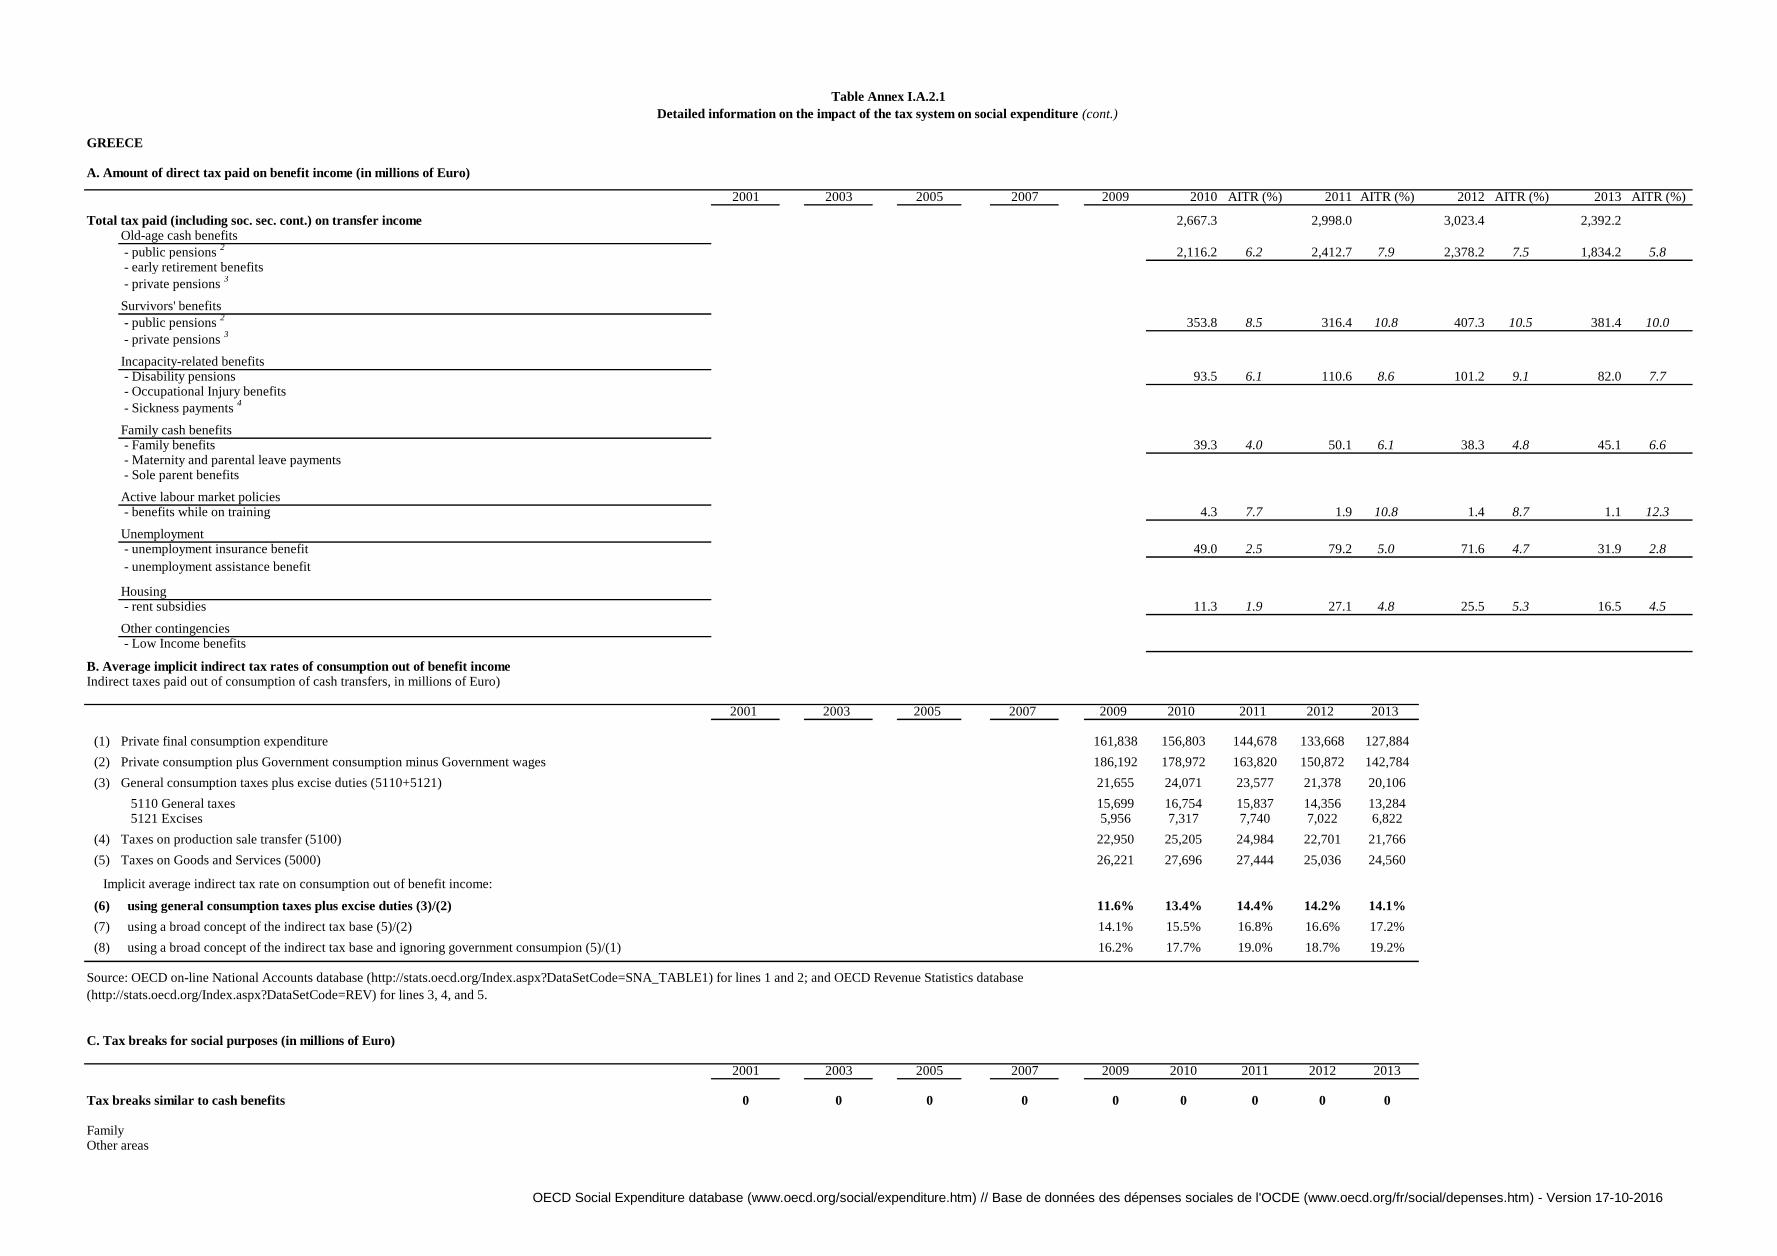
GREECE
A. Amount of direct tax paid on benefit income (in millions of Euro)
2001 2003 2005 2007 2009 2010 AITR (%) 2011 AITR (%) 2012 AITR (%) 2013 AITR (%)
Total tax paid (including soc. sec. cont.) on transfer income 2,667.3 2,998.0 3,023.4 2,392.2Old-age cash benefits
- public pensions 2
2,116.2 6.2 2,412.7 7.9 2,378.2 7.5 1,834.2 5.8 - early retirement benefits
- private pensions 3
Survivors' benefits
- public pensions 2
353.8 8.5 316.4 10.8 407.3 10.5 381.4 10.0
- private pensions 3
Incapacity-related benefits - Disability pensions 93.5 6.1 110.6 8.6 101.2 9.1 82.0 7.7 - Occupational Injury benefits
- Sickness payments 4
Family cash benefits - Family benefits 39.3 4.0 50.1 6.1 38.3 4.8 45.1 6.6 - Maternity and parental leave payments - Sole parent benefits
Active labour market policies - benefits while on training 4.3 7.7 1.9 10.8 1.4 8.7 1.1 12.3
Unemployment - unemployment insurance benefit 49.0 2.5 79.2 5.0 71.6 4.7 31.9 2.8
- unemployment assistance benefit
Housing - rent subsidies 11.3 1.9 27.1 4.8 25.5 5.3 16.5 4.5
Other contingencies - Low Income benefits
B. Average implicit indirect tax rates of consumption out of benefit incomeIndirect taxes paid out of consumption of cash transfers, in millions of Euro)
2001 2003 2005 2007 2009 2010 2011 2012 2013
(1) Private final consumption expenditure 161,838 156,803 144,678 133,668 127,884
(2) Private consumption plus Government consumption minus Government wages 186,192 178,972 163,820 150,872 142,784
(3) General consumption taxes plus excise duties (5110+5121) 21,655 24,071 23,577 21,378 20,106
5110 General taxes 15,699 16,754 15,837 14,356 13,284 5121 Excises 5,956 7,317 7,740 7,022 6,822
(4) Taxes on production sale transfer (5100) 22,950 25,205 24,984 22,701 21,766
(5) Taxes on Goods and Services (5000) 26,221 27,696 27,444 25,036 24,560
Implicit average indirect tax rate on consumption out of benefit income:
(6) using general consumption taxes plus excise duties (3)/(2) 11.6% 13.4% 14.4% 14.2% 14.1%
(7) using a broad concept of the indirect tax base (5)/(2) 14.1% 15.5% 16.8% 16.6% 17.2%
(8) using a broad concept of the indirect tax base and ignoring government consumpion (5)/(1) 16.2% 17.7% 19.0% 18.7% 19.2%
C. Tax breaks for social purposes (in millions of Euro)
2001 2003 2005 2007 2009 2010 2011 2012 2013
Tax breaks similar to cash benefits 0 0 0 0 0 0 0 0 0
FamilyOther areas
Table Annex I.A.2.1
Detailed information on the impact of the tax system on social expenditure (cont.)
Source: OECD on-line National Accounts database (http://stats.oecd.org/Index.aspx?DataSetCode=SNA_TABLE1) for lines 1 and 2; and OECD Revenue Statistics database
(http://stats.oecd.org/Index.aspx?DataSetCode=REV) for lines 3, 4, and 5.
OECD Social Expenditure database (www.oecd.org/social/expenditure.htm) // Base de données des dépenses sociales de l'OCDE (www.oecd.org/fr/social/depenses.htm) - Version 17-10-2016

GREECE
Table Annex I.A.2.1
Detailed information on the impact of the tax system on social expenditure (cont.)
Tax breaks to stimulate private social protection (not including pensions) 0 0 0 0 0 0 0 0 0
Memorendum item
Tax breaks to pensions 0 0 0 0 0 0 0 0 0
Source : International Economic Relations Directorate, Tax Affairs Section.
Note : AITRs and amounts of taxes (including Social Security Contributions) paid by recipients, is based on the annual EU SILC survey conducted by ELSTAT for the relevant years.
The survey’s average sample size is about 7.200 beneficiaries for the last two reference years.
The weights of the survey’s cases that have been used are associated with the number of individual’s that took advantage of a benefit, not with the amount of the benefit itself.
Also estimations for the taxes imposed to the individual’s benefit income have been evaluated according to his/her yearly overall gross income, employing properly escalating tax coefficients in valid for the related year.
Finally please consider the data as provisional, as it is designing an ad hoc survey for the provision of relevant data from administrative sources.
NB The descriptions of benefits in Table Q3 have been amended by ELSTAT as these were originally not accurate in item no 2, 4 and 4a.
OECD Social Expenditure database (www.oecd.org/social/expenditure.htm) // Base de données des dépenses sociales de l'OCDE (www.oecd.org/fr/social/depenses.htm) - Version 17-10-2016

HUNGARY
A. Amount of direct tax paid on benefit income (in millions HUF)
2001 2003 2005 2007 2009 2010 2011 2012 2013
Total tax paid (including soc. sec. cont.) on transfer income 0 0 0 0 0 104 324 92 100 65 166 63 130
Social Security Pension 0 0 0 0Social Security Disability Benefit 4 045 4 278 3 478 2 365
Social security Unemployment Benefit 32 956 29 278 12 729 10 293
Social security Sickness Benefit 17 147 13 301 9 047 9 580
Social security Child cash benefit 46 974 43 938 39 745 40 891
Social security benefits while on training 3 203 1 305 167
B. Average implicit indirect tax rates of consumption out of benefit income
Indirect taxes paid out of consumption of cash transfers, in millions HUF)
2001 2003 2005 2007 2009 2010 2011 2012 2013
(1) Private final consumption expenditure 14,024,765 14,141,855 14,785,172 15,362,627 15,736,882
(2) Private consumption plus Government consumption minus Government wages 16,888,654 17,060,802 17,765,056 18,269,058 18,638,785
(3) General consumption taxes plus excise duties (5110+5121) 3,828,935 3,940,662 4,037,889 4,376,593 4,406,612
5110 General taxes 2,857,504 3,010,781 3,077,927 3,353,969 3,414,342 5121 Excises 971,431 929,881 959,962 1,022,624 992,270
(4) Taxes on production sale transfer (5100) 3,954,201 4,238,757 4,365,926 4,741,036 4,915,333
(5) Taxes on Goods and Services (5000) 4,061,730 4,350,310 4,476,168 4,858,734 5,038,129
Implicit average indirect tax rate on consumption out of benefit income:
(6) using general consumption taxes plus excise duties (3)/(2) 22.7% 23.1% 22.7% 24.0% 23.6%
(7) using a broad concept of the indirect tax base (5)/(2) 24.1% 25.5% 25.2% 26.6% 27.0%
(8) using a broad concept of the indirect tax base and ignoring government consumpion (5)/(1) 29.0% 30.8% 30.3% 31.6% 32.0%
Source: OECD on-line National Accounts database (http://stats.oecd.org/Index.aspx?DataSetCode=SNA_TABLE1) for lines 1 and 2; and OECD Revenue Statistics database
(http://stats.oecd.org/Index.aspx?DataSetCode=REV) for lines 3, 4, and 5.
Table Annex I.A.2.1
Detailed information on the impact of the tax system on social expenditure (cont.)
OECD Social Expenditure database (www.oecd.org/social/expenditure.htm) // Base de données des dépenses sociales de l'OCDE (www.oecd.org/fr/social/depenses.htm) - Version 17-10-2016
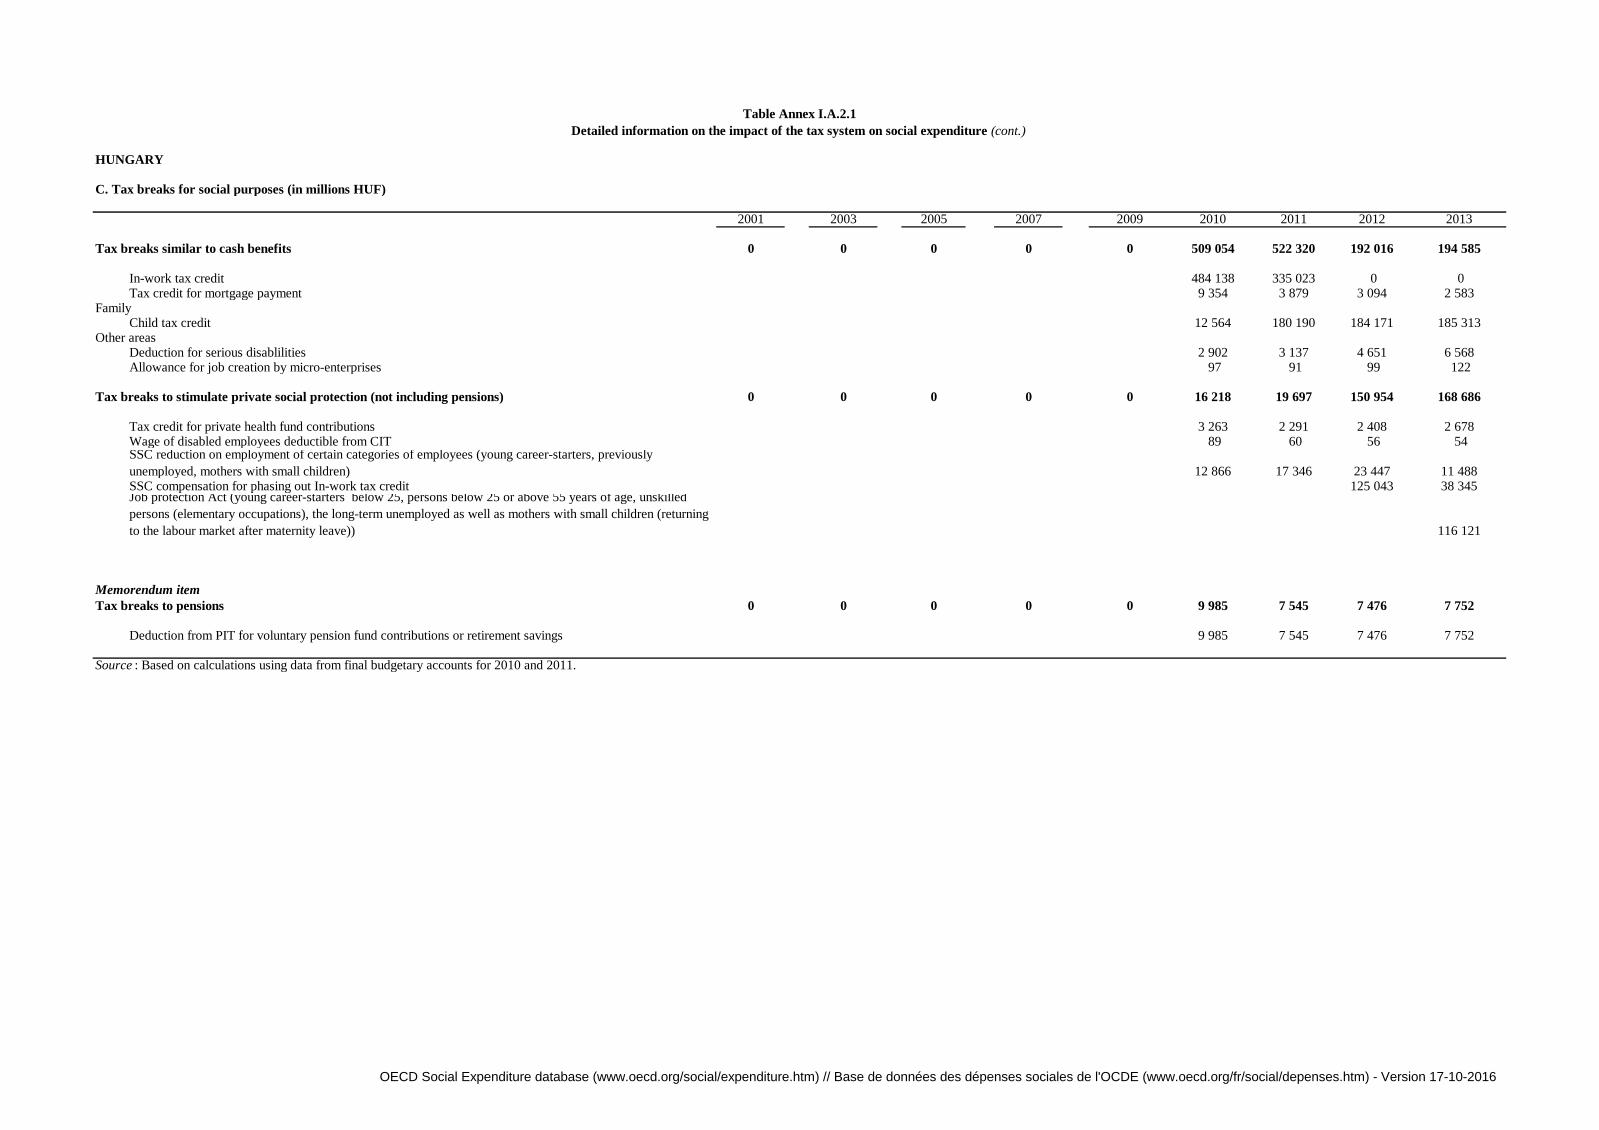
HUNGARY
Table Annex I.A.2.1
Detailed information on the impact of the tax system on social expenditure (cont.)
C. Tax breaks for social purposes (in millions HUF)
2001 2003 2005 2007 2009 2010 2011 2012 2013
Tax breaks similar to cash benefits 0 0 0 0 0 509 054 522 320 192 016 194 585
In-work tax credit 484 138 335 023 0 0Tax credit for mortgage payment 9 354 3 879 3 094 2 583
FamilyChild tax credit 12 564 180 190 184 171 185 313
Other areasDeduction for serious disablilities 2 902 3 137 4 651 6 568Allowance for job creation by micro-enterprises 97 91 99 122
Tax breaks to stimulate private social protection (not including pensions) 0 0 0 0 0 16 218 19 697 150 954 168 686
Tax credit for private health fund contributions 3 263 2 291 2 408 2 678Wage of disabled employees deductible from CIT 89 60 56 54SSC reduction on employment of certain categories of employees (young career-starters, previously
unemployed, mothers with small children) 12 866 17 346 23 447 11 488SSC compensation for phasing out In-work tax credit 125 043 38 345Job protection Act (young career-starters below 25, persons below 25 or above 55 years of age, unskilled
persons (elementary occupations), the long-term unemployed as well as mothers with small children (returning
to the labour market after maternity leave)) 116 121
Memorendum item
Tax breaks to pensions 0 0 0 0 0 9 985 7 545 7 476 7 752
Deduction from PIT for voluntary pension fund contributions or retirement savings 9 985 7 545 7 476 7 752
Source : Based on calculations using data from final budgetary accounts for 2010 and 2011.
OECD Social Expenditure database (www.oecd.org/social/expenditure.htm) // Base de données des dépenses sociales de l'OCDE (www.oecd.org/fr/social/depenses.htm) - Version 17-10-2016

ICELAND
A. Amount of direct tax paid on benefit income (in millions of Islandic krónur)
2001 2003 2005 2007 2009 2010 2011 2012 2013
Total tax paid (including soc. sec. cont.) on public transfer income 6,133 8,087 9,273 10,878 16,611 15,482 17,615 17,833 19,340
of which:
- Income tax 6,133 8,087 9,273 10,878 16,611 15,482 17,615 17,833 19,340
Total tax paid (including soc. sec. cont.) on private transfer income 4,457 5,942 7,407 9,727 11,822 12,154 13,632 15,634 17,501
of which:
- Income tax 4,457 5,942 7,407 9,727 11,822 12,154 13,632 15,634 17,501
Source : Ministry of Finance and Economic Affairs, Tax Department
B. Average implicit indirect tax rates of consumption out of benefit incomeIndirect taxes paid out of consumption of cash transfers, in millions of Islandic krónur
2001 2003 2005 2007 2009 2010 2011 2012 2013
(1) Private final consumption expenditure 440,765 493,973 623,451 769,660 814,310 828,973 879,710 947,233 986,998
(2) Private consumption plus Government consumption minus Government wages 508,836 576,100 715,999 895,070 992,780 ####### ####### 1,140,198 1,189,027
(3) General consumption taxes plus excise duties (5110+5121) 93,859 109,914 152,236 183,485 160,176 169,104 181,296 196,744 204,999
5110 General taxes 72,415 81,881 113,897 137,593 120,241 122,393 131,057 142,814 149,828 5121 Excises 21,444 28,034 38,339 45,891 39,935 46,711 50,239 53,930 55,171
(4) Taxes on production sale transfer (5100) 98,596 114,572 157,941 191,957 168,932 178,995 193,705 209,755 215,271
(5) Taxes on Goods and Services (5000) 110,247 127,106 175,198 214,988 180,199 190,131 203,545 219,681 226,619
Implicit average indirect tax rate on consumption out of benefit income:
(6) using general consumption taxes plus excise duties (3)/(2) 18.4% 19.1% 21.3% 20.5% 16.1% 16.8% 16.9% 17.3% 17.2%
(7) using a broad concept of the indirect tax base (5)/(2) 21.7% 22.1% 24.5% 24.0% 18.2% 18.8% 19.0% 19.3% 19.1%
(8) using a broad concept of the indirect tax base and ignoring government consumpion (5)/(1) 25.0% 25.7% 28.1% 27.9% 22.1% 22.9% 23.1% 23.2% 23.0%
C. Tax breaks for social purposes (in millions of Islandic krónur)
2001 2003 2005 2007 2009 2010 2011 2012 2013
Tax breaks similar to cash benefits 0 0 0 0 0 0 0 0 0
Family;Other areas:
Tax breaks to stimulate private social protection (not including pensions) 0 0 0 0 0 0 0 0 0
Memorendum item
Tax breaks for pension 6,888 8,619 10,596 13,215 14,220 15,571 16,642 15,497 16,575
Source : Ministry of Finance and Economic Affairs, Tax Department
Table Annex
Detailed information on the impact of the tax system on social expenditure (cont.)
Source: OECD on-line National Accounts database (http://stats.oecd.org/Index.aspx?DataSetCode=SNA_TABLE1) for lines 1 and 2; and OECD Revenue Statistics
OECD Social Expenditure database (www.oecd.org/social/expenditure.htm) // Base de données des dépenses sociales de l'OCDE (www.oecd.org/fr/social/depenses.htm) - Version 17-10-2016

IRELAND
A. Amount of direct tax paid on benefit income (in millions of euros)
2001 2003 2005 2007 2009 2010 2011 2012 2013
Total tax paid (including soc. sec. cont.) on transfer income 299 332 371 471 616 693 677 937 1,078
Social Security Pension 268 291 327 408 530 572 566 821 920Social Security Disability Benefit 21 23 28 34 33 51 51 59 78
Social security Unemployment Benefit 11 17 17 28 53 70 60 58 80
Source : Ireland Revenue, Income Tax Returns for 2011, 2012 (SAS)
B. Average implicit indirect tax rates of consumption out of benefit incomeIndirect taxes paid out of consumption of cash transfers, in millions of euros)
2001 2003 2005 2007 2009 2010 2011 2012 2013
(1) Private final consumption expenditure 55,833 65,104 74,675 89,701 80,337 78,710 79,659 79,337 80,681
(2) Private consumption plus Government consumption minus Government wages 64,113 75,100 85,411 103,160 93,893 90,828 91,597 91,627 93,181
(3) General consumption taxes plus excise duties (5110+5121) 12,184 14,531 17,751 20,458 15,194 14,929 14,610 14,993 15,385
5110 General taxes 7,996 9,808 12,373 14,355 10,324 10,067 9,755 10,219 10,372 5121 Excises 4,188 4,723 5,377 6,103 4,870 4,862 4,855 4,774 5,013
(4) Taxes on production sale transfer (5100) 12,286 15,101 17,547 20,710 15,354 15,091 14,719 15,169 15,546
(5) Taxes on Goods and Services (5000) 12,929 15,894 18,562 21,809 16,582 16,377 16,075 16,528 17,034
Implicit average indirect tax rate on consumption out of benefit income:
(6) using general consumption taxes plus excise duties (3)/(2) 19.0% 19.3% 20.8% 19.8% 16.2% 16.4% 15.9% 16.4% 16.5%
(7) using a broad concept of the indirect tax base (5)/(2) 20.2% 21.2% 21.7% 21.1% 17.7% 18.0% 17.6% 18.0% 18.3%
(8) using a broad concept of the indirect tax base and ignoring government consumpion (5)/(1) 23.2% 24.4% 24.9% 24.3% 20.6% 20.8% 20.2% 20.8% 21.1%
Table Annex
Detailed information on the impact of the tax system on social expenditure (cont.)
Source: OECD on-line National Accounts database (http://stats.oecd.org/Index.aspx?DataSetCode=SNA_TABLE1) for lines 1 and 2; and OECD Revenue Statistics database
(http://stats.oecd.org/Index.aspx?DataSetCode=REV) for lines 3, 4, and 5.
OECD Social Expenditure database (www.oecd.org/social/expenditure.htm) // Base de données des dépenses sociales de l'OCDE (www.oecd.org/fr/social/depenses.htm) - Version 17-10-2016

IRELAND
Table Annex
Detailed information on the impact of the tax system on social expenditure (cont.)
C. Tax breaks for social purposes (in millions of euros)
2001 2003 * 2005 * 2007 * 2009 2010 2011 2012 2013
Tax breaks similar to cash benefits 197 319 396 420 578 618 645 563 652
Family:Additional personal allowance for one parent family 92 138 151 186 197 174 142 144 147Additional allowance for incapacitated child 3 4 5 16 39 38 39 42 46
Other areas: Exemption of statutory redundancy payments 9 25 77 - 85 148 214 141 211 Widowed person's allowance (data do not cover non-tax payers) 83 122 126 155 184 185 179 170 182
Additional bereavement allowance to widowed parent 4 6 4 5 7 6 6 6 6Additional allowance to widowed person in year of bereavement 4 6 5 5 5 5 5 4 4Dependent relative allowance 1 1 1 1 2 2 2 2 2Person taking care of incapacitated taxpayer 0 1 1 3 6 6 7 7 7Donations to approved bodies 2 16 26 50 52 54 51 47 47
Tax breaks to stimulate private social protection (not including pensions) 206 227 330 431 592 739 828 874 1,024
Relief in respect of medical insurance premiums 168 162 218 261 321 590 698 737 884Health expenses relief 36 63 110 167 267 146 127 131 134Contributions under permanent health benefit schemes after deduction of tax on benefits received 2 2 3 3 4 4 4 6 6Exemption of income of charities, colleges, hospitals, schools, friendly societies, etc.
Memorendum item
Tax breaks to pensions 2,010 2,709 2,240 2,299 1,858 1,759 1,755 1,695 1,630
Employee’s Contributions to Approved Superannuation Schemes: 389 563 540 543 655 589 599 584 560Employer’s Contributions to Approved Superannuation Schemes ** 498 623 120 120 165 153 141 142 137Exemption of Net Income of Approved Superannuation Funds 938 1,272 1,200 1,200 685 780 835 805 765Retirement Annuity Premiums (Individual private pensions) 185 251 380 436 353 237 180 164 168
* TBSPs are for 2002 instead of 2003, 2004 instead of 2005, and 2006 instead of 2007.
Source: Office of the Revenue Commissioners, Statistical Reports.
** Newly available 2006 aggregate data on contributions to pension schemes by employers and employees arising from a P35 initiative introduced on foot of provisions that were included in Finance Act 2004 with a view to improving data quality have allowed estimates of
the cost of tax for private pension provision for 2006 to be made. Further work is ongoing to provide similar estimates for 2005. As similar data sources would not be available for previous years, it is not possible to provide costings on a similar basis for those years.
OECD Social Expenditure database (www.oecd.org/social/expenditure.htm) // Base de données des dépenses sociales de l'OCDE (www.oecd.org/fr/social/depenses.htm) - Version 17-10-2016

ISRAEL
A. Average Itemised Tax Rates (AITR %)
2001 2003 2005 2007 2009 2010 2011 2012 2013 20141 Old-age cash benefits1a - public pensions 1c - private pensions 9.0% 8.7% 9.5%2 Survivors' benefits2a - public pensions 3 Incapacity-related benefits3a - Disability pensions3b - Occupational Injury benefits 13.3% 11.0% 12.9%3c - Sickness payments 4 Family cash benefits 4a - Family benefits4b - Maternity and parental leave payments 8.8% 11.6% 11.1%5 Active labour market policies5a - benefits while on training6 Unemployment 10.6% 11.5% 12.5%6a - unemployment insurance benefit6b - unemployment assistance benefit
Amount of direct tax paid over transfer income (in millions shekels (NIS) 1,490 1,561 1,613 1,700 1,762 1,829 General disability pension
Work disability pension – up to retirement age
Social assistance benefit
Survivors’ benefit
Old age benefit
B. Average implicit indirect tax rates of consumption out of benefit income
Indirect taxes paid out of consumption of cash transfers, in millions of shekels (NIS).
2001 2003 2005 2007 2009 2010 2011 2012 2013 2014
(1) Private final consumption expenditure 463,327 501,467 534,343 555,235 586,421 611,072
(2) Private consumption plus Government consumption minus Government wages 563,855 607,556 646,145 675,922 715,523 745,001
(3) General consumption taxes plus excise duties (5110+5121) 85,432 95,404 101,496 104,612 114,037 122,801
5110 General taxes 71,954 79,947 85,586 88,167 97,357 105,700 5121 Excises 13,478 15,457 15,910 16,445 16,680 17,101
(4) Taxes on production sale transfer (5100) 87,834 98,093 104,407 107,155 116,335 125,577
(5) Taxes on Goods and Services (5000) 94,568 105,872 112,423 115,391 125,121 134,476
Implicit average indirect tax rate on consumption out of benefit income:
(6) using general consumption taxes plus excise duties (3)/(2) 15.2% 15.7% 15.7% 15.5% 15.9% 16.5%
(7) using a broad concept of the indirect tax base (5)/(2) 16.8% 17.4% 17.4% 17.1% 17.5% 18.1%
(8) using a broad concept of the indirect tax base and ignoring government consumpion (5)/(1) 20.4% 21.1% 21.0% 20.8% 21.3% 22.0%
C. Tax breaks for social purposes (in millions of shekels (NIS)).1
Table Annex
Detailed information on the impact of the tax system on social expenditure (cont.)
Source : National Insurance Institute. These five Social benefits are exempted from Income Tax and Social Security Contributions but pay a minimum Health Insurance Tax. The total HIT raised from these
benefits in 2009 amounted to 1.5 billion LIS. There is no detailled data for each social benefits.
Source: OECD on-line National Accounts database (http://stats.oecd.org/Index.aspx?DataSetCode=SNA_TABLE1) for lines 1 and 2; and OECD Revenue Statistics database
(http://stats.oecd.org/Index.aspx?DataSetCode=REV) for lines 3, 4, and 5.
OECD Social Expenditure database (www.oecd.org/social/expenditure.htm) // Base de données des dépenses sociales de l'OCDE (www.oecd.org/fr/social/depenses.htm) - Version 17-10-2016

ISRAEL
Table Annex
Detailed information on the impact of the tax system on social expenditure (cont.)
2001 2003 2005 2007 2009 2010 2011 2012 2013 2014
Tax breaks similar to cash benefits 2
1 323 1 285 1 608 2 972 3 308
Family:
- Child credits 1 180 1 120 1 440 2 740 3 060
- Value of non-wastable tax credits for children off-set against tax liabilities (e,g. EITC.) 3 5 8 32 38 - Additional personal allowance for one-parent families 80 100 100 110 120
- Value of revenue foregone because of including children in the tax unit 3
Other areas:
- Rebate for taxpayers supporting care-needing relatives 30 30 30 40 40 - Credit for special needs children 30 30 30 50 50
Tax breaks to stimulate private social protection (not including pensions) 170 220 230 250 270
- Donations to (approved) NGOs 170 220 230 250 270
Memorandum Items
Tax breaks for pensions 11 000 12 000 12 800 12 900 13 200
9 000 10 000 10 300 10 000 10 500
- Non-taxation of investment of private pension funds 2 000 2 000 2 500 2 900 2 700
Source: Tax expenditure budget, Ministry of Finance.
1) Examples are in Italics .
3) National tax systems can benefit married couples and their children by including spouses (and/or partners) and children in the tax unit. As support for children is considered a social purpose, fiscal support to children because their inclusion in the tax unit is considered a
TBSP. However, (fiscal) benefits to married persons are not deemed to be part of the social domain (the presence of dependent children leads to eligibility to cash benefits in social protection systems, whereas a marriage contract does not). National authorities are asked to
indicate the value of revenue foregone of including children in the tax unit.
- Deduction of contributions to private pensions (e.g occupational pension plans)
2) In order to avoid double counting it is essential, that age allowances or other relevant fiscal measures that were
OECD Social Expenditure database (www.oecd.org/social/expenditure.htm) // Base de données des dépenses sociales de l'OCDE (www.oecd.org/fr/social/depenses.htm) - Version 17-10-2016

ITALY
A. Amount of direct tax paid on benefit income (in millions of euros)
2001 2003 2005 2007 2009 2010 2011 2012 2013
1 Old-age cash benefits1a - public pensions (mandatory) 17,777 19,868 23,541 27,459 32,458 34,380 37,369 37,738 38,7341b - early retirement benefits1c - private pensions (non mandatory) 502 537 585 649 607 646 728 591 557
2 Survivors' benefits
2a - public pensions (mandatory) 4,343 4,645 5,361 5,939 6,841 7,167 7,610 7,893 8,1772b - private pensions (non mandatory) 142 152 167 182 186 199 215 182 173
3 Incapacity-related benefits3b-1 - Occupational Injury benefits (mandatory) 2,347 2,276 2,258 2,196 2,243 2,195 2,214 3,246 3,2373b-2 - Occupational Injury benefits (non mandatory) 17 16 16 16 17 18 18 16 14
Total 25,128 27,493 31,928 36,442 42,353 44,605 48,155 49,666 50,892
Source: Official administrative information from National Institute for Social Security (INPS).
B. Average implicit indirect tax rates of consumption out of benefit incomeIndirect taxes paid out of consumption of cash transfers, in millions of euros
2001 2003 2005 2007 2009 2010 2011 2012 2013
(1) Private final consumption expenditure 774,938 827,517 885,372 953,415 953,740 978,932 1,007,196 993,725 980,948
(2) Private consumption plus Government consumption minus Government wages 882,365 946,525 1,020,343 1,093,918 1,106,497 1,134,032 1,158,499 1,143,031 1,131,580
(3) General consumption taxes plus excise duties (5110+5121) 109,277 111,784 117,712 128,527 122,183 134,000 139,738 142,966 139,641
5110 General taxes 78,056 79,099 85,317 95,623 86,544 97,586 98,650 96,170 93,921 5121 Excises 31,221 32,685 32,395 32,904 35,639 36,414 41,088 46,796 45,720
(4) Taxes on production sale transfer (5100) 125,750 128,966 138,938 152,930 146,855 158,550 164,900 167,312 162,694
(5) Taxes on Goods and Services (5000) 140,445 143,281 154,101 169,608 164,207 176,638 184,275 187,524 184,382
Implicit average indirect tax rate on consumption out of benefit income:
(6) using general consumption taxes plus excise duties (3)/(2) 12.4% 11.8% 11.5% 11.7% 11.0% 11.8% 11.7% 11.7% 11.7%
(7) using a broad concept of the indirect tax base (5)/(2) 15.9% 15.1% 15.1% 15.5% 14.8% 15.6% 15.5% 15.5% 15.5%
(8) using a broad concept of the indirect tax base and ignoring government consumpion (5)/(1) 18.1% 17.3% 17.4% 17.8% 17.2% 18.0% 17.8% 17.8% 17.8%
Table Annex I.A.2.1
Detailed information on the impact of the tax system on social expenditure (cont.)
Source: OECD on-line National Accounts database (http://stats.oecd.org/Index.aspx?DataSetCode=SNA_TABLE1) for lines 1 and 2; and OECD Revenue Statistics database
(http://stats.oecd.org/Index.aspx?DataSetCode=REV) for lines 3, 4, and 5.
OECD Social Expenditure database (www.oecd.org/social/expenditure.htm) // Base de données des dépenses sociales de l'OCDE (www.oecd.org/fr/social/depenses.htm) - Version 17-10-2016

ITALY
Table Annex I.A.2.1
Detailed information on the impact of the tax system on social expenditure (cont.)
C. Tax breaks for social purposes (in millions of euros)
2001 2003 2005 2007 2009 2010 2011 2012 2013
Tax breaks similar to cash benefits 1,730 2,064 2,400 2,767 10,180 10,384 10,491 10,793 12,372
Tax credits:Healthcare expenses 1,493 1,803 2,093 2,417 2,409 2,585 2,733 2,889 2,960Healthcare expenses for disabled (1) 7Other expenses for disabled (vehicles, dogs, …) 18 Education expenses 189 222 250 283 298 318 320 337 336
Family Tax credits (Total) 11,379 11,375 11,290 11,469 13,115Tax credits for no. of children>3 (non-wastable) (for info as already included in SOCX ) 96 104 106 113 118Wastable Family Tax credits (amount due) 11,283 11,271 11,183 11,356 12,997Wastable Family Tax credits (amount used): 10,313 10,302 10,221 10,379 11,801
- Spouse (for information only as not part of SOCX scope) 2,929 2,926 2,903 2,948 2,879
- Children 7,209 7,201 7,145 7,255 8,733
- Other relatives 175 175 174 176 189
Tax deductions:Medical expenses for disabled (2) 23 39 58 67 90 104 119 136 154
Tax breaks to stimulate private social protection (not including pensions) 1,692 1,458 1,236 1,064 864 787 719 663 404
Tax credits:Donations to ONLUS (ie. NGOs providing social and or/educational services, scientific
research, cultural activities, etc..) 25 36 39 39 36 36 34 33 37Contributions to mutual assistance associations 5 Contributions to health and accident insurance 1,662 1,422 1,197 1,026 828 751 685 630 367
Memorendum item
Tax breaks to pensions 107 191 261 276 326 397 433 456 570
- Deduction of contributions to private pensions 103 178 245 256 317 373 407 443 500 - Non-taxation of investment of private pension funds (3) 4 12 16 20 9 24 27 13 70
1) For all years except 2001, healthcare expenses include healthcare expenses for disabled
Source: Official administrative information
3) The tax break are the reduction of tax rate by 1.5%. The estimate is based on administrative data for the tax revenue from income of pension funds. The tax revenue without the tax break is estimated by applying the ordinary tax rate
of 12.5% to the taxable income. The revenue foregone is then calculated as the difference between this estimated tax revenue and the actual tax revenue.
2) The estimate is based on the amount of the relevant deductions as recorded in all individual tax returns, distributed in 30 income class. The revenue foregone is calculated applying to the deductions in each income class the
corresponding P.I.T. average implicit tax rate.
OECD Social Expenditure database (www.oecd.org/social/expenditure.htm) // Base de données des dépenses sociales de l'OCDE (www.oecd.org/fr/social/depenses.htm) - Version 17-10-2016

JAPAN
A. Amount of direct tax paid on benefit income (in millions of yen)
2001 2003 2005 2007 2009 2010 2011 2012 2013
- public old pensions 1,097,179 1,167,905 1,994,826 2,082,407 3,187,655 2,443,059 2,442,909 2,492,482 2,530,079
- mandatory private old age pensions 66,849 68,706 100,088 110,619 172,846 140,109 145,380 151,219 154,612
- voluntary private old age pensions 375,290 331,809 294,970 319,368 326,583 301,541 306,168 329,560 320,598
Source: Ministry of Finance of Japan and estimates from National Institute of Population and Social Security Research.
B. Average implicit indirect tax rates of consumption out of benefit income
Indirect taxes paid out of consumption of cash transfers, in millions of yen
2001 2003 2005 2007 2009 2010 2011 2012 2013
(1) Private final consumption expenditure 289,787,900 287,514,200 291,132,600 294,122,000 282,941,700 285,867,100 284,244,300 288,195,200 292,302,300
(2) Private consumption plus Government consumption minus Government wages 346,391,100 346,328,900 351,983,800 355,309,600 346,215,900 351,485,300 350,687,100 356,174,800 362,657,800
(3) General consumption taxes plus excise duties (5110+5121) 21,985,200 21,792,400 22,705,400 22,214,700 20,747,800 21,297,600 21,463,900 21,622,030 22,207,326
5110 General taxes 12,241,600 12,106,400 13,134,600 12,841,100 12,220,600 12,675,200 12,744,900 12,901,500 13,478,940
5121 Excises 9,743,600 9,686,000 9,570,800 9,373,600 8,527,200 8,622,400 8,719,000 8,720,530 8,728,386
(4) Taxes on production sale transfer (5100) 22,990,800 22,731,900 23,722,200 23,240,700 21,560,900 22,160,400 22,409,600 22,591,730 23,313,083
(5) Taxes on Goods and Services (5000) 26,053,200 25,792,300 26,786,000 26,255,800 24,364,300 24,730,200 24,966,300 25,055,530 25,744,113
Implicit average indirect tax rate on consumption out of benefit income:
(6) using general consumption taxes plus excise duties (3)/(2) 6.3% 6.3% 6.5% 6.3% 6.0% 6.1% 6.1% 6.1% 6.1%
(7) using a broad concept of the indirect tax base (5)/(2) 7.5% 7.4% 7.6% 7.4% 7.0% 7.0% 7.1% 7.0% 7.1%
(8) using a broad concept of the indirect tax base and ignoring government consumpion (5)/(1) 9.0% 9.0% 9.2% 8.9% 8.6% 8.7% 8.8% 8.7% 8.8%
Note: SOCX data before 2009 was retroactively recalculated in 2012. Due to this change,the amount of direct tax paid on benefit income are uncomparable before and after 2009. Income tax rate of 1.10% + Health insurance contribution of 2.30% +
Long term care insurance contribution of 2.56% in 2010 and 2011
Source: OECD on-line National Accounts database (http://stats.oecd.org/Index.aspx?DataSetCode=SNA_TABLE1) for lines 1 and 2; and OECD Revenue Statistics database
(http://stats.oecd.org/Index.aspx?DataSetCode=REV) for lines 3, 4, and 5.
Table Annex
Detailed information on the impact of the tax system on social expenditure (cont.)
OECD Social Expenditure database (www.oecd.org/social/expenditure.htm) // Base de données des dépenses sociales de l'OCDE (www.oecd.org/fr/social/depenses.htm) - Version 17-10-2016

JAPAN
Table Annex
Detailed information on the impact of the tax system on social expenditure (cont.)
C. Tax breaks for social purposes (in millions of yen)
2001 2003 2005 2007 2009 2010 2011 2012 2013
TBSPs similar to cash benefits 2,800,000 2,720,000 2,600,000 2,700,000 2,700,000 1,800,000 1,300,000 1,300,000
Family:
Deduction for dependent family other than spouses (General taxation) 2,100,000 2,370,000 2,400,000 2,600,000 2,500,000 .. 1,600,000 1,100,000 1,100,000
Other areas:
Deduction for handicapped, survivors and working students (General taxation) 700,000 140,000 100,000 100,000 200,000 .. 200,000 200,000 200,000
Deduction for the elderly * .. 210,000 100,000 - - .. - - -
Deduction for medical expenses .. .. .. .. .. .. .. .. ..
Deduction for retirement income .. .. .. .. .. .. .. .. ..
Tax breaks to stimulate private social protection (not including pensions) 110,000 132,000 129,000 136,000 131,000 .. 144,500 148,000 144,000
Special treatment of fees for medical care under the social insurance system 28,000 25,000 25,000 31,000 35,000 .. 34,500 38,000 34,000
Enterprise tax exemption of medical care under the social insurance system 82,000 107,000 104,000 105,000 96,000 .. 110,000 110,000 110,000
Tax exemption for social welfare juridical persons .. .. .. .. .. .. .. .. ..
Memorendum item
Tax breaks to pensions 3,620,000 3,040,000 3,190,000 3,640,000 2,910,000 .. .. .. ..
- Deduction of contributions to private pensions (e.g occupational pension plans, individual
retirement accounts, RRSPs, Superannuation, etc) - 2,580,000 2,890,000 3,330,000 2,690,000 .. .. .. ..
- Non-taxation of investment of private pension funds - 460,000 300,000 310,000 220,000 .. .. .. ..
* The amount of the "Deduction for the elderly" is not available in 2001.
Source: Information supplied by the Ministry of Finance of Japan.
OECD Social Expenditure database (www.oecd.org/social/expenditure.htm) // Base de données des dépenses sociales de l'OCDE (www.oecd.org/fr/social/depenses.htm) - Version 17-10-2016

KOREA
A. Amount of direct tax paid on benefit income (in millions wons)
2001 2002 2003 2004 2005 2006 2007 2008 2009 2010 2011 2012 20132014
provisional
Public social expenditure
Social contributions 34,842 49,669 51,109 115,549 131,947 161,743 210,991 254,149 240,118 279,034 282,877 305,651 337,630 372,111 income tax 0 0 77 210 758 677 1,044 1,509 3,127 5,258 17,713 20,335
Mandatory private social expenditure 208,942 189,391 216,186 258,537 260,529 287,247 322,893 331,273 349,321 373,744 438,432 549,685 601,318 635,932
Voluntary private social expenditure - - - - - - - - 1,175 6,224 10,539 7,319 26,067
Source: See table C below.
B. Average implicit indirect tax rates of consumption out of benefit income
Indirect taxes paid out of consumption of cash transfers, in millions of wons
2001 2003 2005 2007 2009 2010 2011 2012 20132014
provisional
(1) Private final consumption expenditure 376,802,900 434,864,400 480,170,000 546,429,200 594,882,600 636,712,700 679,141,500 707,614,000 727,799,900 748,907,000
(2) Private consumption plus Government consumption minus Government wages 416,937,800 484,066,500 539,882,900 620,791,000 689,265,500 738,715,400 788,959,000 823,169,000 848,062,100 874,978,400
(3) General consumption taxes plus excise duties (5110+5121) 48,448,000 57,438,000 61,006,000 68,822,000 72,333,000 83,140,000 80,269,000 87,112,000 86,766,000 90,237,000
5110 General taxes 25,835,000 33,447,000 36,118,000 40,942,000 46,992,000 54,800,000 54,868,000 58,702,000 59,105,000 61,469,000 5121 Excises 22,613,000 23,991,000 24,888,000 27,880,000 25,341,000 31,340,000 25,401,000 28,410,000 27,661,000 28,767,000
(4) Taxes on production sale transfer (5100) 57,430,000 66,354,000 69,069,000 78,414,000 84,135,000 96,573,000 93,983,000 99,731,000 99,970,000 102,531,000
(5) Taxes on Goods and Services (5000) 59,377,000 68,197,000 71,041,000 80,861,000 87,043,000 99,769,000 100,551,000 106,402,000 106,717,000 110,986,000
Implicit average indirect tax rate on consumption out of benefit income:
(6) using general consumption taxes plus excise duties (3)/(2) 11.6% 11.9% 11.3% 11.1% 10.5% 11.3% 10.2% 10.6% 10.2% 10.3%
(7) using a broad concept of the indirect tax base (5)/(2) 14.2% 14.1% 13.2% 13.0% 12.6% 13.5% 12.7% 12.9% 12.6% 12.7%
(8)
using a broad concept of the indirect tax base
and ignoring government consumption (5)/(1)15.8% 15.7% 14.8% 14.8% 14.6% 15.7% 14.8% 15.0% 14.7% 14.8%
C. Tax breaks for social purposes (in millions of wons)
2001 2002 2003 2004 2005 2006 2007 2008 2009 2010 2011 2012 20132014
provisional
Tax breaks similar to cash benefits 2,335,191 2,445,808 2,866,733 3,159,706 3,933,938 4,383,470 5,360,549 6,335,963 7,144,133 6,602,955 7,236,721 7,862,633 8,118,924 8,248,202
Basic and additional Income deduction (tax
credit) see calculation1,941,525 2,135,828 2,541,602 2,844,334 3,664,205 4,054,381 4,978,445 5,983,288 6,749,106 6,193,548 6,441,803 6,831,043 7,162,007 7,247,916
of which family: 708,865 708,758 776,262 895,434 1,325,205 1,498,981 1,764,150 2,056,488 2,837,706 2,784,148 2,743,603 2,730,669 2,803,618 2,856,550
Other areas:
Tax abatement for non-profit corporation 20,793 24,949 30,480 32,708 44,377 56,722 104,645 77,145 81,354 88,991 420,864 488,714 487,929 507,446
for social welfare support institution 186,937 197,893 202,616 217,781 179,389 196,208 213,679 208,789 229,025 229,103 28,423 137,274 142,028 147,709
for imported goods for the disabled 7,744 14,369 26,292 31,825 8,190 8,406 9,049 10,757 25,417 18,948 15,322 17,201 15,428 21,138 for the cars used by the disabled 178,192 72,769 65,743 33,059 37,776 67,754 54,731 55,983 59,231 72,365 330,309 388,401 311,532 323,993
Tax breaks to stimulate private social protection (not including pensions) 0 0 0 0 0 0 0 0 0 0 0 0 0 0
Memorendum item
Tax breaks to pensions
Other social policy General Social welfare2001 2002 2003 2004 2005 2006 2007 2008 2009 2010 2011 2012 2013
2014
provisional
Supporting for social
welfare system Non-taxation for personal pension saving
119,300 83,300 75,500 68,400 45,600 54,800 71,303 54,800 97,000 73,400 15,600 28,600 30,800 32,300
Tax deduction for personal pension saving
108,100 100,800 87,100 83,000 65,700 86,100 62,300 54,900 48,800 40,100 39,000 29,000 27,200 28,800
Table Annex
Detailed information on the impact of the tax system on social expenditure (cont.)
Source: OECD on-line National Accounts database (http://stats.oecd.org/Index.aspx?DataSetCode=SNA_TABLE1) for lines 1 and 2; and OECD Revenue Statistics database (http://stats.oecd.org/Index.aspx?DataSetCode=REV) for lines 3, 4, and 5.
Gho, K.H, Chang Y.S and J.W, Kang (2012), Estimation of Social Expenditure in Korea on the Basis of the OECD Guidelines: 1995 - 2009 (in Korean only), Korean Institute for Health and Social Affairs (KIHASA), Korea.
OECD Social Expenditure database (www.oecd.org/els/social/expenditure) // Base de données des dépenses sociales de l'OCDE (www.oecd.org/els/social/depenses) - Version 17-10-2016

Luxembourg
A. Average Itemised Tax Rates (AITR %)
2003 2005 2007 2009 2010 2011 2012 2013
1 Old-age cash benefits
1a - public pensions (2) 8.2% 9.2% 11.2% 10.7% 11.25% 11.15% 11.21% 11.92%
1b - early retirement benefits (public) 7.9% 9.3% 10.6% 10.2% 10.76% 13.45% 13.50% 14.40%
1c1 - private pensions (3) 17.2% 18.6% 20.5% 20.5% 21.20% 22.48% 22.71% 23.68%
1c2 - early retirement benefits (private) 18.3% 19.7% 20.7% 20.8% 21.40% 22.96% 23.18% 23.98%
2 Old-age cash benefits (survivor)
2a - public pensions (2) 5.6% 6.4% 7.6% 7.2% 7.86% 9.69% 9.81% 10.32%
2b - private pensions (3) 10.6% 12.2% 13.3% 12.8% 13.71% 17.15% 17.11% 17.83%
3 Incapacity-related benefits
3a1 - Disability pensions (public) 5.7% 6.5% 7.3% 7.3% 8.17% 9.95% 9.82% 10.45%
3a2 - Disability pensions (private) 13.2% 13.8% 13.6% 14.1% 15.69% 18.87% 19.05% 19.68%
3b - Occupational Injury benefits 0.0% 0.0% 0.0% 0.0% 0.00% 0.00% 1.14% 2.48%
3c - Sickness payments (4) 16.7% 17.3% 18.6% 19.0% 19.73% 19.96% 19.19% 19.83%
4 Family cash benefits
4a - Family benefits 0.0% 0.0% 0.0% 0.0% 0.00% 0.00% 0.00% 0.00%
4b - Maternity and parental leave payments 14.4% 14.8% 16.1% 16.6% 16.74% 16.61% 16.88% 17.22%
4c - Sole parent benefits
6 Unemployment
6a - unemployment insurance benefit 16.7% 16.9% 17.7% 17.9% 18.67% 18.02% 17.93% 18.49%
8 Other contingencies
8a - Low Income benefits 6.1% 6.0% 6.6% 5.9% 5.86% 4.81% 4.71% 4.71%
9 Wage income (5) 22.8% 23.8% 25.2% 25.5% 25.91% 26.40% 25.87% 26.71%
10 Wage income + transferts 19.8% 20.8% 22.4% 22.6% 23.02% 23.62% 23.16% 23.94% Note : 1) Correspondance of EUROSTAT ESSPROS scheme and category.
3) All pension income (old-age cash benefits) paid by the state or a social security fund.4) If sickness benefits paid through social insurance funds (please indicate whether or not his covers maternity and parental benefits in your data-set).5) This category is included for reference purposes, but can be used to estimate tax paid by recipients of continued wage payments in case of absence because of illness.
Source: Microsimulation de l'Inspection générale de la sécurité sociale (IGSS) du Luxembourg (www.mss.public.lu).
B. Taux indirect implicite moyen d'imposition sur la consommation
Table Annex
Detailed information on the impact of the tax system on social expenditure (cont.)
2) Public transfer income concerns all cash benefits paid by general government (different levels of government and social security
institutions). Other social benefits, e.g. occupational pension payments, are considered private.
OECD Social Expenditure database (www.oecd.org/social/expenditure.htm) // Base de données des dépenses sociales de l'OCDE (www.oecd.org/fr/social/depenses.htm) - Version 17-10-2016

Luxembourg
Table Annex
Detailed information on the impact of the tax system on social expenditure (cont.)
Impôts indirects payés sur la consommation des prestations en espèces, en millions de la monnaies nationale
2003 2005 2007 2009 2010 2011 2012 2013
(1) Dépense privée de consommation finale des ménages 827,517 885,372 953,415 953,740 978,932 1,007,196 993,725 980,948
(2)
Consommation des ménages et des administrations publiques moins les salaires
des administrations publiques 946,525 1,020,343 1,093,918 1,106,497 1,134,032 1,158,499 1,143,031 1,131,580
(3) Impôts sur la consommation plus droits d'accise (5110+5121) 111,784 117,712 128,527 122,183 134,000 139,738 142,966 139,641
5110 Impôts généraux 79,099 85,317 95,623 86,544 97,586 98,650 96,170 93,921 5121 Accises 32,685 32,395 32,904 35,639 36,414 41,088 46,796 45,720
(4) Impôts sur production, vente, transfert (5100) 128,966 138,938 152,930 146,855 158,550 164,900 167,312 162,694
(5) Impôts sur les biens et services (5000) 143,281 154,101 169,608 164,207 176,638 184,275 187,524 184,382
Taux indirect implicite moyen d'imposition sur la consommation :
(6) par les impôts sur la consommation et les droits d'accise (3)/(2) 11.8% 11.5% 11.7% 11.0% 11.8% 12.1% 12.5% 12.3%
(7) par un concept plus large de base d'imposition (5)/(2) 15.1% 15.1% 15.5% 14.8% 15.6% 15.9% 16.4% 16.3%
(8)
par un concept plus large de base d'imposition et en ignorant la consommation
des administrations publiques (5)/(1)17.3% 17.4% 17.8% 17.2% 18.0% 18.3% 18.9% 18.8%
C. Avantages fiscaux à finalité sociale (en millions d'euros)2003 2005 2007 2009 2010 2011 2012 2013
Tax breaks similar to cash benefitsFamily:
Child tax credit till 2008Other areas:
Tax breaks to stimulate private social protection (not including pensions)
Memorendum item
Tax breaks to pensions
Source: Microsimulation model using administrative data of the Inspection générale de la sécurité sociale (IGSS) du Luxembourg (http://www.mss.public.lu/)
Source: OECD on-line National Accounts database (http://stats.oecd.org/Index.aspx?DataSetCode=SNA_TABLE1) for lines 1 and 2; and
OECD Revenue Statistics database (http://stats.oecd.org/Index.aspx?DataSetCode=REV) for lines 3, 4, and 5.
OECD Social Expenditure database (www.oecd.org/social/expenditure.htm) // Base de données des dépenses sociales de l'OCDE (www.oecd.org/fr/social/depenses.htm) - Version 17-10-2016

MEXICO
A. Average Itemized Tax Rates (AITR, %) a/
2001 2003 2005 2007 2009 2010 2011 2012 2013 2014
1 Old-age cash benefits b/
1a - public pensions
1b - early retirement benefits
1c - private pensions 2.8 2.6 2.7
2 Survivors' benefits
2a - public pensions
2b - private pensions
3 Incapacity-related benefits
3a - Disability pensions b/ 3.1 3.0 3.4 3.9 4.5
3b - Occupational Injury benefits
3c - Sickness payments
4 Family cash benefits
4b - Maternity and parental leave payments
4c - Sole parent benefits
5 Active labour market policies
5a - benefits while on training
6 Unemployment
- unemployment insurance/assistance benefit
7 Housing
7a - rent subsidies b/ 15.7 16.8 17.4
8 Other contingencies
8a - Low Income benefits
9 Wage income c/ 9.8 11.0 10.7 11.4 11.8
a/ The AITR´s were calculated with a microdata set of taxable and exempted wage income of employees for 2012, 2013 and 2014.
B. Average implicit indirect tax rates of consumption out of benefit income
Indirect taxes paid out of consumption of cash transfers, in millions of pesos)
2001 2003 2005 2007 2009 2010 2011 2012 2013 2014
(1) Private final consumption expenditure 4,465,947 5,229,872 6,385,901 7,549,539 8,063,910 8,899,923 9,642,532 10,510,047 11,052,715 11,689,637
(2) Private consumption plus Government consumption minus Government wages 4,562,333 5,419,582 6,621,463 7,838,032 8,420,303 9,270,804 10,061,375 10,967,868 11,539,138 ..
(3) General consumption taxes plus excise duties (5110+5121) 323,706 376,888 373,718 456,021 477,565 590,607 631,765 678,477 660,905 667,085
5110 General taxes 208,408 254,433 318,432 409,013 407,795 504,509 537,143 579,988 556,794 667,085
5121 Excises 115,298 122,455 55,286 47,008 69,770 86,098 94,623 98,490 104,111 0
(4) Taxes on production sale transfer (5100) 550,184 675,640 928,979 1,042,372 1,017,627 1,271,581 1,508,269 1,643,337 1,557,226 0
(5) Taxes on Goods and Services (5000) 561,704 689,055 944,766 1,063,584 1,039,344 1,293,373 1,530,906 1,660,413 1,576,887 0
Implicit average indirect tax rate on consumption out of benefit income:
(6) using general consumption taxes plus excise duties (3)/(2) 7.1% 7.0% 5.6% 5.8% 5.7% 6.4% 6.3% 6.2% 5.7% #VALUE!
(7) using a broad concept of the indirect tax base (5)/(2) 12.3% 12.7% 14.3% 13.6% 12.3% 14.0% 15.2% 15.1% 13.7% #VALUE!
(8) using a broad concept of the indirect tax base and ignoring government consumpion (5)/(1) 12.6% 13.2% 14.8% 14.1% 12.9% 14.5% 15.9% 15.8% 14.3% 0.0%
C. Tax breaks for social purposes (in millions of Mexican pesos)
20011/
2003 2005 2007 2009 2010 2011 2012 2013 2014
Tax breaks Similar to cash benefits. 66,590 50,320 77,533 99,893 11,383 12,293 12,326 14,579 15,696 18,032
Family:
Other areas:
- Fiscal subsidy (Art. 80-A of 2001 ITL, Articles 114 and 178 of ITL from 2003 to 2007)2/
(wastable tax credit eliminating the existing inequity in the employees' income tax by reducing the tax burden of
those workers that receive a minor proportion of exempt fringe benefits, consequently reducing the difference with
those who earn the same level of income and obtain a significant percentage of exempt fringe benefits)
52,910 34,108 58,938 77,069
Source: OECD on-line National Accounts database (http://stats.oecd.org/Index.aspx?DataSetCode=SNA_TABLE1) for lines 1 and 2; and OECD Revenue Statistics database (http://stats.oecd.org/Index.aspx?DataSetCode=REV) for lines 3, 4, and 5.
Table Annex
Detailed information on the impact of the tax system on social expenditure (cont.)
Almost all the income of individuals from social programs is tax exempted, as stated in article 93 of the Income Tax Law. There are no revenue statistics of the fraction of these transfer benefits that is taxed.
b/ Pension income less than 15 times the minimum wage is tax exempted. Tax exemption of certain social welfare benefits is limited if the sum of ordinary wage and benefits is greater than 7 times the annual minimum wage.
c/ Includes benefits related to wage income.
Source: Ministry of Finance.
OECD Social Expenditure database (www.oecd.org/social/expenditure.htm) // Base de données des dépenses sociales de l'OCDE (www.oecd.org/fr/social/depenses.htm) - Version 17-10-2016

MEXICO
Table Annex
Detailed information on the impact of the tax system on social expenditure (cont.)
- Social welfare provisions (includes subsidy for disability, scholarships, day-care, cultural and sports activities,
and other benefits given in accordance with labor contracts).13,680 16,212 18,595 22,824 11,383 12,293 12,326 14,579 15,696 18,032
- For information only - Employment subsidy.3/ Presidential Decree published in the National Gazette (Diario
Oficial de la Federación)in October 1st 2007. Since 2008 the employment subsidy (non-wastable tax credit
assigned through a table, decreasing the amount by the level of income obtained by each worker. For monthly
income higher than MXN 7 382.34, no employment subsidy is given. Employees with an income tax lower than
the employment subsidy receive in cash the difference along with their salary. The rest of the workers that receive
the subsidy are entitled to a reduction in their tax burden. The employment subsidy is paid by the employers who
may credit it against their tax liabilities; and therefore it represents a fiscal cost for the government). Before the
2008 Tax Reform the employment subsidy was the salary tax credit (Articles 115 and 116 of ITL from 2003 to
2007) which granted the same benefit to lower income workers
35,071 33,646 40,099 35,888 32,488 30,635 30,661 29,594 40,526 41,293
Tax breaks to stimulate private social protection (not including pensions). 12,167 15,250 10,694 17,935 9,099 10,143 10,196 11,780 11,966 13,330
- Income from saving funds.12,010 14,989 7,550 8,770 7,423
8,289 8,086 9,379 9,371 10,744
- Reimbursement of medical, dental and funeral expenses.157 261 82 101 139
164 172 187 171 156
- Donations to approved institutions. - - 3,063 9,064 1,537
1,690 1,938 2,214 2,424 2,430
Memorendum item
Tax breaks to pensions. 5,151 6,927 9,164 21,638 29,373 35,954 38,563 36,663 34,807 42,804
- Retirement and pensions. 464 2,082 2,420 8,947 9,872 11,561 22,119 24,679 27,828 39,060
- Deduction of employers contributions to retirement and pension funds (voluntary contributions). 4,687 4,845 6,744 12,691 19,502 24,393 16,444 11,984 6,979 3,744
Source: Tax Expenditures Budget 2010-2014.
OECD Social Expenditure database (www.oecd.org/social/expenditure.htm) // Base de données des dépenses sociales de l'OCDE (www.oecd.org/fr/social/depenses.htm) - Version 17-10-2016

NETHERLANDS
A. Average Itemised Tax Rates (AITR %)
2001 2003 2005 2007 2009 2010 2011 2012 2013
1 Old-age cash benefits 14.6 - - -1a - public pensions 7.1 13.8 13.8 9.2 9.3 8.8 1b - early retirement benefits 27.9 32.3 32.9 26.8 26.1 25.9 1c - private pensions 16.8 21.5 22.1 17.0 17.3 16.8 2 Survivors' benefits 25.3 2a - public pensions 23.5 24.1 24.3 25.5 25.5 25.5 2b - private pensions 29.5 24.1 24.3 25.5 25.5 25.5 3 Incapacity-related benefits3a - Disability pensions 20.4 27.1 27.6 27.6 pm pm6 Unemployment6a - unemployment insurance benefit 21.6 25.5 25.8 24.2 23.7 22.8 6b - unemployment assistance benefit 14.6 16.5 16.5 16.2 16.2 16.2 8 Other contingencies8a - Low Income benefits 14.0 16.5 16.5 16.2 16.2 16.2 9 Wage income 25.5 32.5 33.4 27.0 26.7 26.7
* 2007 tax rates in italics are Secretariat estimes.
Source: Ministry of Finance, The Netherlands.
B. Average implicit indirect tax rates of consumption out of benefit incomeIndirect taxes paid out of consumption of cash transfers, in millions of euros
2001 2003 2005 2007 2009 2010 2011 2012 2013
(1) Private final consumption expenditure 236,585 251,045 262,462 279,921 279,579 282,510 288,939 289,756 292,158
(2) Private consumption plus Government consumption minus Government wages 293,560 319,148 334,721 370,110 384,355 389,626 396,379 399,518 402,054
(3) General consumption taxes plus excise duties (5110+5121) 46,952 49,440 55,371 60,532 57,888 60,844 59,619 58,864 59,418
5110 General taxes 32,509 34,754 38,566 42,873 40,086 42,654 41,610 41,699 42,424 5121 Excises 14,443 14,686 16,805 17,659 17,802 18,190 18,009 17,165 16,994
(4) Taxes on production sale transfer (5100) 48,060 50,844 56,892 62,015 59,635 62,413 61,390 61,290 63,046
(5) Taxes on Goods and Services (5000) 52,754 55,918 62,714 68,555 66,929 70,154 69,187 69,127 70,720
Implicit average indirect tax rate on consumption out of benefit income:
(6) using general consumption taxes plus excise duties (3)/(2) 16.0% 15.5% 16.5% 16.4% 15.1% 15.6% 15.0% 14.7% 14.8%
(7) using a broad concept of the indirect tax base (5)/(2) 18.0% 17.5% 18.7% 18.5% 17.4% 18.0% 17.5% 17.3% 17.6%
(8) using a broad concept of the indirect tax base and ignoring government consumpion (5)/(1) 22.3% 22.3% 23.9% 24.5% 23.9% 24.8% 23.9% 23.9% 24.2%
C. Tax breaks for social purposes (in millions of euros)
Source: OECD on-line National Accounts database (http://stats.oecd.org/Index.aspx?DataSetCode=SNA_TABLE1) for lines 1 and 2; and OECD Revenue Statistics database
(http://stats.oecd.org/Index.aspx?DataSetCode=REV) for lines 3, 4, and 5.
Table Annex I.A.2.1
Detailed information on the impact of the tax system on social expenditure (cont.)
The micro-simulation model used is based on annual tax data from a representative sample of taxpayers (220 000 individuals, of whom 150 000 have income, or 1.5% of the taxpaying population). These tax data mainly comprise information from
income and wage tax returns and assessments. It normally takes three years before sufficient tax data are available and the simulation model is adjusted, and before reliable up-to-date estimates can be made for current and future years.
OECD Social Expenditure database (www.oecd.org/social/expenditure.htm) // Base de données des dépenses sociales de l'OCDE (www.oecd.org/fr/social/depenses.htm) - Version 17-10-2016

NETHERLANDS
Table Annex I.A.2.1
Detailed information on the impact of the tax system on social expenditure (cont.)
2001 2003 2005 2007 * 2009 2010 2011 2012 2013
Tax breaks similar to cash benefits 1,422 2,444 3,855 4,834 4,296 4,267 4267
Child credits 155 352 621 727 - -Child benefit (for information only as already included in SOCX) 863 981 981Income dependent combination credit (combination of work and care for children) 263 409 754 955 1,432 1,484 1484Single parent credit and additional single parent credit 472 506 618 687 552 557 557Special benefit invalidity and chronical illness 253 256 256Deduction for medical expenses, disability, chronically ill or handicapped expenses, child adoption 364 944 1,712 2,300 984 761 761Deduction for support expenses for children 106 136 150 165 212 228 228Deduction for child care contributions 62 97 .. .. .. .. ..Child care benefit (i.e. daycare and nursery) (for information only as already included in SOCX) 1,942 2,950 2,428 2428
Tax breaks to stimulate private social protection (not including pensions) 2,003 1,753 811 496 496 544 544
Reduced wage tax for low wage employees 890 620 186 - - -Reduced wage tax for long-term unemployed 207 130 39 - - -Reduced wage tax for child care 92 162 - - - -Reduced wage tax for paid parental leave 18 42 51 - - -Deduction of charitable and other donations 214 231 246 313 329 340 340Reduced succession duty for donations to institutions with a public interest 117 150 158 - - -Temporary additional tax credit for home help 52 41 - - - -
Tax deduction for costs of study 83 105 131 183 167 204 204Tax deduction towards employment/training of workforce 330 272 .. .. - -
Reduced wage tax for schooling (non profit) 59 72 .. .. -Deduction for schooling (employer) 271 200 .. .. -
Memorandum itemTax breaks for pensions .. .. .. 10,400 11,329 12,435 12435
- Non-taxation of investment of private pension funds 4,000 3,834 4,582 4582
* 2007 data in italics are Secretariat estimates. - means that the measures have been abolished.
Source : Ministry of Finance, and Ministry of Social Affairs and Employment, The Netherlands.
OECD Social Expenditure database (www.oecd.org/social/expenditure.htm) // Base de données des dépenses sociales de l'OCDE (www.oecd.org/fr/social/depenses.htm) - Version 17-10-2016

NEW ZEALAND
A. Average Itemised Tax Rates (AITR %)
2001 2003 2005 2007 2009 2010 2011 2012 2013 2014
Transitional Retirement Benefit (Discontinued) 4
15.9 16.0 a a a a a a a a
War Veterans’ Allowances/Veteran's Pensions 5
16.8 17.0 17.1 17.4 14.3 12.8 12.4 12.6 12.7 13.0
Widows Benefit 6
16.3 16.0 16.1 16.4 12.9 11.3 10.8 10.9 11.1 a
Invalids Benefit 7
16.3 16.3 16.4 16.6 12.5 11.0 10.6 10.7 10.5 a
Sickness benefit 8
16.3 15.3 15.5 15.7 12.6 11.1 10.6 10.6 10.6 a
Earners account (ACC) 7.4 19.9 20.2 20.6 19.4 17.5 16.6 16.5 16.6 16.5
Motor vehicle account (ACC) 7.4 21.1 20.9 21.2 19.8 17.6 16.9 17.0 16.8 16.8
Non earners account (ACC) 7.4 19.7 19.9 20.3 18.9 17.2 15.5 16.6 14.3 15.3
Treatment Injury account (ACC) (formerly medical misadventure account) 7.4 23.1 22.6 22.9 20.8 19.4 18.4 18.7 19.0 19.0
Occupational injury: residual claims account (ACC) (Discontinued. Now part of work account) 7.4 x x x x x x x x x
Occupational injury: self-employed account (ACC) (Discontinued. Now part of work account) 7.4 x x x x x x x x x
Occupational injury: employers account (ACC) (Discontinued. Now part of work account) 7.4 x x x x x x x x x
Occupational injury: work account (ACC) 9
a na na na na na na na na na
Domestic Purposes Benefit for lone parents 10
17.3 17.0 17.1 17.3 13.6 12.0 11.6 11.6 11.7 a
Training Benefit (Combined with Unemployment Benefits in appropriations reporting) 15.8 x x x x x x x x x
Unemployment Benefit and Emergency Unemployment Benefit 11
16.5 15.3 15.4 15.6 12.5 11.0 10.5 10.6 10.6 a
Independent Youth Benefit 12
15.5 15.0 15.0 15.0 12.5 11.1 10..5 10.5 a a
New Zealand Superannuation na 17.9 18.3 18.8 16.0 14.4 14.0 14.3 14.5 14.7
Student Allowances na 12.5 14.0 14.1 11.6 10.3 9.8 9.7 9.8 9.9
Jobseeker Support and Emergency Benefit 13
a a a a a a a 10.7 10.8
Sole Parent Support 14
a a a a a a a 11.7 11.8
Supported Living Payment 15
a a a a a a a 10.7 10.8
Youth Payment and Young Parent Payment 16
a a a a a a 11.2 11.1 11.1
na = information not available.x = data recorded elsewherea = assistance not available.
Sources: Ministry of Social Development, Accident Compensation Corporation.Taxation at source (paid by Ministry of Social Development and Accident Compensation Corporation) on income transfers and pensions. - from administrative data.
B. Average implicit indirect tax rates of consumption out of benefit incomeIndirect taxes paid out of consumption of cash transfers, in millions of New Zealand dollars
Table Annex
Detailed information on the impact of the tax system on social expenditure (cont.)
Notes
1) Tax on assistance shown is that paid by agencies, and is a potentially incomplete proxy for all tax paid on the assistance shown. Information on additional tax paid by recipients of assistance is not available.
2) Calculated tax rates may be distorted by debts/adjustments which are deducted from the pre-tax figure.
3) Excludes non-taxable social assistance paid to households. Non-taxable assistance excluded includes supplementary benefits (eg Accommodation Supplement) and hardship assistance (eg Special Needs Grants).
4) Transitional Retirement Benefit discontinued on 1 April 2003 following incremental raising to 65 years of eligibility age for New Zealand Superannuation.
5) War Veteran's Allowances were renamed Veteran's Pensions in 1990.
6) Widow's Benefit was discontinued from July 2013; superseded by Jobseeker Support for clients who had no dependent children or whose youngest dependent child was aged 14 years or over, and by
Sole Parent Support for clients who have younger dependent children..
7) Invalid's Benefit was discontinued from July 2013; superseded by Supported Living Payment.
8) Sickness Benefit was discontinued from July 2013; superseded by Jobseeker Support - Health and Disability Conditions. Clients receiving this benefit retained a temporary exemption from requirements
to seek paid work.
9) Work account information released by ACC includes compensation payments made by employers who operate their own injury mangement scheme, but excludes tax at source paid by these employers.
This means that accurate information on tax at source on these payments is not available.
10) Domestic Purposes Benefit was discontinued from July 2013; superseded by Jobseeker Support - Work Ready (if caring for dependent children aged 14 years or over), by Sole Parent Support if caring
for one or more dependent children aged under 14 years, and by Supported Living Payment if caring for a person who is dependent on full-tome care as a result of a health or medical condition.
11) Unemployment Benefits and Emergency Unemployment Benefits was discontinued from July 2013; superseded by Jobseeker Support - Work Ready.
12) Independent Youth Benefit was discontinued from August 2012; superseded byYoung Parent Payments (for sole parents aged 19 years or under) and Youth Payment (for other young people)..
13) Jobseeker Support and Emergency Benefit available from July 2013.
14) Sole Parent Support available from July 2013.
15) Supported Living Payment available from July 2013.
16) Youth Payment and Young Parent Payment available from August 2012.
OECD Social Expenditure database (www.oecd.org/social/expenditure.htm) // Base de données des dépenses sociales de l'OCDE (www.oecd.org/fr/social/depenses.htm) - Version 17-10-2016

NEW ZEALAND
Table Annex
Detailed information on the impact of the tax system on social expenditure (cont.)
2001 2003 2005 2007 2009 2010 2011 2012 2013 2014
(1) Private final consumption expenditure 72,858 82,916 94,791 106,174 113,390 118,144 124,940 128,791 133,732 138,227
(2) Private consumption plus Government consumption minus Government wages 83,836 94,780 109,357 123,334 132,177 137,894 145,780 149,627 155,610 160,851
(3) General consumption taxes plus excise duties (5110+5121) 12,924 15,120 16,438 16,673 18,140 20,925 22,128 22,870 23,919 25,350
5110 General taxes 10,645 12,775 14,133 15,046 16,449 19,143 20,314 21,004 22,063 23,334
5121 Excises 2,279 2,345 2,305 1,627 1,691 1,782 1,814 1,866 1,856 2,016
(4) Taxes on production sale transfer (5100) 13,831 16,135 17,822 18,832 20,278 23,107 24,437 25,193 26,346 27,910
(5) Taxes on Goods and Services (5000) 14,799 17,259 19,054 20,290 21,781 24,692 26,063 26,856 28,170 29,841
Implicit average indirect tax rate on consumption out of benefit income:
(6) using general consumption taxes plus excise duties (3)/(2) 15.4% 16.0% 15.0% 13.5% 13.7% 15.2% 15.2% 15.3% 15.4% 15.8%
(7) using a broad concept of the indirect tax base (5)/(2) 17.7% 18.2% 17.4% 16.5% 16.5% 17.9% 17.9% 17.9% 18.1% 18.6%
(8) using a broad concept of the indirect tax base and ignoring government consumpion (5)/(1) 20.3% 20.8% 20.1% 19.1% 19.2% 20.9% 20.9% 20.9% 21.1% 21.6%
na=data not available
C. Tax breaks for social purposes (in millions of New Zealand dollars)
2001 2003 2005 2007 2009 2010 2011 2012 2013 2014
Tax breaks similar to cash benefits 26.6 24 24 48 46 40 33 1 0 0
Family:Child rebate 8.5 9 9 27 16 14 12 a a aChild Care 18.1 15 16 15 13 14 15 a a a
Other areas: Redundancy rebate - - - 7 17 12 6 1 a a
Tax breaks to stimulate private social protection (not including pensions) 82.8 98 106 116 198 198 216 227 236 236Charitable Donations 82.8 98 106 116 198 198 216 227 236 236
Tax breaks to pensions 82.8 a a na 1 025 1 037 690 723 804 882Kiwisaver tax credits (employer exemption from Employer Superannuaton Contribution Tax on employerr contributions to employee's KiwiSaver funds)82.8 a a na 1 025 1 037 690 723 804 882
Source: New Zealand Treasury to 2007; 2009 onward Ministry of Social Development.2009 - 2013, estimated actual expenditure on tax breaks published in Tax Expenditure Statements released by New Zealand Treasury following annual Government Budget. 2014 - forecast expenditure on tax breaks published in the Tax Expenditure Statement published following the 2015 Government Budget.
a = assistance or tax rebate not availablena=information not available
Source: OECD on-line National Accounts database (http://stats.oecd.org/Index.aspx?DataSetCode=SNA_TABLE1) for lines 1 and 2; and OECD Revenue Statistics database (http://stats.oecd.org/Index.aspx?DataSetCode=REV) for lines
OECD Social Expenditure database (www.oecd.org/social/expenditure.htm) // Base de données des dépenses sociales de l'OCDE (www.oecd.org/fr/social/depenses.htm) - Version 17-10-2016

NORWAY
A. Average Itemised Tax Rates (AITR %)
2001 2003 2005 2007 2009 2010 2011 2012 2013
1 Old-age cash benefits 18.3 17.8 17.6 18.3 18.0 18.2 18.1 18.4 18.6
1a - public pensions 16.5 16.0 15.7 16.6 16.2 16.4 16.3 16.7 17.1
1b - early retirement benefits 22.4 22.5 21.1 21.1 20.5 20.5 20.0 20.5 20.8
1c - private pensions 22.1 21.3 21.3 21.9 21.9 22.0 22.2 22.3 22.2
2 Survivors' benefits 19.4 18.9 18.1 18.7 18.5 19.3 19.4 20.0 19.1
2a - public pensions 19.4 18.9 18.1 18.7 18.5 19.3 19.4 20.0 19.1
3 Incapacity-related benefits 16.3 15.7 15.6 15.4 15.1 15.2 15.5 15.4 15.2
3a - Disability pensions 15.8 15.3 15.3 15.0 14.7 14.8 15.2 15.1 14.9
3c - Sickness payments 25.4 25.0 26.0 26.1 25.7 26.0 26.5 26.7 26.2
4 Family cash benefits 0.2 0.2 0.3 0.3 0.7 0.8 0.0 0.0 0.0
4c - Sole parent benefits 1.6 0.9 1.2 1.7 1.7 3.4 0.0 0.0 0.0
5 Active labour market policies 17.2 19.8 19.9 19.4 19.7 19.8 19.9 20.0 19.8
5a - benefits while on training 17.2 19.8 19.9 19.4 19.7 19.8 19.9 20.0 19.8
6 Unemployment 20.4 20.8 20.1 19.9 20.4 20.4 20.4 20.3 20.0
6a - unemployment insurance benefit 20.4 20.8 20.1 19.9 20.4 20.4 20.4 20.3 20.0
Source: Ministry of Finance.
B. Average implicit indirect tax rates of consumption out of benefit income
Indirect taxes paid out of consumption of cash transfers, in millions Norwegian kroner
2001 2003 2005 2007 2009 2010 2011 2012 2013
(1) Private final consumption expenditure 667,567 740,761 834,615 951,288 1,025,953 1,087,157 1,124,953 1,176,409 1,232,900
(2) Private consumption plus Government consumption minus Government wages 784,015 873,355 976,849 1,110,014 1,221,113 1,292,505 1,339,707 1,399,789 1,467,144
(3) General consumption taxes plus excise duties (5110+5121) 183,542 187,491 216,528 260,471 258,523 278,131 288,655 301,365 314,033
5110 General taxes 129,182 130,794 153,820 189,424 186,759 201,802 211,689 224,062 235,610
5121 Excises 54,360 56,697 62,708 71,047 71,764 76,329 76,966 77,303 78,423
(4) Taxes on production sale transfer (5100) 189,880 192,538 220,835 265,669 264,495 284,948 295,394 308,450 321,353
(5) Taxes on Goods and Services (5000) 204,261 205,930 235,040 282,329 279,001 299,253 310,161 324,286 340,161
Implicit average indirect tax rate on consumption out of benefit income:
(6) using general consumption taxes plus excise duties (3)/(2) 23.4% 21.5% 22.2% 23.5% 21.2% 21.5% 21.5% 21.5% 21.4%
(7) using a broad concept of the indirect tax base (5)/(2) 26.1% 23.6% 24.1% 25.4% 22.8% 23.2% 23.2% 23.2% 23.2%
(8) using a broad concept of the indirect tax base and ignoring government consumpion (5)/(1) 30.6% 27.8% 28.2% 29.7% 27.2% 27.5% 27.6% 27.6% 27.6%
Table Annex
Detailed information on the impact of the tax system on social expenditure (cont.)
Source: OECD on-line National Accounts database (http://stats.oecd.org/Index.aspx?DataSetCode=SNA_TABLE1) for lines 1 and 2; and OECD Revenue Statistics database
(http://stats.oecd.org/Index.aspx?DataSetCode=REV) for lines 3, 4, and 5.
OECD Social Expenditure database (www.oecd.org/social/expenditure.htm) // Base de données des dépenses sociales de l'OCDE (www.oecd.org/fr/social/depenses.htm) - Version 17-10-2016
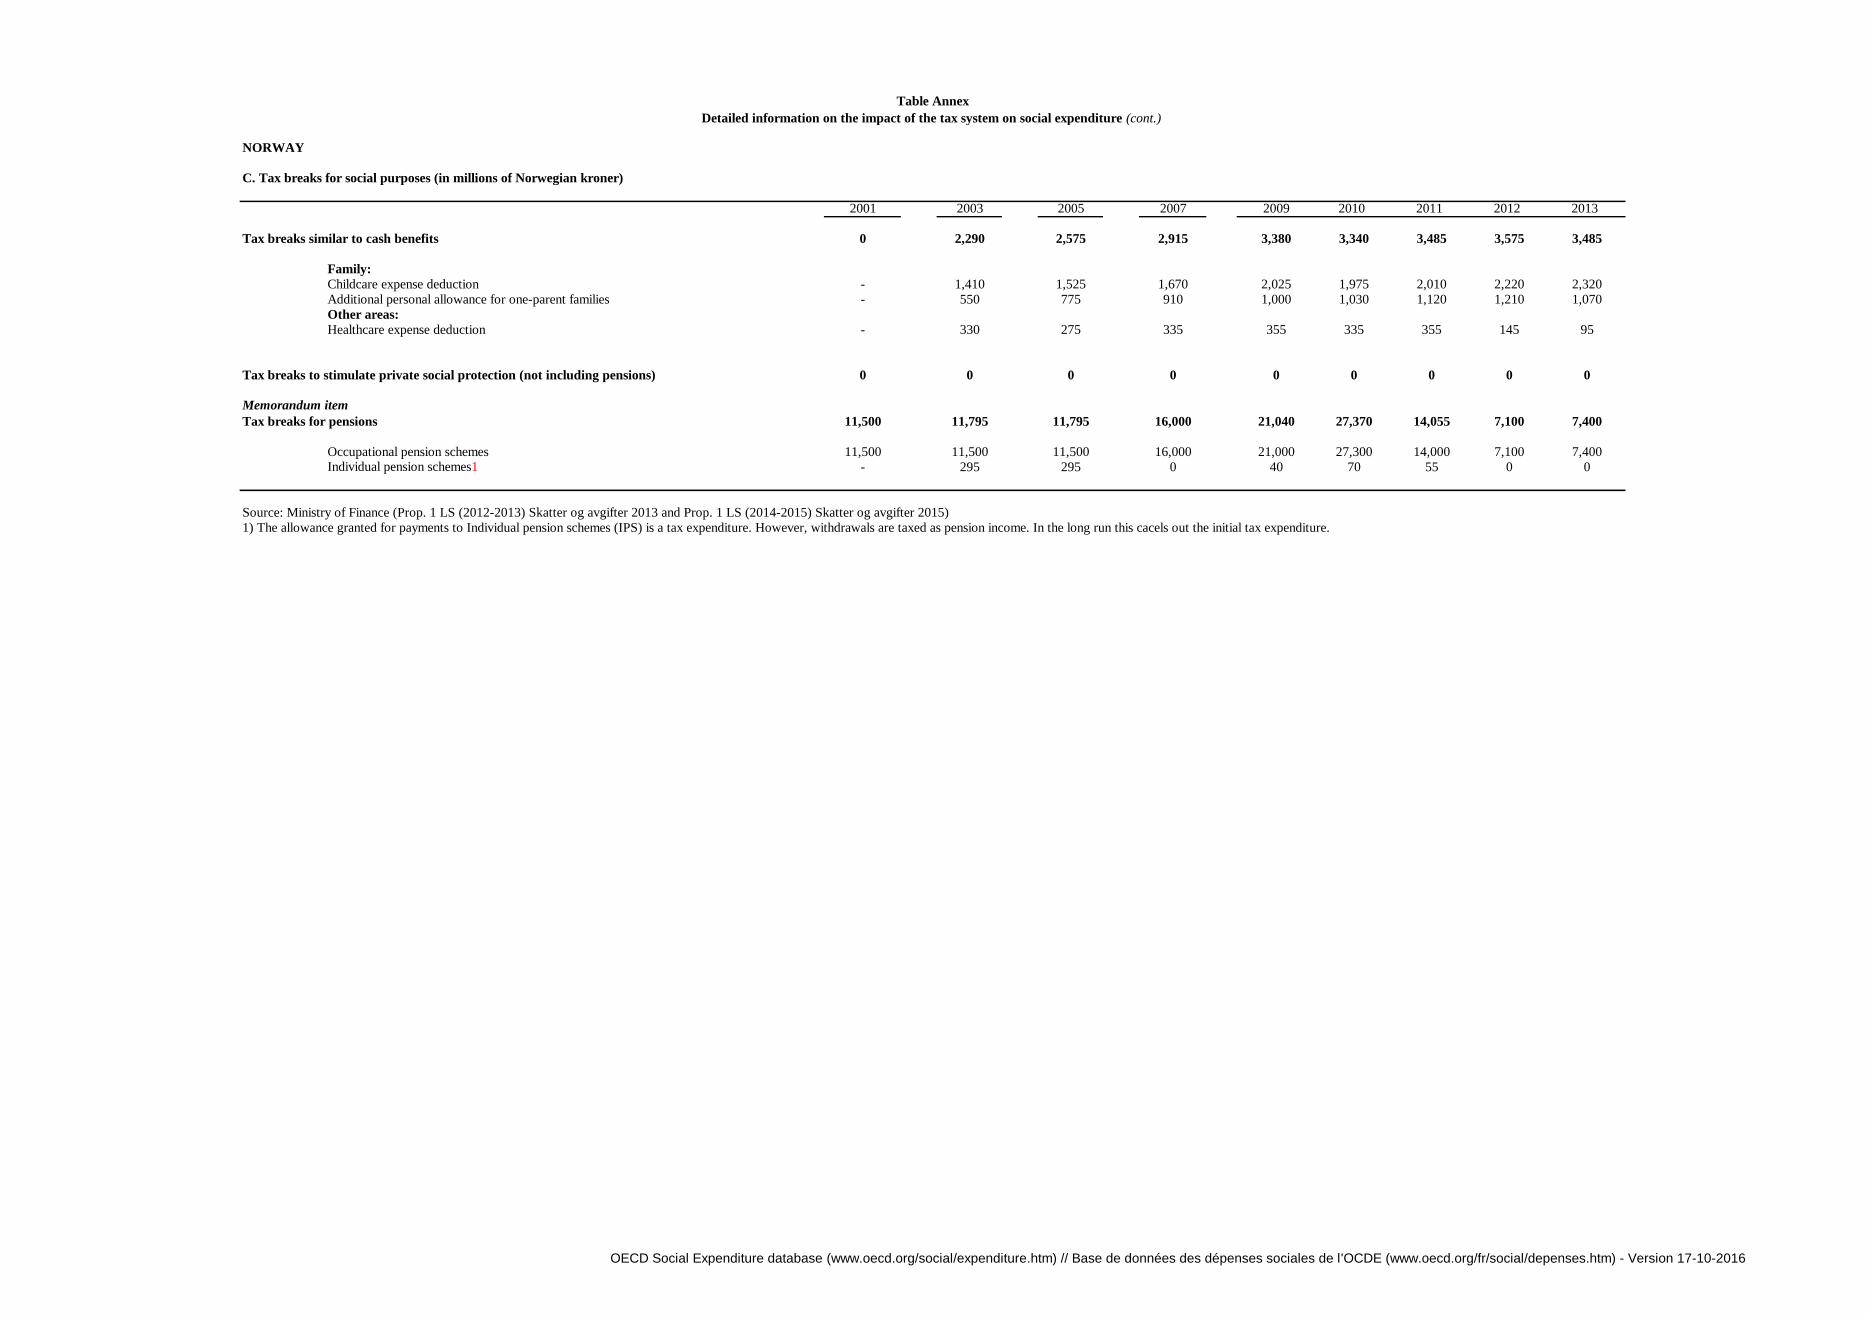
NORWAY
Table Annex
Detailed information on the impact of the tax system on social expenditure (cont.)
C. Tax breaks for social purposes (in millions of Norwegian kroner)
2001 2003 2005 2007 2009 2010 2011 2012 2013
Tax breaks similar to cash benefits 0 2,290 2,575 2,915 3,380 3,340 3,485 3,575 3,485
Family:
Childcare expense deduction - 1,410 1,525 1,670 2,025 1,975 2,010 2,220 2,320
Additional personal allowance for one-parent families - 550 775 910 1,000 1,030 1,120 1,210 1,070
Other areas:
Healthcare expense deduction - 330 275 335 355 335 355 145 95
Tax breaks to stimulate private social protection (not including pensions) 0 0 0 0 0 0 0 0 0
Memorandum item
Tax breaks for pensions 11,500 11,795 11,795 16,000 21,040 27,370 14,055 7,100 7,400
Occupational pension schemes 11,500 11,500 11,500 16,000 21,000 27,300 14,000 7,100 7,400Individual pension schemes1 - 295 295 0 40 70 55 0 0
Source: Ministry of Finance (Prop. 1 LS (2012-2013) Skatter og avgifter 2013 and Prop. 1 LS (2014-2015) Skatter og avgifter 2015)
1) The allowance granted for payments to Individual pension schemes (IPS) is a tax expenditure. However, withdrawals are taxed as pension income. In the long run this cacels out the initial tax expenditure.
OECD Social Expenditure database (www.oecd.org/social/expenditure.htm) // Base de données des dépenses sociales de l'OCDE (www.oecd.org/fr/social/depenses.htm) - Version 17-10-2016

POLAND
A. Average Itemised Tax Rates (AITR %)
2005 2007 2009 2010 2011 2012 2013
Total tax paid on transfer income (effective tax rate + effective rate of contribution)
old-age and disability pensions
13.53% * = 5.90% (tax) +
7.63% (SSC)
14.28% * = 6.65% (tax)
+ 7.63% (SSC)
13.80% * = 6.12% (tax) +
7.68% (SSC)
14.02% * = 6.32% (tax) +
7.7% (SSC)
14.23% * = 6.53% (tax) +
7.7% (SSC)
14.47% * = 6.75% (tax) +
7.72% (SSC)
14.68% * = 6.97% (tax) +
7.71% (SSC)
unemployment benefits
13.53% * = 5.90% (tax) +
7.63% (SSC)
14.28% * = 6.65% (tax)
+ 7.63% (SSC)
13.80% * = 6.12% (tax) +
7.68% (SSC)
14.02% * = 6.32% (tax) +
7.7% (SSC)
14.23% * = 6.53% (tax) +
7.7% (SSC)
14.47% * = 6.75% (tax) +
7.72% (SSC)
14.68% * = 6.97% (tax) +
7.71% (SSC)
sickness benefits
16.83% ** (= 9.40% (tax)
+ 7.43% (SSC))
16.33% ** (= 8.90%
(tax) + 7.43% (SSC)
13.73% ** (= 6.16% (tax)
+ 7.57% (SSC)
13.88% ** (= 6.35% (tax)
+ 7.53% (SSC)
14.09% ** (= 6.55% (tax)
+ 7.54% (SSC)
14.18% ** (= 6.65% (tax)
+ 7.53% (SSC)
14.36% ** (= 6.85% (tax)
+ 7.51% (SSC)
wage income
16.83% = 9.40% (tax) +
7.43% (SSC)
16.33%
=8,90%(tax)+7,43%(SS
C)
13.73% ** (= 6.16% (tax)
+ 7.57% (SSC)
13.88% ** (= 6.35% (tax)
+ 7.53% (SSC)
14.09% ** (= 6.55% (tax)
+ 7.54% (SSC)
14.18% ** (= 6.65% (tax)
+ 7.53% (SSC)
14.36% ** (= 6.85% (tax)
+ 7.51% (SSC)
* Rate can be lower.** On 40% of benefits only.
Source: Ministry of Finance, Poland.
B. Average implicit indirect tax rates of consumption out of benefit income
Indirect taxes paid out of consumption of cash transfers, in millions of Polish Zloty
2005 2007 2009 2010 2011 2012 2013
(1) Private final consumption expenditure 619,960 718,040 839,950 890,111 963,274 1,002,660 1,008,564
(2) Private consumption plus Government consumption minus Government wages 692,556 807,501 946,279 1,007,418 1,081,223 1,126,767 1,138,415
(3) General consumption taxes plus excise duties (5110+5121) 118,268 147,224 150,524 169,279 185,666 180,703 182,371
5110 General taxes 75,783 97,848 99,562 109,717 122,647 116,265 116,607 5121 Excises 42,485 49,376 50,962 59,562 63,019 64,438 65,764
(4) Taxes on production sale transfer (5100) 120,223 150,570 153,543 172,317 189,215 184,109 186,112
(5) Taxes on Goods and Services (5000) 123,954 155,239 158,967 178,280 195,393 189,953 190,618
Implicit average indirect tax rate on consumption out of benefit income:
(6) using general consumption taxes plus excise duties (3)/(2) 17.1% 18.2% 15.9% 16.8% 17.2% 16.0% 16.0%
(7) using a broad concept of the indirect tax base (5)/(2) 17.9% 19.2% 16.8% 17.7% 18.1% 16.9% 16.7%
(8) using a broad concept of the indirect tax base and ignoring government consumpion (5)/(1) 20.0% 21.6% 18.9% 20.0% 20.3% 18.9% 18.9%
C. Tax breaks for social purposes (in millions of Polish Zloty)
2005
(annual tax returns for
2004)
2007
(annual tax returns for
2006)
2009
(annual tax returns for
2008)
2010
(annual tax returns for
2009)
2011
(annual tax returns for
2010)
2012
(annual tax returns for
2011)
2013
(annual tax returns for
2012)
Tax breaks similar to cash benefits 676 1,000 7,523 6,894 6,930 7,062 7,076
Family:
- Value of revenue foregone because of including children in the tax unit (in case of lonly parent) 337 473 554 385 334 335 397 - Children allowance - - 6,044 5,633 5,684 5,740 5,699Other areas:
- Donations to (approved) NGOs 10 105 382 361 404 459 482 - Donations 27 71 86 83 43 68 86- Expences for rehabilitation purposes 302 351 457 432 465 460 412
Tax breaks to stimulate private social protection (not including pensions) 0 0 0 0 0 0 0
Memorandum item
Tax breaks for pensions 1,963 .. .. .. .. .. ..
- Non-taxation of investment of private pension funds 1,963 .. .. .. .. .. ..
Note: Source: Ministry of Finance, Poland.
Table Annex
Detailed information on the impact of the tax system on social expenditure (cont.)
Source: OECD on-line National Accounts database (http://stats.oecd.org/Index.aspx?DataSetCode=SNA_TABLE1) for lines 1 and 2; and OECD Revenue Statistics database
OECD Social Expenditure database (www.oecd.org/social/expenditure.htm) // Base de données des dépenses sociales de l'OCDE (www.oecd.org/fr/social/depenses.htm) - Version 17-10-2016

PORTUGAL
A. Amount of direct tax paid on benefit income (in millions of euros)
2001 2003 2005 2007 2009 2010 2011 2012 2013
Total income tax paid on public and private transfer income .. 866 1 138 1 404 1 546 1 689 1 845 1 907 na
B. Average implicit indirect tax rates of consumption out of benefit incomeIndirect taxes paid out of consumption of cash transfers, in millions of euros
2001 2003 2005 2007 2009 2010 2011 2012 2013
(1) Private final consumption expenditure 72,858 92,238 102,106 113,713 113,509 118,329 115,961 111,610 111,144
(2) Private consumption plus Government consumption minus Government wages 83,836 100,843 112,518 125,387 126,505 130,989 128,330 123,099 122,327
(3) General consumption taxes plus excise duties (5110+5121) 12,924 16,641 18,817 20,274 17,287 19,192 19,632 18,770 18,385
5110 General taxes 10,645 11,076 13,001 14,333 11,971 13,527 14,265 13,995 13,710 5121 Excises 2,279 5,565 5,816 5,941 5,316 5,665 5,367 4,775 4,675
(4) Taxes on production sale transfer (5100) 13,831 18,336 20,903 22,583 19,576 21,278 21,865 20,952 20,567
(5) Taxes on Goods and Services (5000) 14,799 19,825 21,455 23,253 20,340 22,036 22,706 21,802 21,776
Implicit average indirect tax rate on consumption out of benefit income:
(6) using general consumption taxes plus excise duties (3)/(2) 15.4% 16.5% 16.7% 16.2% 13.7% 14.7% 15.3% 15.2% 15.0%
(7) using a broad concept of the indirect tax base (5)/(2) 17.7% 19.7% 19.1% 18.5% 16.1% 16.8% 17.7% 17.7% 17.8%
(8) using a broad concept of the indirect tax base and ignoring government consumpion (5)/(1) 20.3% 21.5% 21.0% 20.4% 17.9% 18.6% 19.6% 19.5% 19.6%
C. Tax breaks for social purposes (in millions of euros)
2001 2003 2005 2007 2009 2010 2011 2012 2013
Tax breaks similar to cash benefits .. 1 438 1 378 1 841 2 005 2 010 1 982 1 211 1 279
Family:- Child tax credits 253 265 279 340 343 344 330 387
Other areas:- Health care tax credits 435 517 610 659 641 609 204 220- Housing tax credits 396 445 503 562 569 579 230 182
Table Annex
Detailed information on the impact of the tax system on social expenditure (cont.)
Source: estimate by the Ministry of Finance based on Personal Income Tax Returns data.
Source: OECD on-line National Accounts database (http://stats.oecd.org/Index.aspx?DataSetCode=SNA_TABLE1) for lines 1 and 2; and OECD Revenue Statistics database
(http://stats.oecd.org/Index.aspx?DataSetCode=REV) for lines 3, 4, and 5.
OECD Social Expenditure database (www.oecd.org/social/expenditure.htm) // Base de données des dépenses sociales de l'OCDE (www.oecd.org/fr/social/depenses.htm) - Version 17-10-2016

PORTUGAL
Table Annex
Detailed information on the impact of the tax system on social expenditure (cont.)
- Tax credits for education expenses and for payments to homes for the elderly on behalf
of taxpayers, 225 6 277 299 302 294 276 286 their relatives in the ascending line and other close relatives whose incomes do not
exceed the minimum wage;
- Tax credit for supporting relatives in the ascending line whose income does not exceed
the minimum pension 3 4 2 1 1 1 1 1- Tax benefits for disabled people 127 141 170 144 154 155 170 203
Tax breaks to stimulate private social protection (not including pensions) .. 88 111 121 126 129 28 21 23
- Tax credits for contributions to personal accident and life insurance 55 67 71 70 72 0 0 0- Tax credits for contributions to health insurance 19 28 33 39 40 22 15 17 - Donations to (approved) NGOs, churches, museums, libraries, schools, research
institutes and associations, 14 16 17 17 17 6 6 6 and other bodies (including government bodies)
Memorandum item
Tax breaks for pensions .. 158 94 113 91 102 105 27 27
- Tax credits for individual retirement accounts (PPR) 158 94 113 91 102 105 27 27- Non-taxation of investment of private pension funds .. .. .. .. .. .. .. .. ..
.. 2001 figures are not available.
Source: Portuguese Ministry of Finance, 2012 State Budget Report ; and Portuguese Ministry of Finance, Personal Income Tax Returns data.
OECD Social Expenditure database (www.oecd.org/social/expenditure.htm) // Base de données des dépenses sociales de l'OCDE (www.oecd.org/fr/social/depenses.htm) - Version 17-10-2016

SLOVAK REPUBLIC
A. Average Itemised Tax Rates / Amount of direct tax paid on benefit income (in millions of euro)
Cash benefits paid by general government in the Slovak Republic are not subject to income tax nor to social security contributions.
B. Average implicit indirect tax rates of consumption out of benefit income
Indirect taxes paid out of consumption of cash transfers, in millions of euro
2001 2003 2005 2007 2009 2010 2011 2012 2013
(1) Private final consumption expenditure 647 773 946 1,160 1,279 1,298 1,340 1,381 1,388
(2) Private consumption plus Government consumption minus Government wages 773 927 1,117 1,365 1,521 1,543 1,583 1,614 1,623
(3) General consumption taxes plus excise duties (5110+5121) 112 143 189 210 199 203 223 209 222
5110 General taxes 81 101 129 138 140 139 156 144 156 5121 Excises 31 42 60 72 58 64 66 66 66
(4) Taxes on production sale transfer (5100) 118 150 192 215 204 208 228 220 235
(5) Taxes on Goods and Services (5000) 126 161 206 231 221 226 245 238 255
Implicit average indirect tax rate on consumption out of benefit income:
(6) using general consumption taxes plus excise duties (3)/(2) 14.5% 15.4% 16.9% 15.4% 13.1% 13.1% 14.1% 13.0% 13.7%
(7) using a broad concept of the indirect tax base (5)/(2) 16.3% 17.4% 18.4% 16.9% 14.5% 14.6% 15.5% 14.8% 15.7%
(8) using a broad concept of the indirect tax base and ignoring government consumpion (5)/(1) 19.5% 20.9% 21.7% 19.9% 17.3% 17.4% 18.3% 17.3% 18.4%
C. Tax breaks for social purposes (in millions of euro)
2001 2003 2005 2007 2009 2010 2011 2012 2013
Tax breaks similar to cash benefits 110 211 0 - - - - - -
Family:
Child tax allowance* 101 200 - - - - - - -* Child tax allowance and tax allowances for disabled people were deductible from tax base.
Cancelled in 2004.For info only as already included in SOCX: Child tax credit (non wastable) - - x 252 258 255 258 261 262
of which cash part:
Other areas:
Tax allowance for partially disabled people* 2 4 - - - - - - -Tax allowance for disabled people* 6 6 - - - - - - -
Table Annex
Detailed information on the impact of the tax system on social expenditure (cont.)
Source: OECD on-line National Accounts database (http://stats.oecd.org/Index.aspx?DataSetCode=SNA_TABLE1) for lines 1 and 2; and OECD Revenue Statistics database
OECD Social Expenditure database (www.oecd.org/social/expenditure.htm) // Base de données des dépenses sociales de l'OCDE (www.oecd.org/fr/social/depenses.htm) - Version 17-10-2016

SLOVAK REPUBLIC
Table Annex
Detailed information on the impact of the tax system on social expenditure (cont.)
2001 2003 2005 2007 2009 2010 2011 2012 2013
Tax breaks to stimulate private social protection (not including pensions) 23 54 31 42 55 44 42 45 47
Assignments to non-profit sector for selected purposes*: - assignments given by individuals - 3 10 13 18 16 17 19 21 - assignments given by legal entities - social and health purposes - - 21 29 37 29 25 26 26
* Each taxpayer can assign 2% from his tax liability (1% in 2003), limits for assignments: taxpayer -
individual - minimum EUR 3.32, taxpayer - legal entity - minimum EUR 8.30 As of 2011 legal entities can assign 1.5 % of their tax liability to non-profit organisations. They can
increase the assignment to 2% provided they donated another 0.5% of their tax liability (donations
are not tax deductible).As from 2014, individual can assign 3% of his tax liability, if he did volunteer work at least 40 hours
per year, otherwise can assign only 2%. Minimim value to assign is 3 eur for individual and 8 eur for
legal entities.
Donations to municipatlities and legal entities for selected purposes**: - donations given by individuals 10 11 - - - - - - - - donations given by legal entities - social and health purposes 9 38 - - - - - - -
** Tax deductibility limits for donations: taxpayer - individual - minimum EUR 16.60 and the value of
donation can not exceed 10% of tax base, taxpayer - legal entity - minimum EUR 66.40 and the value
of donation can not exceed 2 % of tax base. Cancelled in 2004.Reduction of tax for employers hiring disabled people***: - taxpayers who filed tax return for personal income tax purposes 0 .. - - - - - - - - taxpayers who filed tax return for corporate income tax purposes 4 3 - - - - - - -
*** Reduction of tax (tax relief) for employers hiring disabled people: EUR 331.94 per employee or
EUR 796.65 per employee per year according to the level of disability. Cancelled in 2004.
Memorendum item
Tax breaks for pensions
31 13 76 66 65 64 64
**** In 2005 a mandatory fully funded pillar (privately managed) of the pension system has been
introduced. Part of social security contributions (9 percentage points) is accumulated in private
pension funds and these amounts are non-taxable. As of September 2012 social security contributionis
in private pension funds decreased from 9% to 4%. As all mandatory social security contributions are
non taxable there are not considered as tax breaks.
As from January 1, 2005, premiums paid to the supplementary pension insurance, payments for
special-purpose savings paid to a bank and life insurances paid to an insurance company are tax-
deductible up to the maximum limit of EUR 398.33 per year. As from January 2011 they have been
abolished. As of 2014 allowance for supplementary pension insurance has been
reintroduced. Supplementary pension contributions are tax-deductible up to the maximum limit of
EUR 180 per year. 1
***** As of 2013 voluntary contributions to the privately managed fully funded pillar up to 2% of
gross earnings net of employee social security contributions are tax-deductible. Maximum yearly limit
for this tax relief is calculated as: 2% x 60 x AW(t-2), where AW(t-2) average wage two years ago. It
is legislated that this relief will be automatically abolished as of 2017.
- Deduction of contributions to private pensions (e.g occupational pension plans, individual retirement
accounts, RRSPs, Superannuation, etc) ****
- Deduction of voluntary contributions to the privately managed fully funded pillar *****
Source : Data provided by Ministry of Labour, Social Affairs and Family of the Slovak Republic - aggregate data from filed tax returns (personal income tax and corporate income tax) in 2001, 2003 and by Ministry
of Finance of the Slovak Republic in 2005, 2007, 2009, 2010 and 2011.
OECD Social Expenditure database (www.oecd.org/social/expenditure.htm) // Base de données des dépenses sociales de l'OCDE (www.oecd.org/fr/social/depenses.htm) - Version 17-10-2016

SLOVENIA
A. Amount of tax (including soc. sec. cont.) paid (in million national currency)
2001 2003 2005 2007 2009 2010 2011 2012 2013
Total tax paid (including soc. sec. cont.) over transfer income on
Pensions from compulsory disability and pension insurance 16 14 12
Compenstions from compulsory disability and pension insurance 5 5 5
Compenstions and other income from compulsory social insurance 169 162 144
Recognition allowances 0 0 0
Total 190 180 161
Source: Statistical Office of the Republic of Slovenia (SURS); Income tax database
B. Average implicit indirect tax rates of consumption out of benefit income
Indirect taxes paid out of consumption of cash transfers, in millions of euros
2001 2003 2005 2007 2009 2010 2011 2012 2013
(1) Private final consumption expenditure 19,779 20,316 20,668 20,423 19,741
(2) Private consumption plus Government consumption minus Government wages 22,634 23,109 23,535 23,172 22,524
(3) General consumption taxes plus excise duties (5110+5121) 4,364 4,482 4,543 4,526 4,627
5110 General taxes 2,862 2,927 2,995 2,889 3,048 5121 Excises 1,502 1,555 1,548 1,637 1,579
(4) Taxes on production sale transfer (5100) 4,597 4,779 4,850 4,853 4,990
(5) Taxes on Goods and Services (5000) 4,804 4,994 5,070 5,099 5,331
Implicit average indirect tax rate on consumption out of benefit income:
(6) using general consumption taxes plus excise duties (3)/(2) 19.3% 19.4% 19.3% 19.5% 20.5%
(7) using a broad concept of the indirect tax base (5)/(2) 21.2% 21.6% 21.5% 22.0% 23.7%
(8) using a broad concept of the indirect tax base and ignoring government consumpion (5)/(1) 24.3% 24.6% 24.5% 25.0% 27.0%
C. Tax breaks for social purposes (in millions of euros)
2001 2003 2005 2007 2009 2010 2011 2012 2013
Tax breaks similar to cash benefits 21 19 19 20 3
Family:
Tax allowance according to Motor Vehicle Tax
0 1 1 1 1
Allowances from the tax base (social insurance contributions are deductible from the tax base)
283 283 284 301 289
Other areas:
18 16 16 18 02 2 2 1 10 0 0 0 1
Disabled person’s allowance
Table Annex
Detailed information on the impact of the tax system on social expenditure (cont.)
Source: OECD on-line National Accounts database (http://stats.oecd.org/Index.aspx?DataSetCode=SNA_TABLE1) for lines 1 and 2; and OECD Revenue Statistics database
(http://stats.oecd.org/Index.aspx?DataSetCode=REV) for lines 3, 4, and 5.
The use of road motor vehicles for families with three or more children may be exempted from payment
of Motor Vehicles Tax.
Family:
For information only as already reported in SOCX: Family allowances8
Seniority allowance for the resident older than 65 years of age 12
Tax allowance for disabled employees9
OECD Social Expenditure database (www.oecd.org/social/expenditure.htm) // Base de données des dépenses sociales de l'OCDE (www.oecd.org/fr/social/depenses.htm) - Version 17-10-2016

SLOVENIA
Table Annex
Detailed information on the impact of the tax system on social expenditure (cont.)
For information only: these items are not included in the sum of TBSPs as that constitute a double
counting with the calculations on Average Direct Tax Rates over benefit income
Tax exemptions according to PIT 2009 2010 2011 2012 2013
33 49 64 59 56135 140 142 130 11385 40 39 48 4317 18 18 17 14
Tax breaks to stimulate private social protection (not including pensions) 46 44 44 35 31
Tax allowance according to Corporate Income Tax
16 15 17 12 1221 20 20 16 13
9 8 8 7 6
Memorandum Items
Tax breaks for pensions 115 109 116 111 96
Tax breaks to pensions 2
115 109 116 111 96
Source: Ministry of Finance, Slovenia
1) Examples are in Italics .
7) Data are not available
8) Family allowances: granted to residents who are supporting their family members (for the dependent child, for a dependent child who requires special care; for any other dependent family member)
9) A taxpayer that employs disabled persons under the Act regulating the vocational rehabilitation and employment of disabled persons may claim a reduction in the taxable base in the amount of 50% of the salaries of such persons, but not exceeding the
amount of the taxable base, whilst a taxpayer that employs disabled persons with 100% physical disability or deaf persons may claim a reduction in the taxable base in the amount of 70% of the salaries of such persons, but not exceeding the amount of the
taxable base. A taxpayer that employs disabled persons above the prescribed quota, their disability not being the consequence of a workplace injury or occupational disease at the same employer, may claim a reduction in the taxable base in the amount of
70% of the salaries of such persons, but not exceeding the amount of the taxable base.
10) Relief for voluntary supplementary pension insurance up to 24% of the compulsory contributions for pension and disability insurance for an insured employee, but no more than EUR 2,604.54 for 2009, EUR 2,646.46 for 2010, EUR 2,683.26 for the year
2011, EUR 2,755.71 for the year 2012 and EUR 2,819.09 for the year 2013 annually per employee, may apply under certain conditions.
2) Taxpayers receiving pensions (and some other benefits) paid by Pension and disability insurance fund of the Republic of Slovenia are offered a tax credit worth 13.5% of pension received.
2) In order to avoid double counting it is essential, that age allowances or other relevant fiscal measures that were accounted for in the calculation of the Average Itemised Tax Rates are not included here again.
3) National tax systems can benefit married couples and their children by including spouses (and/or partners) and children in the tax unit. As support for children is considered a social purpose, fiscal support to children because their inclusion in the tax unit
is considered a TBSP. However, (fiscal) benefits to married persons are not deemed to be part of the social domain (the presence of dependent children leads to eligibility to cash benefits in social protection systems, whereas a marriage contract does not).
National authorities are asked to indicate the value of revenue foregone of including children in the tax unit.
4) Family benefits and parental compensations includes: child allowances, special supplement for child care, special supplement for the big family, aid for equipment of newborn,payments for maternity leave, fathers' compensation, compensation for child
nursing, adoptive parents' compensation.
5) Social security transfers includes: social allowance, special supplement for the care of disabled persons, health insurance contributions for disadvantaged persons, health insurance contributions for disabled persons, special supplement for soldier's
families, other social care and security allowances.
6) Transfers made to War disabled, war veterans and war victims includes: allowances for war invalids, allowances for war veterans, allowances for war victims, special benefits for war veterans and invalids, allowances for health care of war invalids and
spas.
Subsidies pertaining to young families as an incentive for them to find their first home7
Assistance and receipts provided by the state and self-governing local communities to those socially at Assistance received by socially or otherwise at-risk persons from humanitarian organisations.
7
Assistance received by persons in need of assistance from charitable institutions.7
Compulsory social security contributions paid by Slovenia or a self-governing local community.7
Tax allowance for disabled employees 9
Relief for voluntary supplementary pension insurance10
Transfers to the unemployedFamily benefits and parental compensations
4
Social security transfers5
Transfers made to War disabled, war veterans and war victims6
Additional voluntary pension insurance premiums11
OECD Social Expenditure database (www.oecd.org/social/expenditure.htm) // Base de données des dépenses sociales de l'OCDE (www.oecd.org/fr/social/depenses.htm) - Version 17-10-2016

SLOVENIA
Table Annex
Detailed information on the impact of the tax system on social expenditure (cont.)
12) The seniority allowance for the resident older than 65 years of age was abolished from 1 st of January 2013
11) Special allowance for voluntary additional pension insurance payments: deduction for premiums paid by a resident to the provider of a pension plan based in Slovenia or in an EU Member State according to a pension plan that is approved and entered
into a special register but limited to a sum equal to 24 % of the compulsory contribution for compulsory pension and disability insurance for the taxpayer, or 5,844 % of the taxpayer’s pension, and no more than EUR 2,604.54 for 2009, EUR 2,646.46 for
2010, EUR 2,683.26 for the year 2011, EUR 2,755.71 for the year 2012 and EUR 2,819.09 for the year 2013.
OECD Social Expenditure database (www.oecd.org/social/expenditure.htm) // Base de données des dépenses sociales de l'OCDE (www.oecd.org/fr/social/depenses.htm) - Version 17-10-2016

SPAIN
A. Amount of direct tax paid on benefit income (in millions of euros)
2001 2003 2005 2007 2009 2010 2011 2012 2013
Total tax paid (including social security contribution) on public transfer income 7,127 7,805 9,088 11,785 6,121 7,601 8,466 8,763 9,686 of which: - Income tax * 6,424 7,433 8,808 10,666 4,253 5,977 6,905 7,293 8,090 - Social security contributions ** 703 372 280 1,119 1,868 1,624 1,561 1,470 1,597
Total tax paid (including social security contribution) on private transfer income 1,321 1,646 1,739 2,115 735 864 825 848 765 of which:
- Income tax 1,321 1,646 1,739 2,115 735 864 825 848 765
Total tax paid (including social security contribution) on transfer income 8,448 9,451 10,827 13,900 6,855 8,465 9,291 9,610 10,452
** SSC paid by unemployed workers perceiving unemployment + Temporary Disability +Maternity Benefits.
Sources: Ministry of Finance and Ministry of Employment and Social Security, Spain.
B. Average implicit indirect tax rates of consumption out of benefit incomeIndirect taxes paid out of consumption of cash transfers, in millions of euros
2001 2003 2005 2007 2009 2010 2011 2012 2013
(1) Private final consumption expenditure 414,178 463,042 536,684 615,840 605,346 618,755 618,865 611,379 598,408
(2) Private consumption plus Government consumption minus Government wages 461,068 518,948 607,055 699,437 700,810 715,586 715,937 702,690 686,070
(3) General consumption taxes plus excise duties (5110+5121) 56,463 65,230 79,052 86,058 62,598 79,530 76,965 77,469 84,614
5110 General taxes 39,754 46,077 58,121 63,166 40,603 57,019 55,279 56,259 61,013 5121 Excises 16,708 19,153 20,931 22,892 21,995 22,511 21,686 21,210 23,601
(4) Taxes on production sale transfer (5100) 61,258 70,524 85,260 92,784 67,544 84,326 81,368 84,093 90,457
(5) Taxes on Goods and Services (5000) 66,732 76,056 91,717 99,792 73,697 91,007 87,775 90,284 96,392
Implicit average indirect tax rate on consumption out of benefit income:
(6) using general consumption taxes plus excise duties (3)/(2) 12.2% 12.6% 13.0% 12.3% 8.9% 11.1% 10.8% 11.0% 12.3%
(7) using a broad concept of the indirect tax base (5)/(2) 14.5% 14.7% 15.1% 14.3% 10.5% 12.7% 12.3% 12.8% 14.0%
(8) using a broad concept of the indirect tax base and ignoring government consumpion (5)/(1) 16.1% 16.4% 17.1% 16.2% 12.2% 14.7% 14.2% 14.8% 16.1%
C. Tax breaks for social purposes (in millions of euros)
Table Annex
Detailed information on the impact of the tax system on social expenditure (cont.)
* Estimates based on PIT statistics. Data are based on income class data based on data-set of individual taxpayers + witholding tax payments of taxpayers non subject to submit a PIT return. The estimation method is based on calculations made on
personal income tax payments multiplied by fractions of net taxable income sources (as percentage of the total tax base) at the level of income classes/tax brackets.
Source: OECD on-line National Accounts database (http://stats.oecd.org/Index.aspx?DataSetCode=SNA_TABLE1) for lines 1 and 2; and OECD Revenue Statistics database
(http://stats.oecd.org/Index.aspx?DataSetCode=REV) for lines 3, 4, and 5.
OECD Social Expenditure database (www.oecd.org/social/expenditure.htm) // Base de données des dépenses sociales de l'OCDE (www.oecd.org/fr/social/depenses.htm) - Version 17-10-2016

SPAIN
Table Annex
Detailed information on the impact of the tax system on social expenditure (cont.)
2001 2003 2005 2007 2009 2010 2011 2012 2013
Tax breaks similar to cash benefits - 644 893 2,728 2,848 1,689 1,667 1,694 1,683
Family:Child Care Benefit exemption - 61 154 198 253 204 210 271 292 Child Tax Credit - 583 739 2,046 2,086 913 877 841 829 Personal Allowance for one-parent families - - - 240 232 250 249 250 247
Other areas:Disability of active workers - - - 245 278 321 331 332 316
For informaton only: these items are not included in the sum of TBSPs as that constitute a double counting
with the calculations on Average Direct Tax Rates over benefit income:PIT exemption of Invalidity, Terrorism and HIV Pensions (Revenue foregone) 238 289 329 419 460 356 389 488 520 Unemployment Lump-Sum Payment & Cease Job Compensation (Revenue foregone) - 132 161 174 336 233 277 316 300 Labour extension & Labour mobility (Revenue foregone) - - 33 52 71 78 80 81 99
Tax breaks to stimulate private social protection (not including pensions) - 2,185 2,806 3,237 2,776 2,803 2,450 2,234 1,535
Reduction of SSC for employers hiring disadvantaged groups (long-term unemployed, disabled,...) - 2,185 2,806 3,237 2,776 2,803 2,450 2,234 1,535
Memorandum item
Tax breaks for pensions 1,208 1,862 2,408 2,420 2,148 2,123 2,058 2,227 2,139
Sources: Ministry of Finance and Ministry of Employment and Social Security, Spain.
OECD Social Expenditure database (www.oecd.org/social/expenditure.htm) // Base de données des dépenses sociales de l'OCDE (www.oecd.org/fr/social/depenses.htm) - Version 17-10-2016

SWEDEN
A. Average Itemised Tax Rates (AITR %)
2001 2003 2005 2007 2009 2010 2011 2012 2013
1. Old-age cash benefits
a - public pensions 25.0 28.6 28.8 28.1 27.0 26.0 23.3 23.4 23.4
b - early retirement pensions 29.0 28.6 28.8 28.1 27.0 26.0 23.3 23.4 23.4
c - private pensions 32.1 28.6 28.8 28.1 27.0 26.0 23.3 23.4 23.4
2. Survivors benefits
a - public pensions 22.3 28.3 28.5 27.1 25.9 24.1 21.1 21.1 20.8
b - private pensions
3. Incapacity-related benefits
a - disability pensions 24.8 27.7 28.1 26.7 25.1 25.7 23.2 22.9 22.8
b - occupational injury benefits 32.4 30.8 30.6 27.5 25.5 24.9 25.0 24.8 24.3
c - sickness payments 34.1 30.8 30.6 27.5 25.5 24.9 25.0 24.8 24.3
4. Family cash benefits
a - family benefits
b - maternity and parental leave payments 33.8 30.8 30.6 27.5 25.5 24.9 25.0 24.8 24.3
c - sole parent benefits
5. Active labor market policies
a - benefits while in training 29.6 0.0 0.0 0.0 0.0 0.0 0.0 0.0 0.0
6. Unemployment
a - unemployment insurance benefit 29.8 28.7 28.0 25.1 17.8 23.5 22.9 23.3 23.2
B. Average implicit indirect tax rates of consumption out of benefit income
Indirect taxes paid out of consumption of cash transfers, in millions of Swedish kronor
2001 2003 2005 2007 2009 2010 2011 2012 2013
(1) Private final consumption expenditure 1,147,283 1,241,623 1,336,449 1,462,213 1,550,387 1,634,640 1,692,895 1,715,028 1,759,307
(2) Private consumption plus Government consumption minus Government wages 1,448,857 1,579,686 1,687,992 1,850,871 1,990,073 2,091,408 2,171,767 2,209,353 2,275,589
(3) General consumption taxes plus excise duties (5110+5121) 281,948 307,892 333,062 371,028 392,268 418,286 424,423 423,115 430,437
5110 General taxes 208,410 227,391 250,470 286,211 303,095 326,685 334,708 333,342 341,952
5121 Excises 73,538 80,501 82,592 84,818 89,173 91,601 89,715 89,772 88,485
(4) Taxes on production sale transfer (5100) 291,253 316,684 342,350 380,990 402,042 429,802 436,635 437,900 445,453e e e e e
(5) Taxes on Goods and Services (5000) 298,916 325,011 353,370 394,073 418,419 446,202 452,359 453,503 461,955
Implicit average indirect tax rate on consumption out of benefit income:
(6) using general consumption taxes plus excise duties (3)/(2) 19.5% 19.5% 19.7% 20.0% 19.7% 20.0% 19.5% 19.2% 18.9%
(7) using a broad concept of the indirect tax base (5)/(2) 20.6% 20.6% 20.9% 21.3% 21.0% 21.3% 20.8% 20.5% 20.3%
(8) using a broad concept of the indirect tax base and ignoring government consumpion (5)/(1) 26.1% 26.2% 26.4% 27.0% 27.0% 27.3% 26.7% 26.4% 26.3%
Table Annex
Detailed information on the impact of the tax system on social expenditure (cont.)
Source : Statistics Sweden - Social Protection Expenditure and Receipts in Sweden and Europe.
OECD Social Expenditure database (www.oecd.org/social/expenditure.htm) // Base de données des dépenses sociales de l'OCDE (www.oecd.org/fr/social/depenses.htm) - Version 17-10-2016
SWEDEN
Table Annex
Detailed information on the impact of the tax system on social expenditure (cont.)
C. Tax breaks for social purposes (in millions of Swedish kronor)
2001 2003 2005 2007 2009 2010 2011 2012 2013
Tax breaks similar to cash benefits
Family:
Other areas:
Tax breaks to stimulate private social protection (not including pensions)
Memorandum Items
Tax breaks for pension
- Deduction of contributions to private pensions
Information on TBSPs that were not accounted in the direct tax calculations is not available.
OECD Social Expenditure database (www.oecd.org/social/expenditure.htm) // Base de données des dépenses sociales de l'OCDE (www.oecd.org/fr/social/depenses.htm) - Version 17-10-2016

SWITZERLAND
A. Amount of direct tax paid on benefit income (in millions of euros)
2001 2003 2005 2007 2009 2010 2011 2012 2013
Total tax paid (including soc. sec. cont.) on transfer income .. .. .. .. .. .. .. .. ..
Social Security Pension
Social Security Disability Benefit
Social security Unemployment Benefit
.. Not available. Forthcoming.
B. Average implicit indirect tax rates of consumption out of benefit income
Indirect taxes paid out of consumption of cash transfers, in millions of euros)
2001 2003 2005 2007 2009 2010 2011 2012 2013
(1) Private final consumption expenditure 310,687 323,786 330,592 333,417 338,882 344,505
(2) Private consumption plus Government consumption minus Government wages 330,384 344,347 350,654 354,105 360,693 366,620
(3) General consumption taxes plus excise duties (5110+5121) 26,711 27,522 28,741 29,437 29,986 30,359
5110 General taxes 19,472 19,656 20,505 21,449 21,799 22,336
5121 Excises 7,239 7,866 8,236 7,988 8,187 8,023
(4) Taxes on production sale transfer (5100) 29,146 30,731 31,949 32,433 33,913 33,325
(5) Taxes on Goods and Services (5000) 33,363 34,744 36,422 36,968 38,529 37,943
Implicit average indirect tax rate on consumption out of benefit income:
(6) using general consumption taxes plus excise duties (3)/(2) 8.1% 8.0% 8.2% 8.3% 8.3% 8.3%
(7) using a broad concept of the indirect tax base (5)/(2) 10.1% 10.1% 10.4% 10.4% 10.7% 10.3%
(8) using a broad concept of the indirect tax base and ignoring government consumpion (5)/(1) 10.7% 10.7% 11.0% 11.1% 11.4% 11.0%
Table Annex I.A.2.1
Detailed information on the impact of the tax system on social expenditure (cont.)
Source: OECD on-line National Accounts database (http://stats.oecd.org/Index.aspx?DataSetCode=SNA_TABLE1) for lines 1 and 2; and OECD Revenue Statistics database
(http://stats.oecd.org/Index.aspx?DataSetCode=REV) for lines 3, 4, and 5.
OECD Social Expenditure database (www.oecd.org/social/expenditure.htm) // Base de données des dépenses sociales de l'OCDE (www.oecd.org/fr/social/depenses.htm) - Version 17-10-2016

SWITZERLAND
Table Annex I.A.2.1
Detailed information on the impact of the tax system on social expenditure (cont.)
C. Tax breaks for social purposes (in millions of euros)
2001 2003 2005 2007 2009 2010 2011 2012 2013
Tax breaks similar to cash benefits 0 0 0 2,740 2,200 2,280 2,240 3,060 2,990
Family:
Item 1 Child deduction 665 530 550 540 570 540
item 2 Deduction for supporting care-needing relatives 20 20 20 20 20 20
Item 3 Child deduction (estimation of the cantonal part) - subsumed under Item 7
Item 4 Deduction for Insurance premiums (child) 55 60
Item 5 External child care 65 70
Item 6 Parental tax rate schedule (wasteable tax credit)* 220 230
Item 7 All items (cantonal and communal part) 2,055 1,650 1,710 1,680 2,130 2,070
Tax breaks to stimulate private social protection (not including pensions) 0 0 0 224 260 255 270 270 270
Item 1 Deduction of contributions for unemployment & mandatory accident insurance n.a. n.a. n.a n.a. n.a. n.a.
item 2 Deduction for health care and accident expenses 68 80 80 85 85 85
Item 3 Deduction for donations to NGOs 156 180 175 185 185 185
Memorendum item
Tax breaks to pensions 0 0 0 7,053 6,670 7,410 7,365 7,605 7,945
item 1 Deduction of contributions to occupational pension plans (second pillar) 4,030 3,665 4,320 4,400 4,520 5,020
item 2 Non taxation of interest revenues from occupational pension plans 1,455 1,450 1,470 1,380 1,440 1,340
item 3 Deduction of contributions to certain private pension plans (third pillar) 731 830 810 810 840 810
item 4 Non taxation of interest revenues from private pension plans n.a. 125 125 125 125 125
item 5 Deduction of contributions to life insurance, health insurance and accident insurance and interest on savings 837 600 685 650 680 650
Source : Federal Department of Finance FDF, Federal Tax Administration FTA
OECD Social Expenditure database (www.oecd.org/social/expenditure.htm) // Base de données des dépenses sociales de l'OCDE (www.oecd.org/fr/social/depenses.htm) - Version 17-10-2016

TURKEY
A. Amount of direct tax paid on benefit income (in millions of of New Turkish liras (TRY) )
B. Average implicit indirect tax rates of consumption out of benefit income
Indirect taxes paid out of consumption of cash transfers, in millions of pesos)
2005 2007 2009 2010 2011 2012 2013
(1) Private final consumption expenditure 465,402 601,239 680,768 787,753 923,836 994,396 1,109,722
(2) Private consumption plus Government consumption minus Government wages 541,900 650,463 737,546 849,319 993,929 1,204,705 1,346,311
(3) General consumption taxes plus excise duties (5110+5121) 67,685 82,396 90,607 119,818 142,831 153,278 186,184
5110 General taxes 34,357 43,285 46,987 62,533 78,642 81,572 100,723 5121 Excises 33,328 39,111 43,620 57,285 64,189 71,706 85,462
(4) Taxes on production sale transfer (5100) 74,561 92,605 102,384 131,878 156,944 169,226 203,364
(5) Taxes on Goods and Services (5000) 77,605 96,766 107,128 137,252 163,347 176,305 211,257
Implicit average indirect tax rate on consumption out of benefit income:
(6) using general consumption taxes plus excise duties (3)/(2) 12.5% 12.7% 12.3% 14.1% 14.4% 12.7% 13.8%
(7) using a broad concept of the indirect tax base (5)/(2) 0.0% 14.9% 14.5% 16.2% 16.4% 14.6% 15.7%
(8) using a broad concept of the indirect tax base and ignoring government consumpion (5)/(1) 0.0% 16.1% 15.7% 17.4% 17.7% 17.7% 19.0%
C. Tax breaks for social purposes (in millions of pesos)
2005 2007 2009 2010 2011 2012 2013
Tax breaks Similar to cash benefits 0 0 0 0 0 0 0
Family:Other areas:
Tax breaks to stimulate private social protection (not including pensions) 0 0 0 0 0 0 0
Memorendum item
Tax breaks to pensions
Source: Ministry of Finance.
Social benefits are not subject to taxation (according to the Article 25 of the Law Number 193 (which is PIT Law).
Source: OECD on-line National Accounts database (http://stats.oecd.org/Index.aspx?DataSetCode=SNA_TABLE1) for lines 1 and 2; and OECD Revenue Statistics database
(http://stats.oecd.org/Index.aspx?DataSetCode=REV) for lines 3, 4, and 5.
Table Annex
Detailed information on the impact of the tax system on social expenditure (cont.)
OECD Social Expenditure database (www.oecd.org/social/expenditure.htm) // Base de données des dépenses sociales de l'OCDE (www.oecd.org/fr/social/depenses.htm) - Version 17-10-2016
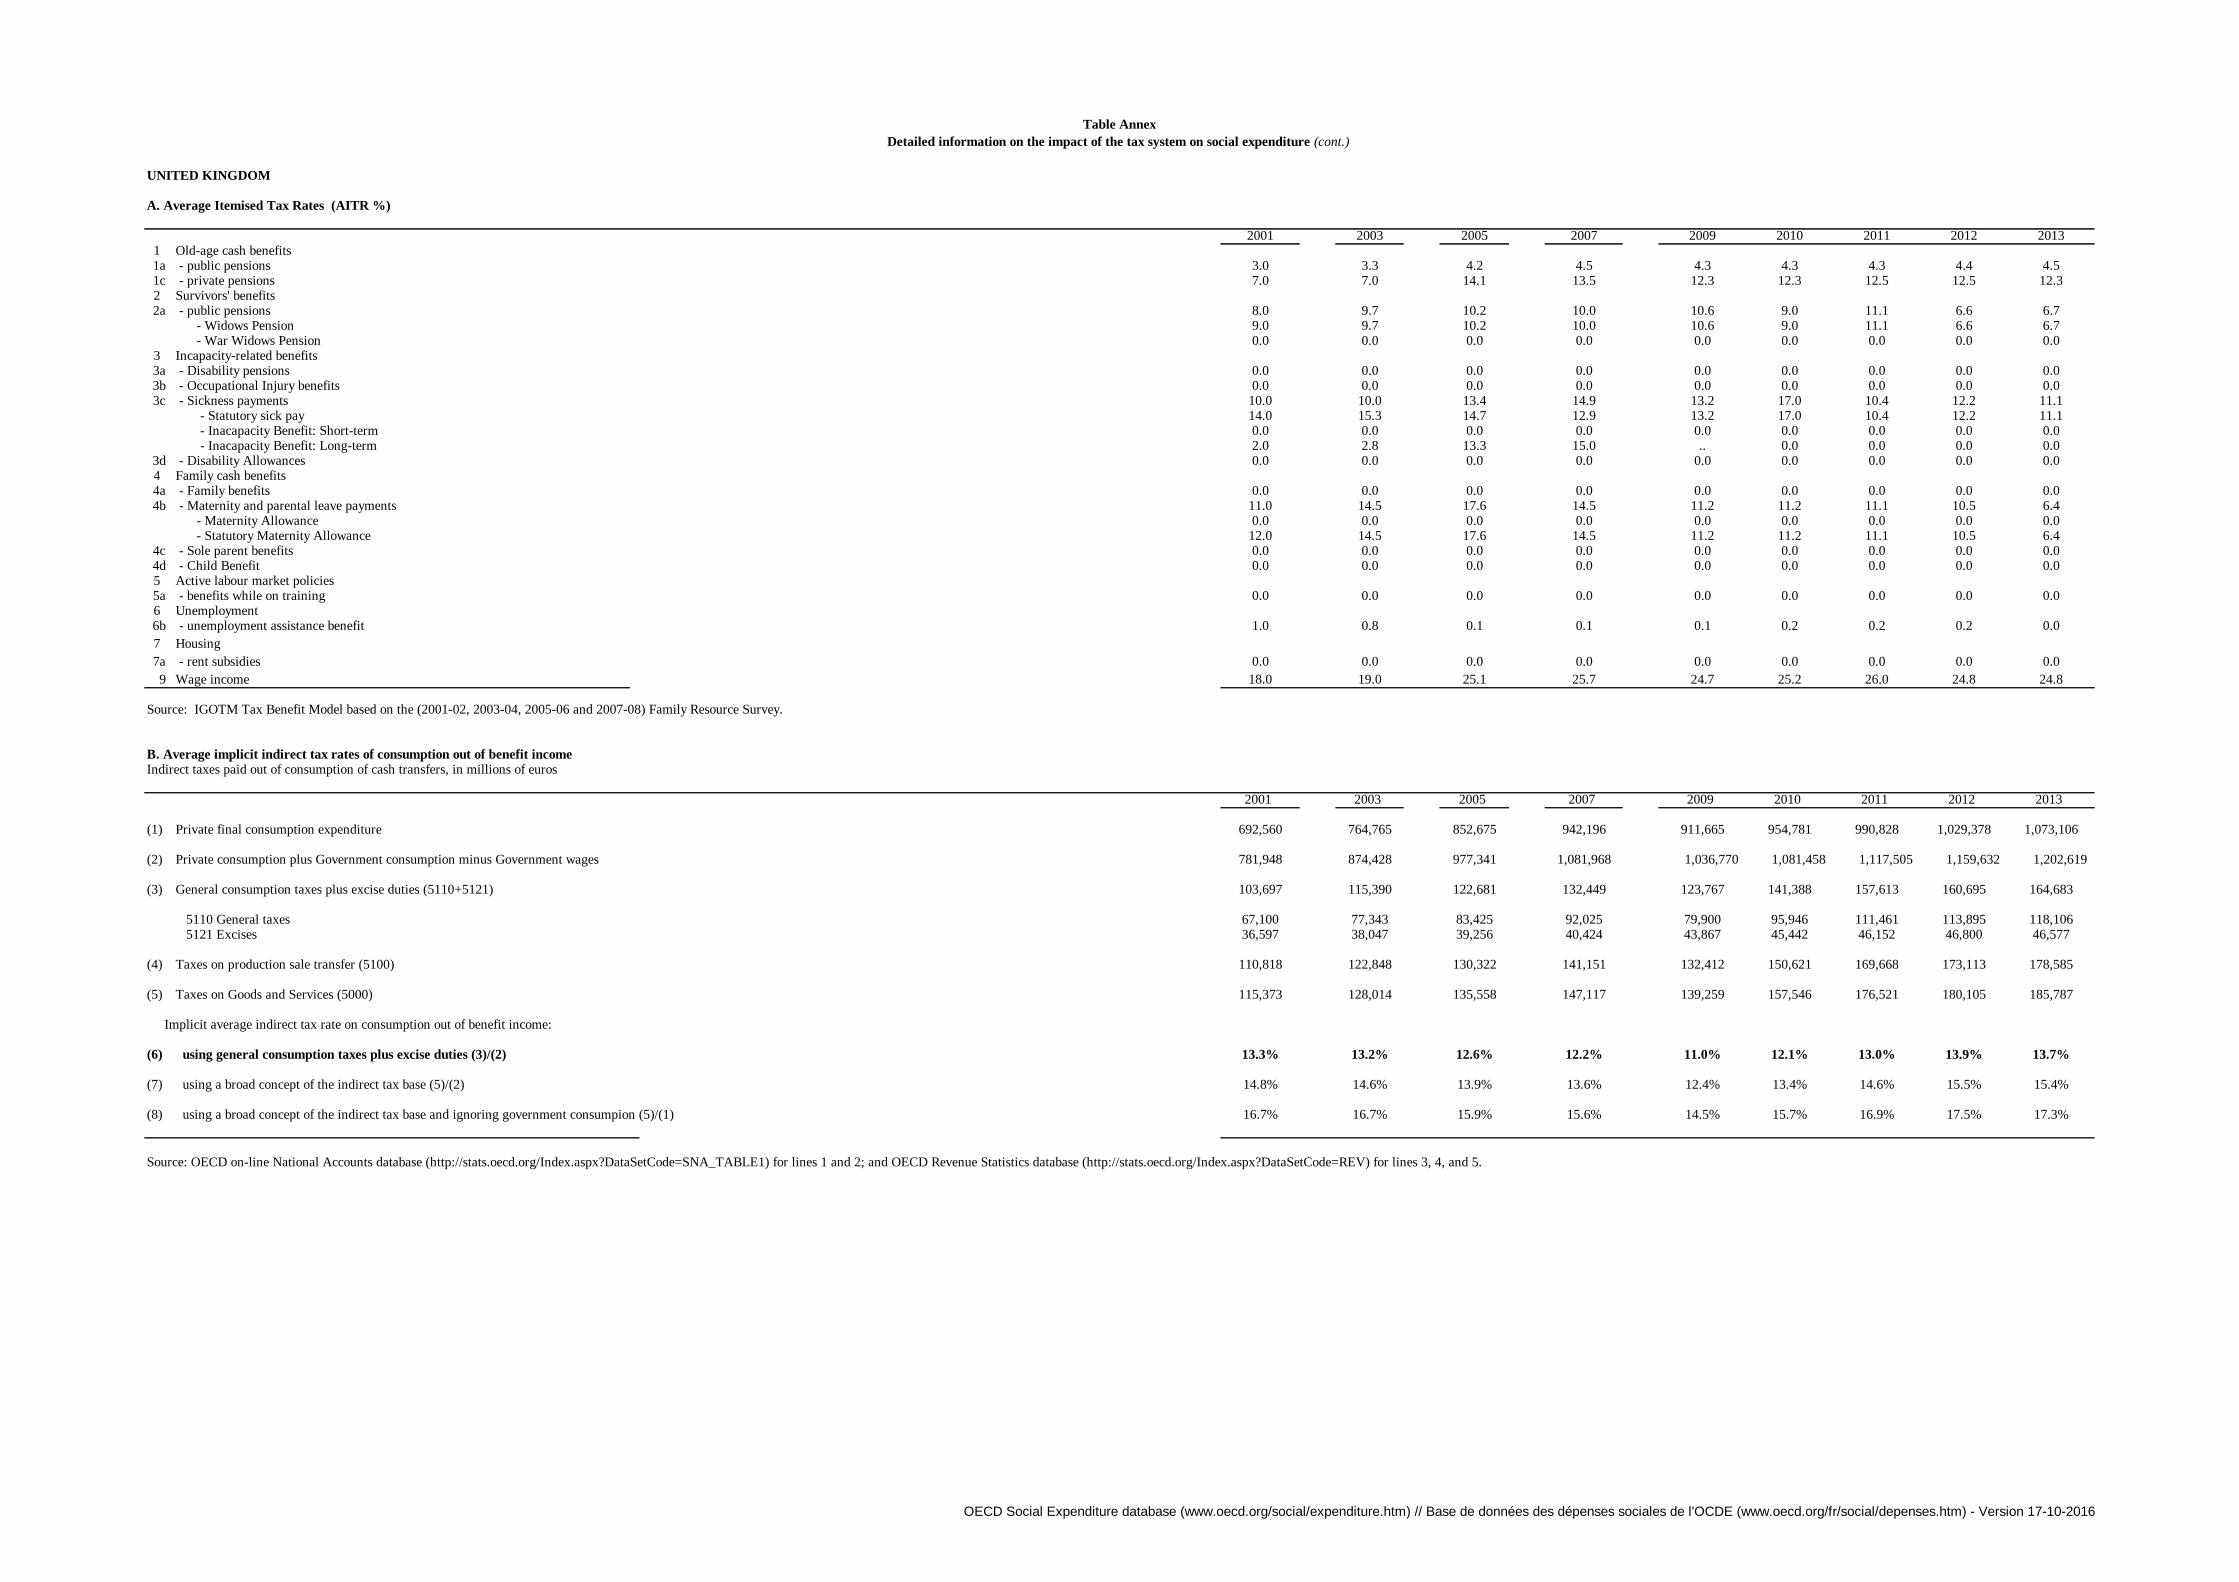
UNITED KINGDOM
A. Average Itemised Tax Rates (AITR %)
2001 2003 2005 2007 2009 2010 2011 2012 20131 Old-age cash benefits1a - public pensions 3.0 3.3 4.2 4.5 4.3 4.3 4.3 4.4 4.51c - private pensions 7.0 7.0 14.1 13.5 12.3 12.3 12.5 12.5 12.32 Survivors' benefits2a - public pensions 8.0 9.7 10.2 10.0 10.6 9.0 11.1 6.6 6.7
- Widows Pension 9.0 9.7 10.2 10.0 10.6 9.0 11.1 6.6 6.7 - War Widows Pension 0.0 0.0 0.0 0.0 0.0 0.0 0.0 0.0 0.0
3 Incapacity-related benefits3a - Disability pensions 0.0 0.0 0.0 0.0 0.0 0.0 0.0 0.0 0.03b - Occupational Injury benefits 0.0 0.0 0.0 0.0 0.0 0.0 0.0 0.0 0.03c - Sickness payments 10.0 10.0 13.4 14.9 13.2 17.0 10.4 12.2 11.1
- Statutory sick pay 14.0 15.3 14.7 12.9 13.2 17.0 10.4 12.2 11.1 - Inacapacity Benefit: Short-term 0.0 0.0 0.0 0.0 0.0 0.0 0.0 0.0 0.0 - Inacapacity Benefit: Long-term 2.0 2.8 13.3 15.0 .. 0.0 0.0 0.0 0.0
3d - Disability Allowances 0.0 0.0 0.0 0.0 0.0 0.0 0.0 0.0 0.04 Family cash benefits 4a - Family benefits 0.0 0.0 0.0 0.0 0.0 0.0 0.0 0.0 0.04b - Maternity and parental leave payments 11.0 14.5 17.6 14.5 11.2 11.2 11.1 10.5 6.4
- Maternity Allowance 0.0 0.0 0.0 0.0 0.0 0.0 0.0 0.0 0.0 - Statutory Maternity Allowance 12.0 14.5 17.6 14.5 11.2 11.2 11.1 10.5 6.4
4c - Sole parent benefits 0.0 0.0 0.0 0.0 0.0 0.0 0.0 0.0 0.04d - Child Benefit 0.0 0.0 0.0 0.0 0.0 0.0 0.0 0.0 0.05 Active labour market policies5a - benefits while on training 0.0 0.0 0.0 0.0 0.0 0.0 0.0 0.0 0.06 Unemployment6b - unemployment assistance benefit 1.0 0.8 0.1 0.1 0.1 0.2 0.2 0.2 0.0
7 Housing
7a - rent subsidies 0.0 0.0 0.0 0.0 0.0 0.0 0.0 0.0 0.0
9 Wage income 18.0 19.0 25.1 25.7 24.7 25.2 26.0 24.8 24.8
Source: IGOTM Tax Benefit Model based on the (2001-02, 2003-04, 2005-06 and 2007-08) Family Resource Survey.
B. Average implicit indirect tax rates of consumption out of benefit income
Indirect taxes paid out of consumption of cash transfers, in millions of euros
2001 2003 2005 2007 2009 2010 2011 2012 2013
(1) Private final consumption expenditure 692,560 764,765 852,675 942,196 911,665 954,781 990,828 1,029,378 1,073,106
(2) Private consumption plus Government consumption minus Government wages 781,948 874,428 977,341 1,081,968 1,036,770 1,081,458 1,117,505 1,159,632 1,202,619
(3) General consumption taxes plus excise duties (5110+5121) 103,697 115,390 122,681 132,449 123,767 141,388 157,613 160,695 164,683
5110 General taxes 67,100 77,343 83,425 92,025 79,900 95,946 111,461 113,895 118,106 5121 Excises 36,597 38,047 39,256 40,424 43,867 45,442 46,152 46,800 46,577
(4) Taxes on production sale transfer (5100) 110,818 122,848 130,322 141,151 132,412 150,621 169,668 173,113 178,585
(5) Taxes on Goods and Services (5000) 115,373 128,014 135,558 147,117 139,259 157,546 176,521 180,105 185,787
Implicit average indirect tax rate on consumption out of benefit income:
(6) using general consumption taxes plus excise duties (3)/(2) 13.3% 13.2% 12.6% 12.2% 11.0% 12.1% 13.0% 13.9% 13.7%
(7) using a broad concept of the indirect tax base (5)/(2) 14.8% 14.6% 13.9% 13.6% 12.4% 13.4% 14.6% 15.5% 15.4%
(8) using a broad concept of the indirect tax base and ignoring government consumpion (5)/(1) 16.7% 16.7% 15.9% 15.6% 14.5% 15.7% 16.9% 17.5% 17.3%
Source: OECD on-line National Accounts database (http://stats.oecd.org/Index.aspx?DataSetCode=SNA_TABLE1) for lines 1 and 2; and OECD Revenue Statistics database (http://stats.oecd.org/Index.aspx?DataSetCode=REV) for lines 3, 4, and 5.
Table Annex
Detailed information on the impact of the tax system on social expenditure (cont.)
OECD Social Expenditure database (www.oecd.org/social/expenditure.htm) // Base de données des dépenses sociales de l'OCDE (www.oecd.org/fr/social/depenses.htm) - Version 17-10-2016
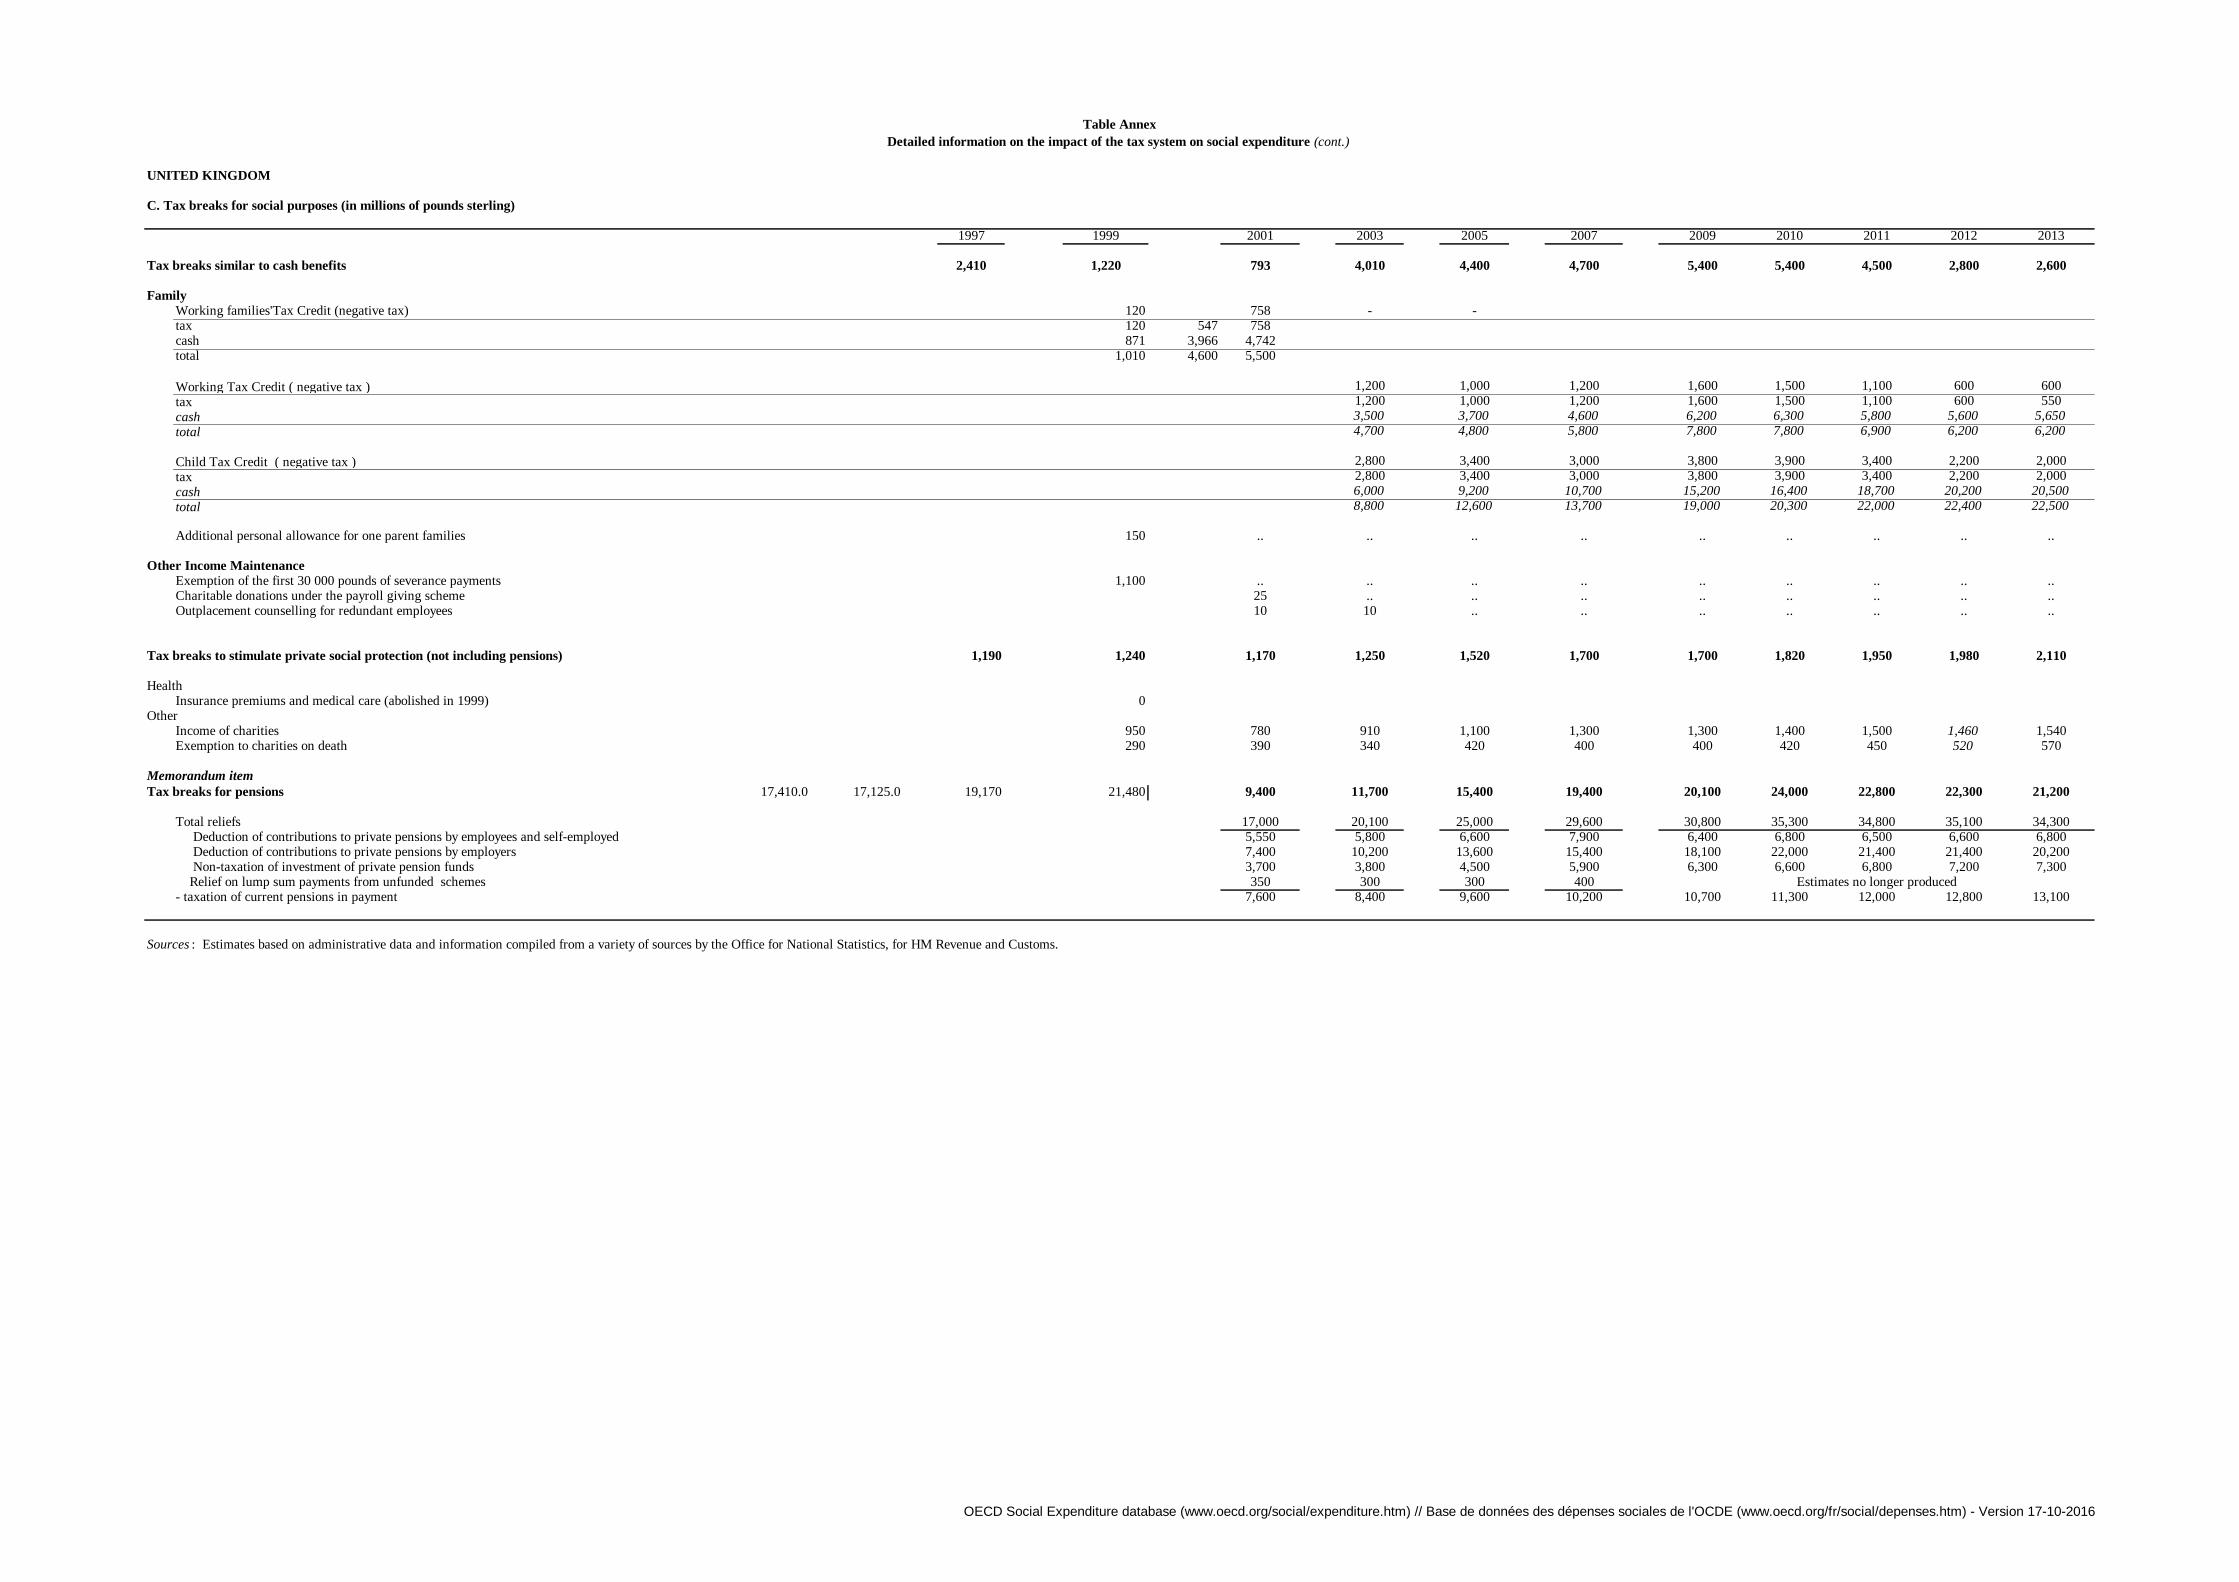
UNITED KINGDOM
Table Annex
Detailed information on the impact of the tax system on social expenditure (cont.)
C. Tax breaks for social purposes (in millions of pounds sterling)
1997 1999 2001 2003 2005 2007 2009 2010 2011 2012 2013
Tax breaks similar to cash benefits 2,410 1,220 793 4,010 4,400 4,700 5,400 5,400 4,500 2,800 2,600
Family
Working families'Tax Credit (negative tax) 120 758 #### - -tax 120 547 758 ####cash 871 3,966 4,742 ####total 1,010 4,600 5,500 6,300
Working Tax Credit ( negative tax ) 1,200 1,000 1,200 1,600 1,500 1,100 600 600
tax 1,200 1,000 1,200 1,600 1,500 1,100 600 550
cash 3,500 3,700 4,600 6,200 6,300 5,800 5,600 5,650
total 4,700 4,800 5,800 7,800 7,800 6,900 6,200 6,200
Child Tax Credit ( negative tax ) 2,800 3,400 3,000 3,800 3,900 3,400 2,200 2,000
tax 2,800 3,400 3,000 3,800 3,900 3,400 2,200 2,000
cash 6,000 9,200 10,700 15,200 16,400 18,700 20,200 20,500
total 8,800 12,600 13,700 19,000 20,300 22,000 22,400 22,500
Additional personal allowance for one parent families 150 .. .. .. .. .. .. .. .. ..
Other Income Maintenance
Exemption of the first 30 000 pounds of severance payments 1,100 .. .. .. .. .. .. .. .. ..Charitable donations under the payroll giving scheme 25 .. .. .. .. .. .. .. ..Outplacement counselling for redundant employees 10 10 .. .. .. .. .. .. ..
Tax breaks to stimulate private social protection (not including pensions) 1,190 1,240 1,170 1,250 1,520 1,700 1,700 1,820 1,950 1,980 2,110
HealthInsurance premiums and medical care (abolished in 1999) 0
Other Income of charities 950 780 910 1,100 1,300 1,300 1,400 1,500 1,460 1,540Exemption to charities on death 290 390 340 420 400 400 420 450 520 570
Memorandum item
Tax breaks for pensions 17,410.0 17,125.0 19,170 21,480 9,400 11,700 15,400 19,400 20,100 24,000 22,800 22,300 21,200
Total reliefs 17,000 20,100 25,000 29,600 30,800 35,300 34,800 35,100 34,300 Deduction of contributions to private pensions by employees and self-employed 5,550 5,800 6,600 7,900 6,400 6,800 6,500 6,600 6,800 Deduction of contributions to private pensions by employers 7,400 10,200 13,600 15,400 18,100 22,000 21,400 21,400 20,200 Non-taxation of investment of private pension funds 3,700 3,800 4,500 5,900 6,300 6,600 6,800 7,200 7,300 Relief on lump sum payments from unfunded schemes 350 300 300 400- taxation of current pensions in payment 7,600 8,400 9,600 10,200 10,700 11,300 12,000 12,800 13,100
Estimates no longer produced
Sources : Estimates based on administrative data and information compiled from a variety of sources by the Office for National Statistics, for HM Revenue and Customs.
OECD Social Expenditure database (www.oecd.org/social/expenditure.htm) // Base de données des dépenses sociales de l'OCDE (www.oecd.org/fr/social/depenses.htm) - Version 17-10-2016

UNITED STATES
A. Average Itemised Tax Rates (AITR %)
2001 2003 2005 2007 2009 2010 2011 2012 2013 2014
Social Security Benefits 4.0 3.6 3.8 4.6 3.5 4.0 4.2 4.5 4.8 5.2
Unemployment compensation 7.7 5.7 5.6 6.0 4.7 4.4 5.6 5.9 5.9 7.0
Pension and IRA distributions 14.5 11.7 12.4 12.9 11.1 11.8 12.7 13.1 13.7 14.3
Source: US Department of Treasury run i80714.
B. Average implicit indirect tax rates of consumption out of benefit income
Indirect taxes paid out of consumption of cash transfers, in millions US dollars
2001 2003 2005 2007 2009 2010 2011 2012 2013 2014
(1) Private final consumption expenditure 7,103,104 7,765,529 8,794,112 9,750,505 9,846,968 10,202,191 10,689,299 11,050,627 11,392,289 11,865,941
(2) Private consumption plus Government consumption minus Government wages 7,600,041 8,328,658 9,451,175 10,504,565 10,706,966 11,085,491 11,567,553 11,935,778 12,237,323 12,707,593
(3) General consumption taxes plus excise duties (5110+5121) 335,237 357,663 407,426 442,870 423,702 439,749 454,806 473,464 485,821 504,330
5110 General taxes 223,109 236,744 275,299 305,524 281,577 294,445 308,257 319,699 332,944 350,784
5121 Excises 112,128 120,919 132,127 137,346 142,125 145,304 146,549 153,765 152,877 153,546
(4) Taxes on production sale transfer (5100) 407,086 439,034 501,411 542,829 514,619 542,066 574,656 596,401 621,287 658,084
(5) Taxes on Goods and Services (5000) 474,289 517,374 601,486 650,209 611,223 644,385 686,647 712,191 740,296 776,655
Implicit average indirect tax rate on consumption out of benefit income:
(6) using general consumption taxes plus excise duties (3)/(2) 4.4% 4.3% 4.3% 4.2% 4.0% 4.0% 3.9% 4.0% 4.0% 4.0%
(7) using a broad concept of the indirect tax base (5)/(2) 6.2% 6.2% 6.4% 6.2% 5.7% 5.8% 5.9% 6.0% 6.0% 6.1%
(8) using a broad concept of the indirect tax base and ignoring government consumpion (5)/(1) 6.7% 6.7% 6.8% 6.7% 6.2% 6.3% 6.4% 6.4% 6.5% 6.5%
Table Annex
Detailed information on the impact of the tax system on social expenditure (cont.)
Source: OECD on-line National Accounts database (http://stats.oecd.org/Index.aspx?DataSetCode=SNA_TABLE1) for lines 1 and 2; and OECD Revenue Statistics database
(http://stats.oecd.org/Index.aspx?DataSetCode=REV) for lines 3, 4, and 5.
OECD Social Expenditure database (www.oecd.org/social/expenditure.htm) // Base de données des dépenses sociales de l'OCDE (www.oecd.org/fr/social/depenses.htm) - Version 17-10-2016

UNITED STATES
Table Annex
Detailed information on the impact of the tax system on social expenditure (cont.)
C. Tax breaks for social purposes (in millions of US dollars)
2001 2003 2005 2007 2009 2010 2011 2012 2013 2014
Tax breaks similar to cash benefits 78,658 84,304 91,916 83,830 97,363 124,243 106,380 83,552 88,400 89,175
Family:
Credit for child and dependent care expenses & exclusion for employer provided child care 3,182 3,310 3,680 3,950 5,110 4,700 5,050 4,780 5,050 5,320
Employer provided child care exclusion 1,220 840 1,360 880 890
Employer-provided child care credit 10 10 10 10 10
Credit for child and dependent care expenses 3,470 4,200 3,410 4,160 4,420
Exclusion. of certain foster care payments 500 430 440 420 440 420 410 420 380 380
Adoption assistance (adoption credit and exclusion) 130 220 360 370 530 660 1,200 62 450 260
Assistance for adopted foster children 190 250 310 350 450 460 500 530 530 530
Child credit (from 1998 onwards) 29,312 37,970 41,790 30,910 25,640 23,030 23,410 24,790 23,480 23,800
Personal allowance for dependants (largely for children) ** 35,353 30,785 33,211 37,580 40,703 40,303 40,910 42,580 43,290 44,375
Refundable amounts:
Adoption assistance (adoption credit and exclusion) 940 1,150 700 0 60
Child credit (from 1998 onwards) 24,470 22,890 22,620 21,660 22,570
Other areas:
Deductibility of medical expenses 4,990 6,240 6,110 4,470 8,760 9,090 8,280 7,230 8,010 6,810
Medical savings accounts 20 -30 1,050 760 1,930 1,790 1,880 1,520 3,110 4,010
Additional deduction for the blind 41 40 40 30 40 30 40 30 30 30
Earned income credit 4,940 5,089 4,925 4,990 4,420 4,910 1,172 1,610 4,070 3,660
Making work pay credit - - - - 9,340 38,850 23,528 0 0 0
Payroll tax holiday (reduced by 2% Jan 2011 through Dec 2012) 0 109,724 114,246 0 0
Refundable amounts:
Earned income credit 54,740 55,670 54,840 56,760 60,810
Making work pay credit 21,410 13,876 0 0 0
Tax breaks to stimulate private social protection (not including pensions) 116,470 141,320 159,610 186,490 195,592 212,420 208,665 233,310 242,000 254,670
Exclusion. of employer contributions for medical insurance premiums and medical care 82,800 101,920 118,420 133,790 144,412 160,110 163,040 184,320 185,330 195,050
Self-employed medical insurance premiums 1,520 2,550 3,790 4,260 4,870 5,680 5,170 5,210 6,140 6,380
Credit for employee health insurance expenses of small businesses 2,300 830 190 630 510
Exclusion. of interest on State and local debt for private non-profit health facilities (excl. interest
hospital construction bonds) - - - - -
Deductibility of charitable contributions (health) 270 3,390 3,350 4,310 4,150 3,850 3,370 3,820 4,470 4,740
Special Blue Cross/Blue Shield deduction 140 350 710 620 760 750 715 420 190 150
Tax credit for orphan drug research 50 160 210 260 270 470 770 840 1,040 1,210
Credit for disabled access expenditures 50 50 30 30 20 20 20 20 30 30
Deductibility of charitable contributions, other than education or health 30,150 30,020 29,670 38,200 36,710 34,080 29,820 33,770 39,260 41,910
Empowerment zones, enterprise communities, renewal communities 380 1,070 1,120 1,450 1,130 730 980 620 450 90
New markets tax credit 10 190 430 810 580 720 820 930 950 1,010
Exclusion of interest on hospital construction bonds 1,100 1,620 1,880 2,760 2,690 3,530 3,100 3,040 3,430 3,500
Refundable amounts:
Credit for employee health insurance expenses of small businesses 180 30 130 80 90
Memorandum item
Tax breaks for pension * 110,990 138,000 101,880 114,320 110,706 119,400 118,690 149,360 128,430 146,360
Net exclusion of pension contributions:
Employer plans 42,070 59,480 50,630 47,060 40,670 39,580 36,390 38,740 37,860 42,780
401(K) plans 44,080 51,560 37,440 46,000 44,126 52,240 53,360 68,820 50,670 62,530
Individual retirement accounts 18,680 20,060 3,100 9,500 12,090 12,630 12,840 21,240 19,310 16,580
Low and moderate income savers credit - 880 1,310 760 1,050 1,130 1,070 1,180 1,190 1,230
Keogh plans 6,160 6,020 9,400 11,000 12,770 13,820 15,030 19,380 19,400 23,240
Small business retirment credit
Sources: Office of Management and Budget, Analytical Perspectives, Budget of the United States Government and US Department of Treasury Table 16-1 FY 2014, Table 14-1 FY 2015 and Table 1 (pp. 22-27) in FY 2016.
** from US Department of Treasury run i80714.
* Estimates for later years reflect a change in the baseline. Lower tax rates on dividends and capital gains on corporate equity are not considered tax preferences.
OECD Social Expenditure database (www.oecd.org/social/expenditure.htm) // Base de données des dépenses sociales de l'OCDE (www.oecd.org/fr/social/depenses.htm) - Version 17-10-2016