Embed Size (px)
Citation preview


7 - 25
Table 7.4 Summary of Remedial Measures
Location Proposed remedial measure
1. Tailing dam Cap the dam to prevent groundwater infiltration Divert rainfall on dam to an area downstream of Trench -2
2. Trench -1 and -2 Continue pumping from these trenches, and Divert water to an evaporation pond
3. Upstream of constriction at KM14
Install a cut-off trench, and Install a drain to remove contaminated water, and Treat and/or dispose of water
ground surface. Therefore, this drain will force to groundwater table to be always at Elevation +224m. For Trench -2, we assumed that the drain is located at Elevation +202.5 m, which is about 7 m above the bottom of the aquifer. This drain will also force the groundwater level at Trench -2 to be at or below Elevation +202.5 m. In this manner, the program calculates the amount of flow out of these two trenches with time without the need to specify a pumping rate at these two locations. For Trench -2, we assumed that the grouting that was performed during installation of this trench was able to reduce the permeability of the aquifer downstream of the Trench by 80 %. The trench will therefore reduce the amount of flow but not completely eliminate it. (2) Modeling of Trench at KM 14 The new proposed trench at KM 14 was also modeled as a “drain” located at the bottom of the aquifer just north of KM 14. In addition, we assumed that the cut-off trench would reduce the permeability of the aquifer downstream of this trench to a very small value (i.e., very effective cutoff). (3) Recharge at Tailing Dam After the capping of the tailing dam, and the diversion of pumped water from trenches -1 and -2 to an evaporation pond, the recharge from the tailing dam into the alluvial aquifer of Wadi Suq will be reduced. However, nominal amount of rainfall infiltration will still seep through the tailings. In addition, a limited amount of contaminated water will still be released from the tailings, most likely as a result of consolidation under self-weight. This amount of recharge was estimated at about 12,000 m3/y, which is equivalent to a uniform water height of 2.0 cm over the entire tailing dam area (estimated at 600,000 square meters). This recharge was assumed to have a chloride concentration of 30,000 mg/L (about equal to the maximum concentration of chloride in water samples obtained from the tailings).
7 - 26
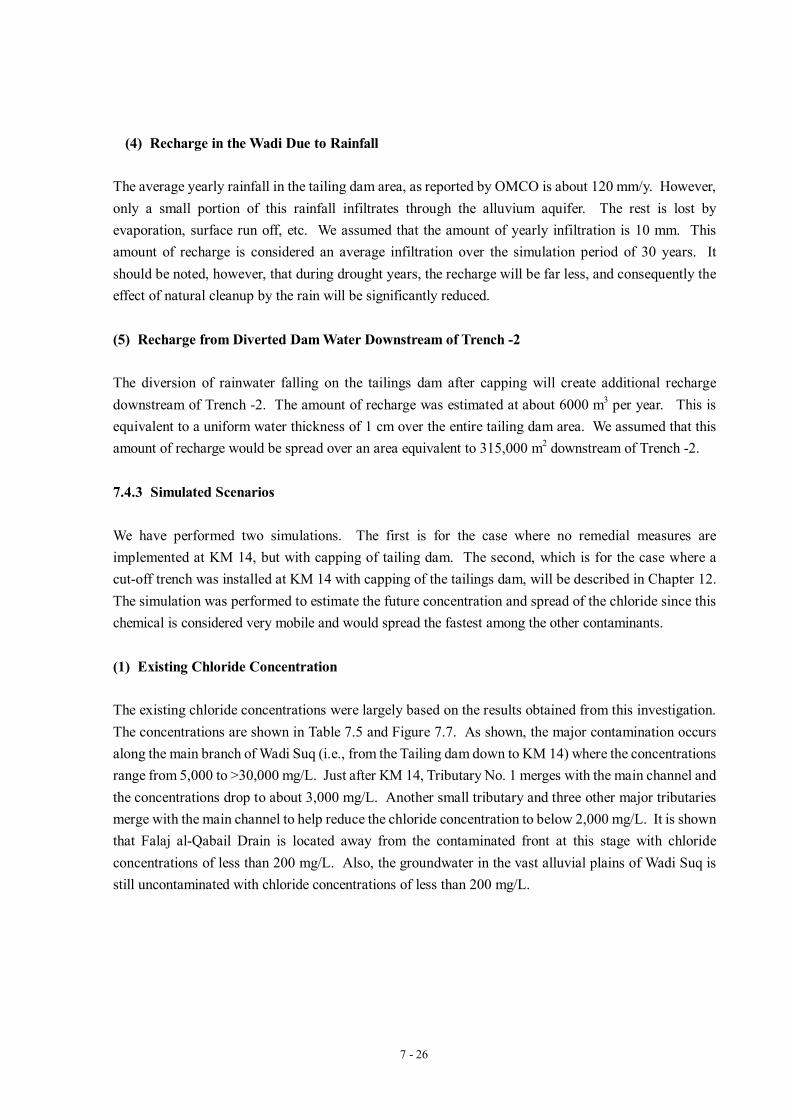
(4) Recharge in the Wadi Due to Rainfall
The average yearly rainfall in the tailing dam area, as reported by OMCO is about 120 mm/y. However, only a small portion of this rainfall infiltrates through the alluvium aquifer. The rest is lost by evaporation, surface run off, etc. We assumed that the amount of yearly infiltration is 10 mm. This amount of recharge is considered an average infiltration over the simulation period of 30 years. It should be noted, however, that during drought years, the recharge will be far less, and consequently the effect of natural cleanup by the rain will be significantly reduced. (5) Recharge from Diverted Dam Water Downstream of Trench -2 The diversion of rainwater falling on the tailings dam after capping will create additional recharge downstream of Trench -2. The amount of recharge was estimated at about 6000 m3 per year. This is equivalent to a uniform water thickness of 1 cm over the entire tailing dam area. We assumed that this amount of recharge would be spread over an area equivalent to 315,000 m2 downstream of Trench -2. 7.4.3 Simulated Scenarios We have performed two simulations. The first is for the case where no remedial measures are implemented at KM 14, but with capping of tailing dam. The second, which is for the case where a cut-off trench was installed at KM 14 with capping of the tailings dam, will be described in Chapter 12. The simulation was performed to estimate the future concentration and spread of the chloride since this chemical is considered very mobile and would spread the fastest among the other contaminants. (1) Existing Chloride Concentration The existing chloride concentrations were largely based on the results obtained from this investigation. The concentrations are shown in Table 7.5 and Figure 7.7. As shown, the major contamination occurs along the main branch of Wadi Suq (i.e., from the Tailing dam down to KM 14) where the concentrations range from 5,000 to >30,000 mg/L. Just after KM 14, Tributary No. 1 merges with the main channel and the concentrations drop to about 3,000 mg/L. Another small tributary and three other major tributaries merge with the main channel to help reduce the chloride concentration to below 2,000 mg/L. It is shown that Falaj al-Qabail Drain is located away from the contaminated front at this stage with chloride concentrations of less than 200 mg/L. Also, the groundwater in the vast alluvial plains of Wadi Suq is still uncontaminated with chloride concentrations of less than 200 mg/L.


7 - 28
Table 7.5 Water quality of Contaminated Groundwater along Wadi Suq
Location Cd Cr Pb Mn Fe SO4 Cl Hg
DH-1 DH-4 DH-5
DH-7 DH-8 DH-9
DH-10*3
0.11 0.02 0.03
0.011
(0.004) (0.002) (0.006)
1.08 0.21 0.91
(0.04)(0.022)(0.006)(0.042)
0.44 0.30 1.17
(0.06)(0.02)(0.02)(0.04)
3.03 0.18
(0.01)
0.32 (<0.01)(<0.01)(<0.01)
77.5 (0.34) (0.20)
(0.13) (0.33) (0.51) (0.11)
1435 584
(364)
973 (114) (58)
(397)
33565 6388 4449
1270 (396) (112) (402)
0.0032(0.0008)(0.0005)
(0.0005)(0.0004)(0.0004)(0.0003)
Standards *1 *2
0.01 0.01
- 0.05
0.10 0.1
- 0.1
- 1
- 400
- 650
0.001 0.001
*1 : Standards of Drinking water in Oman *2 : Standards of discharge water in Oman *3 : Tributary No.1
( ) : Less than standard value 7.4.4 Simulation Results in Case of No Cut-off Trench at KM 14 The first simulation was performed to estimate the future concentrations of chloride with time with no trench cut-off at KM 14. The results are shown for the entire Wadi Suq modeling area on Figures 7.8, 7.9, and 7.10 after 10 years, 20 years, and 30 years. The spread of chloride contamination is very clear from these figures. It is shown that the chloride concentration will exceed 600 mg/L at the discharge point of Falaj al-Qabail within 20 years. The chloride contamination will also reach the vast alluvial plains of Wadi Suq within 20 years and definitely within 30 years. To further illustrate the increase in chloride contamination with time, we have selected three locations along the wadi and plotted the chloride concentrations with time as shown on Figures 7.11, 7.12, and 7.13. The locations are demonstrated on Figure 7.7. The first location is just downstream of KM14 after Tributary No. 1. The second location is just before the vast alluvial plains of Wadi Suq, and the third location is at the town of Falaj al-Qabail. It is shown that the contamination at the first location will increase from 4,000 mg/L to about 7,100 mg/L in 30 years. At the second location, the contamination will also increase from 1,490 mg/L to about 1,675 mg/L in 10 years before the combined effect of rain and tributary No. 1 reduces the contamination. At Falaj al-Qabail, however, the concentration is shown to increase from 150 mg/L to about 950 mg/L in 30 years. It is also shown that it may take another 10 years before the effect of contamination becomes noticeable at this location.