Embed Size (px)
Citation preview

Ecological Specialist Report – September2012
Coastal & Environmental Services 18 Mooi-Mgeni Transfer Scheme
Table 3-2 Ranking matrix to provide an Environmental Significance Environmental Significance Positive Negative
LOW An acceptable impact for which mitigation is desirable but not essential. The impact by itself is insufficient even in combination with other low impacts to prevent development. These impacts will result in either positive or negative medium to short term effects on the social and/or natural environment.
4-7 4-7
MODERATE An important impact which requires mitigation. The impact is insufficient by itself to prevent the implementation of the project but which, in conjunction with other impacts may prevent its implementation. These impacts will usually result in either positive or negative medium to long term effect on the social and/or natural environment.
8-11 8-11
HIGH A serious impact which, if not mitigated, may prevent the implementation of the project. These impacts would e considered by society as constituting a major and usually long term change to the natural and/or social environment and result in severe negative or beneficial effects.
12-15 12-15
VERY HIGH A very serious impact which may be sufficient by itself to prevent the implementation of the project. The impact may result in permanent change. Very often these impacts are unmitigable and usually result in very severe effects or very beneficial effects.
16-20 16-20
Example of an environmental significance statement 3.1. Impact 1: Impact of noise on human health Cause and Comment The noise associated with Heavy Goods Vehicles (HGVs) has the potential to impact on human health. A recommendation for the movement of large vehicles at night may impact on the sleep patterns of local communities. Mitigation and Management There are standard mitigation measures to ensure that vehicle noise is kept within acceptable limits. Vehicles should be kept in good repair; they should use standard exhaust and silencing equipment. Drivers should stick to designated speed limits. Roads should be kept in good condition. Significance Statement
RA
TIN
G
Temporal Scale Spatial Scale Severity of
Impact Risk or
Likelihood Total
Without Mitigation
Short term 1 Localised 1 Moderate 2 Definite 4 8
With Mitigation
Short term 1 Localised 1 Slight 1 Unlikely 1 4
Overall Significance without mitigation MODERATE
Overall Significance with mitigation LOW

Ecological Specialist Report – September2012
Coastal & Environmental Services 19 Mooi-Mgeni Transfer Scheme
4. DESCRIPTION OF THE STUDY AREA
Topography 4.1. The eastern part of study area is considered to have gentle to moderate hills, whereas the western part is considered to be mountainous, leading towards the Drakensberg (uMngeni IDP, 2002). The project area is considered to have a gentle topography, with slightly undulating slopes between Nottingham Road and Rosetta (Plate 4-1). The site area consists of many small streams which can become dangerous during flood events. The main rivers include the Mooi and Little Mooi Rivers which are popular for trout fishing (MMTS-2, 2002). The area has a number of dams which receive high volumes of tourists as well as recreational users. For example, 1997 statistics indicate 65 600 visitors for Hazelmere dam, 25 000 visitors for Inanda dam and 151 000 visitors for Midmar Dam (MMTS-2 2002). The Umngeni and Karkloof rivers flow also have the popular Howick and Karkloof waterfalls on the eastern side of uMngeni.
Plate 4-1: The topography of the study site. A: The north-western portion of the site where
construction of the Spring Grove Dam wall is underway. B: Undulating hills on either side of the R103. C: Steep southern aspect slope below the Gowrie Golf Course. D: Gentle slope near the southern boundary of the Gowrie Golf Course
Geology and soils 4.2. The geology of the area is considered to be sedimentary rocks of the Beaufort and Ecca subgroups of the Karoo Super Group (DWAF 2009). Three different formations comprise uMngeni.

Ecological Specialist Report – September2012
Coastal & Environmental Services 20 Mooi-Mgeni Transfer Scheme
The western part is sandstone of the Tarkastad formation, the centre is predominantly mudstones and sandstone of the Estcourt formation and the east is predominantly shale of the Volkrust and Pietermaritzburg formations (Udidi 2009). Lions River, underlain by the Volksrust and Pietermaritzburg formation is comprised of highly weathered red orange, yellow brown and light blue grey soft rock shale (Drennan, Maude and Partners 2009). Moist silty clay soils with high silt content are characteristic of this formation (Drennan, Maude and Partners 2009). Rosetta is underlain by the Estcourt formation which is comprised of highly weathered soft rock siltstone and sandstone with moist, silty or sand clay soils (average of 28% clay) (Drennan, Maude and Partners, 2009). The Nottingham Road to Rosetta area has permanent wetlands with the most significant being the valley bottom wetland in the Crane Sanctuary (Drennan, Maude and Partners 2009).The depth to bedrock for both formations ranges from 1 m to 3 m. Overall, soils are acidic with a pH range of 3.8 to 5.94 in the project area (Drennan, Maude and Partners, 2009). The region is considered to have high agricultural potential, although fertilizer is required as nutrient levels are low due to leaching (from being in a high rainfall area). Soil in the eastern part is suggested to be well suited for intensive farming but there are problems with phosphorous fixation as well as aluminium toxicity (uMngeni IDP, 2002). Soil erosion originating from poorly-sited tracks/roads has resulted in numerous incised trenches (dongas) across the area (Drennan, Maude and Partners, 2009).
Climate 4.3. The climate of uMngeni is largely dependent on altitude. uMngeni is a summer rainfall area with lower lying areas receiving on average 800 mm rainfall a year, increasing to 1280 mm for higher lying areas (Udidi, 2009). The south-easterly slopes are wetter than north westerly slopes due to moist air entering from the south east (Udidi, 2009). The western areas have a colder winter average temperature of 14°C compared to the slightly warmer eastern part (17°C) due to snowfalls in the west (Udidi, 2009). Altitude also affects temperature as indicated by Table 4-1, with Bishopstowe at an altitude of 838 m above sea level having a mean maximum temperature of 23.9°C and mean minimum temperature of 11.2°C, whereas Nottingham Road at 600 m higher in altitude has a mean maximum temperature of 21.3°C and a much lower mean minimum temperature of 6.1°C. Table 4-1: Temperature variability with change in altitude in uMngeni (source: uMngeni IDP 2002)
Altitude (m) above sea level Mean max temp °C
Mean min temp °C
Bishopstowe 838 23.9 11.2
Cedara 1067 22.5 9.9
Nottingham Road 1438 21.3 6.1
Vegetation of the study area 4.4. Regional Vegetation Ezemvelo-KZN Wildlife has mapped the vegetation of the area in more detail (Figure 4-2), but the vegetation types are the same as the Mucina and Rutherford (2006) descriptions (Figure 4-3). According to these descriptions the proposed pipeline will pass predominantly through Drakensberg Foothill Moist Grassland (which is listed as Least Threatened). However, it will also affect Mooi River Highland Grassland (which lies to the north and west of the proposed pipeline), as well as Midlands Mistbelt Grassland (which lies to the south and east of the proposed pipeline):

Ecological Specialist Report – September2012
Coastal & Environmental Services 21 Mooi-Mgeni Transfer Scheme
Drakensberg Foothill Moist Grassland vegetation type occurs in the KwaZulu-Natal and Eastern Cape provinces. The area is moderately rolling and mountainous, incised with gorges containing dry vegetation types and forest. The majority is dominated by forb-rich grassland (a grassland with a large amount of non-grass species) dominated primarily by Themeda triandra and Tristachya leucothrix. This vegetation type is classified as Least threatened by Mucina and Rutherford (2006), with a conservation target of 23% and 2-3% statutorily conserved. Over 20% has been transformed for cultivation, plantations and urban sprawl. Mooi River Highland Grassland is restricted to the KwaZulu-Natal Province. It comprises gently rolling landscapes dominated by grassland, in which Themeda triandra, Heteropogon contortus and Tristachya leucothrix are dominant. This vegetation type is listed as Vulnerable, with a conservation target of 23%. Only a very small piece of it is statutorily conserved and the majority (almost 60%) has been transformed for cultivation or plantations. Midlands Mistbelt Grassland vegetation type occurs in the KwaZulu-Natal and Eastern Cape provinces. This area is a hilly and rolling landscape, characterised by an east facing scarp formed by dolerite intrusions. This vegetation type is dominated by forb-rich, tall, sour Themeda triandra grasslands that have been transformed by the invasion of Aristida junciformis subsp. junciformis. This vegetation type is classified as Endangered (one of the most threatened vegetation types in KwaZulu-Natal) by Mucina and Rutherford (2006), with a conservation status of 23% and only 0.5% statutorily conserved. More than 50% has already been transformed for plantations, cultivated land or by urban sprawl. Vegetation types in the study area The results of the vegetation assessment have determined the existence of four vegetation types within the study site, namely:
Drakensberg Foothill Moist Grassland,
Eastern Mistbelt Forest,
Wetlands
Transformed vegetation (Figure 4-4). An investigation of the site determined that the majority of the site is covered by cultivated lands or forestry plantations (Plate 4-2). As a result, there is very little natural vegetation on the site. Sites of natural vegetation are restricted to the Bill Barnes Crane and Oribi Nature Reserve and on a few farms that have not been utilised or only sparsely grazed where pockets of Drakensberg Foothill Moist Grassland occur. Wetland and riparian vegetation and two very small sections of Eastern Mistbelt Forest on the southern slopes to the north east of Zenzani Village and below the Gowrie Golf Course (Plate 4-2) were also noted. There are also several invasive species recorded on site, particularly Black Wattle (Acacia mearnsii), Bugweed (Solanum mauritianum), and American Bramble (Rubus cuneifolius, Plate 4-3).

Ecological Specialist Report – September2012
Coastal & Environmental Services 22 Mooi-Mgeni Transfer Scheme
Figure 4-1: KZN Wildlife Vegetation Map of the study area and surrounds

Ecological Specialist Report – September2012
Coastal & Environmental Services 23 Mooi-Mgeni Transfer Scheme
Figure 4-2: Mucina and Rutherford Vegetation Map of the study area and surrounds.

Ecological Specialist Report – September2012
Coastal & Environmental Services 24 Mooi-Mgeni Transfer Scheme
Plate 4-2: Vegetation types found on site. A: Grassland dominated by Themeda triandra
(Background) with Phragmites australis dominating the wetland in the foreground. B: Indigenous Eastern Misbelt Forest on a southern aspect. C: Cultivated land and D: Pine plantation Drakensberg Foothill Moist Grassland This vegetation is restricted to the Bill Barnes Crane and Oribi Nature Reserve and on a few farms which have not been transformed to pastures or plantations. The dominant species which occur are Themeda triandra and Tristachya leucothrix, Eragrostis curvula, Eragrostis plana, Heteropogon contortus and interspersed in areas with herbaceous species like Helichrysum auronitens. It is limited in its distribution, and is likely that it would have covered the majority of the site, should there have been no agricultural activities. Invasive species, predominantly a hybrid of the American Bramble (Rubus cuneifolius), occur within this vegetation type. It is imperative that any remaining areas of this vegetation type are not cleared for agriculture. This vegetation only occurs in three localities on site (Figure 4.3).

Ecological Specialist Report – September 2012
Coastal & Environmental Services 25 Mooi-Mgeni Transfer Scheme
Figure 4-3: Vegetation map of the study area

Ecological Specialist Report – September 2012
Coastal & Environmental Services 26 Mooi-Mgeni Transfer Scheme
Eastern Mistbelt Forest Eastern Mistbelt Forests are small (<1 ha) to large (>1500 ha) forests. They occur in an extensive band at middle altitudes (850-1600 m above sea level) often on steep eastern to western slopes of the mountains or escarpments from the Kokstad to the midlands of KwaZulu-Natal. The habitat is characterized by heavy summer mist. The forests are dominated by Xymalos monospora, Podocarpus henkelii, P latifolius, P. falcatus, Celtis africana, Kiggelaria africana and Ocotea bullata in the canopy. Understorey species vary in importance and include tree/shrub species such as Eugenia zuluensis, Trichocladus ellipticus, Maytenus mossambicensis and Peddiea africana, and a range of fern species often at high density. There are a number of deciduous and semi-deciduous species such as Celtis africana, Calodendrum capense, Ptaeroxylon obliquum, Kiggelaria africana and Zanthoxylum davyi. The forests are generally moist. Historically they were surrounded by grassland, but in many areas are now surrounded by commercial timber plantations, as is the case for the study site (Von Maltitz et al. 2003). Only two small pockets of Eastern Mistbelt Forest occur on steep, southern aspects slopes of the site (Figure 4.3). They contain tree species like Podocarpus falcatus, Ilex mitis var. mitis and Rhamnus prinoides. Most of this vegetation type on site has been cleared for commercial pine plantations and it is imperative that the remaining extent of the Eastern Mistbelt Forest pockets be conserved. Wetland vegetation Wetland vegetation is common across the site (Figure 4.3) but is generally disturbed by agricultural activities and heavily invaded in areas by species like Bugweed (Solanum mauritianum), Black Wattle (Acacia mearnsii) and many other ruderal grass species. Dominant species identified within the wetland vegetation were Typha capensis, Phragmites australis, Juncus kraussii, several Cyperus spp. and Ficinia cinnamomea, although some of these species can themselves be considered invasive in wetland systems and can be indicative of disturbance. Transformed Vegetation The mistbelt area in the KwaZulu Natal Midlands once had a large grassland component, which is now almost entirely transformed by agriculture and commercial timber, which also dominates the study area (Figure 4.3). The majority of the site is covered by cultivated lands and forestry plantations. The cultivated areas either consist of annual and /or perennial pastures such as rye grass (Lolium spp.), Eragrostis curvula and Eragrostis plana and crops such as maize. The plantations consist almost entirely of pine (Pinus pinaster). Plant species Invasive and problematic species The area is heavily invaded by alien invasive species (Plate 4-3), although the number of species is quite low. The vast majority of the invaded area is covered by Bugweed (Solanum mauritianum), Black Wattle (Acacia mearnsii), Pearl Acacia (Acacia podalyriifolia), various Bluegum (Euculyptus) species and the American Bramble (Rubus cuneifolius).This is a severe problem on site as the indigenous vegetation, and particularly possible species of special concern, could be crowded out by these species. These invaders are required to be removed by law, as they are each Category 1: Declared Weeds or Category 2: Declared Invaders (The Conservation of Agricultural Resources Act, 1983 (Act 43 of 1983). The most recent legislation makes the following recommendations regarding Category 1 plants: Combating of category 1 plants (section 15A) Category 1 plants may not occur on any land or inland water surface other than in biological control reserves.

Ecological Specialist Report – September2012
Coastal & Environmental Services 27 Mooi-Mgeni Transfer Scheme
A land user shall control any category 1 plants that occur on any land or inland water surface in contravention of the provisions of sub-regulation (1) by means of the methods prescribed in regulation 15E. No person shall, except in or for purposes of a biological control reserve –
establish, plant, maintain, multiply or propagate category 1 plants;
import or sell propagating material of category 1 plants or any category 1 plants;
acquire propagating material of category 1 plants or any category 1 plants. The executive officer may, on good cause shown in writing by the land user, grant written exemption from compliance with the requirements of sub-regulation (1) on such conditions as the executive officer may determine in each case.
Plate 4-3: Invasive aliens found on site. A: Bugweed (Solanum mauritianum) (Category 1). B: Hybrid
American Bramble (Rubus cuneifolius) (Category 1) that has been treated with a herbicide. C: Black wattle (Acacia mearnsii) (Category 2). Combating of category 2 plants (Section 15B) Category 2 plants may not occur on any land or inland water surface other than a demarcated area or a biological control reserve. The executive officer may on application in writing demarcate an area as an area where category 2 plants may occur, be established and be maintained. An area in respect of which a water use license for stream flow reduction activities has been issued in terms of section 36 of the National Water Act, 1998 (Act No. 36 of 1998) shall be deemed to be a demarcated area.

Ecological Specialist Report – September2012
Coastal & Environmental Services 28 Mooi-Mgeni Transfer Scheme
The executive officer shall demarcate an area for the occurrence, establishment and maintenance of category 2 plants only if –
the category 2 plants in the area are cultivated under controlled circumstances; and
the land user concerned has been authorised to use water in terms of the National Water Act, 1998 (Act No. 36 of 1998); and
the category 2 plants or products of category 2 plants in the area are demonstrated to primarily serve a commercial purpose, use as a woodlot, shelter belt, building material, animal fodder, soil stabilisation, medicinal or other beneficial function that the executive officer may approve; and
all reasonable steps are taken to curtail the spreading of propagating material of the category 2 plants outside the demarcated areas.
When an area is demarcated for the occurrence, establishment and maintenance of category 2 plants the executive officer may impose such additional conditions as may reasonably be deemed necessary to keep the category 2 plants in the area in check. No person shall sell propagating material of category 2 plants or any category 2 plants to another person unless such other person is a land user of a demarcated area or of a biological control reserve. No person shall acquire propagating material of category 2 plants or any category 2 plants unless such material or such plants are intended for use in a demarcated area or in a biological control reserve. Propagating material of category 2 plants or category 2 plants shall only be imported or sold in accordance with the provisions of the Plant Improvement Act, 1976 (Act No. 53 of 1976), the Agricultural Pests Act, 1983 (Act No. 36 of 1983) and the environment conservation regulations. A land user shall control any category 2 plants that occur on any land or inland water surface in contravention of the provisions of sub-regulation (1) by means of the methods prescribed in regulation 15E. Unless authorised thereto in terms of the National Water Act, 1998 (Act No. 36 of 1998), no land user shall allow category 2 plants to occur within 30 meters of the 1:50 year flood line of a river, stream, spring, natural channel in which water flows regularly or intermittently, lake, dam or wetland. The executive officer may, on good cause shown in writing by the land user, grant written exemption from compliance with one or more of the requirements of sub-regulations (1), (3), (5), (6), (8) and (9) on such conditions as the executive officer may determine in each case. Plant species of Special Concern The majority of the site is comprised of cultivated land, a golf course and scattered areas of plantations and some grassland primarily restricted to the Bill Barnes Crane and Oribi Nature Reserve. It is unlikely that a high number of species of special concern will be found in the area if it is more carefully surveyed. It is also important to note at this point that the vegetation types found in this area are sensitive. Mucina and Rutherford (2006) list several species that occur within Mooi River Highland Grassland, Drakensberg Foothill Moist Grassland and Midlands Mistbelt Grassland. Of these, 11 are on the IUCN red data list (Table 4-2).

Ecological Specialist Report – September2012
Coastal & Environmental Services 29 Mooi-Mgeni Transfer Scheme
Table 4-2: Species endemic to the vegetation types (Mooi River Highland Grassland, Drakensberg Foothill Moist Grassland and Midlands Mistbelt Grassland) found in the study area and surrounds.
Vegetation Type Species IUCN
Mooi River Highland Grassland
Geranium ornithopodiodes EN
Salvia repens Rare
Drakensberg Foothill Moist Grassland
Hesperantha ingeliensis Rare
Cheilanthes deltoidea VU
Nerine bowdenii Rare
Protea roupelliae CR
Encephalartos ghellinckii VU
Schizochilus bulbinella Rare
Stachys rivularis DD
Brachystelma molaventi VU
Dioscorea brownii VU
Midlands Mistbelt Grassland NONE
Fauna 4.5. Habitats There is a lack of pristine terrestrial habitats in the general study area, and hence the terrestrial fauna has been severely impacted upon by human activity. Vegetation clearing for cultivation is the primary impact on the natural habitats of the region. Birds The region (quarter degree grid cell: 2929BD) in which the study site is placed, has a bird list consisting of 244 bird species (SABAP 2) (Appendix 1). The forests in the area consist of an Important Bird Area (SA071 KwaZulu-Natal Mistbelt Forests). These forests consist of a series of patches occurring mainly on southern slopes where evaporation is less and the effect of fire is reduced. The forests hold many important bird species, including the largest remaining population of the threatened Cape Parrot Poicephalus robustus robustus. The forest floor and edge dwelling Rednecked Francolin Francolinus afer and Cinnamon Dove Aplopelia larvata are common. Bird parties are frequent and typical forest birds include Trumpeter Hornbill Bycanistes bucinator, Crowned Hornbill Tockus alboterminatus, Narina Trogon Apaloderma narina, Orange Thrush Zoothera gurneyi, Bush Blackcap Lioptilus nigricapillus, Knysna Lourie Tauraco corythaix, Olive Woodpecker Mesopicos griseocephalus, Grey Cuckooshrike Coracina caesia, Chorister Robin Cossypha dichroa, Starred Robin Pogonocichla stellata, Yellowthroated Warbler Seicercus ruficapillus, Bluemantled Flycatcher Trochocercus cyanomelas, Olive Bush Shrike Telophorus olivaceus, Swee Waxbill Estrilda melanotis and Forest Canary Serinus scotops. Forest predators include Forest Buzzard Buteo trizonatus, Crowned Eagle Stephanoaetus coronatus and Black Sparrowhawk Accipiter melanoleucus, and at night the Wood Owl Strix woodfordii. The quiet forest river streams hold habitat for Halfcollared Kingfisher Alcedo semitorquata and Longtailed Wagtail Motacilla clara. Birds listed by Birdlife Africa as occurring in the area, that are on the IUCN red data list are listed in Table 4-3. It should be noted that Grey Crowned (Balearica regulorum), Blue (Anthropoides paradiseus) and Wattled (Bugeranus carunculatus) Cranes have been recorded on the site, with a breeding pair of each of the latter two resident in the Bill Barnes Oribi and Crane Reserve. It is highly likely that Crowned Cranes also nest in the area.

Ecological Specialist Report – September2012
Coastal & Environmental Services 30 Mooi-Mgeni Transfer Scheme
Table 4-3: Red Data list birds which may occur in the area
Scientific name Common name IUCN
Ciconia nigra Black Stork NT
Ciconia episcopus Wooly-necked Stork NT
Geronticus calvus Southern Bald (Bald) Ibis VU
Sagittarius serpentaris Secretary Bird NT
Gypaetus barbatus Bearded Vulture EN
Gyps coprotheres Cape Vulture (Griffon) VU
Polemaetus bellicosus Martial Eagle VU
Stephanoaetus coronatus African Crowned (Crowned) Eagle NT
Circus ranivorus African Marsh-Harrier VU
Falco cherrug Lanner Falcon NT
Bugeranus carunculatus Wattled Crane CR
Anthropoides paradiseus Blue Crane VU
Balearica regulorum Grey Crowned- (Crowned) Crane VU
Neotisdenhami Denham’s (Stanley’s) Bustard VU
Vanellusmelanopterus Black-winged Lapwing (Plover) NT
Tytocapensis African Grass-Owl VU
Alcedosemitorquata Half-collared Kingfisher NT
Bucorvusleadbeateri Southern Ground-Hornbill VU
Lioptilusnigricapillus Bush Blackcap NT
Zootheragurneyi Orange Ground-Thrush NT
Schoenicolabrevirostris Broad-tailed Warbler NT
Mycteria ibis Yellow-billed Stork NT
Plegadisfalcinellus Glossy Bald (Bald) Ibis VU
Circus maurus Black Harrier NT
Rostratulabenghalensis Greater Painted-snipe NT
Reptiles There are 350 species of reptile in South Africa (Branch, 1998), of which 39 species may occur within the study area. These comprise 14 lizards, 24 snakes, andone freshwater terrapin. Reptiles likely to occur in the study area with IUCN categorisation (Least Concern (LC) and not threatened (NT) are given in Table 4-4. Table 4-4: Reptiles recorded from the study area and surrounds
Family Scientific name Common name IUCN
Lizards
Agamidae Acanthocercus atricollis Blue Headed Tree Agama LC
Agama armata Tropical Spiny Agama
Chamaeleonidae Bradypodion thamnobates Natal Midlands Dwarf Chameleon
NT
Cordylidae
Cordylus vittifer Transvaal girdled lizard
Pseudocordylus melanotus Drakensberg Crag Lizard
Chamaesaura anguina Cape grass lizard
Gekkonidae Afroedura pondolia Pondo Rock Gecko
Hemidactylus mabouia Tropical House Gecko
Gerrhosauridae Gerrhosaurus flavigularis Yellow-throated Plated Lizard
Trachylepis depressa Eastern coastal skink
Trachylepis varia Variable Skink

Ecological Specialist Report – September2012
Coastal & Environmental Services 31 Mooi-Mgeni Transfer Scheme
Family Scientific name Common name IUCN
Acontias gracilicauda Thin-tailed Legless Skink LC
Mabuya capensis The Cape Skink
Varanidae Varanus niloticus Nile Monitor
Varanus albigularis Rock Monitor
Snakes
Atractaspididae Aparallactus capensis Cape centipede-eater LC
Colubridae
Crotaphopeltis hotamboeia Red-lipped snake
Dasypeltis inornata Southern brown egg-eater
Dasypeltis scabra Rhombic egg-eater LC
Duberria lutrix common slug-eater LC
Lamprophis capensis Brown house snake
Lamprophis inornatus Olive House Snake LC
Lycodonomorphus laevissimus dusky-bellied water snake
Lycodonomorphus rufulus Common Brown Water Snake
Philothamnus hoplogaster Green water snake
Philothamnusnatalensis subsp. Occidentalis
Western Natal Green Snake
Psammophis brevirostris Short-snouted whip snake
Psammophis crucifer Cross-Marked Grass Snake
Psammophis mossambicus Mozambique Sandsnake
Pseudas piscana mole snake
Psammophylax rhombeatus Rhombic Skaapsteker
Lycophidion capense Cape wolf snake LC
Philothamnus natalensis Natal green snake
Elapidae Hemachatus haemachatus Rinkhals LC
Homorocelaps lacteus Spotted Harlequin Snake
Leptotyphlopidae Leptotyphlops longicaudus long-tailed thread snake
Typhlopidae Typhlops bibronii Bibron’s blind snake
Viperidae Causus rhombeatus Common night adder
Bitis arietans Puff Adder
Testudines
Pelomedusidae Pelomedusa subrufa Marsh Terrapin
Amphibians Amphibians are an important and often neglected component of terrestrial vertebrate faunas. They are well represented in sub-Saharan Africa, from which approximately 600 species have been recorded (Frost 1985). Currently amphibians are of increasing scientific concern as global reports of declining amphibian populations continue to appear (Phillips 1994). Although there is no consensus on a single cause for this phenomenon, there is general agreement that the declines in many areas, even in pristine protected parks, are significant and do not represent simple cyclic events. Frogs have been aptly called bio-indicator species, whose abundance and diversity is a poignant reflection of the general health and well-being of aquatic ecosystems. They are important components of wetland systems, particularly ephemeral systems from which fish are either excluded or of minor importance. In these habitats, they are dominant predators of invertebrates, many of which may impact significantly on humans (e.g. as vectors of disease).

Ecological Specialist Report – September2012
Coastal & Environmental Services 32 Mooi-Mgeni Transfer Scheme
Thirty two amphibian species are likely to occur in the area, of which four are threatened and one is data deficient (see Table 4-5). The Long-toed Tree Frog (Leptopelis xenodactylus) (Endangered) is the most threatened amphibian species likely to occur on site. This species occurs in wetlands and marshes in the mistbelt grassland in southern KwaZulu-Natal. Table 4-5: Amphibians which may occur in the study area and surrounds
Family Scientific name Common name IUCN
Bufonidae
Bufo gutturalis Guttural Toad LC
Bufo rangeri Raucous Toad LC
Schisma dermacarens African Split-skin Toad LC
Vandijkophrynus gariepensis Karoo Toad LC
Hyperoliidae
Hyperolius marmoratus Marbled Reed Frog LC
Afrixalus spinifrons Natal Leaf-folding Frog NT
Hyperolius marmoratus Painted Reed Frog LC
Kassina senegalensis Bubbling Kassina LC
Semnodactylus wealii Rattling Frog LC
Petropedetidae Cacosternum boettgeri Boettger’s Dainty Frog LC
Cacosternum nanum Bronze Dainty Frog LC
Pipidae Xenopus laevis Common Platanna LC
Pyxicephalidae
Strongylopus fasciatus Striped Stream Frog LC
Strongylopus grayii Clicking Stream Frog LC
Strongylopus wageri Plain Stream Frog NT
Tomopterna natalensis Natal Sand Frog LC
Tomopterna tandyi Tandy’s Sand Frog LC
Anhydrophryne hewitti Natal Chirping Frog LC
Cacosternum boettgeri Boettger’s Caco LC
Cacosternum nanum Bronze Caco LC
Cacosternum striatum Striped caco DD
Amieta angolensis Common River Frog LC
Amieta fuscigula Cape River Frog LC
Ranidae Strongylopus grayii Gray’s Stream Frog LC
Arthroleptidae Leptopelis xenodactylus Long-toed Tree Frog EN
Breviceptidae
Breviceps adspersus Bushveld Rain Frog LC
Breviceps bagginsi Bilbo’s Rain Frog VU
Breviceps verrucosus Plaintive Rain Frog LC
Heleophrynidae Hadromophryne natalensis Cascade Frog LC
Phrynobatrachidae Phrynobatrachus natalensis Snoring Puddle Frog LC
Ptychadenidae Ptychadena oxyrhynchus Sharp-nosed Grass Frog LC
Ptychadena porosissima Striped Grass Frog LC
Mammals The grassland biome of South Africa has suffered widespread modification by human development (Apps 2000). Large game makes up less than 15% of the mammal species in South Africa and a much smaller percentage in numbers and biomass. In developed and farming areas, such as the study site, this percentage is greatly reduced, with the vast majority of mammals present being small or medium- sized.
Ecological Specialist Report – September2012
Coastal & Environmental Services 33 Mooi-Mgeni Transfer Scheme
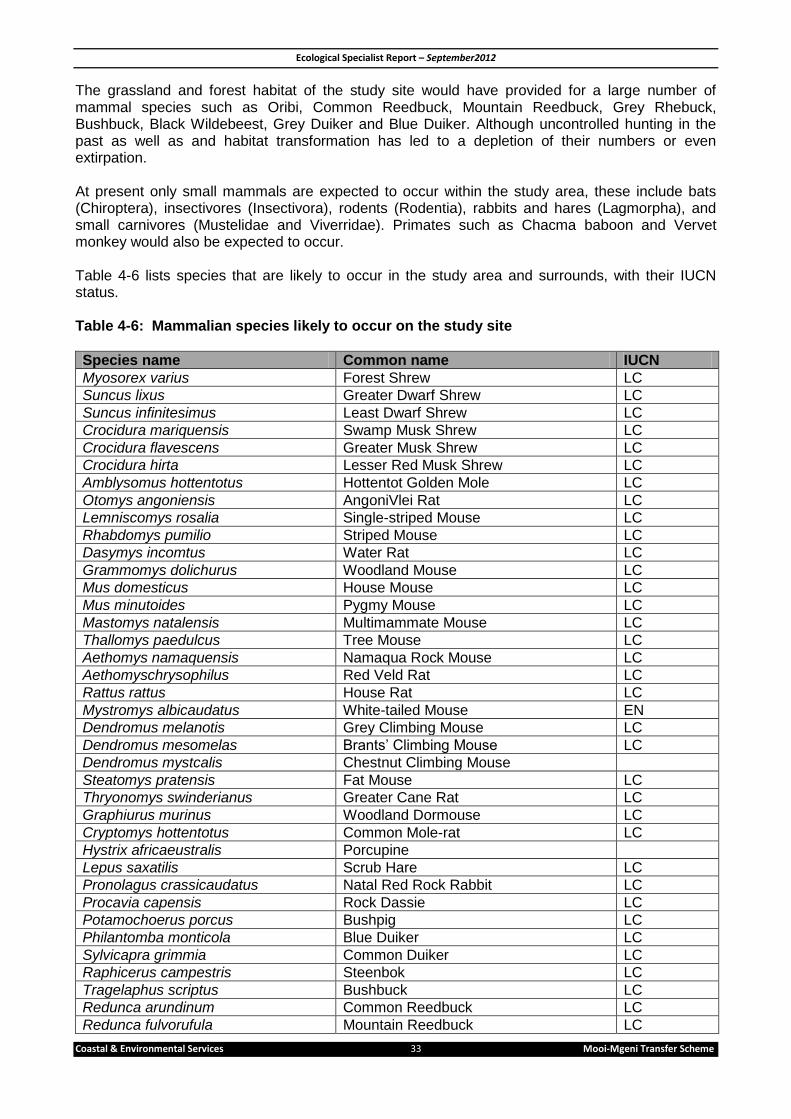
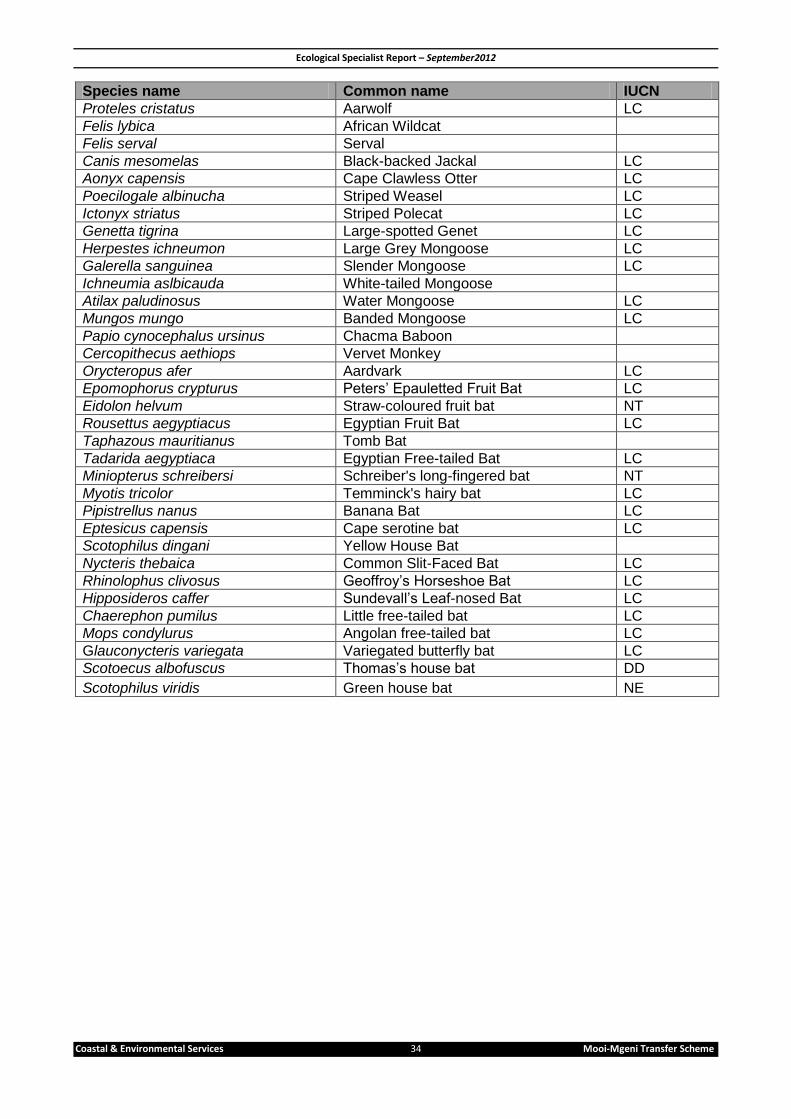
The grassland and forest habitat of the study site would have provided for a large number of mammal species such as Oribi, Common Reedbuck, Mountain Reedbuck, Grey Rhebuck, Bushbuck, Black Wildebeest, Grey Duiker and Blue Duiker. Although uncontrolled hunting in the past as well as and habitat transformation has led to a depletion of their numbers or even extirpation. At present only small mammals are expected to occur within the study area, these include bats (Chiroptera), insectivores (Insectivora), rodents (Rodentia), rabbits and hares (Lagmorpha), and small carnivores (Mustelidae and Viverridae). Primates such as Chacma baboon and Vervet monkey would also be expected to occur. Table 4-6 lists species that are likely to occur in the study area and surrounds, with their IUCN status. Table 4-6: Mammalian species likely to occur on the study site
Species name Common name IUCN
Myosorex varius Forest Shrew LC
Suncus lixus Greater Dwarf Shrew LC
Suncus infinitesimus Least Dwarf Shrew LC
Crocidura mariquensis Swamp Musk Shrew LC
Crocidura flavescens Greater Musk Shrew LC
Crocidura hirta Lesser Red Musk Shrew LC
Amblysomus hottentotus Hottentot Golden Mole LC
Otomys angoniensis AngoniVlei Rat LC
Lemniscomys rosalia Single-striped Mouse LC
Rhabdomys pumilio Striped Mouse LC
Dasymys incomtus Water Rat LC
Grammomys dolichurus Woodland Mouse LC
Mus domesticus House Mouse LC
Mus minutoides Pygmy Mouse LC
Mastomys natalensis Multimammate Mouse LC
Thallomys paedulcus Tree Mouse LC
Aethomys namaquensis Namaqua Rock Mouse LC
Aethomyschrysophilus Red Veld Rat LC
Rattus rattus House Rat LC
Mystromys albicaudatus White-tailed Mouse EN
Dendromus melanotis Grey Climbing Mouse LC
Dendromus mesomelas Brants’ Climbing Mouse LC
Dendromus mystcalis Chestnut Climbing Mouse
Steatomys pratensis Fat Mouse LC
Thryonomys swinderianus Greater Cane Rat LC
Graphiurus murinus Woodland Dormouse LC
Cryptomys hottentotus Common Mole-rat LC
Hystrix africaeustralis Porcupine
Lepus saxatilis Scrub Hare LC
Pronolagus crassicaudatus Natal Red Rock Rabbit LC
Procavia capensis Rock Dassie LC
Potamochoerus porcus Bushpig LC
Philantomba monticola Blue Duiker LC
Sylvicapra grimmia Common Duiker LC
Raphicerus campestris Steenbok LC
Tragelaphus scriptus Bushbuck LC
Redunca arundinum Common Reedbuck LC
Redunca fulvorufula Mountain Reedbuck LC
Ecological Specialist Report – September2012
Coastal & Environmental Services 34 Mooi-Mgeni Transfer Scheme
Species name Common name IUCN
Proteles cristatus Aarwolf LC
Felis lybica African Wildcat
Felis serval Serval
Canis mesomelas Black-backed Jackal LC
Aonyx capensis Cape Clawless Otter LC
Poecilogale albinucha Striped Weasel LC
Ictonyx striatus Striped Polecat LC
Genetta tigrina Large-spotted Genet LC
Herpestes ichneumon Large Grey Mongoose LC
Galerella sanguinea Slender Mongoose LC
Ichneumia aslbicauda White-tailed Mongoose
Atilax paludinosus Water Mongoose LC
Mungos mungo Banded Mongoose LC
Papio cynocephalus ursinus Chacma Baboon
Cercopithecus aethiops Vervet Monkey
Orycteropus afer Aardvark LC
Epomophorus crypturus Peters’ Epauletted Fruit Bat LC
Eidolon helvum Straw-coloured fruit bat NT
Rousettus aegyptiacus Egyptian Fruit Bat LC
Taphazous mauritianus Tomb Bat
Tadarida aegyptiaca Egyptian Free-tailed Bat LC
Miniopterus schreibersi Schreiber's long-fingered bat NT
Myotis tricolor Temminck's hairy bat LC
Pipistrellus nanus Banana Bat LC
Eptesicus capensis Cape serotine bat LC
Scotophilus dingani Yellow House Bat
Nycteris thebaica Common Slit-Faced Bat LC
Rhinolophus clivosus Geoffroy’s Horseshoe Bat LC
Hipposideros caffer Sundevall’s Leaf-nosed Bat LC
Chaerephon pumilus Little free-tailed bat LC
Mops condylurus Angolan free-tailed bat LC
Glauconycteris variegata Variegated butterfly bat LC
Scotoecus albofuscus Thomas’s house bat DD
Scotophilus viridis Green house bat NE

Ecological Specialist Report – September2012
Coastal & Environmental Services 35 Mooi-Mgeni Transfer Scheme
5. CONSERVATION PLANNING TOOLS Several conservation planning tools are available for the area. These tools allow for the determination of any sensitive and important areas from a vegetation and faunal point of view at the scoping stage of a development. They allow for the fine-tuning of plans and layouts with a view to reducing potential environmental impacts at the planning stage of the development. The tools used are outlined in Table 5-1 below. Table 5-1: Conservation and planning tools that need to be considered for the proposed project
Tool Motivation Relevancy Figure
Important Bird Area (IBA) Important Bird Areas are globally recognized areas essential for the protection of bird species. In order to be classified as an IBA, an area must contain Globally threatened species, restricted range species, biome restricted species or congregations of species.
Low relevance, the closest IBA is over 6kms away from the site.
Figure 5-1
Corridors This tool is designed to create corridors which link up fragmented landscapes. Ideally, these should be maintained as conserved areas.
High relevance. The pipeline traverses a corridor near Nottingham Road.
Figure 5-2
Protected Areas Expansion Strategy
The objective of the PAES is to form an overarching strategic framework for a protected area network that ‘conserves a comprehensive, representative and adequate sample of biodiversity and maintains key ecological processes across the landscape and seascape.’ The areas earmarked by this study should be protected.
High relevance. The pipeline traverses areas earmarked for protected areas expansion.
Figure 5-3
Protected Areas Protected areas are areas that are already conserved. Areas in close proximity to the proposed development may be affected by the development and thus must be taken into account.
High Relevance. The pipeline traverses The Bill Barnes Crane and Oribi Nature Reserve.
Figure 5-4
Terrestrial Systematic Conservation Plan
This planning tool developed by Ezemvelo KZN Wildlife shows the priorities for conservation of areas, Priority 1 areas have the highest priority for conservation, with Priority 3 the lowest. The tool also identifies transformed areas.
Very relevant. The site occurs primarily in Priority 1 areas, which have high conservation importance.
Figure 5-4
Delineated wetland inventory
Wetlands are very important aspects of the ecosystem as they are process areas. Not only do they form habitat for both flora and fauna, they also perform vital ecosystem functions. It is for this reason that wetlands are always rated with a high sensitivity and should be conserved.
Very relevant. Some pipeline options traverse, or run very close to, a wetland.
Figure 5-5

Ecological Specialist Report – September2012
Coastal & Environmental Services 36 Mooi-Mgeni Transfer Scheme
Figure 5-1: Important Bird Areas (IBAs) in proximity to the proposed pipeline. Corridors Corridors are areas of vegetation that should ideally be conserved in their natural state in order to maintain linkages within a fragmented landscape. These corridors were developed by Ezemvelo KZN Wildlife as a series of altitudinal and biogeographical corridors to “facilitate evolutionary, ecological and climate change processes and to create a linked landscape for the conservation of species on a fragmented landscape” (EKZNWWW 2010). Areas were assigned values based on how easy it would be for organisms to travel within them, for natural vegetation only. A larger weighting was given to drainage areas, spurs, ridges and mountain tops (EKZNWWW 2010). Corridors form a valuable structure in the landscape and should be maintained as natural areas to facilitate this function. Ecological corridors occur in the vicinity of the site, but the site itself does not

Ecological Specialist Report – September2012
Coastal & Environmental Services 37 Mooi-Mgeni Transfer Scheme
form part of such a corridor. It is important to take note of the proximity of the corridors, but they themselves are of little relevance to the study area.
Figure 5-2: Corridors in proximity to the proposed pipeline. Protected areas expansion strategy
A National Spatial Biodiversity Assessment was conducted in 2004, revealing a lack of protection for a representative sample of the country’s biodiversity, nor conserving adequate process areas. The Protected Areas Expansion Strategy allows for increased conservation of these aspects of the country in order to meet national biodiversity targets. The strategy outlines two methods of expanding the current National Protected Areas:
For public land, the declaration of available, under-utilised and strategic parcels of public land in concordance with the relevant legal requirements for disposal of such land;
For private land, contractual agreements with the affected landowners. Areas earmarked for expansion should not be developed as they could constitute National Parks in the future. Sections of the study site fall within the expansion strategy (Figure 5-3 below).

Ecological Specialist Report – September2012
Coastal & Environmental Services 38 Mooi-Mgeni Transfer Scheme
Figure 5-3: Protected Areas Expansion Strategy and its proximity to the proposed pipeline.

Ecological Specialist Report – September2012
Coastal & Environmental Services 39 Mooi-Mgeni Transfer Scheme
Terrestrial Systematic Conservation Plan The GIS based Terrestrial Systematic Conservation Plan or C-Plan developed by Ezemvelo KZN Wildlife in conjunction with a diverse range of stakeholders in order to determine priority areas for conservation. The outcome was a “irreplaceability” conservation map of the province divided into grid cells of 2 by 2km or Quarter Degree Square (QDS) level, ranking the irreplaceability of each cell or square. Irreplaceability reflects the planning units’ ability to meet set ‘targets’ for selected biodiversity ‘features’. The irreplaceability value is scaled between 0 and 1. The degree of irreplaceability of each cell (planning unit) was calculated by using a weighted score of the potential for important or sensitivity species / habitats to occur or known to occur within each of the cells. The C-plan for the study site is outlined in Figure 5-4 below. Irreplaceability Values are currently grouped into three classes or Biodiversity Priority Areas (BPA’s) and summarised in Table 5-2 below: Irreplaceability value 0: Where a planning unit has an irreplaceability value of 0, all biodiversity features recorded here are conserved to the target amount, and there is unlikely to be a biodiversity concern with the development of the site. Irreplaceability value 1: These planning units are referred to as totally irreplaceable and the conservation of the features within them are critical to meet conservation targets. (EIA very definitely required and depending on the nature of the proposal unlikely to be granted). Irreplaceability value > 0 but < 1: Some of these planning units are required to meet biodiversity conservation targets. If the value is high (e.g. 0.9) then most units are required (few options available for alternative choices). If the value is low, then many options are available for meeting the biodiversity targets. (EIA required and depending on the nature of the proposed development, permission could be granted). Table 5-2: Biodiversity Priority Area (BPA) ranking and description
BPA Description
BPA 1 These planning units have an irreplaceability value of 1, which means there are no other localities available in order to meet conservation targets. Often, BPA 1 is assigned to niche habitats that need to be conserved. Development may be permitted in BPA 1, dependent on its nature and careful consideration on a case-by-case basis.
BPA 2 These planning units have a high irreplaceability score. There exist alternative areas for the meeting of conservation targets, but not many.
BPA 3 These planning units tend to have a low irreplaceability score.
A large portion of the area through which the pipeline traverses is classified as BPA 1, which also includes most of the Springgrove dam site. However, a pipeline will not have a major impact on the loss of biodiversity and habitat in the BPA 1 area. However, it will cause a cumulative impact due to habitat fragmentation.

Ecological Specialist Report – September2012
Coastal & Environmental Services 40 Mooi-Mgeni Transfer Scheme
*White areas are undefined
Figure 5-4: Terrestrial Systematic Conservation Plan and its relevance to the proposed pipeline.

Ecological Specialist Report – September2012
Coastal & Environmental Services 41 Mooi-Mgeni Transfer Scheme
Wetlands
Wetlands are process areas, and as such are high priority areas for conservation. No development should result in loss of this habitat. A generic recommendation usually made to protect wetlands is that a buffer be applied to them, within which no development should take place. It is generally agreed that this buffer width depends on the system being affected, although a blanket 30 – 50 m is usually allocated. However, in this scenario a large section of the proposed water transfer scheme will be sited within an existing servitude (Figure 5-5) that crosses several wetlands and in many instances, the laying of the MMTS-1 caused degradation to wetland structure and function.
Figure 5-5: Wetlands delineated according to Ezemvelo KZN Wildlife and their proximity to the proposed pipeline.

Ecological Specialist Report – September 2012
Coastal & Environmental Services Mooi-Mgeni Transfer Scheme 42
6. WETLAND DELINEATION
Approach 6.1.
For the purposes of this study, wetlands were identified and delineated according to the National Wetland Classification System (NWCS) which defines wetlands as any feature with the following characteristics: “an area of marsh, peatland or water, whether natural or artificial, permanent or temporary, with water that is static or flowing, fresh, brackish or salt, including areas of marine water the depth of which at low tide does not exceed ten metres” (SANBI, 2009). The rationale was to include the many impoundments that have been created by damming sections of the wetlands into the WET HEALTH assessment.
Results 6.2.
Only wetlands that intersect the proposed pipeline routes as well as those affected by the existing Mearns Pipeline were delineated. A total of 11 wetlands could be thus directly affected by the proposed transfer infrastructure, covering a total area of 372.6312 ha (Table 6-1 and Figure 6-1 below). The wetlands were delineated and numbered in ascending order from north to south in the project area. Maps of individual, delineated wetlands are presented in Chapter 7. Table 6-1: Wetlands and their respective areas delineated within the project area.
The spatial extent and location of these 11 wetlands are presented in Figure 6.1 below. All these wetlands will be affected to some extent by the pipeline. Wetlands 1 and 4 are the largest systems, with wetland 4 having been impacted by the MMTS 1 pipeline.
Wetland Area (ha)
1 71.7082
2 21.553
3 21.5769
4 94.42681
5 54.5237
6 13.2868
7 12.5606
8 27.5291
9 15.6996
10 36.0547
11 3.7118

Ecological Specialist Report – September 2012
Coastal & Environmental Services Mooi-Mgeni Transfer Scheme 43
Figure 6-1: Wetlands and pipeline route alternatives within the project area

Ecological Specialist Report – September 2012
Coastal & Environmental Services Mooi-Mgeni Transfer Scheme 44
7. WETLAND HEALTH ASSESSMENT
Introduction 7.1.
Although identified and delineated, Wetland 3 was not included in the health assessment as the route that bisected it was discarded in the final options report. Agriculture and poor land use practices in general have had a substantial impact on wetlands in the project area, with none of the 10 wetlands assessed scoring B or better on any of the assessment criteria. Quaternary catchment boundaries were obtained from DAFF while ArcGIS® was used to delineate catchments for individual wetlands using 5m contour intervals.
Results 7.2.
All the wetlands in the project area were dominated by the valley bottom hydrogeomorphic unit. Wetlands 1 to 7 are subject to diffuse water movement and are classified as un-channelled. Wetlands 8, 9 & 10 were classified as channelled. Wetlands 1, 2, 3 & 4 fall within quaternary catchment V20D while the rest all occur in quaternary catchment U20B (DAFF, 2012). The Mean Annual Precipitation (MAP) and Potential Evapotranspiration data are 857mm & 1379mm for the former and 988mm and 1154mm for the latter (DAFF, 2012). The hydrological vulnerability factor used to assess the hydrological component for all wetlands was thus 0.9. Wetland 1 Wetland 1 is located closest to the Spring Grove Dam (Figure 6-1) and the dominant Hydrogeomorphic (HGM) unit is an un-channelled, Valley Bottom Wetland. Hydrology: Several activities in the catchment, including abstraction of water for irrigation and stands of alien trees, are causing a moderate to large reduction in water inputs in the wetland. Retention and distribution of water within the wetland have been affected largely by artificial drainage channels, excavation and infilling activities to create impoundments within the wetland (Plate 7-2) as well as abstraction from those impoundments and the presence of woody alien vegetation (Eucalyptus species) within the delineated wetland (Plates 7-1). Dams within the wetland and reduced water inputs from the catchment have dampened the effect of flood peaks and runoff on the wetland. The combined hydrology score was 7.5 corresponding to an E or seriously modified system according to ecological categories described in Table 2-6 with an anticipated trajectory of change of -1 (Table 7-1). Geomorphology: It was estimated that the length of the wetland system occupied by gullies (as a percentage of the length of the HGM unit) was approximately 21-40% with gully width contributing about 11-20% in relation to the width of the wetland area. This showed the extent of the erosional features in the wetland as 30%. The intensity of erosion gullies on the geomorphic integrity of the affected wetland areas was considered moderate to large. Depositional features covered approximately 11-25% of the wetland and the intensity of the impact was considered large to serious, although the confidence with which both these factors could be assessed was low due to the extensive modification which has occurred within the wetland to create impoundments, weirs, spillways, etc. The combined geomorphology score was 2.3 or an ecological category of C, moderately modified. The anticipated trajectory of change was scored at -1 (Table 7-1).

Ecological Specialist Report – September2012
Coastal & Environmental Services Hluhluwe Wind Energy Project 45
Vegetation: The vegetation of the wetland has been highly transformed through various agricultural activities and associated practices(i.e. habitat disturbance in the process of establishing dams and associated infrastructure - pump houses, spillways, etc.), seasonal & perennial pastures within the wetland footprint, crop lands and commercial plantations. The vegetation was scored at 6.8 or an E indicating a seriously modified system with an anticipated trajectory of change of -1 (Table 7-1).
Figure 7-1: Wetland 1 with the alternative pipeline route options Overall impacts for wetland 1 are summarised in Table 7-1 below as well as an indication of the anticipated trajectory of change for each component. Table 7-1: WET-HEALTH Level 1 integrated summary for Wetland 1
Conservation Importance: The system is highly modified and although none were observed, it is likely to provide habitat for some Species of Special Concern. The conservation importance is therefore MEDIUM.
Hydrology Geomorphology Vegetation
Impact Score
Change Score
Impact Score
Change Score
Impact Score
Change Score
Area weighted impact scores
7.5 -1 2.3 -1 6.8 -1
PES Categories E ↓ C ↓ E ↓

Ecological Specialist Report – September2012
Coastal & Environmental Services Hluhluwe Wind Energy Project 46
Plate 7-1: Eucalyptus sp. within wetland 1
Plate 7-2: Infilling to create dam walls and siting of
pump house within wetland 1
Plate 7-3: Artificial barriers altering the structure & function of Wetland 1
Wetland 2 Wetland 2 lies to the east of wetland 1 (Figure 7-2) and was also identified as an un-channelled, valley bottom in terms of the dominant HGM unit. The assessment yielded very similar results to that of wetland 1. Hydrology: Several activities in the catchment, including abstraction of water for irrigation and stands of alien trees, are causing a moderate to large reduction in water inputs in the wetland. Retention and distribution of water within the wetland have been affected largely by artificial drainage channels, excavation and infilling activities to create impoundments within the wetland (Plate 6-4) as well as abstraction from those impoundments. Dams within the wetland and reduced water inputs from the catchment have dampened the effect of flood peaks and runoff on the wetland. The combined hydrology score was 7.5 corresponding to an E or seriously modified system according to ecological categories described in Table 2-6 (page 14) with an anticipated

Ecological Specialist Report – September2012
Coastal & Environmental Services Hluhluwe Wind Energy Project 47
trajectory of change of -1 (Table 7-2).
Figure 7-2: Wetland 2 with the alternative pipeline route options Geomorphology: It was estimated that the length of the wetland system occupied by gullies (as a percentage of the length of the HGM unit) was approximately 21-40% with a gully width of about 11-20% in relation to the width of the wetland area. This showed the extent of the erosional features in the wetland as 25%. The intensity of erosion gullies on the geomorphic integrity of the affected wetland areas was considered moderate. Depositional features covered approximately 11-25% of the wetland and the intensity of the impact was considered large to serious, although the confidence with which both these factors could be assessed was low due to the extensive modification within the wetland (impoundments, spillways, etc.). The combined geomorphology score was 2.1 or an ecological category of C, moderately modified. The anticipated trajectory of change was scored at -1 (Table 7-2). Vegetation: The vegetation of the wetland has been highly transformed through various agricultural activities and associated practices (habitat disturbance in the process of establishing dams and associated infrastructure). The vegetation was scored at 6.9 or an E indicating a seriously modified system with an anticipated trajectory of change of -1 (Table 7-2)