Embed Size (px)
Citation preview

Table 2.1.1: New Transplant Rate per million population (pmp), 1998-2005
Year 1998 1999 2000 2001 2002 2003 2004 2005
New transplants 119 122 126 221 203 165 184 192
New transplant rate pmp 5 5 5 9 8 7 7 7
Figure 2.1.1: New transplant rate, 1998-2005
New transplant rate, pmp
Year
0
1
2
3
4
5
6
7
8
9 Rate, pmp
19981999
20002001
20022003
20042005

Table 2.1.2: Types of Cornea Transplant, 1998-2005
Year 1998 (N = 119)
1999 (N = 122)
2000 (N = 126)
2001 (N = 221)
2002 (N = 203)
No. % No. % No. % No. % No. %
Penetrating Keratoplasty 114 96 116 95 120 95 207 94 196 97
Lamellar Keratoplasty 1 1 5 4 5 4 14 6 5 2
Patch Graft for Cornea 0 0 0 0 0 0 0 0 0 0
Patch Graft for Sclera 0 0 0 0 0 0 0 0 0 0
Cornea Scleral Keratoplasty 0 0 1 1 0 0 0 0 0 0
No data 4 3 0 0 1 1 0 0 2 1
Year 2003 (N = 165)
2004 (N = 184)
2005 (N = 192)
TOTAL (N = 1332)
No. % No. % No. % No. %
Penetrating Keratoplasty 156 95 165 90 173 90 1247 94
Lamellar Keratoplasty 8 5 10 5 13 7 61 5
Patch Graft for Cornea 0 0 2 1 3 2 5 0
Patch Graft for Sclera 0 0 0 0 1 0 1 0
Cornea Scleral Keratoplasty 1 0 7 4 2 1 11 1
No data 0 0 0 0 0 0 7 0
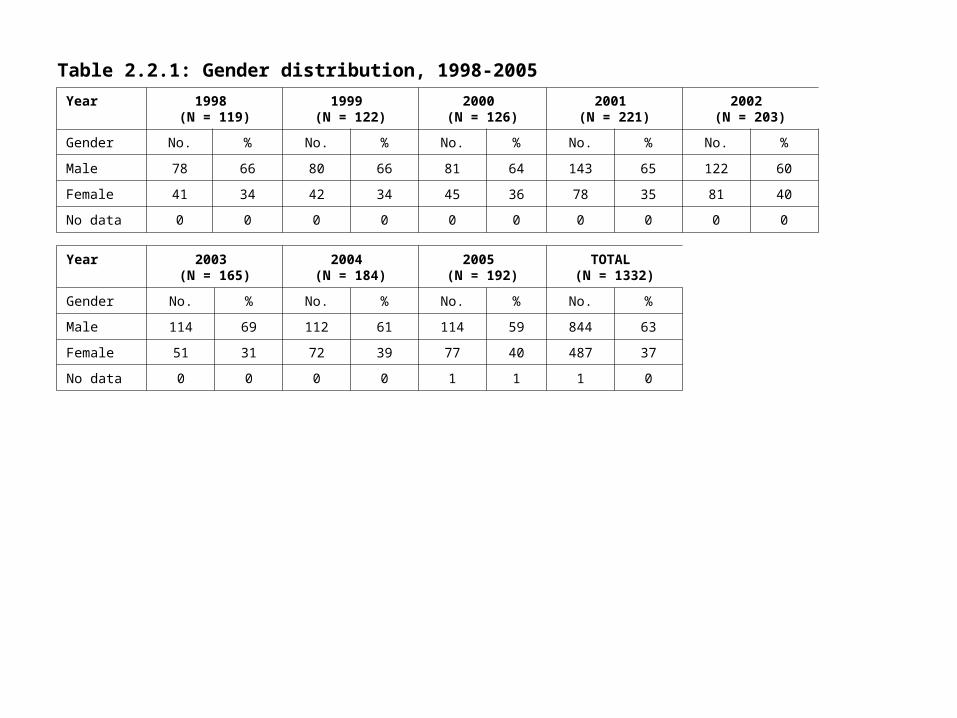
Table 2.2.1: Gender distribution, 1998-2005
Year 1998 (N = 119)
1999 (N = 122)
2000 (N = 126)
2001 (N = 221)
2002 (N = 203)
Gender No. % No. % No. % No. % No. %
Male 78 66 80 66 81 64 143 65 122 60
Female 41 34 42 34 45 36 78 35 81 40
No data 0 0 0 0 0 0 0 0 0 0
Year 2003 (N = 165)
2004 (N = 184)
2005 (N = 192)
TOTAL (N = 1332)
Gender No. % No. % No. % No. %
Male 114 69 112 61 114 59 844 63
Female 51 31 72 39 77 40 487 37
No data 0 0 0 0 1 1 1 0

Table 2.2.2: Ethnic distribution, 1998-2005
Year 1998 (N = 119)
1999 (N = 122)
2000 (N = 126)
2001 (N = 221)
2002 (N = 203)
Ethnic group No. % No. % No. % No. % No. %
Malay 28 24 34 28 41 33 70 32 74 36
Chinese 47 39 46 38 50 40 92 42 83 41
Indian 36 30 35 29 28 22 49 22 35 17
Bumiputra Sabah 0 0 0 0 0 0 0 0 0 0
Bumiputra Sarawak 0 0 0 0 0 0 1 0 0 0
Others 8 7 7 5 6 5 5 2 9 5
No data 0 0 0 0 1 0 4 2 2 1
Year 2003 (N = 165)
2004 (N = 184)
2005 (N = 192)
TOTAL (N = 1332)
Ethnic group No. % No. % No. % No. %
Malay 52 32 66 36 62 32 427 32
Chinese 67 41 58 32 73 38 516 39
Indian 34 20 43 23 41 21 301 22
Bumiputra Sabah 0 0 1 1 1 1 2 0
Bumiputra Sarawak 0 0 4 2 5 3 10 1
Others 11 7 10 5 10 5 66 5
No data 1 0 2 1 0 0 10 1
*Others: Non Malaysian

Figure 2.2.1: Ethnic distribution, 1998-2005
Percent
Ethnic group
0
5
10
15
20
25
30
35
40
45
Malay Chinese Indian Bumiputra Sabah Bumiputra Sarawak Others
19981999
20002001
20022003
20042005

Table 2.2.3: Age distribution of cornea transplant recipient patients, 1998-2005
Year 1998 (N = 119)
1999 (N = 122)
2000 (N = 126)
2001 (N = 221)
2002 (N = 203)
Age group (years) No. % No. % No. % No. % No. %
0-9 4 3 5 4 6 5 8 4 9 4
10-19 13 11 17 14 9 7 29 13 16 8
20-39 28 24 34 28 34 27 49 22 53 26
40-59 38 32 32 26 40 32 61 28 57 28
>=60 36 30 34 28 37 29 74 33 68 34
Mean 45 43 44 45 46
SD 21 22 20 21 21
Median 45 43 45 50 46
Minimum 4 months 5 2 months 5 months 1
Maximum 82 92 86 85 86
Year 2003 (N = 165)
2004 (N = 184)
2005 (N = 192)
TOTAL (N = 1332)
Age group (years) No. % No. % No. % No. %
0-9 6 3 6 4 8 4 52 4
10-19 21 13 15 8 14 7 134 10
20-39 36 22 55 30 59 31 348 26
40-59 51 31 52 28 45 24 376 28
>=60 51 31 56 30 66 34 422 32
Mean 45 45 46 45
SD 21 21 21 21
Median 46 44 49 46
Minimum 5 months 2 months 2 months 2 months
Maximum 84 86 84 92
Age=date transplant-date birth; age if provided

Figure 2.2.2: Age distribution of cornea transplant recipient patients, 1998-2005
PercentYear
0
5
10
15
20
25
30
35
0-9 years 10-19 years 20-39 years 40-59 years >=60 years
19981999
20002001
20022003
20042005
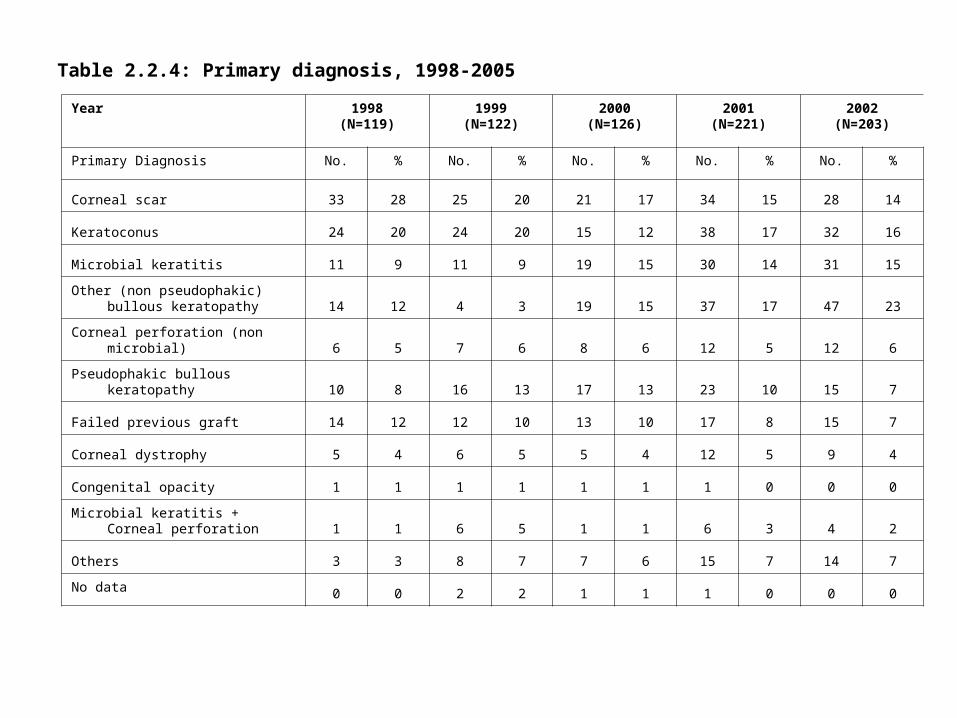
Table 2.2.4: Primary diagnosis, 1998-2005
Year 1998(N=119)
1999(N=122)
2000(N=126)
2001(N=221)
2002(N=203)
Primary Diagnosis No. % No. % No. % No. % No. %
Corneal scar 33 28 25 20 21 17 34 15 28 14
Keratoconus 24 20 24 20 15 12 38 17 32 16
Microbial keratitis 11 9 11 9 19 15 30 14 31 15
Other (non pseudophakic) bullous keratopathy 14 12 4 3 19 15 37 17 47 23
Corneal perforation (non microbial) 6 5 7 6 8 6 12 5 12 6
Pseudophakic bullous keratopathy 10 8 16 13 17 13 23 10 15 7
Failed previous graft 14 12 12 10 13 10 17 8 15 7
Corneal dystrophy 5 4 6 5 5 4 12 5 9 4
Congenital opacity 1 1 1 1 1 1 1 0 0 0
Microbial keratitis + Corneal perforation 1 1 6 5 1 1 6 3 4 2
Others 3 3 8 7 7 6 15 7 14 7
No data 0 0 2 2 1 1 1 0 0 0

Table 2.2.4: Primary diagnosis, 1998-2005
Year 2003(N=165)
2004(N=184)
2005 (N=192)
TOTAL (N=1332*)
Primary Diagnosis No. % No. % No. % No. %
Corneal scar 21 13 25 14 20 10 207 16
Keratoconus 18 11 34 18 34 18 219 16
Microbial keratitis 21 13 18 10 13 7 154 12
Other (non pseudophakic) bullous keratopathy 25 15 16 9 14 7 176 13
Corneal perforation (non microbial) 27 16 13 7 18 9 103 8
Pseudophakic bullous keratopathy 19 12 19 10 35 18 154 12
Failed previous graft 14 8 12 7 14 7 111 8
Corneal dystrophy 7 4 8 4 6 3 58 4
Congenital opacity 1 1 8 4 3 2 16 1
Microbial keratitis + Corneal perforation 4 2 17 9 20 10 59 4
Others 10 6 34 18 35 18 126 9
No data 0 0 1 1 0 0 5 0
*1219 patients have 1 primary diagnosis, 104 have 2 primary diagnoses, 4 patients had 3 diagnoses, and 1 patient had 4 diagnoses

Figure 2.2.3: Primary Diagnosis in Recipients, 1998-2005
05
10
15
20
25
30
Percent
1998 1999 2000 2001 2002 2003 2004 2005Year
CS KCMK PBK
CS = Corneal ScarKC = KeratoconusMK = Microbial keratitisPBK = Pseudophakic bullous
keratopathy

Table 2.2.5: Indications of cornea transplant, 2004-2005
Indication of transplant 2004 (N = 184)
2005 (N = 192)
Total (N = 376)
No. % No. % No. %
Optical 119 65 131 68 250 66
Tectonic 26 14 23 11 49 13
Therapeutic 29 16 22 11 51 14
Tectonic + Therapeutic 9 5 9 5 18 5
Optical + Tectonic 1 0 1 1 2 1
Optical + Tectonic + Therapeutic 0 0 1 1 1 0
Others 0 0 4 2 4 1
No data 0 0 1 1 1 0

Table 2.3.1.1: Number of cornea transplants with complete data set
2004 2005 Total
No. % No. % No. %
Total no. of cornea transplants performed 184 100 192 100 376 100
No. of cornea transplants with notification complete data set 138 75 158 82 296 79

Table 2.3.2.1: No of previous grafts in grafted eye, 2004-2005
Graft Number 2004 (N=138)
2005 (N=158)
Total(N = 296)
No. % No. % No. %
0123 89 143 90 266 90
111 8 12 8 23 8
23 2 2 1 5 2
30 0 1 1 1 0
4 1 1 0 0 1 0
Table 2.3.2.2: Ocular co-morbidity, 2004-2005
2004 (N=138)
2005 (N=158)
Total(N = 296)
Ocular co-morbidity No. % No. % No. %
Any ocular co-morbidity (a to c below) 88 64 102 65 190 64
a) Cornea vascularisation 77 56 78 49 155 82
Superficial vascularisation 44 32 48 30 92 48
Deep vascularisation42 30 38 24 80 42
b) History of glaucoma 29 21 36 23 65 34
c) Current ocular inflammation 41 30 49 31 90 47
*Patient might have multiple ocular co-morbidity

Table 2.3.2.3: Pre-operative vision, 2004-2005
2004 (N=138)
2005 (N=158)
Total(N = 296)
Unaided VA No. % No. % No. %
6/6 3 2 0 0 3 1
6/9 1 1 1 1 2 1
6/12 0 0 2 1 2 1
6/18 0 0 1 1 1 0
6/24 3 2 5 3 8 3
6/36 4 3 6 4 10 3
6/60 7 5 16 10 23 8
5/60 1 1 0 0 1 0
4/60 3 2 1 1 4 1
3/60 2 1 2 1 4 1
2/60 1 1 2 1 3 1
1/60 4 3 9 6 13 4
CF 47 34 47 29 94 33
HM 47 34 46 29 93 32
PL 13 10 15 9 28 9
NPL 2 1 1 1 3 1
No data 0 0 4 3 4 1

Table 2.3.3.1: Source of Donor Cornea Tissue, 2004-2005
2004 (N=138)
2005 (N=158)
Total(N = 296)
Source of donor No. % No. % No. %
Local 20 14 19 12 39 13
USA 95 69 112 71 207 70
Sri Lanka 22 16 27 17 49 17
No data 1 1 0 0 1 0
If Local, ethnic group:
Malay 0 0 4 21 4 10
Chinese 14 70 8 42 22 56
Indian 5 25 6 32 11 28
No data 1 5 1 5 2 6

Figure 2.3.3.1: Source of Donor Corneal Tissue, 2004-2005
PercentYear
0
10
20
30
40
50
60
70
Local USA Sri Lanka
2004 2005

Table 2.3.3.2: Donor age distribution, 2004-2005
2004 (N=138)
2005 (N=158)
Total(N = 296)
Age, years No. % No. % No. %
0-9 2 1 3 2 5 2
10-19 6 4 4 3 10 3
20-39 11 8 7 4 18 6
40-59 52 38 77 49 129 44
>=60 67 49 67 42 134 45
Mean 56 57 57
SD 15 14 15
Median 59 57 58
Minimum 8 3 3
Maximum 78 79 79

Figure 2.3.3.2: Donor age distribution, 2004-2005
0
.05
.1
.15
.2
.25
.3
Fraction5 10 15 20 25 30 35 40 45 50 55 60 65 70 75 80
Age of Donor (years)

Table 2.3.3.3: Preservation media, 2004-2005
2004 (N=138)
2005 (N=158)
Total(N = 296)
Preservation media No. % No. % No. %
Optisol GS 110 80 127 80 237 80
MK Medium 22 16 25 16 47 16
Moist Chamber 4 3 3 2 7 2
No data 2 1 3 2 5 2
Figure 2.3.3.3: Preservation media, 2004-2005
Percent
Year0
10
20
30
40
50
60
70
80
Optisol MK Medium Moist Chamber
2004 2005

Table 2.3.3.4: Cause of death in cornea donors, 2004-2005
2004 (N=138)
2005 (N=158)
Total(N = 296)
Cause of death No. % No. % No. %
Cardiac / Circulatory System 47 35 37 23 84 28
Cerebrovascular System 17 12 23 15 40 14
Malignancy 19 14 26 16 45 15
Trauma / Accident 20 14 10 6 30 10
Respiratory System 15 11 8 5 23 8
Others 17 12 13 8 30 10
No data 3 2 41 27 44 15
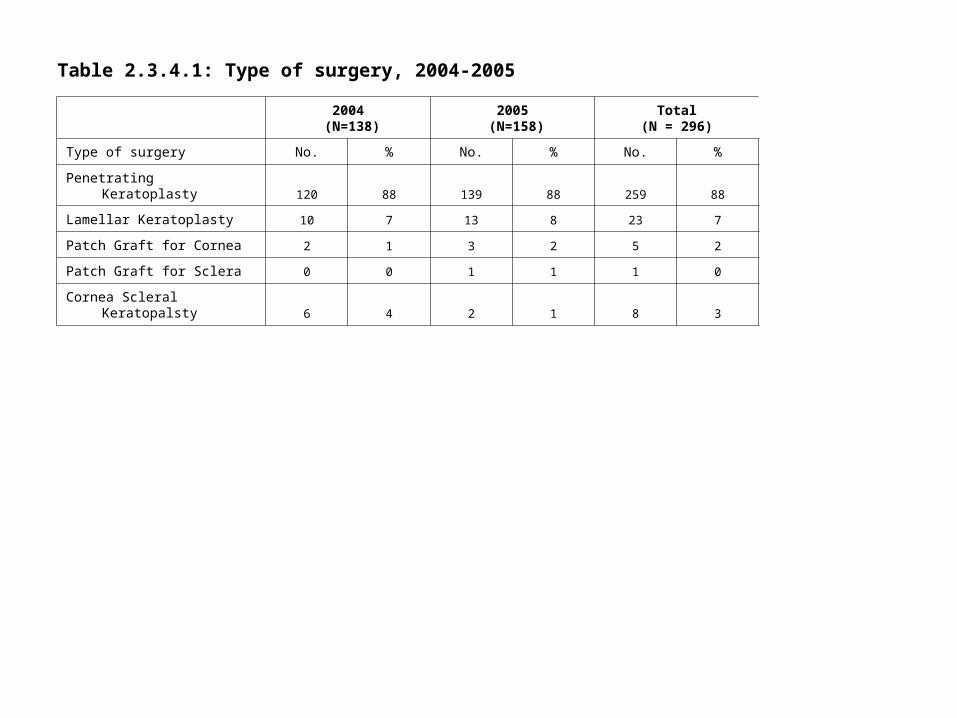
Table 2.3.4.1: Type of surgery, 2004-2005
2004 (N=138)
2005 (N=158)
Total(N = 296)
Type of surgery No. % No. % No. %
Penetrating Keratoplasty 120 88 139 88 259 88
Lamellar Keratoplasty 10 7 13 8 23 7
Patch Graft for Cornea 2 1 3 2 5 2
Patch Graft for Sclera 0 0 1 1 1 0
Cornea Scleral Keratopalsty 6 4 2 1 8 3

Table 2.3.4.2: Type of Combined surgery, 2004-2005
2004 (N=138)*
2005 (N=158)**
Total(N = 296)
Combined surgery No. % No. % No. %
No. of patients with combined surgery 31 22 26 16 57 19
(a) Glaucoma surgery 2 1 3 2 5 9
(b) Cataract Extraction 16 12 13 8 29 51
(c ) IOL 14 10 9 6 23 40
(d) Retinal Surgery + Internal Tamponade 1 1 1 1 2 4
(e) Anterior vitrectomy 9 7 3 2 12 21
(f) Others 5 4 8 5 13 23
*14 patients had 2 types of surgeries and 1 patient had 3 types of surgeries, combined with the corneal transplant surgery**11 patients had 2 types of surgeries combined with the corneal transplant surgery.
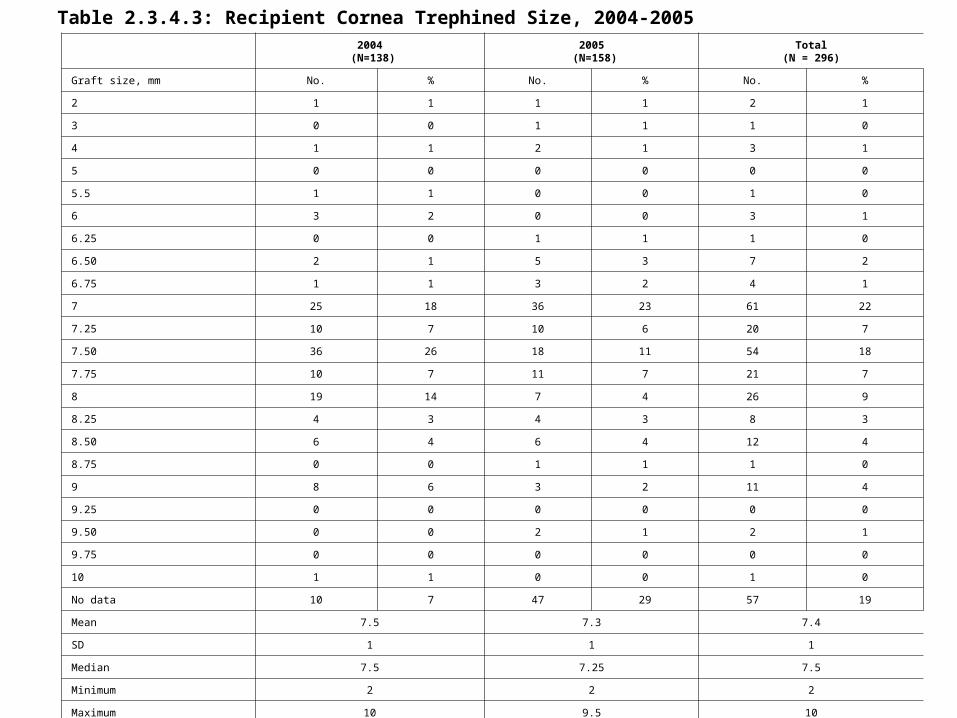
Table 2.3.4.3: Recipient Cornea Trephined Size, 2004-2005 2004
(N=138)2005
(N=158)Total
(N = 296)
Graft size, mm No. % No. % No. %
2 1 1 1 1 2 1
3 0 0 1 1 1 0
4 1 1 2 1 3 1
5 0 0 0 0 0 0
5.5 1 1 0 0 1 0
6 3 2 0 0 3 1
6.25 0 0 1 1 1 0
6.50 2 1 5 3 7 2
6.75 1 1 3 2 4 1
7 25 18 36 23 61 22
7.25 10 7 10 6 20 7
7.50 36 26 18 11 54 18
7.75 10 7 11 7 21 7
8 19 14 7 4 26 9
8.25 4 3 4 3 8 3
8.50 6 4 6 4 12 4
8.75 0 0 1 1 1 0
9 8 6 3 2 11 4
9.25 0 0 0 0 0 0
9.50 0 0 2 1 2 1
9.75 0 0 0 0 0 0
10 1 1 0 0 1 0
No data 10 7 47 29 57 19
Mean 7.5 7.3 7.4
SD 1 1 1
Median 7.5 7.25 7.5
Minimum 2 2 2
Maximum 10 9.5 10

Table 2.3.4.4: Difference in trephined sizes of recipient and donor corneas, 2004-2005
2004 (N=138)
2005 (N=158)
Total(N = 296)
Difference in Graft size, mm No. % No. % No. %
Same size 9 7 8 5 17 6
0.25 29 21 19 12 48 16
0.5 87 62 84 53 171 59
0.75 1 1 0 0 1 0
1 1 1 0 0 1 0
2 1 1 0 0 1 0
No data 10 7 47 30 57 19

Table 2.3.4.5: Suture Technique, 2004-2005
2004 (N=138)
2005 (N=158)
Total(N = 296)
Suture Technique No. % No. % No. %
Interrupted only 132 96 138 88 270 92
Continuous only 0 0 0 0 0 0
Combined 6 4 18 12 24 8

Table 2.4.1.1: Stock and flow
Year 2004
No. %
New transplant 184 100
On follow up 150 82
Lost to follow up 34 18
Dead 0 0
Table 2.4.2.1: Post transplant graft status (Optical and Non-Optical)
2004 (N = 150)
No. %
Graft survival 120 80
Graft failure 30 20
Table 2.4.2.2: Post Transplant graft Status by Optical and Non-Optical Indication
2004 (N = 150)
Optical (N = 99) Non-Optical (N = 51)
No. % No. %
Graft survival 91 92 29 57
Graft failure 8 8 22 43
* Subjects with both optical & non-optical indications were classified into the optical group

Table 2.4.2.3: Causes of graft failure
2004
No. %
Graft Failure 30 20
Cause of Failure Primary graft failure or Primary Endothelial decompensation 4 13
Recurrence of primary disease 4 13
Late Endothelial decompensation 8 27
Glaucoma 5 17
Infection 4 13
Graft rejection 6 20
Others 7 23
No data 3 10
*Each patient may have more than one cause of graft failure* Data represents causes from surgeons who provided a complete data set

Table 2.4.3.1: Available data on post corneal transplant vision
Unaided Vision (N = 150) Best Corrected Visual Acuity (N = 150)
No. % No. %
Data available 137 91 45 30
No data 13 9 105 70
Table 2.4.3.2: Post transplant Unaided Vision (Optical and Non-Optical)
2004 (N = 137)
Post transplant Unaided Vision No. %
6/6 3 2
6/9 5 4
6/12 5 4
6/18 11 8
6/24 20 15
6/36 18 13
6/60 24 18
5/60 0 0
4/60 0 0
3/60 3 2
2/60 1 0
1/60 1 0
CF 16 12
HM 19 14
PL 6 4
NPL 5 4

Figure 2.4.3.1: Post transplant Unaided Vision
PercentUnaided Vision
0
2
4
6
8
10
12
14
16
18
20 percent
6/66/9
6/126/18
6/246/36
6/605/60
4/603/60
2/601/60
CFHM
PLNPL

Table 2.4.3.3: Post transplant Best Corrected Visual Acuity (Optical and Non-Optical)
2004 (N = 45)
Post transplant best corrected Visual Acuity No. %
6/6 4 9
6/9 7 16
6/12 13 29
6/18 6 13
6/24 5 11
6/36 3 7
6/60 3 7
5/60 0 0
4/60 0 0
3/60 0 0
2/60 0 0
1/60 1 2
CF 2 4
HM 1 2
PL 0 0
NPL 0 0

Figure 2.4.3.2: Post transplant Best Corrected Visual Acuity
Percent
Best Corrected Visual Acuity
0
5
10
15
20
25
30 percent
6/66/9
6/126/18
6/246/36
6/605/60
4/603/60
2/601/60
CFHM
PLNPL
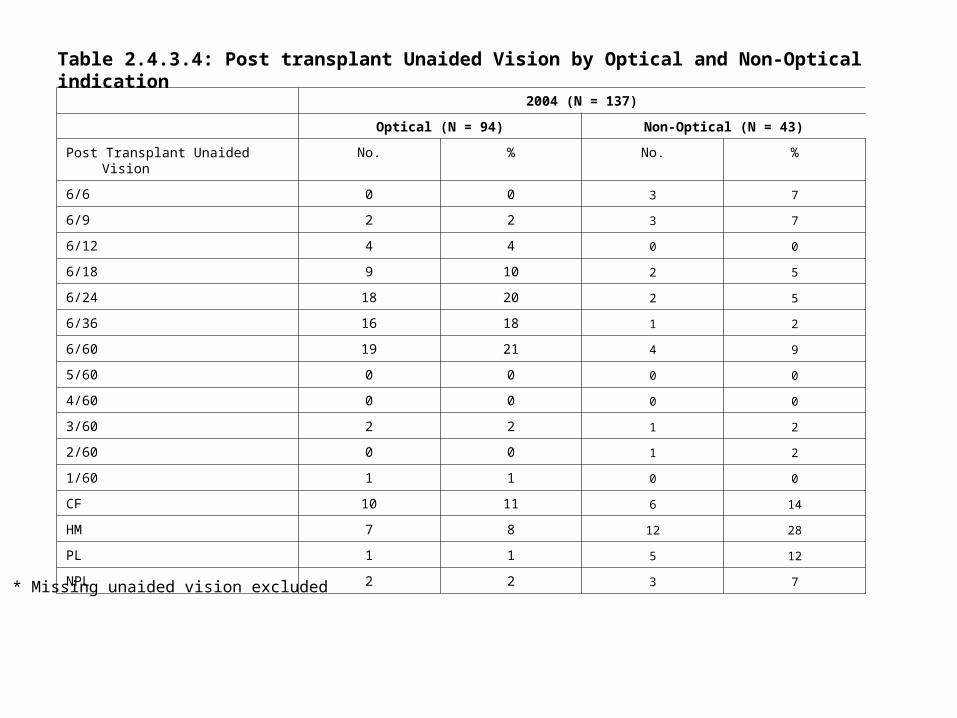
Table 2.4.3.4: Post transplant Unaided Vision by Optical and Non-Optical indication
2004 (N = 137)
Optical (N = 94) Non-Optical (N = 43)
Post Transplant Unaided Vision No. % No. %
6/6 0 0 3 7
6/9 2 2 3 7
6/12 4 4 0 0
6/18 9 10 2 5
6/24 18 20 2 5
6/36 16 18 1 2
6/60 19 21 4 9
5/60 0 0 0 0
4/60 0 0 0 0
3/60 2 2 1 2
2/60 0 0 1 2
1/60 1 1 0 0
CF 10 11 6 14
HM 7 8 12 28
PL 1 1 5 12
NPL 2 2 3 7
* Missing unaided vision excluded

Figure 2.4.3.3a: Post transplant Unaided Vision by Optical indication
Percent
Unaided Vision
0
2
4
6
8
10
12
14
16
18
20
22 percent
6/66/9
6/126/18
6/246/36
6/605/60
4/603/60
2/601/60
CFHM
PLNPL

Figure 2.4.3.3b: Post transplant Unaided Vision by Non-Optical indication
Percent
Unaided Vision
0
5
10
15
20
25
30 percent
6/66/9
6/126/18
6/246/36
6/605/60
4/603/60
2/601/60
CFHM
PLNPL

Table 2.4.3.5: Factors for Post-op Best Corrected Visual Acuity of worse than 6/12
2004
No. %
Post BCVA worse than 6/12 21 47
Factors
High astigmatism 4 20
Glaucoma 1 5
Retinal Detachment 0 0
Cataract 4 20
Cornea Decompensation 2 10
DM Retinopathy 0 0
Others 5 25
No data 7 35
*Patient with BCVA worse than 6/12 might have more than one factor

Table 2.5.1: Stock and Flow
2004
No. %
Total no. of cornea transplants performed 184 100
No. of cornea transplants on follow-up 150 82
No. of outcome with complete data set 79 43
Table 2.5.2: Post transplant complications
2004
No. %
Any complications 47 59
Complications Epithelial Problem 7 15
Wound Dehiscence 1 2
Suture infiltration / abscess 4 9
Endophthalmitis 0 0
Microbial keratitis 6 13
Vascularisation 5 11
Post-keratoplasty glaucoma 13 28
Graft Rejection 8 17
No data 18 38
* Each patient may have more than one complication

Table 2.5.3: Post transplant graft rejection types
2004
No. %
Graft Rejection 8 10
Types Epithelial 2 25
Stromal 1 13
Endothelial 5 63
No data 1 13
* Each patient may have more than one type of rejection


![Bone marrow transplants for cancer (other than …...An autologous or allogeneic (ablative and non-myeloablative [mini-transplant]) hematopoietic stem cell transplantation, single](https://img.dokumen.tips/doc/110x75/5f0ea6807e708231d440431f/bone-marrow-transplants-for-cancer-other-than-an-autologous-or-allogeneic-ablative.jpg)