Embed Size (px)
Citation preview

61English Edition No.42 July 2014
Technical Reports
constant during a shift. During this part of the shift, the deceleration is constant. This results in the engine speed decelerating from 3900 rpm to 900 rpm. The speed change results in an inertia torque. If the dynamometer inertia and engine inertia are the same (top Chart), no compensation is required. The bottom chart shows where the dynamometer inertia is twice the engine inertia and the need to add compensation torque.
Engine torque pulse simulationFigure 10 shows an 8 cylinder engine running at 2000 rpm, part throttle with a mean torque of 118 nm. The mean torque is not shown on this display. Only the torque pulses are shown. We clearly see 8 distinct pulses, one combustion event in each cylinder, over the 720 degrees (two crankshaft rotations). To produce 118 Nm of mean torque, we must produce 145 Nm of firing pulses.
Validation of simulation to real engine dataValidation of the engine simulation is crucial to the acceptance of the algorithm. A comparison between in instrumented crankshaft in a 4 cylinder gasoline engine (bottom chart) and the engine simulation (top chart) is shown in Figure 11. The correlation between simulation and the engine is excellent with the matching of firing order frequencies and closeness in amplitude.
Table 1 shows the amplitude of the spectral components of the engine simulation and the real engine. Inconsistent f i r ing and cer tain torsional resonances f rom the transmission present in the measured data may attribute for the minor differences.
Startup/shut down simulation including HEV startThe typical startup profile for an engine is shown below. Id le speed , crank speed and thei r ramp rates a re controlled. After cranking for a fixed period of time, the speed ramps up to idle speed and the idle speed controller takes over. Torque limits are placed on both cranking and idling. HEV startup for hybrids is easily parameterized by adjusting these parameters to shorter time intervals.Engine shutdown/coast is controlled by the ignition, engine map near zero speed and the StandStillSpeed value. The engine map determines what torque is applied to cause the engine to stop. The StandStillSpeed value
145 Nm peak-to-peak
Figure 10
Figure 11
Idle Speed
Zero Speed
Standstill Speed
Figure 13
Idle Speed
CrankSpeed
Crank Time
Idle rampRate
Figure 12
Table 1
Real Engine Simulation
40 hz 37 nm 37 nm
80 hz 23 nm 30 nm
120 hz 8 nm 15 nm
120 hz 8 nm 15 nm
160 hz 5 nm 7 nm
200 hz 3.7 nm 5 nm
240 hz 1.4 nm 2.5
280 hz 1.1 nm 2
320 hz 0.9 nm 1.5

62 English Edition No.42 July 2014
Feature ArticleApplication
Testing Electrified Drivetrains for Vehicles without the Battery or Engine.
determines when the dyno command is zeroed.
Figure 14 shows engine startup simulation with ETPS (engine torque pulse simulation) turned on. Note that for all engine simulation, torque pulses can be turned on or off. If turned off, then only mean engine torque is simulated. The engine first cranks for a short time after which the engine starts firing and accelerates to idle speed. Prior to firing and during cranking, engine torque pulses are the result of pumping forces in the engine.
Special requirements for dynamometer motors and drives for engine simulation
The dynamometer needs a proper torque to inertia ratio to accomplish > 50,000 RPM/sec accelerations and sub millisecond current rise times required for engine torque pulse simulation. Physical rotor properties (inertia and stiffness) must have first a torsional natural frequency > 600 Hz when connected to the transmission under test. Additionally, in vehicle engine position is duplicated by the tilt and height adjustment of the support base.
Figure 15 pictures a 0.084 kg-m2 inertia, 800 Nm peak torque, engine simulation dynamometer designated as Dynas TP260
Battery simulation for HEV transmissions and drivetrains
HEV drivetrains require a battery or a battery simulator to test the electric motor. Horiba provides a battery simulator to provide the power to operate the HEV motor. The battery simulator consists of a power source to supply DC power and the software to simulate battery conditions and control the supply of voltage and current from the power source. Interface cabinets connect the power source to the customer specif ic HEV electric motor controller (PCU, TPIM, other).
Demand for power, current, voltage, or power + additional current can be used to simulate battery operating modes. The battery simulator simulates realistic battery output current, output voltage, power, state of charge (SOC[6]), pack temperature, cell/module temperature difference, power limit, pack resistance, and capacity. Battery pack life (new, 5 years old, 10 years old) is simulated by adjustments to capacity and slew rates.A battery pack is configured based on cell chemistry and the number of cells placed in series and parallel. Any nominal voltage, power, or capacity can be configured. Figure 16 is a high level block diagram of the VB system.
Different battery technologies simulationA number of HEV battery pack models incorporating chemistries such as Li-Ion, LiFePO4, NiMH, and Lead Acid AGM [7] are supported by the battery simulation sof tware. In addition, interfaces to simulate RLC (resistor-inductor-capacitor) based custom, user defined, battery models are provided.
Engine starts firing
Engine Speed Yellow
Crank pumping torque
Engine Torque RED Crank angle blue
Figure 14
OptionalBattery
PowerSource
Disconnect HEVInterfaceEnclosure
BatterySimulation
HEVController
Battery SimulatorPower source
Figure 16
Figure 15
63English Edition No.42 July 2014
Technical Reports
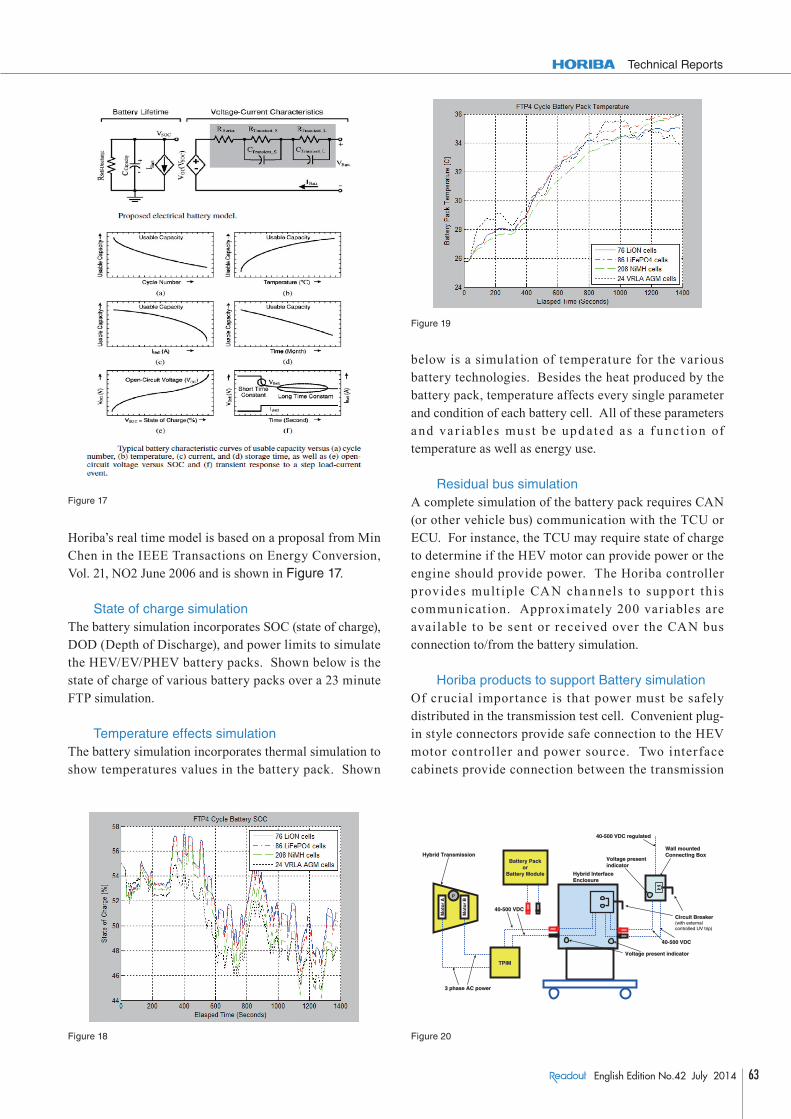
Horiba’s real time model is based on a proposal from Min Chen in the IEEE Transactions on Energy Conversion, Vol. 21, NO2 June 2006 and is shown in Figure 17.
State of charge simulationThe battery simulation incorporates SOC (state of charge), DOD (Depth of Discharge), and power limits to simulate the HEV/EV/PHEV battery packs. Shown below is the state of charge of various battery packs over a 23 minute FTP simulation.
Temperature effects simulationThe battery simulation incorporates thermal simulation to show temperatures values in the battery pack. Shown
below is a simulation of temperature for the various battery technologies. Besides the heat produced by the battery pack, temperature affects every single parameter and condition of each battery cell. All of these parameters and va r iables must be upd ated a s a f u nc t ion of temperature as well as energy use.
Residual bus simulationA complete simulation of the battery pack requires CAN (or other vehicle bus) communication with the TCU or ECU. For instance, the TCU may require state of charge to determine if the HEV motor can provide power or the engine should provide power. The Horiba controller provides mult iple CAN chan nels to suppor t th is communication. Approximately 200 variables are available to be sent or received over the CAN bus connection to/from the battery simulation.
Horiba products to support Battery simulationOf crucial importance is that power must be safely distributed in the transmission test cell. Convenient plug-in style connectors provide safe connection to the HEV motor controller and power source. Two interface cabinets provide connection between the transmission
Figure 17
Figure 18
Figure 19
Wall mountedConnecting BoxWall mountedConnecting Box
40-500 VDC regulated40-500 VDC regulated
Voltage presentindicatorVoltage presentindicator
Voltage present indicatorVoltage present indicator
Mo
tor
A
Mo
tor
B
Mo
tor
A
Mo
tor
B
3 phase AC power3 phase AC power
Hybrid Interface EnclosureHybrid Interface Enclosure
Circuit Breaker(with external controlled UV trip)
Circuit Breaker(with external controlled UV trip)
40-500 VDC40-500 VDC
40-500 VDC40-500 VDC
Battery Packor
Battery Module
Battery Packor
Battery Module
Hybrid TransmissionHybrid Transmission
TPIMTPIM
PP
Figure 20
64 English Edition No.42 July 2014
Feature ArticleApplication
Testing Electrified Drivetrains for Vehicles without the Battery or Engine.
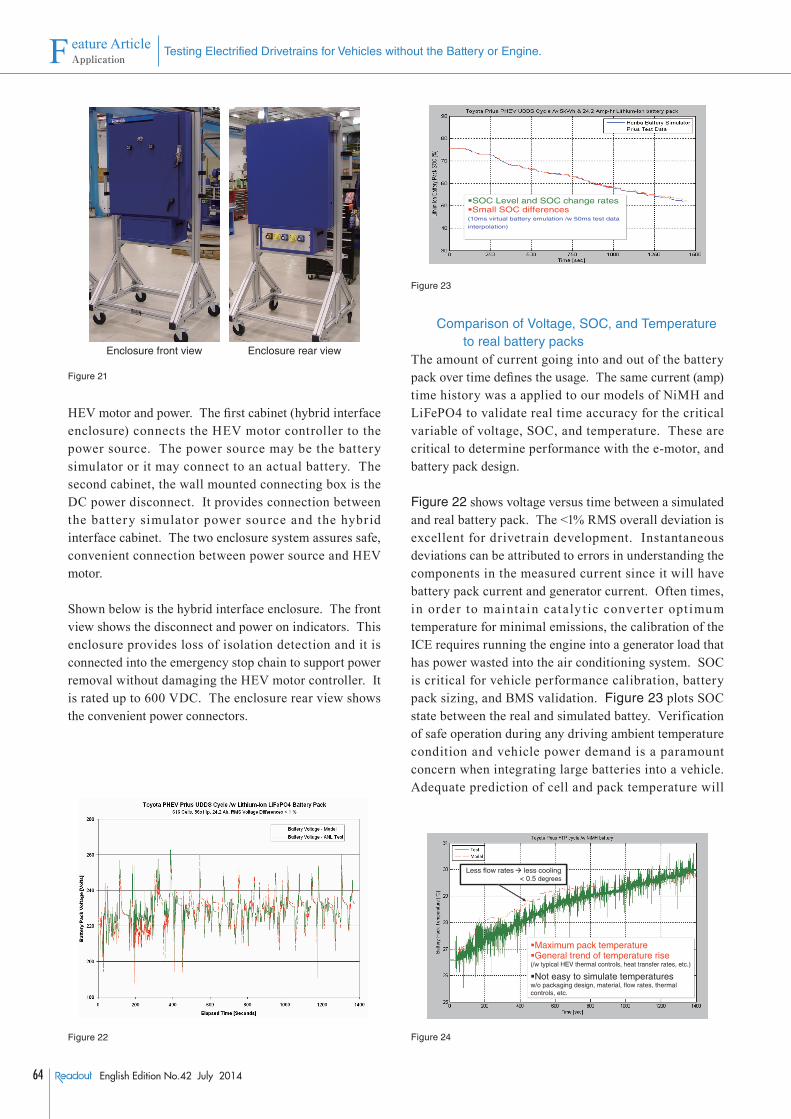
HEV motor and power. The first cabinet (hybrid interface enclosure) connects the HEV motor controller to the power source. The power source may be the battery simulator or it may connect to an actual battery. The second cabinet, the wall mounted connecting box is the DC power disconnect. It provides connection between the bat tery simulator power source and the hybrid interface cabinet. The two enclosure system assures safe, convenient connection between power source and HEV motor.
Shown below is the hybrid interface enclosure. The front view shows the disconnect and power on indicators. This enclosure provides loss of isolation detection and it is connected into the emergency stop chain to support power removal without damaging the HEV motor controller. It is rated up to 600 VDC. The enclosure rear view shows the convenient power connectors.
Comparison of Voltage, SOC, and Temperature to real battery packs
The amount of current going into and out of the battery pack over time defines the usage. The same current (amp) time history was a applied to our models of NiMH and LiFePO4 to validate real time accuracy for the critical variable of voltage, SOC, and temperature. These are critical to determine performance with the e-motor, and battery pack design.
Figure 22 shows voltage versus time between a simulated and real battery pack. The <1% RMS overall deviation is excellent for drivetrain development. Instantaneous deviations can be attributed to errors in understanding the components in the measured current since it will have battery pack current and generator current. Often times, in order to maintain cataly t ic conver ter opt imum temperature for minimal emissions, the calibration of the ICE requires running the engine into a generator load that has power wasted into the air conditioning system. SOC is critical for vehicle performance calibration, battery pack sizing, and BMS validation. Figure 23 plots SOC state between the real and simulated battey. Verification of safe operation during any driving ambient temperature condition and vehicle power demand is a paramount concern when integrating large batteries into a vehicle. Adequate prediction of cell and pack temperature will
Figure 22
Enclosure front view Enclosure rear view
Figure 21
SOC Level and SOC change ratesSmall SOC differences
(10ms virtual battery emulation /w 50ms test data
interpolation)
Figure 23
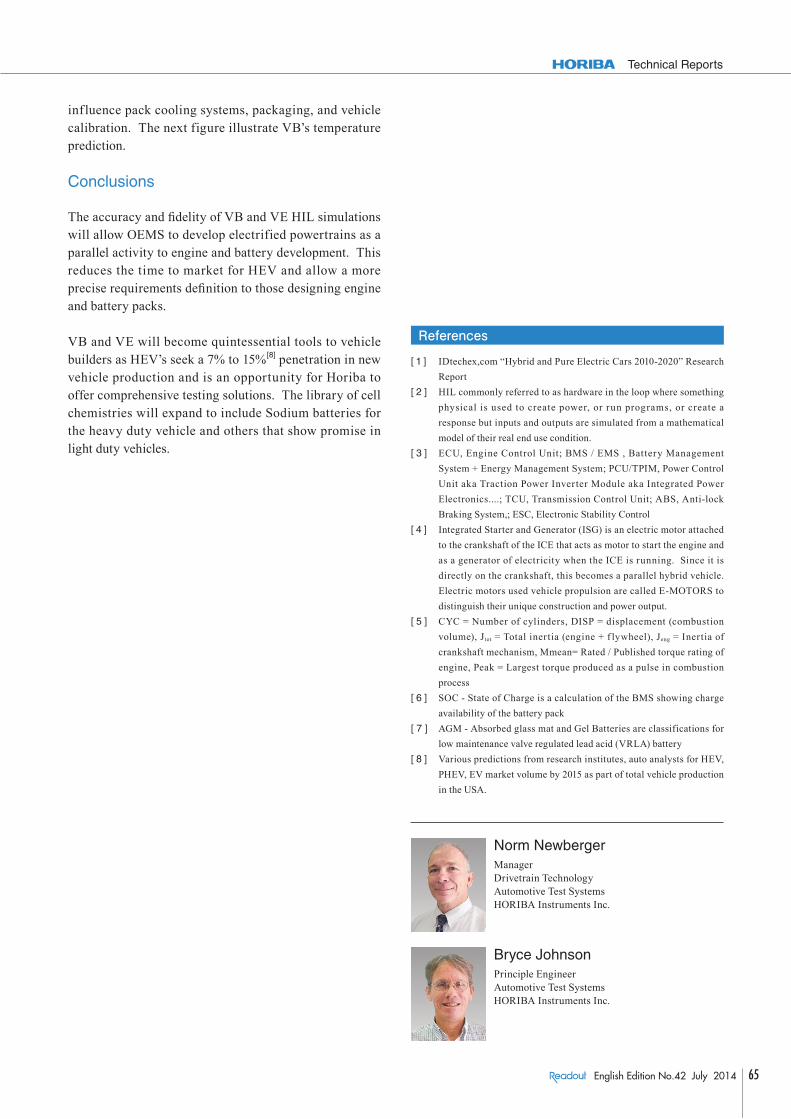
(/w typical HEV thermal controls, heat transfer rates, etc.)
Maximum pack temperatureGeneral trend of temperature rise
Not easy to simulate temperaturesw/o packaging design, material, flow rates, thermal controls, etc.
Less flow rates less cooling< 0.5 degrees
Figure 24
65English Edition No.42 July 2014
Technical Reports
influence pack cooling systems, packaging, and vehicle calibration. The next figure illustrate VB’s temperature prediction.
Conclusions
The accuracy and fi delity of VB and VE HIL simulations will allow OEMS to develop electrified powertrains as a parallel activity to engine and battery development. This reduces the time to market for HEV and allow a more precise requirements defi nition to those designing engine and battery packs.
VB and VE will become quintessential tools to vehicle builders as HEV’s seek a 7% to 15%[8] penetration in new vehicle production and is an opportunity for Horiba to offer comprehensive testing solutions. The library of cell chemistries will expand to include Sodium batteries for the heavy duty vehicle and others that show promise in light duty vehicles.
References
[ 1 ] IDtechex,com “Hybrid and Pure Electric Cars 2010-2020” Research Report
[ 2 ] HIL commonly referred to as hardware in the loop where something physical is used to create power, or run programs, or create a response but inputs and outputs are simulated from a mathematical model of their real end use condition.
[ 3 ] ECU, Engine Control Unit; BMS / EMS , Battery Management System + Energy Management System; PCU/TPIM, Power Control Unit aka Traction Power Inverter Module aka Integrated Power Electronics....; TCU, Transmission Control Unit; ABS, Anti-lock Braking System,; ESC, Electronic Stability Control
[ 4 ] Integrated Starter and Generator (ISG) is an electric motor attached to the crankshaft of the ICE that acts as motor to start the engine and as a generator of electricity when the ICE is running. Since it is directly on the crankshaft, this becomes a parallel hybrid vehicle. Electric motors used vehicle propulsion are called E-MOTORS to distinguish their unique construction and power output.
[ 5 ] CYC = Number of cylinders, DISP = displacement (combustion volume), Jtot = Total inertia (engine + f lywheel), Jeng = Inertia of crankshaft mechanism, Mmean= Rated / Published torque rating of engine, Peak = Largest torque produced as a pulse in combustion process
[ 6 ] SOC - State of Charge is a calculation of the BMS showing charge availability of the battery pack
[ 7 ] AGM - Absorbed glass mat and Gel Batteries are classifications for low maintenance valve regulated lead acid (VRLA) battery
[ 8 ] Various predictions from research institutes, auto analysts for HEV, PHEV, EV market volume by 2015 as part of total vehicle production in the USA.
Bryce JohnsonPrinciple EngineerAutomotive Test SystemsHORIBA Instruments Inc.
Norm NewbergerManagerDrivetrain TechnologyAutomotive Test SystemsHORIBA Instruments Inc.