Embed Size (px)
Citation preview

Table 1. Location 1, Porter Co., Soybean Test,Three-year Average (1995-1997).
Entry Yield Maturity Lodging PlantType and Name (1) est.(2) Date -Days score(3) height
bu./A. in.
Maturity Groups I and IIv DSR-244 61.3 * 9-25 120 1.2 29b Gen-Tech 2596 58.6 * 9-24 119 1.0 29v LG 6275 58.3 * 9-27 122 1.0 28b Callahan 4277 56.4 * 9-24 119 1.2 31v Pioneer var. 9281 56.4 * 9-25 120 1.1 27v Jack Public 56.1 * 9-28 123 1.7 38b Callahan 5290 55.4 * 9-27 122 1.3 34v DSR-277 54.6 * 9-27 122 1.1 30v DSR-250/STS 54.0 * 9-28 123 1.0 29b TS 294 Terra 53.9 * 9-26 121 1.1 33v Countrymrk 215 53.5 * 9-23 118 1.0 36b Beck 291 53.0 * 9-27 122 1.0 34v CX289 DeKalb 52.1 * 9-25 120 1.0 33v Kenwood94 Public 51.4 * 9-22 117 1.8 30b TS 253 Terra 51.4 * 9-25 120 1.0 27v Chapman Public 50.5 9-26 121 1.3 31b LP 290 50.3 9-26 121 1.1 32v Burlison Public 49.2 9-26 121 1.1 30v Archer Public 47.7 9-21 116 1.0 31
______ _____ ___ ____ ___
Grand mean 53.9 9-25 120 1.2 31BLSD (k=100) 10.1 4 4 0.3 2C.V. (%) 12.3 3 2 25.8 5
Maturity Group IIIv CX314 DeKalb 52.8 * 10-01 126 1.0 32b Beck 310 52.5 * 10-02 127 1.0 33b TS 315 Terra 52.2 * 10-02 127 1.1 34v Pioneer var. 9352 51.5 * 10-02 127 1.1 32v DSR-325 51.5 * 10-03 128 1.2 34v CX313 DeKalb 50.4 * 10-02 127 1.3 36v Probst Public 49.8 * 10-02 127 1.3 33v Thorne Public 49.6 * 10-03 128 1.1 32v DSR-350/STS 49.2 10-03 128 1.1 34v Yale Public 46.9 10-05 130 1.2 34v Resnik Public 45.9 10-01 126 1.2 34v Edison Public 45.3 10-02 127 1.1 32v Pella 86 Public 41.5 9-29 124 1.1 33v Williams 82 Public 40.1 10-05 130 2.0 39
______ _____ ___ ____ ___
Grand mean 48.5 10-02 127 1.2 34BLSD (k=100) 3.6 3 3 0.2 2C.V. (%) 7.2 3 1 24.8 5

Table 1. Location 1, Porter Co., Soybean Test,Three-year Average (1995-1997), contd.
(1) Lower case letters indicate entry type as follows:v-variety, b-brand, or m-mixture (blend).
Public entries were developed by AgriculturalExperiment Stations (Indiana AgriculturalResearch Programs) or in cooperation withthe Agricultural Research Service of theUSDA.
Proprietary names are company or brand namesgenerally associated in the trade with variety,brand or blend names.
(2) Yields followed by an asterisk (*) are not,statistically, significantly different from thehighest yield in the sub-table.
(3) 1 (erect) to 5 (flat).(Copyright 1997 Purdue Research Foundation)
Table 2. Location 1, Porter Co., Soybean Test,Two-year Average (1996-1997).
Entry Yield Maturity Lodging PlantType and Name (1) est.(2) Date -Days score(3) height
bu./A. in.Maturity Groups I and IIv LG 6275 61.0 * 9-30 123 1.0 25v DSR-300 61.0 * 10-01 124 1.3 30v DSR-277 57.3 * 9-30 122 1.0 27v DSR-244 57.2 * 9-27 120 1.0 26b Gen-Tech 2596 57.0 * 9-27 120 1.0 27v DSR-246/STS 56.5 * 9-29 122 1.0 26v Jack Public 56.3 * 10-01 124 1.8 35b Callahan 7282 55.3 * 9-28 121 1.0 26v Pioneer var. 9281 55.2 * 9-28 120 1.0 25b Callahan 5290 55.1 * 9-30 122 1.4 31v DSR-250/STS 55.0 * 10-01 123 1.0 26v Countrymrk 297 54.9 * 10-02 124 1.3 32b Callahan 4277 53.8 * 9-28 120 1.1 29v CX289 DeKalb 53.7 * 9-28 121 1.0 32b Beck 291 53.6 * 10-01 123 1.0 31b LP 290 53.3 9-30 122 1.0 30v CX267 DeKalb 52.3 9-28 121 1.1 29b TS 294 Terra 51.7 9-29 122 1.1 30b TS 253 Terra 51.4 9-29 121 1.0 24v CX278 DeKalb 51.0 9-29 122 1.1 28b BG S 292 50.9 10-01 124 1.4 31v Archer Public 50.8 9-26 118 1.0 29v Countrymrk 215 50.2 9-26 119 1.0 33v Kenwood94 Public 49.9 9-26 118 1.6 27v Countrymrk 246 48.9 9-27 120 1.4 31v Chapman Public 48.3 9-29 122 1.1 28v Burlison Public 47.3 9-28 121 1.0 28

Table 2. Location 1, Porter Co., Soybean Test,Two-year Average (1996-1997), contd.
Entry Yield Maturity Lodging PlantType and Name (1) est.(2) Date -Days score(3) height
bu./A. in
Maturity Groups I and II, continued______ _____ ___ ____ ___
Grand mean 53.7 9-29 121 1.1 29BLSD (k=100) 7.5 ns ns 0.6 3C.V. (%) 7.1 4 2 23.3 5
Maturity Group IIIb AgraTech AT 324 55.2 * 10-09 132 1.3 33v CX314 DeKalb 52.4 * 10-06 128 1.0 31b BG S 339 52.4 * 10-09 131 1.0 30b Beck 310 52.2 * 10-05 127 1.0 30b Beck 334 52.1 * 10-08 130 1.0 31b TS 315 Terra 51.8 * 10-05 128 1.0 31b Beck 342 51.8 * 10-09 132 1.0 29v Gold. Hrv. H-1337 51.5 * 10-08 130 1.0 31v DSR-325 51.4 * 10-08 130 1.0 31b TS 357 Terra 51.4 * 10-09 132 1.0 29b TS 364 Terra 51.3 * 10-07 130 1.0 28v Gold. Hrv. H-1351 51.3 * 10-08 131 1.0 28v DSR-314/STS 51.0 10-07 129 1.0 30v Pioneer var. 9306 50.9 10-04 126 1.0 27v Probst Public 50.2 10-06 129 1.1 29v Pioneer var. 9352 49.8 10-06 128 1.0 28v Athow Public 49.7 10-04 126 1.0 28v CX313 DeKalb 49.4 10-07 130 1.3 34v DSR-350/STS 49.3 10-07 129 1.0 30v Thorne Public 48.8 10-08 130 1.0 29v Yale Public 48.7 10-09 131 1.0 31v Resnik Public 45.6 10-06 128 1.0 30v Edison Public 44.7 10-06 129 1.0 28v Pella 86 Public 41.7 10-03 125 1.0 30v Williams 82 Public 40.9 10-09 131 1.9 35
______ _____ ___ ____ ___
Grand mean 49.8 10-07 129 1.1 30BLSD (k=100) 4.1 5 5 0.2 2C.V. (%) 7.5 3 2 15.5 5

Table 2. Location 1, Porter Co., Soybean Test,Two-year Average (1996-1997), contd.
(1) Lower case letters indicate entry type as follows:v-variety, b-brand, or m-mixture (blend).
Public entries were developed by AgriculturalExperiment Stations (Indiana AgriculturalResearch Programs) or in cooperation withthe Agricultural Research Service of theUSDA.
Proprietary names are company or brand namesgenerally associated in the trade with variety,brand or blend names.
(2) Yields followed by an asterisk (*) are not,statistically, significantly different from thehighest yield in the sub-table.
(3) 1 (erect) to 5 (flat).(Copyright 1997 Purdue Research Foundation)
Table 3. Location 1, Porter Co., 1997 SoybeanTest
Entry Yield Maturity Lodging PlantType and Name (1) est.(2) Date -Days score(3) height
bu./A. in.
Maturity Groups I and IIv LG 6275 75.1 * 9-26 136 1.0 27v DSR-300 71.8 * 9-28 138 1.5 35v DSR-277 71.0 * 9-26 136 1.0 32b TS 266 Terra 70.8 * 9-22 132 1.0 28b TS 277 Terra 69.3 9-24 134 1.0 28b Garst D284 68.6 9-23 133 1.3 32b Garst D278 68.5 9-24 134 1.0 29b LP 282 68.4 9-27 137 1.0 32b Beck 281 67.9 9-26 136 1.3 34v Pioneer var. 9281 67.8 9-20 130 1.0 27v DSR-244 67.7 9-21 131 1.0 28b Diener DB 289 67.5 9-26 136 1.0 31b Gen-Tech 2596 67.4 9-19 129 1.0 28v DSR-250/STS 67.3 9-26 136 1.0 29b TS 253 Terra 67.2 9-21 131 1.0 27v DSR-246/STS 67.1 9-23 133 1.0 29v LG 6279 66.6 9-24 134 1.0 32b Callahan 7282 65.6 9-23 133 1.0 29v Flint Public 65.2 9-23 133 1.5 29b BG S 252 65.2 9-27 137 1.0 34v Jack Public 64.8 9-27 137 2.0 39v Countrymrk HT2383 64.5 9-19 129 1.3 32v CX267 DeKalb 64.2 9-23 133 1.3 32b Callahan 5290 63.9 9-25 135 1.0 33

Table 3. Location 1, Porter Co., 1997 Soybean Test, contined .Entry Yield Maturity Lodging PlantType and Name (1) est.(2) Date -Days score(3) height
bu./A. in.Maturity Groups I and II, continuedv DSR-293/RR 63.8 9-23 133 1.3 31b Callahan 4277 63.5 9-20 130 1.3 32b BG S 292 63.5 9-26 136 1.0 33v DSR-271/RR 63.2 9-22 132 1.0 30v CX278 DeKalb 62.9 9-24 134 1.3 33b LP 261 62.8 9-26 136 1.0 36b LP 290 62.2 9-25 135 1.0 34v CX289 DeKalb 62.2 9-25 135 1.0 35v Sandusky Public 61.9 9-25 135 1.3 33b Beck 291 61.9 9-25 135 1.0 35b TS 294 Terra 61.7 9-25 135 1.3 34b LP 250 61.5 9-23 133 1.3 28b Gen-Tech 2995 61.4 9-24 134 1.0 35v Countrymrk 297 61.4 9-28 138 1.5 36v Kenwood94 Public 61.1 9-17 127 1.8 32v Countrymrk 215 60.8 9-18 128 1.0 37v Chapman Public 60.2 9-22 132 1.3 31v Archer Public 58.3 9-17 127 1.0 32v Countrymrk 246 56.9 9-19 129 1.3 34v Burlison Public 56.0 9-21 131 1.0 30
______ _____ ___ ____ ___
Grand mean 64.8 9-23 133 1.2 32BLSD (k=100) 5.4 2 2 0.5 2C.V. (%) 5.9 3 1 26.9 4Maturity Group IIIb Gen-Tech 3597 77.6 * 10-03 143 1.0 35b Diener DB 336 76.9 * 10-03 143 1.0 34b TS 317 Terra 76.1 * 9-28 138 1.0 31b Callahan 6330 75.7 * 10-04 144 1.0 34v Pioneer var. 93B82 74.8 * 10-02 142 1.0 33b LP 333 74.3 * 10-03 143 1.0 34v Pioneer var. 93B41 72.8 * 9-28 138 1.0 30b AgraTech AT 324 70.8 10-03 143 1.3 37v Gold. Hrv. H-1362 70.3 10-04 144 1.3 37b Callahan 7317 70.2 9-27 137 1.0 32v Gold. Hrv. H-1316 70.1 9-28 138 1.0 32b Beck 351 69.0 10-01 141 1.0 35v Gold. Hrv. H-1365 69.0 10-05 145 1.0 37b Beck 386 68.8 10-04 144 1.0 33b TS 364T Terra 68.0 9-30 140 1.3 34b Beck 310 67.5 9-27 137 1.0 34v CX348 DeKalb 67.5 10-02 142 1.0 32b BG S 339 67.2 10-04 144 1.0 36b LP 331 67.0 10-02 142 1.0 35b TS 364 Terra 67.0 10-02 142 1.0 31v CX314 DeKalb 66.9 9-26 136 1.0 34

Table 3. Location 1, Porter Co., 1997Soybean Test, contined.
Entry Yield Maturity Lodging PlantType and Name (1) est.(2) Date -Days score(3) height
bu./A. in.Maturity Group III, continuedb Beck 334 66.8 10-01 141 1.0 35b Beck 342 66.7 10-02 142 1.0 33v Pioneer var. 9306 66.4 9-27 137 1.0 30v CX313 DeKalb 66.4 9-30 140 1.0 38v Rupp RS 2535 66.2 9-27 137 1.0 34v Gold. Hrv. H-1337 66.2 9-30 140 1.0 36v DSR-314/STS 65.8 9-28 138 1.0 34v Thorne Public 65.6 9-30 140 1.0 34v Gold. Hrv. H-1351 65.5 10-02 142 1.0 33v DSR-325 64.9 10-02 142 1.0 35b TS 357 Terra 64.8 10-03 143 1.0 32v Pioneer var. 9352 64.7 9-28 138 1.0 32b LP 311 64.6 9-26 136 1.0 34v DSR-350/STS 64.3 9-29 139 1.0 34b TS 315 Terra 64.2 9-26 136 1.0 35v Probst Public 64.2 9-28 138 1.3 33b S 363 Corn Belt 63.5 9-29 139 1.0 35v Athow Public 63.2 9-26 136 1.0 31b Diener DB 304 62.9 9-27 137 1.0 34v Defiance Public 62.0 9-26 136 1.0 33v Yale Public 61.4 10-04 144 1.0 36v Edison Public 61.3 9-29 139 1.0 33v CX368 DeKalb 60.4 9-30 140 1.3 35v IA 3005 Public 59.6 9-29 139 1.0 33v Resnik Public 59.0 9-26 136 1.0 35v Pella 86 Public 55.6 9-26 136 1.0 33v Harper 87 Public 52.9 9-28 138 1.5 34v Williams 82 Public 51.8 10-03 143 2.0 40
______ _____ ___ ____ ___
Grand mean 66.3 9-30 140 1.1 34BLSD (k=100) 5.9 2 2 0.3 2C.V. (%) 6.6 2 1 17.0 5
Conducted on the Pinney-Purdue Agricultural Center,Wanatah.Jon D. Leuck, superintendent.
Soil type: Runnymede loam.Soil test for Maturity groups I and II: pH 6.6,
P 21 ppm (high), K 150 ppm (high).Soil test for Maturity Group III: pH 6.6, P 20 ppm (high), K 152 (very high).Date of planting: May 13, 1997.Date of harvest for Maturity Groups I and II: October
3, 1997.Date of harvest for Maturity Group III: October 10,
1997

Table 3. Location 1, Porter Co., 1997Soybean Test, contined.
(1) Lower case letters indicate entry type as follows:v-variety, b-brand, or m-mixture (blend).
Public entries were developed by AgriculturalExperiment Stations (Indiana AgriculturalResearch Programs) or in cooperation with theAgricultural Research Service of the USDA.
Proprietary names are company or brand namesgenerally associated in the trade with variety,brand, or blend names.
(2) Yields followed by an asterisk (*) are not,statistically, significantly different from thehighest yield in the sub-table.
(3) 1 (erect) to 5 (flat).(Copyright 1997 Purdue Research Foundation)
Table 4. Location 2, Tippecanoe Co., SoybeanTest, Three-year Average (1995-1997).
Entry Yield Maturity Lodging PlantType and Name (1) est.(2) Date -Days score(3) height
bu./A. in.
Maturity Group IIv Pioneer var. 9281 52.8 * 9-20 106 1.0 31v DSR-277 52.7 * 9-22 108 1.0 30b TS 253 Terra 51.9 * 9-19 105 1.1 28b Beck 292 51.1 * 9-23 109 1.2 32b M-9528 51.0 * 9-21 107 1.1 34v LG 6298 51.0 * 9-23 109 1.1 34b Callahan 5290 51.0 * 9-23 109 1.0 34v Trisoy 2971 50.9 * 9-20 105 1.2 33v CX289 DeKalb 49.3 * 9-22 107 1.2 34v Chapman Public 49.1 * 9-21 107 1.0 30b TS 294 Terra 49.0 * 9-21 106 1.1 32v Jack Public 47.0 9-21 107 1.3 39v Burlison Public 45.9 9-22 108 1.1 30v Kenwood94 Public 45.4 9-16 102 1.1 30v Archer Public 41.4 9-16 102 1.0 32
______ _____ ___ ____ ___
Grand mean 49.3 9-21 106 1.1 32BLSD (k=100) 4.2 4 4 ns 4C.V. (%) 8.8 3 1 20.7 8
Maturity Group IIIv Pioneer var. 9352 51.6 * 9-25 110 1.0 32b AgraTech AT 362 51.1 * 9-28 113 1.1 36v DSR-325 50.6 * 9-26 111 1.2 34v Trisoy 3252 50.5 * 9-25 110 1.0 32b Beck 310 50.3 * 9-25 110 1.0 33

Table 4. Location 2, Tippecanoe Co., SoybeanTest, Three-year Average (1995-1997).continued
Entry Yield Maturity Lodging PlantType and Name (1) est.(2) Date -Days score(3) height
bu./A. in.
Maturity Group III, continuedv DSR-317 50.0 * 9-28 113 1.4 38v DSR-373 49.6 * 9-28 113 1.0 34v Yale Public 49.1 * 9-28 113 1.0 33v CX377 DeKalb 48.9 * 9-29 114 1.0 37b P.S.F. 368A 48.7 * 9-28 113 1.0 36b TS 315 Terra 48.5 * 9-24 109 1.0 32v Probst Public 48.4 * 9-26 111 1.0 31v DSR-370/STS 48.4 * 9-29 114 1.6 40v Thorne Public 48.1 * 9-26 111 1.0 32v CX314 DeKalb 48.0 * 9-24 109 1.0 31v Edison Public 47.7 9-28 113 1.0 31v Resnik Public 47.4 9-25 110 1.0 31b P.S.F. 350N 47.4 9-28 113 1.0 34v CX313 DeKalb 47.3 9-24 109 1.1 34v CX368 DeKalb 46.6 9-28 113 1.0 33v Williams 82 Public 43.3 9-30 115 1.4 39v Pella 86 Public 41.2 9-22 107 1.0 32
______ _____ ___ ____ ___
Grand mean 48.3 9-27 112 1.1 34BLSD (k=100) 3.7 2 2 0.5 2C.V. (%) 7.9 2 1 20.1 6
(1) Lower case letters indicate entry type as follows:v-variety, b-brand, or m-mixture (blend).
Public entries were developed by AgriculturalExperiment Stations (Indiana AgriculturalResearch Programs) or in cooperation withthe Agricultural Research Service of theUSDA.
Proprietary names are company or brand namesgenerally associated in the trade with variety,brand or blend names.
(2) Yields followed by an asterisk (*) are not,statistically, significantly different from thehighest yield in the sub-table.
(3) 1 (erect) to 5 (flat).(Copyright 1997 Purdue Research Foundation)

Table 5. Location 2, Tippecanoe Co., SoybeanTest Two-year Average(1996-1997).
Entry Yield Maturity Lodging PlantType and Name (1) est.(2) Date -Days score(3) height
bu./A. in.Maturity Group IIv DSR-300 54.1 * 9-26 112 1.0 31v DSR-277 52.7 * 9-24 110 1.0 27v Pioneer var. 9281 51.5 * 9-21 107 1.0 29v CX278 DeKalb 51.4 * 9-22 108 1.0 31v LG 6298 51.4 * 9-25 111 1.1 31b M-9528 51.3 * 9-23 109 1.0 31b Callahan 5290 50.9 * 9-24 110 1.0 30b Beck 292 50.5 * 9-25 111 1.3 29v Trisoy 2971 50.3 * 9-21 107 1.1 30b TS 253 Terra 50.2 * 9-20 106 1.1 26b TS 294 Terra 50.0 * 9-23 109 1.1 30b Callahan 7282 49.8 * 9-22 108 1.0 30b BG S 292 49.8 * 9-26 112 1.1 30b Callahan 4277 49.4 * 9-20 106 1.1 30b P.S.F. 286 49.1 * 9-25 111 1.1 29v CX289 DeKalb 48.5 * 9-23 109 1.3 32v Countrymrk 297 48.5 * 9-27 113 1.0 30v Chapman Public 47.9 * 9-22 108 1.0 28v Jack Public 47.4 * 9-22 108 1.0 35b P.S.F. 256 47.1 * 9-23 109 1.0 30v Countrymrk 246 46.1 * 9-19 105 1.1 30v Burlison Public 45.3 * 9-23 109 1.1 27v Kenwood94 Public 44.7 9-19 105 1.1 28v Archer Public 43.2 9-19 105 1.0 29
______ _____ ___ ____ ___
Grand mean 49.2 9-23 109 1.1 30BLSD (k=100) 9.2 5 5 ns 7C.V. (%) 9.3 3 1 22.3 9Maturity Group IIIb Beck 395 59.2 * 10-03 119 1.0 30v Pioneer var. 9306 59.1 * 9-24 110 1.1 28b Callahan 7317 58.7 * 9-26 111 1.0 27b Beck 419 58.7 * 10-04 120 1.3 37b Parke 3696 56.8 * 10-01 116 1.0 29b Garst D331 56.6 * 9-26 112 1.0 30b AgraTech AT 324 56.5 * 10-01 116 1.4 33v Countrymrk 376 56.0 * 9-28 114 1.1 29v Trisoy 3252 55.9 * 9-28 114 1.0 30b Beck 342 55.6 * 10-01 116 1.0 29v DSR-317 55.4 * 10-02 117 1.6 37v DSR-325 55.0 * 9-29 115 1.3 32v Trisoy 3450 55.0 * 9-29 114 1.1 35b AgraTech AT 362 54.9 * 10-01 116 1.1 33b Beck 310 54.8 * 9-28 113 1.0 30

Table 5. Location 2, Tippecanoe Co., SoybeanTest Two-year Average(1996-1997)continued.
Entry Yield Maturity Lodging PlantType and Name (1) est.(2) Date -Days score(3) height
bu./A. in.
Maturity Group III, continuedb Callahan 6330 54.7 * 9-29 114 1.3 29b TS 364 Terra 54.3 * 9-30 116 1.0 28b BG S 339 54.3 * 10-02 118 1.0 30b TS 357 Terra 54.2 9-30 115 1.0 29v Pioneer var. 9352 54.0 9-28 113 1.0 30v DSR-314/STS 53.5 9-28 114 1.1 30b TS 315 Terra 53.0 9-26 112 1.0 30v DSR-373 53.0 9-30 116 1.0 32b P.S.F. 368A 53.0 10-01 117 1.0 34v CX314 DeKalb 52.9 9-27 112 1.0 29b M-9733 52.6 9-28 114 1.0 31v Thorne Public 52.5 9-29 115 1.0 30b P.S.F. 376 52.4 10-03 118 1.1 32v DSR-370/STS 52.2 10-02 118 1.5 38b Beck 334 51.8 9-28 113 1.0 31v Probst Public 51.7 9-28 113 1.0 29v CX377 DeKalb 51.6 10-02 118 1.0 35v CX368 DeKalb 51.4 9-30 116 1.0 31v Yale Public 51.3 9-30 115 1.0 31b P.S.F. 350N 51.1 10-01 116 1.0 32v Athow Public 51.0 9-27 112 1.0 27v CX313 DeKalb 51.0 9-27 113 1.1 32v Countrymrk 347 51.0 9-30 115 1.4 34v Resnik Public 50.5 9-28 113 1.0 29v Edison Public 50.5 9-30 116 1.0 29v Gold. Hrv. H-1322 50.2 9-27 113 1.0 30v Williams 82 Public 45.9 10-02 118 1.3 36v Pella 86 Public 44.4 9-25 110 1.0 30
______ _____ ___ ____ ___
Grand mean 53.4 9-29 115 1.1 31BLSD (k=100) 5.0 3 3 ns 3C.V. (%) 7.1 2 1 22.3 6
(1) Lower case letters indicate entry type as follows:v-variety, b-brand, or m-mixture (blend).
Public entries were developed by Agricultural Experiment Stations (Indiana Agricultural Research Programs) or incooperation with the Agricultural Research Service of the USDA.
Proprietary names are company or brand namesgenerally associated in the trade with variety,brand or blend names

Table 5. Location 2, Tippecanoe Co., SoybeanTest Two-year Average(1996-1997)continued.
(2) Yields followed by an asterisk (*) are not,statistically, significantly different from thehighest yield in the sub-table.
(3) 1 (erect) to 5 (flat).(Copyright 1997 Purdue Research Foundation)
Table 6. Location 2, Tippecanoe Co.,1997 Soybean Test.
Entry Yield Maturity Lodging PlantType and Name (1) est.(2) Date -Days score(3) height
bu./A. in.Maturity Group IIb TS 277 Terra 62.0 * 9-16 117 1.0 27v LG 6298 60.7 * 9-20 121 1.0 29b CFS 290 60.1 * 9-18 119 1.0 25v Sandusky Public 59.7 * 9-16 117 1.0 31v Trisoy 2971 58.9 * 9-15 116 1.0 29b Parke 3096 58.4 * 9-20 121 1.0 29v DSR-300 58.0 * 9-20 121 1.0 31v Pioneer var. 9281 57.5 * 9-15 116 1.0 25v DSR-277 57.5 * 9-18 119 1.0 29v Countrymrk 297 57.3 * 9-19 120 1.0 30v CX267 DeKalb 56.9 * 9-12 113 1.0 31v Trisoy 2770 56.9 * 9-17 118 1.0 25b BG S 292 56.7 * 9-20 121 1.0 30v Countrymrk HT2383 56.5 * 9-12 113 1.0 30b Beck 281 56.4 * 9-18 119 1.0 30v CX278 DeKalb 56.3 9-15 116 1.0 28b M-9528 56.2 9-17 118 1.0 31b Callahan 5290 56.1 9-17 118 1.0 32b BG S 312 55.9 9-20 121 1.0 34b Adler 270 55.8 9-15 116 1.0 28b TS 266 Terra 55.3 9-15 116 1.0 25b Beck 292 55.2 9-18 119 1.0 30v CX289 DeKalb 54.9 9-17 118 1.0 32b M-9728 54.7 9-19 120 1.0 28v Jack Public 54.4 9-18 119 1.0 37b P.S.F. 256 54.4 9-18 119 1.0 32b TS 253 Terra 54.3 9-13 114 1.0 24b Callahan 7282 54.2 9-15 116 1.0 29v Flint Public 53.5 9-15 116 1.0 27v DSR-293/RR 53.5 9-16 117 1.0 30b TS 294 Terra 52.6 9-17 118 1.0 29v Chapman Public 52.2 9-16 117 1.0 29v DSR-271/RR 51.8 9-15 116 1.0 30b P.S.F. 286 51.4 9-19 120 1.0 28

Table 6. Location 2, Tippecanoe Co.,1997 Soybean Test, continued.
Entry Yield Maturity Lodging PlantType and Name (1) est.(2) Date -Days score(3) height
bu./A. in.Maturity Group II, continuedb Callahan 4277 51.2 9-14 115 1.0 30v Countrymrk 215 50.5 9-12 113 1.0 33v Burlison Public 50.0 9-16 117 1.0 28v Kenwood94 Public 49.9 9-12 113 1.0 28v Countrymrk 246 48.1 9-12 113 1.0 30v Archer Public 45.7 9-07 108 1.0 29
______ _____ ___ ____ ___
Grand mean 55.0 9-16 117 1.0 29BLSD (k=100) 5.7 1 1 ns 2C.V. (%) 6.9 2 1 5
Maturity Group IIIv Gold. Hrv. H-1316 63.2 * 9-21 121 1.0 26v Pioneer var. 93B82 63.2 * 9-24 124 1.0 31v Gold. Hrv. H-1383 62.4 * 9-29 129 1.0 30b TS 317 Terra 62.3 * 9-19 119 1.0 28v LG 6395 62.2 * 9-27 127 1.0 28v Pioneer var. 9306 62.1 * 9-16 116 1.0 27v CX348 DeKalb 61.9 * 9-23 123 1.0 29b Garst D331 61.6 * 9-19 119 1.0 30b Garst D308 61.4 * 9-17 117 1.0 25v Countrymrk 376 61.3 * 9-24 124 1.0 29b Callahan 7317 60.7 * 9-19 119 1.0 27b Diener DB 336 60.7 * 9-24 124 1.0 30v Gold. Hrv. H-1394 60.7 * 9-28 128 1.0 30b TS 364 Terra 60.6 * 9-26 126 1.0 29v Pioneer var. 93B41 60.5 * 9-22 122 1.0 29b Parke 3696 60.5 * 9-24 124 1.0 31b Beck 351 60.3 * 9-24 124 1.0 30b Beck 395 60.3 * 9-28 128 1.0 29b AgraTech AT 335 60.2 * 9-23 123 1.0 29b P.S.F. 317 59.8 * 9-20 120 1.0 30b Beck 419 59.7 * 9-28 128 1.0 35v Pioneer var. 9352 59.1 * 9-22 122 1.0 29b P.S.F. 327 59.1 * 9-23 123 1.0 29v CX399 DeKalb 58.9 * 9-26 126 1.0 34b Adler 332 58.8 * 9-23 123 1.0 30v Trisoy 3672 58.8 * 9-23 123 1.0 31b P.S.F. 368A 58.8 * 9-25 125 1.0 34v Gold. Hrv. H-1365 58.8 * 9-26 126 1.0 32v Trisoy 3450 58.5 * 9-22 122 1.0 32b AgraTech AT 324 58.5 * 9-23 123 1.0 32v LG 6369 58.5 * 9-23 123 1.0 30v DSR-325 58.4 * 9-22 122 1.0 32

Table 6. Location 2, Tippecanoe Co.,1997 Soybean Test, continued.
Entry Yield Maturity Lodging PlantType and Name (1) est.(2) Date -Days score(3) height
bu./A. in.Maturity Group III, continuedb TS 364T Terra 58.4 * 9-23 123 1.0 29b Beck 342 58.2 * 9-24 124 1.0 29b M-9439 58.2 * 9-24 124 1.0 36v Trisoy 3252 58.1 * 9-22 122 1.0 29b BG S 345 58.1 * 9-23 123 1.0 33v DSR-317 57.8 9-25 125 1.0 34v DSR-370/STS 57.8 9-27 127 1.0 38b TS 315 Terra 57.6 9-20 120 1.0 29v Gold. Hrv. H-1322 57.6 9-22 122 1.0 31v DSR-314/STS 57.2 9-20 120 1.0 30v Countrymrk HT322 57.2 9-22 122 1.0 30v CX377 DeKalb 57.2 9-26 126 1.0 32b Beck 386 57.2 9-27 127 1.0 31v CX314 DeKalb 57.1 9-19 119 1.0 29b BG S 339 57.1 9-26 126 1.0 30b Parke 3296 57.0 9-23 123 1.0 29b AgraTech AT 362 56.8 9-26 126 1.0 32b Diener DB 377 56.7 9-29 129 1.0 31v Countrymrk 347 56.6 9-23 123 1.0 32b CFS 333 56.3 9-21 121 1.0 31b P.S.F. 337N 56.3 9-22 122 1.0 33b S 363 Corn Belt 56.3 9-22 122 1.0 31v Countrymrk 365 55.8 9-25 125 1.0 30b P.S.F. 376 55.8 9-26 126 1.0 31b Adler 356 55.8 9-28 128 1.0 31b Diener DB 304 55.7 9-20 120 1.0 29b M-9733 55.7 9-21 121 1.0 31b Callahan 6330 55.7 9-23 123 1.0 27b Beck 310 55.6 9-21 121 1.0 29v IA 3005 Public 55.4 9-23 123 1.0 29v Probst Public 55.2 9-20 120 1.0 29v Thorne Public 55.2 9-22 122 1.0 30v DSR-373 55.1 9-22 122 1.0 33b P.S.F. 350N 55.1 9-24 124 1.0 33v CX368 DeKalb 55.0 9-24 124 1.0 31v Yale Public 55.0 9-25 125 1.0 33b TS 357 Terra 54.8 9-23 123 1.0 28b M-Resister 54.8 9-25 125 1.0 31b CFS 325 54.7 9-18 118 1.0 25v Resnik Public 54.5 9-20 120 1.0 29v Rupp RS 2535 54.5 9-21 121 1.0 27b AgraTech AT 310 54.1 9-19 119 1.0 30b Beck 334 54.1 9-21 121 1.0 31v Edison Public 53.8 9-23 123 1.0 29v CX313 DeKalb 53.7 9-22 122 1.0 31

Table 6. Location 2, Tippecanoe Co.,1997 Soybean Test, continued.
Entry Yield Maturity Lodging PlantType and Name (1) est.(2) Date -Days score(3) height
bu./A. in.
Maturity Group III, continuedv Athow Public 51.7 9-19 119 1.0 26v Williams 82 Public 50.4 9-27 127 1.0 36v Harper 87 Public 50.3 9-22 122 1.0 29b P.S.F. 312 50.2 9-18 118 1.0 28v Defiance Public 48.6 9-18 118 1.0 29v Pella 86 Public 46.1 9-16 116 1.0 28
______ _____ ___ ____ ___
Grand mean 57.3 9-23 123 1.0 30BLSD (k=100) 5.2 1 1 ns 2C.V. (%) 6.1 2 1 6
Conducted on the Purdue University AgronomyResearch Center, Lafayette.James J. Beaty III, superintendent.
Soil type: Chalmers clay loam.Soil test for Maturity Group II: pH 6.4, P 9 ppm
(low), K 115 ppm (high).Soil test for Maturity Group III: pH 6.2, P 13 ppm
(medium), K 184 ppm (very high).Date of planting for Maturity Group II: May 22,
1997.Date of planting for Maturity Group III: May 23,
1997.Date of harvest for Maturity Group II: September 26,
1997.Date of harvest for Maturity Group III: October 4,
1997.(1) Lower case letters indicate entry type as follows:
v-variety, b-brand, or m-mixture (blend).Public entries were developed by Agricultural Experiment Stations (Indiana Agricultural Research Programs) or in
cooperation with the Agricultural Research Service of the USDA.Proprietary names are company or brand names
generally associated in the trade with variety,brand or blend names.
(3) Yields followed by an asterisk (*) are not,statistically, significantly different from thehighest yield in the sub-table.
(3) 1 (erect) to 5 (flat).(Copyright 1997 Purdue Research Foundation)

Table 7. Location 2, Tippecanoe Co., 1997Transgenic (Roundup Ready®)Soybean Test.
Entry Yield Maturity Lodging PlantType and Name (1) est.(2) Date -Days score(3) height
bu./A. in.
Ranked by yieldb Beck 302RR 55.2 * 9-21 130 1.0 36v DSR-351/RR 54.1 * 9-22 131 1.0 31b Beck 390RR 50.8 * 9-26 135 1.3 34v DSR-271/RR 49.9 9-12 121 1.0 30b Beck 340RR 49.2 9-20 129 1.0 36b Beck 370RR 48.0 9-24 133 1.6 37v DSR-293/RR 46.0 9-13 122 1.1 32
______ _____ ___ ____ ___
Grand mean 50.5 9-20 129 1.1 34BLSD (k=100) 5.1 3 3 0.3 4C.V. (%) 9.4 6 2 25.9 11
Conducted on the Purdue University Agronomy Research Center, Lafayette.James J. Beaty III, superintendent.
Soil type: Chalmers clay loam.Soil test: pH 6.0, P 17 ppm (high), K 158 ppm
(very high).Date of planting: May 14, 1997.Date of harvest: October 1, 1997.Roundup Ready® is a trademark of Monsanto
Company.(1) Lower case letters indicate entry type as follows:
v-variety, b-brand, or m-mixture (blend).Public entries were developed by Agricultural
Experiment Stations (Indiana AgriculturalResearch Programs) or in cooperation withthe Agricultural Research Service of theUSDA.
Proprietary names are company or brand namesgenerally associated in the trade with variety,brand, or blend names.
(2) Yields followed by an asterisk (*) are not,statistically, significantly different from thehighest yield in the sub-table.
(3) 1 (erect) to 5 (flat).(Copyright 1997 Purdue Research Foundation)
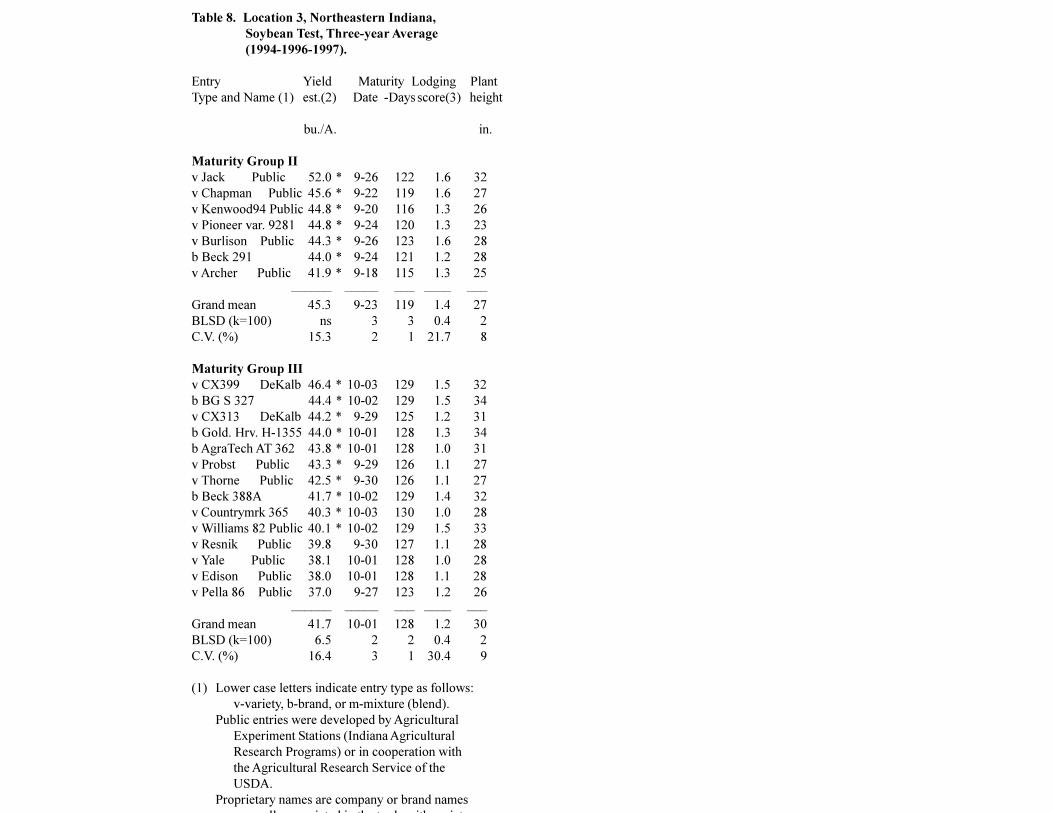
Table 8. Location 3, Northeastern Indiana,Soybean Test, Three-year Average(1994-1996-1997).
Entry Yield Maturity Lodging PlantType and Name (1) est.(2) Date -Days score(3) height
bu./A. in.
Maturity Group IIv Jack Public 52.0 * 9-26 122 1.6 32v Chapman Public 45.6 * 9-22 119 1.6 27v Kenwood94 Public 44.8 * 9-20 116 1.3 26v Pioneer var. 9281 44.8 * 9-24 120 1.3 23v Burlison Public 44.3 * 9-26 123 1.6 28b Beck 291 44.0 * 9-24 121 1.2 28v Archer Public 41.9 * 9-18 115 1.3 25
______ _____ ___ ____ ___
Grand mean 45.3 9-23 119 1.4 27BLSD (k=100) ns 3 3 0.4 2C.V. (%) 15.3 2 1 21.7 8
Maturity Group IIIv CX399 DeKalb 46.4 * 10-03 129 1.5 32b BG S 327 44.4 * 10-02 129 1.5 34v CX313 DeKalb 44.2 * 9-29 125 1.2 31b Gold. Hrv. H-1355 44.0 * 10-01 128 1.3 34b AgraTech AT 362 43.8 * 10-01 128 1.0 31v Probst Public 43.3 * 9-29 126 1.1 27v Thorne Public 42.5 * 9-30 126 1.1 27b Beck 388A 41.7 * 10-02 129 1.4 32v Countrymrk 365 40.3 * 10-03 130 1.0 28v Williams 82 Public 40.1 * 10-02 129 1.5 33v Resnik Public 39.8 9-30 127 1.1 28v Yale Public 38.1 10-01 128 1.0 28v Edison Public 38.0 10-01 128 1.1 28v Pella 86 Public 37.0 9-27 123 1.2 26
______ _____ ___ ____ ___
Grand mean 41.7 10-01 128 1.2 30BLSD (k=100) 6.5 2 2 0.4 2C.V. (%) 16.4 3 1 30.4 9
(1) Lower case letters indicate entry type as follows:v-variety, b-brand, or m-mixture (blend).
Public entries were developed by AgriculturalExperiment Stations (Indiana AgriculturalResearch Programs) or in cooperation withthe Agricultural Research Service of theUSDA.
Proprietary names are company or brand namesll i t d i th t d ith i t

Table 8. Location 3, Northeastern Indiana,Soybean Test, Three-year Average(1994-1996-1997), continued.
(2) Yields followed by an asterisk (*) are not,statistically, significantly different from thehighest yield in the sub-table.
(3) 1 (erect) to 5 (flat).(Copyright 1997 Purdue Research Foundation)
Table 9. Location 3, Northeastern Indiana,Soybean Test, Two-year Average(1996-1997).
Entry Yield Maturity Lodging PlantType and Name (1) est.(2) Date -Days score(3) height
bu./A. in.Maturity Group IIv Jack Public 52.0 * 9-29 119 1.3 29v Countrymrk 297 49.1 * 10-01 121 1.1 26v DSR-300 46.7 * 9-30 120 1.0 24b TS 294 Terra 43.9 * 9-28 118 1.0 25v Burlison Public 43.6 * 10-02 122 1.4 25v Chapman Public 42.5 * 9-26 116 1.4 24v Countrymrk 246 42.0 * 9-25 115 1.0 26v Kenwood94 Public 40.6 * 9-24 114 1.3 23v Archer Public 39.3 * 9-22 112 1.1 23v Pioneer var. 9281 39.3 * 9-28 118 1.1 20b Beck 291 38.5 * 9-29 119 1.0 25
______ _____ ___ ____ ___
Grand mean 43.4 9-28 118 1.2 25BLSD (k=100) 16.0 5 5 ns 3C.V. (%) 16.3 3 1 23.5 9
Maturity Group IIIb Beck 419 50.0 * 10-08 128 1.1 33v Countrymrk 347 47.6 * 10-05 125 1.3 28v CX351 DeKalb 46.1 * 10-06 126 1.0 28b Callahan 7383 45.8 * 10-07 127 1.0 25v CX368 DeKalb 45.4 * 10-06 126 1.0 26v DSR-370/STS 44.9 * 10-07 127 1.5 31b AgraTech AT 324 44.4 * 10-06 126 1.3 27b BG S 339 44.2 * 10-07 127 1.1 28v CX399 DeKalb 43.7 * 10-07 127 1.4 30v Gold. Hrv. H-1310 43.6 * 10-05 125 1.1 27v Probst Public 43.3 * 10-04 124 1.1 25b BG S 327 42.7 * 10-07 127 1.4 31b Callahan 6330 42.2 * 10-05 125 1.5 26b Callahan 7317 41.7 * 10-01 121 1.0 24v CX313 DeKalb 41.4 * 10-03 123 1.1 29b AgraTech AT 362 41.2 * 10-05 125 1.0 29

Table 9. Location 3, Northeastern Indiana,Soybean Test, Two-year Average(1996-1997), continued.
Entry Yield Maturity Lodging PlantType and Name (1) est.(2) Date -Days score(3) height
bu./A. in.
Maturity Group III, continuedb Gold. Hrv. H-1355 41.2 * 10-06 126 1.4 31v DSR-325 40.7 * 10-05 125 1.5 28b S 393 Corn Belt 40.7 * 10-06 126 1.1 27b Beck 342 40.7 * 10-06 126 1.0 25v Pioneer var. 9352 40.3 * 10-05 125 1.0 24v Resnik Public 39.7 * 10-04 124 1.1 27v CX375 DeKalb 39.4 * 10-06 126 1.0 27v Thorne Public 39.3 * 10-05 125 1.1 27b TS 364 Terra 39.0 * 10-06 126 1.0 22b TS 315 Terra 38.7 * 10-04 124 1.0 26b Beck 388A 38.7 * 10-06 126 1.5 30v Countrymrk 365 38.4 * 10-06 126 1.0 26v Williams 82 Public 38.1 * 10-08 128 1.5 31v Pioneer var. 9306 37.3 * 9-30 120 1.0 23v Athow Public 36.1 * 10-02 122 1.0 24v Yale Public 35.8 * 10-06 126 1.0 26v Gold. Hrv. H-1351 35.5 * 10-06 126 1.0 24b Beck 310 35.2 * 10-02 122 1.0 26b TS 357 Terra 34.7 * 10-05 125 1.0 24v Edison Public 33.5 * 10-05 125 1.0 26v Pella 86 Public 33.4 * 10-01 121 1.1 24b Beck 395 32.1 * 10-05 125 1.0 22
______ _____ ___ ____ ___
Grand mean 40.4 10-05 125 1.1 27BLSD (k=100) ns 3 3 ns 3C.V. (%) 18.5 2 1 31.6 10
(1) Lower case letters indicate entry type as follows:v-variety, b-brand, or m-mixture (blend).
Public entries were developed by AgriculturalExperiment Stations (Indiana AgriculturalResearch Programs) or in cooperation withthe Agricultural Research Service of theUSDA.
Proprietary names are company or brand namesgenerally associated in the trade with variety,brand or blend names.
(2) Yields followed by an asterisk (*) are not,statistically, significantly different from thehighest yield in the sub-table.
(3) 1 (erect) to 5 (flat).

Table 10. Location 3, Randolph Co., 1997Soybean Test.
Entry Yield Maturity Lodging PlantType and Name (1) est.(2) Date -Days score(3) height
bu./A. in.Maturity Group IIv Countrymrk 297 57.9 * 9-22 133 1.0 22v Jack Public 56.7 * 9-22 133 1.0 25v DSR-300 53.0 * 9-24 135 1.0 21b Garst D284 51.0 * 9-18 129 1.0 21v Countrymrk HT2383 49.6 * 9-17 128 1.0 22b Beck 281 49.0 * 9-23 134 1.0 21v Burlison Public 47.0 * 9-22 133 1.0 21v Chapman Public 46.0 * 9-20 131 1.0 19b TS 294 Terra 45.9 * 9-22 133 1.0 20b TS 277 Terra 45.8 * 9-22 133 1.0 19v Countrymrk 246 45.2 * 9-17 128 1.0 22b TS 266 Terra 45.2 * 9-19 130 1.0 18b Garst D278 44.7 9-21 132 1.0 21b Callahan 7282 43.2 9-22 133 1.0 20b Callahan 5290 43.0 9-21 132 1.0 20v LG 6279 42.8 9-20 131 1.0 19v Sandusky Public 42.5 9-22 133 1.0 20v Kenwood94 Public 40.8 9-17 128 1.0 19v Flint Public 40.7 9-22 133 1.0 21v Archer Public 39.9 9-13 124 1.0 20v Pioneer var. 9281 35.6 9-21 132 1.0 16b Beck 291 35.0 9-23 134 1.0 19v Countrymrk 215 34.7 9-18 129 1.0 21
______ _____ ___ ____ ___
Grand mean 45.0 9-20 131 1.0 20BLSD (k=100) 12.8 1 1 ns 3C.V. (%) 17.1 2 1 9
Maturity Group IIIv Countrymrk 347 55.7 * 9-28 139 1.0 25b Beck 419 55.3 * 10-02 143 1.0 27v CX351 DeKalb 52.8 * 9-30 141 1.0 26b Callahan 7383 52.3 * 10-01 142 1.0 23v CX368 DeKalb 51.5 * 9-29 140 1.0 23v DSR-370/STS 51.0 * 9-30 141 1.0 29b Beck 386 50.6 * 9-30 141 1.0 24b Davis D327 50.0 * 10-01 142 1.0 28v Gold. Hrv. H-1386 49.8 * 10-01 142 1.0 28b AgraTech AT 324 48.9 * 9-29 140 1.0 23b BG S 339 48.5 * 9-30 141 1.0 27v LG 6353 47.7 * 9-27 138 1.0 24b TS 364T Terra 47.5 * 9-28 139 1.0 24b BG S 337 46.7 * 9-30 141 1.0 25v Countrymrk HT322 45.9 * 9-28 139 1.0 22v CX348 DeKalb 45.9 * 9-30 141 1.0 23

Table 10. Location 3, Randolph Co., 1997 Soybean Test, continued.Entry Yield Maturity Lodging PlantType and Name (1) est.(2) Date -Days score(3) height
bu./A. in.Maturity Group III, continuedv Probst Public 45.2 * 9-26 137 1.0 23v Gold. Hrv.H-1310 45.2 * 9-28 139 1.0 25v Defiance Public 44.8 * 9-27 138 1.0 23v CX399 DeKalb 44.8 * 9-30 141 1.0 24b Callahan 6330 43.6 * 9-29 140 1.0 21v Rupp RS 2535 43.0 * 9-27 138 1.0 22b Gold. Hrv. H-1355 42.5 * 9-29 140 1.0 28b AgraTech AT 362 42.4 * 9-30 141 1.0 26b BG S 327 42.3 * 10-01 142 1.0 28b Callahan 7317 42.1 * 9-24 135 1.0 20b Garst D331 42.0 * 9-25 136 1.0 23b Beck 342 41.6 * 9-29 140 1.0 22v Pioneer var. 93B82 41.4 9-28 139 1.0 20v Countrymrk 365 39.7 9-29 140 1.0 23b S 393 Corn Belt 39.6 9-29 140 1.0 23b Garst D308 39.3 9-22 133 1.0 20v CX313 DeKalb 39.3 9-27 138 1.0 25b Davis D351 39.2 9-29 140 1.0 22b TS 364 Terra 39.2 9-30 141 1.0 19v Resnik Public 39.0 9-26 137 1.0 22v Thorne Public 38.9 9-27 138 1.0 24v LG 6324 38.6 9-28 139 1.0 23v CX375 DeKalb 38.3 9-29 140 1.0 23v Williams 82 Public 37.9 10-03 144 1.0 27v Pioneer var. 9352 37.8 9-29 140 1.0 21v DSR-325 37.7 9-28 139 1.0 24b SC 376 SeedCnslts 37.1 9-28 139 1.0 24b Beck 351 36.7 9-23 134 1.0 19b AgraTech AT 310 36.0 9-25 136 1.0 21b Beck 388A 35.2 9-29 140 1.0 25b S 363 Corn Belt 34.8 9-26 137 1.0 23b Davis D315 34.2 9-23 134 1.0 19b TS 315 Terra 33.7 9-27 138 1.0 23v Yale Public 33.1 9-29 140 1.0 24b TS 317 Terra 32.6 9-26 137 1.0 20v Gold. Hrv. H-1351 31.9 9-29 140 1.0 21v Pioneer var. 9306 31.5 9-23 134 1.0 19b Beck 395 31.4 9-30 141 1.0 20v IA 3005 Public 31.2 9-27 138 1.0 20b AgraTech AT 335 31.0 9-29 140 1.0 22b TS 387 Terra 30.6 9-30 141 1.0 20v LG 6395 30.4 9-30 141 1.0 20v Athow Public 30.3 9-23 134 1.0 22b AgraTech AT 345 30.0 9-27 138 1.0 20b TS 357 Terra 29.2 9-28 139 1.0 21

Table 10. Location 3, Randolph Co., 1997Soybean Test, continued.
Entry Yield Maturity Lodging PlantType and Name (1) est.(2) Date -Days score(3) height
bu./A. in.
Maturity Group III, continuedv Edison Public 29.2 9-28 139 1.0 23v Pioneer var. 93B41 28.1 9-26 137 1.0 19v Pella 86 Public 27.6 9-23 134 1.0 18b Beck 310 26.8 9-27 138 1.0 22v Harper 87 Public 20.9 9-28 139 1.0 20
______ _____ ___ ____ ___
Grand mean 39.7 9-28 139 1.0 23BLSD (k=100) 14.2 2 2 ns 3C.V. (%) 23.2 3 1 10
Conducted on the Davis-Purdue Agricultural Center,Farmland.Jeffrey L. Boyer, superintendent.
Soil type: Blount silty clay loam.Soil test for Maturity Group II: pH 5.8, P 32 ppm
(very high), K 117 ppm (high).Soil test for Maturity Group III: pH 6.0, P 27 ppm
(very high), K 94 ppm (medium).Date of planting for Maturity Groups II and III: May
12, 1997.Date of harvest for Maturity Groups II and III:
October 6, 1997.(1) Lower case letters indicate entry type as follows:
v-variety, b-brand, or m-mixture (blend).Public entries were developed by Agricultural
Experiment Stations (Indiana AgriculturalResearch Programs) or in cooperation withthe Agricultural Research Service of theUSDA.
Proprietary names are company or brand namesgenerally associated in the trade with variety,brand or blend names.
(2) Yields followed by an asterisk (*) are not,statistically, significantly different from thehighest yield in the sub-table.
(3) 1 (erect) to 5 (flat).(Copyright 1997 Purdue Research Foundation)

Table 11. Location 4, Daviess Co., Soybean Test,Three-year Average (1995-1996-1997).
Entry Yield Maturity Lodging PlantType and Name (1) est.(2) Date -Days score(3) height
bu./A. in.Maturity Group IIIv Pioneer var. 9362 33.0 * 9-27 113 1.0 24b AgraTech AT 362 27.0 9-25 111 1.0 23b Beck 419 25.4 9-28 114 1.0 25v CX399 DeKalb 25.3 9-27 112 1.0 24v Pioneer var. 9352 25.2 9-27 112 1.0 22v Countrymrk 396 25.0 9-27 112 1.0 23v Resnik Public 23.9 9-27 113 1.0 21v Countrymrk 365 23.9 9-28 114 1.0 22v Yale Public 22.7 9-26 111 1.0 24v Edison Public 22.5 9-27 113 1.0 23v Probst Public 22.4 9-25 110 1.0 23v Williams 82 Public 22.1 9-27 113 1.1 25v Thorne Public 21.2 9-26 112 1.0 21v Pella 86 Public 18.7 9-26 112 1.0 21
______ _____ ___ ____ ___
Grand mean 24.2 9-27 112 1.0 23BLSD (k=100) 4.2 3 3 ns 2C.V. (%) 14.6 4 2 7.7 9
Maturity Group IVv Stressland Public 31.3 * 9-29 115 1.0 28v LG 6437c 31.3 * 10-01 117 1.0 26b TS 474 Terra 30.4 * 10-04 120 1.1 27b Beck 454 28.6 * 9-30 116 1.0 26b AgraTech AT 415 28.5 * 9-29 115 1.0 23v Countrymrk 426 25.3 * 10-01 117 1.0 26v Flyer Public 24.5 * 9-29 115 1.0 25v Spencer Public 22.4 9-30 115 1.0 23
______ _____ ___ ____ ___
Grand mean 27.8 9-30 116 1.0 26BLSD (k=100) 7.0 6 6 ns 3C.V. (%) 18.6 3 2 10.1 9(1) Lower case letters indicate entry type as follows:
v-variety, b-brand, or m-mixture (blend).Public entries were developed by Agricultural
Experiment Stations (Indiana AgriculturalResearch Programs) or in cooperation withthe Agricultural Research Service of theUSDA.
Proprietary names are company or brand namesgenerally associated in the trade with variety,brand or blend names.
(2) Yields followed by an asterisk (*) are not,statistically significantly different from the

Table 12. Location 4, Daviess Co., Soybean Test, Two-year Average (1996-1997).Entry Yield Maturity Lodging PlantType and Name (1) est.(2) Date -Days score(3) height
bu./A. in.Maturity Group IIIv Pioneer var. 9362 32.3 * 10-01 116 1.0 19b BG S 339 27.0 * 10-02 117 1.0 18v Countrymrk 376 26.5 * 10-02 117 1.0 17b TS 364 Terra 26.1 * 10-03 118 1.0 17b AgraTech AT 362 25.5 * 9-30 115 1.0 17b Callahan 7383 25.2 10-02 117 1.0 16v CX399 DeKalb 25.1 10-01 116 1.0 18v Gold. Hrv. H-1383 23.5 10-02 117 1.0 16b Beck 419 23.5 10-03 118 1.0 18v Countrymrk 396 23.2 10-02 117 1.0 17v LG 6395 22.4 10-03 118 1.0 16v Gold. Hrv. H-1394 22.3 10-03 118 1.0 17v Pioneer var. 9352 21.8 9-30 115 1.0 17v Resnik Public 21.7 10-01 116 1.0 16v Countrymrk 347 21.7 10-01 116 1.0 18v Williams 82 Public 21.6 10-01 116 1.0 18b G-392 Great Heart 21.6 10-03 118 1.0 16v Countrymrk 365 21.5 10-02 117 1.0 16v Edison Public 21.5 10-02 117 1.0 17b Beck 395 21.5 10-02 117 1.0 15v Athow Public 20.7 10-01 116 1.0 16v Yale Public 20.5 10-01 116 1.0 18v Probst Public 20.2 9-30 115 1.0 17v Pella 86 Public 18.0 10-02 117 1.0 16v Thorne Public 17.5 9-30 115 1.0 15
______ _____ ___ ____ ___
Grand mean 22.9 10-02 117 1.0 17BLSD (k=100) 7.0 3 3 ns 3C.V. (%) 17.4 2 1 10Maturity Group IVv LG 6437c 33.4 * 10-04 119 1.0 21b TS 474 Terra 31.9 * 10-09 124 1.0 22v Stressland Public 31.3 * 10-01 116 1.0 22b Beck 454 27.4 * 10-05 120 1.0 21b AgraTech AT 415 26.9 * 10-01 116 1.0 19b TS 415 Terra 26.5 * 10-02 117 1.0 19b Callahan 7417 26.0 * 10-02 117 1.0 16v CX450c DeKalb 25.7 * 10-06 121 1.0 22b BG S 492 25.7 * 10-12 127 1.0 24v Flyer Public 24.8 * 10-01 116 1.0 19v Countrymrk 426 24.7 * 10-03 118 1.0 19v Spencer Public 22.4 10-03 118 1.0 17
______ _____ ___ ____ ___
Grand mean 27.2 10-04 119 1.0 20BLSD (k=100) 10.6 4 4 ns 2C.V. (%) 18.7 3 1 11

Table 12. Location 4, Daviess Co., Soybean Test,Two-year Average (1996-1997), contd.
(1) Lower case letters indicate entry type as follows: v-variety, b-brand, or m-mixture (blend).
Public entries were developed by AgriculturalExperiment Stations (Indiana AgriculturalResearch Programs) or in cooperation withthe Agricultural Research Service of theUSDA.
Proprietary names are company or brand namesgenerally associated in the trade with variety,brand or blend names.
(2) Yields followed by an asterisk (*) are not,statistically, significantly different from thehighest yield in the sub-table.
(3) 1 (erect) to 5 (flat).(Copyright 1997 Purdue Research Foundation)
Table 13. Location 4, Daviess Co., 1997Soybean Test.
Entry Yield Maturity Lodging PlantType and Name (1) est.(2) Date -Days score(3) height
bu./A. in.Maturity Group IIIv Pioneer var. 93B82 34.5 * 9-18 120 1.0 18v Pioneer var. 9362 31.0 * 9-17 119 1.0 18v CX394c DeKalb 29.3 * 9-18 120 1.0 21v Pioneer var. 93B41 28.8 * 9-17 119 1.0 18v Countrymrk HS3971 28.4 * 9-19 121 1.0 17v Countrymrk 376 27.1 9-17 119 1.0 17b TS 364 Terra 26.8 9-19 121 1.0 16v Countrymrk 396 26.7 9-18 120 1.0 16v Countrymrk 347 26.0 9-17 119 1.0 20v Gold. Hrv. H-1383 25.9 9-19 121 1.0 17v Gold. Hrv. H-1365 25.7 9-17 119 1.0 19v Defiance Public 25.5 9-15 117 1.0 19b TS 357 Terra 25.4 9-17 119 1.0 16b TS 364T Terra 25.1 9-17 119 1.0 16b Beck 419 24.2 9-19 121 1.0 19b G-370 Great Heart 24.0 9-17 119 1.0 18b BG S 339 23.9 9-18 120 1.0 17v Williams 82 Public 23.5 9-17 119 1.0 19b AgraTech AT 362 23.5 9-17 119 1.0 18b AgraTech AT 345 23.3 9-17 119 1.0 16v LG 6384c 23.2 9-18 120 1.0 17v CX377 DeKalb 23.1 9-17 119 1.0 18v CX399 DeKalb 23.0 9-17 119 1.0 18v Edison Public 22.8 9-17 119 1.0 17v Athow Public 22.7 9-16 118 1.0 17b Beck 395 22.6 9-18 120 1.0 16v Pioneer var. 9306 22.4 9-17 119 1.0 17

Table 13. Location 4, Daviess Co., 1997Soybean Test, continued.
Entry Yield Maturity Lodging PlantType and Name (1) est.(2) Date -Days score(3) height
bu./A. in.Maturity Group III, continuedb AgraTech AT 396 22.3 9-17 119 1.0 18v Yale Public 22.2 9-17 119 1.0 18v Resnik Public 22.2 9-17 119 1.0 17v Gold. Hrv. H-1394 22.2 9-18 120 1.0 17b TS 387 Terra 22.1 9-18 120 1.0 16b G-392 Great Heart 21.9 9-18 120 1.0 16b Callahan 7383 21.6 9-16 118 1.0 15v Pioneer var. 9352 21.5 9-18 120 1.0 17v Saul Miles Seed 21.3 9-16 118 1.0 17v Probst Public 21.2 9-17 119 1.0 18b Callahan 7388 21.2 9-18 120 1.0 17v LG 6395 20.9 9-17 119 1.0 16v Countrymrk 365 20.6 9-18 120 1.0 16v Thorne Public 20.0 9-16 118 1.0 15v Pella 86 Public 19.8 9-17 119 1.0 16b Diener DB 377 18.1 9-19 121 1.0 15v Harper 87 Public 17.7 9-17 119 1.0 16v IA 3005 Public 17.1 9-17 119 1.0 16
______ _____ ___ ____ ___
Grand mean 23.6 9-17 119 1.0 17BLSD (k=100) 6.6 2 2 ns 2C.V. (%) 17.7 2 1 9
Maturity Group IVv Gold. Hrv. H-1454 40.7 * 9-18 120 1.0 21v Pioneer var. 9421 35.3 * 9-17 119 1.0 21v DSR-418 34.8 * 9-18 120 1.0 22v DSR-417/RR 33.5 * 9-16 118 1.0 22v LG 6437c 32.3 * 9-18 120 1.0 20b Callahan 3484 30.5 * 9-19 121 1.0 20v Countrymrk HS4161 30.1 * 9-18 120 1.0 20b TS 415 Terra 29.5 * 9-18 120 1.0 19v CX499c DeKalb 28.8 * 9-19 121 1.0 27v Stressland Public 28.7 * 9-16 118 1.0 22b TS 474 Terra 28.6 * 9-22 124 1.0 24v Flyer Public 28.4 * 9-16 118 1.0 20b Diener DB 442c 27.6 * 9-17 119 1.0 19v Countrymrk 426 27.2 * 9-18 120 1.0 18b AgraTech AT 415 27.1 * 9-17 119 1.0 18b Callahan 6435 27.0 * 9-18 120 1.0 21v Corsica Public 26.9 * 9-16 118 1.0 21v Pioneer var. 9492 26.7 * 9-24 126 1.0 19v CX420c DeKalb 26.6 * 9-17 119 1.0 22v Omaha Public 26.6 * 9-17 119 1.0 20v CX494 DeKalb 26.6 * 9-20 122 1.0 22

Table 13. Location 4, Daviess Co., 1997Soybean Test, continued.
Entry Yield Maturity Lodging PlantType and Name (1) est.(2) Date -Days score(3) height
bu./A. in.
Maturity Group IV, continuedv CX470c DeKalb 26.5 * 9-17 119 1.0 21v CX450c DeKalb 26.1 * 9-19 121 1.0 21b Beck 454 25.9 * 9-21 123 1.0 20v Spencer Public 25.5 * 9-20 122 1.0 17b Diener DB 444c 25.4 * 9-20 122 1.0 21v David Miles Seed 25.2 * 9-18 120 1.0 21b Callahan 7417 23.7 9-17 119 1.0 16v Exodus Miles Seed 23.5 9-19 121 1.0 21b BG S 492 22.5 9-27 129 1.0 25
______ _____ ___ ____ ___
Grand mean 28.3 9-19 121 1.0 21BLSD (k=100) 15.8 1 1 ns 3C.V. (%) 23.7 2 1 10
Conducted on the Ernest E. Dyer Farm nearPlainville.Ernest E. Dyer, cooperator.
Soil type: Elston loam.Soil test for Maturity Group III: pH 6.2, P 21 ppm
(high), K 118 ppm (high).Soil test for Maturity Group IV: pH 6.0, P 18 ppm
(high), K 105 ppm (medium).Date of planting: May 21, 1997.Date of harvest for Maturity Groups III and IV: October 8, 1997.(1) Lower case letters indicate entry type as follows:
v-variety, b-brand, or m-mixture (blend).Public entries were developed by Agricultural
Experiment Stations (Indiana AgriculturalResearch Programs) or in cooperation withThe Agricultural Research Service of theUSDA.
Proprietary names are company or brand namesgenerally associated in the trade with variety,brand or blend names.
(2) Yields followed by an asterisk (*) are not,statistically, significantly different from thehighest yield in the sub-table.
(3) 1 (erect) to 5 (flat).(Copyright 1997 Purdue Research Foundation)

Table 14. Location 5, Jennings Co., Soybean Test,Three-year Average (1995-1996-1997).
Entry Yield Maturity Lodging PlantType and Name (1) est.(2) Date -Days score(3) height
bu./A. in.Maturity Group IIIb Beck 419 57.2 * 10-03 117 1.5 31v Gold. Hrv. H-1397 56.4 * 10-04 118 1.1 28b L&M Glick 314 53.9 * 10-01 116 1.5 30v Probst Public 52.9 * 9-27 111 1.2 25v Pioneer var. 9352 52.6 * 10-01 115 1.0 23b L&M Glick 365 51.2 10-02 116 1.3 29v Gold. Hrv. H-1353 51.2 10-02 117 1.3 25v CX368 DeKalb 51.1 10-01 116 1.0 27b L&M Glick 320 49.9 10-02 116 1.3 28v Edison Public 49.7 9-30 115 1.0 26v Resnik Public 48.7 9-27 112 1.1 26v Yale Public 47.9 10-01 115 1.1 27v Countrymrk 396 47.5 10-01 116 1.0 24v Countrymrk 365 47.0 10-02 117 1.0 27v Williams 82 Public 45.9 10-03 118 1.5 30v Thorne Public 44.6 9-26 111 1.3 24v Pella 86 Public 42.8 9-25 109 1.3 24
______ _____ ___ ____ ___
Grand mean 50.0 9-30 115 1.2 27BLSD (k=100) 4.8 2 2 0.5 2C.V. (%) 11.2 2 1 22.8 8Maturity Group IVb TS 474 Terra 62.4 * 10-12 126 1.9 33v Stressland Public 57.9 * 10-05 120 1.5 32b AgraTech AT 415 54.2 10-03 118 1.0 26v Flyer Public 53.1 10-03 118 1.0 29v Countrymrk 426 52.0 10-07 121 1.1 30v Spencer Public 50.0 10-06 120 1.1 28
______ _____ ___ ____ ___
Grand mean 54.9 10-06 121 1.3 30BLSD (k=100) 7.5 3 3 0.5 2C.V. (%) 11.6 2 1 20.5 7
(1) Lower case letters indicate entry type as follows:v-variety, b-brand, or m-mixture (blend).
Public entries were developed by AgriculturalExperiment Stations (Indiana AgriculturalResearch Programs) or in cooperation withThe Agricultural Research Service of theUSDA.
Proprietary names are company or brand namesgenerally associated in the trade with variety,brand or blend names
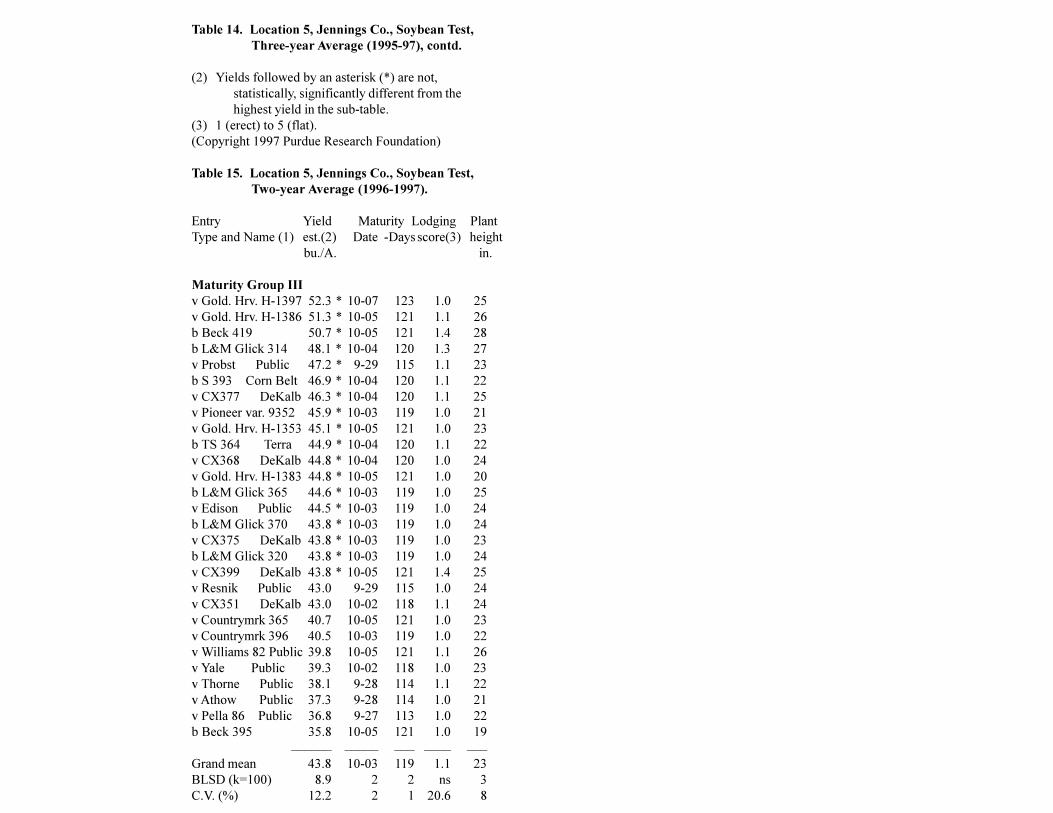
Table 14. Location 5, Jennings Co., Soybean Test,Three-year Average (1995-97), contd.
(2) Yields followed by an asterisk (*) are not,statistically, significantly different from thehighest yield in the sub-table.
(3) 1 (erect) to 5 (flat).(Copyright 1997 Purdue Research Foundation)
Table 15. Location 5, Jennings Co., Soybean Test,Two-year Average (1996-1997).
Entry Yield Maturity Lodging PlantType and Name (1) est.(2) Date -Days score(3) height
bu./A. in.
Maturity Group IIIv Gold. Hrv. H-1397 52.3 * 10-07 123 1.0 25v Gold. Hrv. H-1386 51.3 * 10-05 121 1.1 26b Beck 419 50.7 * 10-05 121 1.4 28b L&M Glick 314 48.1 * 10-04 120 1.3 27v Probst Public 47.2 * 9-29 115 1.1 23b S 393 Corn Belt 46.9 * 10-04 120 1.1 22v CX377 DeKalb 46.3 * 10-04 120 1.1 25v Pioneer var. 9352 45.9 * 10-03 119 1.0 21v Gold. Hrv. H-1353 45.1 * 10-05 121 1.0 23b TS 364 Terra 44.9 * 10-04 120 1.1 22v CX368 DeKalb 44.8 * 10-04 120 1.0 24v Gold. Hrv. H-1383 44.8 * 10-05 121 1.0 20b L&M Glick 365 44.6 * 10-03 119 1.0 25v Edison Public 44.5 * 10-03 119 1.0 24b L&M Glick 370 43.8 * 10-03 119 1.0 24v CX375 DeKalb 43.8 * 10-03 119 1.0 23b L&M Glick 320 43.8 * 10-03 119 1.0 24v CX399 DeKalb 43.8 * 10-05 121 1.4 25v Resnik Public 43.0 9-29 115 1.0 24v CX351 DeKalb 43.0 10-02 118 1.1 24v Countrymrk 365 40.7 10-05 121 1.0 23v Countrymrk 396 40.5 10-03 119 1.0 22v Williams 82 Public 39.8 10-05 121 1.1 26v Yale Public 39.3 10-02 118 1.0 23v Thorne Public 38.1 9-28 114 1.1 22v Athow Public 37.3 9-28 114 1.0 21v Pella 86 Public 36.8 9-27 113 1.0 22b Beck 395 35.8 10-05 121 1.0 19
______ _____ ___ ____ ___
Grand mean 43.8 10-03 119 1.1 23BLSD (k=100) 8.9 2 2 ns 3C.V. (%) 12.2 2 1 20.6 8

Table 15. Location 5, Jennings Co., Soybean Test,Two-year Average (1996-1997), contd.
Entry Yield Maturity Lodging PlantType and Name (1) est.(2) Date -Days score(3) height
bu./A. in.Maturity Group IVb TS 474 Terra 55.7 * 10-12 128 1.6 29v Stressland Public 55.0 * 10-07 123 1.4 28b TS 415 Terra 50.0 * 10-07 123 1.1 23b BG S 436 48.6 * 10-06 122 1.3 28b AgraTech AT 415 47.2 * 10-05 121 1.0 23v Flyer Public 45.2 10-05 121 1.0 25v Countrymrk 426 44.6 10-08 124 1.0 25v Spencer Public 43.8 10-08 124 1.0 24b Callahan 7417 41.9 10-07 123 1.0 20
______ _____ ___ ____ ___
Grand mean 48.0 10-07 123 1.2 25BLSD (k=100) 9.0 3 3 0.7 4C.V. (%) 12.3 1 1 22.4 8(1) Lower case letters indicate entry type as follows:
v-variety, b-brand, or m-mixture (blend).Public entries were developed by Agricultural
Experiment Stations (Indiana AgriculturalResearch Programs) or in cooperation withthe Agricultural Research Service of theUSDA.
Proprietary names are company or brand namesgenerally associated in the trade with variety,brand or blend names.
(2) Yields followed by an asterisk (*) are not,statistically, significantly different from thehighest yield in the sub-table.
(3) 1 (erect) to 5 (flat).(Copyright 1997 Purdue Research Foundation)
Table 16. Location 5, Jennings Co., 1997Soybean Test.
Entry Yield Maturity Lodging PlantType and Name (1) est.(2) Date -Days score(3) height
bu./A. in.
Maturity Group IIIv Pioneer var.93B82 61.2 * 9-26 134 1.0 25b Beck 351 59.2 * 9-21 129 1.0 24b SC 406 SeedCnslts 57.5 * 9-26 134 1.0 25b AgraTech AT 335 56.9 * 9-19 127 1.0 26v Gold. Hrv. H-1386 56.7 * 9-26 134 1.0 28b AgraTech AT 396 56.0 * 9-28 136 1.0 26

Table 16. Location 5, Jennings Co., 1997 Soybean Test, continued.Entry Yield Maturity Lodging PlantType and Name (1) est.(2) Date -Days score(3) height
bu./A. in.Maturity Group III, continuedv Gold. Hrv. H-1397 55.2 * 9-29 137 1.0 26v Pioneer var. 9352 54.8 * 9-25 133 1.0 22v Gold. Hrv. H-1383 54.7 * 9-28 136 1.0 21v Probst Public 54.3 * 9-21 129 1.0 25b Beck 419 52.7 * 9-26 134 1.0 28b TS 364 Terra 52.6 * 9-25 133 1.0 22v Countrymrk HS3971 51.7 9-29 137 1.0 24b Callahan 7383 51.3 9-24 132 1.0 23b Diener DB 377 51.1 9-27 135 1.0 20b Beck 386 50.4 9-26 134 1.0 23b L&M Glick 365 50.2 9-24 132 1.0 26b AgraTech AT 345 50.2 9-25 133 1.0 23v Pioneer var. 9306 49.5 9-19 127 1.0 22b L&M Glick 314 49.3 9-25 133 1.0 26b S 393 Corn Belt 49.2 9-25 133 1.0 22v LG 6395 49.1 9-26 134 1.0 21v Resnik Public 48.8 9-18 126 1.0 25v Countrymrk 347 48.6 9-23 131 1.0 25v Gold. Hrv. H-1394 48.5 9-27 135 1.0 24v Edison Public 47.7 9-23 131 1.0 25b L&M Glick 370 47.6 9-24 132 1.0 24b TS 364T Terra 47.5 9-23 131 1.0 23b L&M Glick 376 47.5 9-25 133 1.0 23v CX351 DeKalb 47.3 9-25 133 1.0 24v CX375 DeKalb 47.0 9-24 132 1.0 26v Defiance Public 46.8 9-17 125 1.0 25b L&M Glick 320 46.8 9-25 133 1.0 24v Gold. Hrv. H-1353 46.1 9-26 134 1.0 23v Pioneer var.93B41 46.0 9-19 127 1.0 21v CX377 DeKalb 45.8 9-26 134 1.0 25v Countrymrk 396 45.1 9-25 133 1.0 22v Countrymrk 365 45.0 9-25 133 1.0 23v Thorne Public 44.8 9-19 127 1.0 24v CX368 DeKalb 44.8 9-25 133 1.0 25v CX399 DeKalb 44.5 9-26 134 1.0 24v Yale Public 44.3 9-25 133 1.0 25v Williams 82 Public 44.3 9-28 136 1.0 26v IA 3005 Public 41.3 9-23 131 1.0 21b Callahan 7388 41.3 9-25 133 1.0 22b Beck 395 40.9 9-27 135 1.0 20b S 363 Corn Belt 40.8 9-18 126 1.0 23b TS 387 Terra 40.4 9-28 136 1.0 21v Harper 87 Public 40.3 9-23 131 1.0 23b TS 357 Terra 40.3 9-23 131 1.0 22v Athow Public 39.8 9-19 127 1.0 21v Pella 86 Public 38.8 9-18 126 1.0 22
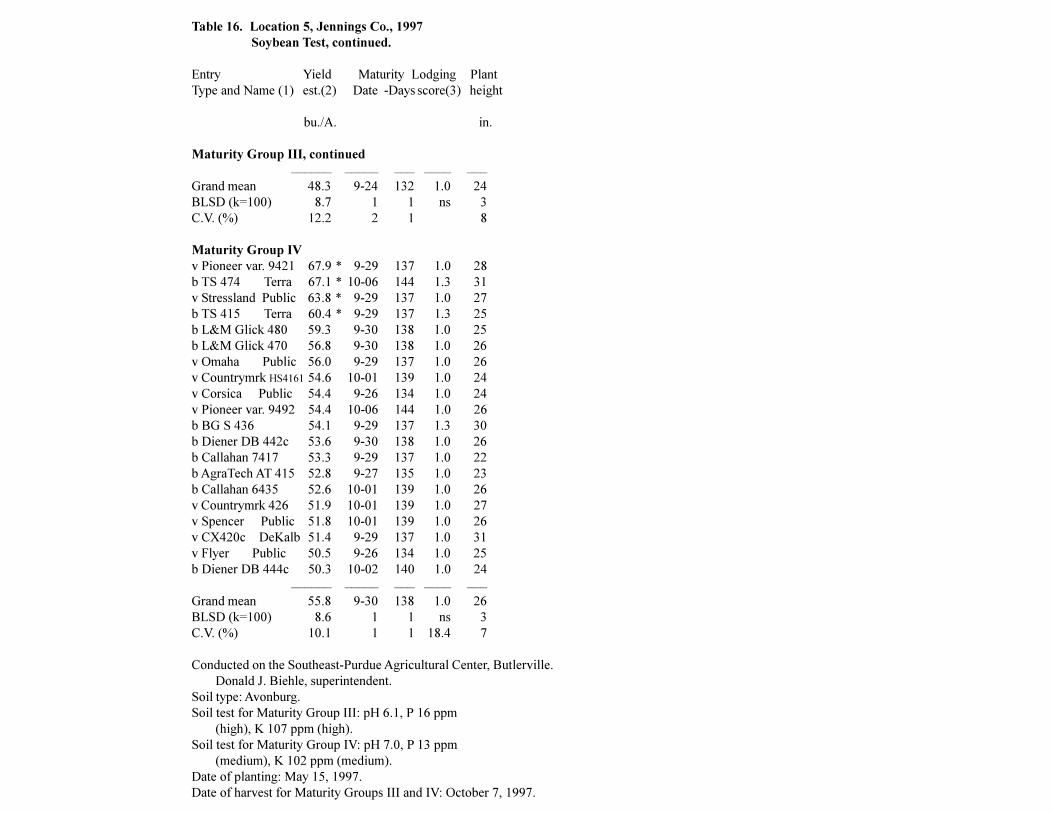
Table 16. Location 5, Jennings Co., 1997Soybean Test, continued.
Entry Yield Maturity Lodging PlantType and Name (1) est.(2) Date -Days score(3) height
bu./A. in.
Maturity Group III, continued______ _____ ___ ____ ___
Grand mean 48.3 9-24 132 1.0 24BLSD (k=100) 8.7 1 1 ns 3C.V. (%) 12.2 2 1 8
Maturity Group IVv Pioneer var. 9421 67.9 * 9-29 137 1.0 28b TS 474 Terra 67.1 * 10-06 144 1.3 31v Stressland Public 63.8 * 9-29 137 1.0 27b TS 415 Terra 60.4 * 9-29 137 1.3 25b L&M Glick 480 59.3 9-30 138 1.0 25b L&M Glick 470 56.8 9-30 138 1.0 26v Omaha Public 56.0 9-29 137 1.0 26v Countrymrk HS4161 54.6 10-01 139 1.0 24v Corsica Public 54.4 9-26 134 1.0 24v Pioneer var. 9492 54.4 10-06 144 1.0 26b BG S 436 54.1 9-29 137 1.3 30b Diener DB 442c 53.6 9-30 138 1.0 26b Callahan 7417 53.3 9-29 137 1.0 22b AgraTech AT 415 52.8 9-27 135 1.0 23b Callahan 6435 52.6 10-01 139 1.0 26v Countrymrk 426 51.9 10-01 139 1.0 27v Spencer Public 51.8 10-01 139 1.0 26v CX420c DeKalb 51.4 9-29 137 1.0 31v Flyer Public 50.5 9-26 134 1.0 25b Diener DB 444c 50.3 10-02 140 1.0 24
______ _____ ___ ____ ___
Grand mean 55.8 9-30 138 1.0 26BLSD (k=100) 8.6 1 1 ns 3C.V. (%) 10.1 1 1 18.4 7
Conducted on the Southeast-Purdue Agricultural Center, Butlerville.Donald J. Biehle, superintendent.
Soil type: Avonburg.Soil test for Maturity Group III: pH 6.1, P 16 ppm
(high), K 107 ppm (high).Soil test for Maturity Group IV: pH 7.0, P 13 ppm
(medium), K 102 ppm (medium).Date of planting: May 15, 1997.Date of harvest for Maturity Groups III and IV: October 7, 1997.

Table 16. Location 5, Jennings Co., 1997Soybean Test, continued.
(1) Lower case letters indicate entry type as follows:v-variety, b-brand, or m-mixture (blend).
Public entries were developed by AgriculturalExperiment Stations (Indiana AgriculturalResearch Programs) or in cooperation withthe Agricultural Research Service of theUSDA.
Proprietary names are company or brand namesgenerally associated in the trade with variety,brand or blend names.
(2) Yields followed by an asterisk (*) are not,statistically, significantly different from thehighest yield in the sub-table.
(3) 1 (erect) to 5 (flat).(Copyright 1997 Purdue Research Foundation)
Table 17. Location 5, Jennings Co., Soybean Test,Using No Tillage.
Entry Yield Maturity Lodging PlantType and Name (1) est.(2) Date -Days score(3) height
bu./A. in.
Three-Year Average, 1995-1996-1997b Beck 419 44.2 * 10-12 108 1.0 26v Stressland Public 43.5 * 10-12 109 1.0 28b Beck 388A 40.8 * 10-10 106 1.0 26v Williams 82 Public 39.9 * 10-11 108 1.0 27v Edison Public 38.4 10-11 107 1.0 23v Countrymrk 426 38.4 10-14 110 1.0 26v Yale Public 38.1 10-10 107 1.0 22v Flyer Public 36.7 10-11 107 1.0 25b AgraTech AT 415 36.5 10-11 108 1.0 23v Pella 86 Public 36.4 10-07 104 1.0 24v Spencer Public 35.8 10-13 110 1.0 23v Resnik Public 35.5 10-07 104 1.0 23v Countrymrk 396 35.5 10-11 108 1.0 21v Probst Public 35.2 10-07 104 1.0 21v Countrymrk 365 35.0 10-12 108 1.0 23b L&M Glick 365 34.5 10-12 108 1.0 24v Thorne Public 33.3 10-08 104 1.0 20
______ _____ ___ ____ ___
Grand mean 37.5 10-11 107 1.0 24BLSD (k=100) 5.7 2 2 ns 2C.V. (%) 10.8 2 1 8

Table 17. Location 5, Jennings Co., Soybean Test,Using No Tillage, continued.
Entry Yield Maturity Lodging PlantType and Name (1) est.(2) Date -Days score(3) height
bu./A. in.Two-Year Average, 1996-1997b Beck 419 43.4 * 10-17 107 1.0 24v Stressland Public 41.1 * 10-17 108 1.0 25b Beck 388A 40.9 * 10-16 107 1.0 24v Williams 82 Public 38.9 * 10-16 107 1.0 23v Edison Public 37.8 * 10-16 107 1.0 21v Yale Public 37.6 * 10-15 106 1.0 20v Spencer Public 37.4 * 10-18 108 1.0 21v Countrymrk 426 37.2 * 10-18 109 1.0 23v Countrymrk 365 37.0 * 10-17 107 1.0 21b AgraTech AT 415 35.8 * 10-16 107 1.0 21v Pella 86 Public 35.5 * 10-13 103 1.0 21v Flyer Public 35.3 * 10-15 106 1.0 22v Countrymrk 396 34.7 * 10-16 106 1.0 19v Probst Public 34.2 * 10-12 103 1.0 19b L&M Glick 365 34.1 * 10-16 107 1.0 21b L&M Glick 370 33.6 10-14 105 1.0 19v Athow Public 33.6 10-15 105 1.0 19v Resnik Public 33.5 10-12 103 1.0 20v Thorne Public 33.0 10-13 104 1.0 18b Beck 395 32.2 10-16 106 1.0 18
______ _____ ___ ____ ___
Grand mean 36.3 10-15 106 1.0 21BLSD (k=100) 9.6 2 2 ns 3C.V. (%) 11.9 2 1 101997 results(4)b Beck 419 50.0 * 10-15 105 1.0 28b SC 406 SeedCnslts 48.2 * 10-16 106 1.0 27b Beck 351 47.6 * 10-11 101 1.0 23v Gold. Hrv. H-1397 45.9 * 10-16 106 1.0 25v Harper 87 Public 45.5 * 10-10 100 1.0 25v Gold. Hrv. H-1351 45.1 * 10-12 102 1.0 24v Countrymrk HS3971 45.0 * 10-15 105 1.0 24v Corsica Public 44.9 * 10-12 102 1.0 24b AgraTech AT 396 44.7 * 10-15 105 1.0 25v Countrymrk HS4161 44.6 * 10-15 105 1.0 28v Omaha Public 44.5 * 10-14 104 1.0 25v Williams 82 Public 44.1 10-13 103 1.0 28v Gold. Hrv. H-1386 44.1 10-15 105 1.0 27b Beck 388A 43.8 10-14 104 1.0 28v Yale Public 43.7 10-13 103 1.0 24v Stressland Public 43.5 10-15 105 1.0 28b L&M Glick 480 43.3 10-16 106 1.0 24v Probst Public 42.3 10-10 100 1.0 21v IA 3005 Public 42.2 10-15 105 1.0 23

Table 17. Location 5, Jennings Co., Soybean Test,Using No Tillage, continued.
Entry Yield Maturity Lodging PlantType and Name (1) est.(2) Date -Days score(3) height
bu./A. in.1997 Results, continued(4)v Countrymrk 365 41.6 10-13 103 1.0 26b Beck 386 41.4 10-14 104 1.0 23v Pella 86 Public 41.2 10-09 99 1.0 25v Countrymrk 426 41.0 10-14 104 1.0 27v Edison Public 40.8 10-13 103 1.0 23v Gold. Hrv. H-1394 40.8 10-14 104 1.0 22v Resnik Public 40.2 10-10 100 1.0 23v Thorne Public 39.9 10-12 102 1.0 22v Countrymrk 396 39.8 10-13 103 1.0 22v Flyer Public 39.4 10-13 103 1.0 25v Athow Public 38.3 10-13 103 1.0 22v Spencer Public 38.3 10-15 105 1.0 24b Beck 395 36.6 10-14 104 1.0 22v LG 6395 36.5 10-15 105 1.0 21b AgraTech AT 415 35.7 10-15 105 1.0 23b L&M Glick 365 34.5 10-14 104 1.0 24b L&M Glick 370 34.4 10-10 100 1.0 20
______ _____ ___ ____ ___
Grand mean 42.0 10-13 103 1.0 24BLSD (k=100) 5.6 2 2 ns 3C.V. (%) 9.1 2 1 9
(1) Lower case letters indicate entry type as follows:v-variety, b-brand, or m-mixture (blend).
Public entries were developed by AgriculturalExperiment Stations (Indiana Agricultural Research Programs) or in cooperation withthe Agricultural Research Service of theUSDA.
Proprietary names are company or brand namesgenerally associated in the trade with variety,brand or blend names.
(2) Yields followed by an asterisk (*) are not,statistically, significantly different from thehighest yield in the sub-table.
(3) 1 (erect) to 5 (flat) .(4) Conducted on the Southeast-Purdue Agricultural
Center, Butlerville.Donald J. Biehle, superintendent.
Soil type: Avonburg. Soil test: pH 6.1, P 29 ppm(very high), K 78 ppm (medium).
Date of planting: July 2, 1997.Date of harvest: October 23, 1997.
(Copyright 1997 Purdue Research Foundation)

Table 18. Location 5, Jennings Co., Soybean Test,Using Conventional Tillage.
Entry Yield Maturity Lodging PlantType and Name (1) est.(2) Date -Days score(3) height
bu./A. in.
Two-Year Average, 1995 and 1997b Beck 419 60.4 * 10-11 110 1.0 37v Stressland Public 57.4 * 10-11 110 1.0 37b L&M Glick 365 53.8 10-08 107 1.0 33v Probst Public 52.7 10-05 104 1.0 29v Flyer Public 52.3 10-09 108 1.0 31v Thorne Public 52.1 10-06 105 1.0 29b Beck 388A 51.7 10-06 105 1.1 32v Countrymrk 396 51.6 10-07 106 1.0 30v Countrymrk 365 51.3 10-09 108 1.0 33v Resnik Public 50.6 10-05 104 1.0 29b AgraTech AT 415 50.5 10-08 107 1.0 29v Spencer Public 50.1 10-10 109 1.0 32v Williams 82 Public 49.8 10-08 107 1.4 35v Countrymrk 426 49.8 10-11 110 1.0 35v Edison Public 49.2 10-06 105 1.0 28v Pella 86 Public 48.5 10-05 104 1.0 30v Yale Public 48.5 10-07 106 1.0 30
______ _____ ___ ____ ___
Grand mean 51.8 10-08 107 1.0 32BLSD (k=100) 4.8 2 2 ns 4C.V. (%) 4.9 2 1 11.7 51997 Results (4)v Countrymrk HS3971 54.4 * 10-15 105 1.0 33b L&M Glick 480 54.3 * 10-16 106 1.0 30b SC 406 SeedCnslts 54.2 * 10-15 105 1.0 34b Beck 419 53.5 * 10-16 106 1.0 37v Stressland Public 53.2 * 10-17 107 1.0 36v Countrymrk HS4161 53.0 * 10-18 108 1.0 34b AgraTech AT 396 51.9 * 10-14 104 1.0 29v Gold. Hrv. H-1386 51.9 * 10-15 105 1.0 30v Corsica Public 51.5 10-13 103 1.0 30b Beck 351 51.1 10-12 102 1.0 31v Gold. Hrv. H-1397 51.1 10-17 107 1.0 30b L&M Glick 365 51.0 10-14 104 1.0 30v LG 6395 50.7 10-14 104 1.0 26v Countrymrk 396 50.4 10-13 103 1.0 30b Beck 388A 50.0 10-13 103 1.0 32v Gold. Hrv. H-1394 49.7 10-15 105 1.0 27b Beck 386 49.2 10-14 104 1.0 27v Thorne Public 48.5 10-13 103 1.0 28v Gold. Hrv. H-1351 48.3 10-13 103 1.0 27v Flyer Public 48.3 10-14 104 1.0 27

Table 18. Location 5, Jennings Co., Soybean Test,Using Conventional Tillage, continued.
Entry Yield Maturity Lodging PlantType and Name (1) est.(2) Date -Days score(3) height
bu./A. in.1997 Results (4), continuedv Countrymrk 365 48.1 10-14 104 1.0 32v IA 3005 Public 47.9 10-14 104 1.0 28v Spencer Public 47.9 10-15 105 1.0 31v Williams 82 Public 47.3 10-13 103 1.0 34v Omaha Public 47.2 10-14 104 1.0 28v Probst Public 46.9 10-11 101 1.0 25v Harper 87 Public 46.9 10-13 103 1.0 29v Resnik Public 46.6 10-12 102 1.0 27v Pella 86 Public 46.5 10-12 102 1.0 30v Countrymrk 426 46.4 10-17 107 1.0 33b AgraTech AT 415 45.6 10-14 104 1.0 29b L&M Glick 370 45.0 10-12 102 1.0 28v Athow Public 44.7 10-10 100 1.0 26b Beck 395 44.7 10-14 104 1.0 24v Edison Public 44.5 10-13 103 1.0 26v Yale Public 44.2 10-13 103 1.0 27
______ _____ ___ ____ ___
Grand mean 49.1 10-14 104 1.0 30BLSD (k=100) 2.6 1 1 ns 3C.V. (%) 4.0 1 1 9
(1) Lower case letters indicate entry type as follows:v-variety, b-brand, or m-mixture (blend).
Public entries were developed by AgriculturalExperiment Stations (Indiana AgriculturalResearch Programs) or in cooperation withthe Agricultural Research Service of theUSDA.
Proprietary names are company or brand namesgenerally associated in the trade with variety,brand or blend names.
(2) Yields spanned by the same letter are not,statistically, significantly different.
(3) 1 (erect) to 5 (flat).(4) Conducted on the Southeast-Purdue Agricultural
Center, Butlerville.Donald J. Biehle, superintendent.
Soil type: Avonburg.Soil test: pH 6.3, P 37 ppm (very high), K 109
ppm (high).Date of planting: July 2, 1997.Dates of harvest: October 23 and 29, 1997.
(Copyright 1997 Purdue Research Foundation)

Table 19. Location 5, Jennings Co., 1997Transgenic (Roundup Ready®)Soybean Test, Using ConventionalTillage and No Tillage.
Entry Yield Maturity Lodging PlantType and Name (1) est.(2) Date -Days score(3) height
bu./A. in.Conventional Tillage Testb Beck 370RR 46.9 * 10-08 98 1.0 29b Beck 340RR 42.3 * 10-09 99 1.0 27v DSR-417/RR 37.9 10-06 96 1.0 28b Beck 390RR 35.8 10-08 98 1.0 27v DSR-351/RR 31.9 10-08 98 1.0 27
______ _____ ___ ____ ___
Grand mean 39.0 10-08 98 1.0 28BLSD (k=100) 6.4 ns ns ns nsC.V. (%) 12.3 3 2 14No Tillage Testv DSR-417/RR 41.4 * 10-14 104 1.0 28b Beck 390RR 41.1 * 10-16 106 1.0 22b Beck 370RR 38.9 * 10-14 104 1.0 28v DSR-351/RR 33.9 10-13 103 1.0 18b Beck 340RR 31.4 10-12 102 1.0 24
______ _____ ___ ____ ___
Grand mean 37.3 10-14 104 1.0 24BLSD (k=100) 3.1 1 1 ns 3C.V. (%) 7.2 2 1 10Conducted on the Southeast-Purdue Agricultural Center, Butlerville.
Donald J. Biehle, superintendent.Soil type: Avonburg.Soil test: pH 6.3, P 37 ppm (very high), K 109 ppm
(high).Date of planting: July 2, 1997.Date of harvest: October 23, 1997.Roundup Ready® is a trademark of Monsanto
Company.(1) Lower case letters indicate entry type as follows:
v-variety, b-brand, or m-mixture (blend).Public entries were developed by Agricultural
Experiment Stations (Indiana AgriculturalResearch Programs) or in cooperation withthe Agricultural Research Service of theUSDA.
Proprietary names are company or brand namesgenerally associated in the trade with variety,brand or blend names.
(2) Yields followed by an asterisk (*) are not,statistically, significantly different from thehighest yield in the sub-table.
(3) 1 (erect) to 5 (flat). (Copyright 1997 PRF)

Table 20. Location 5, Jennings Co., 1997Double Crop Soybean Test.
Entry Yield Maturity Lodging PlantType and Name (1) est.(2) Date -Days score(3) height
bu./A. in.Double Cropb Beck 419 50.6 * 10-24 106 1.0 30b L&M Glick 480 50.1 * 10-23 105 1.0 27v Countrymrk HS4161 49.8 * 10-22 104 1.0 28v Gold. Hrv. H-1386 49.1 * 10-23 105 1.0 28b L&M Glick 365 48.7 * 10-21 103 1.0 26b Beck 388A 47.2 10-22 104 1.0 30v Countrymrk HS3971 47.1 10-22 104 1.0 30b SC 406 SeedCnslts 47.0 10-22 104 1.0 29v Spencer Public 46.8 10-21 103 1.0 29v Corsica Public 46.3 10-22 104 1.0 24v Gold. Hrv. H-1397 45.8 10-21 103 1.0 26b Beck 390RR 45.3 10-22 104 1.0 27v Gold. Hrv H-1394 45.0 10-22 104 1.0 23v Omaha Public 44.9 10-21 103 1.0 24b AgraTech AT 396 44.0 10-22 104 1.0 26v Countrymrk 396 43.8 10-21 103 1.0 24v Countrymrk 365 43.8 10-22 104 1.0 25v Countrymrk 426 43.8 10-22 104 1.0 28v Stressland Public 43.7 10-22 104 1.0 25b Beck 386 43.0 10-21 103 1.0 23v Williams 82 Public 42.6 10-22 104 1.0 30v Harper 87 Public 42.0 10-22 104 1.0 25b AgraTech AT 415 41.9 10-20 102 1.0 24v Edison Public 41.8 10-22 104 1.0 24b Beck 351 41.7 10-21 103 1.0 24v Flyer Public 41.7 10-21 103 1.0 25v IA 3005 Public 41.7 10-21 103 1.0 23v Probst Public 41.6 10-21 103 1.0 23v Yale Public 41.5 10-21 103 1.0 24v Resnik Public 41.3 10-21 103 1.0 24v LG 6395 40.2 10-21 103 1.0 22b Beck 395 40.1 10-21 103 1.0 21v Pella 86 Public 39.7 10-21 103 1.0 26b L&M Glick 370 39.7 10-22 104 1.0 25v Gold. Hrv. H-1351 39.4 10-22 104 1.0 23v Athow Public 39.1 10-21 103 1.0 24v Thorne Public 38.1 10-21 103 1.0 23
______ _____ ___ ____ ___
Grand mean 43.8 10-22 104 1.0 25BLSD (k=100) 3.3 3 3 ns 2C.V. (%) 5.7 2 1 7

Table 20. Location 5, Jennings Co., 1997Double Crop Soybean Test, contd.
Conducted on the Southeast-Purdue Agricultural Center, ButlervilleDonald J. Biehle, superintendent.
Soil type: Avonburg.Soil test: pH 6.4, P 28 ppm (very high), K 101 ppm
(medium).Date of planting: July 10, 1997.Date of harvest: November 11, 1997.(1) Lower case letters indicate entry type as follows:
v-variety, b-brand, or m-mixture (blend).Public entries were developed by Agricultural
Experiment Stations (Indiana AgriculturalResearch Programs) or in cooperation withthe Agricultural Research Service of theUSDA.
Proprietary names are company or brand namesgenerally associated in the trade with variety,brand or blend names.
(2) Yields followed by an asterisk (*) are not,statistically, significantly different from thehighest yield in the sub-table.
(3) 1 (erect) to 5 (flat).(Copyright 1997 Purdue Research Foundation)
Table 21. Results of Maturity Group II SoybeanPerformance Tests at Two IndianaLocations (Averaged Across Locations1 and 2).
Entry Yield Maturity Lodging PlantType and Name (1) est.(2) Date -Days score(3) height
bu./A. in.Three-Year Average, 1995-1996-1997v Pioneer var. 9281 54.6 * 9-23 113 1.0 29v DSR-277 53.6 * 9-25 115 1.0 30b Callahan 5290 53.2 * 9-25 116 1.1 34b TS 253 Terra 51.6 * 9-22 112 1.0 28v Jack Public 51.6 * 9-25 115 1.5 39b TS 294 Terra 51.4 * 9-23 114 1.1 33v CX289 DeKalb 50.7 * 9-23 114 1.1 34v Chapman Public 49.8 * 9-24 114 1.2 30v Kenwood94 Public 48.4 9-19 109 1.4 30v Burlison Public 47.6 9-24 114 1.1 30v Archer Public 44.6 9-19 109 1.0 31
______ _____ ___ ____ ___
Grand mean 50.6 9-23 113 1.1 32BLSD (k=100) 5.6 4 4 0.4 3C.V. (%) 11.0 3 1 24.4 6

Table 21. Results of Maturity Group II SoybeanPerformance Tests at Two IndianaLocations (Averaged Across Locations1 and 2), continued.
Entry Yield Maturity Lodging PlantType and Name (1) est.(2) Date -Days score(3) height
bu./A. in.Two-Year Average, 1996-1997v DSR-300 57.5 * 9-28 118 1.1 30v DSR-277 55.0 * 9-27 116 1.0 27v Pioneer var. 9281 53.4 * 9-25 114 1.0 27b Callahan 5290 53.0 * 9-27 116 1.2 31b Callahan 7282 52.5 9-25 114 1.0 28v Jack Public 51.8 9-27 116 1.4 35v Countrymrk 297 51.7 9-29 118 1.1 31b Callahan 4277 51.6 9-24 113 1.1 29v CX278 DeKalb 51.2 9-26 115 1.1 29v CX289 DeKalb 51.1 9-26 115 1.1 32b TS 253 Terra 50.8 9-25 114 1.1 25b TS 294 Terra 50.8 9-26 115 1.1 30b BG S 292 50.3 9-29 118 1.3 30v Chapman Public 48.1 9-26 115 1.1 28v Countrymrk 246 47.5 9-23 112 1.3 31v Kenwood94 Public 47.3 9-23 112 1.4 28v Archer Public 47.0 9-22 112 1.0 29v Burlison Public 46.3 9-26 115 1.1 27
______ _____ ___ ____ ___
Grand mean 50.9 9-26 115 1.1 29BLSD (k=100) 4.8 5 5 ns 4C.V. (%) 8.2 3 2 23.5 71997 Resultsb TS 277 Terra 65.6 * 9-20 125 1.0 27v DSR-300 64.9 * 9-24 130 1.3 33v DSR-277 64.3 * 9-22 127 1.0 31b TS 266 Terra 63.1 * 9-18 124 1.0 26v Pioneer var. 9281 62.7 * 9-17 123 1.0 26b Beck 281 62.2 * 9-22 127 1.1 32v Sandusky Public 60.8 9-21 126 1.1 32b TS 253 Terra 60.7 9-17 123 1.0 26v CX267 DeKalb 60.6 9-17 123 1.1 31v Countrymrk HT2383 60.5 9-16 121 1.1 31b BG S 292 60.1 9-23 128 1.0 32b Callahan 5290 60.0 9-21 126 1.0 32b Callahan 7282 59.9 9-19 124 1.0 29v CX278 DeKalb 59.6 9-19 125 1.1 30v Jack Public 59.6 9-22 128 1.5 38v Flint Public 59.4 9-19 124 1.3 28v Countrymrk 297 59.3 9-23 129 1.3 33v DSR-293/RR 58.6 9-19 125 1.1 31v CX289 DeKalb 58.5 9-21 126 1.0 34

Table 21. Results of Maturity Group II SoybeanPerformance Tests at Two IndianaLocations (Averaged Across Locations1 and 2), continued.
Entry Yield Maturity Lodging PlantType and Name (1) est.(2) Date -Days score(3) height
bu./A. in.
1997 Results, continuedv DSR-271/RR 57.5 9-18 124 1.0 30b Callahan 4277 57.3 9-17 122 1.1 31b TS 294 Terra 57.2 9-21 126 1.1 32v Chapman Public 56.2 9-19 125 1.1 30v Countrymrk 215 55.7 9-15 120 1.0 35v Kenwood94 Public 55.5 9-14 120 1.4 30v Burlison Public 53.0 9-18 124 1.0 29v Countrymrk 246 52.5 9-15 121 1.1 32v Archer Public 52.0 9-12 118 1.0 31
______ _____ ___ ____ ___
Grand mean 59.2 9-19 124 1.1 31BLSD (k=100) 4.5 2 2 ns 2C.V. (%) 5.7 3 1 23.4 5
(1) Lower case letters indicate entry type as follows:v-variety, b-brand, or m-mixture (blend).
Public entries were developed by AgriculturalExperiment Stations (Indiana AgriculturalResearch Programs) or in cooperation withthe Agricultural Research Service of theUSDA.
Proprietary names are company or brand namesgenerally associated in the trade with variety,brand or blend names.
(2) Yields followed by an asterisk (*) are not,statistically, significantly different from thehighest yield in the sub-table.
(3) 1 (erect) to 5 (flat).(Copyright 1997 Purdue Research Foundation)

Table 22. Results of Maturity Group III SoybeanPerformance Tests At IndianaLocations, (Averaged Across Locations1, 2, 4 and 5, For Three Years; AndAcross Locations 1, 2, 3, 4 and 5, ForTwo Years and One Year).
Entry Yield Maturity Lodging PlantType and Name (1) est.(2) Date -Days score(3) height
bu./A. in.Locations 1, 2, 4 and 5,Three-Year Average,1995-1996-1997v Pioneer var. 9352 45.2 * 9-29 116 1.0 27v Probst Public 43.4 * 9-27 115 1.1 28v Yale Public 41.7 9-30 117 1.1 30v Resnik Public 41.5 9-28 115 1.1 28v Edison Public 41.3 9-29 117 1.0 28v Thorne Public 40.9 9-28 115 1.1 27v Williams 82 Public 37.9 10-01 119 1.5 33v Pella 86 Public 36.0 9-25 113 1.1 28
______ _____ ___ ____ ___
Grand mean 41.0 9-28 116 1.1 29BLSD (k=100) 2.8 3 3 0.2 2C.V. (%) 10.3 3 1 21.4 7Locations 1, 2, 3, 4 and 5,Two-Year Average, 1996-1997b TS 364 Terra 43.1 * 10-04 122 1.0 23v Probst Public 42.5 * 10-01 119 1.1 25v Pioneer var. 9352 42.4 * 10-02 120 1.0 24v Resnik Public 40.1 * 10-01 119 1.0 25v Thorne Public 39.2 * 10-02 120 1.1 25v Yale Public 39.1 * 10-03 121 1.0 26v Athow Public 39.0 * 9-30 118 1.0 23v Edison Public 38.9 * 10-03 121 1.0 25v Williams 82 Public 37.2 10-05 123 1.4 29v Pella 86 Public 34.8 9-30 117 1.0 24
______ _____ ___ ____ ___
Grand mean 39.6 10-02 120 1.1 25BLSD (k=100) 4.7 4 4 0.2 2C.V. (%) 13.0 2 1 17.6 8Locations 1, 2, 3, 4 and 5, 1997 Resultsv Pioneer var.93B82 55.0 * 9-25 132 1.0 25b TS 364T Terra 49.3 9-24 130 1.1 25b TS 364 Terra 49.2 9-26 133 1.0 23v Probst Public 48.0 9-22 129 1.1 25v Pioneer var. 9352 47.6 9-24 130 1.0 24v Pioneer var.93B41 47.3 9-22 129 1.0 23v Pioneer var. 9306 46.4 9-20 126 1.0 23v Defiance Public 45.5 9-20 127 1.0 26v Thorne Public 44.9 9-23 129 1.0 25v Resnik Public 44.7 9-21 128 1.0 26

Table 22. Results of Maturity Group III SoybeanPerformance Tests At IndianaLocations, (Averaged Across Locations1, 2, 4 and 5, For Three Years; AndAcross Locations 1, 2, 3, 4 and 5, ForTwo Years and One Year), continued.
Entry Yield Maturity Lodging PlantType and Name (1) est.(2) Date -Days score(3) height
bu./A. in.
Locations 1, 2, 3, 4 and 5, 1997 Results, continuedv Yale Public 43.2 9-26 132 1.0 27v Edison Public 42.9 9-24 130 1.0 25b TS 357 Terra 42.9 9-25 131 1.0 24v Athow Public 41.6 9-21 127 1.0 23v Williams 82 Public 41.6 9-27 134 1.2 30v IA 3005 Public 40.9 9-24 130 1.0 24v Pella 86 Public 37.6 9-20 126 1.0 23v Harper 87 Public 36.4 9-24 130 1.1 24
______ _____ ___ ____ ___
Grand mean 44.7 9-23 130 1.0 25BLSD (k=100) 4.9 2 2 ns 2C.V. (%) 13.5 2 1 9.4 7
(1) Lower case letters indicate entry type as follows:v-variety, b-brand, or m-mixture (blend).
Public entries were developed by AgriculturalExperiment Stations (Indiana AgriculturalResearch Programs) or in cooperation withthe Agricultural Research Service of theUSDA.
Proprietary names are company or brand namesgenerally associated in the trade with variety,brand or blend names.
(2) Yields followed by an asterisk (*) are not,statistically, significantly different from thehighest yield in the sub-table.
(3) 1 (erect) to 5 (flat).(Copyright 1997 Purdue Research Foundation)

Table 23. Results Of Maturity Group IV SoybeanPerformance Test At Two IndianaLocations (Averaged Across Locations4 and 5).
Entry Yield Maturity Lodging PlantType and Name (1) est.(2) Date -Days score(3) height
bu./A. in.Three-Year Average, 1995-1996-1997b TS 474 Terra 46.4 * 10-08 123 1.5 30v Stressland Public 44.6 * 10-02 118 1.3 30b AgraTech AT 415 41.4 * 10-01 116 1.0 25v Flyer Public 38.8 * 10-01 116 1.0 27v Countrymrk 426 38.6 * 10-04 119 1.0 28v Spencer Public 36.2 * 10-03 118 1.0 25
______ _____ ___ ____ ___
Grand mean 41.0 10-03 118 1.1 28BLSD (k=100) ns ns ns ns 3C.V. (%) 13.8 2 1 17.8 8Two-Year Average, 1996-1997b TS 474 Terra 43.8 * 10-10 126 1.3 26v Stressland Public 43.2 * 10-04 120 1.2 25b TS 415 Terra 38.3 * 10-04 120 1.1 21b AgraTech AT 415 37.1 * 10-03 119 1.0 21v Flyer Public 35.0 * 10-03 119 1.0 22v Countrymrk 426 34.6 * 10-06 121 1.0 22b Callahan 7417 33.9 * 10-05 120 1.0 18v Spencer Public 33.1 * 10-06 121 1.0 21
______ _____ ___ ____ ___
Grand mean 37.4 10-05 121 1.1 22BLSD (k=100) ns ns ns ns 3C.V. (%) 14.0 2 1 13.5 91997 Resultsv Pioneer var. 9421 51.6 * 9-23 128 1.0 25b TS 474 Terra 47.9 * 9-29 134 1.1 27v Stressland Public 46.2 * 9-23 128 1.0 24b TS 415 Terra 45.0 * 9-23 128 1.1 22v Countrymrk HS4161 42.4 9-24 129 1.0 22v Omaha Public 41.3 9-23 128 1.0 23v Corsica Public 40.7 9-21 126 1.0 22b Diener DB 442c 40.6 9-23 128 1.0 23v Pioneer var. 9492 40.5 9-30 135 1.0 23b AgraTech AT 415 39.9 9-22 127 1.0 21b Callahan 6435 39.8 9-24 129 1.0 23v Countrymrk 426 39.6 9-25 130 1.0 22v Flyer Public 39.4 9-21 126 1.0 22v CX420c DeKalb 39.0 9-23 128 1.0 26v Spencer Public 38.7 9-25 130 1.0 22b Callahan 7417 38.5 9-23 128 1.0 19b Diener DB 444c 37.9 9-26 131 1.0 23

Table 23. Results Of Maturity Group IV SoybeanPerformance Tests At Two IndianaLocations (Averaged Across Locations4 and 5), continued.
Entry Yield Maturity Lodging PlantType and Name (1) est.(2) Date -Days score(3) height
bu./A. in.1997 Results, continued
______ _____ ___ ____ ___
Grand mean 41.7 9-24 129 1.0 23BLSD (k=100) 7.3 2 2 ns 3C.V. (%) 12.6 2 1 11.6 8
(1) Lower case letters indicate entry type as follows:v-variety, b-brand, or m-mixture (blend).
Public entries were developed by AgriculturalExperiment Stations (Indiana AgriculturalResearch Programs) or in cooperation withthe Agricultural Research Service of theUSDA.
Proprietary names are company or brand namesgenerally associated in the trade with variety,brand or blend names.
(2) Yields followed by an asterisk (*) are not,statistically, significantly different from thehighest yield in the sub-table.
(3) 1 (erect) to 5 (flat).(Copyright 1997 Purdue Research Foundation)
Table 24. Results of Soybean Performance InJennings Co., Location 5, AveragedAcross Conventional Tillage, No Tillageand Double Crop Tests.
Entry Yield Maturity Lodging PlantType and Name (1) est.(2) Date -Days score(3) height
bu./A. in.1997 Resultsb Beck 419 51.4 * 10-18 105 1.0 32b SC 406 SeedCnslts 49.8 * 10-18 105 1.0 30b L&M Glick 480 49.2 * 10-18 106 1.0 27v Countrymrk HS4161 49.1 * 10-18 106 1.0 30v Countrymrk HS3971 48.8 * 10-17 104 1.0 29v Gold. Hrv. H-1386 48.4 * 10-17 105 1.0 28v Corsica Public 47.6 10-16 103 1.0 26v Gold. Hrv. H-1397 47.6 10-18 105 1.0 27b Beck 388A 47.0 10-16 103 1.0 30b AgraTech AT 396 46.9 10-17 104 1.0 27b Beck 351 46.8 10-15 102 1.0 26

Table 24. Results of Soybean Performance InJennings Co., Location 5, AveragedAcross Conventional Tillage, No Tillageand Double Crop Tests, continued.
Entry Yield Maturity Lodging PlantType and Name (1) est.(2) Date -Days score(3) height
bu./A. in.1997 Results, continuedv Stressland Public 46.8 10-18 105 1.0 30v Omaha Public 45.5 10-16 104 1.0 26v Gold. Hrv. H-1394 45.2 10-17 104 1.0 24v Harper 87 Public 44.8 10-15 102 1.0 26v Williams 82 Public 44.7 10-16 103 1.0 30b L&M Glick 365 44.7 10-16 103 1.0 27v Countrymrk 396 44.6 10-16 103 1.0 25v Countrymrk 365 44.5 10-16 104 1.0 28b Beck 386 44.5 10-16 103 1.0 24v Spencer Public 44.4 10-17 104 1.0 28v Gold. Hrv. H-1351 44.3 10-16 103 1.0 25v IA 3005 Public 44.0 10-16 104 1.0 24v Countrymrk 426 43.8 10-18 105 1.0 29v Probst Public 43.6 10-14 101 1.0 23v Yale Public 43.1 10-16 103 1.0 25v Flyer Public 43.1 10-16 103 1.0 26v Resnik Public 42.7 10-14 101 1.0 24v Pella 86 Public 42.5 10-14 101 1.0 27v LG 6395 42.5 10-17 104 1.0 23v Edison Public 42.4 10-16 103 1.0 24v Thorne Public 42.1 10-15 102 1.0 24b AgraTech AT 415 41.1 10-16 104 1.0 26v Athow Public 40.7 10-14 102 1.0 24b Beck 395 40.5 10-16 104 1.0 22b L&M Glick 370 39.7 10-14 102 1.0 24
______ _____ ___ ____ ___
Grand mean 45.0 10-16 103 1.0 26BLSD (k=100) 3.8 2 2 ns 2C.V. (%) 6.4 2 1 8(1) Lower case letters indicate entry type as follows:
v-variety, b-brand, or m-mixture (blend).Public entries were developed by Agricultural
Experiment Stations (Indiana AgriculturalResearch Programs) or in cooperation withthe Agricultural Research Service of the USDA.
Proprietary names are company or brand namesgenerally associated in the trade with variety,brand or blend names.
(2) Yields followed by an asterisk (*) are not,statistically, significantly different from thehighest yield in the sub-table.
(3) 1 (erect) to 5 (flat). (Copyright 1997 PRF)