Embed Size (px)
Citation preview
HAL Id: hal-01929807https://hal.inria.fr/hal-01929807v2
Submitted on 13 Dec 2019
HAL is a multi-disciplinary open accessarchive for the deposit and dissemination of sci-entific research documents, whether they are pub-lished or not. The documents may come fromteaching and research institutions in France orabroad, or from public or private research centers.
L’archive ouverte pluridisciplinaire HAL, estdestinée au dépôt et à la diffusion de documentsscientifiques de niveau recherche, publiés ou non,émanant des établissements d’enseignement et derecherche français ou étrangers, des laboratoirespublics ou privés.
T2-based MRI Delta-Radiomics Improve ResponsePrediction in Soft-Tissue Sarcomas Treated by
Neoadjuvant ChemotherapyAmandine Crombé, Cynthia Perier, Michèle Kind, Baudouin Denis de
Senneville, Francois Le Loarer, Antoine Italiano, Xavier Buy, Olivier Saut
To cite this version:Amandine Crombé, Cynthia Perier, Michèle Kind, Baudouin Denis de Senneville, Francois Le Loarer,et al.. T2-based MRI Delta-Radiomics Improve Response Prediction in Soft-Tissue Sarcomas Treatedby Neoadjuvant Chemotherapy. Journal of Magnetic Resonance Imaging, Wiley-Blackwell, 2019, 50(2), pp.497-510. �10.1002/jmri.26589�. �hal-01929807v2�

1
T2-based MRI Delta-Radiomics Improve Response Prediction in Soft-
Tissue Sarcomas Treated by Neoadjuvant Chemotherapy. CrombéA1,PérierC2,KindM1,DeSennevilleBD2,LeLoarerF3,ItalianoA4,BuyX,SautO2
1. DepartmentofRadiology,InstitutBergonie,RegionalComprehensiveCancerCenter,Bordeaux,France.
2. UniversityofBordeaux,IMB,UMRCNRS5251,INRIAProjectteamMonc,Talence,France.
3. DepartmentofPathology,InstitutBergonie,RegionalComprehensiveCancerCenter,Bordeaux,France.
4. DepartmentofMedicalOncology,InstitutBergonie,RegionalComprehensiveCancerCenter,Bordeaux,France.
ABSTRACT
Background: Standard of care for patients with high-grade soft-tissue sarcoma (STS) are
being redefined since neoadjuvant chemotherapy (NAC) has demonstrated a positive effect on
patients’ outcome. Yet, response evaluation in clinical trials still remains on RECIST criteria.
Purpose: To investigate the added value of a Delta-radiomics approach for early response
prediction in patients with STS undergoing NAC
Study type: Retrospective
Population: 65 adult patients with newly-diagnosed, locally-advanced, histologically proven
high-grade STS of trunk and extremities. All were treated by anthracycline-based NAC
followed by surgery and had available MRI at baseline and after 2 cycles.
Field strength/Sequence: Pre- and post-contrast enhanced T1-weighted imaging (T1-WI),
turbo spin echo T2-WI at 1.5T.
Assessment: A threshold of <10% viable cells on surgical specimen defined good response
(Good-HR). Two senior radiologists performed a semantic analysis of the MRI. After 3D
manual segmentation of tumors at baseline and early evaluation, and standardization of voxel-
sizes and intensities, absolute changes in 33 texture and shape features were calculated.
Statistical tests: Classification models based on logistic regression, support vector machine,
k-nearest neighbors and random forests were elaborated using cross-validation (training and
validation) on 50 patients (‘training cohort’) and was validated on 15 other patients (‘test
cohort’).
Results: 16 patients were good-HR. Neither RECIST status, nor semantic radiological
variables were associated with response except an edema decrease (p=0.003) although 14
shape and texture features were (range of p-values: 0.002-0.037). On the training cohort, the
highest diagnostic performances were obtained with random forests built on 3 features:
Δ_Histogram_Entropy, Δ_Elongation, Δ_Surrounding_Edema, which provided:
AUROC=0.86, accuracy=88.1%, sensitivity=94.1%, specificity=66.3%. On the test cohort,
this model provided an accuracy of 74.6% but 3/5 good-HR were systematically ill-classified.
2
Data conclusions: A T2-based Delta-Radiomics approach can improve early response
prediction in STS patients with a limited number of features.
Level of evidence: 3
Technical Efficacy: 2
KEYWORDS
Radiomics;
Texture analysis;
Soft-tissue sarcoma;
Response Evaluation Criteria in solid tumors;
Chemotherapy;
Magnetic Resonance Imaging
ABBREVIATIONS 18F-FDG-PET-CT
AUROC: area under the ROC curve
CE: contrast-enhanced
DCE-MRI: dynamic contrast enhanced MRI
DWI: diffusion weighted imaging
FS: fat sat
KNN: K-nearest neighbors
LD: longest diameter
LR: logistic regression
NAC: neoadjuvant chemotherapy
NPV: negative predictive value
PPV: positive predictive value
RECIST: response evaluation criteria in solid tumors
RF: random forests
SI: signal intensity
STS: soft-tissue sarcoma
SUVmax: maximal standardized uptake value
SVM: support vector machine
TSE: turbo spin echo
WI: weighted imaging

3
INTRODUCTION
Standard of care for locally advanced high-grade soft-tissue sarcomas (STS) has been recently
redefined as phase 3 clinical trials demonstrated improved overall and metastasis-free
survivals in patients treated with anthracycline-based NAC1-3. Despite encouraging results of 18Fluorodeoxyglucose position emission tomography (18F-FDG-PET-CT), modified Choi
criteria and dynamic-contrast enhanced MRI (DCE-MRI), evaluation of response to NAC still
relies on RECIST 1.14.
Non-invasive quantification of tumor heterogeneity and its changing phenotype during
treatment is a recent, promising and challenging field of research referred to as radiomics.
Radiomics techniques aim at leveraging big-data analytics and personalized medicine
approaches in oncologic imaging5,6. To achieve this, several numeric features are extracted to
quantify and to screen tumor phenotype and surrounding tissue on any available imaging
modality7. After a careful selection of features, machine learning algorithms can be designed
and trained to answer crucial oncologic questions such as associations between imaging
phenotypes and molecular subtypes with specific treatment and outcomes, prediction of
response and patient outcome by including other –omics (genomic, transcriptomics)
information within the model8.
Because of their complex morphology, architecture and changes during treatments, STS may
be particularly appropriate to the radiomics approach. Indeed, radiomics on DWI may help to
improve STS grading on microbiopsy9. In addition, Hayano et al. have demonstrated that
texture parameters on CT-scan were associated with neoangiogenesis and overall survival for
STS treated with radiotherapy and bevacizumab10,11. STS heterogeneity assessed on 18F-FDG-
PET-CT may be more predictive of survival as compared to classical measure of maximal
standardized uptake value (SUVmax)12. Recently, composite texture features from MRI and
from 18F-FDG-PET-CT have enabled to identify aggressive tumors at risk of lung metastasis
at baseline13. Together, these promising studies highlight the potential of radiomics applied to
STS. However, to our knowledge, applications to response prediction to NAC have never
been attempted.
Visual MRI evaluation of STS during NAC can highlight a wide range of morphologic
alterations combining fibrotic and necrotic processes, infarction, bleeding, re-differentiation

4
or selection of resistant component. As change in longest diameter (LD) is not a sufficient
criterion to predict therapeutic response, we hypothesized that a radiomics process could help
predict NAC efficacy through the histologic response.
MATERIALS AND METHODS
Patients
The institutional review board approved this study and informed consent was waived.
All consecutive adult patients between June 2007 and June 2017 were included, as they
presented with histologically proven high-grade STS of extremities or trunk wall, without
metastasis on chest CT-scan, eligible for an anthracycline-based NAC according to the
regional sarcoma reference center board. High-grade was defined as grade III STS according
to the French Federation of Cancer Centers Sarcoma Group grading system14.
Criteria for inclusion were: measurable tumor with MRI, available MRI performed <28 days
before the first cycle of NAC (: baseline, MRI_0) and between cycle 2 and 3 of NAC (: early
evaluation, MRI_1), 4 to 6 cycles of NAC, histological response assessment on surgical
specimen by an expert pathologist following published guidelines15. A threshold of <10% of
viable cells assessed on whole tumor defined good histological response (good-HR)16.
Of the 163 patients with a newly diagnosed STS of trunk wall and extremities who underwent
NAC at our institution (according to the pharmacology department), 28 patients were
excluded because of non-anthracycline-based NAC, 20 because of less than 4 cycles of NAC,
33 because T2-weighted-imaging (T2-WI) was not performed at baseline, 7 because T2-WI
was not performed at early evaluation, 10 because of non-diagnostic MRI at baseline and/or
early evaluation.
MR imaging
Images were acquired in daily practice using 1.5-Tesla MR-systems from different
radiological centers. Ninety-three examinations (72%) were carried out on a Magnetom
AERA, (Siemens Healthineers, Erlangen, Germany). Coils, field-of-view and matrices were
adapted to tumor location and size. To be considered as ‘diagnostic’, MRI must include at
least 2D T2-WI turbo-spin echo (TSE) sequence without fat-suppression, T1-WI before and
after Gadolinium-chelates injection (contrast-enhanced T1-WI, CE-T1-WI) and 2 orthogonal
acquisition plans. Section thickness ranged from 3 to 5 mm. Ranges of repetition time / echo
time were: 500-700/10-15 msec for T1-WI and 2400-6860/100-130 msec for T2-WI.

5
Semantic radiological features
Two senior radiologists (AC and MK, with 3 and 27 years of experience in STS imaging,
respectively), independently reviewed the MRI blinded to patient data in a randomized
fashion on a dedicated PACS workstation. They reported:
- LD in mm on MRI_0 and MRI_1, relative change in LD and RECIST response status.
- Percentage of tumor volume with changes compatible with fibrosis (low signal intensity (SI)
on T2-WI, T1-WI, subtle enhancement) and/or necrosis (fluid-like SI on T2-WI, variable SI
on T1-WI, no enhancement), as follows: 0%, <50% and ≥50%,
- Change in margin definition on CE-T1-WI (Δ_Margin_Definition), as follows: ‘well-
defined or better definition’ versus ‘stable ill-defined margins or worst’,
- Change in surrounding edema on T2-WI without or with fat-suppression technique when
available (Δ_Edema), as follows: ‘none or decreased’ versus ‘stable or increased’,
- Changes in peritumoral enhancement on CE-T1-WI (Δ_Peritumoral_enhancement), as
follows: ‘none or decreased’ versus ‘stable or increased’.
One radiologist (AC) did a second reading 1.5 months later to assess intra-observer agreement
(Supplemental Data). A consensual lecture was performed 3 months after for the statistical
analysis.
MRI post-processing (Fi. 1)
Slice-by-slice 3D-delineation of whole tumor was manually made on T2-WI by one
radiologist (AC) using the ROI manager of OSIRIX software.
All slices were resampled using bi-linear interpolation to obtain a common isotropic in plane
1x1 mm2 pixel aspect. Signal intensities on T2-WI were normalized for non-uniform intensity
(bias field correction17) and the intensity ranges were standardized using histogram-
matching18 with the acquisition of a healthy volunteer’s thigh as reference. Thirty-three first-
and second-order texture and shape features were computed using in-house Python software
based on the ITK library19. The collected features and methods are detailed in Supplemental
Data. We calculated the absolute change of a given feature ‘X’ for each patient as follows:
Δ_X= XMRI_1 – XMRI_0.
Statistical analyses
Comparisons between good-HR and poor-HR were assessed with Student or Mann-Whitney
tests depending on results to the Shapiro-Wilk normality test. Association of categorical and
ordinal variables with response was assessed with Chi-2 and Fischer tests. Correlations

6
between features were assessed with Spearman’s rank test. All tests were two-tailed. A p-
value ≤0.05 was deemed significant.
To elaborate and validate the prediction model, the whole data set was partitioned in two: a
training cohort (50 patients, included from June 2007 to June 2016) and a test cohort (15
patients, from July 2016 to June 2017 whose MRI were acquired after the initiation of the
project). We initially selected only one feature per category (semantic, shape and texture
categories) according to its lowest p-value at univariate analysis and lowest correlation with
other significant features.
The selected combination of features was used to define models with 10-fold stratified cross
validation on the training cohort. First, for each run and each set, the missing values were
imputed with training features median and quantitative features were normalized by removing
the training mean and scaling to unit variance. Several classification algorithms were
evaluated using the scikit-learn library20: random forests (RF), k-nearest neighbors (KNN),
support vector machine (SVM) and logistic regression (LR). The parameters of those
estimators were optimized by cross-validated grid-search (Supplemental Data). The selected
classifiers were then trained with the whole 50-patients set and applied on the 15 patients
from the test set using the same preprocessing method (Figure 1c).
The cross-validation step was repeated 100 times with shuffled folds composition. The full
process (including the final test) was also repeated with different random initialization seed
for the RF algorithm. Average test metrics are reported for each step: accuracy, area under the
ROC curve (AUROC), specificity, sensitivity, positive predictive value (PPV), negative
predictive value (NPV) and train score.
Finally, we increased the number of features that were included in the model in a forward
stepwise fashion according to their p-value at univariate analysis and we calculated the
corresponding classifiers test metrics.
RESULTS
Patient characteristics (Table 1)
The cohort included 65 patients (27 females, mean age: 57.9 ± 12.8 years old), of which 16
(24.6%) were good-HR. The most frequent histotypes were undifferentiated sarcoma (50.8%),
followed by myogenic sarcoma (leiomyosarcoma and rhabdomyosarcoma, 20%). Most of
them were deep-seated (93.8%) in the lower limb (58.5%). Twenty-two patients (33.8%)
received 4 cycles of NAC in total.
Standard radiological assessment (Table 2)

7
No association was found between baseline epidemiologic characteristics and histological
response. LD at baseline was significantly higher in good-HR (146 ± 66 mm vs. 110 ± 51
mm, p=0.038). Relative change in LD at early evaluation was also significantly different
between good-HR and poor-HR (-11.2 ± 20.8% versus 2.9 ± 19.5%, p=0.027), however,
response status according to RECIST 1.1 was not associated with histological response
(p=0.112) as most good-HR and poor-HR were classified as stable disease by these criteria
(81.3% and 79.6%, respectively). Of all the semantic radiological features, only Δ_Edema
was associated with response (p=0.003), with substantial inter- and intra-rater agreements
(0.637 and 0.769, respectively).
Radiomics assessment
The population study was partitioned in a training cohort (50 patients, 11 Good-HR) and a test
set (15 patients, 5 Good-HR). There was no statistical difference between the training and test
cohorts regarding the baseline epidemiological characteristics (Supplemental Data).
Within the training cohort, changes in twelve first and second order textural indices were
associated with response at univariate analysis: Δ_Histogram_Entropy (p=0.002), Δ_Stdev
(p=0.008), Δ_ClusterProminence_5 (p=0.038), Δ_Energy_1 (p=0.015), Δ_Energy_2
(p=0.014), Δ_Energy_5 (p=0.010), Δ_Entropy_1 (p=0.005), Δ_Entropy_2 (p=0.004),
Δ_Entropy_5 (p=0.003), Δ_Homogeneity_1 (p=0.037), Δ_Homogeneity_2 (p=0.022),
Δ_Homogeneity_5 (p=0.014), as well as two shape features: Δ_Elongation (p=0.019) and
Δ_Flatness (p=0.019) (Table 3). Correlation matrix demonstrated significant and strong
correlations between all first and second order texture features (Table 4). Since the lowest p-
value was obtained with Δ_Histogram_Entropy for texture features and Δ_Elongation for
shape features, the initial selection for building the model included these two features and
Δ_Edema
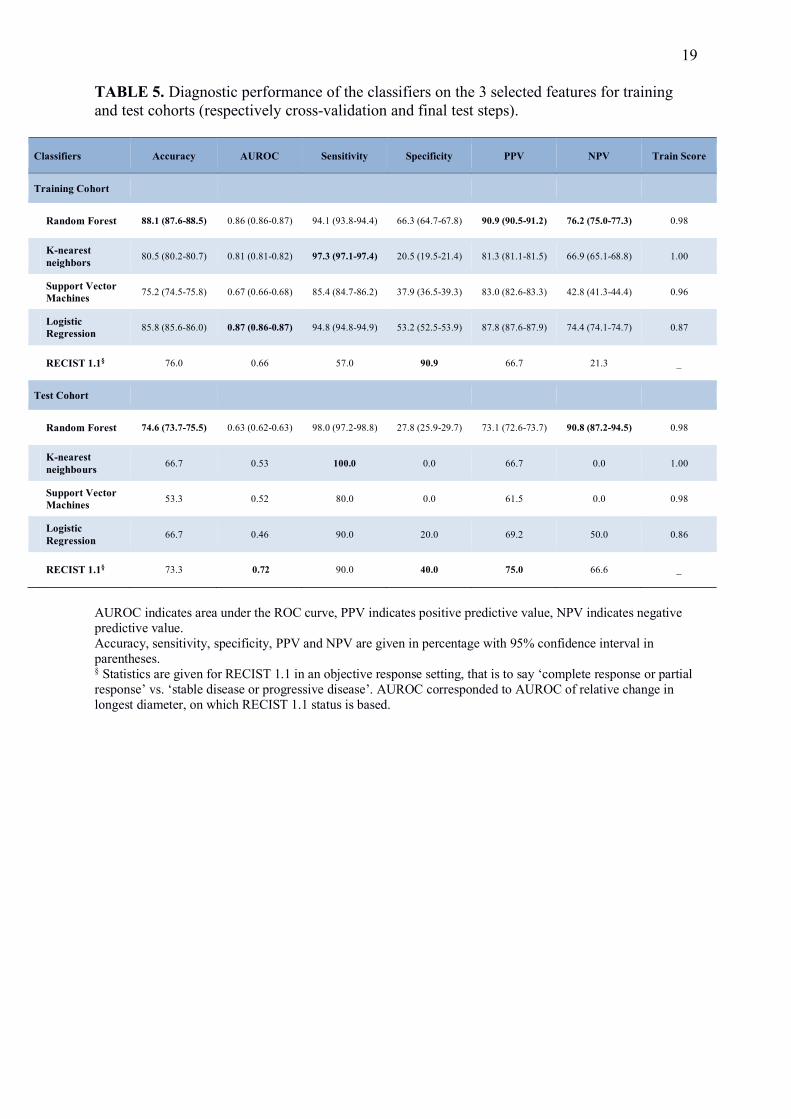
Table 5 provides the performance of the classifiers for their optimal set of parameters and for
this selection. On the training set, the highest mean accuracy was obtained with RF (88.1%),
followed by LR (85.8%), KNN (80.5%) and SVM (75.2%). In an objective response setting,
RECIST 1.1 provided one of the lowest accuracy with 76.0% of correctly predicted patients.
In descending order, AUROC were 0.87 with LR, 0.86 with RF, 0.81 with KNN, 0.67 with
SVM and 0.66 for relative change in LD (Fig. 2).
In the test set, the accuracy of the prediction of the 15 patients for classifiers trained with the
whole training set on the 3 initial features were: 74.6% for RF, 66.7% for LR, 53% for SVM,
66.7% for KNN and 73.3% for an objective response according to RECIST 1.1. In details,

8
while 9 (90%) of poor-HR were correctly predicted with RF, 3 (60%) good HR were
systematically misclassified in the test set.
Since the best compromise was obtained with the RF classifier, we investigated the impact of
adding features in the RF model (Fig. 3). Accuracy and AUROC were not improved in the
training cohort and they decreased in the test cohort. In the training cohort, specificity was at
its highest with 3 features while sensitivity remained constant. In the test cohort, higher
sensitivity and specificity were obtained with 3 features. Figure 4 illustrates the added value
of the final RF algorithm for two cases with a stable disease according to RECIST 1.1, one
being a poor-HR, the other a good-HR.
The retrospective analysis of the false positive predictions made by the RF model highlighted
cases of massively necrotic-hemorrhagic tumors and late-responder profiles (Fig. 5).
Quantification of tumor heterogeneity was biased by heterogeneous large blood clots on
baseline examination and their changes at early evaluation. Analysis based on other imaging
modalities of ‘late-responder’ cases did not provide any clue to predict a good response after
2 cycles, whereas pre-surgical evaluation demonstrated extensive fibro-necrotic changes,
strong decrease of DCE-MRI parameters and SUVmax.
DISCUSSION
In this study, we developed and evaluated radiomics models to predict the histological
response of STS during NAC that were based on changes on T2-WI from baseline to early
evaluation. Overall, our best model was obtained with RF classifiers on 3 relevant features
from analysis of STS shape, heterogeneity and surrounding tissue. It performed better than
RECIST 1.1 with an accuracy of 88.1% and AUROC of 0.86 at cross-validation and had the
highest scores on the independent test cohort. However, those last results highlighted outliers
requiring additional characterization.
Performances of our best predictive model were comparable or higher than those found for
other imaging biomarkers in literature although we should be careful in making comparisons
since different cut-offs may have been used to define a good histological response, different
chemotherapy regimens may have been prescribed and imaging may have been performed at
different stages in time. Stacchiotti et al. investigated CHOI criteria to predict a pathological
very good response defined as <10% viable cells on surgical specimen in a series of 37
patients. They obtained an accuracy of 74.1% (14/22 CHOI partial responders being true
good-HR and 6/6 CHOI non-responder being true poor-HR)21,22. In another studies, a

9
decrease in contrast-enhancement of -30.5% between two MRI with optimized acquisition
delay after contrast-agent injection provided an accuracy of 82.8%23. On a retrospective series
of 23 patients, multiparametric assessment combining qualitative evaluation of diffusion
imaging and DCE-MRI provided a best AUROC of 0.83324. At early evaluation with 18F-
FDG-PET-CT, a decrease >35% of SUVmax provided an AUROC of 0.83 in a prospective
study of 50 patients25,26.
Association between decrease in edema and good response did not surprise us. Surrounding
edema is associated with high-grade STS and satellite tumor cells27-29. NAC efficacy should
logically go with reduced satellite tumor cells and thus a decrease of signal anomalies
surrounding STS on MRI. A decrease in tumor cellularity turning into fibro-necrotic tissue
could explain a tumor softening leading to changes in shape, towards retraction of its borders.
Finally, these fibro-necrotic processes lead to a larger range of signal intensity values within
tumors, that is to say a flattening of the SI histogram responsible for change in its entropy.
A careful retrospective analysis of the tumors that were systematically ill classified in our
series enabled to identify ‘late-responder’ and ‘massively necrotic STS’ profiles. These last
ones are difficult to image and their morphological changes during treatment can be
complicated to interpret. Evaluation with RECIST 1.1 is biased as it mostly measures the
necrosis and not the changes in viable tumor component. DCE-MRI and diffusion imaging are
challenging because viable tissue generally consists in small buds attached to the tumor wall
within a large hemorrhagic mass. In our case, 18F-FDG-PET-CT correctly predicted a good
response according to the previously published cut-off of a 35-38% decrease in SUVmax26.
These two observations from the test cohort provide insights into next features to add to the
future predictive models. Partitioning dataset in independent training and test datasets enabled
to have a larger view of the response patterns of STS, and to consider additional imaging
features from other advanced imaging modalities for improvement of the future models.
Interestingly, our best models relied on a limited set of features from non-contrast enhanced
sequences. Corino et al. also found that only 3 features from diffusion imaging provided the
highest accuracy to predict histological grade of STS9. The best model to predict lung
metastatic relapse of STS according to Vallières et al. relied on 4 texture features13. In their
studies, adding any other feature to the model did not improve prediction. In a context of
controversy about long-term effects of Gadolinium-chelates contrast agents, an imaging
work-flow for response evaluation may be considered in which known outliers of the model
or patients with an intermediate probability of response could be assessed in a second step
with contrast agent injection and advanced imaging modalities such as DCE-MRI, DWI and 18F-FDG-PET-CT.

10
Our study has limits. First, this is a retrospective study with a relatively small number of
patients. Nevertheless, our series is one of the largest regarding STS and MRI, with uniformly
treated patients with the chemotherapy of reference. No epidemiological data was added into
the model because none was associated with the tumor response at univariate analysis.
Indeed, the population study only included patients who shared all the epidemiological
features associated with worse prognosis, namely high-grade, deep- or deep and superficial
STS with LD above 5cm30. Beside, if modest, the cohort was significant enough to put a few
data aside to form an independent validation set and control our results.
Second, imaging protocols were not designed for radiomics studies. 2D TSE T2-WI was used
for features extraction because (i) it was the most commonly acquired sequence, (ii) it
provided a large range of morphological changes during treatment, (iii) there was no change
in the acquisition parameters during the study period. T2-WI can capture fibrotic and necrotic
processes (decreased and increased T2 SI, respectively). T2-WI has already demonstrated
good results in textural approaches applied to other tumor types31-35. Conversely, post-contrast
T1-WI sequences showed heterogeneous acquisition protocols in our series: some were 3D
gradient recalled echo imaging and others 2D TSE, different fat suppression techniques were
used (Dixon method, fat-sat, short TI inversion recovery, subtraction with pre-contrast T1-
WI), as well as different contrast agents. Furthermore, the acquisition delay after contrast
agent injection was not standardized although it may have a significant effect on changes in
tumor heterogeneity quantified on CE-T1-WI. Changes in surrounding edema helped predict
response but its assessment could only be qualitative because of non-standardized sequence
for its evaluation. Future studies should include automatic and quantitative assessment of
edema and its changes, since it was one of the best predictor for the response in the current
study. Adding another imaging modalities would have markedly decreased the population
study and we made the decision to privilege one informative sequence and an acceptable
population study. Nevertheless, this point stresses the urge for a standardized MRI protocol
for STS.
Third, post-processing included voxel size standardization - with an acceptable voxel size to
preserve the global shape of tumor - and signal intensity normalization. The aim was to limit
the inherent bias due to MR acquisition at different stages on different MR-systems and to
improve the reliability and the reproducibility of the extracted features. 3D Segmentation was
manually performed, slice-by-slice. Automatic and semi-automatic methods were tried before
the study with disappointing results as compared to those obtained by the expert radiologist
from a sarcoma reference center.

11
Fourth, we decided to limit the number of extracted textural features, despite the fact that
several others could have been calculated from fractal analysis, wavelet, and other matrices36.
Therefore, we limited the risk of finding relevant features by chance and facilitated the
understanding of our results. Those we calculated are widely used and can be easily found in
open libraries37. Due to the relatively small population study, we did not apply deep-learning
purposely and focused on time-tested classifiers. Finally, one could question the outcome.
The histological response is routinely used as an intermediate evaluator reflecting immediate
efficacy of NAC and patient prognosis16. Nonetheless, it is a semi-quantitative assessment,
with possible subjectivity and sample bias. Ultimately, our goal is to build predictive models
for survival, but only 41 patients in this series have a follow-up of more than 2 years and 26
of more than 5 years.
To conclude, our preliminary results indicate that T2-based delta-radiomics approach applied
to STS in the neoadjuvant setting is feasible, provides valuable information to predict
response after only 2 cycles and improves evaluation compared to RECIST 1.1. Optimization
of the model is still needed with the study of larger cohorts and inclusion of other categories
of features, other imaging modalities and other ‘-omics’ criteria.
REFERENCES
1. Saponara M, Stacchiotti S, Casali PG, Gronchi A. (Neo)adjuvant treatment in localised soft
tissue sarcoma: The unsolved affair. European Journal of Cancer. 2017;70:1–11.
2. Gronchi A, Ferrari S, Quagliuolo V, et al. Histotype-tailored neoadjuvant chemotherapy
versus standard chemotherapy in patients with high-risk soft-tissue sarcomas (ISG-STS
1001): an international, open-label, randomised, controlled, phase 3, multicentre trial. The
Lancet Oncology. 2017;18:812–822.
3. Issels RD, Lindner LH, Verweij J, et al. Neo-adjuvant chemotherapy alone or with regional
hyperthermia for localised high-risk soft-tissue sarcoma: a randomised phase 3 multicentre
study. The Lancet Oncology. 2010;11:561–570.
4. Eisenhauer EA, Therasse P, Bogaerts J, et al. New response evaluation criteria in solid
tumours: Revised RECIST guideline (version 1.1). European Journal of Cancer.
2009;45:228–247.
5. Lambin P, Leijenaar RTH, Deist TM, et al. Radiomics: the bridge between medical
imaging and personalized medicine. Nat Rev Clin Oncol. 2017;14:749–762.

12
6. Limkin EJ, Sun R, Dercle L, et al. Promises and challenges for the implementation of
computational medical imaging (radiomics) in oncology. Ann Oncol. 2017;28:1191–1206.
7. Gillies RJ, Kinahan PE, Hricak H. Radiomics: Images Are More than Pictures, They Are
Data. Radiology. 2016;278:563–577.
8. Aerts HJWL. The Potential of Radiomic-Based Phenotyping in Precision Medicine: A
Review. JAMA Oncol. 2016;2:1636–1642.
9. Corino VDA, Montin E, Messina A, et al. Radiomic analysis of soft tissues sarcomas can
distinguish intermediate from high-grade lesions. J Magn Reson Imaging. 2018;47:829–840.
10. Hayano K, Tian F, Kambadakone AR, et al. Texture Analysis of Non-Contrast-Enhanced
Computed Tomography for Assessing Angiogenesis and Survival of Soft Tissue Sarcoma. J
Comput Assist Tomogr. 2015;39:607–612.
11. Tian F, Hayano K, Kambadakone AR, Sahani DV. Response assessment to neoadjuvant
therapy in soft tissue sarcomas: using CT texture analysis in comparison to tumor size,
density, and perfusion. Abdom Imaging. 2015;40:1705–1712.
12. Eary JF, O’Sullivan F, O’Sullivan J, Conrad EU. Spatial heterogeneity in sarcoma 18F-
FDG uptake as a predictor of patient outcome. J Nucl Med. 2008;49:1973–1979.
13. Vallières M, Freeman CR, Skamene SR, El Naqa I. A radiomics model from joint FDG-
PET and MRI texture features for the prediction of lung metastases in soft-tissue sarcomas of
the extremities. Phys Med Biol. 2015;60:5471–5496.
14. Trojani M, Contesso G, Coindre JM, Lagarde C, et al. Soft-tissue sarcomas of adults;
study of pathological prognostic variables and definition of a histopathological grading
system. Int J Cancer. 1984;33:37-42.1
15. Wardelmann E, Haas RL, Bovée JVMG, et al. Evaluation of response after neoadjuvant
treatment in soft tissue sarcomas; the European Organization for Research and Treatment of
Cancer–Soft Tissue and Bone Sarcoma Group (EORTC–STBSG) recommendations for
pathological examination and reporting. European Journal of Cancer. 2016;53:84–95.
16. Cousin S, Crombe A, Stoeckle E, et al. Clinical, radiological and genetic features,
associated with the histopathologic response to neoadjuvant chemotherapy (NAC) and
outcomes in locally advanced soft tissue sarcoma (STS) patients (pts). J Clin Oncol.
2017;35(15_suppl):11014–11014.
17. Tustison NJ, Avants BB, Cook PA, et al. N4ITK: improved N3 bias correction. IEEE
Trans Med Imaging. 2010;29:1310–1320.
18. Nyúl LG, Udupa JK, Zhang X. New variants of a method of MRI scale standardization.
IEEE Trans Med Imaging. 2000;19:143–150.

13
19. Yoo TS, Ackerman MJ, Lorensen WE, et al. Engineering and algorithm design for an
image processing Api: a technical report on ITK--the Insight Toolkit. Stud Health Technol
Inform. 2002;85:586–592.
20. Pedregosa F, Varoquaux G, Gramfort A, et al. Scikit-learn: Machine Learning in Python.
Journal of Machine Learning Research. 2011;12:2825–2830.
21. Stacchiotti S, Verderio P, Messina A, et al. Tumor response assessment by modified Choi
criteria in localized high-risk soft tissue sarcoma treated with chemotherapy. Cancer.
2012;118:5857–5866.
22. Stacchiotti S, Collini P, Messina A, et al. High-grade soft-tissue sarcomas: tumor response
assessment—pilot study to assess the correlation between radiologic and pathologic response
by using RECIST and Choi criteria. Radiology. 2009;251:447–456.
23. Crombé A, Le Loarer F, Kind M, et al. High-grade soft-tissue sarcoma: optimizing
injection improves MRI evaluation of tumor response. Eur Radiol. 2018 Jul 23. doi:
10.1007/s00330-018-5635-4.
24. Soldatos T, Ahlawat S, Fayad LM, et al. Multiparametric assessment of treatment
response in high-grade soft-tissue sarcomas with anatomic and functional MR imaging
sequences. Radiology. 2015;278:831–840.
25. Benz MR, Allen-Auerbach MS, Eilber FC, et al. Combined assessment of metabolic and
volumetric changes for assessment of tumor response in patients with soft-tissue sarcomas. J
Nucl Med. 2008;49:1579–1584.
26. Benz MR, Czernin J, Allen-Auerbach MS, et al. FDG-PET/CT imaging predicts
histopathologic treatment responses after the initial cycle of neoadjuvant chemotherapy in
high-grade soft-tissue sarcomas. Clin Cancer Res. 2009;15:2856–2863.
27. Hanna SL, Fletcher BD, Parham DM, Bugg MF. Muscle edema in musculoskeletal
tumors: MR imaging characteristics and clinical significance. J Magn Reson Imaging.
1991;1:441–449.
28. White LM, Wunder JS, Bell RS, et al. Histologic assessment of peritumoral edema in soft
tissue sarcoma. Int J Radiat Oncol Biol Phys. 2005;61:1439–1445.
29. Zhao F, Ahlawat S, Farahani SJ, et al. Can MR imaging be used to predict tumor grade in
soft-tissue sarcoma? Radiology. 2014;272:192–201.
30. Coindre JM, Terrier P, Contesso G, et al. Prognostic factors in adult patients with locally
controlled soft tissue sarcoma. A study of 546 patients from the French Federation of Cancer
Centers Sarcoma Group. J Clin Oncol. 1996;14:869-77.

14
31. Dong Y, Feng Q, Yang W, et al. Preoperative prediction of sentinel lymph node
metastasis in breast cancer based on radiomics of T2-weighted fat-suppression and diffusion-
weighted MRI. Eur Radiol. 2018;28:582–591.
32. Henderson S, Purdie C, Michie C, et al. Interim heterogeneity changes measured using
entropy texture features on T2-weighted MRI at 3.0 T are associated with pathological
response to neoadjuvant chemotherapy in primary breast cancer. Eur Radiol. 2017;27:4602–
4611.
33. Hocquelet A, Auriac T, Perier C, et al. Pre-treatment magnetic resonance-based texture
features as potential imaging biomarkers for predicting event free survival in anal cancer
treated by chemoradiotherapy. Eur Radiol. 2018;28:2801–2811.
34. Nketiah G, Elschot M, Kim E, et al. T2-weighted MRI-derived textural features reflect
prostate cancer aggressiveness: preliminary results. Eur Radiol. 2017;27:3050–3059.
35. Gnep K, Fargeas A, Gutiérrez-Carvajal RE, et al. Haralick textural features on T2 -
weighted MRI are associated with biochemical recurrence following radiotherapy for
peripheral zone prostate cancer. J Magn Reson Imaging. 2017;45:103–117.
33. Depeursinge A, Al-Kadi OS, Mitchell JR. Chapter 5 - Fractals for Biomedical Texture
Analysis. In: Academic Press, ed. Biomedical texture analysis. Fundamentals, tools and
challenges.1st edition, 2017;131-161.
36. Conners RW, Trivedi MM, Harlow CA. Segmentation of a high-resolution urban scene
using texture operators. Computer Vision, Graphics, and Image Processing. 1984;25:273–310.

15
TABLES : TABLE 1. Epidemiologic characteristics
Characteristics Patients (n=65)
Gender Male 38 (58.5)
Female 27 (41.5)
Age at diagnosis (y), mean ± sd 57.9 ± 12.8
Histotype Undifferentiated sarcoma1 33 (50.8)
Muscular sarcoma2 13 (20)
M/RC liposarcoma3 5 (7.7)
Other liposarcoma4 6 (9.2)
Synovial sarcoma 7 (10.8)
MPNST 1 (1.5)
Location Trunk wall 12 (18.5)
Pelvic Girdle 2 (3.1)
Shoulder Girdle 6 (9.2)
Upper limb 7 (10.8)
Lower limb 38 (58.5)
Depth Superficial 4 (6.2)
Deep 61 (93.8)
LD at baseline (mm), mean ± sd 119 ± 56
Nb cycles 4 cycles 22 (33.8)
5 or 6 cycles 43 (66.2) LD indicates longest diameter, sd indicates standard deviation, MPNST indicates malignant peripheral nerve sheath tumor. Data are numbers of patients with percentages in parentheses, except for age and LD. 1 : myxofibrosarcoma or undifferentiated sarcoma ; 2 : leiomyosarcoma and rhabdomyosarcoma ; 3 : myxoid/round cells liposarcoma ; 4 : pleomorphic or dedifferentiated liposarcoma.

16
TABLE 2. Association between demographic and semantic radiological features and histological response.
Variables Good_HR Poor_HR p-value Baseline clinico-radiological features Gender
Male 11 (68.8) 27 (55.1) 0.393
Female 5 (21.2) 22 (44.9)
Age at diagnosis (y) 58.8 ± 11.4 57.6 ± 13.3 0.873 Histotype
Undifferentiated sarcoma1 10 (62.5) 23 (46.9)
0.257
Muscular sarcoma2 5 (21.2) 8 (16.3) M/RC liposarcoma3 1 (6.3) 4 (8.2) Other liposarcoma4 0 (0) 6 (12.2) Synovial sarcoma 0 (0) 7 (14.3) MPNST 0 (0) 1 (2.1) Location Trunk wall 2 (12.5) 10 (20.4)
0.146 Pelvic Girdle 2 (12.5) 0 (0) Shoulder Girdle 1 (6.3) 5 (10.2) Upper limb 2 (12.5) 5 (10.2) Lower limb 9 (56.2) 29 (59.2) Depth
Superficial 1 (6.3) 3 (6.1) 1.000 Deep 15 (93.7) 46 (93.9)
Nb cycles 4 cycles 11 (68.8) 32 (65.3)
1.000 5 or 6 cycles 5 (21.2) 17 (34.7) LD on MRI_0 (mm) 146 (66) 110 (51) 0.038 * MRI_0 to MRI_1
Change in LD (%) -11.2 ± 20.8 2.9 ± 19.5 0.027 * RECIST 1.1 Complete Response 0 (0) 0 (0)
0.112 Partial Response 3 (18.8) 3 (6.1%) Stable Disease 13 (81.2) 39 (79.6) Progressive Disease 0 (0) 7 (14.3) Objective Response
Yes 3 (18.8) 3 (6.1) 0.154 No 13 (81.2) 46 (93.9)
Δ_Margin_definition§ Well- or better limited 5 (21.2) 9 (20)
0.490 stable or worst 11 (68.8) 36 (80) Δ_Edema
None or decrease 12 (75) 15 (30.6) 0.003 ** Stable or increase 4 (25) 34 (69.4)
Δ_Peritumoral enhancement§ None or decrease 12 (80) 24 (57.1)
0.134 Stable or increase 3 (20) 18 (42.9) Fibro-Necrotic Changes
No 2 (21.2) 14 (25.6) 0.430 < 50% tumor volume 9 (56.2) 23 (46.9)
≥ 50% tumor volume 5 (31.3) 12 (24.5) LD indicates longest diameter, sd insdicates standard deviation. MPNST indicates malignant peripheral nerve sheath tumor. Data are numbers of patients with percentages in parentheses, except for age, LD and change in LD. 1 : myxofibrosarcoma or undifferentiated sarcoma ; 2 : leiomyosarcoma and rhabdomyosarcoma ; 3 : myxoid/round cells liposarcoma ; 4 : pleomorphic or dedifferentiated liposarcoma. §: 8 patients had missing values for Δ_Peritumoral_enhancement and 4 for Δ_Margin_definition due to defective MR protocol (incomplete acquisition of edema on post contrast T1-WI, different acquisition plan on MRI_0 and MRI_1). * : p ≤ 0.05 ; ** : p ≤ 0.005.

17
TABLE 3. Association between delta-radiomics features and response in training cohort
Variables Good-HR Poor-HR p-value 1st order feature
Δ_Histogram_Entropy -0.185 ± 0.548 0.316 ± 0.406 0.002 ** Δ_Interval -0.037 ± 0.179 0.017 ± 0.260 0.524 Δ_Kurtosis 2.967± 10.329 -8.16 ± 24.83 0.056 Δ_Mean -0.071 ± 0.269 -0.078 ± 0.223 0.879 Δ_Skewness -0.015 ± 1.725 0.488 ± 2.261 0.598 Δ_Stdev -0.001 ± 0.094 0.090 ± 0.096 0.008 ** 2nd order features
Δ_ClusterProminence_1 496.6 ± 5280.8 6004 ± 10585 0.070 Δ_ClusterProminence_2 -366.7 ± 5075.7 5096 ± 8913 0.051 Δ_ClusterProminence_5 -816.9 ± 4070.6 3654 ± 6244 0.038 * Δ_ClusterShade_1 -154.97 ± 376.63 -86.6 ± 480.8 0.666 Δ_ClusterShade_2 -134.0 ± 347.6 -74.3 ± 410.9 0.631 Δ_ClusterShade_5 -97.1 ± 278.1 -56.3 ± 294.4 0.648 Δ_Energy_1 0.066 ± 0.134 -0.06 ± 0.104 0.015 * Δ_Energy_2 0.065 ± 0.126 -0.053 ± 0.096 0.014 * Δ_Energy_5 0.059 ± 0.118 -0.047 ± 0.089 0.010 * Δ_Entropy_1 -0.392 ± 1.474 0.945 ± 1.282 0.005 ** Δ_Entropy_2 -0.461 ± 1.559 0.984 ± 1.355 0.004 ** Δ_Entropy_5 -0.545 ± 1.596 0.988 ± 1.414 0.003 ** Δ_Homogeneity_1 0.001 ± 0.123 -0.083 ± 0.113 0.037 ** Δ_Homogeneity_2 0.014 ± 0.144 -0.093 ± 0.130 0.022 * Δ_Homogeneity_5 0.030 ± 0.160 -0.100 ± 0.146 0.014 ** Δ_Inertia_1 0.916 ± 1.431 1.843 ± 2.316 0.256 Δ_Inertia_2 1.587 ± 3.089 3.799 ± 4.640 0.137 Δ_Inertia_5 1.579 ± 5.708 6.992 ± 8.608 0.056 Shape features
Δ_Pixels_number 6695 ± 41169 2747 ± 80507 0.078 Δ_Elongation -0.081 ± 0.181 0.064 ± 0.191 0.019 * Δ_Equivalent_spherical_radius -2.065 ± 7.797 0.328 ± 10.323 0.266 Δ_Roundness -0.025 ± 0.051 -0.015 ± 0.083 0.714 Δ_Perimeter -20.517 ± 12737 1303 ± 16842 0.810 Δ_Physical_size -19716 ± 209957 31197 ± 391970 0.355 Δ_Flatness 0.200 ± 0.281 0.029 ± 0.249 0.019 * Δ_Perimeter_on_border_ratio -0.003 ± 0.006 0.002 ± 0.013 0.183 Δ_Feret_diameter -3.033 ± 23.707 5.45 ± 33.16 0.202
Data are given as mean and standard deviation. *: p<0.05, **: p<0.005

18
TABLE 4. Correlation matrix of the significant texture and shape features at univariate analysis
19
TABLE 5. Diagnostic performance of the classifiers on the 3 selected features for training and test cohorts (respectively cross-validation and final test steps).
Classifiers Accuracy AUROC Sensitivity Specificity PPV NPV Train Score
Training Cohort
Random Forest 88.1 (87.6-88.5) 0.86 (0.86-0.87) 94.1 (93.8-94.4) 66.3 (64.7-67.8) 90.9 (90.5-91.2) 76.2 (75.0-77.3) 0.98
K-nearest neighbors 80.5 (80.2-80.7) 0.81 (0.81-0.82) 97.3 (97.1-97.4) 20.5 (19.5-21.4) 81.3 (81.1-81.5) 66.9 (65.1-68.8) 1.00
Support Vector Machines 75.2 (74.5-75.8) 0.67 (0.66-0.68) 85.4 (84.7-86.2) 37.9 (36.5-39.3) 83.0 (82.6-83.3) 42.8 (41.3-44.4) 0.96
Logistic Regression 85.8 (85.6-86.0) 0.87 (0.86-0.87) 94.8 (94.8-94.9) 53.2 (52.5-53.9) 87.8 (87.6-87.9) 74.4 (74.1-74.7) 0.87
RECIST 1.1§ 76.0 0.66 57.0 90.9 66.7 21.3 _
Test Cohort
Random Forest 74.6 (73.7-75.5) 0.63 (0.62-0.63) 98.0 (97.2-98.8) 27.8 (25.9-29.7) 73.1 (72.6-73.7) 90.8 (87.2-94.5) 0.98
K-nearest neighbours 66.7 0.53 100.0 0.0 66.7 0.0 1.00
Support Vector Machines 53.3 0.52 80.0 0.0 61.5 0.0 0.98
Logistic Regression 66.7 0.46 90.0 20.0 69.2 50.0 0.86
RECIST 1.1§ 73.3 0.72 90.0 40.0 75.0 66.6 _
AUROC indicates area under the ROC curve, PPV indicates positive predictive value, NPV indicates negative predictive value. Accuracy, sensitivity, specificity, PPV and NPV are given in percentage with 95% confidence interval in parentheses. § Statistics are given for RECIST 1.1 in an objective response setting, that is to say ‘complete response or partial response’ vs. ‘stable disease or progressive disease’. AUROC corresponded to AUROC of relative change in longest diameter, on which RECIST 1.1 status is based.

20
FIGURE LEGENDS FIGURE 1: Radiomics pipeline. (a) First step consisted in MRI post-processing, including resampling (with a bi-linear interpolation), bias removal (N4) and normalization of signal intensities (with histogram-matching). The volume of interest was manually segmented, slice by slice, and then propagated on post-processed images, enabling the extraction of histogram-based, texture and shape features (b). This process was applied on baseline MRI and MRI after 2 cycles of neoadjuvant chemotherapy providing delta-radiomics features (Δ_features), which were rescaled (standard scaling). (c) Statistical method. In step 1, the whole data set was partitioned into a ‘Training Cohort’ and a ‘Test Cohort’. In step 2, the ‘Training cohort’ was used to build the model. It was based on a 10-fold cross-validation that consisted in separating the 50 patients into 10 blocks of 5 patients. For each of the 10 combinations, the classifier was trained on the subset of 9 blocks (blue squares), then validated on the remaining block (in light orange). At the end of the cross-validation, each block has been used once for validation (*). This whole process was repeated with different tuning parameters proper to each type of classifier (: hyperparameters, Supplemental Data) and different methods for features selection and preprocessing, until obtaining a model with the highest accuracy and area under the ROC curve (AUROC). Those optimal metrics are shown in the cross-validation section of the results. In step 3, a model with the optimal combination of parameters was fitted on the whole training cohort. This final model was tested on the independent test cohort (dark orange) and its diagnostic performance (accuracy, AUROC, PPV, NPV, specificity, sensitivity, negative/predictive value) was calculated. FIGURE 2: ROC curves of random forest model, logistic regression model and relative change in longest diameter from baseline to post-2 cycles of chemotherapy (% Change_LD) at cross-validation. Random forest and logistic regression were based on the optimal selection of features (Change in surrounding edema, change in histogram-entropy, change in Elongation). For each classifier, the individual scores of each sample from all folds are sorted together into a single ROC curve and then averaged across the 100 repetitions. FIGURE 3. Accuracy, AUROC, sensitivity and specificity of the random forest algorithm as functions of the numbers of features included in the model. These statistic metrics were calculated in the training cohort (a) and the test cohort (b). Features were added in the ascending order of their p-value (descending order of statistical significance) as listed in Table 1 and 2. The grey dashed vertical line emphasizes the initially selected 3-features model (changes in edema, histogram_entropy and elongation from baseline to post-2 cycles evaluation). FIGURE 4: Added value of final random forest (RF) model for early response prediction. (a) 76 years-old male presented with a deep-seated grade III pleomorphic rhabdomyosarcoma of the shoulder. After 2 cycles of chemotherapy, the tumor was stable according to RECIST 1.1 criteria, but it demonstrated an increase of its surrounding edema (white arrows), stability of its shape and stable histogram entropy. Hence, the final RF model predicted a poor histological response that was confirmed on surgical specimen (70% residual viable cells). (b) 50 years-old male presented with a deep-seated grade III undifferentiated pleomorphic sarcoma of the popliteal region. After 2 cycles of chemotherapy, the tumor was stable according to RECIST 1.1 criteria. Surrounding edema markedly decreased (white arrow heads) with a retraction of its shape on 3D reconstruction and a decreased entropy on normalized histogram. The final RF model predicted a good response that was confirmed on surgical specimen (5% residual viable cells). T2: T2-weighted imaging, FS: fat-sat, PD: proton-density weighted-imaging FIGURE 5: Outliers patients who were misclassified as poor responders by the model. (a) Example of massively necrotic tumor at baseline: 52 years-old male presented with deep-seated grade III undifferentiated pleomorphic sarcoma of the left thigh. Blood clots and fibrinous septa were mixed with necrosis (white arrow), only small buds of tumor were seen against tumor wall. Therefore, changes in tumor heterogeneity were mostly due to change in structure and signal of the necrotic-hemorrhagic compartment. (b) This patient benefited from a 18F-FDG-PET-CT at baseline and after two cycles showing a strong decrease of SUVmax (8.16 to 3.94, -51.7%) suggestive of chemotherapy efficacy. (c) Example of a ‘late responder’ profile: 66 years-old male presented with a deep-seated grade III pleomorphic rhabdomyosarcoma of the abdominal wall. No obvious change was seen by

21
visual assessment at early evaluation. (d) 18F-FDG-PET-CT demonstrated a slight paradoxical increase of SUVmax (22.34 to 24.32) although the patient was a good histological responder after 4 additional cycles of chemotherapy. T2-WI: T2 weighted imaging; Gd+ FS T1-WI: Fat-Sat T1 weighted imaging after Gadolinium-chelates injection.

22
FIGURE 1

23
FIGURE 2

24
FIGURE 3

25
FIGURE 4

26
FIGURE 5