Embed Size (px)
Citation preview

T/18P
BASS BASIN, TASMANIA
2001 SHELDUCK 2D SEISMIC SURVEY
FINAL REPORT
Origin Energy Resources Limited A.B.N. 66 007 845 338 South Tower John Oxley Centre 339 Coronation Drive MILTON QLD 4064 M Lonergan, November 2002
S:\T-18P\BA018 - T Technical\Shelduck FINAL 3-4-03.doc Page 2
TABLE OF CONTENTS PAGE NO.
1.0 INTRODUCTION....................................................................................................... 4
2.0 SURVEY OBJECTIVES .............................................................................................. 6
2.0 SURVEY OBJECTIVES .............................................................................................. 7
3.0 DATA ACQUISITION................................................................................................. 7 3.1 Program....................................................................................................... 7
4.0 DATA PROCESSING ................................................................................................. 9
5.0 DATA QUALITY...................................................................................................... 10
6.0 REGIONAL GEOLOGY AND STRATIGRAPHY ......................................................... 10
7.0 DATA INTERPRETATION & MAPPING ................................................................... 11 7.1 Interpretation ........................................................................................... 11 7.2 Time Mapping ........................................................................................... 13 7.3 Depth Mapping.......................................................................................... 13
8.0 PROSPECTS & LEADS ............................................................................................ 14
9.0 CONCLUSIONS....................................................................................................... 16
FIGURES
1. T/18P Location Map
2. Shelduck Seismic Survey Location Map
3. Seismic Line ORS01-04
4. Seismic Line ORS01-17
5. Seismic Line ORS01-13
6. Stratigraphy of the Bass Basin, Tasmania
7. Seismic Data Vintage Map

S:\T-18P\BA018 - T Technical\Shelduck FINAL 3-4-03.doc Page 3
TABLES
1. Recorded Program
APPENDICES
1. Seismic Data Acquisition Final Report
2. Seismic Data Processing Final Report
ENCLOSURES SCALE
1. Near Top EVCM Seismic Marker Time Structure 1:100,000
2. Base P. Asperopolus Seismic Marker Time Structure 1:100,000
3. Near Top Palaeocene Seismic Marker Time Structure 1:100,000
4. Near Top EVCM Seismic Marker Depth Structure 1:100,000
5. Base P. Asperopolus Seismic Marker Depth Structure 1:100,000
6. Near Top Palaeocene Seismic Marker Depth Structure 1:100,000
7. Near Top EVCM Seismic Marker Average Velocity 1:100,000
8. Base P. Asperopolus Seismic Marker Average Velocity 1:100,000
9. Near Top Palaeocene Seismic Marker Average Velocity 1:100,000

S:\T-18P\BA018 - T Technical\Shelduck FINAL 3-4-03.doc Page 4
1.0 INTRODUCTION
The 2001 Shelduck 2D Seismic Survey was undertaken by Origin Energy Resources Limited (OERL), as Operator, in T/18P in the central part of the Bass Basin, offshore Australia from 4 – 9 June 2001 (Figure 1). At the time of recording the survey, T/18P comprised the following Joint Venture (JV) participants:
Origin Energy Resources Limited 41.4 %
AWE Petroleum Limited 35.1 %
CalEnergy Gas (Australia) Limited 23.5 % The 2001 Shelduck Seismic Survey represented a fulfilment of the T/18P permit Year 2 work obligation of 375 kilometres of seismic. Twenty seismic lines totalling approximately 375km of full-fold 2D seismic line data were acquired by Fugro-Geoteam AS from 4 June 2001 to 9 June 2001, utilizing the RV Geo Arctic seismic vessel (Figure 2). Water depths in the area range on average from approximately 70m to 90m. Further details and technical specifications for the survey, including operational reports can be found in the Final Acquisition Report for the survey, contained in Appendix 1. Data processing was performed by CGG Australia in Perth. The Data Processing Report for the survey is contained in Appendix 2.

S:\T-18P\BA018 - T Technical\Shelduck FINAL 3-4-03.doc Page 5
TASMANIA
VICTORIABallarat
Hobart
Launceston
LongfordMaffra
Melbourne
Port Latta
Sale
Yolla Field
0 20 40 60 80 100
KILOMETRES
T/18P
LOCATION
Figure 1 Location of Bass Basin petroleum exploration permit T/18P

S:\T-18P\BA018 - T Technical\Shelduck FINAL 3-4-03.doc Page 6
145 20 00 E 145 40 00 E40
00
00
S39
40
00
S
360000M E 380000M E 400000M E
5540
000M
N55
6000
0M N
5580
000M
N56
0000
0M N
5 620
000M
N
40 1
7 1
5 S
39 3
3 4
9 S
145 09 08 E 145 50 15 E
ORS01-01
ORS01-01
ORS01-02
ORS01-02
ORS01-03
ORS01-03
ORS01-04
ORS01-04
ORS01-05
ORS01-05
ORS
01-0
6
OR
S01-
06
ORS01-07
ORS01-07
ORS01-08
ORS01-08
ORS01-09
ORS01-09
ORS01-10
ORS01-10
ORS01-11
ORS01-11
ORS01-12
ORS01-12
ORS01-
13
ORS01-
13
ORS01-14
ORS01-14
ORS01-15
ORS01-15
ORS01-16
ORS01-16
ORS01-17
ORS01-17
ORS01-18
ORS01-18
ORS01-19
ORS01-19
ORS01-20
ORS01-20
Aroo 1
Barramundi 1
Bass 1
Bass 3
Cormorant 1
King 1
Koorkah 1
Narimba 1
Tarook 1
White Ibis 1
Yolla 1
Yolla 2
T/18P T/RL1
T/18P
TASMANIA
VICTORIABallarat
Hobart
Launceston
LongfordMaffra
Melbourne
Port Latta
Sale
Yolla Field
145 20 00 E 145 40 00 E40
00
00
S39
40
00
S
360000M E 380000M E 400000M E
5540
000M
N55
6000
0M N
5580
000M
N56
0000
0M N
5 620
000M
N
40 1
7 1
5 S
39 3
3 4
9 S
145 09 08 E 145 50 15 E
1 : 100,000
0 2 4 6 8 10
KILOMETRES
Aroo East
Aroo Updip
Chappell
Trefoil
Montague
Robbins
Bass 3 Updip
White Ibis Field
Yolla Field
Figure 2 Location of 2001 Shelduck 2D Seismic Survey lines and relevant leads and prospects

S:\T-18P\BA018 - T Technical\Shelduck FINAL 3-4-03.doc Page 7
2.0 SURVEY OBJECTIVES
The 2001 Shelduck Seismic Survey represented a fulfilment of the T/18P permit Year 2 work obligation of 375 kms of seismic. The key objectives of the survey were: • to mature the Chappell lead to drillable status by infilling the existing
grid to approximately 500m spacing. • to mature the Aroo East lead to drillable status by providing infill
structural control. • to provide pre-detail control over the Montague and Robbins leads by
decreasing the existing dip grid to approximately 1km spacing. • to intersect the maximum of the Palaeocene AVO anomaly recognised at
the Trefoil prospect and provide a direct tie back to Aroo-1 for calibration purposes.
3.0 DATA ACQUISITION
3.1 Program
The final recorded program consisted of twenty (20) 2D seismic lines totalling 424.1 km. Full-fold data represents approximately 375 km of this total. The programme as recorded is summarised in Table 1 below.
TABLE 1
RECORDED PROGRAM
Line Number Shotpoints Kms S.O.L. E.O.L.
ORS01-01 870 1802 17.48 ORS01-02 1000 2144 21.45 ORS01-03 1000 2091 20.46 ORS01-04 870 2014 21.46 ORS01-05 1000 1984 18.45 ORS01-06 1000 1984 18.45 ORS01-07 1000 1985 18.47 ORS01-08 1000 1986 18.49 ORS01-09 870 1801 17.46 ORS01-10 870 1828 17.96 ORS01-11 870 1748 16.46 ORS01-12 1000 2518 28.46 ORS01-13 870 2706 34.43 ORS01-14 870 2548 31.46 ORS01-15 1000 2198 22.46 ORS01-16 870 1801 17.46 ORS01-17 1000 2331 24.96 ORS01-18 870 1802 17.48 ORS01-19 1000 2250 23.44 ORS01-20 870 1800 17.44 Sub Total 424.14

S:\T-18P\BA018 - T Technical\Shelduck FINAL 3-4-03.doc Page 8
Acquisition parameters for the 2001 Shelduck Seismic Survey are summarised as follows:
Source Data
Total Water Depth 63 - 81 metres
Source : Sodera G Air Gun Array
Number of Arrays : 1
Number of Sub-Arrays : 4
Gun Depth : 5 metres
Volume : 2860 cu.in
Pressure : 2000 psi
Shot Interval 18.75 metres
Receiver Data
Number of Streamers : 1
Streamer Depth 7.5 meters , 10 m for line ORS01-15A
Streamer Length : 4600 metres
Number of Channels 368
Near channel number : 1
Near trace offset : 150 metres
Group Interval : 12.5 metres
Nominal Stacking Fold : 123
Recording Instruments
Recording System : I/O MSX Seismic Recording System
Recording Format : SEG-D 8058, 3590 cartridges
Record Length : 5120 milliseconds
Sample Interval : 2 milliseconds
Recording Filter
Low cut : 4Hz – 12 dB/oct
High cut : 206Hz, - 264 dB/oct
Recording commenced at the southern end of the grid on 4 June 2001 and was completed on 9 June 2001. Details of recording are contained in the final data acquisition report included as Appendix 1.
S:\T-18P\BA018 - T Technical\Shelduck FINAL 3-4-03.doc Page 9
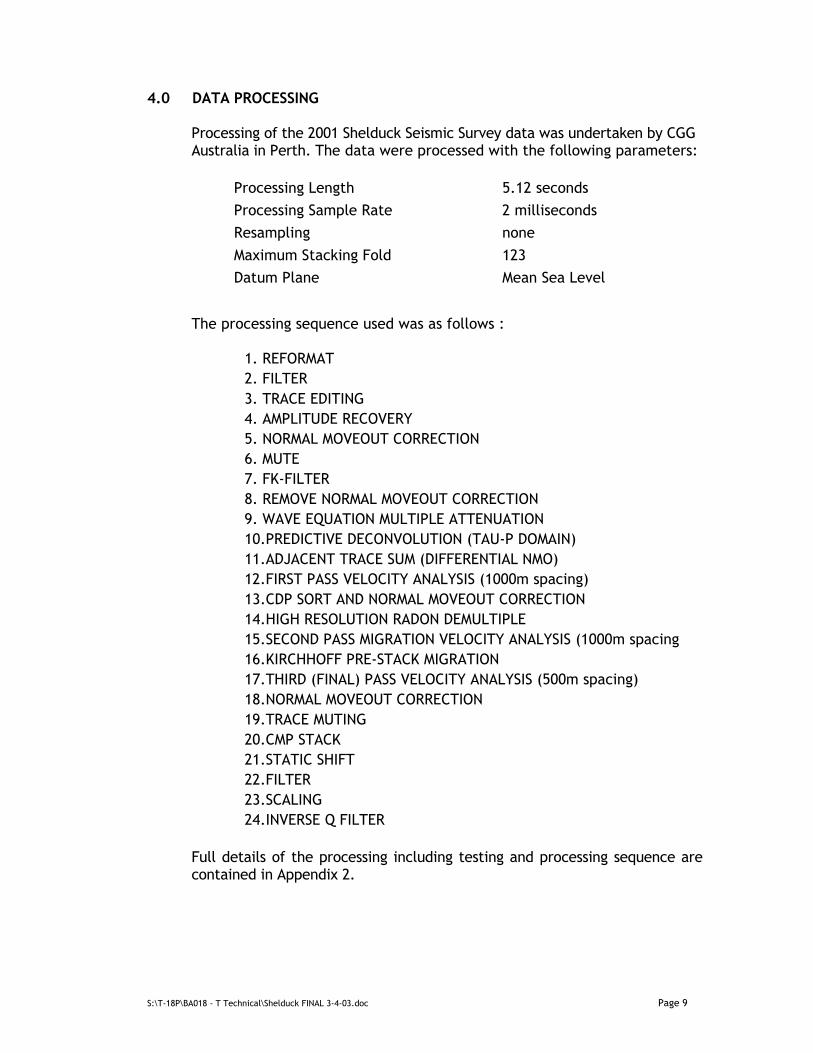
4.0 DATA PROCESSING Processing of the 2001 Shelduck Seismic Survey data was undertaken by CGG Australia in Perth. The data were processed with the following parameters:
Processing Length 5.12 seconds Processing Sample Rate 2 milliseconds Resampling none Maximum Stacking Fold 123 Datum Plane Mean Sea Level
The processing sequence used was as follows :
1. REFORMAT 2. FILTER 3. TRACE EDITING 4. AMPLITUDE RECOVERY 5. NORMAL MOVEOUT CORRECTION 6. MUTE 7. FK-FILTER 8. REMOVE NORMAL MOVEOUT CORRECTION 9. WAVE EQUATION MULTIPLE ATTENUATION 10.PREDICTIVE DECONVOLUTION (TAU-P DOMAIN) 11.ADJACENT TRACE SUM (DIFFERENTIAL NMO) 12.FIRST PASS VELOCITY ANALYSIS (1000m spacing) 13.CDP SORT AND NORMAL MOVEOUT CORRECTION 14.HIGH RESOLUTION RADON DEMULTIPLE 15.SECOND PASS MIGRATION VELOCITY ANALYSIS (1000m spacing 16.KIRCHHOFF PRE-STACK MIGRATION 17.THIRD (FINAL) PASS VELOCITY ANALYSIS (500m spacing) 18.NORMAL MOVEOUT CORRECTION 19.TRACE MUTING 20.CMP STACK 21.STATIC SHIFT 22.FILTER 23.SCALING 24.INVERSE Q FILTER
Full details of the processing including testing and processing sequence are contained in Appendix 2.

S:\T-18P\BA018 - T Technical\Shelduck FINAL 3-4-03.doc Page 10
5.0 DATA QUALITY
Data quality of the 2001 Shelduck lines is generally good, characterized by relatively high signal-to-noise and good event continuity, especially in the zone of interest from approximately 1.5 to 3.0 seconds two-way time (Figure 3). Faults have generally been imaged well, particularly on “true” dip lines. Data quality in the vicinity of the Robbins and Montague leads is only fair however, due to the highly faulted nature of the area (Figure 4). Data in the vicinity of volcanic intrusions in T/18P are also compromised and show little or no reflection character as expected (Figure 5).
6.0 REGIONAL GEOLOGY AND STRATIGRAPHY
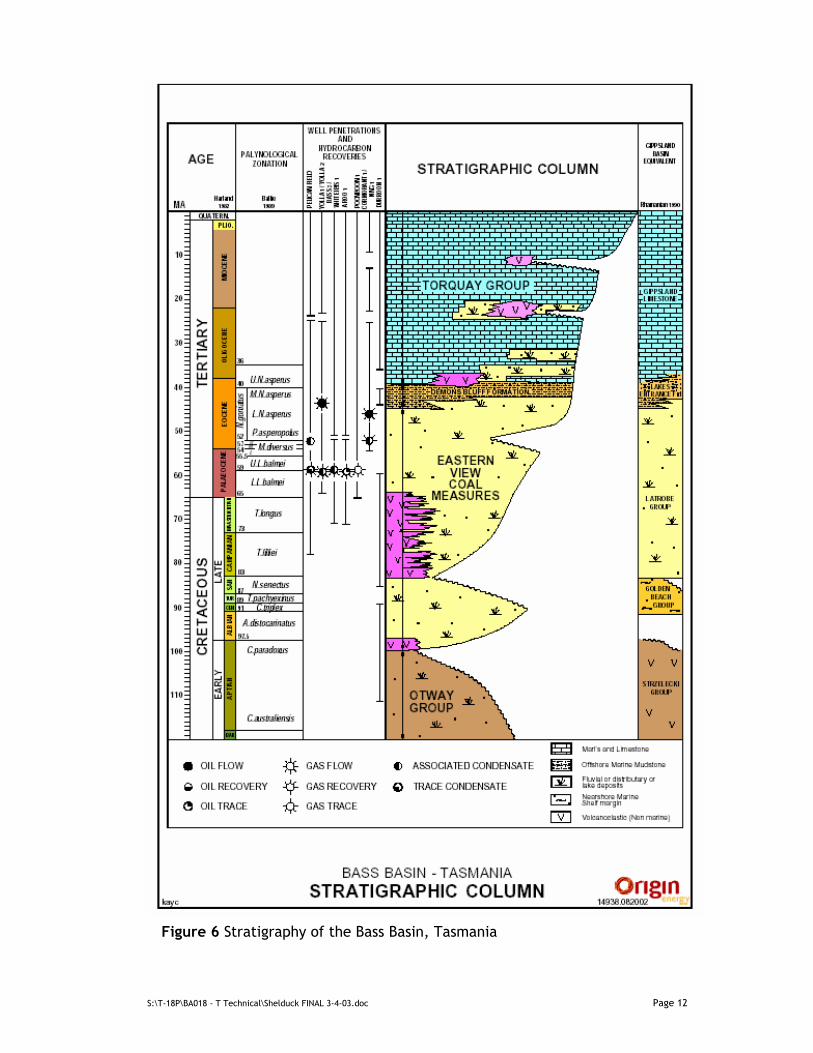
The Bass Basin is located offshore in south-eastern Australia between Victoria and Tasmania. It is one of a series of sedimentary basins along the southern margin of Australia that were formed during the Early to Late Cretaceous as a result of rifting between Australia and Antarctica and, to a lesser extent, Tasman Sea rifting. The Bass Basin is a failed intra-cratonic rift basin with structural features which highlight three separate phases of evolution: 1) initial northeast-southwest extension during the early Cretaceous, 2) Late Cretaceous to Pliocene thermal subsidence and 3) Miocene compression. The Pelican, Yolla and Cormorant Troughs comprise the major depocentres in the Bass Basin. These are fault-bounded half-grabens that progressively developed via growth faulting during the active rifting and thermal subsidence phases of basin evolution. The dominant structural trend in the basin is northwest-southeast, highlighted by the orientation of the major faults and troughs. The stratigraphic succession in the Bass Basin comprises sediments ranging in age from Early Cretaceous to Recent (Figure 6). The Early Cretaceous Otway Group rests unconformably on pre-rift Palaeozoic black shales and quartzites and consists of clastic, volcaniclastic, fluvial and deltaic sediments ranging from coarse-grained sandstone to shale and coal. Overlying the Otway Group are the prospective Early Cretaceous to Late Eocene Eastern View Coal Measures (EVCM) which comprise a thick succession of sandstone, siltstone, shale and coal, deposited primarily within fluvial, deltaic and lacustrine depositional environments. Seismic data suggests that the EVCM is over 4000m thick in the Troughs. The EVCM thins markedly towards the basin margins and exhibits both onlap onto basement and erosional truncation. In a broad sense, the EVCM can be divided into three sequences separated by erosional unconformities. The middle sequence was penetrated in Bass-1 and Yolla-1 and –2 and contains the major gas accumulations in the Yolla Field. This sequence is bounded at the base by the N. senectus unconformity and at the top by the upper M. diversus unconformity.

Seismic Line ORS01-04
NESWTw
o-W
ay T
ime
(sec
)
Top EVCM
Base P. Asperopolus
Top Palaeocene
Figure 3 Seismic line indicating general Shelduck data quality around zone of interest
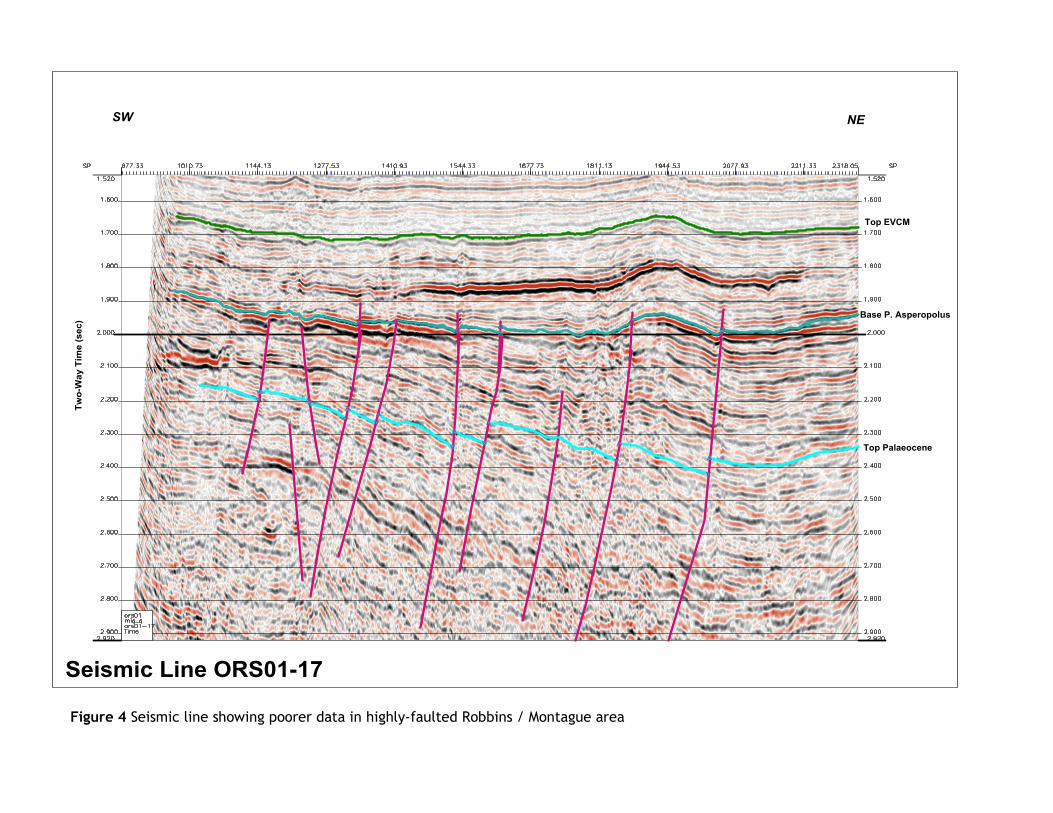
Seismic Line ORS01-17
NESW
Two-
Way
Tim
e (s
ec)
Top EVCM
Base P. Asperopolus
Top Palaeocene
Figure 4 Seismic line showing poorer data in highly-faulted Robbins / Montague area

Seismic Line ORS01-13
NESWTw
o-W
ay T
ime
(sec
)
Top EVCM
Base P. Asperopolus
Top Palaeocene
Volc
ano
Figure 5 Seismic line showing poorer data in vicinity of volcanics
145 20 00 E 145 40 00 E
40 0
0 0
0 S
360000M E 380000M E 400000M E
5580
000M
N56
0000
0M N
40 0
6 1
5 S
39 3
8 4
9 S
145 09 08 E 145 56 15 E
T/18P T/RL1
T/18P
145 20 00 E 145 40 00 E
40 0
0 0
0 S
360000M E 380000M E 400000M E
5580
000M
N56
0000
0M N
40 0
6 1
5 S
39 3
8 4
9 S
145 09 08 E 145 56 15 E
Aroo East
Aroo Updip
Chappell
Trefoil
Montague
Robbins
Bass 3 Updip
White Ibis Field
Yolla Field
Aroo 1
Barramundi 1
Bass 1
Bass 3
Tarook 1
White Ibis 1
Yolla 1
Yolla 2
0 2 4 6 8 10
KILOMETRES
LEGENDSeismic Data
ORS01 Series (Shelduck)
BHB96 Series
BBS81 Series
SB94A Series
TNK4 Series
TQH5 Series
Yolla 3D
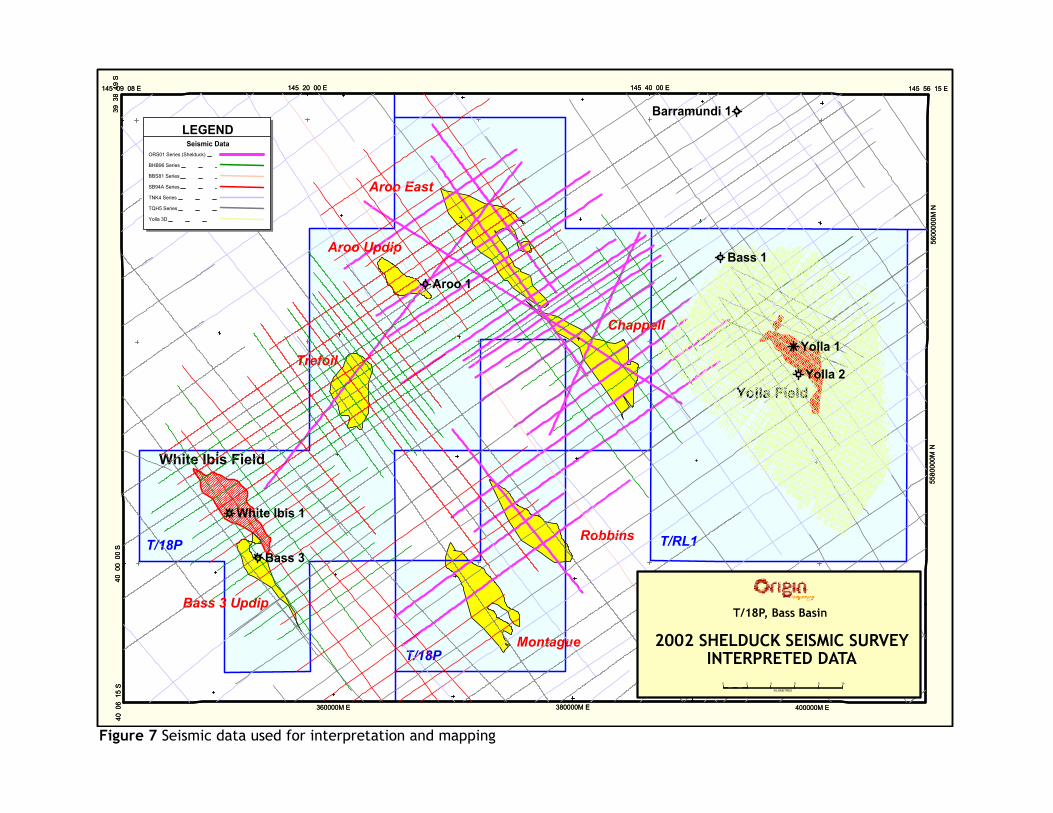
Figure 7 Seismic data used for interpretation and mapping

S:\T-18P\BA018 - T Technical\Shelduck FINAL 3-4-03.doc Page 11
Conformably overlying the EVCM is the Late Eocene Demon’s Bluff Formation. Lithologically this unit consists of a basal sequence of fine-grained carbonaceous shale and siltstone deposited in an open marine environment. The unit has an average thickness over the basin of approximately 120 m, but thins toward the basin margins. The Demon’s Bluff Formation provides a regional top seal to hydrocarbons reservoired in the top-most sandstone units of the EVCM as demonstrated in Yolla-1. The Demon’s Bluff Formation is overlain by the Oligocene to Pliocene age Torquay Group which broadly consists of a basal sequence of marls and calcareous shales which grade upwards into a succession of bioclastic limestones. In addition to extrusive igneous rocks associated with basal and intra-EVCM unconformities, intrusive and extrusive igneous rocks of Oligocene and Miocene age have been intersected in a number of wells drilled in the Bass Basin. Seismic data allow the mapping of the shallow volcanic rocks with a high level of confidence, in contrast to the intrusives and deeper extrusives which are difficult to image.
7.0 DATA INTERPRETATION & MAPPING
Interpretation and mapping of the 2001 Shelduck Seismic Survey seismic data was undertaken in conjunction with regional mapping within T/18P aimed at producing an updated inventory of leads and prospects, particularly in the northeastern portion of the permit in the vicinity of the Chappell and Aroo East leads. Mapping was also focused on the Montague and Robbins area in the southern portion of the permit. Figure 7 shows the grid of seismic used for the interpretation. Interpretation was undertaken utilising Schlumberger’s IESX software within Geoframe Version 3.8. Mapping was carried out using Petrosys Version 11.3 software.
7.1 Interpretation
Based on well ties at Aroo-1, White Ibis-1, Bass-3 and Yolla-1 and –2, three key horizons were interpreted regionally with the rationale behind picking each as follows: Near Top EVCM Seismic Marker - Provides structural configuration for prospective Mid-Eocene hydrocarbon reservoirs (cf. Yolla, Pelican, Cormorant-1). Base P. asperopolus Seismic Marker – Provides structural control on a key unconformity within the EVCM. Useful for defining overall form of deeper horizons in the Palaeocene where signal-noise and continuity of seismic events is problematic.
S:\T-18P\BA018 - T Technical\Shelduck FINAL 3-4-03.doc Page 12
Figure 6 Stratigraphy of the Bass Basin, Tasmania

S:\T-18P\BA018 - T Technical\Shelduck FINAL 3-4-03.doc Page 13
Near Top Palaeocene Seismic Marker - Provides structural configuration for prospective Palaeocene hydrocarbon reservoirs within the Upper and Lower L. balmei palynological zones (cf. Yolla, White Ibis). The top EVCM and base P. asperopolus events are fair to good quality, regionally extensive events. The top Palaeocene is however poor to fair and in a lot of areas is inferred based on the base P. asperopolus event.
7.2 Time Mapping
Based on the interpretation above, the following regional two-way time structure maps were produced:
• Near Top EVCM Seismic Marker Time Structure (Enclosure 1)
• Base P. asperopolus Seismic Marker Time Structure (Enclosure 2)
• Near Top Palaeocene Seismic Marker Time Structure (Enclosure 3) All time maps are characterised by an apparent ring of volcanoes of Miocene age in the vicinity of T/18P.
7.3 Depth Mapping The velocity field in the vicinity of T/18P is complicated by volcanic intrusives/extrusives, with “pull-up” recognized on time sections due to anomalously high velocities in the vicinity of the volcanics. Under normal circumstances a relatively simple depth conversion approach using time/depth relationship from wells would be considered. However, in the interests of better defining the rather complex velocity field, average velocity maps were derived from smoothed seismic stacking velocities calibrated to average velocities at well control, derived from seismic time/depth pairs. The depth conversion was carried out utilising these average velocity maps applied to the relevant two-way time map.
Using the method above, the following regional depth maps were produced:
• Near Top EVCM Seismic Marker Depth Structure (Enclosure 4)
• Base P. Asperopolus Seismic Marker Depth Structure (Enclosure 5)
• Near Top Palaeocene Seismic Marker Depth Structure (Enclosure 6)
The corresponding average velocity maps are included as Enclosures 7, 8 and 9.

S:\T-18P\BA018 - T Technical\Shelduck FINAL 3-4-03.doc Page 14
Few significant four-way dip closures are recognised on the top EVCM depth map (Enclosure 7). The only feature with reasonable areal closure is the fault-bounded structure at White Ibis.
Only minor faulting is recognised at the top EVCM level, with the predominant trend being northwest-southeast in keeping with the initial rift architecture of the Bass Basin. The more east-west structural trend also recognised on the top EVCM map is interpreted to represent a structural overprint resulting from a structuring event in the late Eocene.
The top Palaeocene depth structure map (Enclosure 6) is characterised by extensive northwest-southeast, basement-involved, normal faulting. These faults are interpreted to be early basin rift faults that have been reactivated in the Palaeocene/Eocene. The mapping suggests that with the exception of the Trefoil prospect, all structural plays within the Palaeocene are reliant on bounding faults for any significant closure.
8.0 PROSPECTS & LEADS
The Shelduck Seismic Survey addressed the following key prospects and leads: Chappell
The Chappell Prospect is located approximately 15 km west of the Yolla Gas Field in water depths of approximately 78 m. The feature is structurally complex and is interpreted as a narrow horst created by the merging of two northwest-southeast trending normal faults at potential reservoir levels within the EVCM (Enclosures 2 and 3). Possible strike-slip movement along the faults is also interpreted.
The Shelduck seismic data has better defined fault location and linkage for the Chappell feature. Whilst the confidence of fault mapping is still limited by the 2D grid, the overall closure is considered robust based on local structural style and setting. A primary risk associated with Chappell is the reliance on fault seal for trapping significant quantities of hydrocarbons.
Chappell is mapped at the top Palaeocene with approximately 5.3 km2 of fault-independent areal closure and 45 m of vertical closure. If all faults are considered to seal, the potential pool size can be extended down to the lowest closing contour with 25.7 km2 of fault-dependent areal closure and 230 m of vertical closure being mapped (Enclosure 6).

S:\T-18P\BA018 - T Technical\Shelduck FINAL 3-4-03.doc Page 15
Aroo East
The Aroo East Prospect is located approximately 6 km northeast of Aroo-1 and 28 km northwest of the Yolla Gas Field in water depths of approximately 76 m. The feature is immediately adjacent to Chappell and is interpreted at potential reservoir levels within the EVCM as an anticlinal closure associated with a narrow northwest-southeast trending half-graben (Enclosures 2 and 3). It is constrained by two northeast dipping normal faults on which the feature is reliant for the greater part of its closure.
The Shelduck seismic data has better defined fault location and linkage for the Aroo East feature with enhanced confidence in fault mapping. Clearly, a primary risk associated with Aroo East is the reliance on fault seal for trapping significant quantities of hydrocarbons.
Aroo East is mapped at the top Palaeocene with approximately 0.4 km2 of fault-independent areal closure and 5 m of vertical closure. If all faults are considered to seal, the potential pool size can be extended down to the lowest closing contour with 38 km2 of fault-dependent areal closure and 185 m of vertical closure being mapped (Enclosure 6).
Trefoil
The Trefoil Prospect is located approximately 37 km west of the Yolla Gas Field in water depths of approximately 68 m. The feature is mapped as a relatively simple fault-independent, four-way dip closure in the Palaeocene and Eocene (Enclosures 2 and 3). The single Shelduck line across Trefoil (ORS01-13) has enabled better definition of a structural crest however the feature is still viewed as structurally subtle, being mapped with less than 15 ms vertical closure at the top Palaeocene (Enclosure 6).
The existing Trefoil seismic grid was subjected to reprocessing in mid-2002 and in conjunction with the Shelduck data will form the basis of a detailed remapping study, incorporating PSDM and HSVA depth conversion as well as AVO analysis to investigate previously recognised AVO anomalies on the data.
Aroo Updip
The Aroo Updip Prospect is located immediately to the west of Aroo-1 and approximately 33 km westnorthwest of the Yolla Gas Field in water depths of approximately 74 m. The feature is interpreted as a northwest-southeast trending, fault-controlled anticline at potential reservoir levels within the EVCM.
The Shelduck seismic data has enabled better definition of the Aroo structure that was tested by Aroo-1 in 1974. Time mapping at the top Palaeocene indicates clear updip structure from Aroo-1, however it appears to be fault-dependent (Enclosure 3). Depth mapping at the top Palaeocene also demonstrates similar updip fault-dependent closure albeit with a small associated amount of fault-independent closure (Enclosure 6).

S:\T-18P\BA018 - T Technical\Shelduck FINAL 3-4-03.doc Page 16
Aroo Updip is mapped at the top Palaeocene with approximately 0.7 km2 of fault-independent areal closure and 5 m of vertical closure. If the bounding fault is considered to seal, the potential pool size can be extended down to the lowest closing contour with 6.1 km2 of fault-dependent areal closure and 35 m of vertical closure being mapped (Enclosure 6).
Robbins and Montague
The Robbins and Montague leads are located approximately 26 km and 33 km southwest respectively of the Yolla Gas Field in water depths of approximately 72 to 76 m. Both features were previously mapped as elongate, fault dependent, northwest-southeast trending anticlines within the prospective Eocene and Palaeocene sections of the EVCM. No closure was recognised at the top of the EVCM. The infill Shelduck seismic data has served to provide more information on the extent and linkage of faults in the area and in the process both Robbins and Montague have decreased significantly in size. As such, they are no longer regarded as being of economic size for structurally trapped hydrocarbons.
9.0 CONCLUSIONS
The Shelduck 2D survey has increased the accuracy of structural interpretation and mapping within T/18P and made it possible to further evaluate the hydrocarbon prospectivity of the permit.
Chappell and Aroo East leads have been highgraded by the infill Shelduck data, however their structural complexity warrants possible future 3D seismic coverage to further reduce structure and seal risks associated with the bounding faults on these plays.
The Montague and Robbins leads have been significantly reduced in size as a result of the Shelduck mapping and as such are no longer considered viable exploration targets.


