Embed Size (px)
Citation preview

Social Security Bulletin, Vol. 75, No. 2, 2015 57
IntroductionThe Census Bureau has recently begun the annual publication of alternative estimates of poverty for the U.S. population based on new methods intended to address shortcomings in the official measure of poverty. The new Supplemental Poverty Measure (SPM) produces a somewhat higher overall estimate of the number of poor and substantially alters the composition of the poverty population—much less child poverty, much more aged poverty, and more poor nonaged adults.
In this article, we present a detailed examination of poverty among nonaged adults (those aged 18–64). This age group accounts for 60 percent of persons who are poor under the SPM. Our analysis employs public-use microdata files recently released by the Census Bureau. For a more comprehensive view of poverty and comparison purposes, we present some findings for younger and older segments of the population.1 We compare and contrast the poverty estimates produced under the official and new measures for 2011. We also attempt to discern why the SPM and official estimates differ.
The choice of poverty measure affects the poverty status of participants in the Social Security Admin-istration’s (SSA’s) Old-Age, Survivors, and Disability Insurance (OASDI) program and the Supplemental Security Income (SSI) program administered by SSA. Moreover, these programs have substantial effects on the poverty status of nonaged adults. About 90 percent of SPM-poor nonaged adults are in family units that pay payroll taxes. About a fifth of nonaged adults are in units receiving Social Security (OASDI) benefits or SSI payments.
The official poverty measure consists of a set of thresholds for families of different sizes and
Selected Abbreviations
CPS/ASEC Current Population Survey’s Annual Social and Economic Supplement
FCSU food, clothing, shelter, and utilitiesLIHEAP Low-Income Home Energy Assistance
ProgramMOOP medical out-of-pocket [expenses]
* The authors are with the Office of Economic Analysis and Comparative Studies, Office of Research, Evaluation, and Statistics, Office of Retirement and Disability Policy, Social Security Administration.
Note: Contents of this publication are not copyrighted; any items may be reprinted, but citation of the Social Security Bulletin as the source is requested. The Bulletin is available on the web at http://www.socialsecurity.gov/policy/docs/ssb/. The findings and conclusions presented in the Bulletin are those of the authors and do not necessarily represent the views of the Social Security Administration.
The SupplemenTal poverTy meaSure (Spm) and nonaged adulTS: how and why The Spm and official poverTy eSTimaTeS differby Benjamin Bridges and Robert V. Gesumaria*
In November 2011, the Census Bureau released its first report on the Supplemental Poverty Measure (SPM). The SPM addresses many criticisms of the official poverty measure, and its intent is to provide an improved statisti-cal picture of poverty. This article examines the extent of poverty identified by the two measures. We present a detailed examination of poverty among nonaged adults (those aged 18–64). For a more comprehensive view of poverty and comparison purposes, some findings are presented for younger and older segments of the popula-tion. We compare and contrast poverty estimates produced under the official and new measures and investigate why the official and SPM estimates differ.
58 http://www.socialsecurity.gov/policy/docs/ssb/
compositions that are compared with before-tax cash income to determine a family’s poverty status.2 That measure was developed in the early 1960s by SSA’s Mollie Orshansky. The poverty thresholds associated with the official measure are the minimum amounts of such income that families of particular sizes and compositions need in order to be considered not poor.3 When they were developed, the official thresholds rep-resented the cost of a minimum food diet multiplied by 3 (to allow for expenditures on other goods and services). The thresholds have been kept constant in purchasing power over time by increasing their money values to keep pace with increases in the general price level.
Critics of the official measure point out that the offi-cial income or resource measure fails to account for noncash government benefits, taxes, medical out-of-pocket (MOOP) expenses, and work expenses. Those critics also argue that the official thresholds are a very narrow measure of necessary expenditures—that is, food—and are based on very old data. The official thresholds also fail to adjust for geographic differences in the cost of living.4
In November 2011, the Census Bureau released its first report on the new SPM (Short 2011).5 The SPM addresses numerous concerns of official measure crit-ics, and its intent is to provide an improved statistical picture of poverty. The SPM income or resource mea-sure is cash income plus in-kind government benefits (such as food stamps and housing subsidies) minus nondiscretionary expenses (taxes, MOOP expenses, and work expenses). The SPM thresholds are based on a broad measure of necessary expenditures—food, clothing, shelter, and utilities (FCSU)—and are based on recent, annually updated expenditure data. The SPM thresholds are adjusted for geographic differ-ences in the cost of living.6
The official poverty measure and the SPM produce rather different estimates of the composition of pov-erty among demographic and socioeconomic groups (by race, Social Security beneficiary status, and so forth). Moreover, the impact of taxes (payroll taxes, refundable tax credits, and income taxes) and in-kind government benefits (food stamps, housing subsidies, and so forth) are directly reflected in SPM estimates, but not in the official poverty estimates.
In the next section, we describe in more detail the various features of the SPM (unit definition, resource measure, and threshold measure) and contrast them with the corresponding features of the official poverty measure. In the following two sections, we present for 2011 an empirical examination of the two poverty measures. First, for various groups, we compare the SPM poverty estimates with official estimates. We present some estimates for all age groups, but focus on persons aged 18–64. Then, for nonaged adults, we estimate the effects of various features of the SPM on poverty levels. In effect, we attempt to discern why SPM estimates for nonaged adults differ from official estimates.
We find that for the total population, the SPM poverty rate (16.1 percent) exceeds the official rate (15.1 percent).7 For broad age groups, the SPM and official measures give quite different results. For persons aged 18–64, the SPM poverty rate (15.6 per-cent) exceeds the official rate (13.7 percent). Compared with the official measure, the SPM shows much more poverty for persons aged 65 or older (an increase in the poverty rate from 8.7 percent to 15.1 percent) and much less poverty for persons younger than age 18 (a decrease from 22.3 percent to 18.2 percent). Higher SPM poverty rates are found for nearly all of the age subgroups in the 18–64 range.
Many people are classified as poor by only one of the two measures. Five percent of the nonaged adults in our sample are counted as nonpoor by the official measure, but as poor by the SPM. On the other hand, 3.1 percent of nonaged adults are counted as poor by the official measure, but as nonpoor by the SPM.
We examine poverty of nonaged adults for vari-ous demographic and socioeconomic groups. Among the groups with the largest percentage increases in poverty when shifting from the official measure to the SPM are persons with private health insurance, per-sons in units that have an owner with a mortgage, and those of Asian descent.8 Among the groups with little to no change in poverty are blacks, persons in units that have a homeowner with no mortgage, persons
Selected Abbreviations—Continued
MSA metropolitan statistical areaNSLP National School Lunch ProgramSNAP Supplemental Nutrition Assistance
ProgramSPM Supplemental Poverty MeasureSSA Social Security AdministrationSSI Supplemental Security IncomeWIC Special Supplementary Nutrition Program
for Women, Infants, and Children

Social Security Bulletin, Vol. 75, No. 2, 2015 59
residing in the Midwest, women, and persons who did not work during the year. Two groups have substan-tial decreases in poverty: persons with public health insurance only and those residing outside metropolitan statistical areas (MSAs).
As we show later, the combined effect of all changes (from the official poverty measure to the SPM) in the resource measure increases the poverty rate of non-aged adults by 1.7 percentage points. The combined effect of all the changes in the threshold measure increases the poverty rate by 2.8 percentage points.
Key Features of the Official Poverty Measure and the SPMMeasurement of poverty within the population has three critical elements:1. Unit measures. Which individuals in a household
can reasonably be expected to share resources?2. Resource measures. What should be counted as
resources?3. Threshold measures. What minimum resources are
required to be considered nonpoor?
In this section, we consider each of those elements in turn.9 The SPM and official poverty estimates examined in this article use the public-use version of the 2012 Current Population Survey’s Annual Social and Economic Supplement (CPS/ASEC), which gives income amounts for calendar year 2011.10 In the fol-lowing three subsections, we describe the official and SPM elements as they were implemented for the 2012 CPS/ASEC. Box 1 summarizes the conceptual differ-ences between the two poverty measures.
Unit MeasuresThe official measure uses as its unit of analysis the Cen-sus-defined family, which includes all persons residing together who are related by birth, marriage, or adop-tion; it treats all unrelated individuals aged 15 or older independently. Proponents of the SPM unit criticize the failure of the official unit to include all persons at an address who are likely to share resources. In particular, those proponents believe that the official-unit concept does not treat cohabiters and their relatives properly.
Proponents of the SPM believe that the SPM unit better represents the unit that shares economic
Box 1. Poverty measure concepts: Official and SPM
Concept Official poverty measure Supplemental Poverty Measure (SPM)
Unit definition Conventional definition: Families and unrelated individuals
Broadened definition: All related individuals who live at the same address, including any cohabiters and their relatives and foster children
Resource measure Before-tax cash income Cash income plus noncash transfers (such as food
stamps and housing subsidies) and refundable tax credits
minus income and payroll taxes, medical out-of-pocket expenses, and work expenses (includes childcare expenses)
Threshold level for base two-adult/two-child unit
Three times the cost of a minimum food diet (from the Department of Agriculture), updated by the U.S. Consumer Price Index
33rd percentile of expenditures on food, clothing, shelter, and utilities (from recent Bureau of Labor Statistics surveys) multiplied by 1.2
Threshold adjustments Implicit equivalence scale that varies by family size, composition, and age of the family head
Explicit equivalence scale that varies by unit size and composition, but not by age of unit head; also, adjustments for differences in housing costs by (1) housing status (owner with a mortgage and so forth) and (2) geographic area
SOURCES: Short (2012), http://www.census.gov/hhes/povmeas/methodology/supplemental/research/Short_ResearchSPM2011.pdf; and DeNavas-Walt, Proctor, and Smith (2012), http://www.census.gov/newsroom/releases/archives/income_wealth/cb12-172.html.
60 http://www.socialsecurity.gov/policy/docs/ssb/
resources. The SPM unit includes all related persons at the same address, any cohabiters and their relatives, and any coresident unrelated children who are cared for by the family (such as foster children).11 Most non-aged adults in SPM units that differ from their official units are in SPM units that contain cohabiters.
Resource MeasuresThe official resource measure is family before-tax money income.12 Persons in families whose before-tax money income is less than the family’s threshold are classified as poor. Proponents of the SPM believe that the official resource measure has the following major weaknesses:13
1. The official resource measure does not reflect the effects of a number of government benefit and tax programs that alter the resources available to families and, thus, their poverty status. Those programs are in-kind public benefits, refundable tax credits, and various taxes—some of which are large. For example, in fiscal year 2011, federal outlays for the Supplemental Nutrition Assistance Program or SNAP (formerly known as the Food Stamp Program) amounted to about $80 billion or 2.1 percent of all federal outlays. Federal expen-ditures for refundable tax credits and for housing subsidies were about $80 billion and $40 billion, respectively (Falk 2012). All three of these in-kind benefit programs are designed to assist the low-income population.14
2. The official resource measure does not account for expenses that are necessary to hold a job and to earn income. These expenses include transportation costs for getting to and from work and the costs of childcare for working families. More than 80 per-cent of the population under study are members of SPM units with work expenses.15 For those units, such expenses can be substantial; unit work expenses on average amount to 12 percent of SPM poverty thresholds.
3. The official resource measure does not consider MOOP expenses, which include expenditures for health insurance premiums, a person’s own medical care (hospital visits, medical providers, dental ser-vices, prescription medicine, vision aids, and medi-cal supplies), and over-the-counter health-related products. More than 95 percent of our sample universe are members of SPM units with MOOP expenses. For those units, MOOP expenses can be large; unit MOOP expenses on average amount to 22 percent of SPM poverty thresholds. In addition,
there is great dispersion around this average; a minority of units have very high MOOP expenses relative to their poverty thresholds.The SPM resource measure attempts to overcome
these weaknesses of the official resource measure. The SPM resource measure is the sum of cash income plus refundable tax credits and any in-kind government benefits that units can use to meet their basic needs, which are represented in the thresholds, minus taxes and other nondiscretionary expenses for critical goods not included in the thresholds. The SPM thresholds represent the amount needed for a basic set of goods—FCSU—and an additional amount allowed for other basic needs (for example, household supplies, personal care, nonwork-related transportation). The importance of these various additions to and subtractions from cash income varies greatly across age groups.
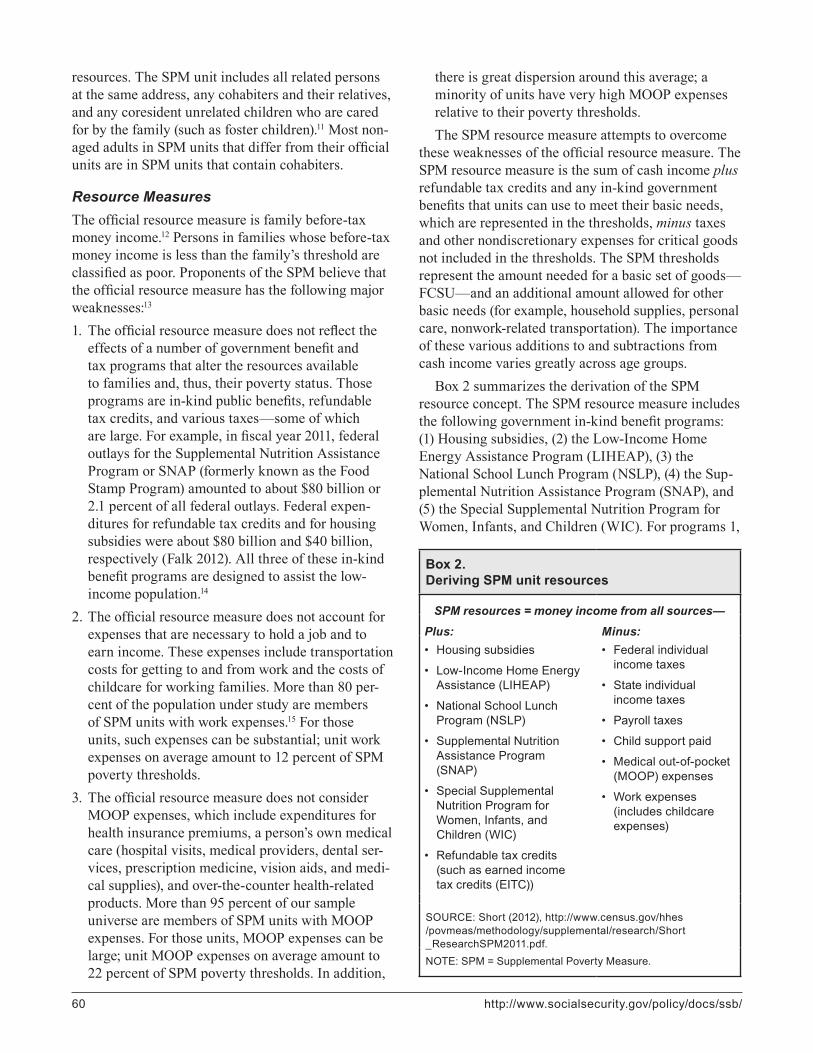
Box 2 summarizes the derivation of the SPM resource concept. The SPM resource measure includes the following government in-kind benefit programs: (1) Housing subsidies, (2) the Low-Income Home Energy Assistance Program (LIHEAP), (3) the National School Lunch Program (NSLP), (4) the Sup-plemental Nutrition Assistance Program (SNAP), and (5) the Special Supplemental Nutrition Program for Women, Infants, and Children (WIC). For programs 1,
Box 2. Deriving SPM unit resources
SPM resources = money income from all sources—
Plus: Minus:• Housing subsidies
• Low-Income Home Energy Assistance (LIHEAP)
• National School Lunch Program (NSLP)
• Supplemental Nutrition Assistance Program (SNAP)
• Special Supplemental Nutrition Program for Women, Infants, and Children (WIC)
• Refundable tax credits (such as earned income tax credits (EITC))
• Federal individual income taxes
• State individual income taxes
• Payroll taxes
• Child support paid
• Medical out-of-pocket (MOOP) expenses
• Work expenses (includes childcare expenses)
SOURCE: Short (2012), http://www.census.gov/hhes /povmeas /methodology/supplemental/research/Short _ResearchSPM2011.pdf.NOTE: SPM = Supplemental Poverty Measure.
Social Security Bulletin, Vol. 75, No. 2, 2015 61
3, and 5, the CPS/ASEC collects information only on recipiency, but not on amounts received. In estimating the amounts of those benefits, the Census Bureau uses information from other government agencies.16
Housing subsidies, LIHEAP benefits, and SNAP benefits are intended to help both nonaged and aged persons. On the other hand, NSLP and WIC benefits are intended to help nonaged persons. All of these programs are targeted to low-income individuals.
The SPM resource measure also includes the fol-lowing refundable tax credits: (1) the earned income tax credit (EITC) and (2) the additional federal child-care tax credit. These credits are intended to help low-income working units, especially those with children.
The following expenses are deducted in deriving SPM unit resources: (1) federal individual income tax (after nonrefundable credits), (2) state indi-vidual income tax, (3) Social Security tax payments by employees and the self-employed plus federal employee retirement payroll deductions, (4) child sup-port paid, (5) MOOP expenses, and (6) work expenses (including childcare expenses). The CPS/ASEC does not collect information on taxes, refundable tax credits, or work expenses. The Census Bureau applies a tax-calculating computer program to the CPS/ASEC to simulate taxes and tax credits and uses informa-tion from another household survey to estimate work expenses.17
It should be clear that the relative impact of vari-ous types of expenses on household resources tends to vary by age. For instance, low-income aged units typically have no or low income tax liabilities. Payroll taxes and work expenses affect working families. Child support payments come mostly from nonaged persons.
MOOP expenses are very important for aged persons, but are also important for nonaged persons. As stated earlier, MOOP expenses include the pay-ment of health insurance premiums plus other medi-cally necessary items, such as prescription drugs and doctor copayments that are not covered by insurance.18 Subtracting MOOP expenses from income, in addi-tion to subtracting taxes and work expenses, leaves the amount of income that the SPM unit has available to purchase the basic bundle of goods included in the threshold.
Threshold MeasuresThe official measure uses a set of thresholds for fami-lies of different sizes and compositions. The threshold
values depend on family size, number of children, and age of the family head (younger than age 65 or aged 65 or older). At the time they were developed, the official thresholds represented the cost of a minimum food diet multiplied by 3 (to allow for expenditures on other goods and services).19 The thresholds are indexed annually by the U.S. Consumer Price Index for all items.
Proponents of the SPM believe that the offi-cial threshold measure has the following major weaknesses:1. Official thresholds are based on only one category
of necessary expenditures; that is, food. (For 2011, food expenditures accounted for only 36 percent of the bundle of necessary expenditures or FCSU that form the basis of the SPM thresholds.)20 The expen-diture information used is more than 50 years old. The share of food in expenditures is much lower now than it was 50 years ago. The threshold levels are fixed in real or inflation-adjusted dollars and do not reflect real increases over time in spending on basic needs.
2. The official threshold measure does not adjust for differences in FCSU-expenditure needs resulting from differences in unit housing-tenure status. For example, homeowners with mortgages on aver-age need to make sizable mortgage payments. (In determining SPM thresholds for 2011, the FCSU needs of units that have owners with mortgages are estimated by the Bureau of Labor Statistics (2012) to have been 21 percent larger than those of units that have owners with no mortgages.)
3. The official threshold measure does not adjust for geographic differences in the cost of living, which are often large. (For 2011, the geographic-adjustment factors used in the SPM ranged from .80 for the lowest-cost area to 1.48 for the highest-cost area.)
4. Official thresholds use family size and composi-tion adjustments that in some cases produce questionable results. For example, in some cases, single-parent families have higher thresholds than married-couple families of the same size, imply-ing that children cost more than adults in certain size families. Proponents of the SPM believe that the evidence used in setting thresholds for aged units and for one-person nonaged units is quite weak. In addition, the fact that the equiva-lence scales are implicit and not transparent is a substantial weakness.

62 http://www.socialsecurity.gov/policy/docs/ssb/
The SPM threshold measure attempts to overcome the weaknesses of the official threshold measure and has the following properties:1. As stated earlier, SPM thresholds represent the
amount needed for a basic set of goods that consists of FCSU and an additional amount allowed for other basic needs (household supplies, personal care, non-work-related transportation). The basic FCSU needs reflect expenditures on this basic bundle of goods around the 33rd percentile of the expenditure distri-bution, as reported in the Bureau of Labor Statistics’ Consumer Expenditure Survey (CE).21 The SPM thresholds for 2011 are based on 2007–2011 data from the CE. To include other basic needs in the threshold, the basic FCSU needs are multiplied by 1.2. Over time, the thresholds are not fixed in real or inflation-adjusted dollars. Each year, the thresholds are updated using the most recent CE data.
2. The SPM thresholds are adjusted for differences in shelter and utility expenditure needs. The thresholds depend on unit housing-tenure status. The groups within that category consist of units that have owners with mortgages, owners with no mortgages, and renters. The adjustments are based on CE data.
3. The thresholds are adjusted for geographic differ-ences in housing costs. The adjustment factors are for more than 300 areas and are based on American Community Survey estimates of apartment rents.
4. The threshold for units with two children (the base threshold) is derived from CE data as described in item 1 above. The thresholds for other unit types (differing in size and number of children) are then derived by applying an explicit equivalence scale to this base threshold.22 Equivalence scales are measures of the relative cost of living for units of different sizes and compositions that are otherwise similar. For example, if a unit of two adults can live as well as a unit of two adults and two chil-dren while spending only three-fourths as much, then relative to the reference unit of two adults and two children, the equivalence-scale value for a two-adult unit is three-fourths. For the purpose of poverty measurement, an equivalence scale is used to adjust the threshold value for the reference unit to provide corresponding thresholds for other unit types. The three-parameter SPM equivalence scale used has the following four properties: (1) a child always costs less than an adult; (2) the scale always exhibits economies of scale in consump-tion; (3) the scale does not depend on the age of the
unit head; and (4) for one-person nonaged units, the SPM-scale value is rather different from the official-scale value.23
Official and SPM Estimates: A ComparisonIn this section, we begin our empirical examination of the two poverty measures. For the various age groups, we compare the SPM poverty estimates with official estimates. Then in the following section, for our focus group (persons aged 18–64), we estimate the effects of various features of the SPM on poverty levels. In effect, we look at why SPM estimates for our nonaged adult sample differ from the official estimates.
We begin this section by looking at poverty for the total population and for various groups of nonaged and aged persons. Next, we examine deep poverty and the distribution of our sample by welfare-ratio intervals. Then, we examine movements into and out of poverty. Finally, we look at poverty of nonaged adults for vari-ous demographic and socioeconomic groups.
Poverty by Age GroupsTable 1 gives the numbers and percentages of people in poverty for the total population under study and for various age groups and detailed age subgroups. For the total population, the SPM poverty rate (16.1 percent) exceeds the official rate (15.1 percent) by 1.0 percent-age point.24 The number of people poor under the SPM (49.8 million) exceeds the number of people poor under the official measure (46.6 million) by 3.2 million or 7 percent.25
Both Table 1 and the accompanying chart show that for broad age groups, the SPM and official measures give quite different results. For adults aged 18–64, the SPM poverty rate (15.6 percent) exceeds the official rate (13.7 percent) by 1.8 per-centage points or by 13 percent. Compared with the official measure, the SPM shows much more poverty for aged adults (those aged 65 or older) and much less poverty for children (those younger than age 18). For the group aged 65 or older, the SPM poverty rate (15.1 percent) exceeds the official rate (8.7 percent) by 6.4 percentage points.26 On the other hand, for children, the SPM rate (18.2 percent) is lower than the official rate (22.3 percent) by 4.1 points.27 Com-pared with the official measure, the SPM shows much smaller age-group differences in poverty rates. As the chart shows, the official poverty rate for nonaged adults is much lower than that for children and much higher than that for aged adults; however, the SPM poverty rate for nonaged adults is only modestly
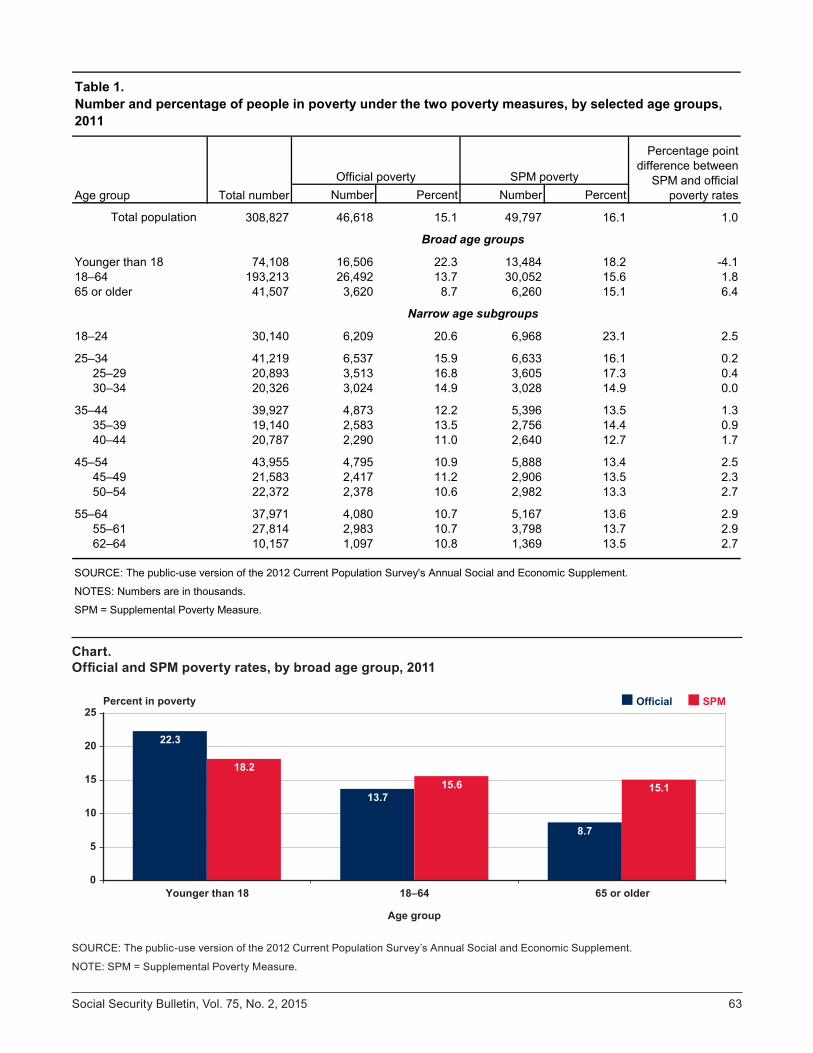
Social Security Bulletin, Vol. 75, No. 2, 2015 63
Number Percent Number Percent
Total population 308,827 46,618 15.1 49,797 16.1 1.0
74,108 16,506 22.3 13,484 18.2 -4.1193,213 26,492 13.7 30,052 15.6 1.8
41,507 3,620 8.7 6,260 15.1 6.4
30,140 6,209 20.6 6,968 23.1 2.5
41,219 6,537 15.9 6,633 16.1 0.220,893 3,513 16.8 3,605 17.3 0.420,326 3,024 14.9 3,028 14.9 0.0
39,927 4,873 12.2 5,396 13.5 1.319,140 2,583 13.5 2,756 14.4 0.920,787 2,290 11.0 2,640 12.7 1.7
43,955 4,795 10.9 5,888 13.4 2.521,583 2,417 11.2 2,906 13.5 2.322,372 2,378 10.6 2,982 13.3 2.7
37,971 4,080 10.7 5,167 13.6 2.927,814 2,983 10.7 3,798 13.7 2.910,157 1,097 10.8 1,369 13.5 2.7
Official poverty SPM poverty
Table 1.Number and percentage of people in poverty under the two poverty measures, by selected age groups, 2011
Total number
Percentage point difference between
SPM and official poverty ratesAge group
Broad age groups
Narrow age subgroups
Younger than 1818–6465 or older
18–24
25–3425–2930–34
35–4435–3940–44
45–5445–4950–54
SPM = Supplemental Poverty Measure.
55–6455–6162–64
SOURCE: The public-use version of the 2012 Current Population Survey's Annual Social and Economic Supplement.
NOTES: Numbers are in thousands.
Chart. Official and SPM poverty rates, by broad age group, 2011
SOURCE: The public-use version of the 2012 Current Population Survey’s Annual Social and Economic Supplement.
NOTE: SPM = Supplemental Poverty Measure.
Younger than 18 18–64 65 or older0
5
10
15
20
25Percent in poverty
22.3
18.2
13.715.6
8.7
15.1
Official SPM
Age group
64 http://www.socialsecurity.gov/policy/docs/ssb/
lower than that for children and is very similar to that for aged adults.
For nonaged adults, we also look at poverty rates for detailed age subgroups (Table 1). For the great majority of the detailed age subgroups, the SPM rates exceed the official poverty rates. For the subgroups ranging from ages 30–34 to 50–54, this excess increases with age—from 0 percentage points to 2.7 points. The excesses for the subgroups aged 55–61 and 62–64 are 2.9 and 2.7 percentage points, respectively.
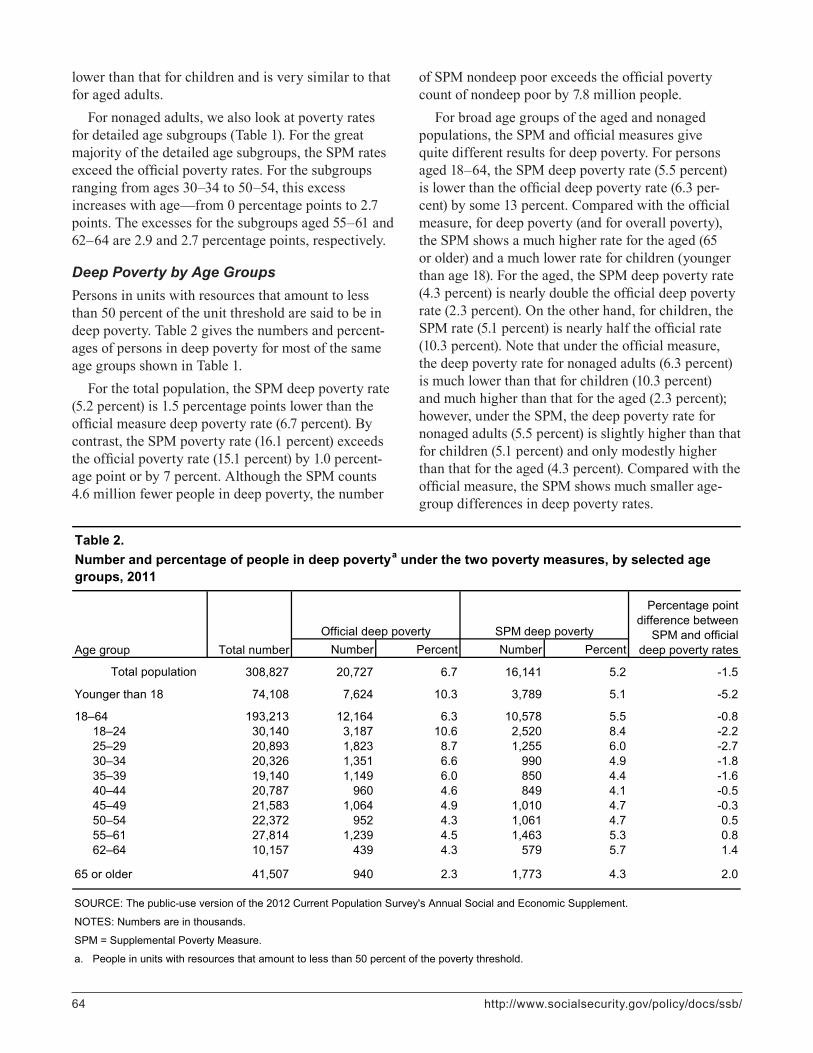
Deep Poverty by Age GroupsPersons in units with resources that amount to less than 50 percent of the unit threshold are said to be in deep poverty. Table 2 gives the numbers and percent-ages of persons in deep poverty for most of the same age groups shown in Table 1.
For the total population, the SPM deep poverty rate (5.2 percent) is 1.5 percentage points lower than the official measure deep poverty rate (6.7 percent). By contrast, the SPM poverty rate (16.1 percent) exceeds the official poverty rate (15.1 percent) by 1.0 percent-age point or by 7 percent. Although the SPM counts 4.6 million fewer people in deep poverty, the number
of SPM nondeep poor exceeds the official poverty count of nondeep poor by 7.8 million people.
For broad age groups of the aged and nonaged populations, the SPM and official measures give quite different results for deep poverty. For persons aged 18–64, the SPM deep poverty rate (5.5 percent) is lower than the official deep poverty rate (6.3 per-cent) by some 13 percent. Compared with the official measure, for deep poverty (and for overall poverty), the SPM shows a much higher rate for the aged (65 or older) and a much lower rate for children (younger than age 18). For the aged, the SPM deep poverty rate (4.3 percent) is nearly double the official deep poverty rate (2.3 percent). On the other hand, for children, the SPM rate (5.1 percent) is nearly half the official rate (10.3 percent). Note that under the official measure, the deep poverty rate for nonaged adults (6.3 percent) is much lower than that for children (10.3 percent) and much higher than that for the aged (2.3 percent); however, under the SPM, the deep poverty rate for nonaged adults (5.5 percent) is slightly higher than that for children (5.1 percent) and only modestly higher than that for the aged (4.3 percent). Compared with the official measure, the SPM shows much smaller age-group differences in deep poverty rates.
Number Percent Number Percent
Total population 308,827 20,727 6.7 16,141 5.2 -1.5
74,108 7,624 10.3 3,789 5.1 -5.2
193,213 12,164 6.3 10,578 5.5 -0.830,140 3,187 10.6 2,520 8.4 -2.220,893 1,823 8.7 1,255 6.0 -2.720,326 1,351 6.6 990 4.9 -1.819,140 1,149 6.0 850 4.4 -1.620,787 960 4.6 849 4.1 -0.521,583 1,064 4.9 1,010 4.7 -0.322,372 952 4.3 1,061 4.7 0.527,814 1,239 4.5 1,463 5.3 0.810,157 439 4.3 579 5.7 1.4
41,507 940 2.3 1,773 4.3 2.0
a.
Younger than 18
18–6418–2425–29
Official deep poverty SPM deep poverty
Table 2.Number and percentage of people in deep poverty a under the two poverty measures, by selected age groups, 2011
Total number
Percentage point difference between
SPM and official deep poverty ratesAge group
People in units with resources that amount to less than 50 percent of the poverty threshold.
30–34
65 or older
SOURCE: The public-use version of the 2012 Current Population Survey's Annual Social and Economic Supplement.
NOTES: Numbers are in thousands.
SPM = Supplemental Poverty Measure.
62–64
35–3940–4445–4950–5455–61

Social Security Bulletin, Vol. 75, No. 2, 2015 65
For nonaged adults, we also look at deep poverty rates for detailed age subgroups (Table 2). For each of the subgroups in the age 25–49 range, the SPM rate is lower than the official deep poverty rate, but the difference between the two rates decreases as age increases. By contrast, for each of the subgroups in the age 50–64 range, the SPM rate exceeds the official deep poverty rate and the difference increases with age.
Distribution of Persons by Welfare-Ratio Intervals and Age GroupsWe next compare distributions of economic welfare measured using SPM concepts with those measured using official poverty measure concepts. Table 3 shows the percentage distributions of people in the various age groups by welfare-ratio intervals. The welfare ratio is defined as the ratio of a unit’s resources to its unit poverty threshold. People in poverty and in deep
Less than 0.50 0.50–0.99 b 1.00–1.24 b 1.25–1.49 b 1.50–1.99 b 2.00–3.99 b
4.00 or more
Total population 6.7 8.4 4.8 5.1 9.5 30.5 35.1
10.3 12.0 6.0 6.0 10.3 29.1 26.3
6.3 7.4 4.0 4.4 8.5 30.2 39.110.6 10.0 5.6 5.9 10.9 30.4 26.7 8.7 8.1 4.4 5.1 10.0 33.2 30.4 6.6 8.2 4.7 4.8 9.1 31.7 34.8 6.0 7.5 4.6 4.6 9.1 31.5 36.7 4.6 6.4 3.5 4.5 7.9 32.3 40.8 4.9 6.3 3.2 3.8 7.7 31.1 43.0 4.3 6.4 3.0 3.6 6.9 27.5 48.3 4.5 6.3 3.3 3.2 6.8 26.0 49.9 4.3 6.5 3.3 4.3 7.7 29.0 44.9
2.3 6.5 5.8 6.5 12.6 34.2 32.2
Total population 5.2 10.9 8.6 8.4 15.0 34.2 17.7
5.1 13.1 10.4 10.9 17.5 31.6 11.4
5.5 10.1 7.6 7.5 14.2 35.3 19.9 8.4 14.8 10.2 9.7 16.5 30.6 9.9 6.0 11.2 8.5 8.8 16.2 35.7 13.6 4.9 10.0 8.1 8.7 15.7 36.6 16.0 4.4 10.0 7.8 8.5 14.9 36.9 17.4 4.1 8.6 7.1 7.2 14.9 38.7 19.4 4.7 8.8 7.0 6.6 14.1 36.6 22.3 4.7 8.6 6.3 5.6 12.3 35.8 26.6 5.3 8.4 6.1 5.5 10.8 34.0 30.0 5.7 7.8 6.2 5.5 11.9 35.1 27.7
4.3 10.8 9.7 8.4 14.3 33.6 18.9
a.
b.
Welfare-ratio intervals
Table 3.Percentage distribution of people under the two poverty measures, by welfare-ratio a intervals and selected age groups, 2011
Official
SPM
Age group
Younger than 18
18–6418–2425–29
40–44
30–3435–39
45–4950–5455–6162–64
65 or older
Younger than 18
18–6418–2425–2930–3435–3940–4445–49
The ratio of unit resources to the unit poverty threshold.
Less than the lower bound of the next interval.
SPM = Supplemental Poverty Measure.
NOTES: Row percentages sum to approximately 100.0.
50–5455–6162–64
65 or older
SOURCE: The public-use version of the 2012 Current Population Survey's Annual Social and Economic Supplement.

66 http://www.socialsecurity.gov/policy/docs/ssb/
poverty are those in units with welfare ratios less than 1.0 and less than 0.5, respectively.
Compared with the official measure, for the total population, the SPM shows a higher share of people in each of the four middle welfare-ratio intervals (with ratios equal to or greater than 1.00 and less than 4.00) and a much lower share in the top welfare-ratio interval (with ratios of 4.00 or more). This pattern also holds for almost all the nonaged subgroups (rang-ing from the subgroup aged 18–24 to the subgroup aged 62–64), shown in Table 3. For the broad 18–64 age group, the official poverty measure assigns 47.1 percent of people to the four middle welfare-ratio intervals compared with 64.6 percent under the SPM. The lower shares in the top welfare-ratio interval result in large part from the subtraction of tax pay-ments in computing the SPM resource measure.
“Movements” Into and Out of Poverty by Age GroupsWhen the basis for poverty measurement changes, the composition of the population designated as poor also changes. We refer to such redesignations in poverty status as movements into and out of poverty that are solely attributable to the switch to a different
method for determining who is poor.28 We now discuss the effects on poverty status (movements into and out of poverty) of changing the way that poverty is measured—from the official measure to the SPM.
Table 4 gives percentages of people exiting poverty, staying in poverty, and entering poverty for the various age groups and subgroups. We have seen that for the total population, the SPM poverty rate (16.1 percent) exceeds the official rate (15.1 percent). Switching to the SPM moves some persons into poverty (official non-poor who become SPM poor) and others out of poverty (official poor who become SPM nonpoor). Switching to the SPM moves about 5.0 percent of the population into poverty and about 3.9 percent out of poverty, which accounts for the 1.0 percentage point net increase in the measured poverty rate. Some 11.2 percent of the popu-lation is considered poor under both poverty measures.
For nonaged adults, the SPM poverty rate (15.6 per-cent) exceeds the official rate (13.7 percent). Switching to the SPM moves about 5.0 percent of the population aged 18–64 into poverty and about 3.1 percent out of poverty. Some 10.6 percent of nonaged adults are con-sidered poor under both poverty measures. For most of the narrow age subgroups of nonaged adults, the ratio of the percentage entering poverty to the percentage
Official poor a Exit poverty b Stay in poverty c Enter poverty d SPM poor e
Total population 15.1 3.9 11.2 5.0 16.1
22.3 7.4 14.9 3.4 18.2
13.7 3.1 10.6 5.0 15.620.6 4.4 16.2 7.0 23.116.8 4.7 12.1 5.1 17.314.9 4.4 10.5 4.4 14.913.5 3.5 10.0 4.4 14.411.0 2.4 8.6 4.1 12.711.2 2.4 8.8 4.6 13.510.6 1.9 8.7 4.6 13.310.7 2.1 8.6 5.0 13.710.8 1.8 9.0 4.4 13.5
8.7 1.4 7.3 7.7 15.1
a.
b.
c.
d.
e.
25–2930–3435–39
Table 4.Percentage of people defined as poor under the official poverty measure and poverty-status effects of a shift to the SPM, by selected age groups, 2011
Younger than 18
Official poor and SPM poor.
Official nonpoor, but SPM poor.
"Stay in poverty" column plus "Enter poverty" column.
Age group
NOTE: SPM = Supplemental Poverty Measure.
"Exit poverty" column plus "Stay in poverty" column.
Official poor, but SPM nonpoor.
65 or older
SOURCE: The public-use version of the 2012 Current Population Survey's Annual Social and Economic Supplement.
40–4445–4950–5455–6162–64
18–6418–24

Social Security Bulletin, Vol. 75, No. 2, 2015 67
Less than 0.50 0.50–0.99 b 1.00–1.49 b 1.50–1.99 b 2.00–3.99 b 4.00 or more
0.0 0.0 14.3 5.0 4.8 1.4 0.0 0.0 61.7 8.1 4.1 0.6
6.0 56.4 0.0 0.0 0.0 0.0 2.1 22.1 0.0 0.0 0.0 0.0 2.2 10.7 0.0 0.0 0.0 0.0 0.3 0.3 0.0 0.0 0.0 0.0
37.5 14.5 0.0 0.0 0.0 0.0 9.3 38.7 0.0 0.0 0.0 0.0
0.0 0.0 5.1 1.1 0.3 0.0 0.0 0.0 5.3 3.0 0.7 0.1 0.0 0.0 5.1 12.3 18.5 0.5 0.0 0.0 0.1 0.6 23.5 23.8
a.
b.
c.
d.
Table 5.Changes in poverty status of adults aged 18–64, by welfare-ratio a interval, 2011: Joint percentage distributions by change category
1.50–1.99 b
SPM welfare-ratio interval
Exiting poverty c
Entering poverty d
Poor under both measures
Not poor under both measures
2.00–3.99 b
4.00 or more
Less than 0.500.50–0.99 b
1.00–1.49 b
Official measure welfare-ratio interval
Less than 0.500.50–0.99 b
1.00–1.49 b
1.50–1.99 b
Official nonpoor, but SPM poor.
2.00–3.99 b
4.00 or more
The ratio of unit resources to the unit poverty threshold.
Less than the lower bound of the next higher interval.
Official poor, but SPM nonpoor.
SOURCE: The public-use version of the 2012 Current Population Survey's Annual Social and Economic Supplement.
NOTES: For each change category (nonaged adults who exit poverty, those who enter poverty, those poor under both poverty measures, and those not poor under both poverty measures), the percentages sum to approximately 100.0.
SPM = Supplemental Poverty Measure.
exiting poverty exceeds 1.5. Over the 30–64 age range, that ratio increases with age, from about 1 to about 2.5.
For aged adults (65 or older), the SPM poverty rate (15.1 percent) exceeds the official rate (8.7 percent). Switching to the SPM moves about 7.7 percent of the aged population into poverty and only about 1.4 per-cent out of poverty, which accounts for the large increase in that group’s poverty rate. Some 7.3 per-cent of aged adults are considered poor under both poverty measures.
For children (younger than age 18), the SPM poverty rate (18.2 percent) is lower than the official rate (22.3 percent). Switching to the SPM moves about 3.4 percent of children into poverty and about 7.4 per-cent out of poverty. A very sizable percentage of children (14.9 percent) are considered poor under both poverty measures.
Table 5 gives joint percentage distributions of non-aged adults (18–64), by their official measure and SPM welfare-ratio intervals and change categories: exiting poverty, entering poverty, poor under both measures, and not poor under both measures. For nonaged adults, much of the movement into and out of poverty occurs near the poverty line, as one might expect. Thus, of the 9.6 million people entering poverty, some 57 percent move from the 1.00–1.49 official measure welfare-ratio interval to the 0.50–0.99 SPM interval.29 Similarly, of the 6.1 million people exiting poverty, 62 percent move from the 0.50–0.99 welfare-ratio interval under the official measure to the 1.00–1.49 interval under the SPM. Of those who are poor under both poverty measures, approximately 9 percent move into deep poverty and nearly 15 percent move out of deep poverty.
68 http://www.socialsecurity.gov/policy/docs/ssb/
Poverty of Nonaged Adults by Various Demographic and Socioeconomic CharacteristicsWe now turn to more detailed comparisons of SPM and official poverty for nonaged adults and examine results for various demographic and socioeconomic groups.
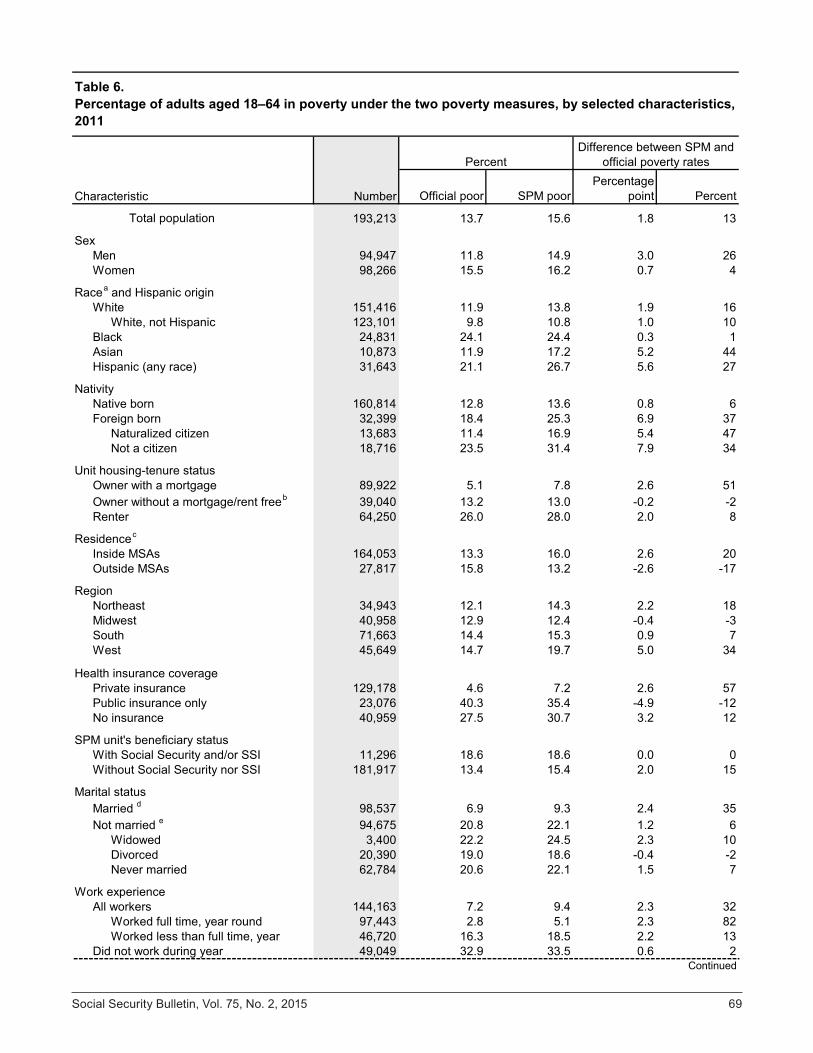
Table 6 shows poverty numbers, poverty rates, and differences in poverty by sex, race and Hispanic origin, nativity, unit housing-tenure status, residence, region, health insurance coverage, Social Security beneficiary status, marital status, work experience, payroll tax status, and disability status. Among the demographic and socioeconomic groups we discuss, the largest percentage increases in poverty (column 5) are for persons with private health insurance, persons in units that have an owner with a mortgage, and Asians.30 Correspondingly, the largest percent-age point increases in poverty (column 4) are for the foreign born, Hispanics, Asians, and for persons residing in the West. The groups with very little to no change in poverty are blacks, persons in units that have an owner with no mortgage, those residing in the Midwest, women, and nonworkers. The groups with substantial decreases in poverty are persons with public health insurance only and those residing outside MSAs.
Usually, within a category, the group that has the larger percentage increase in poverty also has the larger percentage point increase in its poverty rate. For example, in the region category, the percentage increases in poverty for the West, Northeast, South, and Midwest are 34, 18, 7, and -3, respectively. The corresponding percentage point increases in poverty rates are 5.0, 2.2, 0.9, and -0.4.
Among housing-tenure status groups, persons in units that have an owner with no mortgage show very little change in poverty. On the other hand, two groups—persons in units that have an owner with a mortgage and persons in units that have a renter—show increases in poverty of 51 percent and 8 percent, respectively; that is, their SPM poverty exceeds their official poverty. This pattern of percentage differ-ences reflects in considerable part the fact that the SPM thresholds take unit housing-tenure status into account. In addition, MOOP expenses and taxes are more important in increasing poverty for owners with mortgages than for renters.31 SNAP and housing subsidies are more important in reducing poverty for nonaged adults in units that have renters than for those in units that have owners with mortgages.
For the residence category, nonaged adults residing inside MSAs have an increase in poverty of 20 per-cent. On the contrary, those residing outside MSAs have a very sizable decrease in poverty (-17 percent). This pattern of percentage differences reflects the fact that the SPM threshold incorporates adjustments for geographic differences in housing costs.
Among regions, nonaged adults residing in the West and Northeast have the largest percentage increases in poverty (34 percent and 18 percent, respectively). On the other hand, persons residing in the Midwest and South have percentage changes of -3 and 7 per-cent, respectively. Again, these patterns of percentage differences reflect the fact that the SPM threshold incorporates adjustments for geographic differences in housing costs.32
Nonaged adult Hispanics have a larger rela-tive increase in poverty (27 percent) than do non-Hispanic whites (10 percent).33 Foreign-born individuals have a much larger relative increase in poverty (37 percent) than do their native-born coun-terparts (6 percent).34 These patterns of percentage differences in large part reflect the fact that the SPM threshold incorporates adjustments for geographic differences in housing costs.
For each of the previous five categories (unit hous-ing-tenure status, residence, region, Hispanic origin, and nativity), differences between the SPM and official thresholds play a key role in shaping the patterns of percentage differences in poverty changes. For other demographic and socioeconomic categories, differ-ences in unit definition and resource measure between the official poverty measure and the SPM drive the differences in poverty rates under the two measures.
The relative increase in poverty is considerably larger for married nonaged adults (35 percent) than for those not married (6 percent). This difference in part reflects the fact that the SPM and official units differ.35 The percentage increase in poverty is markedly larger for men (26 percent) than for women (4 percent). This difference in part also reflects the fact that the SPM and official units differ.
Nonaged adults with work experience during the year have a considerably larger relative increase in poverty (32 percent) than do those with no work expe-rience during the year (2 percent). This difference in part reflects the fact that payroll taxes, income taxes, work expenses, and MOOP expenses are more impor-tant through their effects (in reducing SPM resources) in increasing poverty for workers than for nonworkers.
Social Security Bulletin, Vol. 75, No. 2, 2015 69
Official poor SPM poorPercentage
point Percent
Total population 193,213 13.7 15.6 1.8 13
94,947 11.8 14.9 3.0 2698,266 15.5 16.2 0.7 4
151,416 11.9 13.8 1.9 16123,101 9.8 10.8 1.0 10
24,831 24.1 24.4 0.3 110,873 11.9 17.2 5.2 4431,643 21.1 26.7 5.6 27
160,814 12.8 13.6 0.8 632,399 18.4 25.3 6.9 3713,683 11.4 16.9 5.4 4718,716 23.5 31.4 7.9 34
89,922 5.1 7.8 2.6 5139,040 13.2 13.0 -0.2 -264,250 26.0 28.0 2.0 8
164,053 13.3 16.0 2.6 2027,817 15.8 13.2 -2.6 -17
34,943 12.1 14.3 2.2 1840,958 12.9 12.4 -0.4 -371,663 14.4 15.3 0.9 745,649 14.7 19.7 5.0 34
129,178 4.6 7.2 2.6 5723,076 40.3 35.4 -4.9 -1240,959 27.5 30.7 3.2 12
11,296 18.6 18.6 0.0 0181,917 13.4 15.4 2.0 15
98,537 6.9 9.3 2.4 3594,675 20.8 22.1 1.2 6
3,400 22.2 24.5 2.3 1020,390 19.0 18.6 -0.4 -262,784 20.6 22.1 1.5 7
144,163 7.2 9.4 2.3 3297,443 2.8 5.1 2.3 8246,720 16.3 18.5 2.2 1349,049 32.9 33.5 0.6 2
Table 6.Percentage of adults aged 18–64 in poverty under the two poverty measures, by selected characteristics, 2011
Number
Difference between SPM and official poverty rates
Characteristic
Percent
Inside MSAs
RenterOwner without a mortgage/rent free bOwner with a mortgage
SexMenWomen
Race a and Hispanic origin
Nativity
WhiteWhite, not Hispanic
Foreign bornNative born
Hispanic (any race)AsianBlack
WestSouthMidwestNortheast
Outside MSAs
Work experience
Did not work during year
All workers
Not married eMarried d
Worked full time, year roundWorked less than full time, year
Naturalized citizenNot a citizen
WidowedDivorcedNever married
Without Social Security nor SSIWith Social Security and/or SSI
No insurancePublic insurance onlyPrivate insurance
Marital status
Unit housing-tenure status
Residence c
Region
Health insurance coverage
SPM unit's beneficiary status
Continued

70 http://www.socialsecurity.gov/policy/docs/ssb/
For SPM units with payroll tax liability, nonaged adults have a sizable relative increase in poverty (24 percent). Those in units with no payroll taxes have very high poverty rates, but the shift from the official measure to the SPM produces little relative change in their poverty. This pattern of percentage differences in part reflects the fact that payroll taxes, work expenses, and MOOP expenses are more important through their effects (in reducing resources) in raising the poverty levels for persons in units with payroll tax liability.
There is a 4 percent decrease in poverty for non-aged adults with a disability.36,37 On the other hand, those without a disability have an increase in poverty of 17 percent. This difference reflects in part the fact that payroll taxes and work expenses are more impor-tant in increasing poverty for persons with no dis-abilities and the fact that SNAP and housing subsidies are more important through their effects (in increas-ing SPM resources) in reducing poverty for persons with disabilities.38
Nonaged adults in units with no Social Security beneficiaries nor SSI recipients have a larger relative increase in poverty (16 percent) than do those in units with Social Security and/or SSI benefit receipt (6 per-cent).39 This pattern of percentage increases reflects in part the fact that payroll taxes and work expenses are more important in increasing poverty for persons in
units with no Social Security benefits nor SSI pay-ments and the fact that SNAP benefits and housing subsidies are more important in reducing poverty for persons in units with Social Security and/or SSI ben-efit receipt.40 In addition, the percentage differences between beneficiaries and nonbeneficiaries reflect the differing effects of adjustments for geographic differ-ences in living costs and housing status.
Nonaged adults with only public health insurance have a sizable decrease in poverty (-12 percent).41 On the other hand, those with private health insurance and those with no health insurance have increases in poverty (57 and 12 percent, respectively).42 This pat-tern of percentage differences in part reflects the fact that SNAP and housing subsidies are more important in reducing poverty among persons with only public insurance than for those with private insurance or no insurance. In addition, MOOP expenses and taxes are more important in increasing poverty among persons with private insurance than for those with no insurance.
Blacks aged 18–64 have a smaller poverty increase (1 percent) than do whites (16 percent). SNAP and housing subsidies are more important in reducing poverty for blacks than for whites. Asians, on the other hand, have a larger poverty increase (44 percent) than do whites (16 percent). These percentage differences
Official poor SPM poorPercentage
point Percent
14,968 28.8 27.6 -1.2 -4177,309 12.5 14.6 2.1 17
a.
b.
c.
d.
e.
f.
Married, spouse present in the household.
In addition to the widowed, divorced, or never married, this category also includes those who are married with the spouse absent from the household.
Disability status is not defined for persons in the armed forces.
SOURCE: The public-use version of the 2012 Current Population Survey's Annual Social and Economic Supplement.
MSA = metropolitan statistical area; SPM = Supplemental Poverty Measure; SSI = Supplemental Security Income.
Excludes people who report more than one race.
Includes nonowners who live rent free.
Excludes a small number of persons where confidentiality rules prevent identification of MSA status on the public-use data file. Such identification is available on the Census Bureau's internal data file.
NOTES: Numbers are in thousands.
Table 6.Percentage of adults aged 18–64 in poverty under the two poverty measures, by selected characteristics, 2011—Continued
With a disabilityWithout a disability
Disability status fCharacteristic Number
Difference between SPM and official poverty ratesPercent

Social Security Bulletin, Vol. 75, No. 2, 2015 71
between Asians and whites reflect the differing effects of adjustments for geographic differences in housing costs, differences in unit definitions, and differences in the role of MOOP expenses.
For six of the previously discussed categories (work experience, payroll tax status, disability status, Social Security and/or SSI benefit receipt status, health insurance coverage, and race), differences between the SPM and official resource measures play a key role in determining the patterns of percentage differences in poverty changes.
Effects of Various Features of the SPM on Poverty Rates Among Nonaged AdultsThe 1.8 percentage point increase in measured poverty among the nonaged adult population can be attributed to specific features of the SPM. A number of those features increase poverty, but others reduce it. We now consider the effects of the SPM’s resource, threshold, and unit measures.
Effects of Elements of the Resource MeasureIn this subsection, we discuss the effects of noncash transfers and refundable tax credits. Then, we address taxes and other nondiscretionary expenses. We then examine the cumulative effect of the resource measure.
Noncash transfers and refundable tax credits. For each of these programs, we compare SPM poverty with the poverty that results when the benefits of the program are subtracted from the resource measure, but the SPM thresholds and SPM units are unchanged.43 We view the change in poverty as the result of a speci-fied change in the way poverty is measured.
There is another way to interpret the change in poverty. We could view the change in poverty as the effect of a change in program policy for a given mea-sure of poverty, namely, the effect on SPM poverty of introducing the program. Our estimate of the increase in resources that is the result of the introduction of the program equals the amount of program benefits.44 It does not include any changes in other resource com-ponents that are due to the program’s behavioral (work effort and so forth) and interprogram effects.45
The six benefit and tax credit programs considered here are refundable tax credits,46 housing subsidies, LIHEAP, NSLP, SNAP, and WIC. Table 7 gives the percentage point decreases in the SPM poverty rate for adults aged 18–64 attributed to each of these six programs. Three of these governmental pro-grams—refundable tax credits, SNAP, and housing
subsidies—have quite discernible effects on SPM pov-erty of nonaged adults. Refundable tax credits have the largest impact. Including tax credits, SNAP, and housing subsidies in the resource measure reduces the measured poverty rate by 2.1, 1.2, and 0.7 percentage points, respectively. Refundable tax credits are pri-marily intended to help low-income working families with children.47 SNAP and housing subsidies target the nonaged and aged low-income populations. The other three programs are not large enough to have sizable effects on poverty rates. The sum of the six individual effects is 4.4 percentage points.
Government cash transfers such as Social Security benefits and SSI payments are included as resources by both the SPM and the official poverty measure.48 Including Social Security and SSI benefit amounts in SPM resources reduces the SPM poverty rate of non-aged adults by 4.1 and 1.2 percentage points, respec-tively (not shown). Including Social Security and SSI in the official resource measure reduces the official poverty rate by smaller numbers of percentage points (3.0 and 0.7, also not shown).
Table 7 (columns 2–6) gives the percentage point decreases in the SPM poverty rates of nonaged adults in five narrow age subgroups (18–24, 25–34, 35–44, 45–54, and 55–64) attributed to refundable tax credits and to each of the five noncash transfer programs. As we might expect, the poverty-rate effect of tax credits decreases sharply as age increases beyond the 35–44 range because older individuals are less likely to be in units with children that would qualify for those tax credits. Moreover, the effect of SNAP decreases as age increases beyond the 25–34 range. By contrast, the effect of housing subsidies does not vary much by age.
Taxes and other nondiscretionary expenses. For each expense element, we compare SPM poverty with the poverty that results when we use SPM resources plus the expense-element amount as our resource measure, but continue to use the SPM thresholds and SPM units. The six expense items considered here are federal income taxes,49 payroll taxes,50 state income taxes,51 child support paid, MOOP expenses, and work expenses. Table 7 (bottom panel, column 1) gives the percentage point increases in the SPM poverty rate of the total nonaged adult population, attributed to each of these six expense items—four of which have substantial effects on the SPM poverty rate of nonaged adults. MOOP expenses have the largest effect; subtracting those expenses in calculating the resource measure increases the measured poverty rate by 2.8 percentage points.52 The poverty-rate increases

72 http://www.socialsecurity.gov/policy/docs/ssb/
attributed to work expenses, payroll taxes, and federal income taxes are 1.7, 1.4, and 0.6 percentage points, respectively.53
Almost 90 percent of SPM-poor nonaged adults are members of SPM units with MOOP expenses. For those units, MOOP expenses can be quite high; for nonaged adults in those units, their unit’s MOOP expenses on average amount to 20 percent of their unit’s SPM poverty threshold. About 65 percent of SPM-poor nonaged adults are members of SPM units with work expenses and about 65 percent are members of units with payroll tax payments. The comparable figure for federal income taxes is about 25 percent. Recall that work expenses include those for childcare. The sum of these six individual expense effects is a 6.9 percentage point increase in the SPM poverty rate.
Table 7 (bottom panel, columns 2–6) also gives the percentage point increases in the SPM poverty rates of persons in five age subgroups of nonaged adults, attributed to each of the nondiscretionary expense items. We find that the poverty-rate effect of MOOP
expenses is largest for the 55–64 subgroup. For both work expenses and payroll taxes, poverty-rate effects decrease steadily as age increases.
All resource elements. Here we compare SPM poverty with the poverty that results when we replace the SPM resource measure with the official resource measure, but use the SPM thresholds and units. We find that the SPM poverty rate (15.6 percent) exceeds the modified poverty rate by 1.7 percentage points (Table 7). In other words, using the SPM resource measure increases the poverty rate by 1.7 points.
The combined effect on poverty of all the differ-ences between the SPM resource measure and the official resource measure need not equal the sum of the effects of the 12 individual differences. There can be substantial interaction effects. For example, although including either SNAP benefits or a housing subsidy in the resource measure may not move a unit out of poverty, including both benefits may do so.54
The sum of the six poverty-increasing resource measure elements (6.9 percentage points) exceeds the
Total (18–64) 18–24 25–34 35–44 45–54 55–64
Refundable tax credits -2.1 -2.9 -3.2 -3.0 -1.3 -0.4Housing subsidies -0.7 -0.8 -0.8 -0.6 -0.7 -0.8LIHEAP (energy assistance) -0.1 -0.1 -0.1 a -0.0 -0.1 -0.1School lunches -0.2 -0.2 -0.3 -0.4 -0.1 -0.1SNAP (formerly the Food Stamp Program) -1.2 -1.7 -1.6 -1.2 -0.9 -0.8WIC -0.1 -0.2 -0.2 -0.1 a -0.0 a -0.0
Federal income taxes 0.6 0.8 0.6 0.4 0.5 0.6Payroll taxes 1.4 1.8 1.6 1.4 1.1 1.0State income taxes 0.2 0.4 0.2 0.2 0.2 0.2Child support paid 0.2 0.1 0.2 0.3 0.2 0.1MOOP expenses 2.8 3.1 2.4 2.5 2.7 3.5Work expenses 1.7 2.5 2.2 1.7 1.3 1.1
1.7 2.4 0.4 0.7 2.1 3.0
a.
b.
Table 7.Percentage point changes in the SPM poverty rate attributed to individual additions to and subtractions from SPM resources for adults aged 18–64, by selected age groups, 2011
SPM resource additions and subtractions
Additions (refundable tax credits and noncash transfers)
Subtractions (taxes and other nondiscretionary expenses)
Combined effect of all SPM additions and subtractions b
Negative, but greater than -0.05.
Because of the interaction effect and rounding, the combined effect does not equal the sum of the individual changes.
Poverty-reducing components
Poverty-increasing components
SOURCE: The public-use version of the 2012 Current Population Survey's Annual Social and Economic Supplement.
NOTES: LIHEAP = Low-Income Home and Energy Assistance Program; MOOP = medical out-of-pocket; SNAP = Supplemental Nutrition Assistance Program; SPM = Supplemental Poverty Measure; WIC = Special Supplemental Nutrition Program for Women, Infants, and Children.

Social Security Bulletin, Vol. 75, No. 2, 2015 73
sum of the six poverty-reducing resource measure elements (4.4 percentage points) by 2.5 percentage points. Thus, the net interaction effect is -0.8 percent-age points (1.7 – 2.5).
The combined effect of resource-measure differ-ences on poverty rises steadily with age, from an increase of 0.4 percentage points for the 25–34 sub-group to an increase of 3.0 percentage points for the 55–64 subgroup.
Effects of Elements of the Threshold MeasureWe now examine the effects of various elements of the SPM threshold measure; that is, housing status, geo-graphic area, threshold level, and equivalence scale. In addition, we consider the combined effect of the various elements of the SPM threshold measure. These effects on the SPM poverty rate for nonaged adults are given in Table 8.
Housing-status adjustments. The SPM thresholds depend on a unit’s housing-tenure status group. The groups are units that have owners with mortgages, owners without mortgages, and renters. All thresholds for units that have owners without mortgages are 15 percent lower than they would be if the thresholds did not depend on housing status. Correspondingly, thresholds for units that have owners with mortgages and renters are respectively 3 percent and 1 percent higher than they would be if the thresholds did not depend on housing status.55
To estimate the effect of housing-status adjust-ments, we remove them from the SPM thresholds and compare SPM poverty with the poverty that results when we use these modified thresholds. We find that the housing-status adjustment decreases the poverty
rate of the nonaged adult population by 0.4 percentage points.56 About 20 percent of that population who are poor in the absence of this adjustment reside in units that have owners with no mortgages; the adjustment markedly lowers their thresholds and moves many of these people out of poverty. The adjustment decreases the poverty rate for people in units that have owners with no mortgages by 3.7 percentage points.57 For peo-ple in units that have owners with mortgages and those in units that have renters, there are small increases in their poverty rates (0.5 percentage points each).
Among the age subgroups of nonaged adults, the decreases in poverty rates that are due to the housing-status adjustments are largest for the 45–54 and 55–64 subgroups at 0.5 and 0.7 percentage points, respec-tively. These are the age subgroups with the highest percentages of poor people in units that have owners with no mortgages.
Geographic adjustments. The SPM thresholds are adjusted to reflect geographic differences in living costs. The adjustment factors depend on housing-status group and area rent levels. Rent data for more than 300 areas are from the American Community Survey. For a given housing-status group, the geo-graphic-adjustment factor is derived by multiplying an area’s rent-index value by the group’s share of housing expenditures (shelter plus utilities) in its threshold and adding this product to the group’s nonhousing share. The rent index is the ratio of the area’s rent to the national average rent.58
The rent-index values range from about 0.60 to 1.90. For units that have owners with mortgages, owners without mortgages, and renters, the shares of expenses for housing in the thresholds are .507, .401, and .497,
Total (18–64) 18–24 25–34 35–44 45–54 55–64
-0.4 -0.4 a 0.0 -0.2 -0.5 -0.70.6 0.8 0.8 0.9 0.3 0.32.5 3.2 2.7 2.4 2.0 2.10.4 1.3 0.4 0.3 0.4 a 0.0
2.8 4.8 3.4 2.9 2.1 1.4
a.
b.
Table 8.Percentage point changes in the SPM poverty rate attributed to individual features of the SPM threshold for adults aged 18–64, by selected age groups, 2011
SOURCE: The public-use version of the 2012 Current Population Survey's Annual Social and Economic Supplement.
Positive, but less than 0.05.
Because of the interaction effect and rounding, the combined effect does not equal the sum of the individual changes.
Threshold feature
Housing-status adjustmentGeographic adjustmentThreshold levelEquivalence scale
Combined effect of all SPM threshold features b
NOTE: SPM = Supplemental Poverty Measure.

74 http://www.socialsecurity.gov/policy/docs/ssb/
respectively (Bureau of Labor Statistics 2012). For nonaged adults, the geographic-adjustment factors average about 1.02 and range from 0.80 to 1.48.
We remove the geographic adjustments from the SPM thresholds and compare SPM poverty with the poverty that results when we use those modified thresholds.59 The geographic adjustment increases the overall poverty rate of nonaged adults by 0.6 percent-age points (Table 8). The adjustment raises thresh-olds for people in higher-cost areas and thus moves 3.7 million of them into poverty; on the other hand, the adjustment lowers thresholds for people in lower- cost areas and thus moves 2.6 million of them out of poverty. It markedly increases poverty in two regions (the Northeast and West) and decreases poverty in the other two regions (the Midwest and South).60 The adjustment decreases poverty substantially for people living outside of MSAs and increases it for those liv-ing inside MSAs.
Among the age subgroups of nonaged adults, the increases in poverty rates that are due to the geo-graphic adjustments are smallest for the 45–54 and 55–64 subgroups at 0.3 percentage points each.61
Threshold level. With no housing-status adjustment and no geographic adjustment, the SPM threshold for the two-adult/two-child unit for 2011 would have been $25,000.62 The two-adult/two-child official threshold for 2011 was $22,811. Thus, for this base unit, the official threshold is only 91.24 percent of the SPM threshold.
To estimate the effect of the threshold-level dif-ference, we remove that difference by multiplying each unit’s SPM threshold by .9124. We then compare SPM poverty with the poverty that results when we use these modified thresholds. This change increases the poverty rate for nonaged adults by 2.5 percentage points (Table 8).
Equivalence scales. There are important differ-ences between the official and SPM equivalence scales. Both scales depend on unit size and number of unit children, but they depend on these two factors in somewhat different ways, as we will show. The official scale also depends on the age of the unit head; one-person and two-person units with aged heads have lower scale values than corresponding units with nonaged heads.
In estimating the total effect of using the SPM equivalence scale on poverty of nonaged adults, we incorporate the official equivalence scale into the
SPM thresholds as follows. For each poverty measure, the equivalence-scale value is set equal to 1.00 for a nonaged two-adult/two-child unit. For each unit type, we compute the ratio of the official-scale value to the SPM-scale value, where unit type is defined by unit size, number of children, and whether the unit head is at least age 65. We next multiply each unit’s SPM threshold by the ratio of scale values to obtain modi-fied thresholds. We find that using the SPM equiva-lence scale increases the poverty rate for nonaged adults by 0.4 percentage points, an increase of 0.8 mil-lion persons (Table 8).63
Using the SPM scale increases poverty for units for which the SPM-scale value is greater than the official-scale value and decreases poverty for units for which the SPM-scale value is less than the official-scale value. Table 9 shows the ratios of the SPM equivalence-scale value to the official measure equivalence-scale value for the various unit types. The ratio of the SPM-scale value to the official-scale value exceeds 1.00 for all units with three to eight persons and zero to two children, excluding units with four persons and two children; for those units, using the SPM scale increases the number of non-aged adults in poverty by 2.3 million. On the other hand, the ratio of these scale values is less than 1.00 for all units with three to eight persons and three to seven children; for those units, using the SPM scale reduces the number of nonaged adults in poverty by 0.3 million. Correspondingly, using the SPM scale for one-person nonaged units reduces the poverty of nonaged adults by 1.0 million.
Among the narrow age subgroups of nonaged adults, there are increases in poverty rates resulting from using the SPM equivalence scale for four of the five subgroups (Table 8). For the 55–64 subgroup, there is no change in poverty.64
All threshold elements. We now examine the com-bined effect of adjustments for housing and geographic area, threshold level, and equivalence scale on poverty of nonaged adults. For each SPM unit, we replace the SPM threshold with the official threshold. The official thresholds depend on SPM unit size, number of unit children, and whether the unit head is at least age 65. We then compare SPM poverty with the poverty that results when we use these modified thresholds, but continue to use the SPM resource measure and SPM units.
We find that using the SPM thresholds increases the poverty rate of nonaged adults by 2.8 percentage

Social Security Bulletin, Vol. 75, No. 2, 2015 75
points (Table 8). The sum of the four individual threshold-element effects—housing adjustment (decreases the poverty rate by 0.4 percentage points), geographic adjustment (increases the rate by 0.6 points), threshold level (increases the rate by 2.5 points), and equivalence scale (increases the rate by 0.4 points)—yields a poverty-rate increase of 3.1 per-centage points. Thus, the interaction effect is a pov-erty-rate decrease of 0.3 percentage points (2.8 – 3.1).
Among the narrow age subgroups of nonaged adults, the increases in the poverty rate that result from the combination of all the threshold changes is smallest for the 55–64 subgroup, at 1.4 percentage points (Table 8).
Effects of Unit DefinitionWe now compare the official poverty of nonaged adults (18–64) with the poverty that results when we use the SPM unit, but use the official resource and threshold concepts.65 We find that replacing the official unit with the SPM unit reduces the poverty rate for nonaged adults by 1.4 percentage points (Table 10).
The majority of nonaged adults stay in the same unit; that is, their SPM unit is the same as their official unit. However, about 10 percent of them end up in a new unit; that is, in a SPM unit that differs from their official unit. Some 97 percent of these new-unit
persons end up in larger SPM units.66 Replacing the official unit with the SPM unit moves about a sixth of these new-unit persons out of poverty; a very small proportion moves into poverty. In larger units, there is more resource sharing and more economies of scale that tend to reduce the number of people in poverty.
Among the age subgroups of nonaged adults, the decrease in poverty rates because of the change in unit declines with age, from 2.8 percentage points for the 18–24 subgroup to 0.7 percentage points for the 55–64 subgroup (Table 10). The percentage of nonaged adults ending up in new units decreases with age, from 15 percent for the 25–34 subgroup to 5 percent for the 55–64 subgroup (not shown).
Effect of All Elements of the SPMFor nonaged adults, the SPM poverty rate exceeds the official rate by 1.8 percentage points. The combined effect of all changes (from the official measure to SPM) in the resource measure increases the poverty rate by 1.7 percentage points. The combined effect of all changes in the threshold measure increases the poverty rate by 2.8 points. On the other hand, replac-ing the official unit with the SPM unit reduces the poverty rate by 1.4 points. The sum of the resource, threshold, and unit effects (1.7 + 2.8 – 1.4) is 3.1 points. Thus, the interaction effect in this case is a substantial -1.3 percentage points (1.8 – 3.1).
0 1 2 3 4 5 6 7
Younger than age 65 0.90 . . . . . . . . . . . . . . . . . . . . .Aged 65 or older 0.98 . . . . . . . . . . . . . . . . . . . . .
Unit head younger than age 65 0.99 1.03 . . . . . . . . . . . . . . . . . .Unit head aged 65 or older 1.10 1.03 . . . . . . . . . . . . . . . . . .
1.30 1.11 1.05 . . . . . . . . . . . . . . .1.20 1.08 1.00 0.95 . . . . . . . . . . . .1.17 1.07 1.01 0.95 0.92 . . . . . . . . .1.15 1.08 1.03 0.98 0.93 0.91 . . . . . .1.11 1.05 1.02 0.97 0.94 0.90 0.91 . . .1.09 1.04 1.01 0.97 0.94 0.91 0.88 0.86
a.
Number of children
Table 9.Ratio of the SPM equivalence-scale value to the official poverty measure equivalence-scale value, by unit size, age of unit head, and number of children
Unit size and age of unit head a
One person
Two people
Three peopleFour peopleFive peopleSix people
Ratios for units with three or more persons do not depend on the age of the unit head.
Seven peopleEight people
SOURCE: Authors' calculations.
NOTES: SPM = Supplemental Poverty Measure; . . . = not applicable.

76 http://www.socialsecurity.gov/policy/docs/ssb/
Summary of Empirical FindingsFirst, we provide an overview of our comparisons of official measure and SPM estimates. Then, we summarize our analysis of the effects of the vari-ous features of the SPM on poverty of the nonaged adult population.
Comparison of Official and SPM EstimatesFor the total population under study, the SPM poverty rate (16.1 percent) exceeds the official rate (15.1 per-cent). For broad age groups, the SPM and official mea-sures give quite different results. For nonaged adults (18–64), the SPM poverty rate (15.6 percent) exceeds the official rate (13.7 percent) by 13 percent. Larger discrepancies are observed for the younger and older segments of the population. Compared with the official measure, the SPM shows much more poverty for adults aged 65 or older (an increase in the poverty rate, from 8.7 percent to 15.1 percent) and substantially less poverty for children younger than age 18 (a decrease in the poverty rate, from 22.3 percent to 18.2 percent). Compared with the official measure, the SPM shows much smaller age-group differences in poverty rates. Among nonaged adults, we also observe that for the majority of narrow age subgroups, the SPM poverty rates exceed the official rates.
For the total population under study, the SPM deep poverty rate (5.2 percent) is lower than the official deep poverty rate (6.7 percent). For broad age groups, the SPM and official measure give quite different results for deep poverty. For nonaged adults (18–64), the SPM deep poverty rate (5.5 percent) also is lower than the official deep poverty rate (6.3 percent). Compared with the official measure, the SPM shows a much higher rate for deep poverty among aged adults and a much lower rate for children.
Switching to the SPM moves about 5.0 percent of nonaged adults into poverty and about 3.1 percent out of poverty. Much of this movement into and out of poverty occurs near the poverty line.
We examine poverty of nonaged adults (18–64) for various demographic and socio economic groups (Table 6). Among the groups with the largest percent-age increases in poverty are people with private health insurance, those in units that have an owner with a mortgage, and Asians. Some groups (blacks, persons in units that have an owner with no mortgage, those residing in the Midwest, women, and nonworkers) have very small changes in poverty. Several groups (persons with only public health insurance and those residing outside MSAs) have substantial decreases in poverty. Workers have a large percentage increase in poverty, but nonworkers have little change in poverty.
Effects of SPM Features on the Poverty Rates of Nonaged AdultsFor nonaged adults, the SPM poverty rate (15.6 per-cent) exceeds the official rate (13.7 percent) by 1.9 per-centage points.
The combined effect of all changes (from the offi-cial measure to the SPM) in the resource measure is to increase the poverty rate by 1.7 percentage points. Among the six poverty-increasing resource elements (that is, taxes and other nondiscretionary expenses), MOOP expenses, work expenses, and payroll taxes produce the largest increases in the poverty rate—2.8, 1.7, and 1.4 percentage points, respectively. Among the six poverty-reducing resource elements (that is, refundable tax credits and noncash transfers), refundable tax credits and SNAP produce the largest decreases in the poverty rate—2.1 and 1.2 percentage points, respectively.
Total (18–64) 18–24 25–34 35–44 45–54 55–64
1.7 2.4 0.4 0.7 2.1 3.02.8 4.8 3.4 2.9 2.1 1.4
-1.4 -2.8 -2.0 -1.0 -0.9 -0.7
1.8 2.5 0.2 1.3 2.5 2.9
a. Because of the interaction effect and rounding, the combined effect does not equal the sum of individual changes.
Table 10.Percentage point change in the SPM poverty rate attributed to features of the SPM for adults aged 18–64, by selected age groups, 2011
SOURCE: The public-use version of the 2012 Current Population Survey's Annual Social and Economic Supplement.
NOTE: SPM = Supplemental Poverty Measure.
SPM element
All resource featuresAll threshold featuresUnit
Combined effect of all features a
Social Security Bulletin, Vol. 75, No. 2, 2015 77
The combined effect of all the changes in the thresh-old measure is to increase the poverty rate by 2.8 per-centage points. Raising the threshold level increases the poverty rate by 2.5 percentage points and is by far the largest of the individual threshold-element effects.
Replacing the official unit with the SPM unit reduces the poverty rate by 1.4 percentage points.67
Concluding CommentsThe impact of taxes (payroll taxes, refundable tax credits, and income taxes) and government noncash benefit programs (food stamps, housing subsidies, and so forth) are directly reflected in SPM estimates, but not in official poverty estimates.
Additional research on the SPM should prove very fruitful. We could benefit from research evaluating the SPM and testing alternative methods of improving it. Additional research is needed on elements of both the resource and threshold measures. Further investiga-tion of the valuation of work expenses, adjustments for underreporting of income and expenses, and geographic adjustments of thresholds should be of high priority. Finally, more research on how and why the SPM and official poverty estimates differ would be worthwhile, particularly regarding population sub-groups such as children.
Appendix A: Evolution of the SPMWhat ultimately became the official poverty measure was developed by Mollie Orshansky of SSA, from 1963 through 1964 (Orshansky 1963, 1965a, 1965b). In May 1965, the Office of Economic Opportunity, newly established as part of the Johnson administra-tion’s War on Poverty, adopted the Orshansky measure as a working or quasi-official definition of poverty.68 In August 1969, the Orshansky measure was desig-nated as the federal government’s official statistical definition of poverty (Fisher 1992). Only a few minor changes in the measure have been made since 1969.
Over time, concerns about the adequacy of the official measure increased. As a result, in the early 1990s at the request of Congress, the National Acad-emy of Sciences (NAS) undertook an independent scientific study of the concepts, measurement meth-ods, and information needs for a poverty measure. For that purpose, NAS established the Panel on Poverty and Family Assistance, which released its 1995 report, Measuring Poverty: A New Approach (Citro and Michael 1995). Based on its assessment of the weaknesses of the official poverty measure, the NAS
panel recommended a considerably different poverty measure that it believed would much better reflect contemporary government policy and economic and social realities.
Over the next 15 years or so, numerous government and nongovernment studies examined alternative poverty measures. For example, the Census Bureau released studies that presented a set of experimental poverty measures based on the recommendations of the NAS panel (Short and others 1999; Short 2001). Those studies suggested that the new measures would identify as poor a rather different population than that identified by the official poverty measure.
In 2009, the Office of Management and Budget formed a working group of representatives from a number of government agencies to consider improv-ing the measurement of poverty. This working group was asked to develop a set of initial starting points to permit the Census Bureau, in cooperation with the Bureau of Labor Statistics, to produce a supplemental poverty measure. The Interagency Technical Working Group on Developing a Supplemental Poverty Mea-sure (ITWG) issued its report in 2010.69
In 2011, the Census Bureau released its first report on the SPM (Short 2011). That report described the new measure in some detail and presented estimates of SPM-based poverty for both 2009 and 2010. The sec-ond, third, and fourth annual SPM reports presented estimates for 2011, 2012, and 2013, respectively (Short 2012, 2013, 2014). The recently released SPM is largely based on the recommendations of the NAS panel; deviations from the panel’s recommendations reflect suggestions from the ITWG and more current research.
Appendix B: CPS Data for Components of the SPM Resource MeasureThe sources of the dollar values for the various in-kind benefits, refundable tax credits, tax liabilities, and other nondiscretionary expense items given in the CPS/ASEC data file are discussed in this Appendix. We begin by discussing (1) in-kind benefits, and (2) taxes and refundable tax credits.• Housing subsidies. The CPS/ASEC collects infor-
mation on recipiency, but not on amounts received. To estimate amounts of such assistance, the Depart-ment of Housing and Urban Development program rules are applied to CPS households.
• Low-Income Home Energy Assistance Program (LIHEAP). The CPS/ASEC collects information on amounts received.

78 http://www.socialsecurity.gov/policy/docs/ssb/
• National School Lunch Program (NSLP). The CPS/ASEC collects information on recipiency, but not on amounts received. To value benefits, the Census Bureau uses the amount of the cost per lunch from the Department of Agriculture’s Food and Nutrition Service.
• Supplemental Nutrition Assistance Program (SNAP). The CPS/ASEC collects information on amounts received.
• Special Supplemental Nutrition Program for Women, Infants, and Children (WIC). The CPS/ASEC collects information on recipiency, but not on amounts received. To value the benefits, the Census Bureau uses program information from the Depart-ment of Agriculture.
• Taxes and refundable tax credits. The CPS/ASEC does not collect information on taxes and refund-able tax credits, but relies on a tax calculator to simulate them. The calculator is a computer pro-gram that incorporates the main features of federal and state tax laws. These simulations also use a statistical match of the CPS/ASEC to the Internal Revenue Service’s Statistics of Income microdata file of tax returns.We conclude by discussing other necessary
expenses that are subtracted from resources.• Child support paid. The CPS/ASEC collects infor-
mation on amounts paid.• Medical out-of-pocket (MOOP) expenses. The
CPS/ASEC collects information on amounts paid for (1) health insurance premiums; (2) over-the-counter health-related products; and (3) medical care (hospital visits, medical providers, dental ser-vices, prescription medicine, vision aids, and medi-cal supplies). Caswell and O’Hara (2010) conclude that CPS/ASEC estimates of MOOP expenditures compare favorably to estimates from the Medical Expenditure Panel Survey (MEPS) and the Survey of Income and Program Participation (SIPP). The MEPS, in particular, devotes considerably more effort to collecting MOOP expenditures than does the CPS/ASEC.
• Work-related expenses (excludes childcare expenses). The CPS/ASEC does not collect infor-mation on work-related expenses (travel to work, tools, uniforms, and so forth). Information on amounts of work expenses from the most recent SIPP is used to estimate those expenses for workers in the CPS/ASEC.
• Childcare expenses. The CPS/ASEC collects information on amounts of such expenses (any type of childcare while parents are at work).
NotesAcknowledgments: We thank Linda Del Bene, Irena Dushi, Howard Iams, Patrick Purcell, and especially Michael Leonesio for helpful comments on earlier drafts of this article; we also thank Linda Del Bene for preparing the tabular material.
1 In an earlier article (Bridges and Gesumaria 2013), we focused on the measurement of poverty among adults aged 65 or older.
2 There are two slightly different versions of the official poverty measure: (1) poverty thresholds, which are more detailed and primarily used for statistical purposes; and (2) poverty guidelines, which are a simplified version of the thresholds, primarily used for administrative purposes. In this article, we use the term “official poverty measure” to denote the poverty threshold measure. For a discussion of the two measures, see the Institute for Research on Poverty (2013).
3 All members of a family unit are assigned the same poverty status; that is, poor or not poor.
4 An extensive discussion of such criticisms appears in Citro and Michael (1995).
5 Subsequently, the Census Bureau released SPM reports in 2012, 2013, and 2014 (Short 2012, 2013, 2014).
6 For a discussion of the evolution of the SPM, see Appendix A.
7 The poverty rate is the percentage of people in a group who are classified as poor.
8 Throughout the article, changes in poverty that are due to changes in the poverty measure used are the changes in poverty that result from switching from the official measure to the SPM.
9 This section draws heavily on Short (2012). Refer to that report for further details.
10 The 2012 CPS/ASEC is a household survey of the U.S. civilian noninstitutionalized population; it also includes military personnel who live in a household with at least one civilian adult. The number of households interviewed was about 74,000. Some 7,000 households were not interviewed because there was no available participant.
11 For a detailed discussion of the SPM and official unit measures, see Provencher (2011).
12 Money income in the CPS/ASEC consists of (1) earn-ings; (2) unemployment compensation; (3) workers’ compensation; (4) Social Security; (5) Supplemental Security Income (SSI); (6) public assistance (Temporary Assistance for Needy Families (TANF) and general assistance); (7) veterans’ payments; (8) survivor benefits;

Social Security Bulletin, Vol. 75, No. 2, 2015 79
(9) disability benefits; (10) pension or retirement income; (11) interest; (12) dividends; (13) rents, royalties, and estates and trusts; (14) educational assistance; (15) alimony; (16) child support; (17) financial assistance from outside of the household; and (18) other income.
13 For a critique of the resource-based SPM, see Meyer and Sullivan (2012). Those authors favor a consumption-based poverty measure.
14 Federal outlays for Supplemental Security Income (SSI) and Temporary Assistance for Needy Families (TANF) were about $56 billion and $17 billion. Both of these cash benefit programs are also designed to assist the low-income population.
15 This estimate is from the authors’ tabulation of the 2012 CPS/ASEC public-use file.
16 The sources of the dollar values for the various in-kind benefits, taxes, and other nondiscretionary expense items given on the CPS/ASEC public-use data file are discussed in Appendix B. For more details, see Short (2012) and refer-ences cited therein.
17 See note 16.18 Respondents reported amounts of premium and non-
premium MOOP expenses in the 2012 CPS/ASEC.19 For families of three or more persons, the multiplier
is 3. However, for families of two persons, the multiplier is 3.7. Without using a food plan and a multiplier, the thresh-olds for unrelated individuals were set at 80 percent of the corresponding thresholds for two-person families.
20 Bureau of Labor Statistics (2012).21 To be more precise, “expenditures around the 33rd
percentile” is the average of expenditures within the 30th to 36th percentile portion of the expenditure distribution.
22 In this article, the terms adults and children are used in two slightly different ways.
In calculating equivalence-scale values and thresholds values, all persons younger than age 15 and dependent persons aged 15–17 are counted as children; all persons aged 18 or older and nondependent persons aged 15–17 are counted as adults.
In all other parts of the article, the term “children” signifies persons younger than age 18 and the term “adults” means persons aged 18 or older. The term “nonaged adults” denotes persons aged 18–64.
23 The three-parameter scale values are calculated as follows:
1. SPM unit with one or two adults and no children— unadjusted-scale value = [number of adults]0.5
2. SPM unit with one adult and one or more children (mostly single-parent units)— unadjusted-scale value = [1 + 0.8 + 0.5(number of children – 1)]0.7
3. All other SPM units— unadjusted-scale value = [number of adults + 0.5(number of children)]0.7
In equation (2), the first child is treated as 80 percent of an adult; each additional child is treated as 50 percent of an adult. In equation (3), each child is treated as 50 percent of an adult. The numbers of adult equivalents are given by the expressions inside the brackets. For example, for a two-adult/two-child unit, equation (3) shows that the number of adult equivalents is three.
Economies of scale require that whenever an addi-tional equivalent adult is added to an SPM unit, the unit’s equivalence-scale value divided by the number of adult equivalents decreases. The exponents outside the brackets are the economy-of-scale factors. The smaller exponent (0.5) exhibits greater economies of scale than does the larger exponent (0.7).
The Census Bureau then adjusts all unadjusted-scale values proportionally so that the adjusted-scale value for the two-adult/two-child unit equals 1. The base threshold level for the two-adult/two-child unit is then multiplied by the adjusted-scale values to derive threshold values for the other unit types.
24 The Census Bureau’s report on official poverty shows a poverty rate of 15.0 percent for 2011 (DeNavas-Walt, Proctor, and Smith 2012). That report excludes all unre-lated individuals younger than age 15 from the universe of official poverty calculations.
In the Census Bureau’s report on SPM poverty (Short 2012) and in this article, these unrelated individuals are included in the universe for official and SPM poverty calculations. In the official poverty calculations, all of these unrelated individuals are counted as poor. In the SPM pov-erty calculations, they are assumed to share the resources of their SPM unit.
25 The SPM thresholds incorporate adjustments for geographic differences in housing costs. Because of confi-dentiality restrictions, the geographic information available for use in calculating the SPM thresholds on the public-use data file is slightly more limited than that available for use in calculating the SPM thresholds on the Census Bureau’s internal data file. Thus, this article’s SPM poverty estimates differ slightly from those in Short (2012).
26 The subtraction of MOOP expenses is the major cause of the increase in the measured poverty rate of the aged population.
27 Refundable tax credits are very important for units with children.
28 This terminology is somewhat different from that ordinarily used in the poverty literature, in which move-ments into and out of poverty are attributable to changes in a unit’s financial resources.
29 To be more precise, “1.00–1.49” means equal to or greater than 1.00, but less than 1.50. Correspondingly,
80 http://www.socialsecurity.gov/policy/docs/ssb/
“0.50–0.99” means equal to or greater than 0.50, but less than 1.00.
30 For full-time, year-round workers (a subgroup of our sample population not discussed), there is an 82 percent increase in poverty,
31 The mean age of poor nonaged adults in units with mortgages is about 5 years greater than that of poor non-aged adults in units with renters.
32 The percentages of poor nonaged adults living inside MSAs is highest for those living in the West and Northeast (about 90 percent) and lowest for those in the Midwest and South (about 80 percent).
33 About 60 percent of poor nonaged (18–64) Hispanic adults are foreign born. The percentages of poor nonaged adults who are Hispanic are highest in the West and North-east and lowest in the Midwest and South.
34 About 60 percent of poor nonaged (18–64) foreign-born adults are Hispanic. The percentages of poor nonaged adults who are foreign born are highest in the West and Northeast and lowest in the Midwest and South.
35 A substantial minority of nonmarried individuals ends up in a new unit, that is, in a SPM unit that differs from their official unit; the vast majority of those new units are larger than the official units. With larger units, there is more resource sharing and more economies of scale that tend to reduce the number of people in poverty. By contrast, relatively few married persons end up in new units.
36 To identify persons with a disability, we use the vari-able “prdisflg.” A person with a disability must have one or more of the following conditions: (1) deafness or serious difficulty hearing; (2) blindness or serious difficulty see-ing; (3) serious difficulty concentrating, remembering, or making decisions; (4) serious difficulty walking or climbing stairs; (5) difficulty dressing or bathing; (6) difficulty doing errands, such as visiting a doctor’s office or shopping. This definition of disability differs from the statutory definition of disability used by SSA to administer the Social Security Disability Insurance and SSI programs. In addition, the definition of disability used in this article does not indicate whether the disability limits or prevents work.
37 About a fourth of poor nonaged adults with a disability are Social Security beneficiaries.
38 Almost half of poor nonaged adults with no disability are workers. By contrast, only about a sixth of that popula-tion with a disability are workers.
39 Almost half of poor nonaged adult Social Security beneficiaries have a disability.
40 Almost half of poor nonaged adult Social Security nonbeneficiaries are workers. By contrast, less than a tenth of poor beneficiaries are workers.
41 Among poor nonaged adults with only public health insurance coverage, Medicaid coverage is considerably more common than Medicare coverage.
42 Some 15 percent of poor nonaged adults with private health insurance coverage also have public health insurance coverage.
43 For example, we compute the effect on the SPM poverty rate of adding refundable tax credits to the SPM resource measure using the following steps:
1. We subtract the value of each SPM unit’s refundable tax credits from its SPM resource measure.
2. For each unit, we then compare that modified resource measure to the unit’s SPM threshold to determine the modified poverty status of its members.
3. We then calculate the percentage of nonaged adults whose modified poverty status is poor; that is, we calculate the modified poverty rate. For this case, the modified poverty rate is 17.7 percent.
4. Finally, we compare the modified poverty rate with the SPM poverty rate. For nonaged adults, the SPM poverty rate is 15.6 percent.
The inclusion of refundable tax credits in the resource measure thus reduces the poverty rate by 2.1 percentage points (15.6 – 17.7).
44 These program benefit amounts usually incorporate behavioral and interprogram effects.
45 An interprogram effect exists when program rules specify that the benefit amount of one program affects the benefit amount of another program.
46 The federal earned income tax credit plus the refund-able portion of the federal child tax credit plus other refundable federal credits.
47 About 45 percent of SPM poor nonaged adults are in SPM units that receive refundable federal tax credits.
48 Other government cash transfers included as resources by both the SPM and official poverty measures are (1) unemployment insurance, (2) workers’ compensation, and (3) Temporary Assistance for Needy Families (TANF) and general assistance.
49 Federal individual income tax after subtracting nonre-fundable tax credits.
50 Contributions by employees and the self-employed to the Old-Age, Survivors, Disability, and Health Insur-ance program plus retirement contributions by federal employees.
51 State income tax after credits. Some amounts are negative.
52 For persons with only public insurance, this MOOP subtraction increases the poverty rate by 4.3 percentage points. For persons with private health insurance and those with no health insurance, the corresponding figures are 2.5 and 3.0 percentage points.
53 Subtracting payroll taxes from the official resource measure increases the official measure poverty rate by 0.8 percentage points.
Social Security Bulletin, Vol. 75, No. 2, 2015 81
54 The interaction effect is not the same as the interpro-gram effect discussed earlier (note 45).
55 With no geographic adjustment and no housing-status adjustment, the threshold for the two-adult/two-child unit would be 1.2($20,833) or $25,000. The base FCSU expendi-ture is $20,833, and 20 percent is added to the base expen-diture to allow for other basic needs (household supplies, personal care, and nonwork-related transportation). With no geographic adjustment, basic thresholds for two-adult/two-child units would be $25,703 for owners with mort-gages; $21,175 for owners without mortgages; and $25,222 for renters. Those three amounts are 103 percent, 85 per-cent, and 101 percent of $25,000. (See the Bureau of Labor Statistics 2012).
56 Preliminary thresholds are multiplied by geographic-adjustment factors to obtain final thresholds. Those factors depend on the housing-status group and on area rent. The inclusion of housing-status group in the calculation of geographic-adjustment factors reduces the poverty rate for nonaged adults by 0.1 percentage points. We include this effect as part of the effects of the geographic-adjustment factors and not as part of the effects of the housing-status adjustment.
57 Not shown in the article’s tables.58 The adjustment factors are calculated using the follow-
ing formula:Factorah = HousingShareh × (Renta / Rentn) + (1 –
HousingShareh), where a denotes geographic area, h denotes housing-status group, and n denotes national. See Renwick (2011).
59 Renwick (2011) made such estimates for an earlier year.
60 Not shown in the article’s tables.61 These are the two age subgroups with lower percent-
ages of poor people living in the West, slightly higher percentages in the South, and slightly higher percentages outside of MSAs.
62 Derived from the Bureau of Labor Statistics (2012).63 We estimate the role of the official threshold’s differen-
tial treatment of one-person and two-person units with aged heads. We find that this differential treatment has very little effect on the poverty of nonaged adults.
64 This subgroup has the lowest proportion of poor individuals in units with three to eight persons and zero to two children and the highest proportion of poor individuals in one-person units.
65 Note that here we compare official poverty with the poverty that results when we change a specified feature of the official measure. In all of our previous estimates of pov-erty effects, we compare SPM poverty with the poverty that results when we change a specified feature of the SPM. For the case of unit definition, the approach that we use here is considerably easier to implement than our usual approach.
66 For the remaining people whose SPM unit changes, their SPM unit and their official unit are of the same size, but differ in membership.
67 For aged adults (65 or older), Bridges and Gesumaria (2013) report the following results:
The combined effect of all the changes in the resource measure is an increase in the poverty rate of 5.5 percentage points. Of the subtractions of taxes and other nondiscre-tionary expenses, only the subtraction of MOOP expenses results in a large increase in the measured poverty rate (7.1 percentage points). This effect is substantially larger than that of any other change in resource measure, thresh-old measure, or unit definition. Of the additions of noncash transfers and refundable tax credits, the addition of housing subsidies produces the largest decrease in the poverty rate (1.2 percentage points).
The combined effect of all the changes in the threshold measure increases the poverty rate by 1.6 percentage points. Raising the threshold level and using the SPM equivalence scale increases the poverty rate by 2.8 percentage points and 1.3 percentage points, respectively. On the other hand, the housing-status adjustment decreases the poverty rate by 2.8 percentage points.
Replacing the official unit with the SPM unit reduces the poverty rate slightly, by 0.3 percentage points.
68 In its 1964 report, the President’s Council of Economic Advisors (CEA) set forth a poverty threshold of $3,000 (in 1962 dollars) for all families of two or more persons and a threshold of $1,500 for unrelated individuals. The Orshan-sky set of thresholds, in which the thresholds increase with family size, was clearly superior to the CEA alternative.
69 See ITWG (2010).
ReferencesBridges, Benjamin, and Robert V. Gesumaria. 2013. “The
Supplemental Poverty Measure (SPM) and the Aged: How and Why the SPM and Official Poverty Estimates Differ.” Social Security Bulletin 73(4): 49–69. http://www.socialsecurity.gov/policy/docs/ssb/v73n4/v73n4p49 .html.
Bureau of Labor Statistics. 2012. Supplemental Poverty Measure (SPM) Thresholds. Washington, DC: Depart-ment of Labor. http://www.bls.gov/pir/spmhome.htm.
Caswell, Kyle J., and Brett O’Hara. 2010. “Medical Out-of-Pocket Expenses, Poverty, and the Uninsured.” SEHSD Working Paper No. 2010-17. Washington, DC: Census Bureau, Social, Economic, and Housing Statistics Division.
Citro, Constance F., and Robert T. Michael (eds.). 1995. Measuring Poverty: A New Approach. Washington, DC: National Academy Press.
DeNavas-Walt, Carmen, Bernadette D. Proctor, and Jessica C. Smith. 2012. Income, Poverty, and Health Insurance

82 http://www.socialsecurity.gov/policy/docs/ssb/
Coverage in the United States: 2011. Census Bureau, Current Population Reports, P60-243. Washington, DC: Government Printing Office (September).
Falk, Gene. 2012. Low-Income Assistance Programs: Trends in Federal Spending. CRS Report for Congress, R41823. Washington, DC: Congressional Research Service (June 13).
Fisher, Gordon M. 1992. “The Development and History of the Poverty Thresholds.” Social Security Bulletin 55(4): 3–14.
Institute for Research on Poverty. 2013. What are Poverty Thresholds and Poverty Guidelines? Madison, Wis-consin: University of Wisconsin-Madison (September). http://www.irp.wisc.edu/faqs/faq1.htm.
[ITWG] Interagency Technical Working Group on Develop-ing a Supplemental Poverty Measure. 2010. Observa-tions from the Interagency Technical Working Group on Developing a Supplemental Poverty Measure. Wash-ington, DC: Census Bureau (March). http://www.census .gov/hhes/www/poverty/SPM_TWGObservations.pdf.
Meyer, Bruce D., and James X. Sullivan. 2012. “Identify-ing the Disadvantaged: Official Poverty, Consumption Poverty, and the New Supplemental Poverty Measure.” Journal of Economic Perspectives 26(3): 111–135.
Orshansky, Mollie. 1963. “Children of the Poor.” Social Security Bulletin 26(7): 3–13.
———. 1965a. “Counting the Poor: Another Look at the Poverty Profile.” Social Security Bulletin 28(1): 3–29.
———. 1965b. “Who’s Who Among the Poor: A Demo-graphic View of Poverty.” Social Security Bulletin 28(7): 3–32.
Provencher, Ashley J. 2011. “Unit of Analysis for Poverty Measurement: A Comparison of the Supplemental Poverty Measure and the Official Poverty Measure.” SEHSD Working Paper No. 2011-22. Washington, DC: Census Bureau, Social, Economic, and Housing Statis-tics Division.
Renwick, Trudi. 2011. “Geographic Adjustments of Supple-mental Poverty Measure Thresholds: Using the Ameri-can Community Survey Five-Year Data on Housing Costs.” SEHSD Working Paper No. 2011-2. Washington, DC: Census Bureau, Social, Economic, and Housing Statistics Division.
Short, Kathleen. 2001. Experimental Poverty Measures: 1999. Census Bureau, Current Population Reports, Consumer Income, P60-216. Washington, DC: Govern-ment Printing Office (October). http://www.census.gov /prod/2001pubs/p60-216.pdf.
———. 2011. The Research Supplemental Poverty Measure: 2010. Census Bureau, Current Population Reports, P60-241. Washington, DC: Government Printing Office (November). http://www.census.gov /hhes/povmeas /methodology/supplemental/research /Short_ResearchSPM2010.pdf.
———. 2012. The Research Supplemental Poverty Measure: 2011. Census Bureau, Current Population Reports, P60-244. Washington, DC: Government Printing Office (November). http://www.census.gov /hhes/povmeas /methodology/supplemental/research /Short_ResearchSPM2011.pdf.
———. 2013. The Research Supplemental Poverty Mea-sure: 2012. Census Bureau, Current Population Reports, P60-247. Washington, DC: Government Printing Office (November). http://www.census.gov/prod/2013pubs/p60 -247.pdf.
———. 2014. The Supplemental Poverty Measure: 2013. Census Bureau, Current Population Reports, P60-251. Washington, DC: Government Printing Office (October). http://www.census.gov/content/dam/Census/library /publications/2014/demo/p60-251.pdf.
Short, Kathleen, Thesia Garner, David Johnson, and Patricia Doyle. 1999. Experimental Poverty Measures: 1990 to 1997. Census Bureau, Current Population Reports, Consumer Income, P60-205. Washington, DC: Government Printing Office. http://www.census.gov /prod/99pubs/p60-205.pdf.