Embed Size (px)
Citation preview
Li-ion BESS for public transportation Electric bus battery lifetime estimation
T. Patey, R. Flueckiger, J. Poland, N. Prasad, O. Sologubenko; ABB Corporate Research, 4th of May 2015

Li-ion BESS for public transportation Outline
1) Introduction to electric bus lines
2) Electric, thermal, aging model of a battery
3) Case study - battery aging in an electric bus
4) Conclusions & Outlook
Introduction
Model
Case study
Conclusions
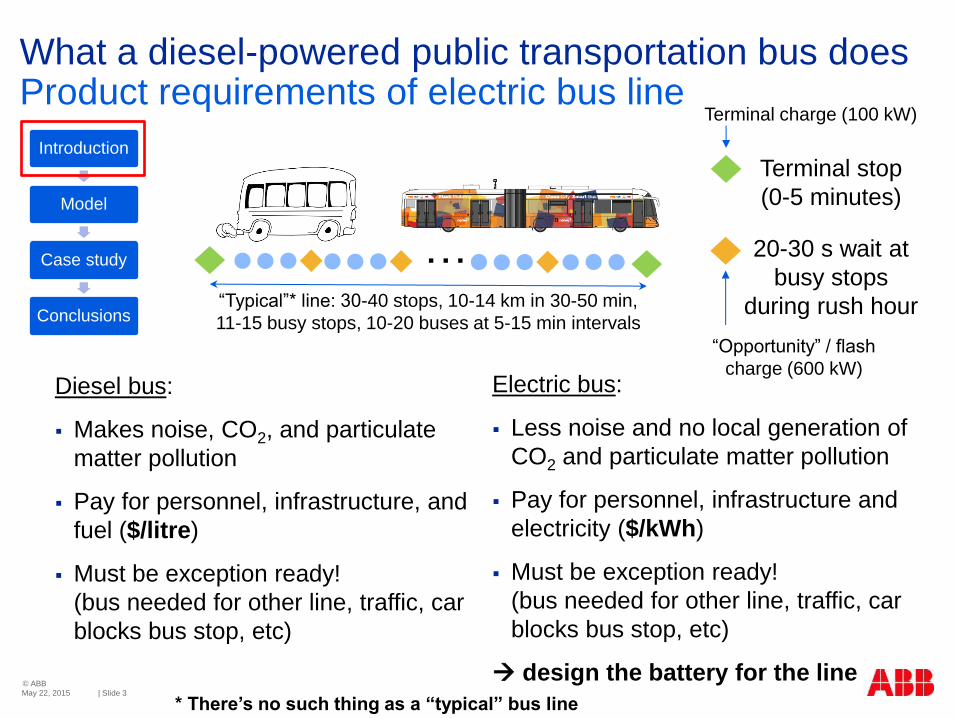
Diesel bus:
Makes noise, CO2, and particulate
matter pollution
Pay for personnel, infrastructure, and
fuel ($/litre)
Must be exception ready!
(bus needed for other line, traffic, car
blocks bus stop, etc)
What a diesel-powered public transportation bus does Product requirements of electric bus line
May 22, 2015 | Slide 3
© ABB
20-30 s wait at
busy stops
during rush hour
Terminal stop
(0-5 minutes)
…
Electric bus:
Less noise and no local generation of
CO2 and particulate matter pollution
Pay for personnel, infrastructure and
electricity ($/kWh)
Must be exception ready!
(bus needed for other line, traffic, car
blocks bus stop, etc)
design the battery for the line
“Typical”* line: 30-40 stops, 10-14 km in 30-50 min,
11-15 busy stops, 10-20 buses at 5-15 min intervals
* There’s no such thing as a “typical” bus line
“Opportunity” / flash
charge (600 kW)
Terminal charge (100 kW)
Introduction
Model
Case study
Conclusions
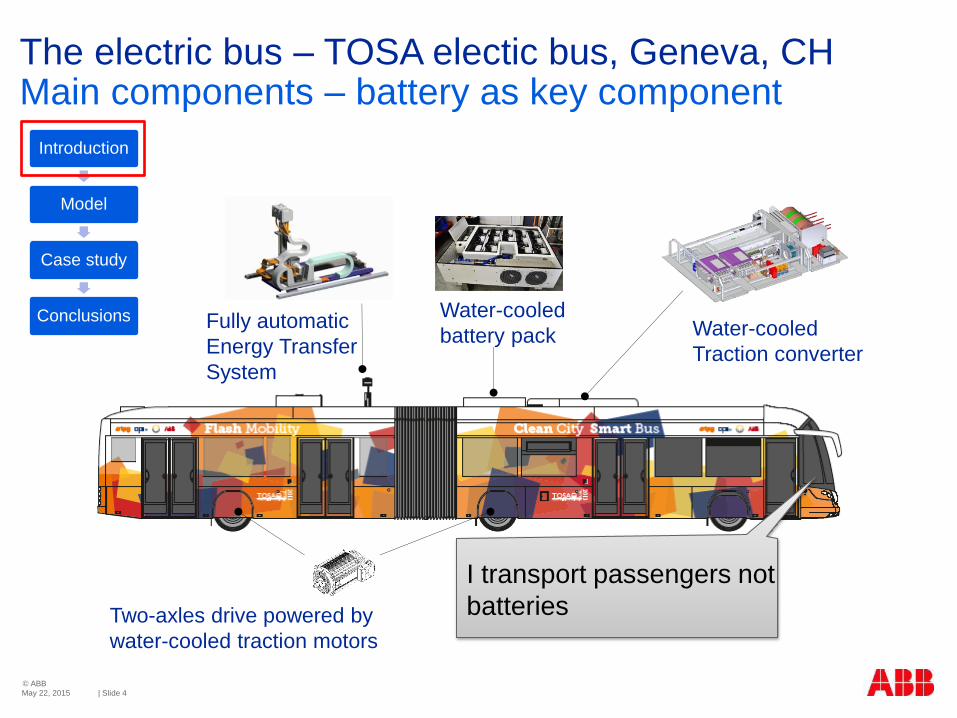
The electric bus – TOSA electic bus, Geneva, CH Main components – battery as key component
May 22, 2015 | Slide 4
© ABB
Water-cooled
Traction converter
Fully automatic
Energy Transfer
System
Water-cooled
battery pack
Two-axles drive powered by
water-cooled traction motors
I transport passengers not
batteries
Introduction
Model
Case study
Conclusions
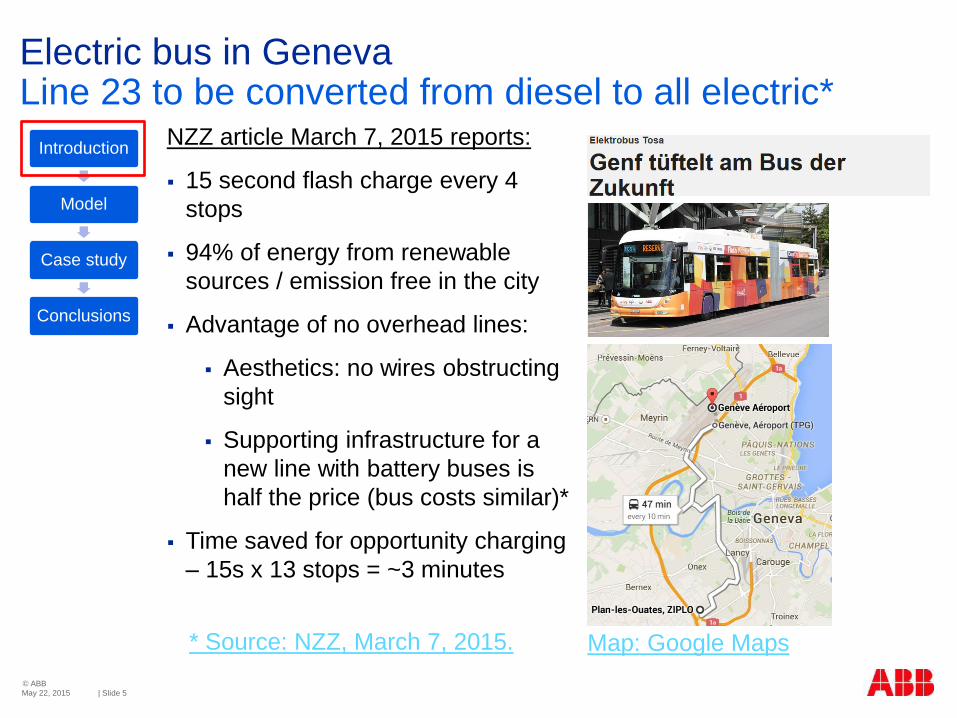
Electric bus in Geneva Line 23 to be converted from diesel to all electric*
May 22, 2015 | Slide 5
© ABB
NZZ article March 7, 2015 reports:
15 second flash charge every 4
stops
94% of energy from renewable
sources / emission free in the city
Advantage of no overhead lines:
Aesthetics: no wires obstructing
sight
Supporting infrastructure for a
new line with battery buses is
half the price (bus costs similar)*
Time saved for opportunity charging
– 15s x 13 stops = ~3 minutes
* Source: NZZ, March 7, 2015. Map: Google Maps
Introduction
Model
Case study
Conclusions
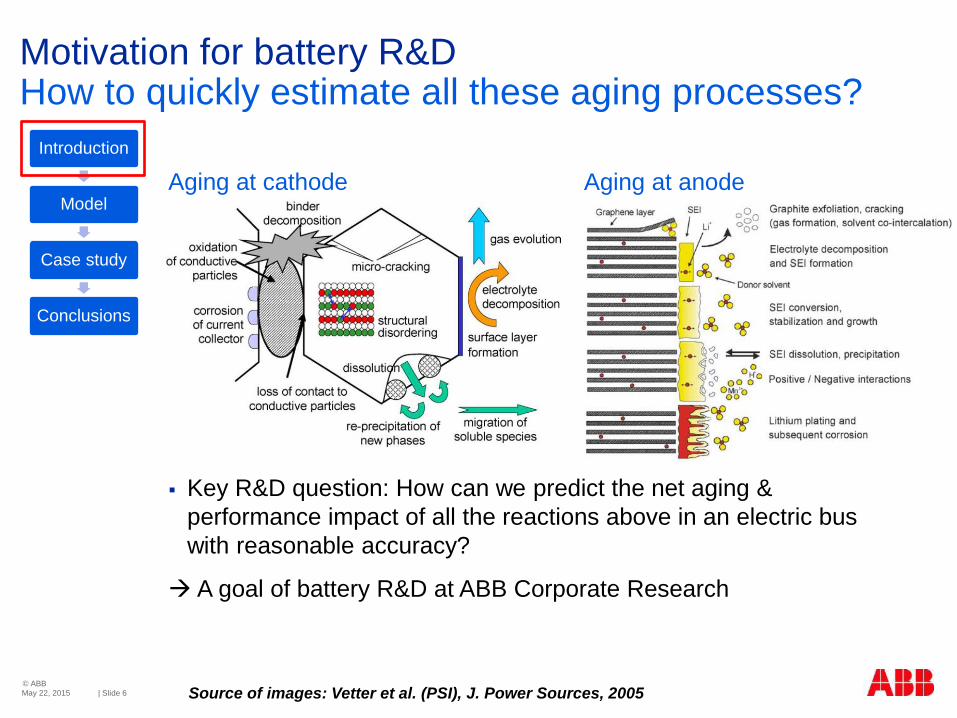
Motivation for battery R&D How to quickly estimate all these aging processes?
May 22, 2015 | Slide 6
© ABB
Aging at anode
Source of images: Vetter et al. (PSI), J. Power Sources, 2005
Aging at cathode
Key R&D question: How can we predict the net aging &
performance impact of all the reactions above in an electric bus
with reasonable accuracy?
A goal of battery R&D at ABB Corporate Research
Introduction
Model
Case study
Conclusions
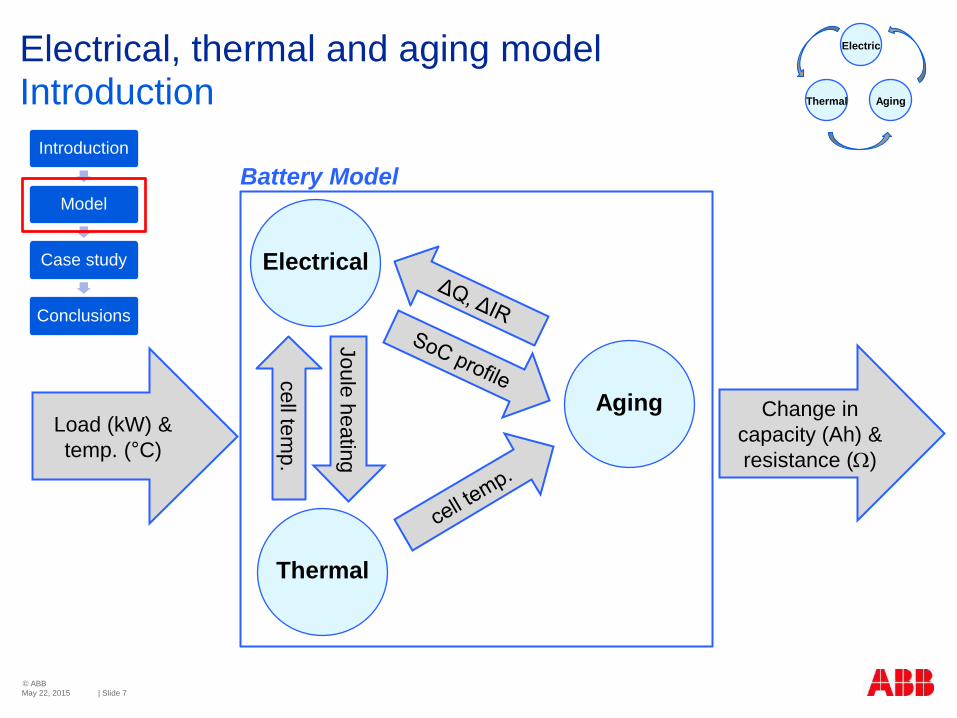
Electrical, thermal and aging model Introduction
May 22, 2015 | Slide 7
© ABB
Battery Model
Load (kW) &
temp. (°C)
Electrical
Thermal
Aging
Joule
heatin
g
cell te
mp.
Electric
Thermal Aging
Change in
capacity (Ah) &
resistance ()
Introduction
Model
Case study
Conclusions
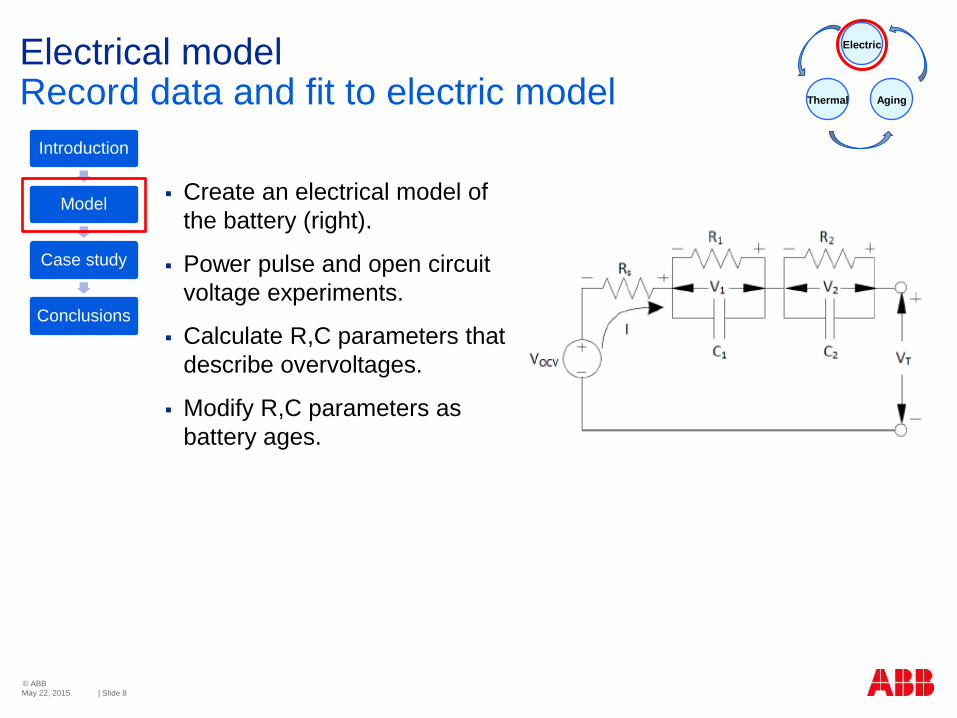
Electrical model Record data and fit to electric model
May 22, 2015 | Slide 8
© ABB
Create an electrical model of
the battery (right).
Power pulse and open circuit
voltage experiments.
Calculate R,C parameters that
describe overvoltages.
Modify R,C parameters as
battery ages.
Electric
Thermal Aging
Introduction
Model
Case study
Conclusions
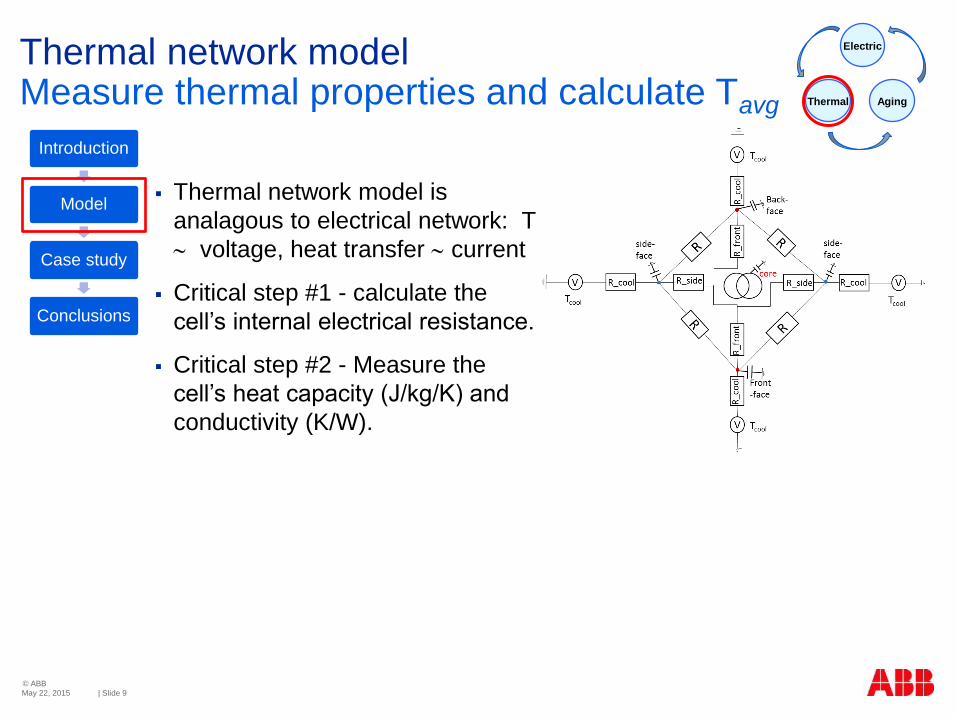
Thermal network model Measure thermal properties and calculate Tavg
May 22, 2015 | Slide 9
© ABB
Electric
Thermal Aging
Thermal network model is
analagous to electrical network: T
voltage, heat transfer current
Critical step #1 - calculate the
cell’s internal electrical resistance.
Critical step #2 - Measure the
cell’s heat capacity (J/kg/K) and
conductivity (K/W).
Introduction
Model
Case study
Conclusions
60
70
80
90
100
110
time and cycles
capacity [%
]
100
110
120
130
140
150
rela
tive IR
[%
]
formation
cycles
graceful
degradation
rapid
degradation
"knee"
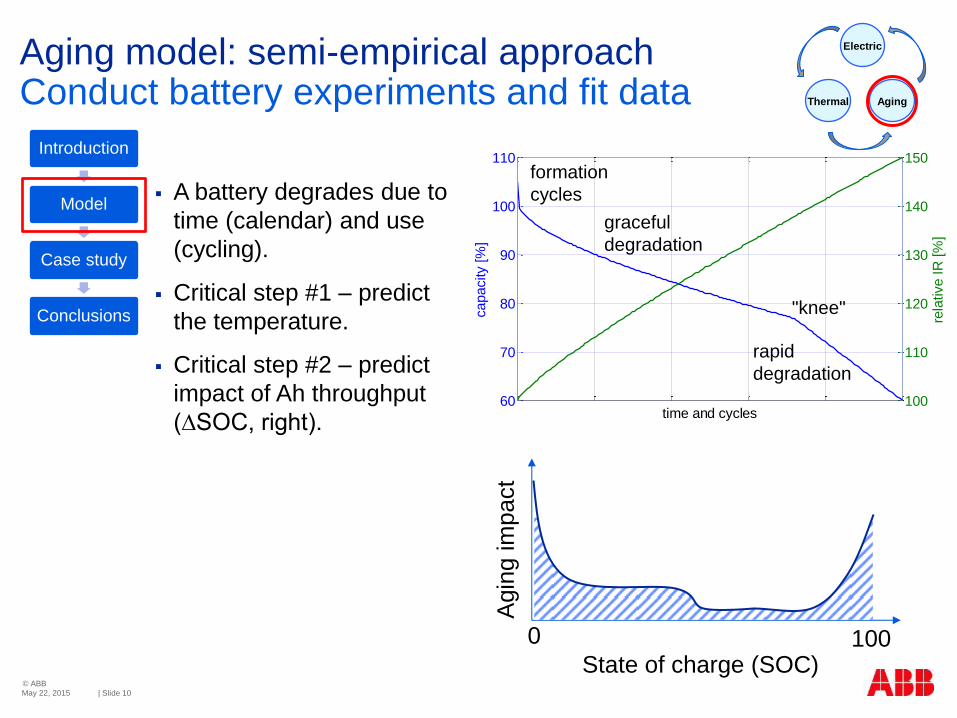
Aging model: semi-empirical approach Conduct battery experiments and fit data
May 22, 2015 | Slide 10
© ABB
Electric
Thermal Aging
A battery degrades due to
time (calendar) and use
(cycling).
Critical step #1 – predict
the temperature.
Critical step #2 – predict
impact of Ah throughput
(∆SOC, right).
State of charge (SOC)
0 100
Agin
g im
pact
Introduction
Model
Case study
Conclusions

Case study of electric bus, similar to TOSA, Geneva Geneva, Switzerland
© ABB
22 May 2015 | Slide 11
Case study details:
43 kWh, 300 kW Li-ion battery.
10 full journeys per day, 365 d/y for 10 y.
Lithium titanate (LTO) as anode.
Key design question: how does cooling influence
the aging of the battery?
Introduction
Model
Case study
Conclusions
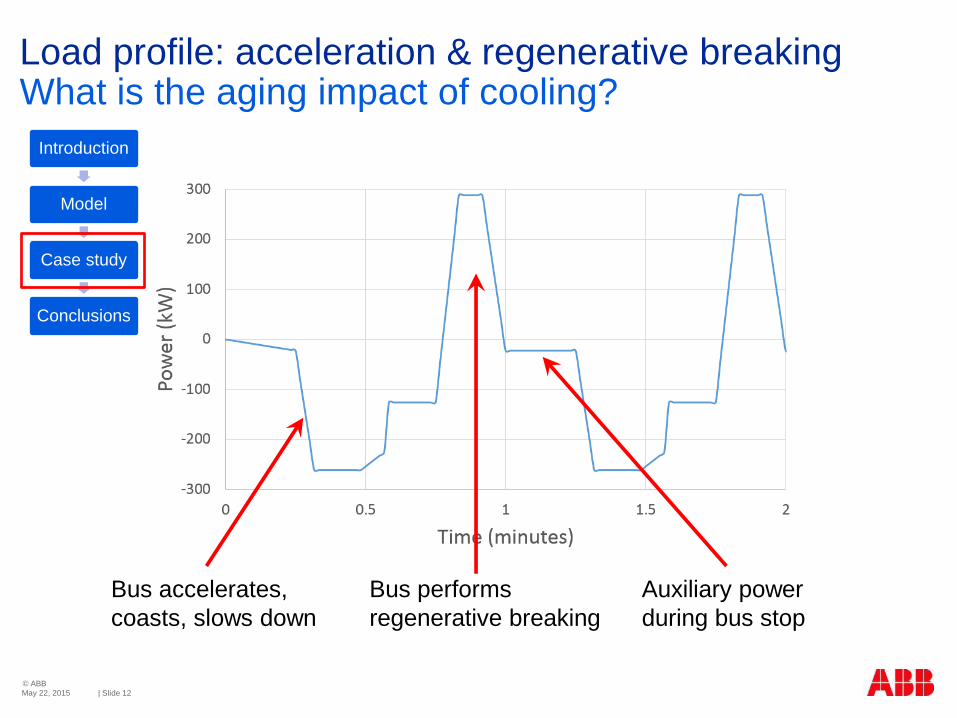
Load profile: acceleration & regenerative breaking What is the aging impact of cooling?
May 22, 2015 | Slide 12
© ABB
Bus accelerates,
coasts, slows down
Bus performs
regenerative breaking
Auxiliary power
during bus stop
Introduction
Model
Case study
Conclusions
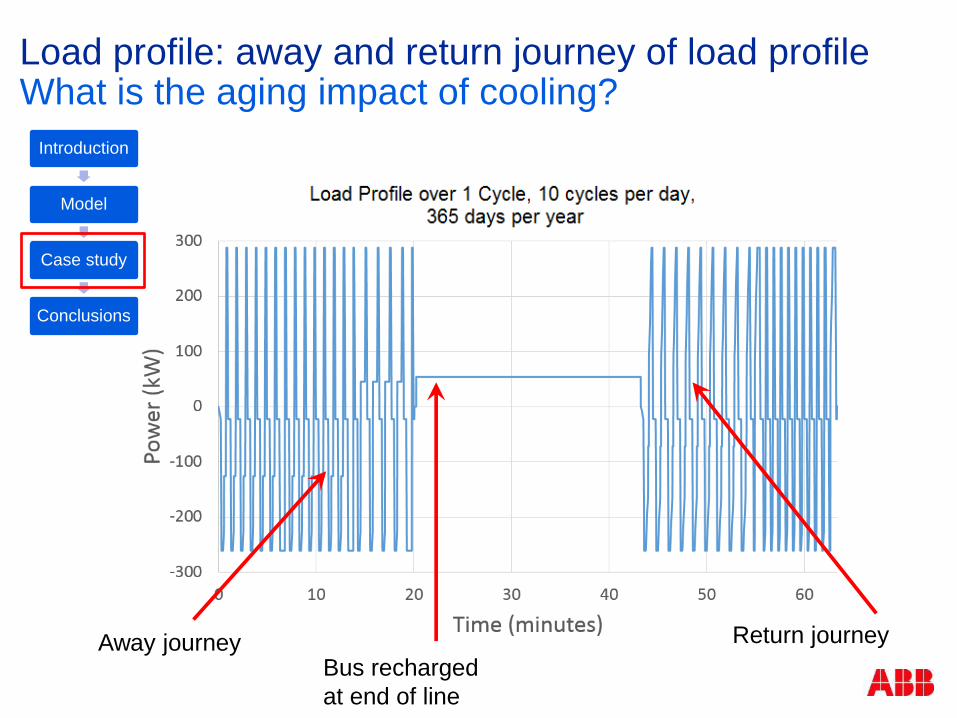
Load profile: away and return journey of load profile What is the aging impact of cooling?
Away journey Bus recharged
at end of line
Return journey
Introduction
Model
Case study
Conclusions
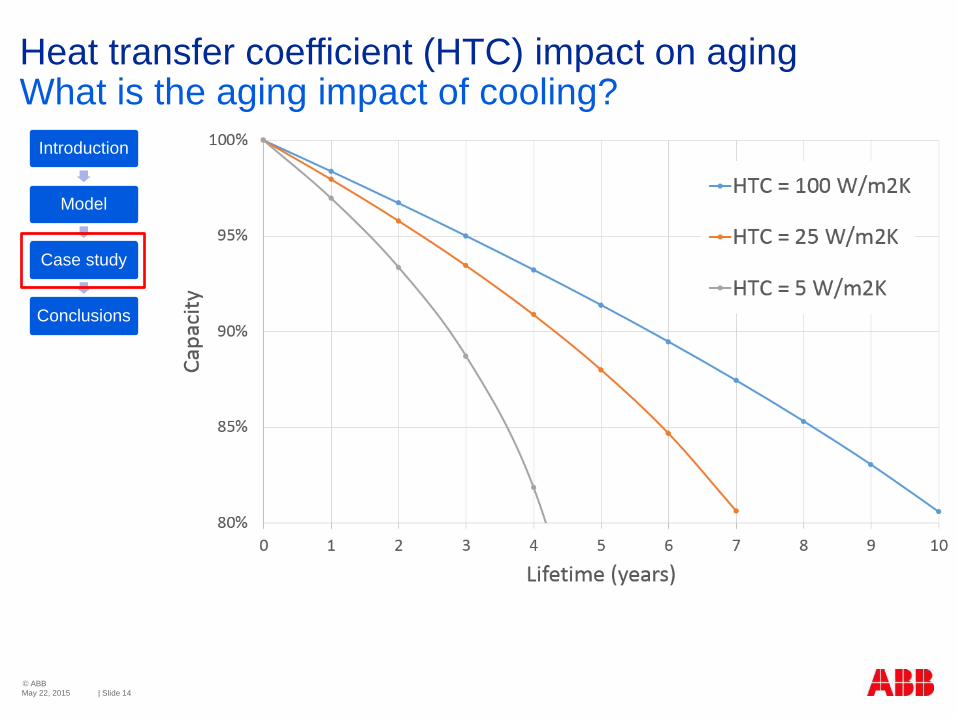
Heat transfer coefficient (HTC) impact on aging
May 22, 2015 | Slide 14
© ABB
What is the aging impact of cooling?
Introduction
Model
Case study
Conclusions

Heat transfer coefficient (HTC) impact on temperature
May 22, 2015 | Slide 15
© ABB
What is the aging impact of cooling?
Introduction
Model
Case study
Conclusions

Conclusions on battery model
May 22, 2015 | Slide 16
© ABB
For long lifetime of 10 years, liquid-cooling is needed to manage
aging and core temperature.
Battery modelling acts as design guideline and not “perfect”
forecast (especially for prototypes).
Model components are interdependent. For example:
Electric model determines resistance.
Thermal model calculates temperature (based on resistance).
Aging model highly depends on temperature (∆10°C = ca. x2
more aging), and modifies R.
Electric
Thermal Aging
Introduction
Model
Case study
Conclusions
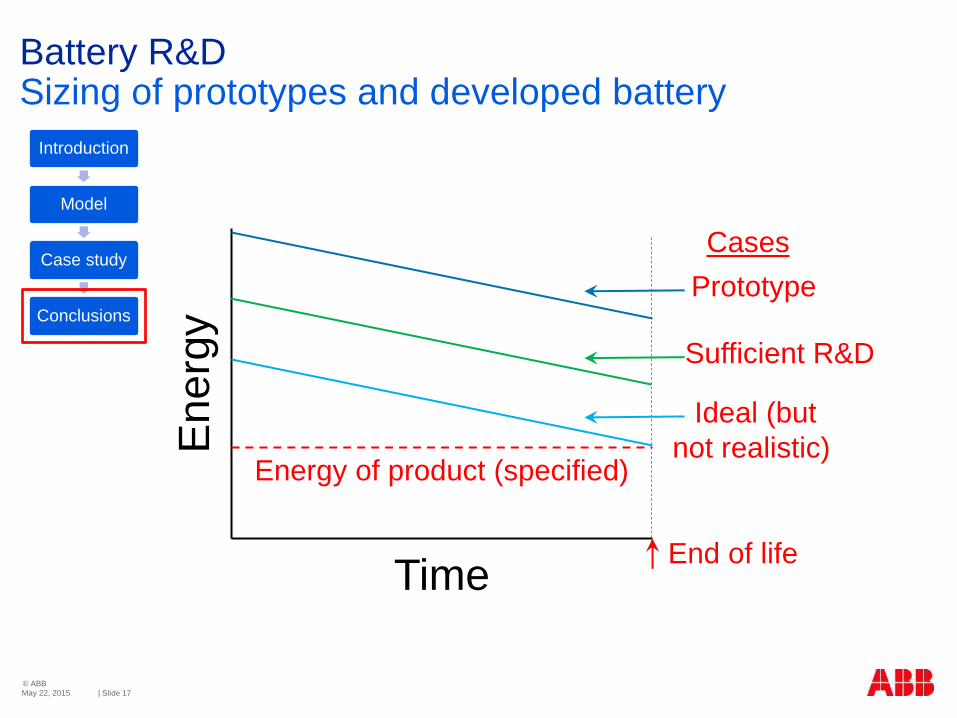
Battery R&D Sizing of prototypes and developed battery
May 22, 2015 | Slide 17
© ABB
En
erg
y
Time
Energy of product (specified)
End of life
Prototype
Sufficient R&D
Ideal (but
not realistic)
Cases
Introduction
Model
Case study
Conclusions
Conclusions
May 22, 2015 | Slide 18
© ABB
Design the battery for the public transportation line and the bus.
Models support battery design, but it must be combined with
experience and field data.
Batteries will increasingly be used in ABB products and systems
Lifetime knowledge critical for reliability
Continued collaboration with Academia
Introduction
Model
Case study
Conclusions

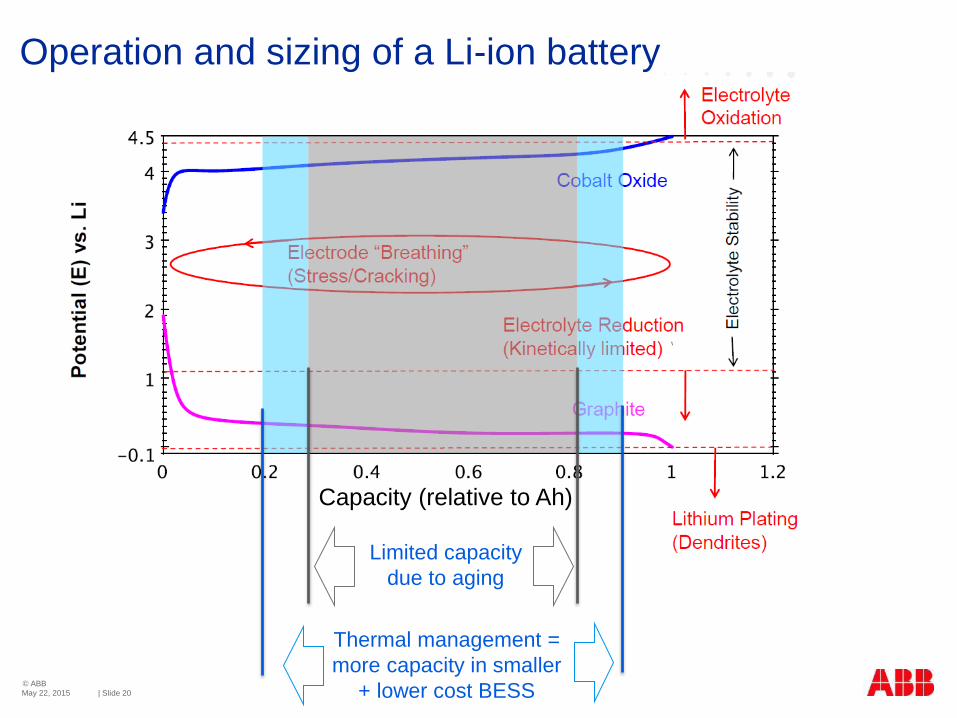
Operation and sizing of a Li-ion battery
May 22, 2015 | Slide 20
© ABB
Capacity (relative to Ah)
Thermal management =
more capacity in smaller
+ lower cost BESS
Limited capacity
due to aging
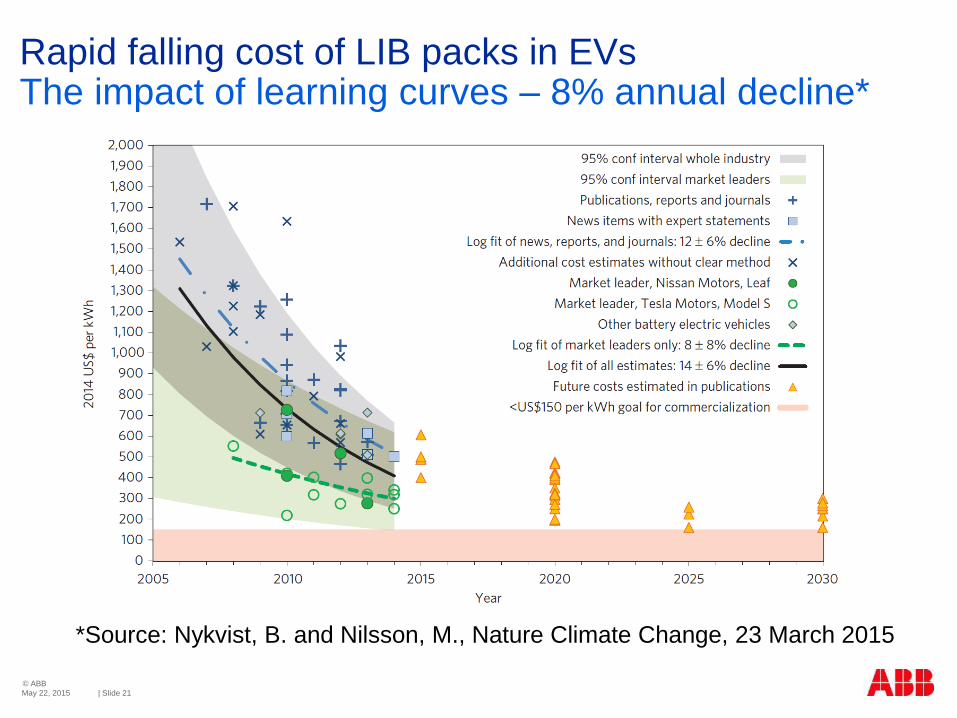
Rapid falling cost of LIB packs in EVs The impact of learning curves – 8% annual decline*
May 22, 2015 | Slide 21
© ABB
*Source: Nykvist, B. and Nilsson, M., Nature Climate Change, 23 March 2015
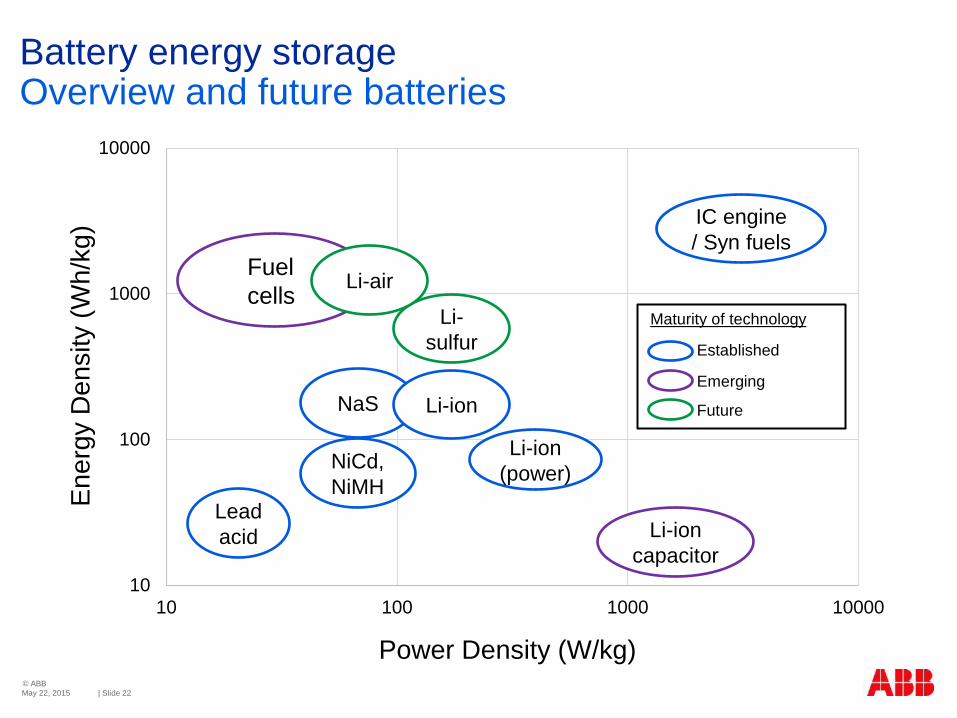
Battery energy storage Overview and future batteries
May 22, 2015 | Slide 22
© ABB
10
100
1000
10000
10 100 1000 10000
En
erg
y D
en
sity (
Wh
/kg
)
Power Density (W/kg)
Lead
acid
NiCd,
NiMH
IC engine
/ Syn fuels
Li-ion
capacitor
Li-
sulfur
Li-ion
(power)
Li-air Fuel
cells
Established
Emerging
Future
Maturity of technology
NaS Li-ion