Embed Size (px)
Citation preview

Reprinted from T heMathWorksNews&Notes | June 2007 | www.mathworks.com
critical early stages of a program, and only a limited number of engineers can conduct them. We therefore decided to explore the potential of 3-D visualization using MATLAB graphical functions.
Developing the MATLAB Based Tool We created our initial visualizations with command-line-driven scripts and functions. As the demand for this sort of visualization grew, we launched an inter-nal research and development program, using the MATLAB GUIDE tool to es-tablish the basic framework. The applica-tion consists of a GUI divided into a 3-D and 2-D section (Figure 1). When a pat-tern is selected from a pull-down menu,
Engineers use gain pattern analysis to determine how much coverage the anten-nas provide, and how that coverage is mod-ified by interaction with the physical struc-ture on which they are mounted. For example, if antennas are placed near thrust-er nozzles, solar arrays, or booms, these components can redirect radio frequency energy, creating dropouts in coverage.
Traditionally, antenna gain analysis has used two-dimensional (2-D) cuts through what is really a three-dimen-sional (3-D) pattern, an approach that has several disadvantages. Cuts through principal axes can miss important fea-tures, while cuts spaced closely enough to include these features are complicated to interpret.
Using MATLAB® graphics and GUI building tools, my colleagues and I devel-oped Three Dimensional Visualizer (3DV), an application that gives our group an envi-ronment for analyzing gain patterns in 3-D and 2-D simultaneously. The application has reduced turnaround time for analyses and dramatically enhanced our ability to explain results to customers.
While our applications are all space-re-lated, antenna pattern analysis is common throughout aeronautical, marine, and oth-er terrestrial applications. Indeed, 3DV is useful for exploring any information that
can be represented as a scalar value varying with direction, including thermal, optical, and radar signatures.
Antenna Analysis at Lockheed Martin Space Systems CompanyWe use pattern data analysis throughout a program’s life cycle. During the initial stages we compare patterns theoretically generated from candidate antenna de-signs to requirements and to each other. During prototyping, we compare empiri-cal pattern data from range tests to ex-pected patterns. During spacecraft de-sign we model the antennas’ interaction with the spacecraft structure to compare mounting locations or evaluate the ef-fects of other design changes on the resulting pattern. In fi-nal testing we verify the em-pirical patterns from a full spacecraft range test against re-quirements. Critical to all these analyses is rapid turnaround and the ability to communicate results to a multidisciplinary spacecraft design team.
Despite the sophistication of our tools and modeling capa-bilities, many of these analyses take too long to be used in the
T heMathWorksNews&Notes
By MICHAEL HICkS, LOCkHEEd MARTIn SPACE SySTEMS COMPAny
Lockheed Martin
Because most spacecraft, once deployed, can never be serviced, it is vital to ensure that their communications systems meet requirements for link availability and quality. Antenna design and analysis are critical to this process.
Figure 1. The 3DV interface.
develops a Tool for 3-d Antenna data Visualization

Reprinted from T heMathWorksNews&Notes | June 2007 | www.mathworks.com
it appears as a patch graphic object in the 3-D section of the GUI. A plane or cone represents the point where the 2-D cut is taken. The cut is interpolated through the regularly spaced 3-D data and displayed on the 2-D side.
The 3-D and 2-D environments are interconnected and interactive. The user can grab the 3-D pattern and spin it in any direction using mouse motion and button callbacks associated with the graphic objects. Grabbing and spinning the 3-D cut instantly updates the 2-D display, while rotating the 2-D display rotates the cut. Legends, labeled vectors, highlights at specific gains, and other in-dicators can be displayed or hidden.
The tool provides a variety of display styles to aid the interpretation and expla-nation of pattern features (Figure 2). For example, the user can represent gain by dis-tance from point of origin, enabling rapid visual understanding of peaks, dropouts, and areas of interference. To determine the true angular extent of the features, the tool projects gain onto a uniform sphere as colors. A sphere showing gain above and below a certain threshold in two distinct colors instantly shows directions where a communications link can be made. Finally, a mercator projection enables the entire pattern to be displayed at once.
Commercial packages provide some of this capability, but we were unable to find
one that we could expand to meet our evolving needs. We can tailor our MAT-LAB application on demand. For example, groups across the company use a variety of data formats, many unique to a specific analyst or output from a specific test range or software package. We have added the ability to read many of these niche formats, as well as features requested by program teams, including percent sky coverage over specific solid angles, the ability to sum or merge patterns, and new output features, such as user-editable graphic objects.
Feature ImplementationDeveloping these features was greatly simplified by the high-level mathemati-cal functions, graphic object properties,
and GUI control features in MATLAB. For example, the 3-D rotation of the pat-tern is implemented using the Button-DownFcn properties, which can be set for the patch object representing the pattern and the GUI figure. Clicking the pattern patch object or other graphic objects runs functions that set flags in the GUI handles structure. These flags are refer-enced by logic in the GUI figure Window-ButtonMotionFcn, triggered when the mouse is clicked and dragged over the GUI, to determine what action to take.
A Sample Analysis One recent analysis involved optimizing the location of the telemetry antenna on the aft deck of a satellite. Combined with
Figure 2. Four visualizations of the same pattern. From left to right: Antenna gain determines magnitude of shape, gain mapped in color to a sphere, sphere showing binary link/no link directions, and 2-D projection.
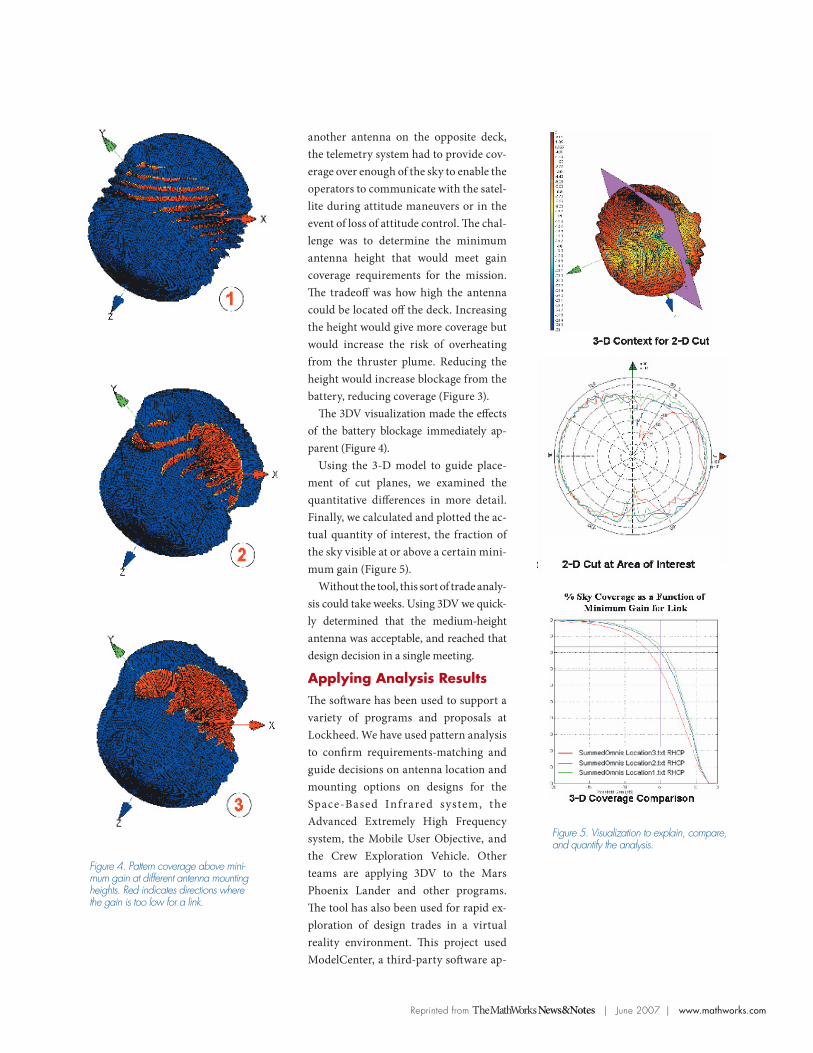
Figure 3. Antenna analysis problem. The numbers 1,2, and 3 represent the test heights of the antenna.
Reprinted from T heMathWorksNews&Notes | June 2007 | www.mathworks.com
another antenna on the opposite deck, the telemetry system had to provide cov-erage over enough of the sky to enable the operators to communicate with the satel-lite during attitude maneuvers or in the event of loss of attitude control. The chal-lenge was to determine the minimum antenna height that would meet gain coverage requirements for the mission. The tradeoff was how high the antenna could be located off the deck. Increasing the height would give more coverage but would increase the risk of overheating from the thruster plume. Reducing the height would increase blockage from the battery, reducing coverage (Figure 3).
The 3DV visualization made the effects of the battery blockage immediately ap-parent (Figure 4).
Using the 3-D model to guide place-ment of cut planes, we examined the quantitative differences in more detail. Finally, we calculated and plotted the ac-tual quantity of interest, the fraction of the sky visible at or above a certain mini-mum gain (Figure 5).
Without the tool, this sort of trade analy-sis could take weeks. Using 3DV we quick-ly determined that the medium-height antenna was acceptable, and reached that design decision in a single meeting.
Applying Analysis ResultsThe software has been used to support a variety of programs and proposals at Lockheed. We have used pattern analysis to confirm requirements-matching and guide decisions on antenna location and mounting options on designs for the Space-Based Infrared system, the Advanced Extremely High Frequency system, the Mobile User Objective, and the Crew Exploration Vehicle. Other teams are applying 3DV to the Mars Phoenix Lander and other programs. The tool has also been used for rapid ex-ploration of design trades in a virtual reality environment. This project used ModelCenter, a third-party software ap-
Figure 5. Visualization to explain, compare, and quantify the analysis.
Figure 4. Pattern coverage above mini-mum gain at different antenna mounting heights. Red indicates directions where the gain is too low for a link.

Resources
visit www.mathworks.com
tECHNiCAL sUPPORt www.mathworks.com/support
ONLiNE UsER COMMUNitY www.mathworks.com/matlabcentral
DEMOs www.mathworks.com/products/demos
tRAiNiNG sERviCEs www.mathworks.com/training
tHiRD-PARtY PRODUCts www.mathworks.com/connections
�WORLDWiDE CONtACts www.mathworks.com/contact
�E-MAiL [email protected]
plication to control data flow in complex analyses integrating MATLAB, spread-sheets, and legacy Fortran code.The tool continues to evolve with our changing needs; improvements planned
for the future include additional ways to combine and compare patterns, more animation formats, and aids for cycling through large data sets. 7
Resources
visit www.mathworks.com
tECHNiCAL sUPPORt www.mathworks.com/support
ONLiNE UsER COMMUNitY www.mathworks.com/matlabcentral
DEMOs www.mathworks.com/products/demos
tRAiNiNG sERviCEs www.mathworks.com/training
tHiRD-PARtY PRODUCts www.mathworks.com/connections
�WORLDWiDE CONtACts www.mathworks.com/contact
�E-MAiL [email protected]
©1994-2007 by The MathWorks, Inc.MATLAB, Simulink, Stateflow, Handle Graphics, Real-Time Workshop, SimBiology, SimHydraulics, and xPC TargetBox are registered trademarks and SimEvents is a trademark of The MathWorks, Inc. Other product or brand names are trademarks or registered trademarks of their respective holders.
Reprinted from T heMathWorksNews&Notes | June 2007 | www.mathworks.com
For More Information
■ Lockheed Martin Space Systems www.lockheedmartin.com
■ Aerospace and Defense Industry www.mathworks.com/res/aerodef
©1994-2007 by The MathWorks, Inc.MATLAB, Simulink, Stateflow, Handle Graphics, Real-Time Workshop, SimBiology, SimHydraulics, and xPC TargetBox are registered trademarks and SimEvents is a trademark of The MathWorks, Inc. Other product or brand names are trademarks or registered trademarks of their respective holders.
91482V00 05/07