Embed Size (px)
Citation preview

T HD-A132 162
UNCLASSIFIED
PREDICTING BUSINESS FAILURE: IDENTIFYING HIGH-RISK 1/1 CONTRACTORS<U> NAVAL POSTGRADUATE SCHOOL MONTEREV CA W n MATTHEWS JUN 83
F/G 5/3 NL
-
V

•.•..•'.• .••.••• ".»•• mi.i!ni.i"i^^u i.i ij •. — 1 :
10 f"- K SSS«|ää
1.8
L25 IIIIL4 i 1.6
MICROCOPY RESOLUTION TEST CHART
NATIONAL BUREAU OF S1ANDAR0S-1963-A
^
• • _t •
L •„•."•
7
' ..'-"ff . -.-;
: ••.
:
LV-V-V-
I -I
\ .'•
• .........
.--.' -•*•'•-•**. ~*J •!• ••,?,.. —••••',•*.•.*.. ,t„.i .« . m> '^«,.r.. .«fci.;.!,»,^.,*O,* .'.Mi^ilni,,,',.» * » T 1 * *-- »-"• m-M~JI^^KtA
* I • '• I • • . • . • I »l • J • • l • I • . • > i .-7- -»- -, - . • T- ••-.-.-•-.-• j-
ADA 13 21 63
CD
Ä
NAVAL POSTGRADUATE SCHOOL Monterey, California
DTIC ELECTE
SEP 7 1983
B
THESIS PREDICTING BUSINESS FAILURE
IDENTIFYING HIGH-RISK CONTRACTORS
by
William McKinley Matthews
June 1983
Thesis Advisor: K. Euske
Approved for public release; distribution unlimited,
6 3 09 06 037
__—_—i—• - - - - - - • • • • i

-r —i—p>
SECURITY CLARIFICATION OF THIS PAGE fWian Data Enfrtd)
REPORT DOCUMENTATION PAGE i MIPORT luute*
READ INSTRUCTIONS BEFORE COMPLETING FORM
2. OOVT ACCESSION NO J. RECIPIENT'S CAT ALOG NUMBER
£• /£=Q 4. TITLE (ml SuMll»)
Predicting Business Failure: Identifying High-Risk Contractors
S. TYPE OF REPORT a PERIOD COVEREO
Master's Thesis June 1983
S. PERFORMING ORG. REPORT NUMBER
7. AuTMORC.J
William McKinley Matthews
». CONTRACT OR GRANT NUMBERf»
t. PERFORMING OROANIIATION NAME ANO AOORESS
Naval Postgraduate School Monterey, California 93940
10. PROGRAM ELEMENT PROJECT. TASK AREA a WORK UNIT NUMBERS
II. CONTROLLING OFFICI NAME ANO AOORCSS
Naval Postgraduate School Monterey, California 93940
I*. MONITORING AGENCY NAME * AOORCSS/" dlHtmtl Inm Controlling Otllcm)
IX. REPORT OATE
June 1983 U. NUMBER OF PAGES
45 IS. SECURITY CLASS. <ol (Ma rapeitj
ISa. OECL ASSIFICATION' DOWNGRADING SCHEDULE
I«. DISTRIBUTION STATEMENT (ol Ulla Kopott)
Approved for public release; distribution unlimited.
17. DISTRIBUTION STATEMENT (of (A* mtltaet mumnd In »lock 20. II dlllmrmtt Inm R»potl)
It. SUPPLEMENTARY NOTES
IB. KEY WOROB f/CantnuM an n»*araa mitt» II n»c»»omr an* Idtnlitr op block numbmr)
Bankruptcy
Cognitive Complexity
20. ABSTRACT (ESSSK* — ra»araa «MB II BJMMBf tnä Immtltr OF Mock mmtbmr)
The purpose of this thesis is to examine the usefulness of the qualitative information found in annual financial reports for making predictions about corporate failure. The content of the presidents' cover letters for a matched pair of firms, failed versus non-failed, spanning the five-year period prior to failure were analyzed and scored for inte- grative complexity. The major finding was that a firm may
DO,: Tn 1473 EDITION OF I MOV 11 IS OMOLETC
S/N 0102- LF- 014- 6601 1
SECURITY CLASSIFICATION OF THIS PAGE (Whon Dala Knlmroa'
- • ^_—. - - _ _ , • »__^_. • i

p—m "•' ^ ." i-
-.
t
SECURITY CLASSIFICATION Of THIS '»Of f*ll«i Data Enl.r.rfj
1
1
•
M
4
be identified as a probable candidate for failure as many as five years prior to the time of entering bankruptcy pro- ceedings. When employed in conjunction with current pre- scribed analytical techniques utilized by Department of Defense contracting and purchasing officials in determing a contractor's capacity to perform, this technique may prove useful in identifying high-risk contractors, thereby reducing the risk of financial loss to the government.
/
.•
• . • U ! •
JU! -
By ___ DistributIon/ AvailabilU Cc s
|Avail and/or Sp&cial
I I L
5 N 0102- LF- 014-440I
stcumrr CLASSIFICATION or THIS p*otfw*>»* o— Nmt
^ ^ _

"."«."-•.-•.•."»•-•-•I "T^^^^^"T •^i^•^"^"^
Approved for public release; distribution unlimited,
Predicting Business Failure:
Identifying High-Risk Contractors
by
William McKinley Matthews Lieutenant, United States Navy
B.S., Middle Tennessee State University, 1974
Submitted in partial fulfillment of the requirements for the degree of
MASTER OF SCIENCE IN MANAGEMENT
from the
NAVAL POSTGRADUATE SCHOOL June 1983
Author
Approved by
Second" Reader
, Department or Administrative Sciences
\L-<JLT.HwLii Dean or [nformation->and\Policy Sciences
• - - - i «.,•. •..-.. .^ _. . •. . .......... •- - • • .. .

• . —- • »•'• •••'•' •!• . • .
ABSTRACT
The purpose of this thesis is to examine the usefulness
of the qualitative information found in annual financial
reports for making predictions about corporate failure. The
content of the presidents' cover letters for a matched pair
of firms, failed versus non-failed, spanning the five-year
period prior to failure were analyzed and scored for inte-
grative complexity. The major finding was that a firm may
be identified as a probable candidate for failure as many
as five years prior to the time of entering bankruptcy pro-
ceedings. When employed in conjunction with current prescribed
analytical techniques utilized by Department of Defense
contracting and purchasing officials in determining a
contractor's capacity to perform, this technique may prove
useful in identifying high-risk contractors, thereby reducing
the risk of financial loss to the government.
>.«. -.».-,,*.»,.*..« m.,*..m, *—••—.-•*• — fc— A— * •..«.«, . - ~ fl _'« . ft - . ifc. »!••>,,.• • . • k - * - . .. - -

-T 1 :— .- 1 I 1 • 1 I . • - • •• ^^^^^^^^^•^•••••^p^
TABLE OF CONTENTS
I. INTRODUCTION 7
A. DEPARTMENT OF DEFENSE POLICY 7
B. THE REQUIREMENT FOR FINANCIAL CAPABILITY- - - 8
C. IDENTIFYING HIGH-RISK CONTRACTORS 9
II. PREVIOUS BANKRUPTCY RESEARCH 10
A. BEAVER'S RATIO STUDY 10
B. ALTMAN'S "Z" FUNCTION - 12
C. LIBBY'S BEHAVIORAL APPLICATION- 13
D. OHLSON'S PROBABILISTIC MODEL - - 15
E. SUMMARY -------- 17
III. PREVIOUS BEHAVIORAL RESEARCH- - - 18
A. CONCEPTUAL COMPLEXITY THEORY- -------- 18
B. INTEGRATIVE COMPLEXITY- 21
C. CONCEPTUAL COMPLEXITY THEORY AND BANKRUPTCY PREDICTION - - - - 22
IV. DESIGN 25
A. SELECTION OF FAILED FIRMS - - - - 25
B. SELECTION OF NON-FAILED FIRMS 26
C. SCORING FOR INTEGRATIVE COMPLEXITY 28
1. Low Integrative Complexity (scale value 1) 28
2. Moderately Low Integrative Complexity (scale value 3) -- 29
3. Moderately High Integrative Complexity (scale value 5) 29
5
•"•—"••—*-^"—-* - • - • ^ . . - - - - - - .......

"^^—^ I _ I !••--. ,,--^ .
4. High Integrative Complexity (scale value 7)---- 29
32 V. ANALYSIS, RESULTS, AND CONCLUSIONS
A. DATA PREPARATION 32
B. ANALYSIS PROCEDURE 35
C. RESULTS 34
D. DISCUSSION AND CONCLUSIONS 37
APPENDIX A: FAILED AND NON-FAILED FIRMS 41
BIBLIOGRAPHY- - - - - 42
INITIAL DISTRIBUTION LIST 45
1
kl^-L^. - • - - . _ .

WHI, 'I I • • • . Hit P"^—^^^^M^i^i W-^»^-^^"*^^»^«
:•
I. INTRODUCTION
Several factors have combined to make the tasks of
contracting and acquisition within the Department of Defense
(DOD) complicated and of high financial risk. As noted in
a recent General Accounting Office (GAO) report (1982) and
in the weekly Federal Contract Report (1983) , DOD is
dividing its growing defense budget among an increasing
number of civilian manufacturers and contractors. At the
same time, mounting political and public pressures are
causing DOD managers to be aware of the need to increase
effectiveness and efficiency and also to reduce fraud, waste,
and abuse (GAO, 1982). Add a sagging U.S. economy that
has recently given rise to a near record number of business
failures (Wall Street Journal, 1983) and it becomes obvious
that deciding with whom DOD should do business is not a
trivial issue. In an effort to reduce the risk of financial
loss, DOD has set forth policy guidelines and specific rules
tor its representatives to follow during the contracting
process .
A. DEPARTMENT OF DEFENSE POLICY
A fundamental policy of the Department of Defense is to
do business only with responsible contractors. In accordance
with the guidelines established in DOD's Defense Acquisition
— . . . :. : . ,

- — - -. ••!.-.-• .»-*•-.—i T - ........ •. • - a • • . ,„ .'••'••I.l', » • • f r • i
Acquisition Regulation (DAR), the purchasing office that
selects the source and makes the award is charged with adhering
to this policy. To aid in this crucial judgment, DOD has
established a number of standards that must be met before
a prospective contractor can be considered responsible.
A complete description of the minimum standards for respon-
sibility can be found in the Defense Acquisition Regulation
(DAR). One of these standards deals specifically with the
issue of determining a contractor's financial capability.
This thesis investigates one method that may be helpful in
that determination.
B. THE REQUIREMENT FOR FINANCIAL CAPABILITY
Defense Acquisition Regulation 1-903 states that, in
order to be eligible for award, a prospective contractor
must have adequate financial resources or the ability to
obtain them during performance of the contract. Financial
difficulties encountered by contractors may disrupt production
schedules; cause waste of manpower and resources; and, if
connected with guaranteed loans, advance payments or progress
payments, result in a monetary loss go the government. It
is, therefore, essential that a thorough review and analysis
of a prospective contractor's financial condition be con-
ducted prior to the awarding of the contract. When properly
performed, this analysis will help the contracting official
identify financially weak or high-risk contractors.
8
• • •*•'-•
• - - - • - - ' - • * . . M «_ -•-•---»-

F"" "•".•• ••• -• •• •—-. • ••—•—' ^—i—i i i _
••
7* C. IDENTIFYING HIGH-RISK CONTRACTORS
While it is important that DOD make purchases and write
contracts at the lowest possible price, it is not required
to award a contract to a marginal supplier solely because
the supplier submitted the lowest bid. The award of a con-
tract on price alone would provide false economy if there
were subsequent default by the contractor. For this reason,
and depending upon the dollar value of the potential award,
the cognizant contract administration office is required to
perform an analysis of the contractor's management, financial
stability, and facility resources to determine whether or not
a contractor can be considered reliable. One measure of
stability is the likelihood of bankruptcy. Previous studies
by Beaver (1966), Altman (1968), Libby (1975), and Ohlson
(1980) have examined the usefulness of accounting data in
making predictions about corporate failure. In general,
these studies have been analyses of the quantitative finan-
cial accounting information found in corporations' annual
reports. The purpose of this thesis is to investigate
another analytical technique that may be used for identifying
high-risk contractors by using other information found in
corporate annual reports. Specifically, it examines one form
of content analysis, the paragraph completion test, to deter-
mine its usefulness in evaluating the information contained
in the president's letter in the annual report as a basis for
predicting the firm's potential for failure.
-.-. ...»,... • >.•.-.•,,,,,.. ,.- ... .,. ._^ _

—"—•—•—•—•—•"•"• . • . .
II . PREVIOUS BANKRUPTCY RESEARCH
During the past fifteen years, researchers such as
Altman (1963), Beaver (1966, 1968), Blum (1972), Ohlson
(1980), and Wilcox (1971) have been utilizing univariate and
multivariate statistical techniques to assess the predictive
ability of a large group of ratios. Some of the studies
(Beaver, 1968; Blum, 1972; Wilcox, 1971) have found that,
on an ex post basis, failed firms can be correctly classitied
about 90 percent of the time the year before bankruptcy.
Independent variables usually include performance measures
(e.g., net income to total assets), liquidity ratios (e.g.,
working capital to sales), leverage assessments (e.g., total
liabilities to total assets), and funds flow analysis (e.g.,
cash flow to total liabilities). Other studies by Bruns
(1966), Casey (1980), Libby (1975), and Zimmer (1980) have
considered the behavioral impact of accounting measures and
predictors on decision makers. In the following sections,
four diverse methods that have been used in studying corporate
failure are reviewed.
A. BEAVER'S RATIO STUDY
Beaver (1966) published the results of a study designed
to provide an empirical verification of the usefulness or
predictive ability of accounting data, specifically, financial
statements. He developed a list of seventy-nine firms that
10
• i. .i. i - - • • • - - - .

p. .". •-.,--.• —•- . - : »—••- ••«—*—•—»—•—•—•—•——w—i—— - i." v1 i" .- .» •• .• . .••• .—. i. . . . - .—,.t...,.v.,.<.1.t...
«
n
failed during the period 1954-1964 and paired them with an
| equal number of non-failed firms from the same industries
and of approximately the same asset size. Financial statement
data for each pair were obtained from Moody's Industrial
I Manual for five years prior to failure. From these data,
thirty financial ratios were calculated and grouped into six
major categories. After all thirty were analyzed, one ratio
per category was selected as a focus for discussion. The
ratios used were cash flow/total debt, net income/total assets,
total debt/total assets, working capital/total assets, the
current ratio, and the no-credit interval.
Beaver analyzed the data from three perspectives. First,
he compared the mean values of the ratios for each pair of
firms and developed a profile of the relationship of the
ratios for both the failed and non-failed firms. Next, he
performed a dichotomous classification test, using upper and
lower critical values, that enabled him to determine the
reliability of a given ratio to correctly indicate failure
or non-failure. For his final test, Beaver used Bayes'
Theorem to develop likelihood ratios for each financial ratio
in the study. This measure indicated what change, if any,
might occur in a user's prior probabilities (feelings) about
the future of a firm once knowledge of the value of a given
ratio had been made available to him.
Beaver found that, as bankruptcy approached, the ratio
distribution of failed firms exhibited a marked deterioration,
11
»••-..».,»-»»-,-.—. . -. .,«,,»-. , - -
— , pi T-V »i. » i^ •• inn J • • • -!••»• ^^7-1-TTT^^^^
iV
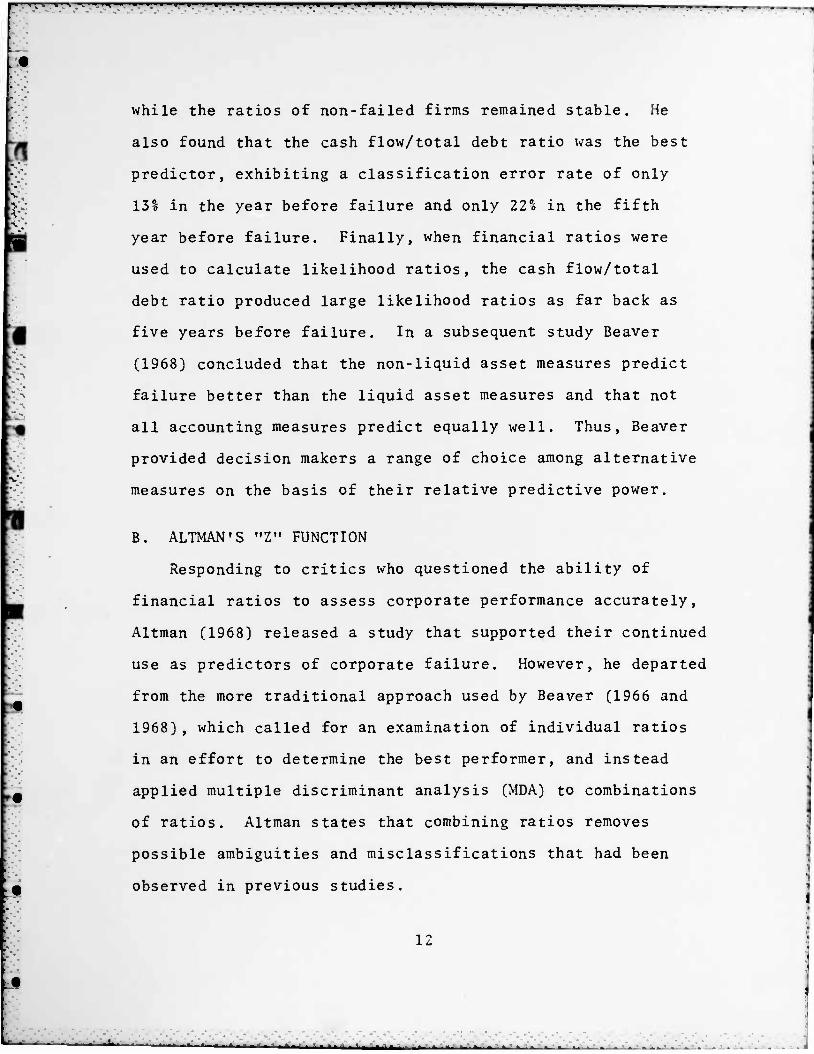
while the ratios of non-failed firms remained stable. He
also found that the cash flow/total debt ratio was the best
predictor, exhibiting a classification error rate of only
131 in the year before failure and only 22°o in the fifth
year before failure. Finally, when financial ratios were
used to calculate likelihood ratios, the cash flow/total
debt ratio produced large likelihood ratios as far back as
five years before failure. In a subsequent study Beaver
(1968) concluded that the non-liquid asset measures predict
failure better than the liquid asset measures and that not
all accounting measures predict equally well. Thus, Beaver
provided decision makers a range of choice among alternative
measures on the basis of their relative predictive power.
B. ALTMAN'S "Z" FUNCTION
Responding to critics who questioned the ability of
financial ratios to assess corporate performance accurately,
Altman (1968) released a study that supported their continued
use as predictors of corporate failure. However, he departed
from the more traditional approach used by Beaver (1966 and
1968), which called for an examination of individual ratios
in an effort to determine the best performer, and instead
applied multiple discriminant analysis (MDA) to combinations
of ratios. Altman states that combining ratios removes
possible ambiguities and misclassifications that had been
observed in previous studies.
12
* •*•*•'—•—•—•—•- ,i.•...•••.._-.•. . , , , , , ^_ m ._ ^_... •
•• . 1—»•—•—• •—i .'•» l"J^/ • PI I 1 . 'I 'I • I |il l^^*^^^»^^""^"»^^*^»^»
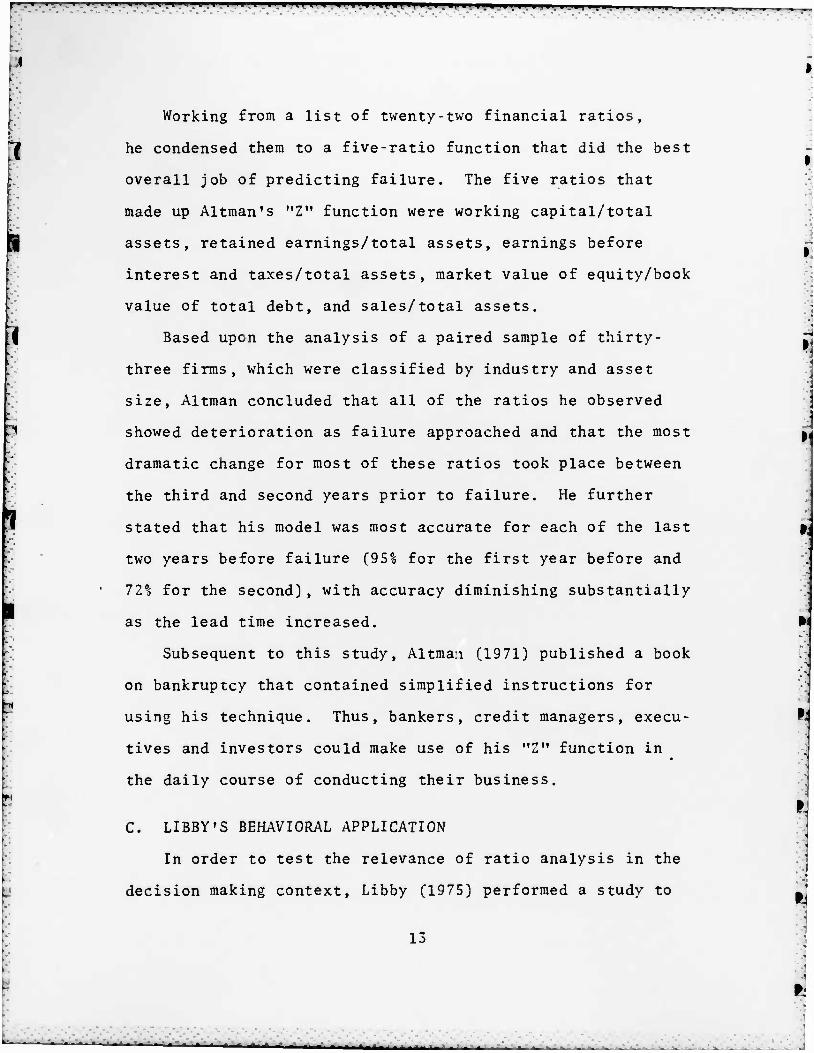
Working from a list of twenty-two financial ratios,
he condensed them to a five-ratio function that did the best
overall job of predicting failure. The five ratios that
made up Altman's "Z" function were working capital/total
assets, retained earnings/total assets, earnings before
interest and taxes/total assets, market value of equity/book
value of total debt, and sales/total assets.
Based upon the analysis of a paired sample of thirty-
three firms, which were classified by industry and asset
size, Altman concluded that all of the ratios he observed
showed deterioration as failure approached and that the most
dramatic change for most of these ratios took place between
the third and second years prior to failure. He further
stated that his model was most accurate for each of the last
two years before failure (95% for the first year before and
721 for the second) , with accuracy diminishing substantially
as the lead time increased.
Subsequent to this study, Altma:i (1971) published a book
on bankruptcy that contained simplified instructions for
using his technique. Thus, bankers, credit managers, execu-
tives and investors could make use of his "Z" function in
the daily course of conducting their business.
C. LIBBY'S BEHAVIORAL APPLICATION
In order to test the relevance of ratio analysis in the
decision making context, Libby (1975) performed a study to
13
«.«•• -1, ,.•.--•-•--...-. _ _ .. .. _ . . _ , __, , , , , , •__,

' . •_* -,t •_» • ' »• w • *• • • -m •_» ' » -•.-.- IT. '».I • • •." 'L'l ', I •• •'
• •
*•
evaluate jointly the predictive power of financial ratios
as well as the ability of a group of bank loan officers
to use them in predicting corporate failure. Twenty-seven
bankers from large and small banks located in different
communities were split into three groups. Each group was
given the same set of ratios, which had been calculated on
a paired sample of thirty failed and non-failed firms. The
ratios were net income/total assets, current assets/sales,
current assets/current liabilities, current assets/total
assets, and cash/total assets. The bankers were informed
that approximately one half of the firms they were analyzing
had failed and were then required to classify each firm as
either failed or non-failed within three years of the
statement date. They were also asked to rate themselves on
the confidence they had in their decision.
The purpose of Libby's study was to measure the consis-
tency of interpretation of the ratios (1) within loan officers,
by calculating their test-retest scores, and (2) between
loan officers, by assessing the interrater reliability of
their decisions. In addition, a composite score (consensus
judge) was calculated by firm across subjects and was compared
to the individual decision maker's average result.
In spite of widely diverse backgrounds and experience
levels, the bankers were able to make highly accurate and
reliable predictions of business failure. Libby concluded
14
-*—*—•--—— — •-- ..... .. , . M ti, ,~v i

'[•miinji.n • ,n *"m T '• ". •.!•!• • »' • • i • i •! • .» i • i» • i i i T i i , , • —. „
that the traditional confidence placed in ratio analysis
for predictive purposes seemed justified.
In a study otherwise similar to Libby's, Casey (1980)
did not inform his subjects of the firms' frequency of failure
rate. As a result of this difference, Casey reported per-
formance results for predicting failure that were inconsistent
with Libby's reported findings.
D. OHLSON'S PROBABILISTIC MODEL
The study performed by Ohlson (1980) differs in several
ways from the majority of published work on predicting
corporate failure. Ohlson's data came from the period 1970
to 1976; almost all previous studies took data from the
decade of the sixties. This study also examined a considerably
larger number of firms (105 failed and 2,058 non-failed)
than have most other researchers, and they were not paired
by failed and non-failed firms. The source for his data
was also different. Rather than using the summary financial
data found in Moody's Industrial Manual, Ohlson obtained
copies of the firm's annual report (Form 10-K) to the
Securities and Exchange Commission (SEC). This source
enabled him to determine whether the firm had entered bank-
ruptcy before or after its financial statements had been
made available to the general public. If he found that a
firm had released its statements after having filed for
bankruptcy, that firm was excluded from the study on the
15

•I I • 1 • L • • • I 1 II • I • ii.i • • I I I I 1 • I. • . • , • i i | , , .—, «_ ~- 1 •
:i
N
basis that a realistic evaluation of a model's predictive
relationships requires that the predictors (financial account-
ing data) be available for use prior to the event of failure.
Ohlson noted that this important timing difference had been
ignored in most other bankruptcy studies. 'Vlso, he used con-
ditional logit analysis to examine the data, which was
different from previously used techniques.
Ohlson's fundamental research question was this: given
that a firm belongs to some prespecified population, what is
the probability that the firm fails within some prespecified
time period? He found that the size of the firm as well as
some measure(s) of its financial structure, performance, and
liquidity were all statistically significant in assessing the
probability of failure within one year. The independent
variables he specified were (1) size = log(total assets/GNP
price-level index), (2) total liabilities/total assets,
(3) working capital/total assets, (4) current liabilities/
current assets, (5) net income/total assets, (6) an indica-
tion of whether or not total liabilities exceeded total
assets, (7) funds provided by operations/total liabilities,
(8) an indication of whether or not net income had been
negative during the previous two years, and (9) the change
in net income for the most recent period.
Ohlson concluded that the predictive power of any model
depends upon when the information (financial report) is
16
" - * - * —-* "-•* ... <*.,. »-^.A-.-«..—*'^m_'— M..-. r -,-,-» ri « n - _m • T „ ^ ..... ..-.•. Li J _^-*. ^_. ... • _
"•" ~'-" •••••"• • '—' • • • '—-•"' ' '•' • ' • •••• • • ••• •••.... • ... ... ...._„..
i available. Further, he found that the predictive powers of
ratios appear to be robust across estimation procedures
when applied to a large sample of data.
E. SUMMARY
Of the studies reviewed, no two were alike. All of them
examined the use of financial ratios and other accounting
data as predictors of failure, but each was unique in that
different data sets were used; different analytical techniques
were employed; varying levels of predictability were attained;
and different conclusions were reached. The purpose of this
thesis is to take yet another approach to the investigation
of corporate failure, one that involves analyzing information
of a qualitative nature. The process of classifying quali-
tative material into appropriate categories for description
and further analysis is known as content analysis, which is
the topic of the next chapter.
17
.—i—.-w ... ... -

_——_•__- .—.- - .- „• I- •.. 11 ' I • • 'I I I , .. .—.—. i r-y-m w-.
III. PREVIOUS BEHAVIORAL RESEARCH
I
:*
Most of the research investigating corporate failure has
been performed by conducting analyses of the quantitative data
contained in financial statements. However, other public
information may exist that is useful for the analysis and
prediction of corporate failure. Weick (1983) has suggested
that research in psychology and political science may be
useful in the analysis of accounting questions. Specifically,
Weick suggested that research dealing with conceptual
complexity and individual behavior in stressful situations
may provide a useful basis for the analysis of accounting
questions.
A. CONCEPTUAL COMPLEXITY THEORY
Conceptual complexity theory states that individuals
differ along a scale ranging from simple to complex with
respect to how they process information, communicate and
make decisions. Suedfeld, Tetlock, and Ramirez (1977)
state that one 's level of conceptual complexity is a function
of three components. The first is discrimination, which
is the ability to identify the differences present in an
environment. Second is differentiation, which is the ability
to perceive various levels or dimensions in the environment.
The third component is integration, which is how the
13
• •
- i - --•-•-*-- _. _. __• _. _. _,

'- " » . I •. ' . • T~^—^-"^•^•^W^^^^^^^P"^-!». - I ' * • ' ' '. • "I. • T •'! • I • I • • . • • •
differentiated aspects of an environment are combined for use
in the decision-making process. In evaluating conceptual
complexity, differentiation and integration are considered
to be the crucial components, with differentiation being a
necessary prerequisite for integration.
Individuals with low levels of conceptual complexity
tend to think in strict categorical terms and, generally
speaking, recognize only a limited number of alternatives,
which they tend to arrange in a strictly compartmentalized
manner. Ambiguity and conflict are avoided where possible,
and selected alternatives are usually dealt with in absolute
terms. By contrast, individuals who demonstrate high levels
of conceptual complexity tend to recognize subtle differences
in the environment and are able to perceive a full range of
alternatives, which relate to one another in a complex,
interwoven framework. Conflict and ambiguity are put to
use in order to gain additional information about the
environment, which in turn may be used in formulating new
alternatives.
As noted by Schroder et al. (1967), the complexity of
information-processing varies as a function of environmental
variables such as stress, novelty or uncertainty. A number
of other studies (Holsti, 1972; Janis, 1972; Selye, 1956;
Suedfeld, 1964) have arrived at the same basic conclusion.
Further, as noted by Suedfeld and Tetlock (1977), there
19
•*••«•! 1 in • - • * ' - ' •

. .- • .... . . . . ., ^ i, . , « l-F^TTfTf»t^^^^>^^<liyT^PHTi i • i . , , , ,„ , . .„ ^,
appears to be general agreement among researchers that
prolonged stress decreases the complexity of information-
processing. Of the various measurement techniques available,
Suedfeld and Tetlock (1977) and Suedfeld, Tetlock, and
Ramirez (1977) found that the Paragraph Completion Test (PCT)
provided an accurate measure of this trait.
The PCT measures an individual's level of conceptual
complexity by scoring paragraphs that the individual has
completed. As originally designed, the paragraphs are
generated by giving an individual a set of incomplete sentences
and asking that individual to complete the paragraphs. The
topics usually pertain to some crucial aspect of the decision-
making process. Approximately two minutes are allowed for
the completion of each of the paragraphs. Upon completion
of the test, each paragraph is scored for conceptual com-
plexity. Scoring is based on a scale of one to seven, where
one equals low complexity, three equals moderately low
complexity, five equals moderately high complexity, and
seven equals high complexity. Scores of two, four or six
are allowable for paragraphs that are borderline cases. The
training of scorers is a critical variable, and, according to
Schroder, Driver, and Streufert (1967), an interrater relia-
bility of .80 or better is the accepted standard to ensure
reliable and accurate results.
20
* m m - - . -•-—--- m ^ . , - - - L « «. ,
» »• » i •• I • • • W .•• fm W fi •• p p p M u-qy^p—^.jppp—p^»p , p „ P'V**?^^11*^
B. INTEGRATIVE COMPLEXITY
Suedfeld, Tetlock, and Ramirez (1977) found that the
PCT was just as accurate at assessing the complexity of
archival materials as it was at assessing the complexity of
individual responses. In this context, however, differentia-
tion and integration were viewed as aspects of information
processing rather than as personality variables. As such,
the output of the PCT became a measure of the level of
integrative complexity inherent in a situation as opposed
to an individual's measured level of conceptual complexity.
In particular, they found that simplification of information-
processing regularly occurs where stress is building toward
conflict. These results were based upon a study of speeches
made to the United Nations General Assembly by delegates
from Israel, Egypt, Syria, the United States, and the Soviet
Union.
The study was designed to test if integrative complexity
in the speeches decreased in the months prior to periods
of conflict. Five to fifteen paragraphs from each speech
delivered during the period 1947 to 1976 were randomly
selected and scored by three trained scorers. Listings of
facts and other purely descriptive passages were omitted
from the sample, and overlap scoring was performed to ensure
interjudge reliability was .85 or better. Finally, the mean
integrative complexity scores were correlated and an analysis
of variance (ANOVA) performed.
21
- i • J • > ._ , • .'. . . . . . ._

-,—.- — •.—-—-1—1—-—•—•—•—•••"--."—• "• • . •— • 1 • 1 • I 1 "• . ". -
From this analysis, Suedfeld, Tetlock, and Ramirez found
that the complexity of information-processing was significantly
reduced in speeches made during the months preceding the out-
break of conflict. Specifically, as relations deteriorated
and stress increased, speeches became simpler, more repetitious
and less differentiated. As a result of the data obtained
from this study, they concluded that the Paragraph Completion
Test appeared to be useful in predicting future events on the
basis of integrative complexity scores.
C. CONCEPTUAL COMPLEXITY THEORY AND BANKRUPTCY PREDICTION
Conceptual complexity theory, in its broadest sense,
addresses the question of how information is processed. As
applied to historical information, conceptual complexity
theory provides an explanation of the integrative complexity
prior to "stressful" situations. The Paragraph Completion
Test (PCT) provides a measure of an individual's level of
conceptual complexity as well as an assessment of the level
of integrative complexity present in a given environment
(Suedfeld, Tetlock, and Ramirez, 1977). In either case, the
presence of stress generally results in low complexity scores.
A firm approaching bankruptcy is, in some respects,
like a nation approaching conflict. In that regard, a firm's
management may, as failure approaches, exhibit some of the
characteristics noted in the leaders of nations approaching
conflict. For example, long-term plans may be ignored in
22
• • - - - - - •- -•- ..-••

I I III 1—p.MMy . , ,l|m,ll,lii, .,, . ,. .. j , , ,. ....,„ ••.*•• • - » » •
favor of reacting to the immediate crisis; unpleasant inputs
may be suppressed or ignored; the ability to distinguish
between relevant and irrelevant information may be impaired;
the ability to make fine distinctions among items of informa-
tion may be abandoned in the face of crisis; and responses
and attitudes may become increasingly stereotyped (Suedfelt
and Tetlock, 1977). If this is so, it could be expected L."
.1 that the published information of a corporation might,
as its financial condition gets progressively weaker, reveal
less integrative complexity than when the corporation was
P financially healthy. A published document that relates
directly to corporate financial health is the president's
cover letter to the annual report to stockholders.
• Environmental factors unrelated to financial failure
might cause changes in the levels of integrative complexity
for both failing and stable firms. That being the case, it I
might prove meaningful to compare the levels of integrative
complexity between a failed and a non-failed firm from the
same industry, of approximately the same asset size, and
over the same time period. In so doing, it would be possible
to observe the relative changes in the levels of integrative
complexity unique to the failing firm.
Based upon the above discussion, it could be expected
that, given two similar firms, one approaching bankruptcy
and one not, the level of integrative complexity of the
23
>;
*• ' '*—•—•—* ••• •'* • *• ---•--'-• ii-i i - - «_. . - ~ ... ..

••• • ' 1 • • • • , • I • I • ' • 1" • • " » • • ' ' »• V • . r- W T • •- .•• • r- —T- ——
president's letter for the firm approaching bankruptcy will
be relatively lower than that of the financially healthy
firm. Stated as specific, testable hypotheses:
(a) As failure of the firm approaches, the integrative complexity score of the president's cover letter will decrease absolutely.
(b) As failure of the firm approaches, the integrative complexity score of the president's cover letter will be lower relative to that of the non-failing firm.
24
- .-. ... .......... _ .. .... _._..-..— ..._. ..._ «. * - tr " Y. n I,,, i. * ' »- " ~ - ' - '- - .... , , -

- - • •• • ' . *- -^ * -« \-v—v—. -^ '^ -. -^ '•! "'^^ WTT" v'* - m • ,, • -^ • . »-•» '
'1
IV. DESIGN
The de.-" ign used in this thesis is similar to that used
by Beaver (1966). Data were collected on a sample of twenty
failed and non-failed firms over the five-year period
preceding the year in which the failed firm filed for bank-
ruptcy. Matching criteria required that paired firms be
from the same industry and of approximately the same asset
size. Pairing was done to provide control for variables
other than the impending bankruptcy. The source for all of
the sample data was the Stanford University Business Library.
A. SELECTION OF FAILED FIRMS
It was originally intended that the list of failed firms
for this thesis would be taken from a previous paired bank-
ruptcy study. However, only one of the studies reviewed
that used a paired sample design (Wilcox, 1971) disclosed
the names of the firms studied. The Wilcox study included
firms that failed during the period 1948 to 1972. By com-
paring his list to the annual reports on file at Stanford,
it was determined that not enough of the reports for these
firms were available to enable an adequate sample to be drawn
The Altman (1982) study, while not a paired analysis,
did list the names of the firms being examined. Firms that
entered bankruptcy during the period 1970 to 1982 were
25
.». - t - « ^* -^ „. t _ .. - . A ^ • - '-•».-

p-^^-»^^-»"»«-
included in the study. Sufficient numbers of the annual
reports for these firms were available in the Stanford
library so that Altman's list could be used for developing
a sample. The process used to develop the sample of failed
firms was a three-step process. First, starting with the
most recently reported failures, a potential firm was looked
up in the card file and, once found, was accepted only if
the annual reports for the five-year period preceding failure
were listed as being on file. Second, Moody's Industrial
Manual was used to determine each firm's principal line of
business and to identify its approximate asset size for the
year before failure. Third, the Office of Management and
Budget's (OMB) Standard Industrial Classification Manual was
referred to, and each firm, based on its principal line of
business, was assigned a three-digit SIC code. This process
was repeated until a sample of twenty failed firms had been
developed, each having been classified by industry and asset
size.
B. SELECTION OF NON-FAILED FIRMS
Having selected the failed firms, the next step was to
develop a matching list of non-failed firms. Moody's
Industrial Manual, which provides an alphabetical listing as
well as a listing of firms by product line, was referred to
in order to identify a set of prospective non-failed firms
for each failed firm already identified. The set of
26
* - -.-. m...X.m \m • m \ - P, M-* --.••- - . „••..-., _..•__ ^ - . t _ . _ >_•.__._._. •"-*• . . ,

' •". .". ,". .". *. "—"—- - -- -—*—• • '—• • "• " • ".»•'«'• ... .^i- .. .. - ... . i . . .
non-failed firms was checked to determine if their annual
reports were on file 1,1 the Stanford library. For those
that were, the same procedures used for the failed firms
were followed in assigning each non-failed firm an SIC code
and in determining its approximate asset size. If the SIC
code for the non-failed firms did not match the failed firm's
SIC code, that non-failed firm was eliminated from the
prospective set. Of those non-failed firms remaining in
the set with the same SIC code as the failed firm, the one
closest in asset size to its failed counterpart was selected.
This process was repeated until a list of twenty pairs of
matching failed and non-failed firms was developed.
Copies of the presidents' cover letters for the entire
sample were made, arranged in pairs, and sequentially
numbered. One annual report each for two non-failed firms,
although listed as being on file in the Stanford library,
could not be located. These cover letters for these reports
were not included in the sample and were ultimately treated
as unscored data points. Finally, the cover letters were
then randomly arranged in preparation for eventual scoring.
This step was done in order to eliminate any bias in scoring
that might have occurred had the ordered pairs of firms been
scored.
27
^« - - • i^

^^^^^^^^^^^^^^^•••^^^^
C. SCORING FOR INTEGRATIVE COMPLEXITY
Copies of the presidents' cover letters for each pair
of firms for the five-year period preceding bankruptcy were
scored for integrative complexity. However, not every
paragraph in each letter was scored. Purely descriptive
passages or lists of facts were omitted from scoring. To
be considered scorable, a paragraph had to offer an analysis
or explanation of some event or of operations in general
and address both the what and why of the situation. Explana-
tions could relate to the past, the present, or the future.
Having met this criterion, the scorable paragraphs were
assigned scores ranging from one to seven, where one equals
low integrative complexity, three equals moderately low
integrative complexity, five equals moderately high integra-
tive complexity, and seven equals high integrative complexity,
Scores of two, four, or six were assigned in those instances
where some qualities of the next higher score were present
but not pronounced enough to put the score at that level.
Following is a brief description of the characteristics of
each of the four basic scores.
1. Low Integrative Complexity (scale value 1)
Passages of this type are characterized by anchored
or rigid thinking; statements of an absolute nature; indica-
tions of the presence of strict categorical thinking; a
tendency to externalize the causes of the current situation;
and a tendency to minimize conflict and resist ambiguity.
28
.- _ . . . .

I '.«•.• .^^^•—»•••»P»»»»»P.
2. Moderately Low Integrative Complexity (scale value 5)
V% Passages of this type are characterised by a
recognition of possible alternative conditions and a move-
ment away from absolutism. Still, the alternate states
that are recognized tend to be relatively few, and they are
generally viewed as being isolated from one another.
Rigidity of thought exists and is evidenced in the ways
that alternatives are narrowly selected, with all but the
chosen alternative being ruled out. Some recognition of
the firm's ability to control its destiny is evidenced by
the generation of various possible courses of action.
3. Moderately High Integrative Complexity (scale value 5)
Passages at this level are characterized by the
recognition of a number of alternatives that are part of a
complex, interconnected network. Control is more evident by
the recognition and generation of a wider number of choices.
Flexibility is generally demonstrated in dealing with these
choices. Thinking at this level is generally more abstract,
as evidenced by the ability to deal with multiple alterna-
tives simultaneously.
4. High Integrative Complexity (scale value 7)
Passages of this type are characterized by an
extreme level of abstract thinking that allows for the
simultaneous functioning of many alternate, interactive
processes. Change and ambiguity are recognized as catalysts
29
- - ............ -•«•»• •"»'""• h"*—...... . •—• *_4 • - . . - • - • • ...-.- • . . _•. .-..

•—• •* . . • . ,t. i .1 .. . . . • . »•'• i . » |i» )• . • i mm • '» • • . • . • > • • • • p - w >—r-
for new alternate solutions. Diversity is evidenced by the
ability to generate and handle many alternate and complex
environmental variables. Rather than being controlled by
externalities, rules and processes are generated from within.
After an initial training period of approximately
ten days, scoring began and was carried out over a several-
week period. All annual reports were scored by one rater (the
author) who was aware of the hypotheses being tested and of
the identity of the failed and non-failed firms. However,
given that the 200 cover letters were randomly arranged
and scored in small groups over a six-week period, it is
unlikely that objectivity was significantly impaired by
his prior knowledge of the sample. An additional rater
(the thesis advisor) scored approximately one-fourth of the
sample to provide a mean to determine interrater reliability.
Two dimensions of the rater's reliability were of
concern: (1) the selection of paragraphs for scoring and
(2) the scoring for integrative complexity. Since the cover
letters were not screened beforehand to determine which of
the paragraphs in each of the presidents' cover letters
would or would not be scored, the decision was made inde-
pendently by each rater. The resulting level of interrater
reliability for scored paragraphs was 0.87. In regard to
the second concern, where differences did exist as to which
paragraphs were selected for scoring, only the scores for
30
_ «. • -~- - • - •. - .

' . • •••III . I •.
the commonly scored paragraphs were considered in calcu-
/*" lating interrater reliability. A rule of thumb used for
determining an acceptable level of interrater reliability
for paragraph scores is 0.80 (Schroder, Driver and Streufert,
I 1967). The level of interrater reliability achieved for
integrative complexity scores for this thesis was 0.79.
Although below the recommended level, the difference is
I minimal.
31
'-•• -- '-•'-" -* '-•'- -•'- . - ...._-
r——-."• ••-•.".• •.•.-.".>.•' i . i . 111 i _ L >ivfvr^i^^w^^^ '*• » • . » • . » •^'••.•l-Wt-W
V. ANALYSIS, RESULTS, AND CONCLUSIONS
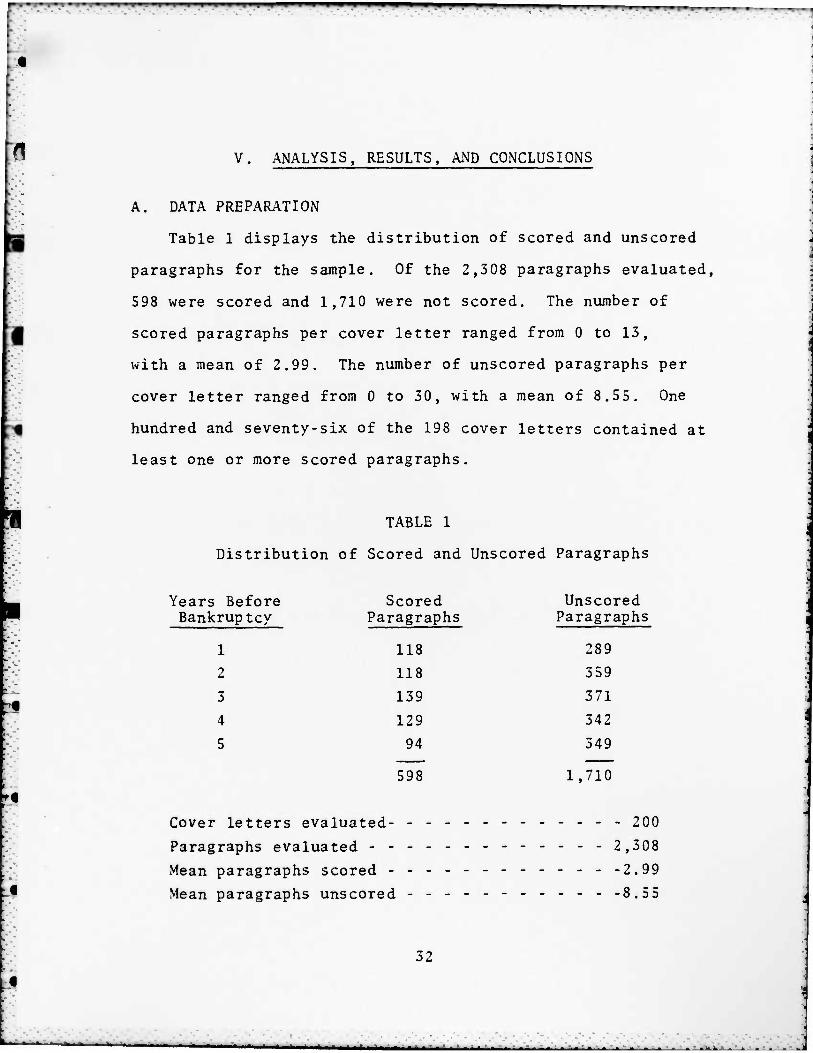
A. DATA PREPARATION
Table 1 displays the distribution of scored and unscored
paragraphs for the sample. Of the 2,308 paragraphs evaluated,
598 were scored and 1,710 were not scored. The number of
scored paragraphs per cover letter ranged from 0 to 13,
with a mean of 2.99. The number of unscored paragraphs per
cover letter ranged from 0 to 30, with a mean of 8.55. One
hundred and seventy-six of the 198 cover letters contained at
least one or more scored paragraphs.
TABLE 1
Distribution of Scored and Unscored Paragraphs
Years Before Scored Unscored Bankruptcy Paragraphs Paragraphs
1 118 289
2 118 359
3 139 371
4 129 342
5 94 349
598 1,710
Cover letters evaluated 200
Paragraphs evaluated 2,308
Mean paragraphs scored 2.99
Mean paragraphs unscored ----- 8.55
32
-**-^—*—*—»—•—•—*-—•—- --- - - - . . . . . . - ...».•. _. . . ,
w^^m^^i^^m
Twenty-two of the cover letters were purely descriptive
in nature, containing no scorable paragraphs. Two cover
letters were missing from the sample, one each from two
non-failed firms. As shown in Table 2, the unscored cover
letters were distributed throughout the sample. Eight firms,
three failed and five non-failed, had one unscored or
missing cover letter each. Six firms, three failed and
three non-failed, had two unscored letters each. And one
non-failed firm had four unscored cover letters. One pair
of firms had a total of six unscored cover letters, two
attributable to the failed firm and four attributable to the
non-failed firm. Given that the majority of the cover letters
were unscorable for the non-failed firm, this pair was
excluded from the sample during the subsequent analyses.
The remaining fourteen unscorable cover letters, along with
the two missing cover letters, were treated as missing data
points. Their scores were subsequently estimated by the mean
score for their particular year and group.
B. ANALYSIS PROCEDURE
Given that this experiment consisted of multiple observa-
tions (i.e., the president's letters) on a single experimental
unit (i.e., the firm), a repeated measures design was used.
The design consists of two factors: type of firm and years.
The first factor, type of firm, has two levels: failed and
non-failed. The second factor has five levels or years.
33
* * - - - --- .•.-•*-•_ —, _. ... , _ ._ ._ . . ,__

• • • • •^^f^^^^^^^m^fm^f^mi^^m^m^m^m •!•-••» » • I
1 TABLE 2
Distribution of Unscored or Missing Cover Letters
Number of Unscored Failed Non-failed Cover Letters Firms
14
Firms
0 11
1 5 5
2 3 3
3 0 0
4 0 1
5 0 0
Note: The two missing cover letters came from separate non-failed firms.
The various analytical procedures used in this study were
accomplished through the use of an IBM 3033 computer and the
Statisticak Package for the Social Sciences (SPSS).
C. RESULTS
Hypothesis (a): As failure of the firm approaches, the integrative complexity score of the president's cover letter will decrease absolutely.
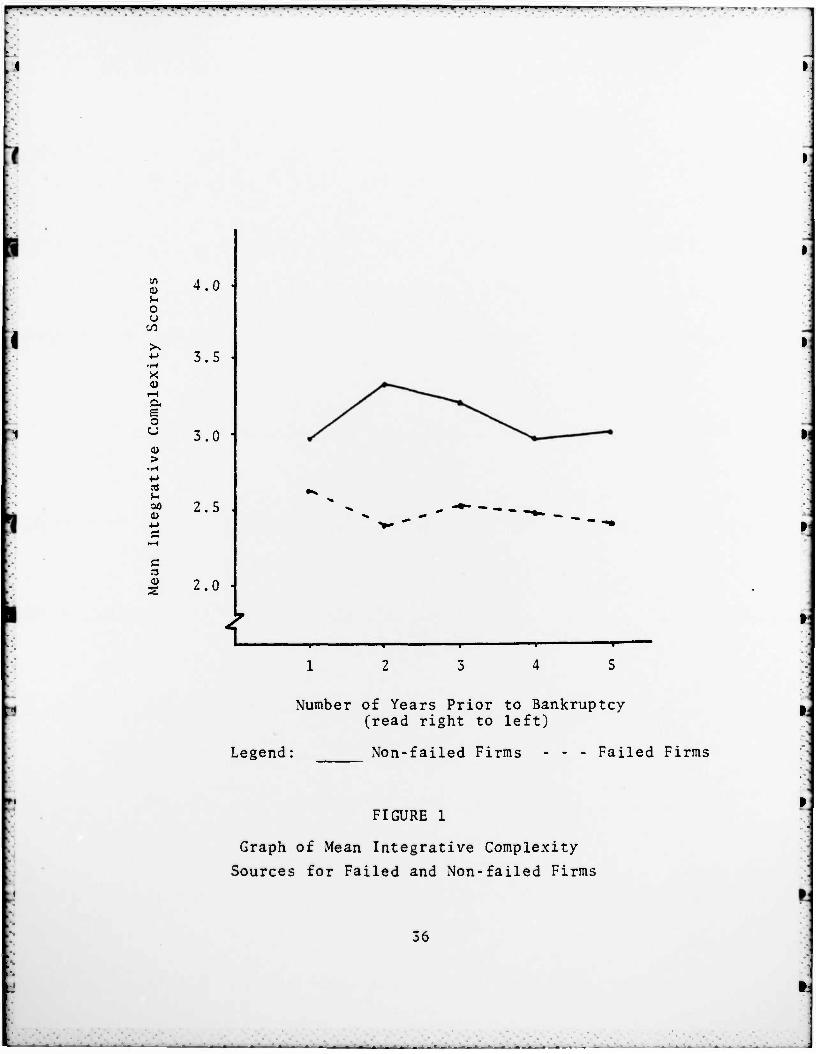
Table 3 displays the mean integrative complexity scores for
both failed and non-failed firms. Figure 1 is a graphical
representation of the scores. The decrease in the integrative
complexity scores for failed firms was not significant
(p < 0.769), as shown in Table 4. Given these test results,
hypothesis (a) was rejected.
34
-i.i- -,.., ._._.. . ' - a . i -• --- •-.-.---.-

, , .—_— -1 »-T —v-
TABLE 3
Mean Integrative Complexity Scores for Firms
Years Before Failed Non-failed Entire Bankruptcy Firms
2.6254
Firms Sample
1 2.9562 2.7908
2 2.3787 3.3636 2.8712
3 2.5244 3.2216 2.8730
4 2.4946 2.9191 2.7069
5 2.4298 3.0659 2.7479
TABLE 4
Statistics for Test of Hypothesis (a)
Source of Variation
Constant
Year
Wilks Lambda
0.89230
F Statistic
1332.07049
0.45262
Significance of F
0.0
0.769
Hypothesis (b): As failure of the firm approaches, the integrative complexity score of the president's cover letter will be lower relative to that of the non-failed firm.
Referring again to Figure 1, it can be observed that the
integrative complexity scores of the failed firms remained
35
——^_. . - • i ^_. . •
^^"^•^^^^^•^^ —w » •. » ,
<u ^- o u w
tu
o
>
s-
<U
c
4.0
3.5
3.0
2.5
2.0
i -r-
3 5
Number o£ Years Prior to Bankruptcy (read right to left)
Legend: Non-failed Firms - Failed Firms
FIGURE 1
Graph of Mean Integrative Complexity
Sources for Failed and Non-failed Firms
36
_,.-»_. - - • - _
!•••-•-• I • . • • • • 1.1 ^^^^^^^^^^^^^«^^
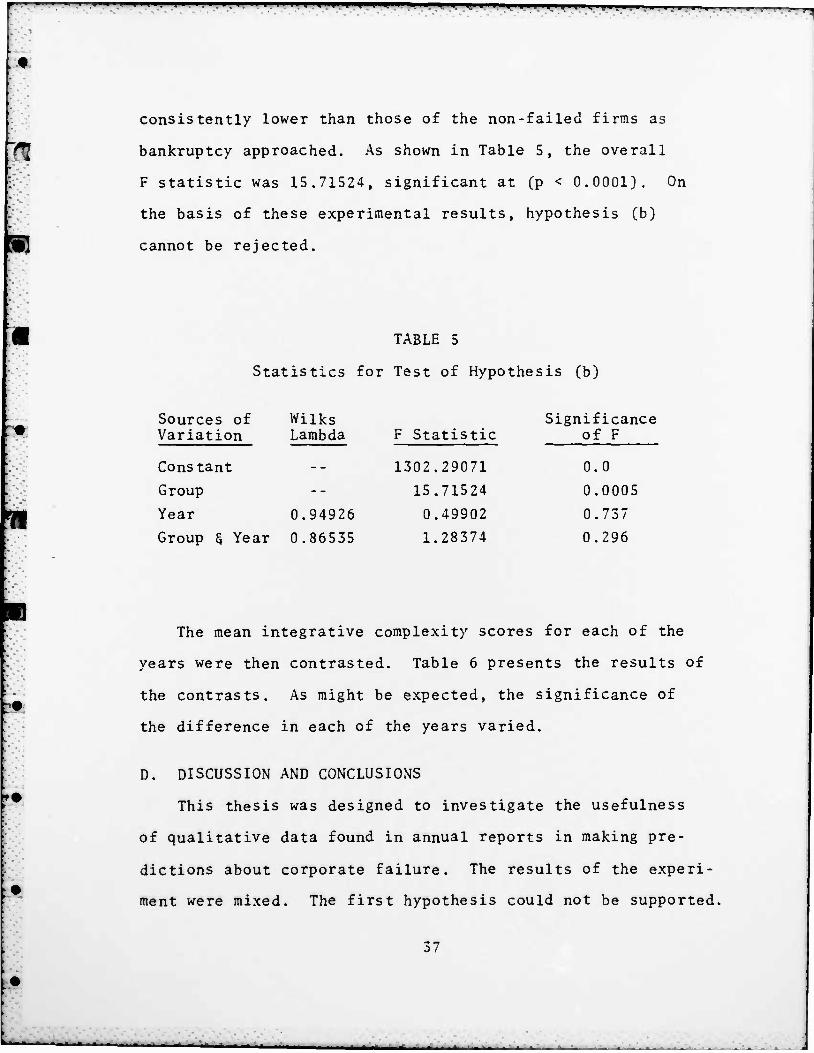
consistently lower than those of the non-failed firms as
bankruptcy approached. As shown in Table 5, the overall
F statistic was 15.71524, significant at (P < 0.0001). On
the basis of these experimental results, hypothesis (b)
cannot be rejected.
TABLE 5
Statistics for Test of Hypothesis (b)
Sources of Wilks Significance Variation Lambda F Statistic
1302.29071
of F
Constant 0.0
Group -- 15.71524 0.0005
Year 0.94926 0.49902 0.737
Group § Year 0.86535 1.28374 0.296
The mean integrative complexity scores for each of the
years were then contrasted. Table 6 presents the results of
the contrasts. As might be expected, the significance of
the difference in each of the years varied.
D. DISCUSSION AND CONCLUSIONS
This thesis was designed to investigate the usefulness
of qualitative data found in annual reports in making pre-
dictions about corporate failure. The results of the experi-
ment were mixed. The first hypothesis could not be supported.
37
_^_.. _

. « . I ^' f ^ 'tfT'^1^ 'HI %f • <_ % " mm w" 11'^ • « ^1 '« f • • • I.I, ••••!! • • •>••. • ff • • »i ••• , T ••y. ¥" ' T • •—
TABLE 6
Difference of Years Contrasts for
Mean Integrative Complexity Scores
Years Before Bankruptcy
Failed Firms
2.6254
Non-failed Firms F Statistic
1.587
Significance of F
1 2.5962 0.2159
2 2.3787 3.3636 13.011 0.0009
3 2.5244 3.2216 9.456 0.0040
4 2.4946 2.9191 2.701 0.1090
5 2.4298 3.0659 7.133 0.0113
However, the second hypothesis was supported. The results
indicate that, while the complexity of language in the
presidents' cover letters for failing firms does not
decrease as bankruptcy approaches, the integrative complexity
scores for failing firms are consistently lower than those
of the non-failing firms as failure approaches. Although
it is possible for rater bias to have influenced the results,
the process of randomization of the cover letters and lack
of familiarity with the specific firms in question helped
to minimize the possibility of such a bias. Additionally,
during the scoring process, which took place over a six-week
period, the relative scores within or between firms were not
discussed by the raters.
38
•—.. ^LJ^IJ. i. - .

"• •—1—•—•—•—•—
»•
The fact that the results of this experiment are not
strictly supportive of the theory underlying the concept
of integrative complexity may be attributable to at least
two factors, or to some interaction of the two factors.
The first is sample size. If replicated with a larger sample
size, the results obtained might show a trend of integrative
simplification in reporting as failure approaches. The second
factor is the length of the time period from which the sample
was drawn. While the sample size for this experiment might
well have been adequate, the time period from which the data
were gathered may have been too short. The theory suggests
that the populations should be the same for the failed and
non-failed firms at some point in time and that, as bankruptcy
approaches, the presidents' cover letters for failing firms
would begin to exhibit a trend of integrative simplification
(Suedfeld, Tetlock, and Ramirez, 1977). However, the process
of integrative simplification in financial reporting under
stress may be so gradual that a study encompassing a period
of longer than five years might be required before a clearly
decreasing trend could be detected.
Previous bankruptcy studies by Beaver (1966) and Wilcox
(1973), which were based upon analyses of financial ratios,
reported that firms could be classified as failing or non-
failing most accurately within one year of failure, with
predictive accuracy steadily diminishing through the fifth
39
_. • . . . . . . . ^_^ - «:__..

year before failure. With the techniques of Beaver and
Wilcox, the risk of misclassifying a firm as belonging to
either the failinr or the non-failing population is greater
five years before failure than in the year before failure.
The technique used in this thesis might offer an advantage
over the aforementioned techniques, in that the difference
in the populations was significant over the entire five-year
period. While this does not allow the analyst to predict in
which year the firm might fail, it does give an indication
at least as early as five years ahead of time that a firm
may be headed for failure.
40
•-•• •-*' •*•- *•• "•• fc - " •<•* • •-• - — * — "^-* — » — in'- T'I-^CT1 . - - - - - - _ ._ -i^

^^^^^^^ **^^^9 *m "^ »—w—
APPENDIX A
FAILED AND NCN-FAILED FIRMS
Failed Firm Bankruptcy Filing Date
Lionel Corp. 2/82
Commonwealth Oil
Refining 7/79
United Merchants
and Manufacturers 77
Flock Industries, Inc. 4/77
Fields Plastic and
Chemical, Ind. 7/77
National Shoes 12/80
City Stores 7/79
E. C. Ernst 12/78
Garcia Corp. 6/78
General Recreation 12/78
Goldblatt Bros. 6/81
Lafayette Radio
Electronics 1/80
Mansfield Tire and
Rubber Company 10/79
Piedmont Industries 2/79
Richton International 3/80
Sambo's Restaurants, Inc 6/81
Bobbie Brooks 1/82
Tenna 12/78
Allied Supermarkets 11/78
Gruen Industries 4/77
Non-failed Firms
Arrow Electronics
Husky Oil, Ltd.
Burlington Ind.
Georgia Bonded Fibers
VersaTech, Inc.
Craddock-Terry, Inc.
Dillard Dept. Stores
Technical Opns., Inc.
Shakespeare, Inc.
Outdoor Industries
Ames Dept. Stores
Lloyds Electronics
Aegis Corp.
Damon Creations
Swank, Inc.
Denny's Inc.
Leslie Fay, Inc.
Automatic Radio Mfg.
Scot Lad Foods, Inc.
Benrus, Inc.
41
• • - -.—-—• i_^i -- > • • • I i • — • • • _* - •— - - > — - - • - • -• •

F i r—4 - r_— P>r*T*1 •••.-.•-.• .i»T. M I * . w .«• « ^ ••;•• • •<** . ,
BIBLIOGRAPHY
Altman, E. I., "Accounting Implications of Failure Prediction Models," Journal of Accounting, Auditing, and Finance, Vol. 6, No. 1, Fall 1982, pp. 4-19.
Altman, E. I., Corporate Bankruptcy in America (Lexington: Heath Lexington Books, 1971).
Altman, E. I., "Financial Ratios, Discriminant Analysis and the Prediction of Corporate Bankruptcy," Journal of Finance, Sept. 1968, pp. 589-607.
Assistant Secretary of Defense (Installations and Logistics), Defense Acquisition Regulation, 1976 edition.
Beaver, W. H. , "Alternative Accounting Measures as Predictors of Failure," The Accounting Review, Jan. 1968, pp. 113-122
Beaver, W. H., "Financial Ratios as Predictors of Failure," Empirical Research in Accounting: Selected Studies, 1966, pp. VI-1U2.
Beaver, W. H., "Market Prices, Financial Ratios, and the Prediction of Failure," Journal of Accounting Research, Autumn 1968, pp. 179-192.
Blum, M., "Failing Company Discriminant Analysis," Journal of Accounting Research, Spring 1972, pp. 1-25.
Bruns, W. , "The Accounting Period and its Effect upon Management Decisions," Empirical Research in Accounting: Selected Studies, 1966, pp. 1-14.
Bureau of National Affairs, "DOD Seeks Wider Use of Commercial Products," in Federal Contract Report, Vol. 39, No. 12, pp. 649, 677 (Washington, D.C., March 21, 1983).
Cartwright, Darwin P., "Analysis of Qualitative Materials," in Research Methods in the Behavioral Sciences, Leon Festinger and Daniel Katz, eds. (Holt, Rmehart § Winston: New York, 1966) .
Comptroller General of the United States, "Defense Budget Increases: How Well Are They Planned and Spent?" in Report to Congress, PLRD-82-62 (Washington, D.C., April 13, 1982) .
42
• - .- ..... ^ . .
W • • "• i P i • • •, -fw^^^^^^P^wp^y^ppwwyppBwpw^py^^, >»' i •>• > i p«. •« •<
!• ;•'
Deakin, E. B., "A Discriminant Analysis of Prediction of • Business Failure," Journal of Accounting Research, I Spring 1972, pp. 168-179.
Edmister, R. Q. , "An Empirical Test of Financial Ratio Analysis for Small Business Failure Prediction," Journal of Financial and Quantitative Analysis, March 197T',
j pp. 1477-1493.
Harvey, 0. J., D. E. Hunt, and H. M. Schroder, Conceptual Systems and Personality Organization (John Wiley, New Vork, 1961). '
[ Hofstedt, T. R., "Some Behavioral Parameters of Financial 1 Analysis," The Accounting Review, Oct. 1972, pp. 679-692.
Libby, R. and B. L. Lewis, "Human Information Processing Research in Accounting: The State of the Art," Accounting, Organizations and Society, Vol. 2, No. 3, pp. 245-268.
Libby, R., Accounting and Human Information Processing: Theory and Applications^ (Prentice-Hall, Inc., New Jersey, 1981).
Libby, R., "Accounting Ratios and the Prediction of Failure: Some Behavioral Evidence," Journal of Accounting Research, Spring 1975, pp. 150-161.
Moyer, C., "Forecasting Financial Failure: A Re-Examination," Financial Management, Spring 1977, pp. 11-17.
Norton, C. L. and E. Smith, "A Comparison of General Price Level and Historical Cost Financial Statements in the Prediction of Bankruptcy," The Accounting Review, Jan 1979, pp. 72-87.
Ohlson, J. A., "Financial Ratios and the Probabilistic Prediction of Bankruptcy," Journal of Accounting Research, Spring 1980, pp. 109-131.
Schroder, H. M., M. J. Driver, and S. Streufert, Human Information Processing (Holt, Rinehart § Winston, New York, 19673 .
Suedfeld, P. and P. E. Tetlock, "Integrative Complexity of Communications in International Crises," Journal of Conflict Resolution, March 1977, pp. 169-T8~T^
43
' - " " -- »'»•'"— *• • "• «- «- - • «- --" n.. - - ' T- - •- - " -

M»'V •—""^—•—* . « '. * ' * t"t'^ •.'• i^'i ••'• •— • i~- y—»-—•—
Suedfeld, P., P. E. Tetlock, and C. Ramirez, "War, Peace, and Integrative Complexity," Journal of Conflict Resolution, Sept. 1977, pp. 427-441.
Wilcox, J. W., "A Prediction of Business Failure Using Accounting Data," Empirical Research in Accounting: Selected Studies, 1975, pp. 165-173.
Wilcox, J. W., "A Simple Theory of Financial Ratios as Predictors of Failure," Journal of Accounting Research, Autumn 1971, pp. 389-595.
Winans, R. F., "Firms Under Chapter 11 May Offer Investors Some Above-Average Returns, Analyst Says," The Wall Street Journal (January 4, 1983), p. 51 (in Western Edition}.
44
.-—_. . • - - - - . ^_»_ _ «^ ^ . . . .

•
L* ,
~M
»
1 INITIAL DISTRIBUTION LIST -
[*•" * No. Copies
1. Defense Technical Information Center 2 Cameron Station Alexandria, Virginia 22314
2. Library, Code 0142 2 Naval Postgraduate School Monterey, California 93940
3. Professor K. Euske, Code 54Ee 1 Department of Administrative Sciences Naval Postgraduate School Monterey, California 93940
4. Professor J. Fremgen, Code 54Fm 1 Department of Administrative Sciences Naval Postgraduate School Monterey, California 93940
5. William M. Matthews, LT, USN 1 COMNAVSECGRU 3801 Nebraska Avenue, NW (GD-22) Washington, D.C. 20390
45
^*m
v-
v.. ;-< X:*i.:y>\ raHH
.** :-;, jf^-
/ T?'
J * w* iff
>
/IM &U>